Abstract
Paddy field runoff containing plastic capsules that are used to coat fertilizers has been receiving increased attention. However, the behavior of these capsules, especially their degradation behavior, has not been extensively investigated. We divided the capsules in runoff into two categories: “floating capsules after ploughing” and “floating capsules discharged via pipes at the exits of paddy fields”. The behaviors of the capsules in both types of runoff were monitored in 2022 and 2023 at four paddy fields in Fukushima and Miyagi prefectures in northern Japan. Sampling of capsules in paddy biomass and soil, and comparisons of capsule weight to biomass weight showed that a decrease in plastic capsule weight reflected a decrease in capsule runoff. However, the emergence of clear effects showed a delay of 2 to 3 years, as explained by carbon isotopic analyses. The decrease in the weight of the plastic capsules could be attributed to a combination of capsule degradation and the release of urea inside the capsules, which was also explained by carbon isotopic analyses. Three types of degraded capsules were found: shrunken, broken, and spherical. Statistically significant differences among the weights of each type found.
1. Introduction
Plastic-coated fertilizers (Figure 1), which are widely used in Japan [1], consist of manure encapsulated within plastic shells [2,3,4]. This design facilitates the gradual release of nutrients into paddy fields [5,6,7]. Applying these fertilizers to paddy fields in spring obviates the need for additional fertilizer application in summer [5,6,7]. The method offers significant advantages in terms of paddy field management [5,6,7], especially given the diminishing labor force [5,6,7] and the reticence of younger individuals to return to the exclusion zone following the Fukushima Daiichi nuclear disaster [8,9]. However, concerns have been raised regarding the plastic capsules being transported from the paddy fields in runoff [2,3,4], especially since these capsules account for 15% of the total microplastics discharged from the catchment into the marine environment [10].
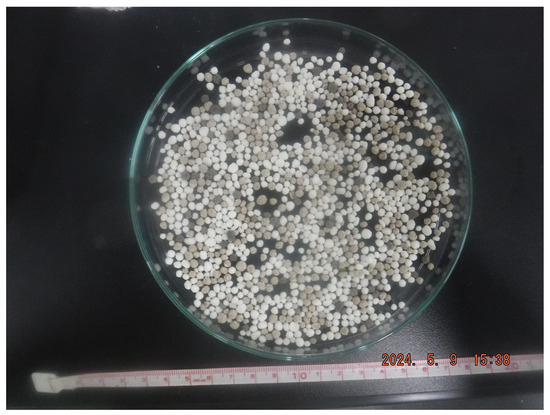
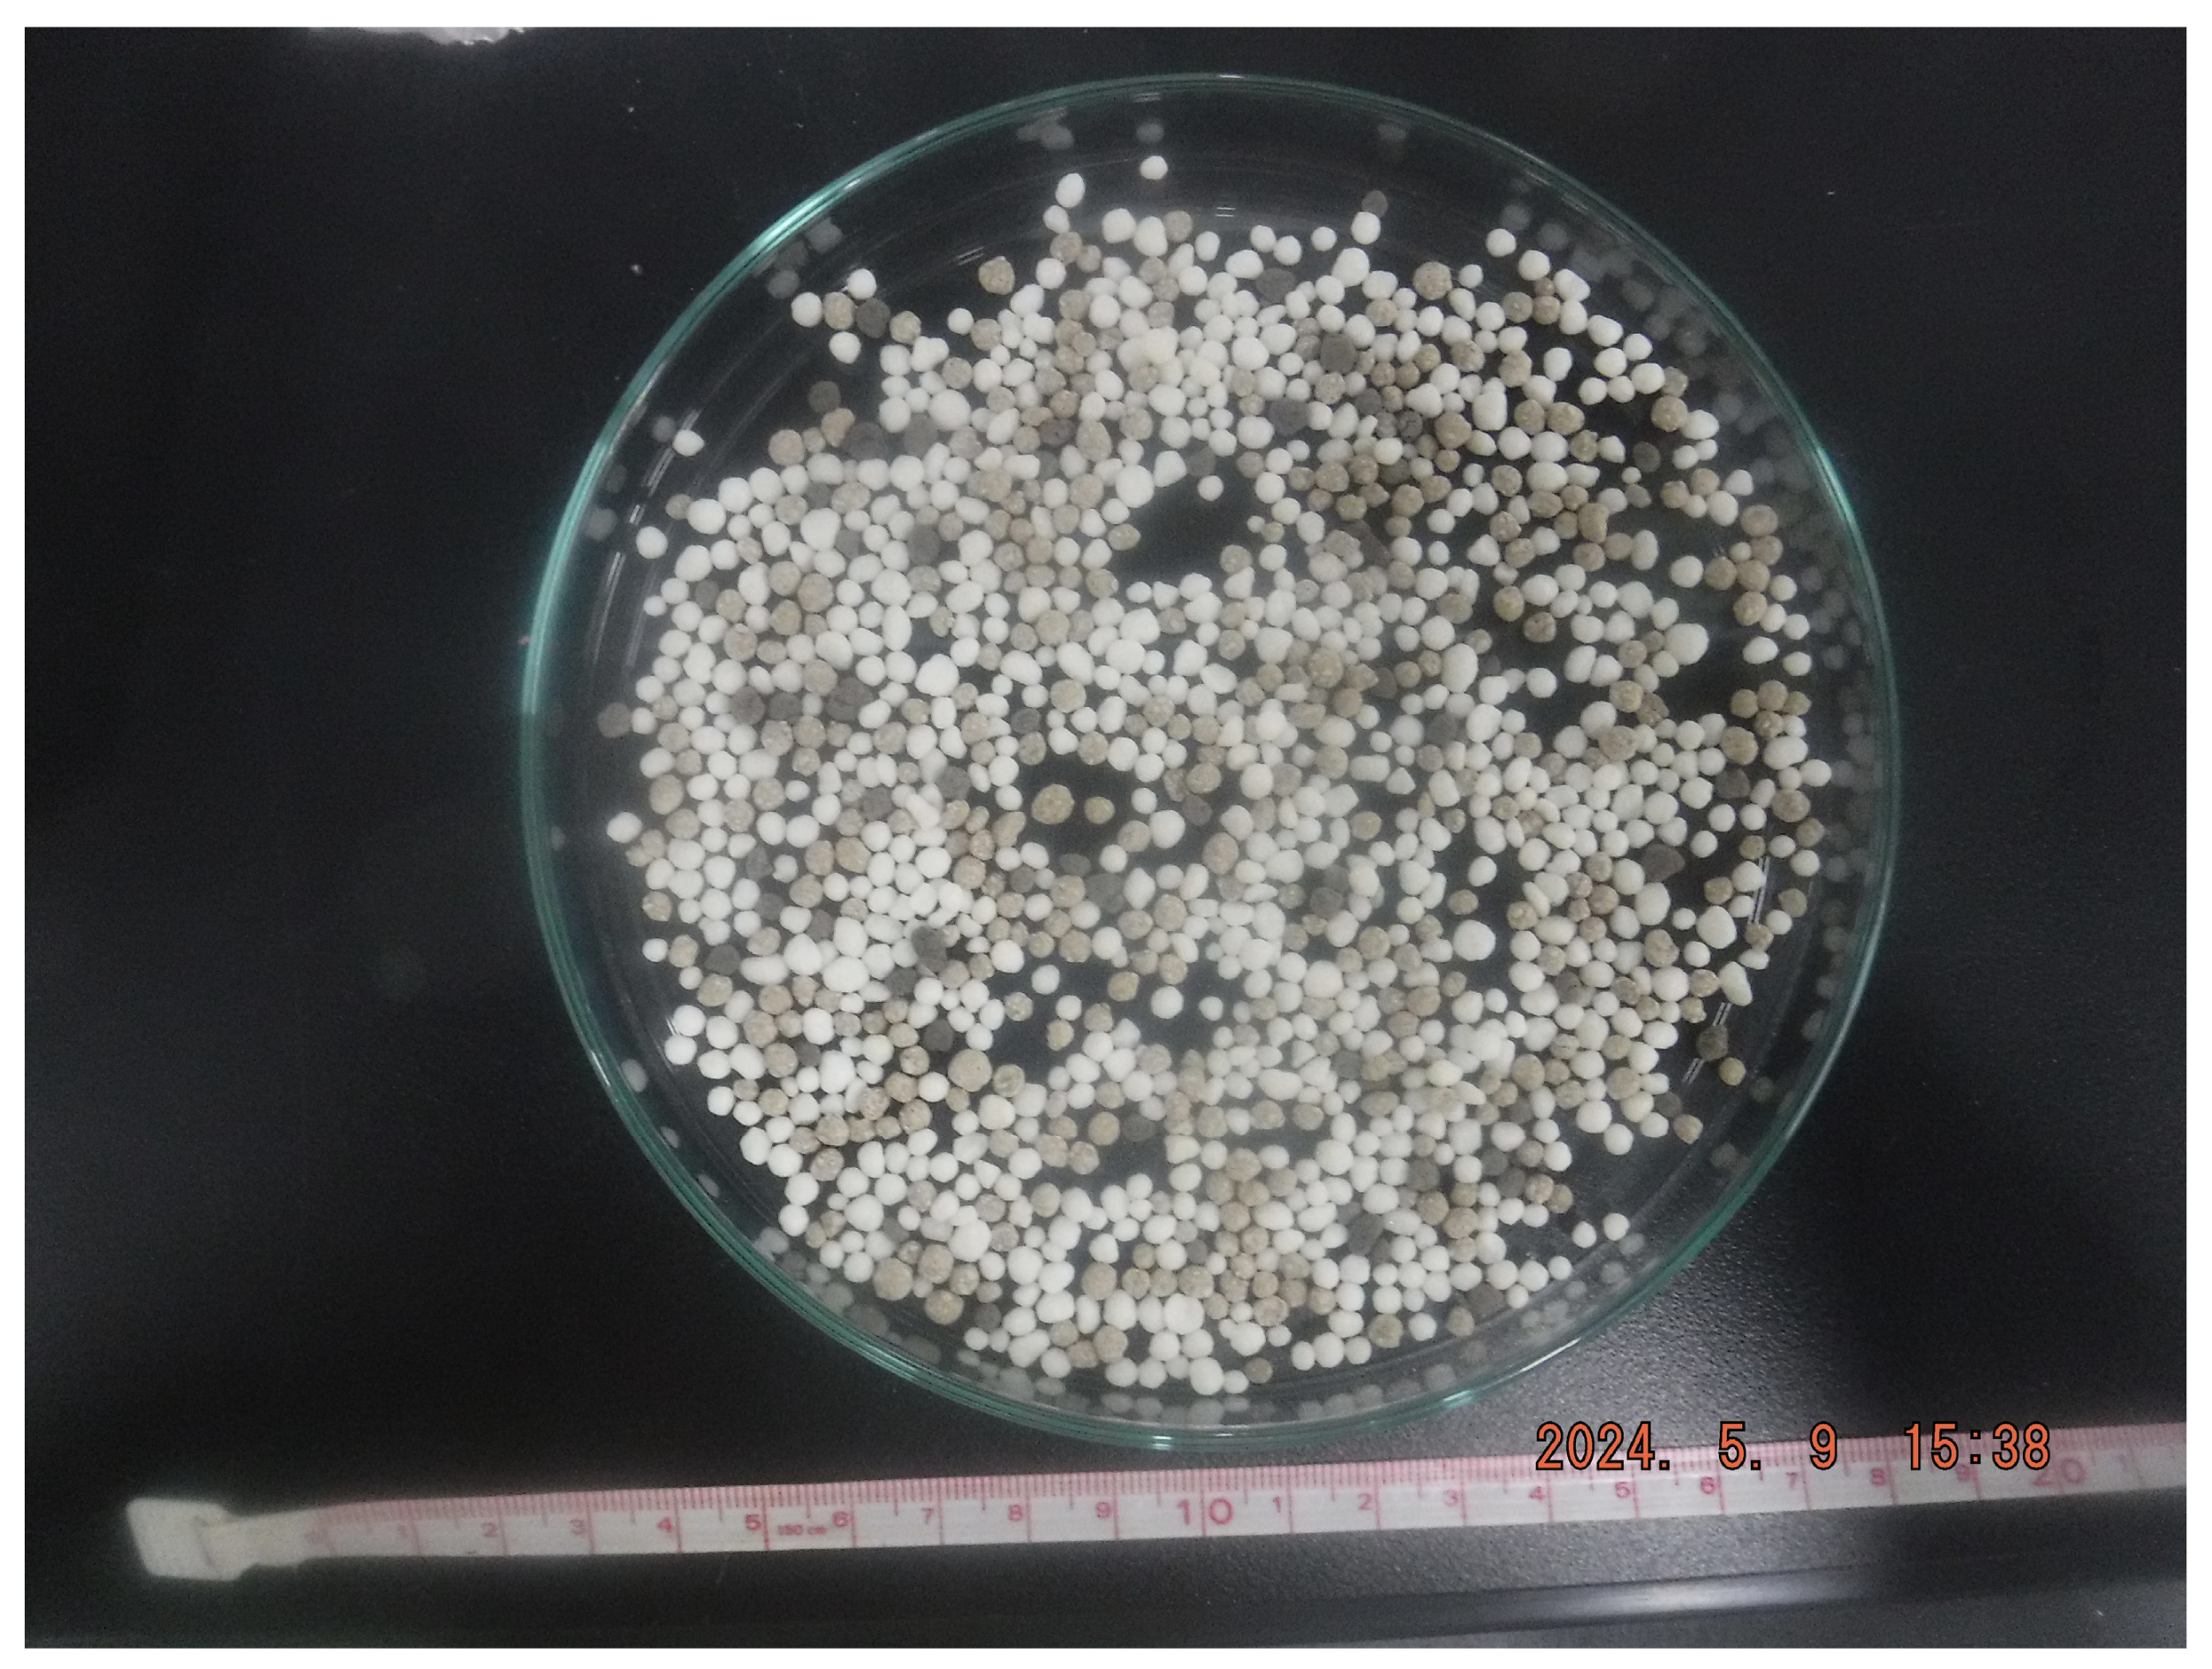
Figure 1.
Coated fertilizer (white) and normal fertilizer (dark) capsules used in paddy fields C1 and C2 in this study (see Table 1).
The increase in the plastic runoff into oceans has been identified as an issue of global concern [11,12,13,14]. Although the present study does not directly address the severity of this problem, its eco-toxicological impact is important to note [15,16,17].
Microplastics are generally defined as plastic particles measuring <5 mm [18,19]. Of these particles, primary microplastics are derived from domestic and industrial sources [18,19] and frequently pass through sewerage treatment systems [15]. Secondary microplastics are derived from waste that has been crushed and fragmented by ultraviolet rays and physical abrasion [18,19].
The plastic capsules derived from agricultural applications are classified as primary microplastics. However, because they are an example of a non-point-source of pollution, they do not pass through sewage treatment systems, which are relatively effective in trapping such microplastics. In cases where the use of sludge on farmland is planned, countermeasures against runoff are necessary [20].
Such countermeasures include placing simple microplastic traps on site [5,6,7]. Examples of these have been developed by the authors and are described elsewhere [6]. Briefly, the authors’ technique utilizes porous concrete to filter runoff and capture the discharged plastic capsules from the paddy fields [21,22,23,24,25].
Previous studies [2,3,4,5,6,7] have shown that plastic capsules persist for several years in paddy fields. Capsule longevity is affected mainly by the following three factors: the proportion of capsules that float relative to the total volume of capsules in the paddy soil after ploughing, the fraction of these capsules that enter runoff or are retained within the rice paddy as a proportion of the total volume of floating capsules during discharge after ploughing, and the capsule degradation rate during retention inside the paddy field.
Understanding the lifespan and behavior of these capsules is important; however, this requires a modeling approach, which is a goal for future research.
In 2022 and 2023, we performed surveys, including the monitoring and sampling of capsules in samples of biomass and mud, as well as floating capsules in runoff that were discharged via drainage pipes from the paddy fields after ploughing. In this study, four paddy fields (A, B, C1, and C2; Table 1 and Table 2) in Fukushima and Miyagi prefectures were sampled (Figure 2 and Figure 3).

Table 1.
Characteristics of the four paddy fields in Fukushima and Miyagi prefectures examined in this study.
Table 2.
Timing of sampling relative to ploughing and fertilizer application in this study.

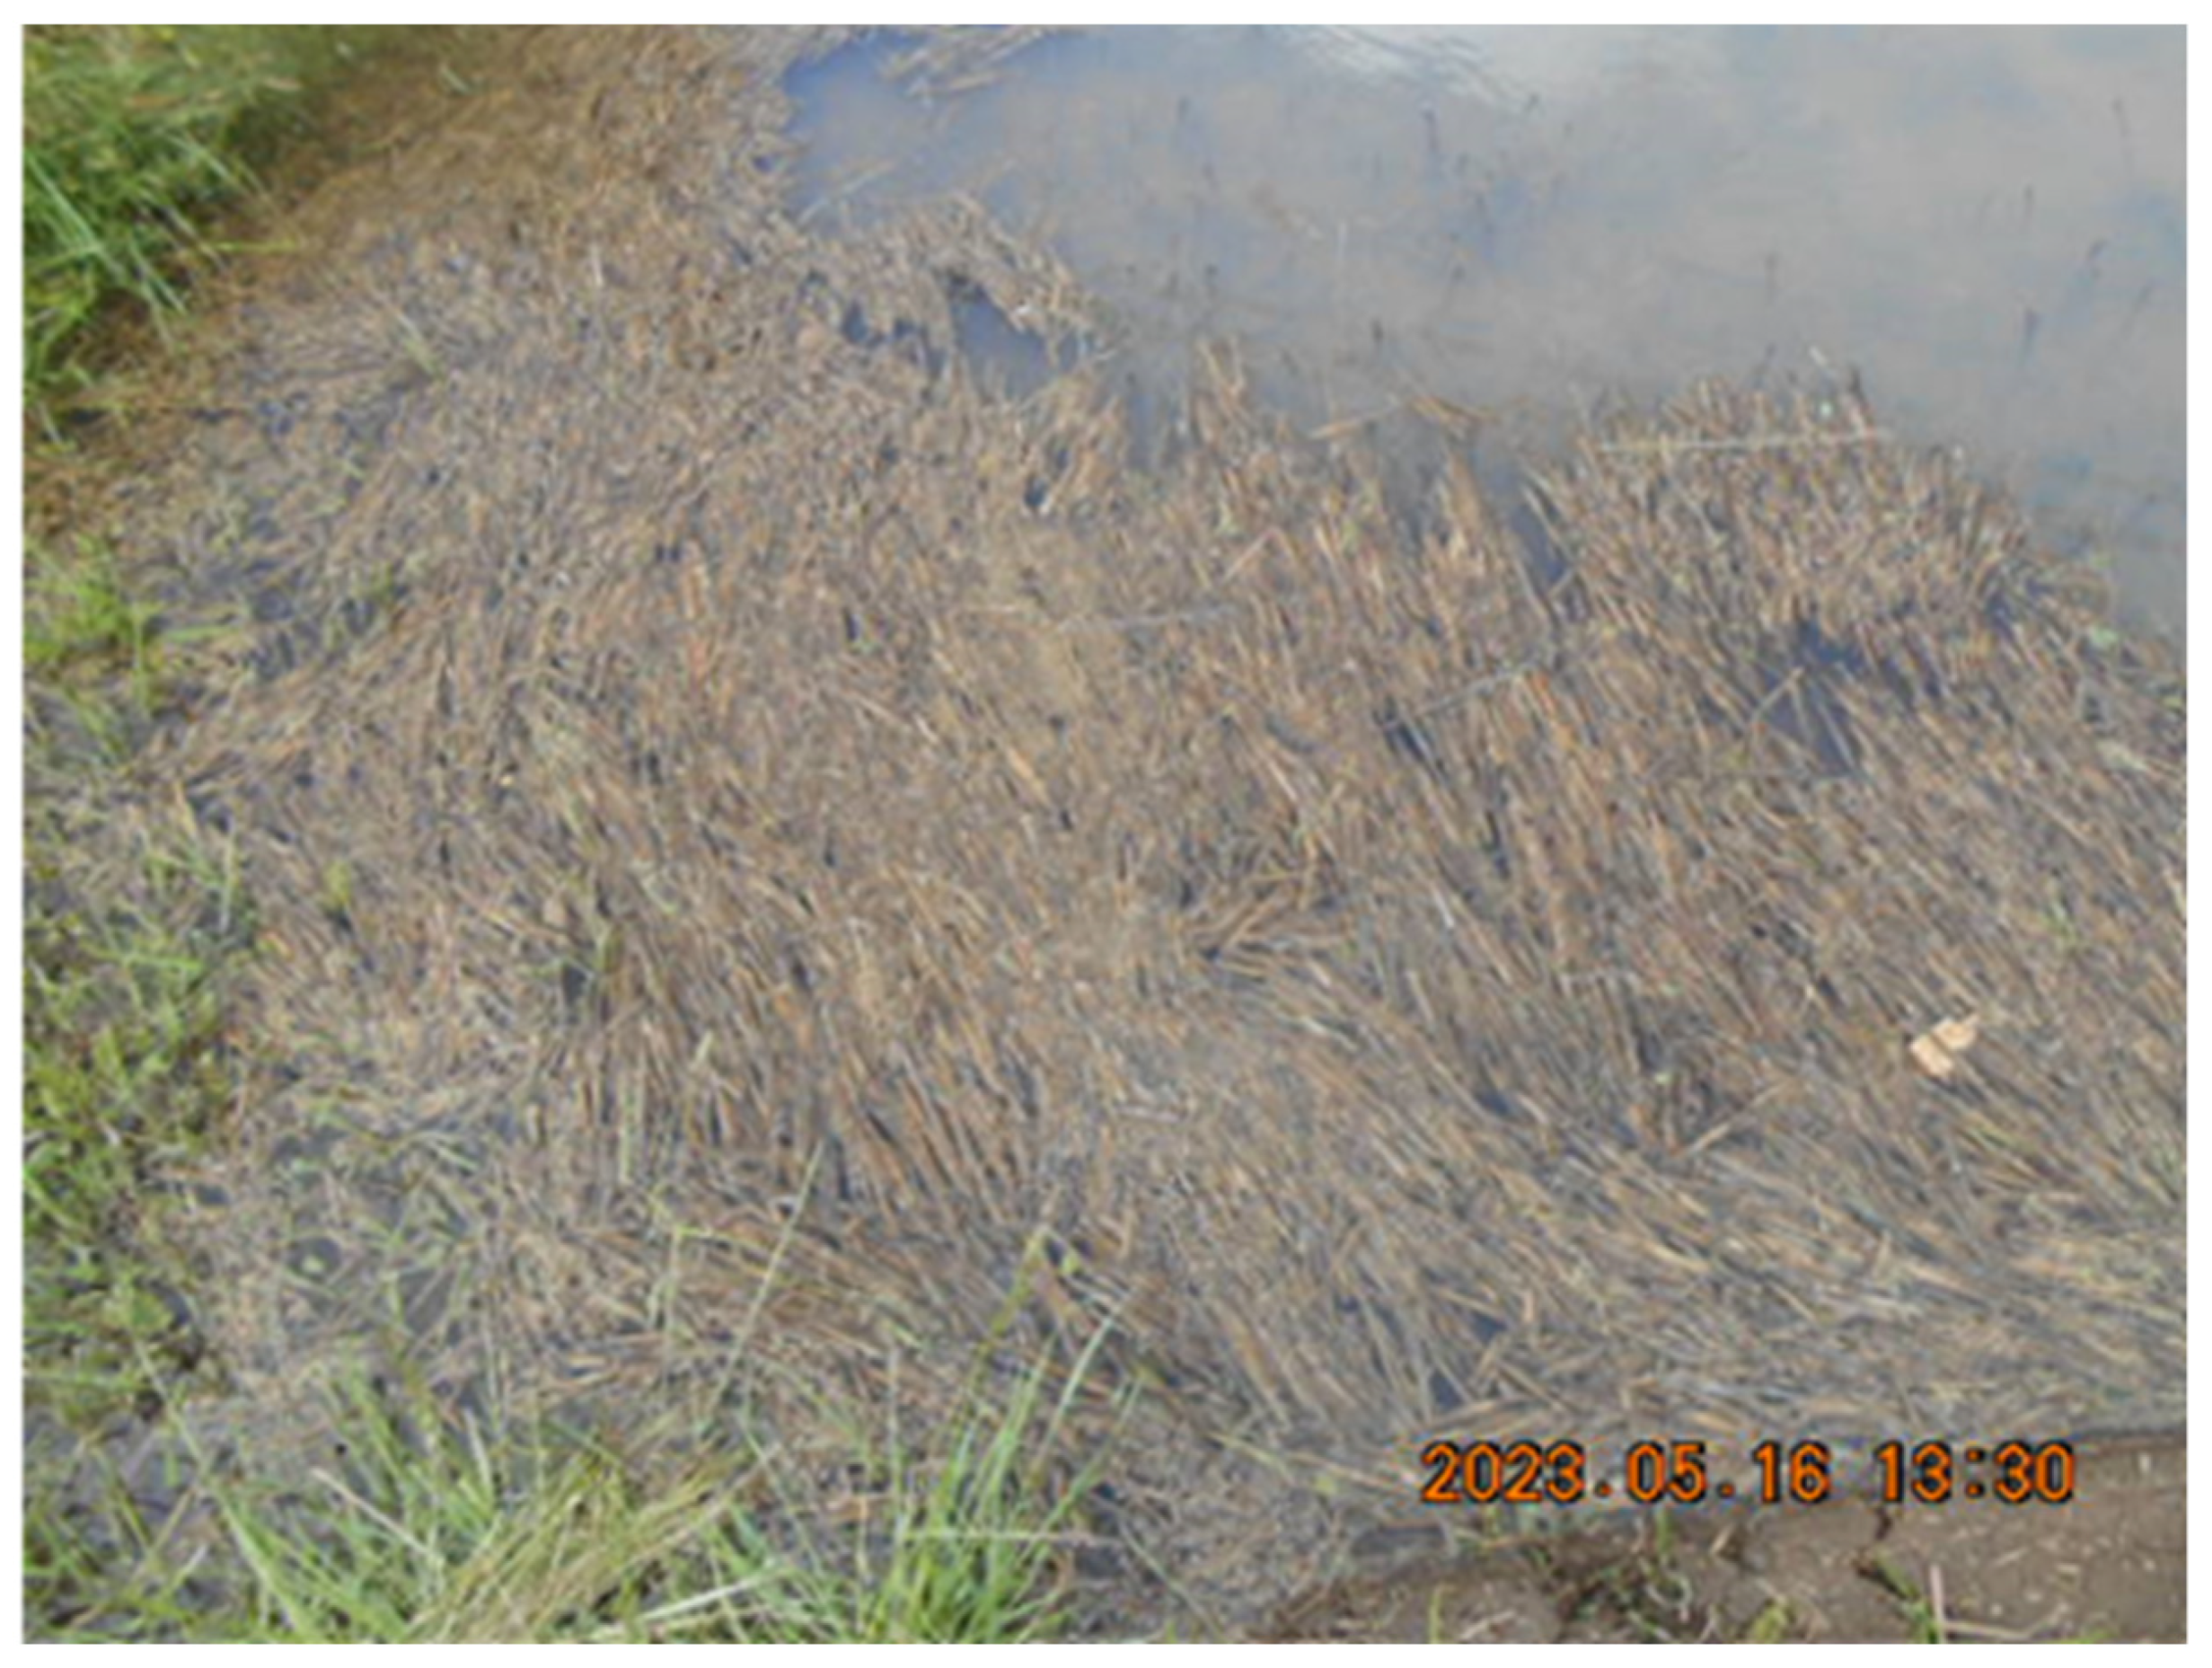
Figure 2.
Typical appearance of floating fertilizer after ploughing (C2 in 2023).
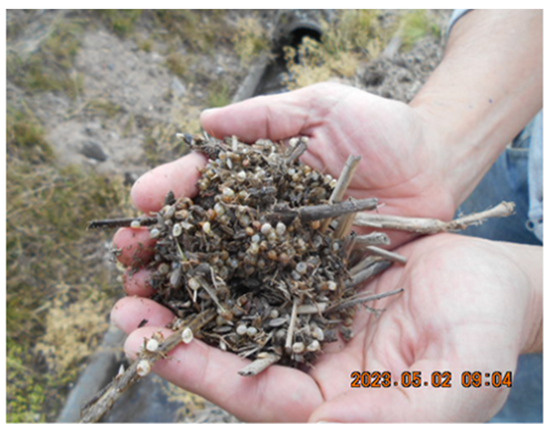
Figure 3.
Typical appearance of plastic capsules in floating biomass after ploughing (C2, 2023).
This paper reports the results of our surveys and subsequent physical measurements (capsule weight and density), scanning electron microscopy (SEM) analyses, and chemical (C and δ13C) measurements.
The 2022 surveys examined the differences in capsule behavior at the four paddy fields. Preliminary results showed general tendencies in capsule behaviors, including retention within paddy fields. The authors subsequently focused on variations in the capsule weights, capsule depth in the paddy soil, and chemical measurement results in two adjacent paddy fields (C1 and C2 in Table 1) under identical conditions, except for the timing of coated fertilizer application. The temporal differences between the proportions and weights of the floating capsules in C2, where the same coated fertilizer (Figure 1) was used in 2019–2023 (Table 3), and those in C1 (a coated fertilizer was not used in 2021 and 2023) provide information about the degradation behavior of the capsules.
Table 3.
Application timing and type of fertilizer used in fields C1 and C2 in Fukushima Prefecture.
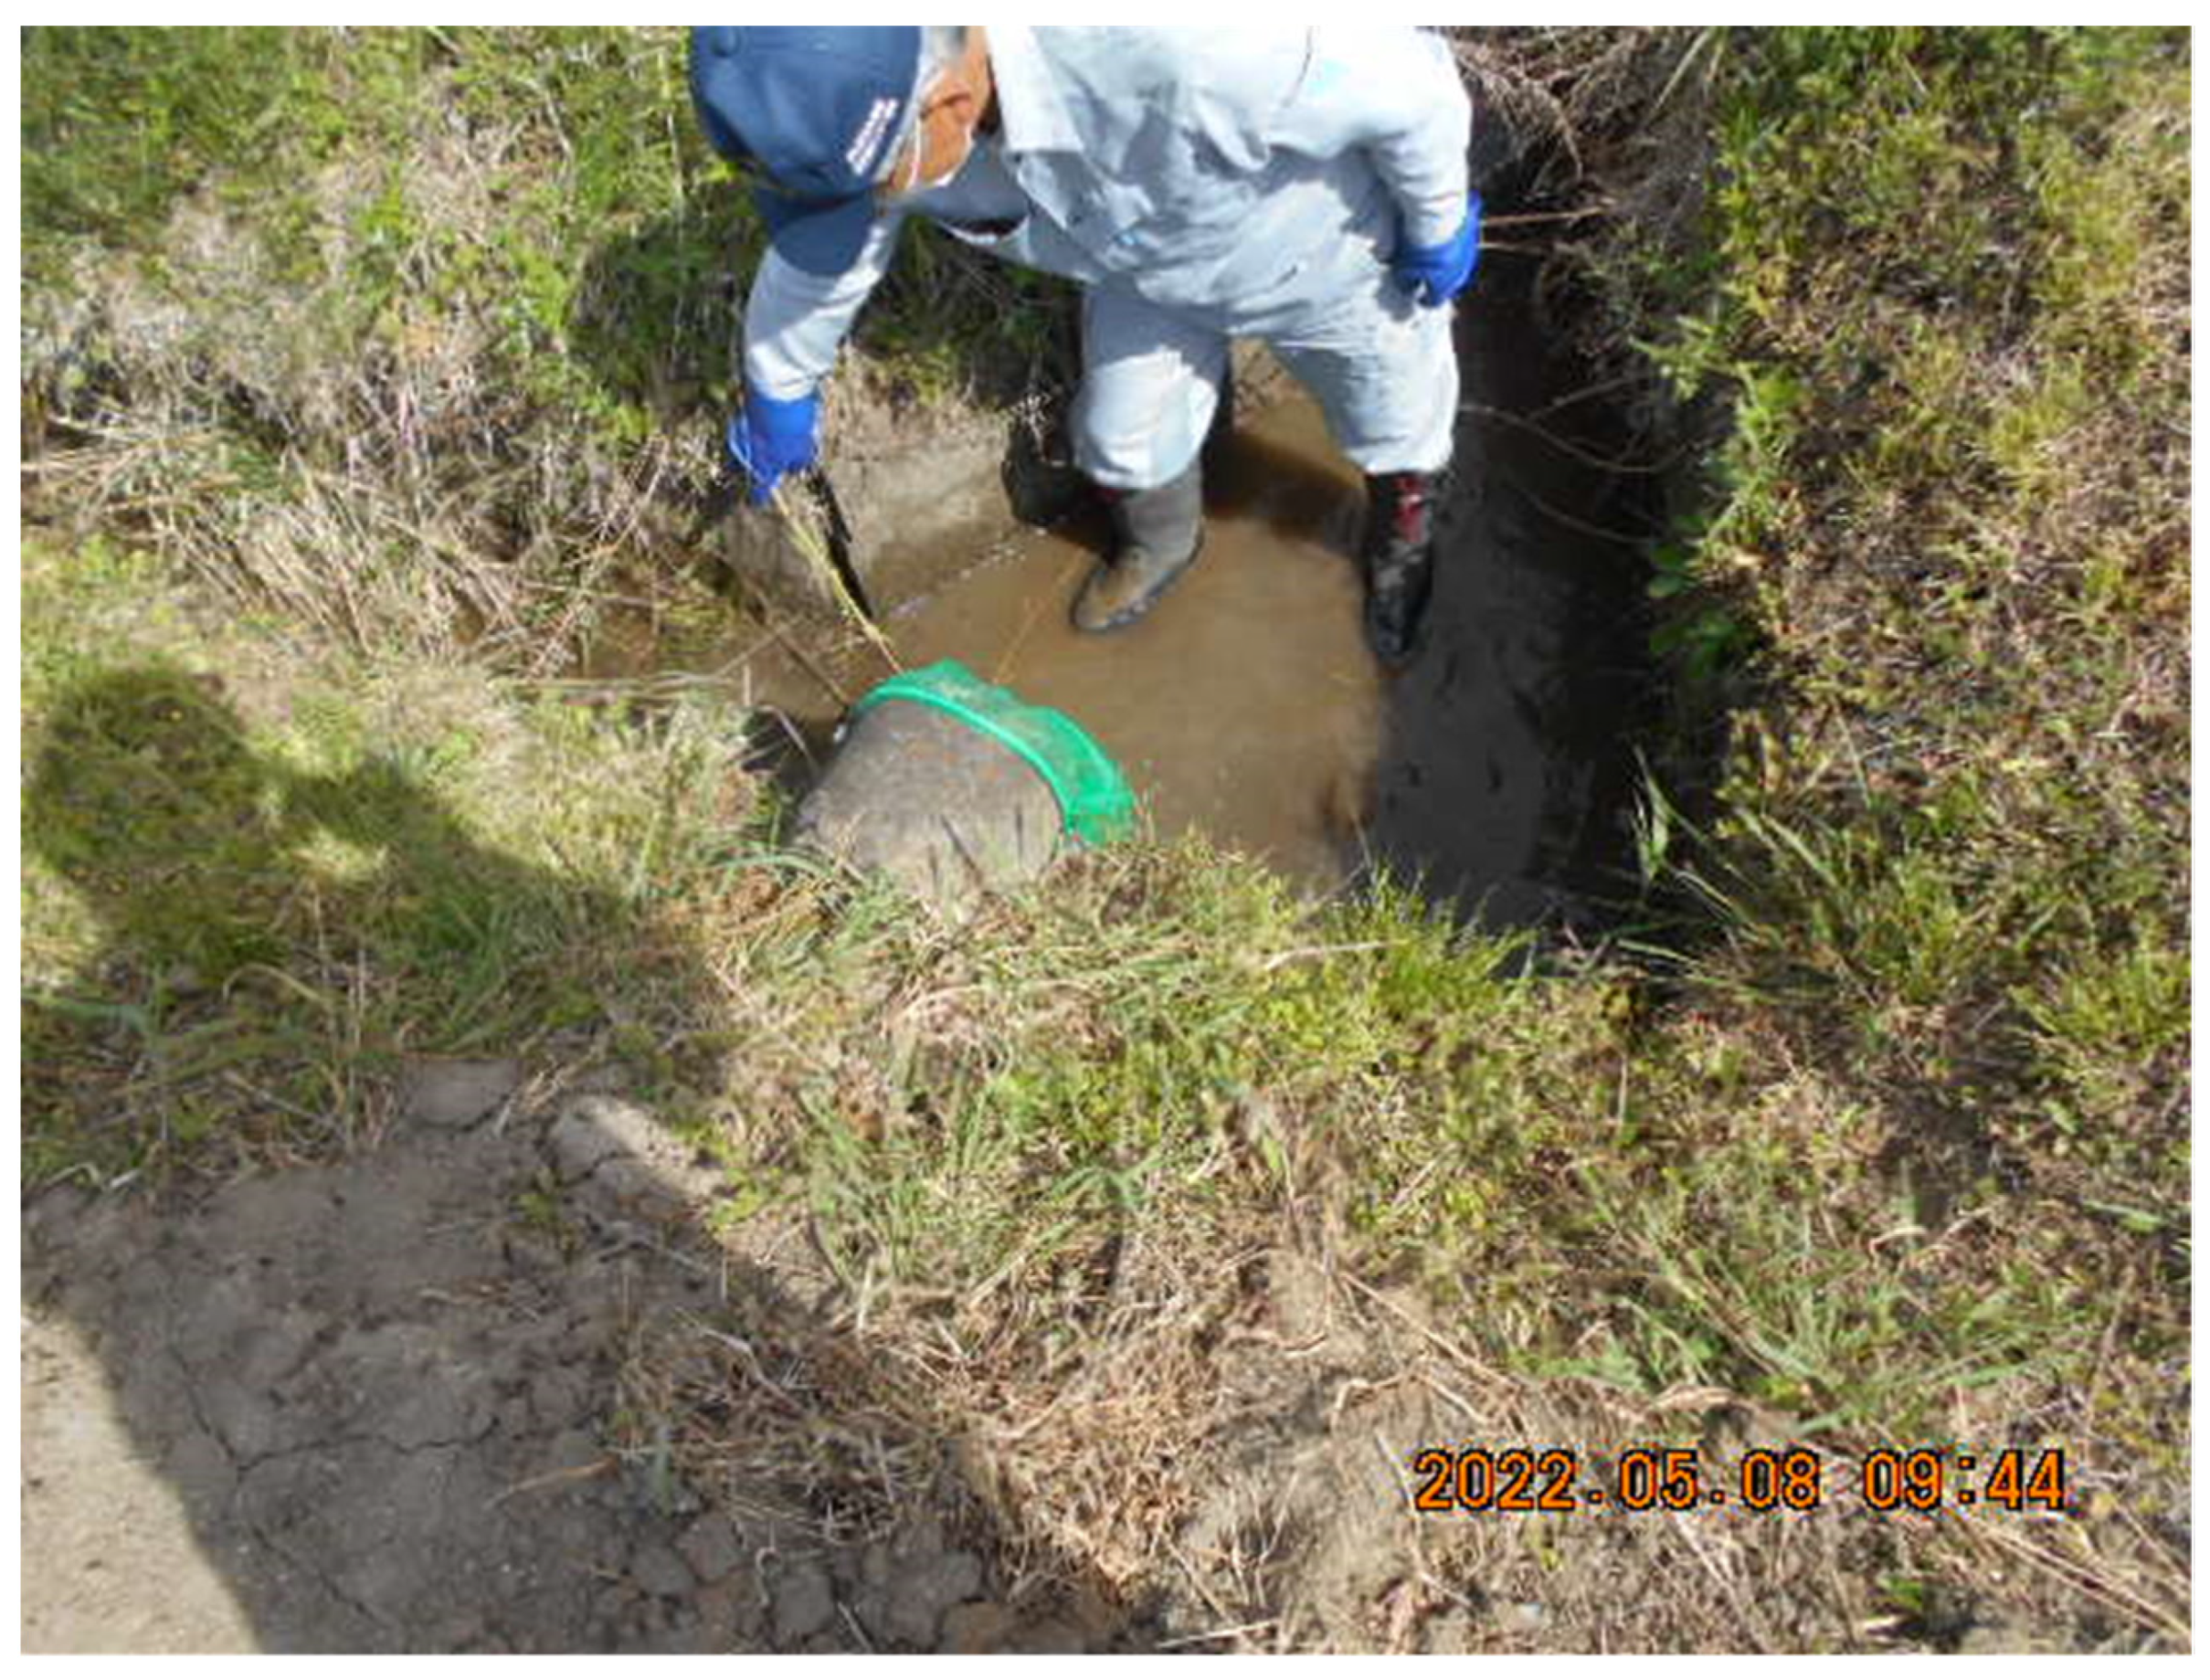
We confirmed that a negligible proportion of the capsules were transported in runoff on rainy days. In addition, nearly 100% of the total capsule runoff load from paddy field B during the rice harvesting period occurred shortly after ploughing. This was confirmed by placing a fine mesh net (2 mm mesh) at the discharge pipe of paddy field B in 2022 (Table 1 and Figure 4). Thus, the main focus of this study was to investigate the behavior of the capsules during the ploughing period.

Figure 4.
Deployment of 2 mm mesh at the drainage pipe exiting paddy field B (Table 1).
2. Materials and Methods
2.1. Study Sites and Paddy Conditions
The study was conducted in four paddy fields (fields A, B, C1, and C2) at three sites in Fukushima and Miyagi prefectures; three paddy fields in Fukushima Prefecture and one in Miyagi Prefecture (Table 1). Table 1 shows the characteristics of each field. Table 2 shows the differences in the fertilizer application methods and/or timing employed in the paddy fields. “Before ploughing” means that fertilizer was applied when the paddy soil was dry before ploughing (Table 2). “After ploughing” means that the fertilizer was applied at the same time as rice planting (Table 2).
Paddy fields C1 and C2 were adjacent to each other, and the types of fertilizer applied to these fields are shown in Table 3.
2.2. Monitoring and Sampling
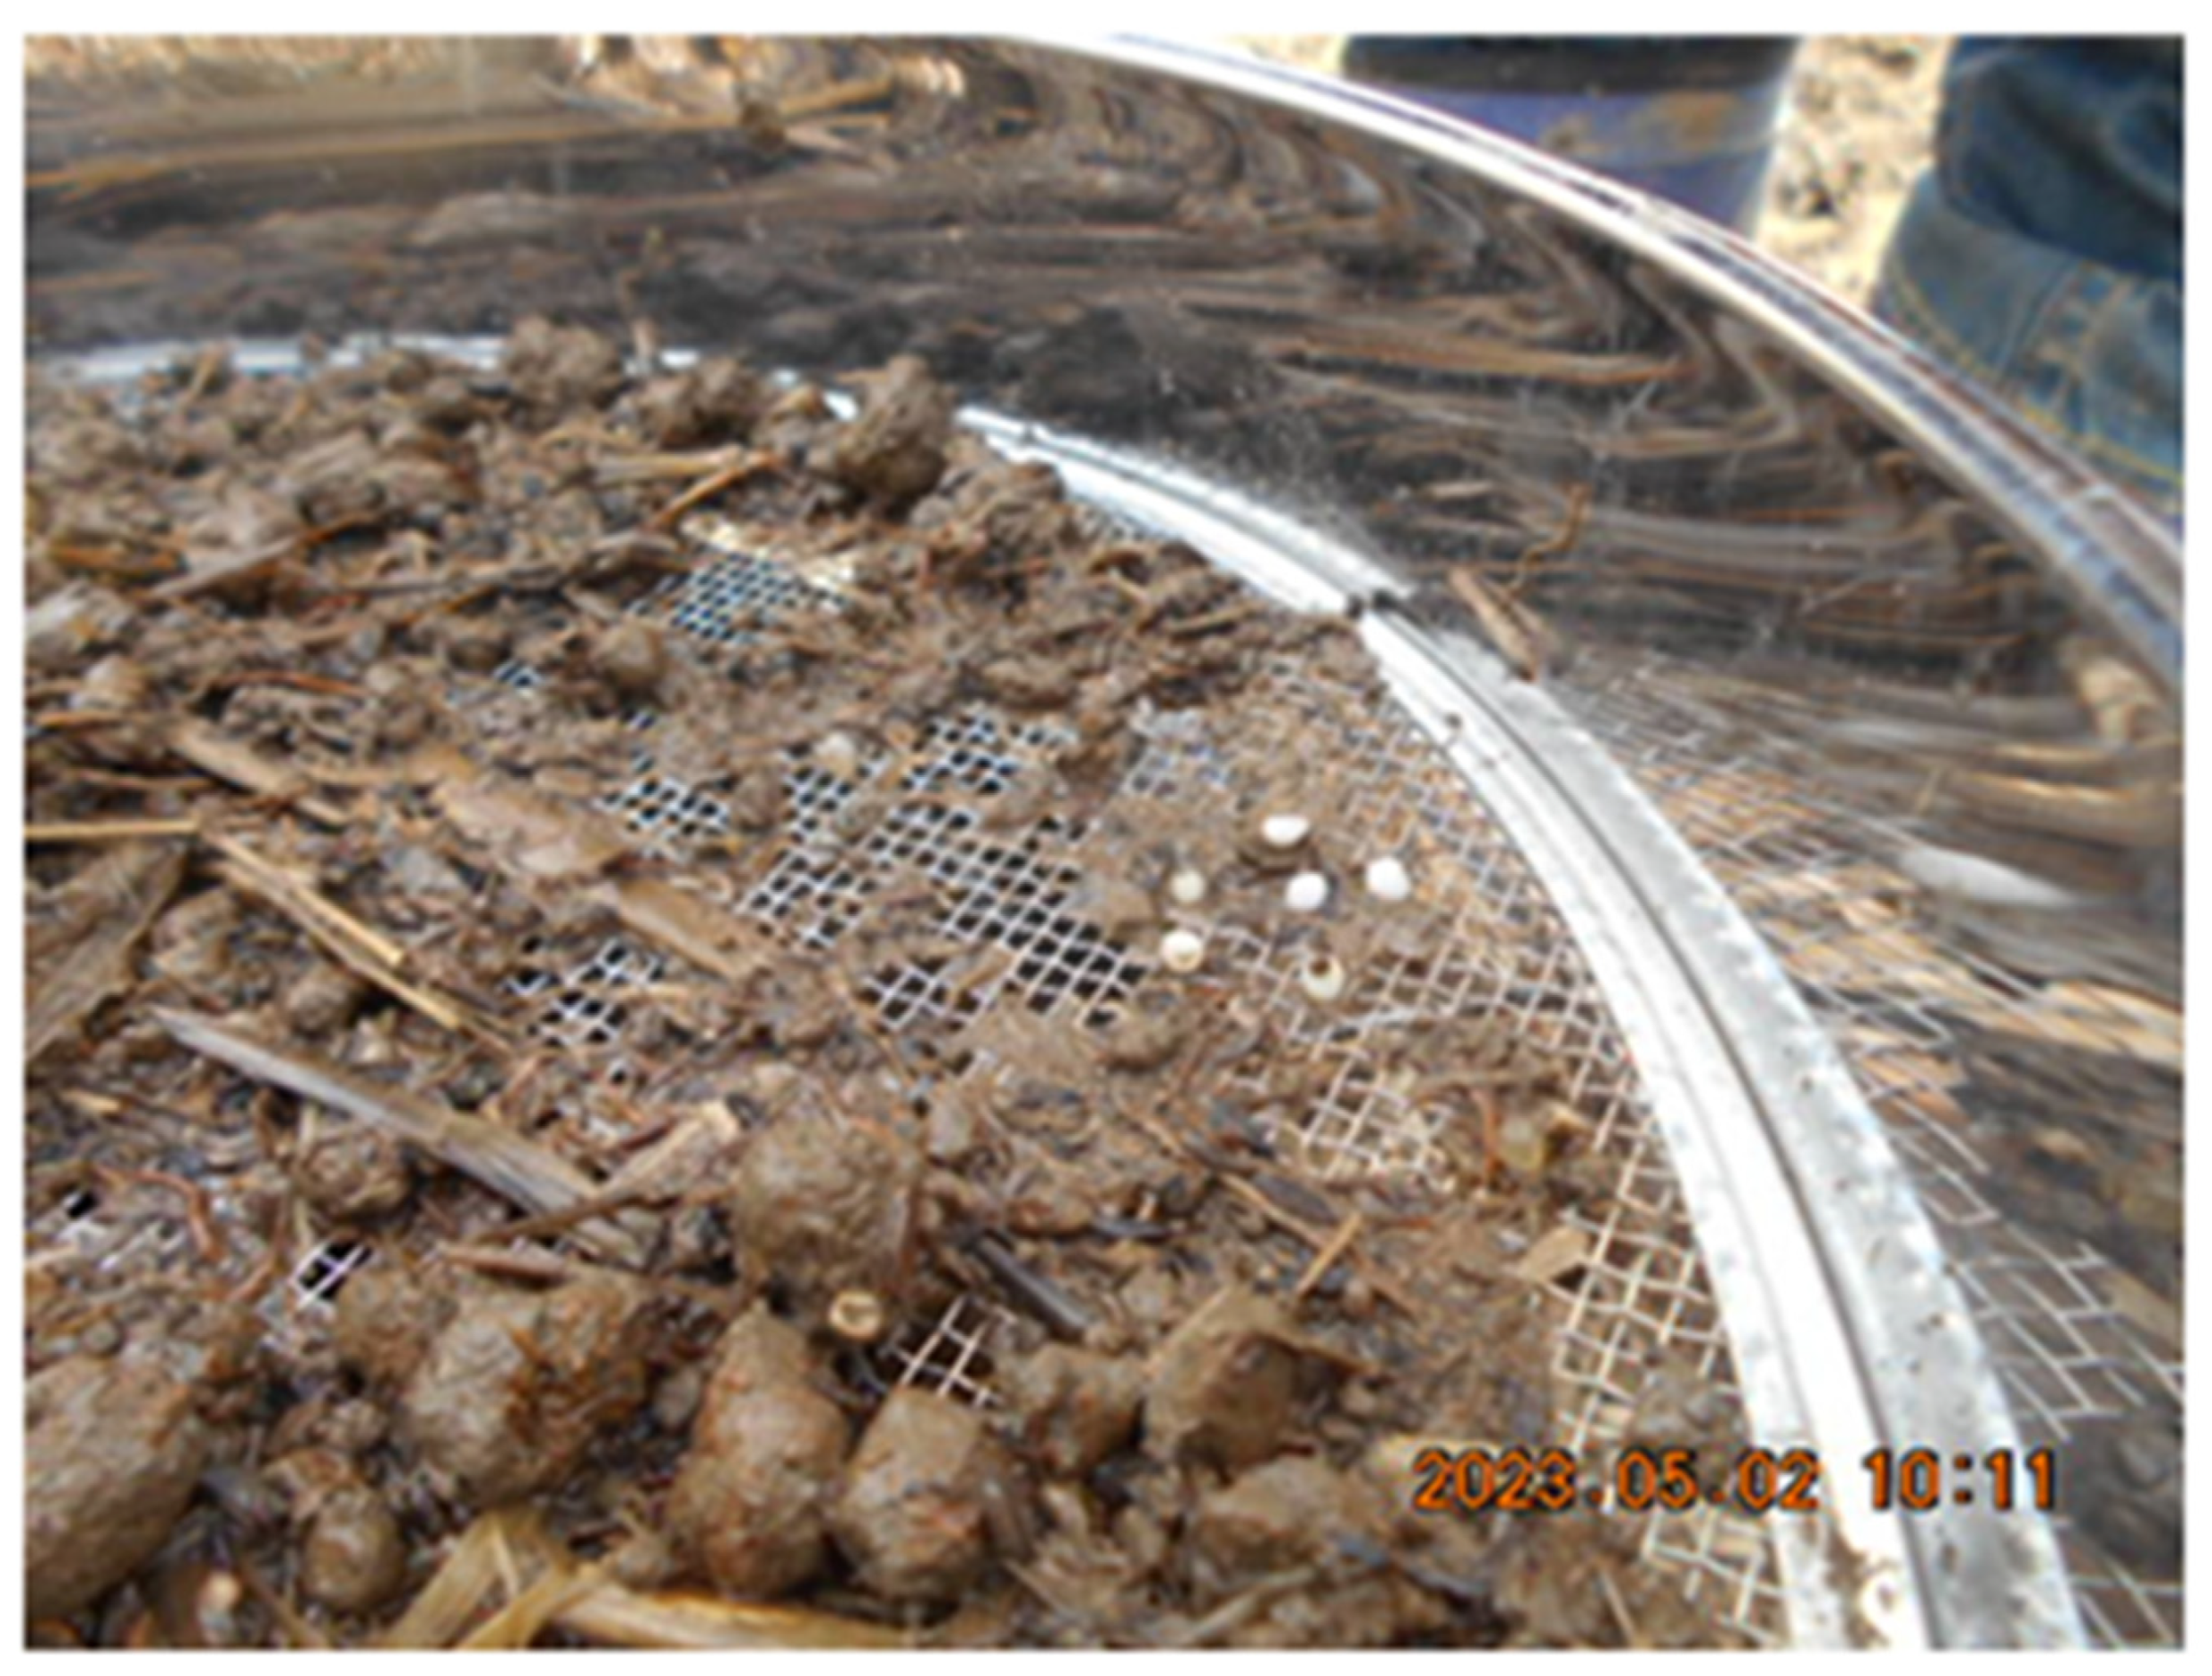
In 2022, samples of floating and discharged capsules mixed with biomass and soil particles were collected from rice field ridges at the four paddy fields and at the drainage pipes. The methods were the same as those shown in Figure 4, but the sampling duration was shorter (5 min). The timing of the sampling was after ploughing in early May (fields A and B) and mid-May (fields C1 and C2). Collected samples were dried at room temperature. Following drying, the sediments were sorted using screens with mesh sizes of 2 and 3 mm. Subsequently, capsules were manually extracted from the biomass mixtures (Figure 5).
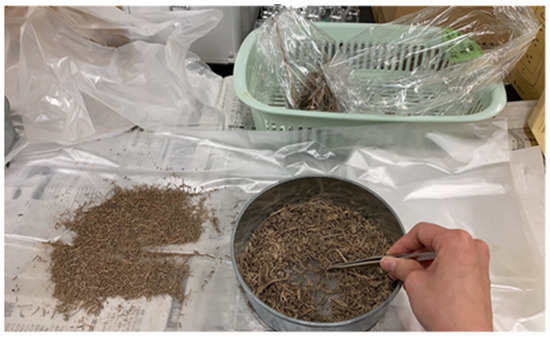
Figure 5.
Hand sorting of capsules in the 2–3 mm and >3 mm fractions.
During the 2023 survey, we focused on capsules in paddy fields C1 and C2, the collection and weighing of floating coated fertilizers in C1 and C2, and the C and δ13C measurements (as described in Section 2.3 below).
2.3. Analyses of Capsule Behavior
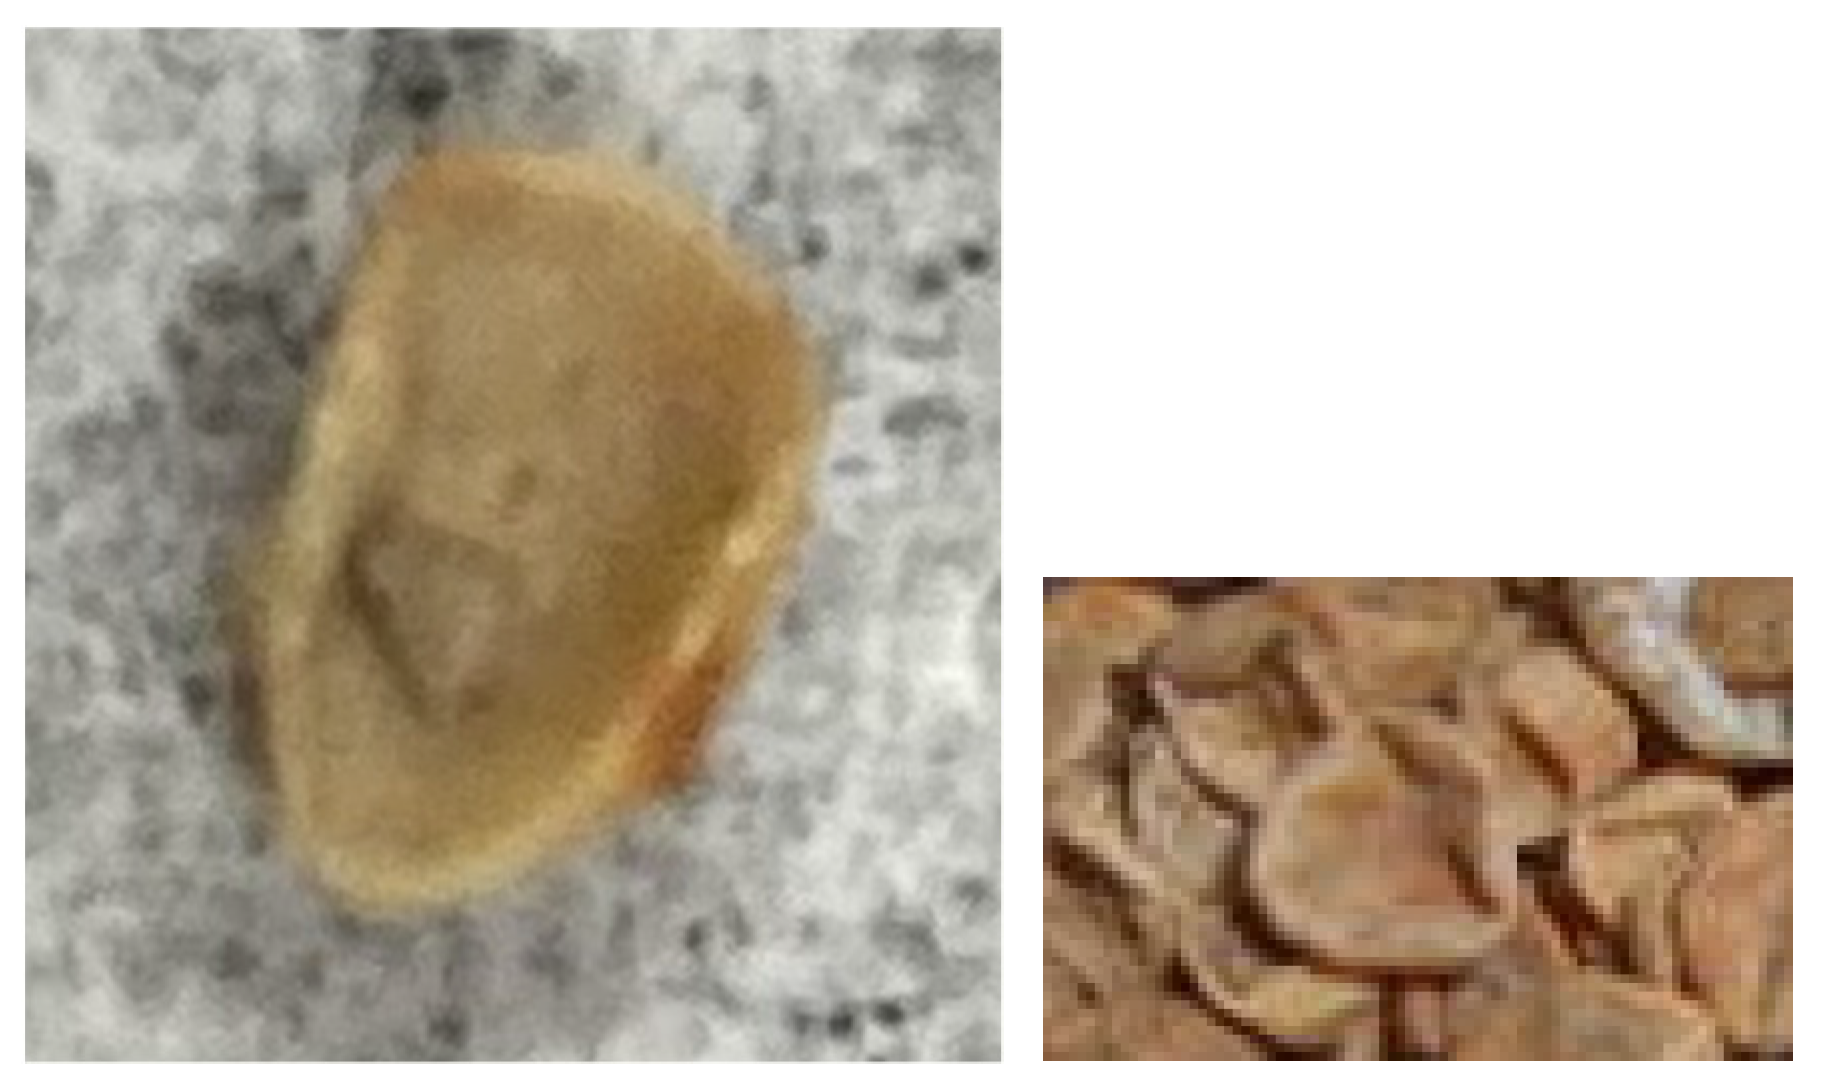
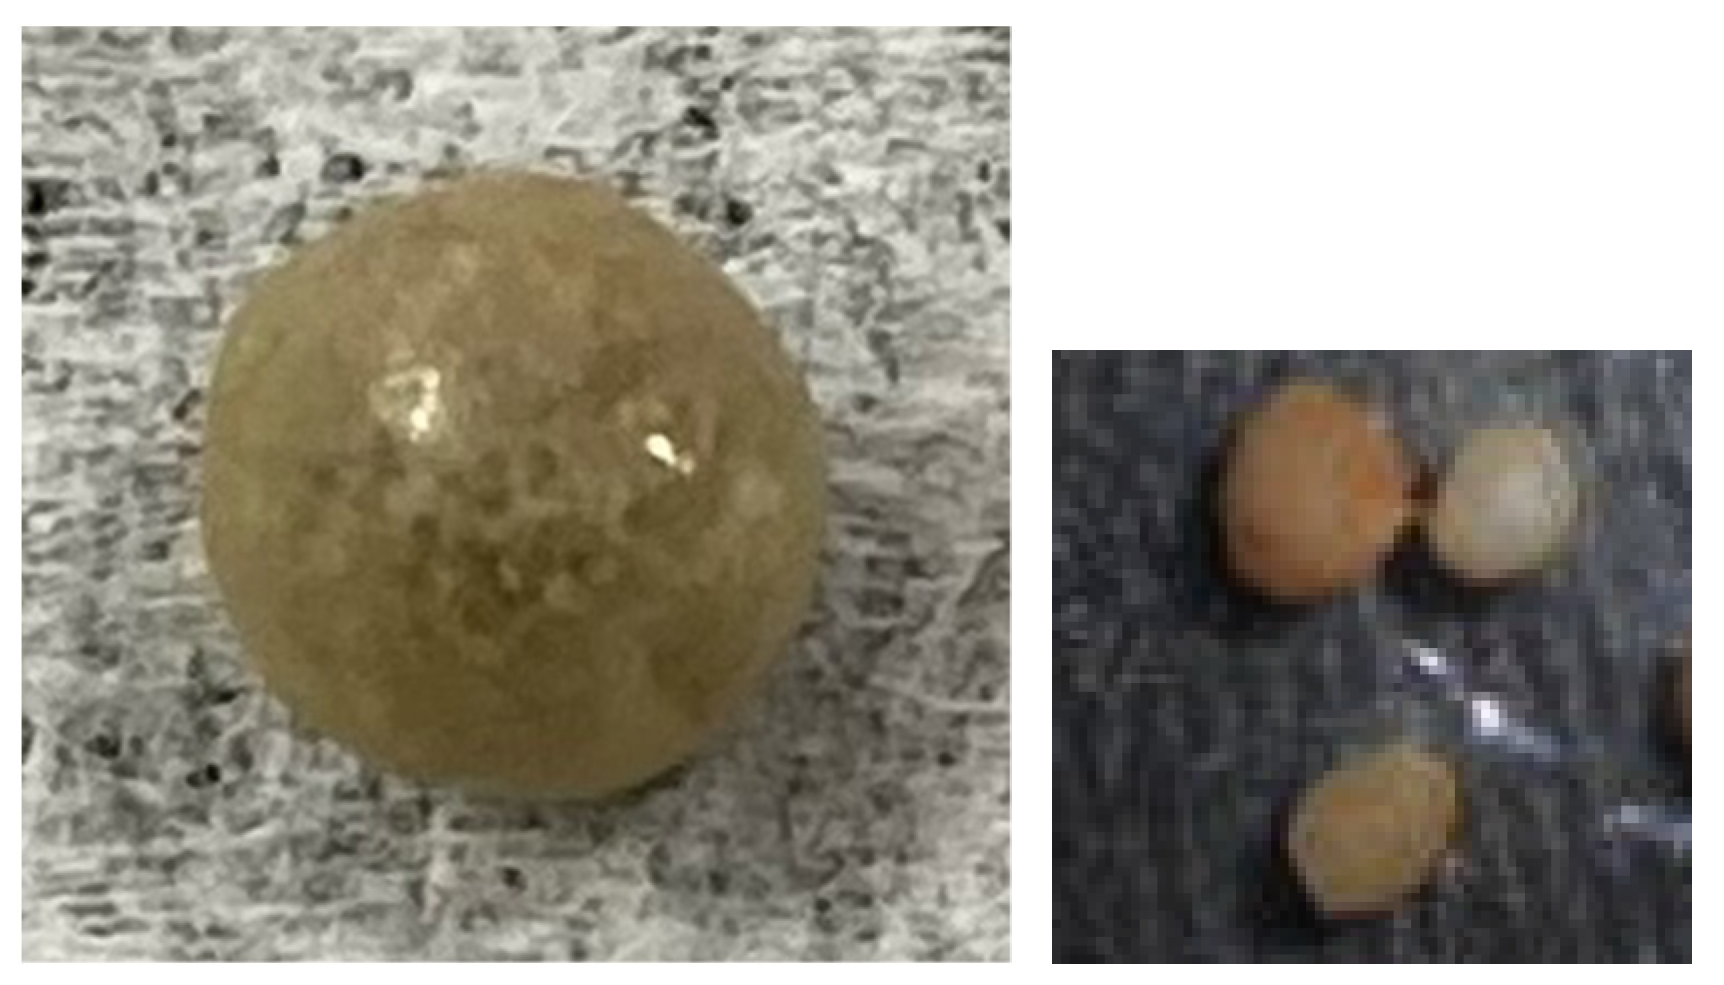
The authors evaluated the variations in the mass (weight) of the plastic capsules relative to biomass fragments > 3 mm in the floated and discharged mixtures in 2022. First, the floating capsules were categorized into three distinct shapes: shrunken (Figure 6), broken (Figure 7), and spherical (Figure 8). Subsequently, the weight distributions of floating capsules in fields C1 and C2 were compared with those of unused coated fertilizer capsules.

Figure 6.
Shrunken plastic capsule.
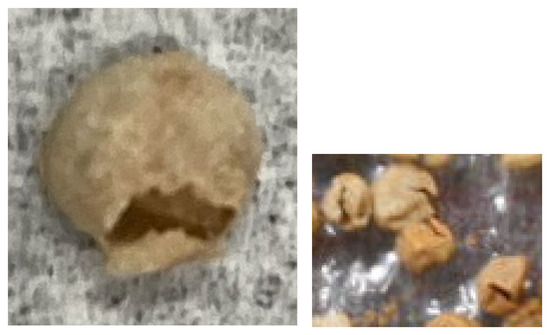
Figure 7.
Broken capsule.

Figure 8.
Spherical capsule.
Randomly selected floating capsules of the three types were obtained from fields C1 and C2 in 2022 (50 capsules of each, except for C2, from which only 25 capsules were collected). Then, 100 unused coated fertilizer capsules were weighed, and the average was calculated. Separately, the densities of these capsules were measured. The statistical significance of the differences among the average weights of the unused coated fertilizer capsules, and those among the floated capsules in C1 and C2, were analyzed by the t-test. Also, the statistical differences among the average weights of the three types of floated capsules in C1 and C2 were analyzed by variance analysis.
2.4. Extent of Coated Fertilizer Capsules in Paddy Fields
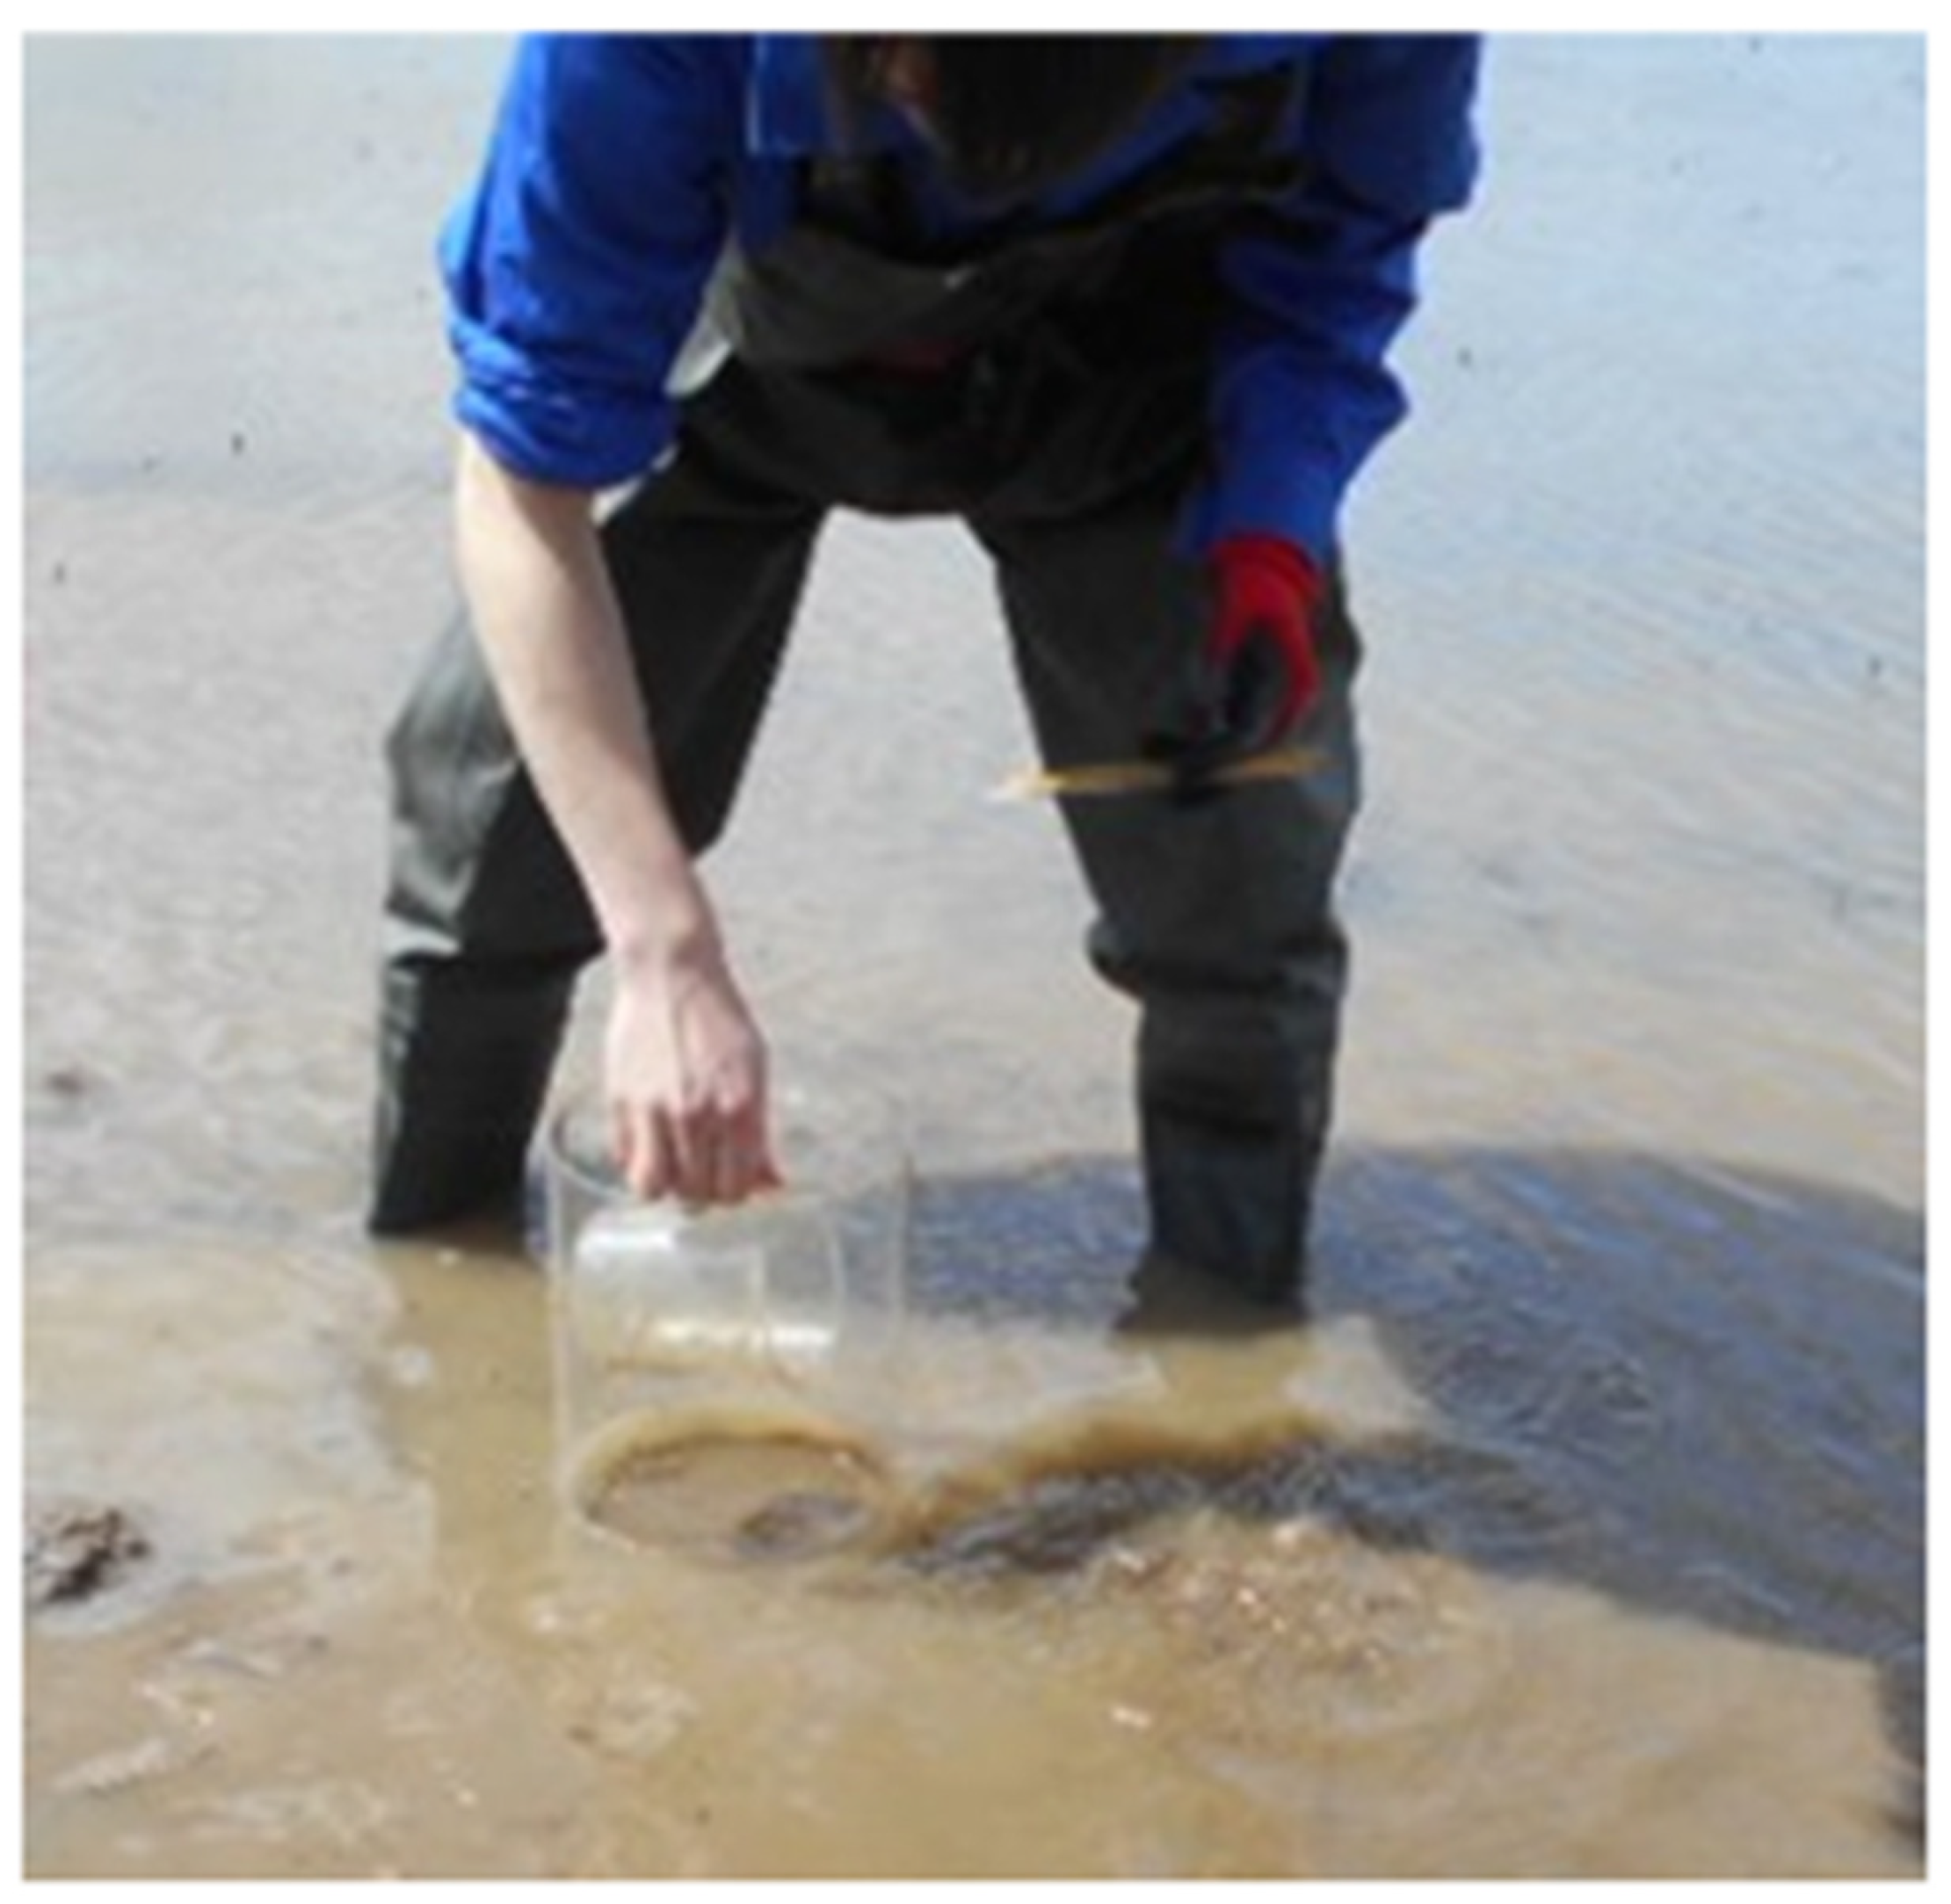
To assess the distribution of coated fertilizer capsules in paddy fields, capsules were collected by inserting transparent acrylic pipes (inner diameter: 180 mm) into the soil at several locations in paddies C1 and C2 (Figure 9, Figure 10 and Figure 11).
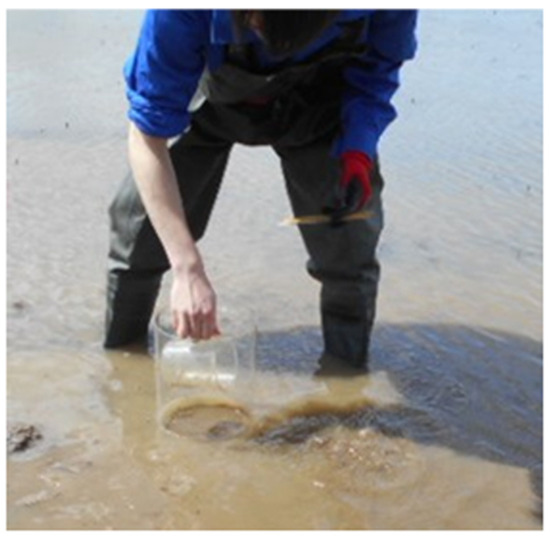
Figure 9.
Insertion of an acrylic pipe into the paddy soil (to a depth of 15 cm) to collect fertilizer capsules.
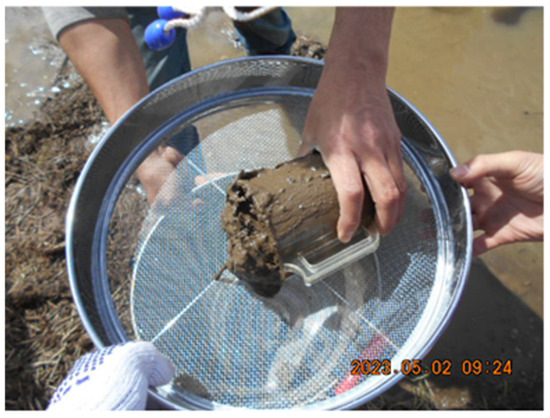
Figure 10.
Placement of a soil sample on a 2 mm mesh.
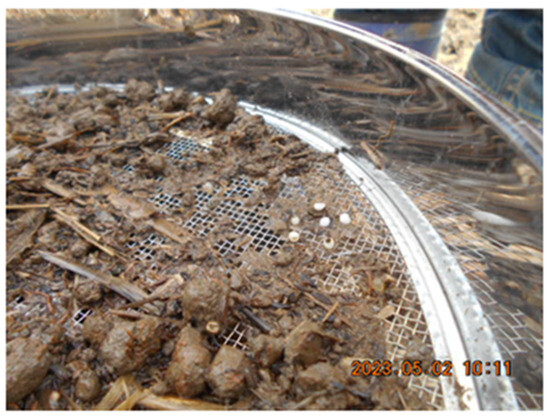
Figure 11.
Washing a sample to remove soil and count the capsules in the sample.
2.5. Chemical Analyses and Sample Preparation
All of the capsules were washed thoroughly with Milli-Q water (Millipore) in an ultrasonic cleaner. Scanning electron microscope (SEM) images were captured after the capsules had been sectioned using a microtome and mounted. The segments were then coated with platinum using a sputtering machine (JEC-3000FC; JEOL, Tokyo, Japan). The outer and inner surfaces, as well as the freshly cut cross-sections of these segments, were examined using SEM (JCM7000; JEOL, Japan).
Carbon concentration and carbon isotopic analyses were performed using a continuous flow system with an elemental analyzer coupled with an isotope ratio mass spectrometer (EA-IRMS; Delta-V equipped with Flash EA 2000, Thermo Fisher Scientific, Waltham, MA, USA) at Fukushima University. The methods used were based on protocols used by the authors previously [26,27,28,29]. The isotopic composition was expressed in ‰ and calculated using the following equation:
where Rsample is the 13C/12C ratio in the sample, and Rstandard is the 13C/12C ratio in the standard [30]. The standard reference materials are carbonate in Vienna PeeDee Belemnite (PDB). We used DL-α-alanine (Shoko Science Co., Ltd., Yokohama, Japan), L-leucine (CERKU-04), and L-threonine (CERKU-05) as internal standards to calibrate the δ13C of the samples [30]. The analytical precision, expressed as the standard deviation for our δ13C analyses, was within ±0.15‰.
δ13C = [(Rsample/Rstandard) − 1] × 1000
3. Results and Discussion
3.1. Proportion of Floating Capsule Weight to the >3-mm Biomass Fraction
The authors compared the variations in the mass (weight) of the plastic capsules relative to those of >3 mm fragments screened from floating biomass and discharged mixtures in 2022 (Table 4 and Table 5). The trends in the proportions shown in Table 4 across four paddy fields appeared to reflect the trends in total nitrogen usage at the sites. At field B, where farmers are trying to reduce the fertilizer volume, the smallest proportion of floating capsules was observed among the four fields. A comparison of the proportions shown in Table 4 and Table 5 suggested similar trends, leading to the conclusion that the reduction in capsule runoff from the paddy fields reflected the reduction in the volume of floating capsules. This conclusion should be verified through a comparison of the total floating and total discharged loads. However, collecting all of the floating and discharged loads is quite difficult and the authors were unable to accomplish this within the scope of the current study. This limitation is an important area for future research.
Table 4.
Proportion of floating capsule weight to weight of >3 mm biomass fragments in 2022.
Table 5.
Proportion of discharged capsule weight to weight of >3 mm biomass fragments in 2022.
3.2. Comparison of Floating Capsule Weight in Fields C1 and C2
Table 4 shows that the proportion of the floating capsule weight in C1 corresponded to 78.6% of that in C2 in 2022, suggesting that the discharge of capsules from C1 is smaller than that from C2 because the farmers did not use coated fertilizer in C1 in 2021. The same comparison in 2022 indicates that the proportion of floating capsules in C1 corresponded to 17.6% of that in C2 in 2023. The results suggest that the decrease in the floating capsule weight after the use of coated fertilizer was stopped in 2021 proceeded more rapidly for the 3-year period from 2020 to 2023 than for the 2-year period from 2020 to 2022. These results are compared with carbon isotopic analyses below.
3.3. Presence of Plastic-Coated Fertilizer within Paddy Soil
Table 6 shows that the depth profile of the coated fertilizer capsules exhibited a clear peak at 5–10 cm. This pattern can be attributed to the density of the coated fertilizers, which exceeds unity (>1.3 g/cm3), causing the fertilizer to penetrate deeper into the paddy soil. The Ministry of Agriculture reported that coated fertilizers typically accumulate within 10 cm of the surface [1]. Our analysis at 5 cm intervals showed more granular insights. The age of the fertilizer capsules buried in the soil was estimated based on their color; white capsules were initially presumed to be newer, although recent findings have identified some older white capsules. Consequently, while the results shown in Table 6 are considered to be qualitatively accurate, a more rigorous approach is needed to obtain more quantitative data.
Table 6.
Number of solid coated fertilizer capsules present in different depths of paddy soil.
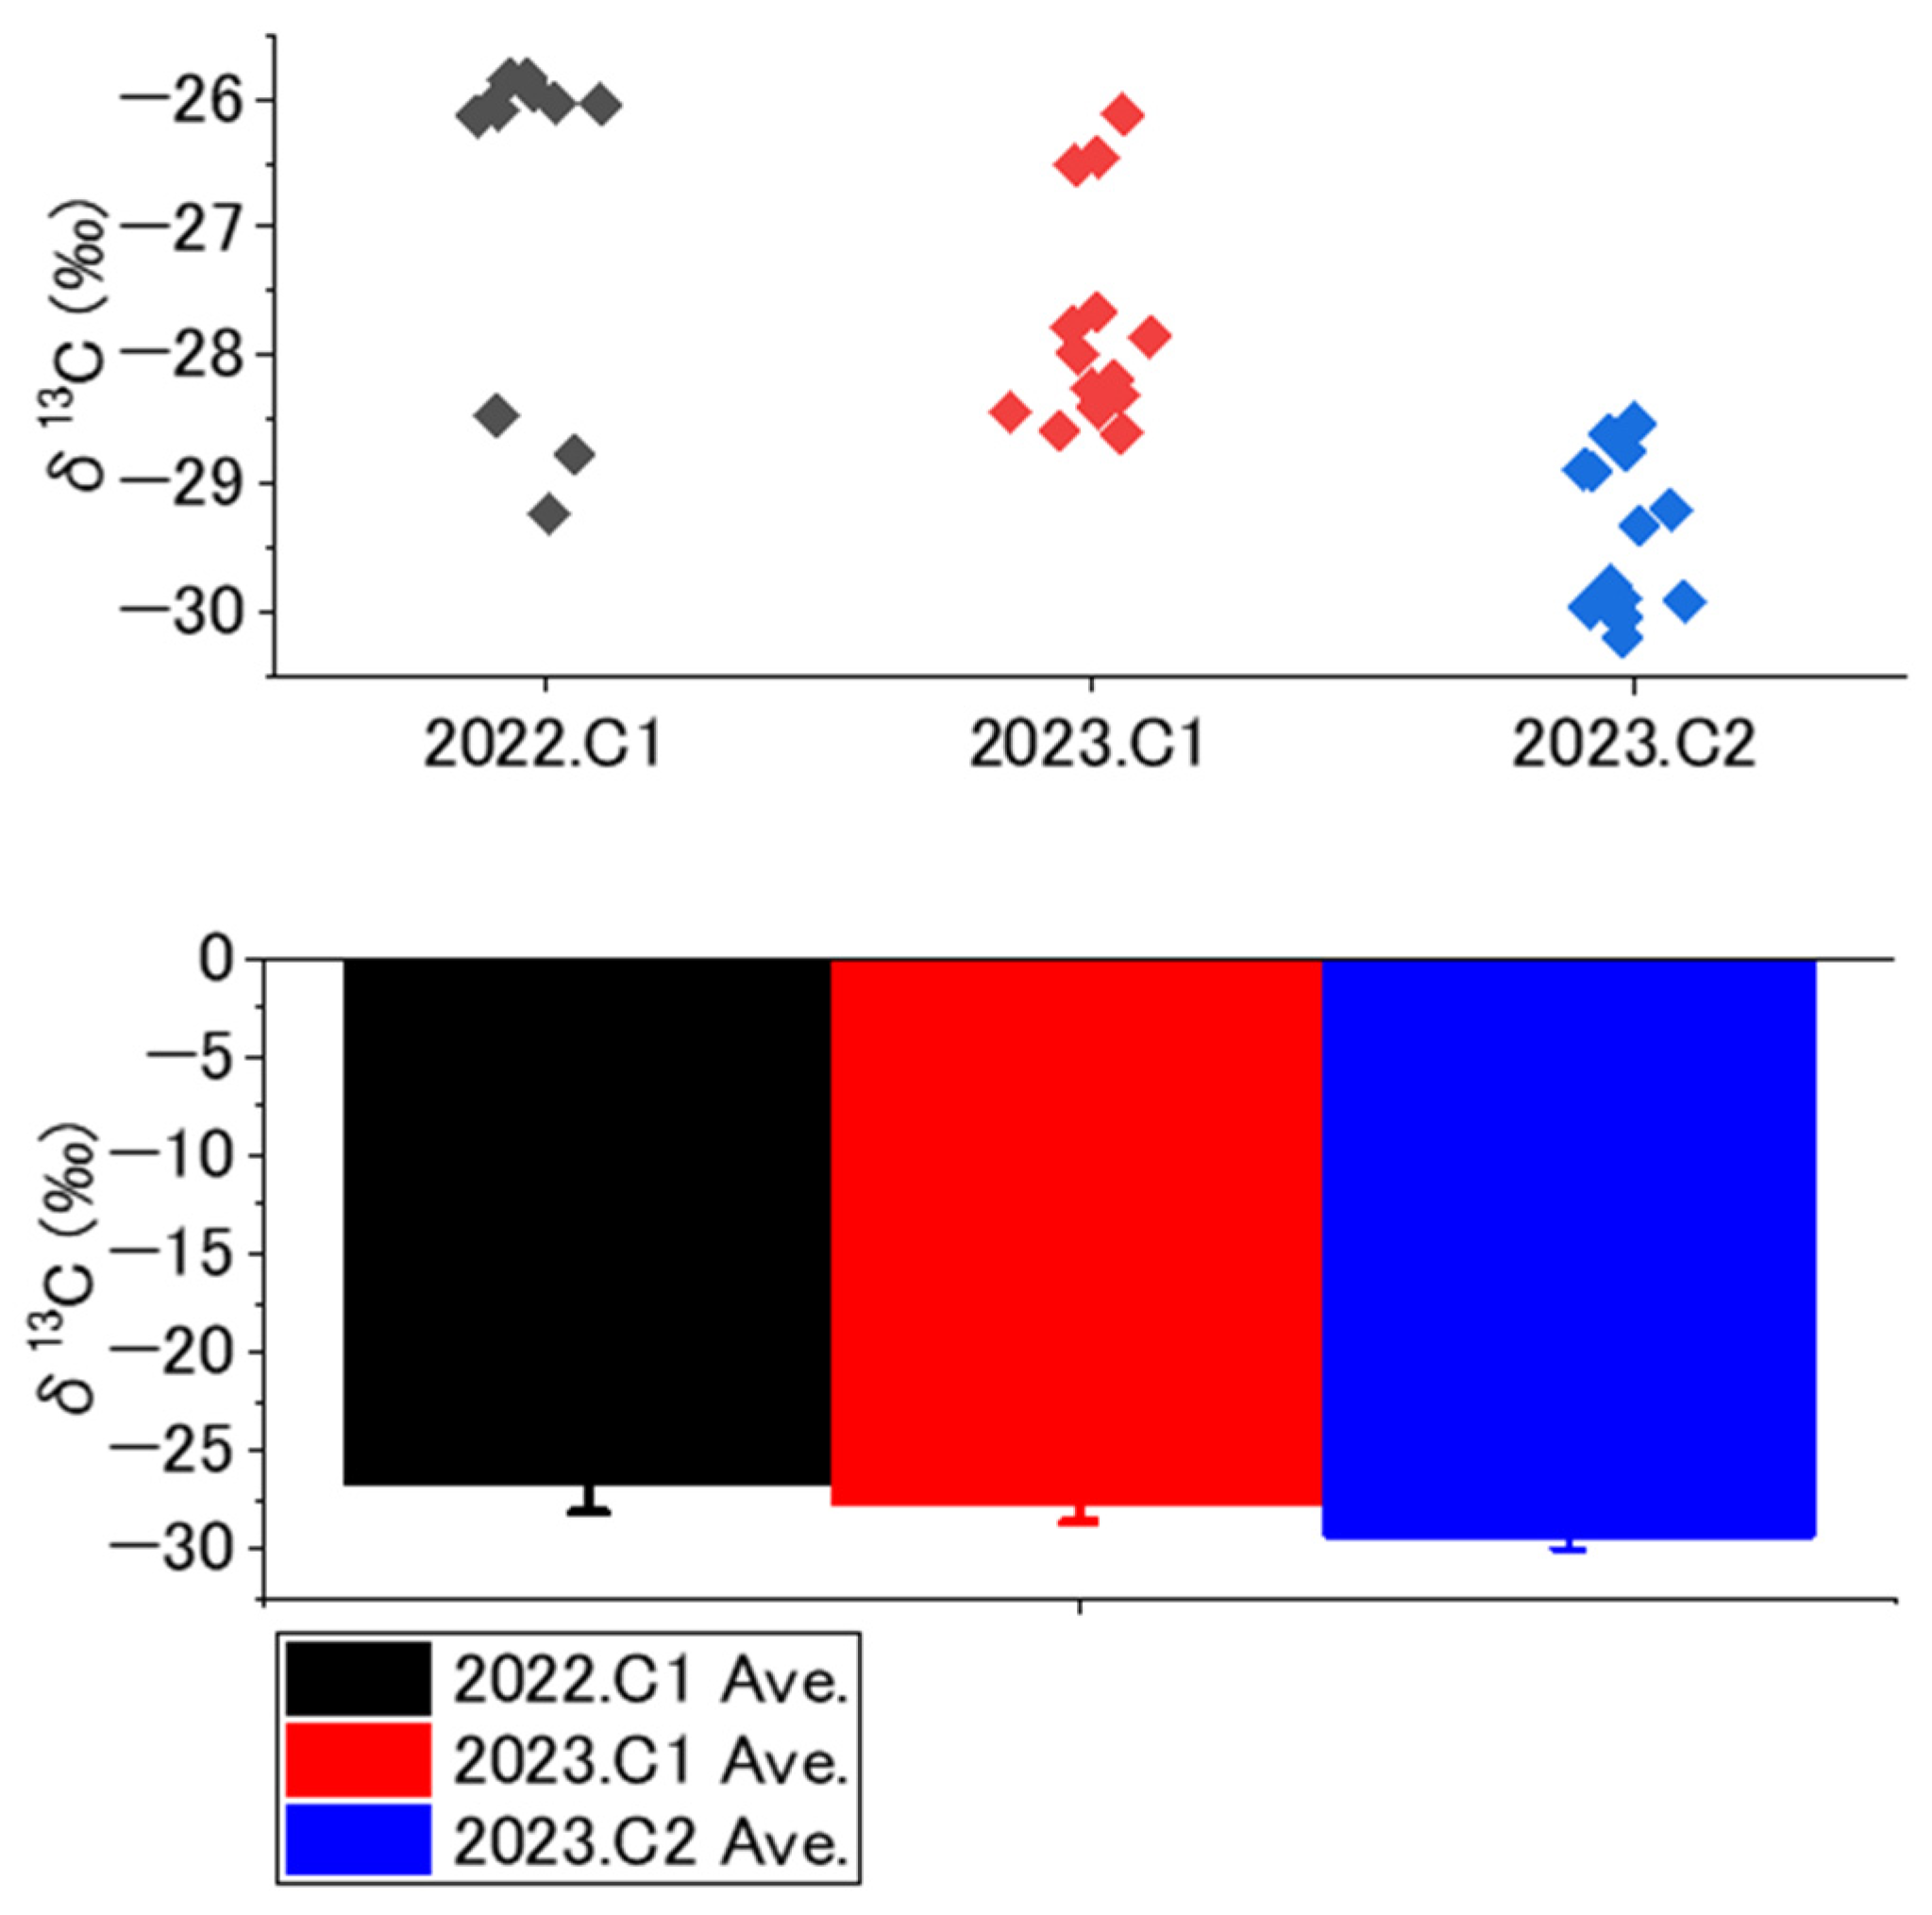
3.4. Carbon Isotopic Analyses
Figure 12 shows the variations in δ13C for the samples collected from field C1 in 2022 and 2023 and from field C2 in 2023 (hereafter referred to as 2022.C1, 2023.C1, and 2023.C2, respectively). Given that the floating capsules are a mixture of capsules of different ages, we analyzed the statistical significance of the differences in the average δ13C values across these three groups. The comparison between the average δ13C values of 2022.C1 and 2023.C1 assesses whether a population that is 1 year older exhibits a higher average 13C abundance; the findings demonstrated that this is the case (p = 0.0246). Furthermore, the comparison between the average δ13C values of 2023.C1 and 2023.C2 investigates whether the population with the higher proportion of older capsules demonstrates a higher average 13C abundance; the findings demonstrated that this is the case (p = 2 × 10⁻⁶). These results verify that the cessation of coated fertilizer application leads to increases in 13C abundance due to an increase in the proportion of older capsules.

Figure 12.
Variations in δ13C in floating capsules from field C1 in 2022 and 2023 and from field C2 in 2023.
3.5. SEM Analyses and Additional Factors Affecting 13C Abundance
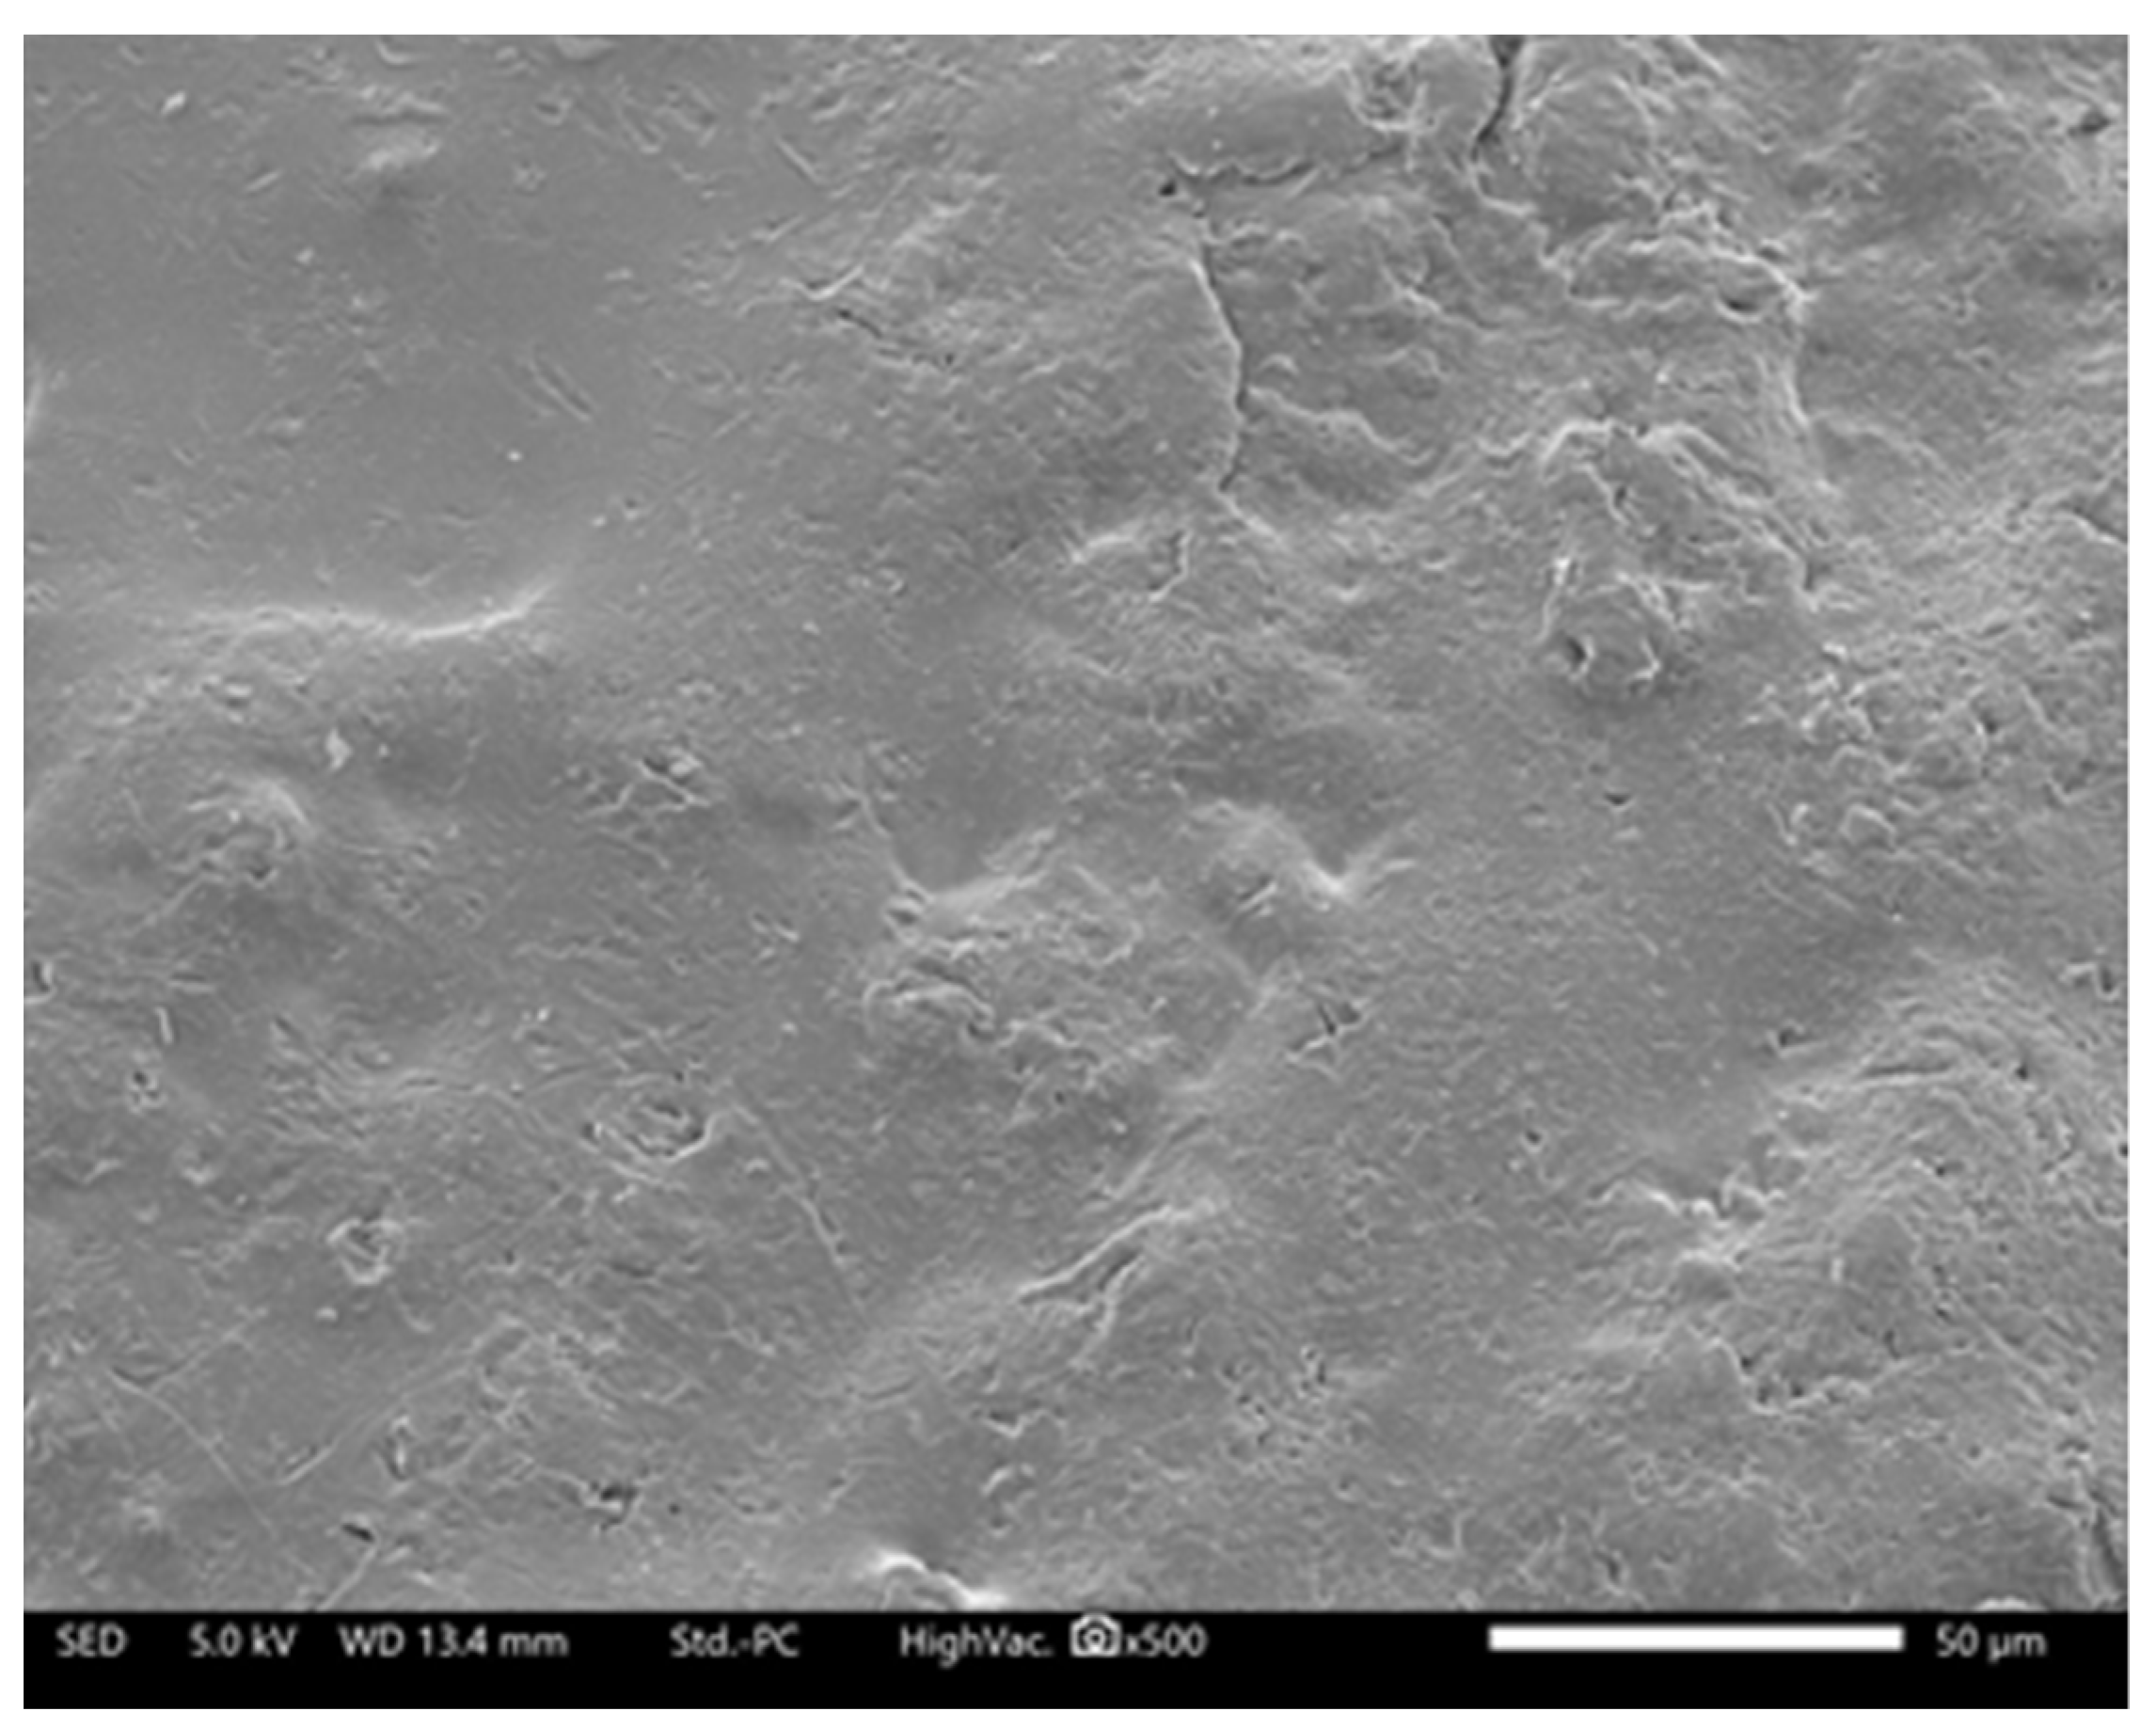
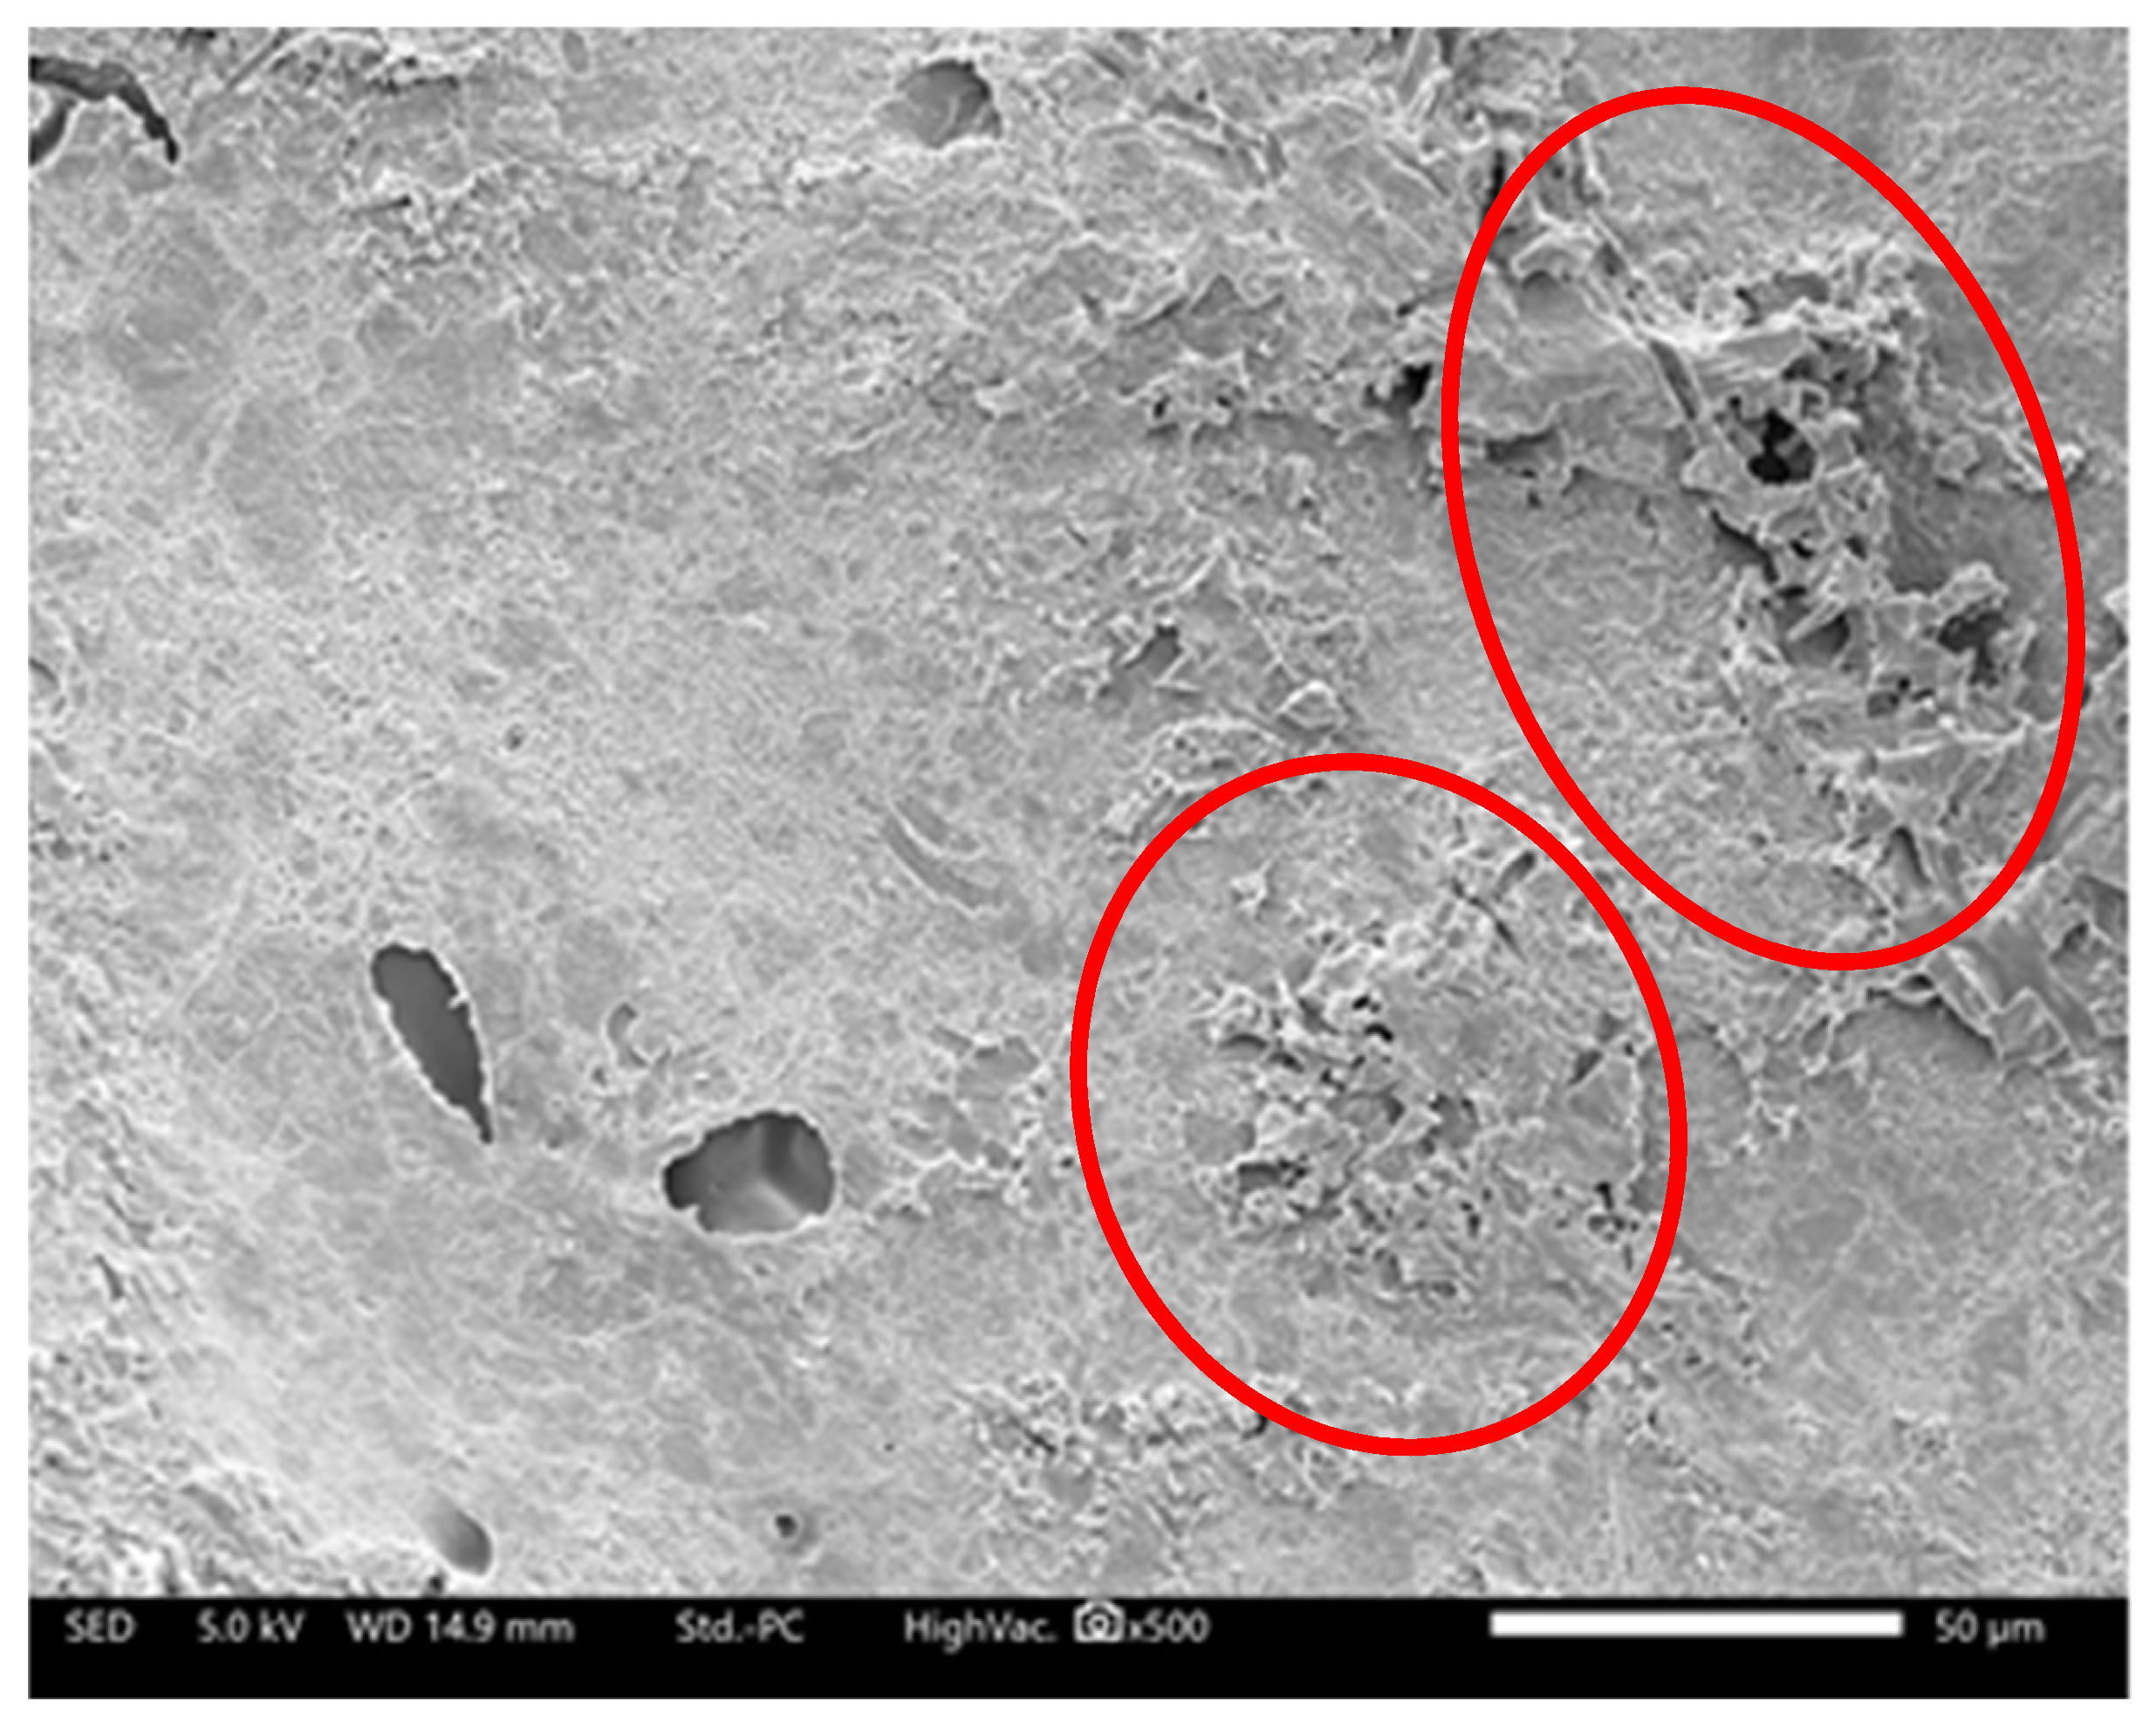
Figure 13 shows an SEM image of the outer surface of a floating capsule. Since no mud or biota is present on the surface, contamination of the capsule exterior is not of concern. However, the SEM image of the interior of a floating capsule (Figure 14) shows that some materials, probably crystallized fertilizer, are present.

Figure 13.
SEM image of the outer surface of a floating capsule.

Figure 14.
SEM image of the interior surface of a floating capsule, with red circles indicating the presence of materials such as crystalized fertilizer.
We measured 13C abundance in capsules from unused fertilizer that were rinsed in Milli-Q water (Millipore) (Figure 15). The results show that the rinsed capsules exhibited higher δ13C abundance. Analysis of the fertilizer content within the capsules revealed the presence of urea, which has a very low 13C abundance. These results indicate that the release of urea from the coated fertilizer increases 13C abundance. This mechanism not only increases 13C abundance, but also accelerates the degradation of the capsule itself. We concluded that the observed variation in the 13C abundance, as shown in Figure 16, reflects the combined effect of capsule degradation and the release of urea, resulting in significant differences in the average 13C abundance.
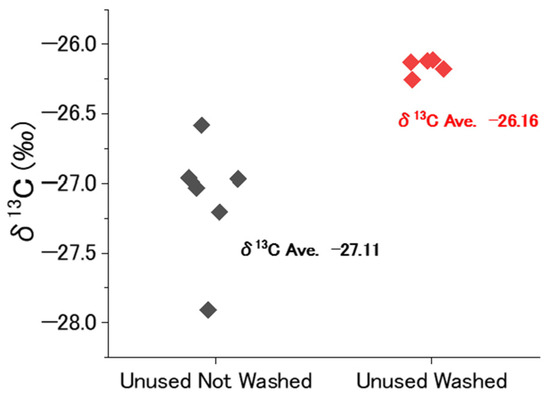
Figure 15.
δ13C abundance in capsules detached from unused fertilizer (capsules washed and those not washed).
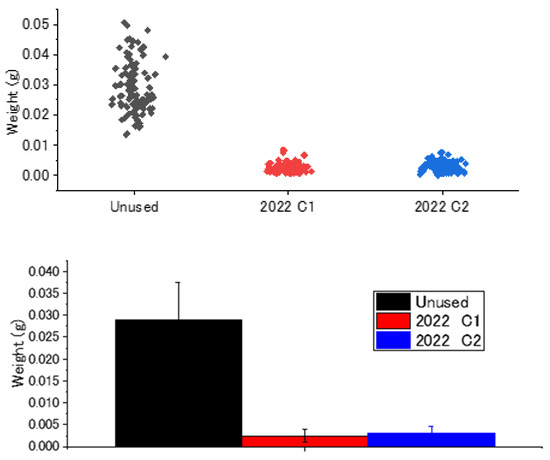
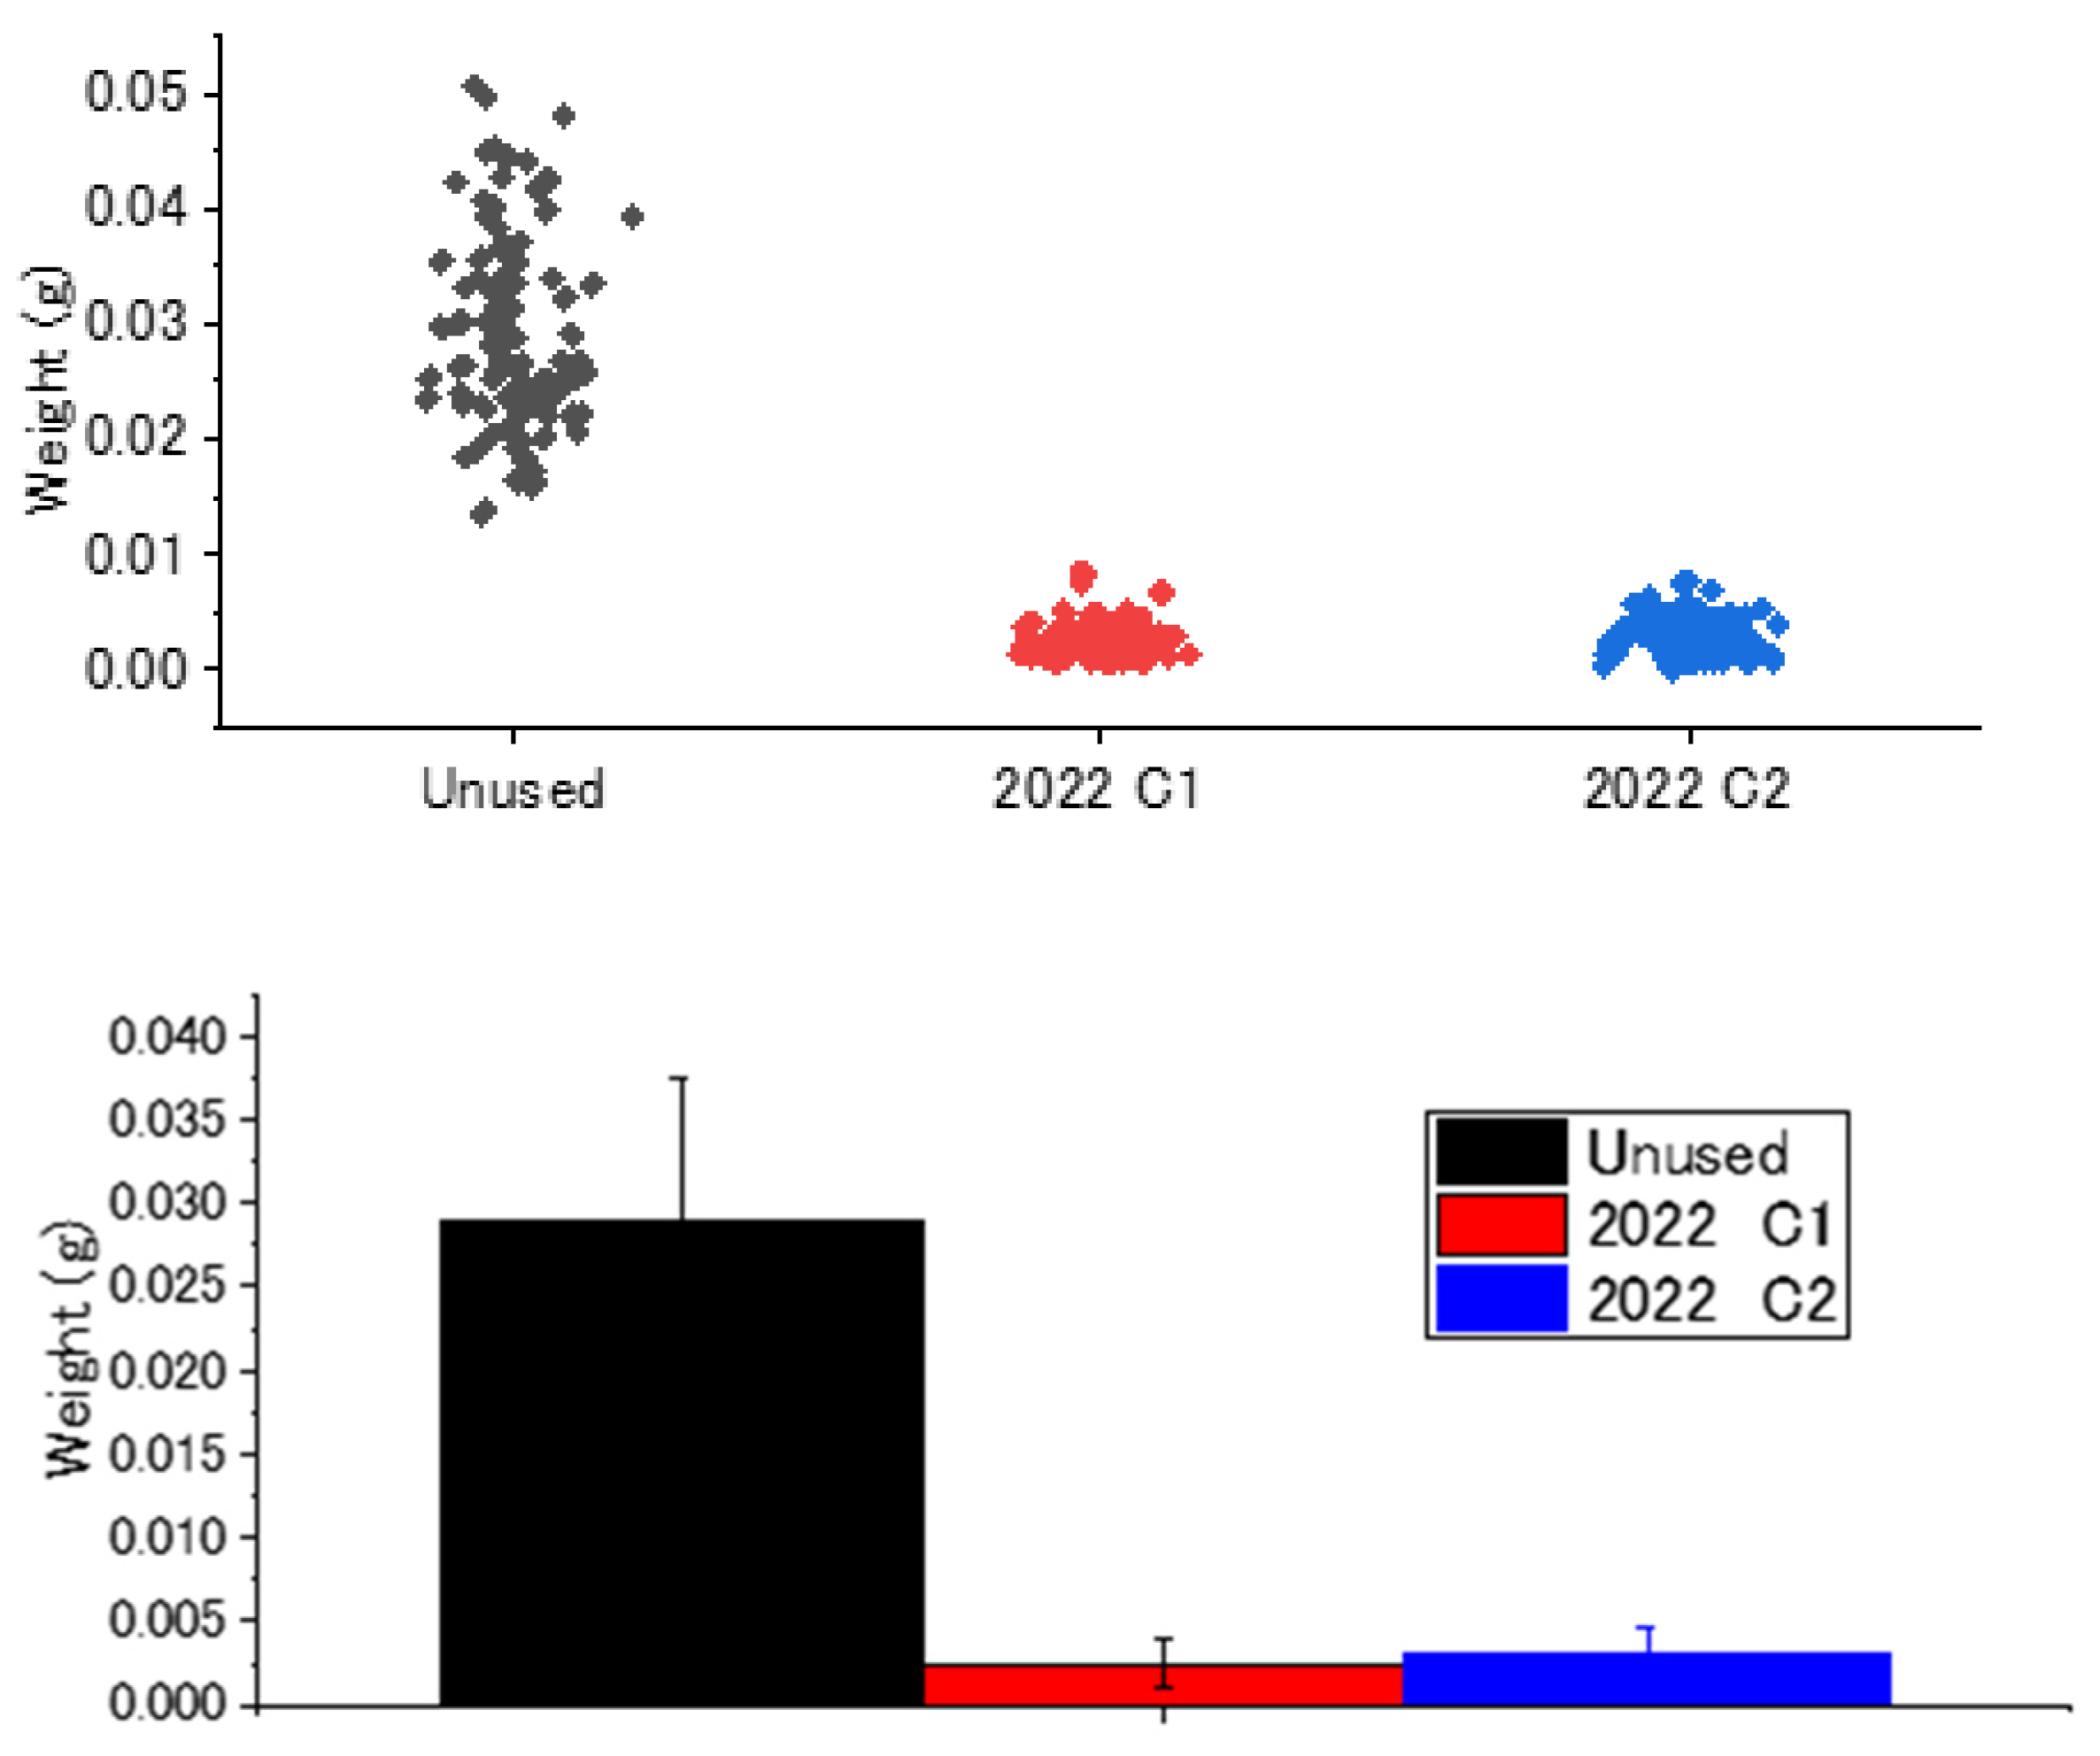
Figure 16.
Weights of unused coated fertilizer capsules and floating capsules from fields C1 and C2 (2022).
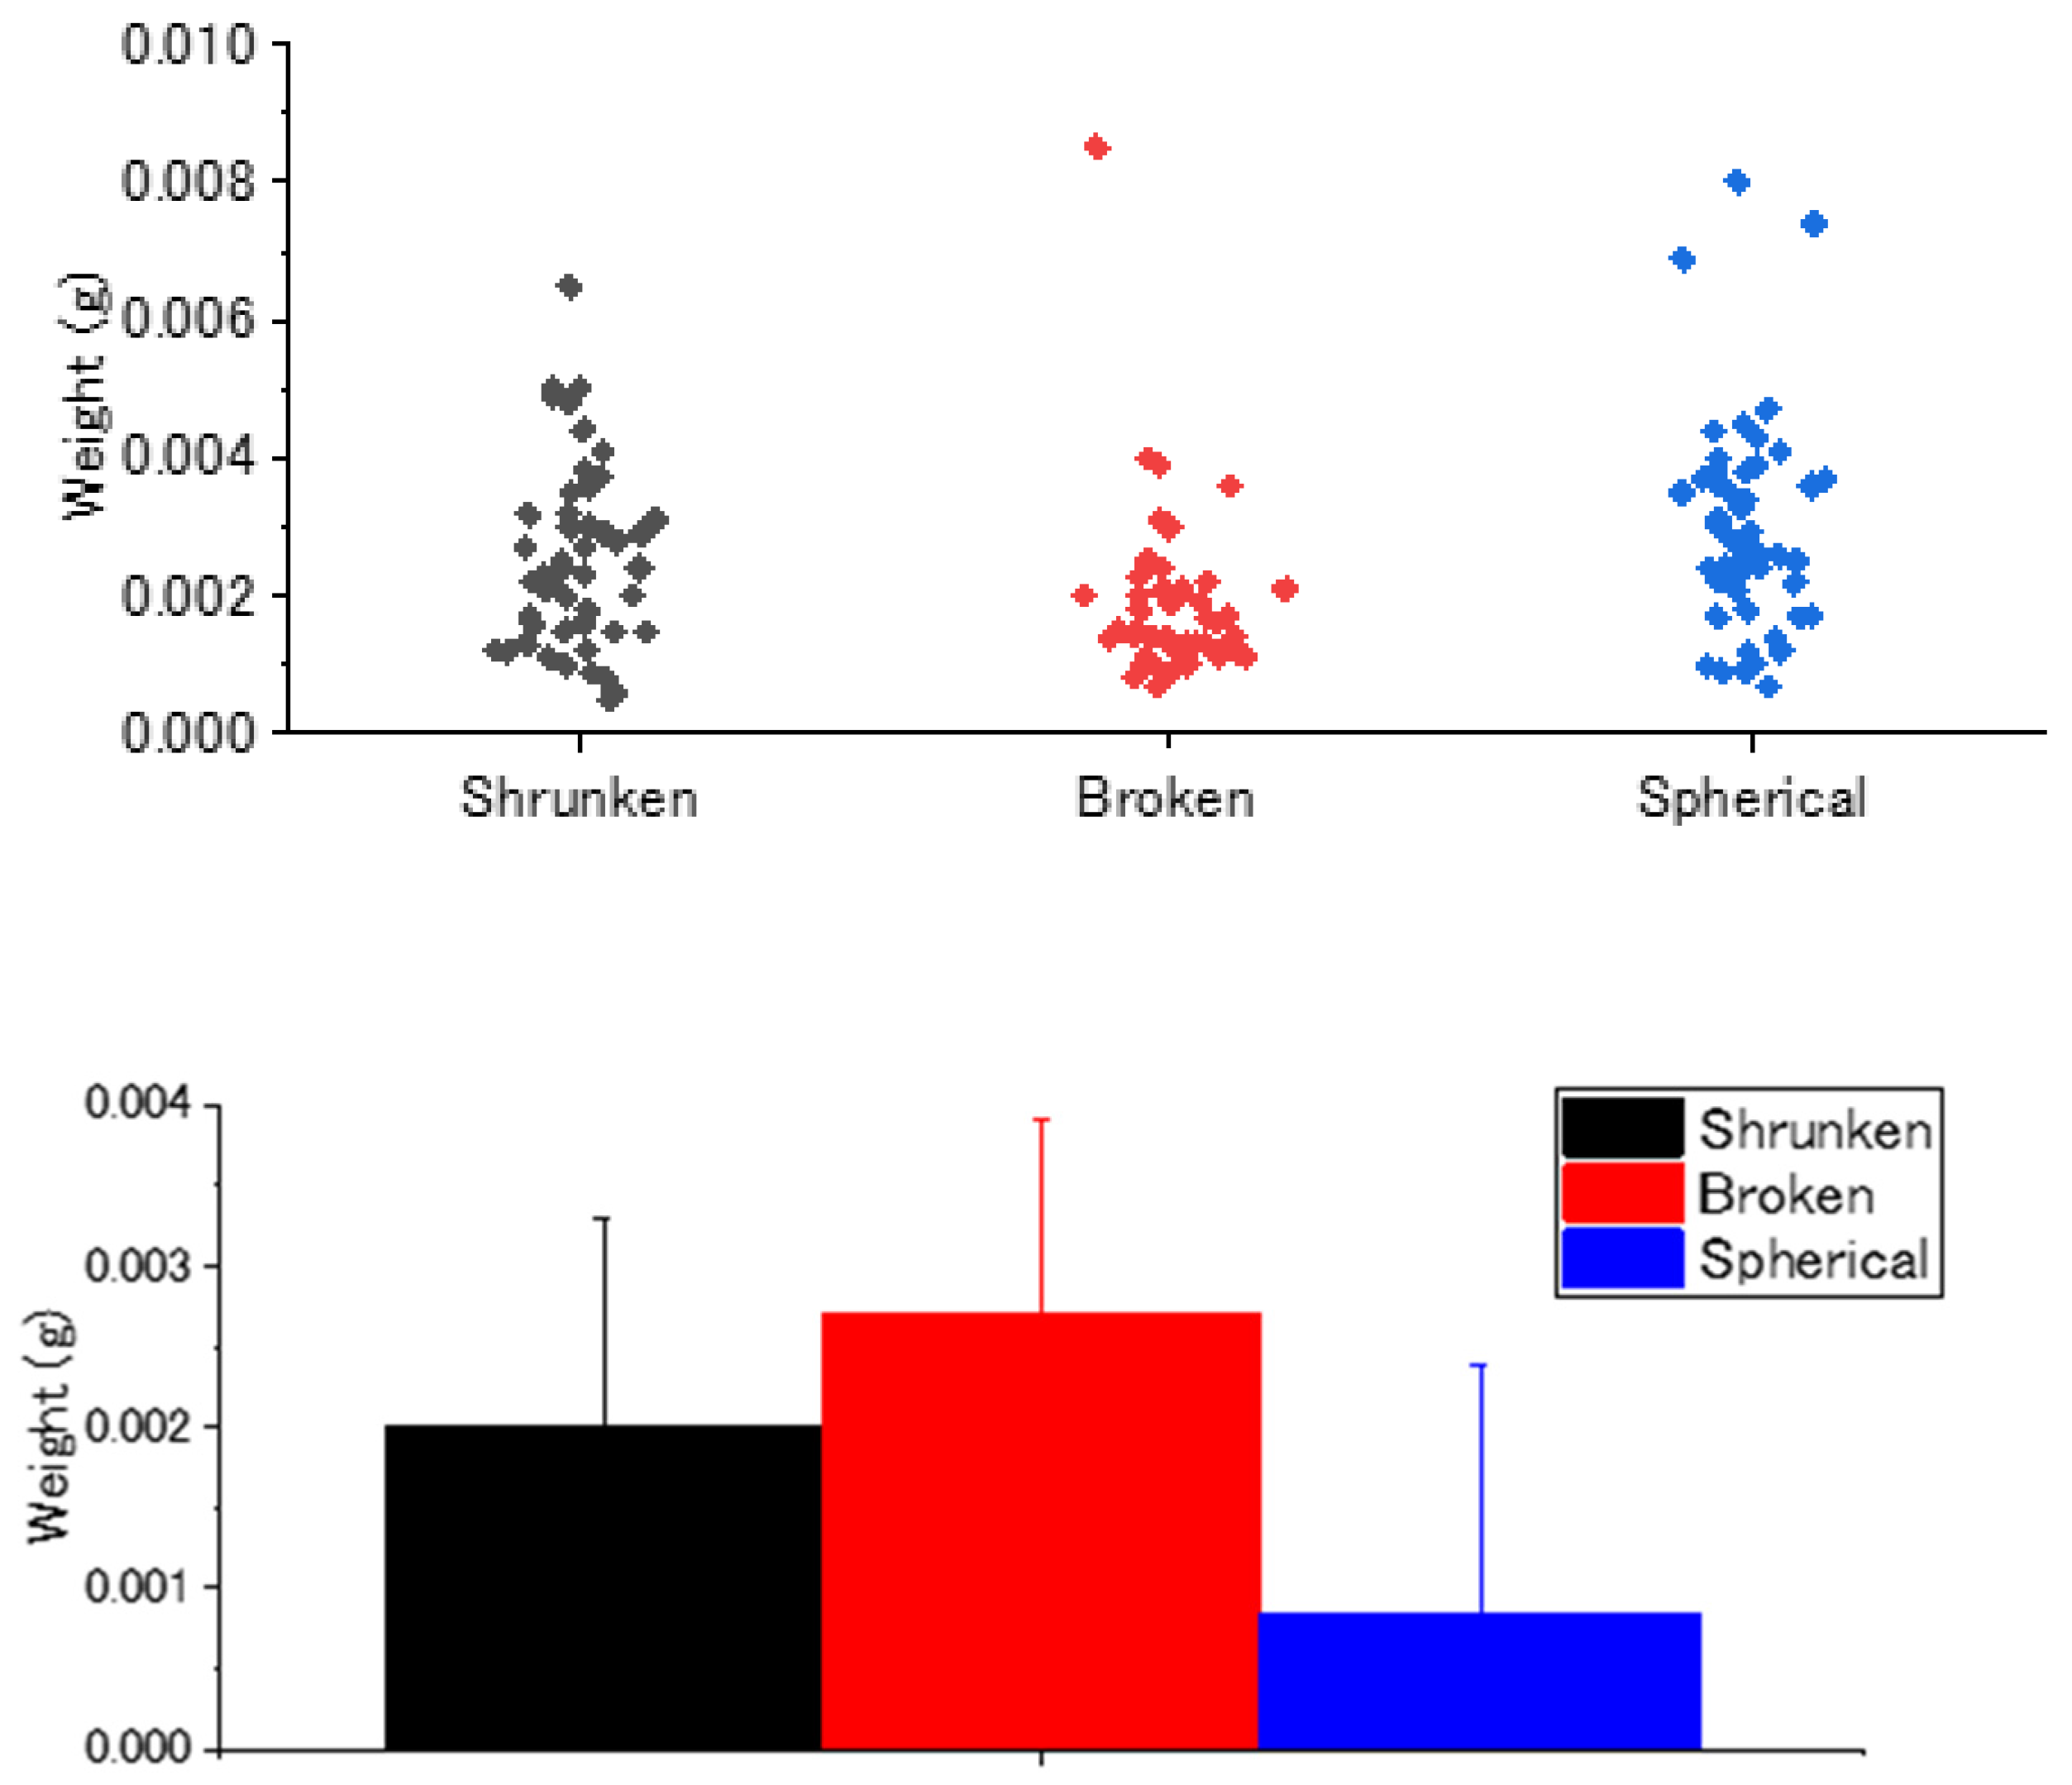
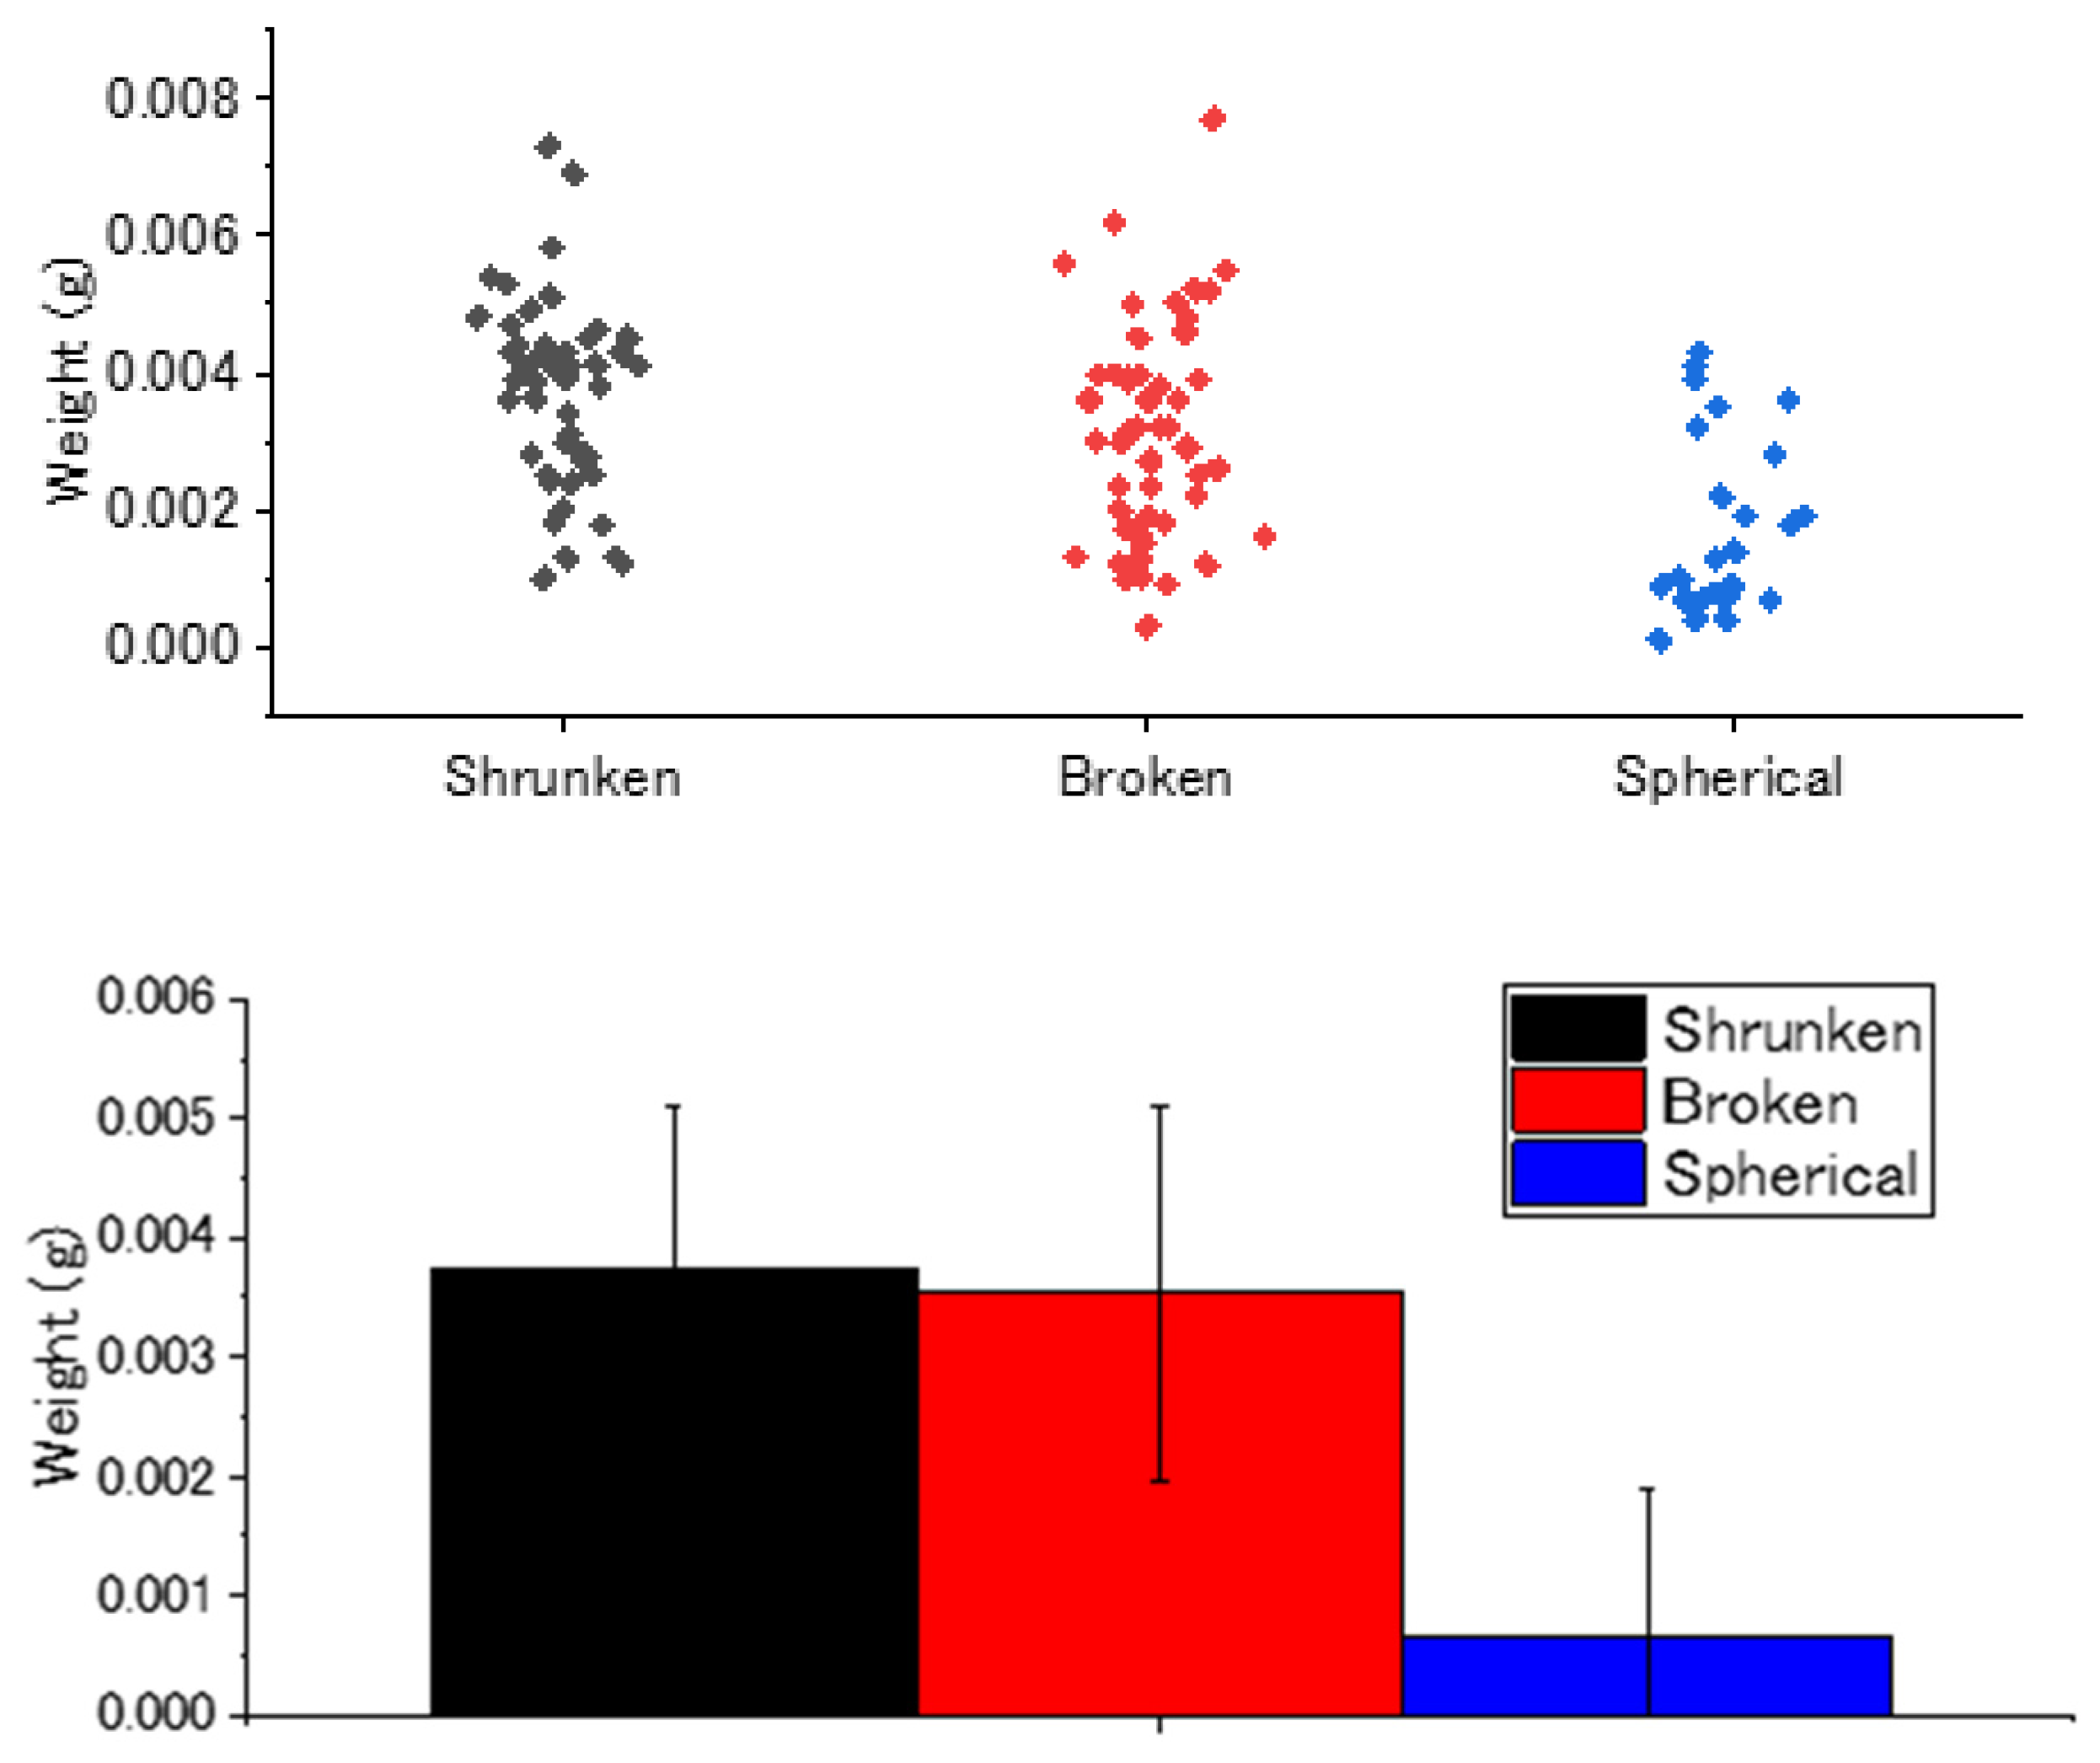
Further analyses were performed on the differences in the average weight of unused fertilizer capsules, the 2022.C1 population, and the 2022.C2 population (Figure 16). The figure shows the weight distribution and average of randomly selected three types of capsules obtained from C1 and C2 in 2022 (50 capsules each, but 25 capsules in the case of the spherical capsules from C2) and that of unused coated fertilizer (100 capsules). The results indicate that the urea constituted a large part of the unused fertilizer by weight. Also, the average weights of the 2022.C1 and 2022.C2 samples were significantly different (p = 0.0013), which might be due to the increased proportion of older capsules in the 2022.C1 samples. Regarding the differences in the three types of floating capsules in 2022.C1 and 2022.C2 (Figure 17 and Figure 18, respectively), a statistically significant difference (p < 0.05) was observed for both the 2022.C1 and 2022.C2 samples, as estimated by variance analysis.

Figure 17.
Weights of three types of floating capsules from field C1 (2022).

Figure 18.
Weights of three types of floating capsules from field C2 (2022).
4. Conclusions and Future Work
- Intensive surveys were conducted in four paddy fields Fukushima and Miyagi prefectures in 2022 and 2023 to investigate the behavior of floating and discharged plastic capsules, originally used as coated fertilizer and degraded over time. Understanding the floating behaviors of these capsules after ploughing is critical for assessing their role in the serious issue of plastic runoff. The capsules collected from the paddy fields represent a mixture of different ages, each having been subjected to a variety of different processes, such as degradation and leaching. Therefore, the primary objective of the present study was to clarify the average behaviors of different capsule populations.
- Comparisons of the proportion of the floating capsules to >3 mm biomass fragments between two distinct populations were conducted. Population 1 consisted of floating capsules from a field with continuous use of coated fertilizer, while Population 2 consisted of floating capsules from a field with intermittent coated fertilizer application. The results revealed that significant degradation of the capsules typically occurred more than 2 years after the application of the coated fertilizer to the paddy fields.
- Marked differences in the proportions as well as the variations in δ13C values were observed between the two populations after 3 years. The enhancement in δ13C values can be attributed to both the degradation of the capsules in the paddy soils and the release of urea from within the coated fertilizers, which collectively contribute to increasing δ13C values over time.
- The weight of each capsule was measured, revealing statistically significant differences between the two populations, in addition to variations in δ13C. A high degree of consistency was observed in the variation in the variations concerning the weight proportion of the floating capsules relative to that of >3 mm biomass, the weight of individual floating capsules, and δ13C values.
For future work, it is essential to quantify the capsules that float, the capsules that are discharged, and the capsules that are retained within the paddy soils, and to develop a mass balance model. Key parameters for this model might include the mechanical efficiency of ploughing, the ratios of discharged to floating capsule weights, and the degradation rates of capsules under various conditions. Conducting both full-scale and controlled indoor experiments are considered necessary to validate the model.
The indoor experiments are expected to quantify the degradation rates of the capsules under different physical, chemical, biological, and ecological conditions. While the approach employed in this study to estimate the average behavior of each population effectively clarified the role of phenomena occurring in the actual paddy field environment, a more precise approach is required to analyze the factors affecting the individual phenomena. Therefore, controlled indoor experiments are strongly recommended to provide detailed insights into these complex interactions.
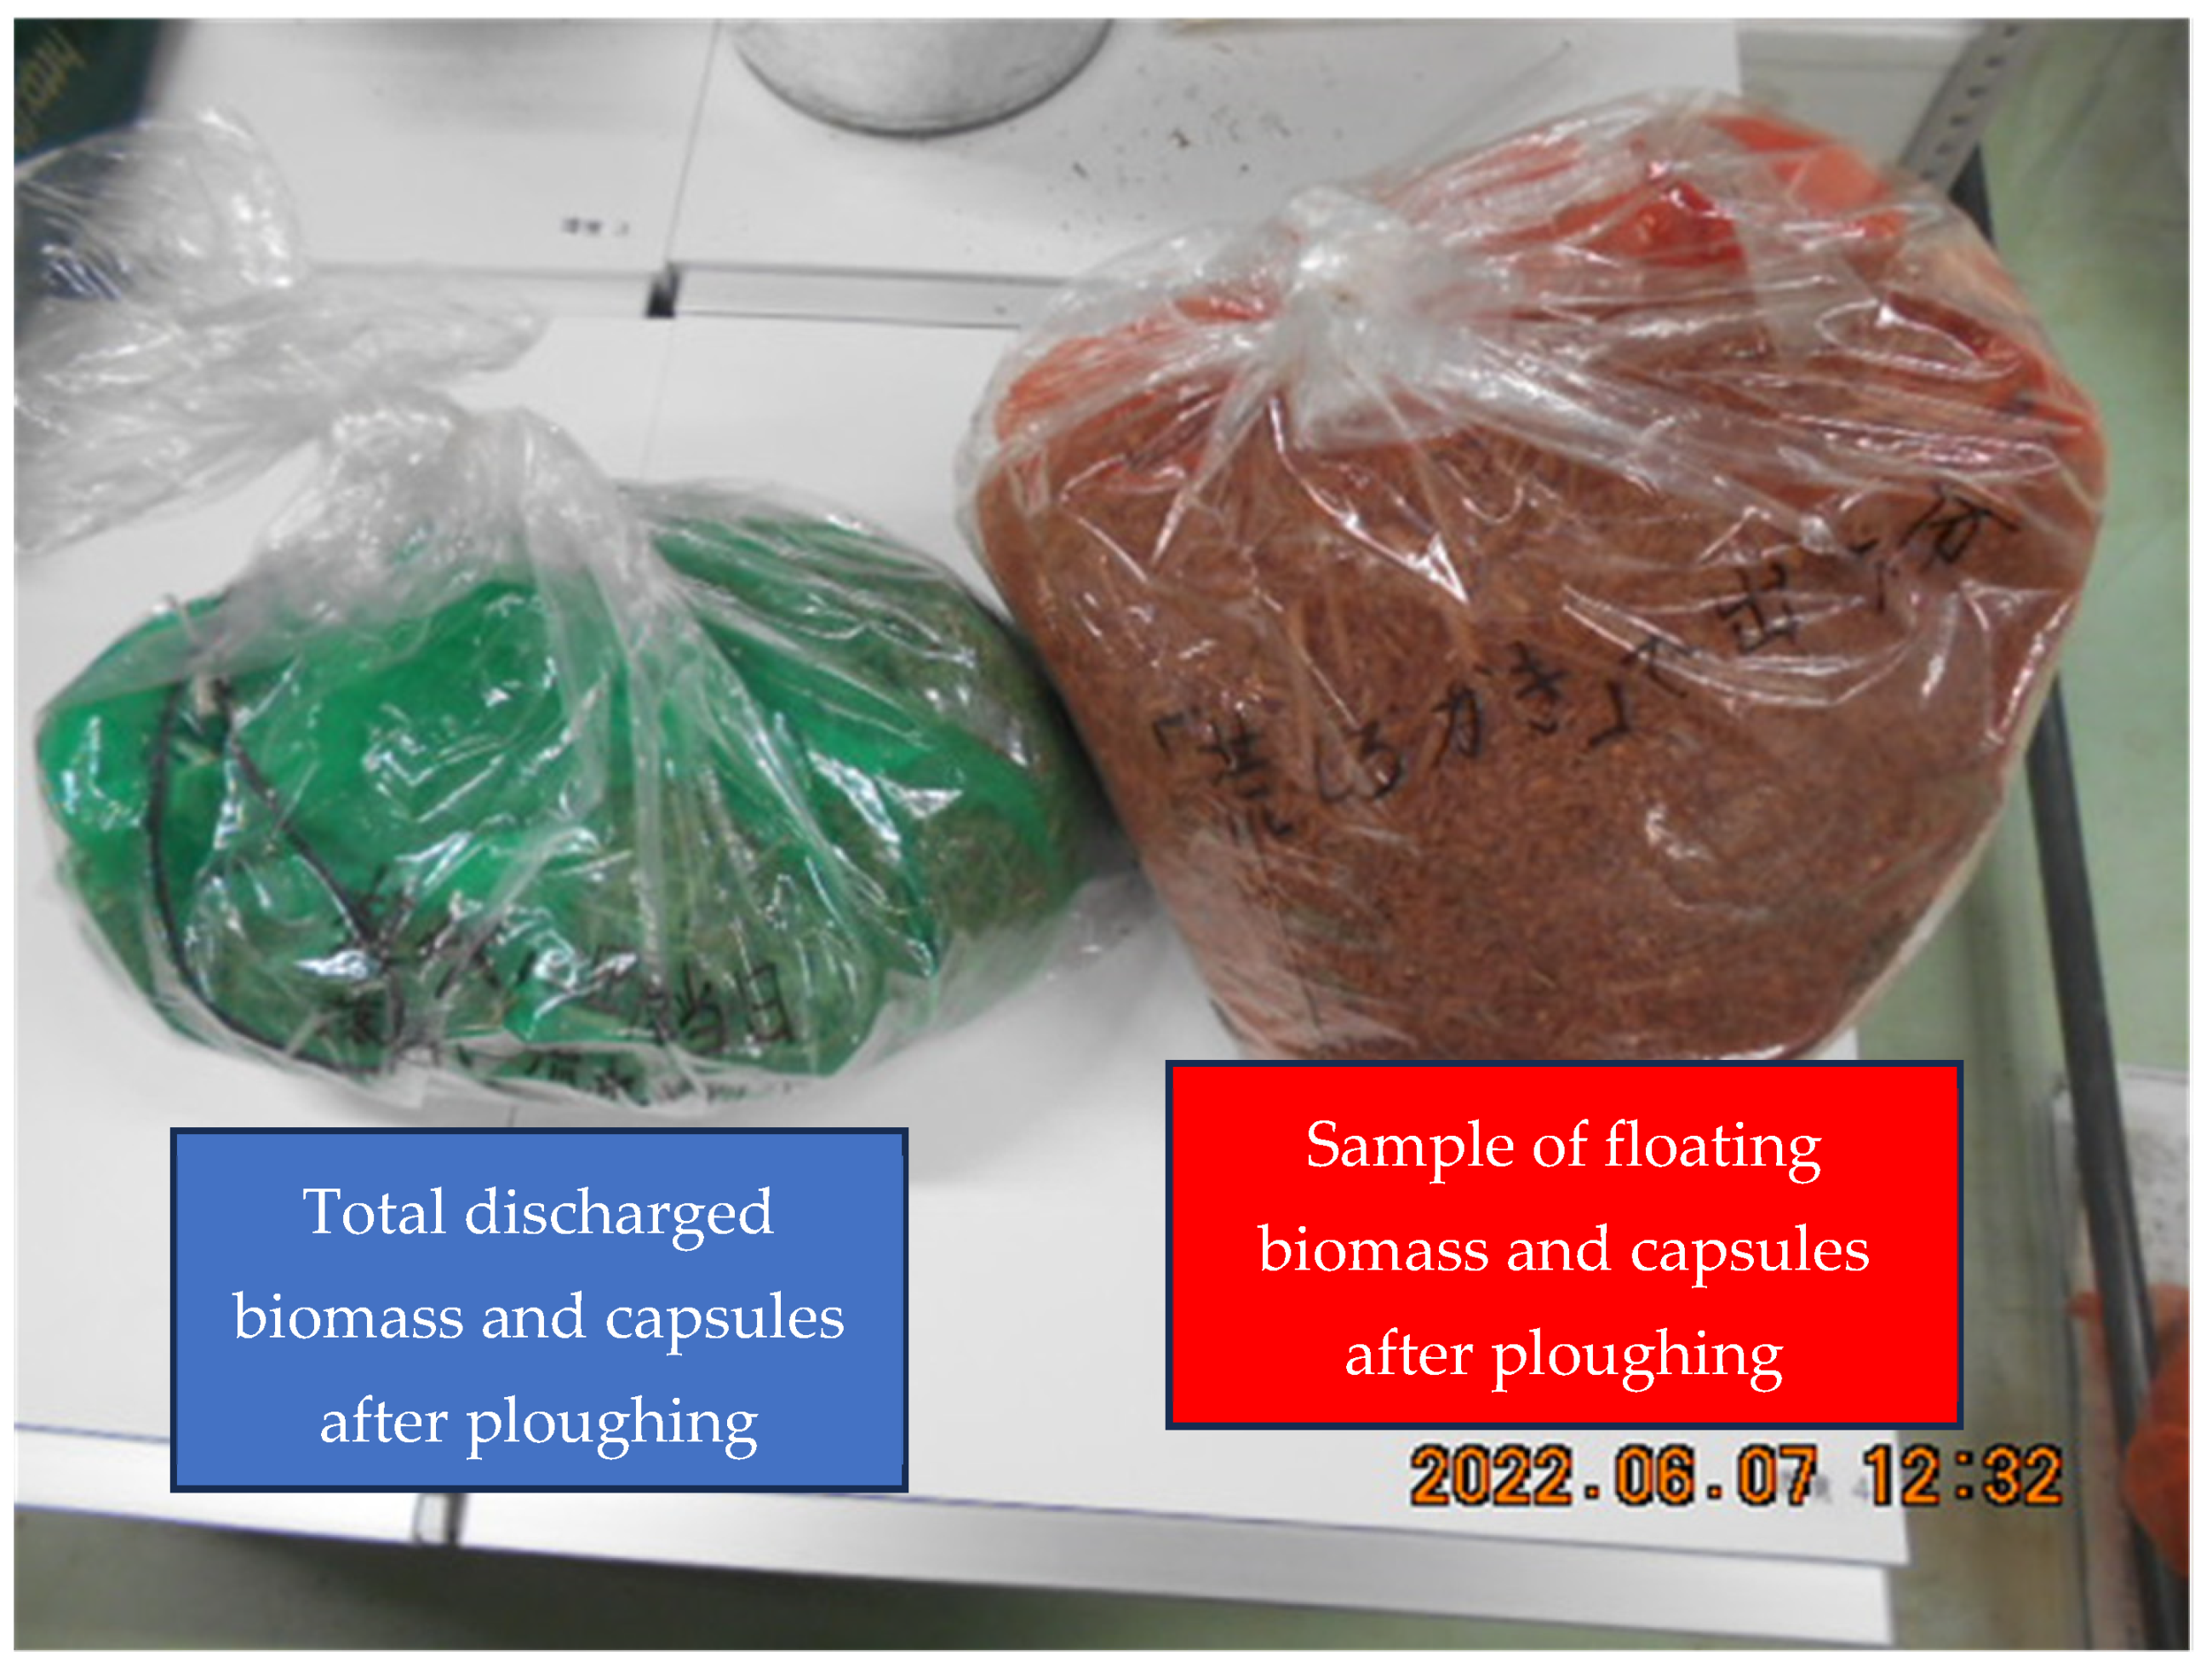
Subsequent full-scale monitoring is expected to elucidate the variations in parameters and the causal relationships underlying these variations. For instance, one observation in Field B in 2022 after ploughing involved collecting all of the discharged biomass with capsules at the end of the discharge pipe, as shown in Figure 4. It was observed that the quantity of discharged capsules and biomass was significantly smaller than that which floated after ploughing (Figure 19). This reduction was due to the farmer’s efforts to mitigate the environmental impact of paddy discharge. Contrasting results were observed in other fields, where the volume of discharged biomass and capsules was affected by the water level at the discharge pipe, which varied due to farmers’ operations. Attention must be paid to the differences in water levels across paddy fields, as well as to discharge velocities. The parameter “the ratio of discharged capsule weight to that of floating capsules” is quite effective for analyzing capsule behavior and for developing capsule runoff reduction methodologies in close collaboration between farmers and researchers.

Figure 19.
Comparison of all discharged biomass and capsules with a portion of floating biomass and capsules after ploughing Field B (see Table 1), during reduced discharge volume.
Another important aspect of understanding capsule behavior involves assessing the differences in degradation and urea release rates among the three capsule types, i.e., shrunken, broken, and spherical. Marked differences among these types suggest potential differences in urea release rates. Ongoing SEM analyses are anticipated to better clarify the differences among the three types of capsules.
Moreover, the chemical analyses, especially the δ15N analyses coupled with CN composition assessments, are expected to provide a more precise understanding of the degradation and urea release behaviors of various capsules.
Author Contributions
Conceptualization, S.H. and I.Y.; Methodology, S.H., I.Y., K.F. and Y.N.; Validation, S.H.; Formal analysis, S.H.; Investigation, S.H. and I.Y.; Data curation, S.H., I.Y., K.F. and Y.N.; Writing—original draft, S.H.; Writing—review & editing, S.H.; Visualization, S.H.; Supervision, S.H.; Project administration, S.H.; Funding acquisition, S.H. All authors have read and agreed to the published version of the manuscript.
Funding
This study was supported by Fukushima University Research Funds (262Q006, 23RG001) and Takahashi Industrial and Economic Research Foundation (14-003-383).
Data Availability Statement
Data is contained within the article.
Acknowledgments
At the time of this study, Itsuki Yajima was an undergraduate student at the Faculty of Food and Agricultural Sciences, Fukushima University.
Conflicts of Interest
The authors declare no conflict of interest.
References
- Ministry of Agriculture, Japan. Available online: https://www.maff.go.jp/j/seisan/sien/sizai/s_hiryo/attach/pdf/jigyo-2.pdf (accessed on 15 May 2024).
- Katsumi, N.; Kusube, T.; Nagao, S.; Okochi, H. The role of coated fertilizer used in paddy fields as a source of microplastics in the marine environment. Mar. Pollut. Bull. 2021, 161, 111727. [Google Scholar] [CrossRef] [PubMed]
- Katsumi, N.; Kusube, T.; Nagao, S.; Okochi, H. Accumulation of microcapsules derived from coated fertilizer in paddy fields. Chemosphere 2021, 267, 129185. [Google Scholar] [CrossRef] [PubMed]
- Katsumi, N.; Kusube, T.; Nagao, S.; Okochi, H. The input-output balance of microplastics derived from coated fertilizer in paddy fields and the timing of their discharge during the irrigation season. Chemosphere 2021, 279, 130574. [Google Scholar] [CrossRef] [PubMed]
- Harada, S.; Ishii, H.; Hayashi, K.; Kubota, Y. Monitoring of pollution runoff while ploughing and irrigating rice fields, specifically plastic capsules of coating fertilizer. In Proceedings of the 25th Symposium of Japan Society on Water Environment, Tokyo, Japan, 6–7 September 2022; Volume 25, pp. 107–108. (In Japanese). [Google Scholar]
- Oikawa, H.; Harada, S. Analyses on the behavior of plastic capsule of coated fertilizer during ploughing and irrigating the rice fields, and indoor experiments for designing the runoff reduction systems. Appl. Hydrol. (Symp. Proc.) 2023, 35, 65–74. (In Japanese) [Google Scholar]
- Harada, S. A priority research project of Fukushima University adopted in the fiscal year 2022: Implementation of the on-site infiltration and retention techniques for non-point contamination reduction due to farming and daily humane activities. J. Community Future Des. Cent. Fukushima Univ. 2023, 34, 1–4. (In Japanese) [Google Scholar]
- Harada, S. Questionnaires for Fukushima university students and subjects belonging to other societies outside the university aiming to clarify the conditions and opportunities to visit Iitate-mura village. J. Reconstr. Agric. Sci. 2023, 3, 10–23. (In Japanese) [Google Scholar]
- Harada, S. Index list for the youth to realize farm village residence; factor analyses; subjective importance of each index; questionnaire. J. Jpn. Soc. Civ. Eng. Ser. G. (Environ. Res.) (Symp. Proc.) 2023, 51, 39–44. (In Japanese) [Google Scholar]
- The Mainichi. Available online: https://mainichi.jp/articles/20220621/ddm/013/040/008000c (accessed on 15 May 2024).
- Jambeck, J.R.; Geyer, R.; Wilcox, C.; Siegler, T.R.; Perryman, M.; Andrady, A.; Narayan, R.; Law, K.L. Plastic waste inputs from land into the ocean. Science 2015, 347, 768–771. [Google Scholar] [CrossRef] [PubMed]
- Hurley, R.; Horton, A.; Lusher, A.; Nizzetto, L. Chapter 7—Plastic waste in the terrestrial environment. In Plastic Waste and Recycling Environmental Impact, Societal Issues, Prevention, and Solutions; Academic Press: New York, NY, USA, 2020; pp. 163–193. [Google Scholar] [CrossRef]
- Kosior, E.; Crescenzi, I. Chapter 16—Solutions to the plastic waste problem on land and in the oceans. In Plastic Waste and Recycling Environmental Impact, Societal Issues, Prevention and Solutions; Academic Press: New York, NY, USA, 2020; pp. 415–446. [Google Scholar] [CrossRef]
- Laurent, C.M.; Lebreton, J.Z.; Damsteeg, J.-W.; Boyan, S.; Andrady, A.; Reisser, J. River plastic emissions to the world’s oceans. Nat. Commun. 2017, 8, 15611. [Google Scholar] [CrossRef]
- Takada, H. Reduction of single-use plastics is first priority considering hazardous chemicals in plastics and view pf global material cycles. Environ. Inf. Sci. 2019, 48, 12–16. (In Japanese) [Google Scholar]
- Hahladakis, J.N.; Velis, C.A.; Weber, R.; Iacovidou, E.; Purnell, P. An overview of chemical additives present in plastics: Migration, release, fate and environmental impact during their use, disposal and recycling. J. Hazard. Mater. 2018, 344, 179–199. [Google Scholar] [CrossRef] [PubMed]
- Hermabessiere, L.; Dehaut, A.; Paul-Pont, I.; Lacroix, C.; Jezequel, R.; Soudant, P.; Duflos, P. Occurrence and effects of plastic additives on marine environments and organisms: A review. Chemosphere 2017, 182, 781–793. [Google Scholar] [CrossRef] [PubMed]
- National Institute for Environmental Studies, Japan. Available online: https://www-cycle.nies.go.jp/magazine/kenkyu/201902.html (accessed on 15 May 2024).
- Ohtsuka, Y.; Takada, H.; Nihei, Y.; Kameda, Y.; Nishikawa, K. Current status and issues of microplastic pollution research. J. Jpn. Soc. Water Environ. 2021, 44, 35–42. (In Japanese) [Google Scholar] [CrossRef]
- Xu, K.; Chen, X.; Wang, J.; Liu, X. Current status and issues of microplastic pollution in China. Irrig. Wastewater 2020, 62, 55–68. (In Japanese) [Google Scholar]
- Harada, S.; Kim, J. Application of infiltration technic for residential zone in agricultural area. Water Land Environ. Eng. 2014, 82, 301–304. (In Japanese) [Google Scholar]
- Harada, S.; Komuro, Y. Decrease of heavy metal non-point runoff using porous concrete. Trans. JSIDRE 2009, 264, 81–82. (In Japanese) [Google Scholar]
- Harada, S.; Komuro, Y. Decrease of non-point zinc runoff using porous concrete. Chemosphere 2010, 78, 488–491. [Google Scholar] [CrossRef]
- Harada, S.; Yanbe, M. Adsorption by and artificial release of zinc and lead from porous concrete for recycling of adsorbed zinc and lead and of porous concrete to reduce non-point heavy metal runoff. Chemosphere 2018, 197, 451–456. [Google Scholar] [CrossRef] [PubMed]
- Harada, S. Application of porous concrete infiltration techniques to street stormwater inlets that simultaneously mitigate against non-point heavy metal pollution and stormwater runoff reduction in urban areas: Catchment-scale evaluation of the potential of discrete and small-scale techniques. Water 2023, 15, 1998. [Google Scholar] [CrossRef]
- Koshikawa, H.; Harada, S.; Watanabe, M.; Sato, K.; Aketaha, K. Relative contribution of bacterial and photosynthetic production to metazooplankton as carbon sources. J. Plankton Res. 1996, 18, 2269–2281. [Google Scholar] [CrossRef]
- Koshikawa, H.; Harada, S.; Watanabe, M.; Kogure, K.; Ioriya, T.; Kohata, K.; Kimura, T.; Sato, K.; Akehata, T. Influence of plankton community structure on the contribution of bacterial production to metazooplankton in a coastal mesocosm. Mar. Ecol. Prog. Ser. 1999, 186, 31–42. [Google Scholar] [CrossRef]
- Koshikawa, H.; Harada, S.; Watanabe, M. Carbon transfer from dissolved organic matter to higher order organisms via microbial loop. Bull. Plankton Soc. Jpn. 1999, 46, 78–87. (In Japanese) [Google Scholar]
- Harada, S.; Koshikawa, H.; Watanabe, M.; Ioriya, T. Implications for top-down control of phytoplankton species succession within a large coastal mesocosm. J. Glob. Environ. Eng. 2006, 11, 17–27. [Google Scholar]
- Tayasu, I.; Hirasawa, R.; Ogawa, N.O.; Ohkochi, N.; Yamada, K. New organic reference materials for carbon- and nitrogen-stable isotope ratio measurements provided by Center for Ecological Research, Kyoto University, and Institute of Biogeosciences, Japan Agency for Marine-Earth Science and Technology. Limnology 2011, 12, 261–266. [Google Scholar] [CrossRef]


Disclaimer/Publisher’s Note: The statements, opinions and data contained in all publications are solely those of the individual author(s) and contributor(s) and not of MDPI and/or the editor(s). MDPI and/or the editor(s) disclaim responsibility for any injury to people or property resulting from any ideas, methods, instructions or products referred to in the content. |
© 2024 by the authors. Licensee MDPI, Basel, Switzerland. This article is an open access article distributed under the terms and conditions of the Creative Commons Attribution (CC BY) license (https://creativecommons.org/licenses/by/4.0/).