
Spatio-Temporal Variation in Suspended Sediment during Typhoon Ampil under Wave–Current Interactions in the Yangtze River Estuary


Abstract
1. Introduction
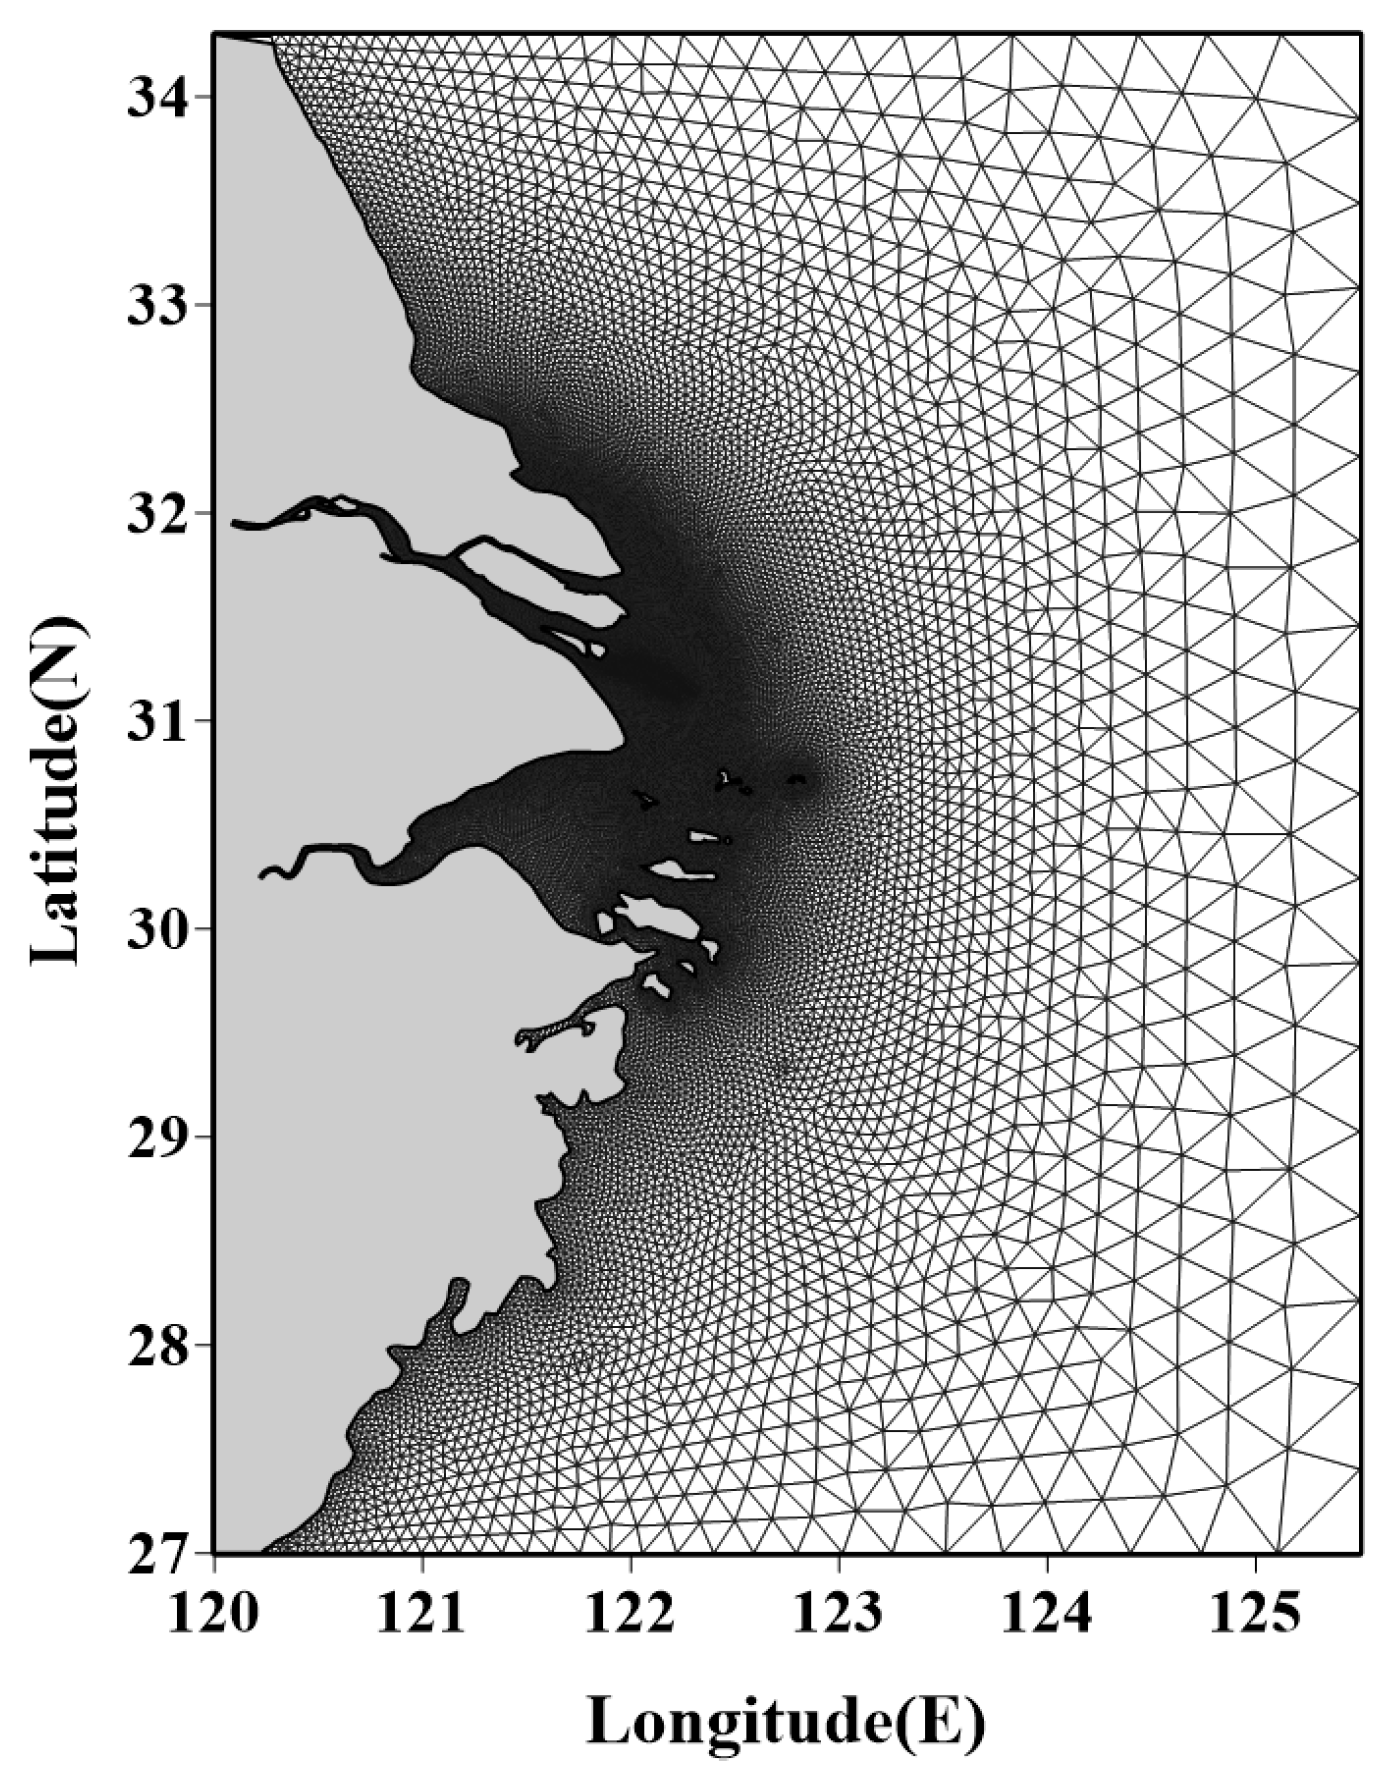
2. Numerical Model
2.1. Hydrodynamic Model
2.2. Sediment Transport Module
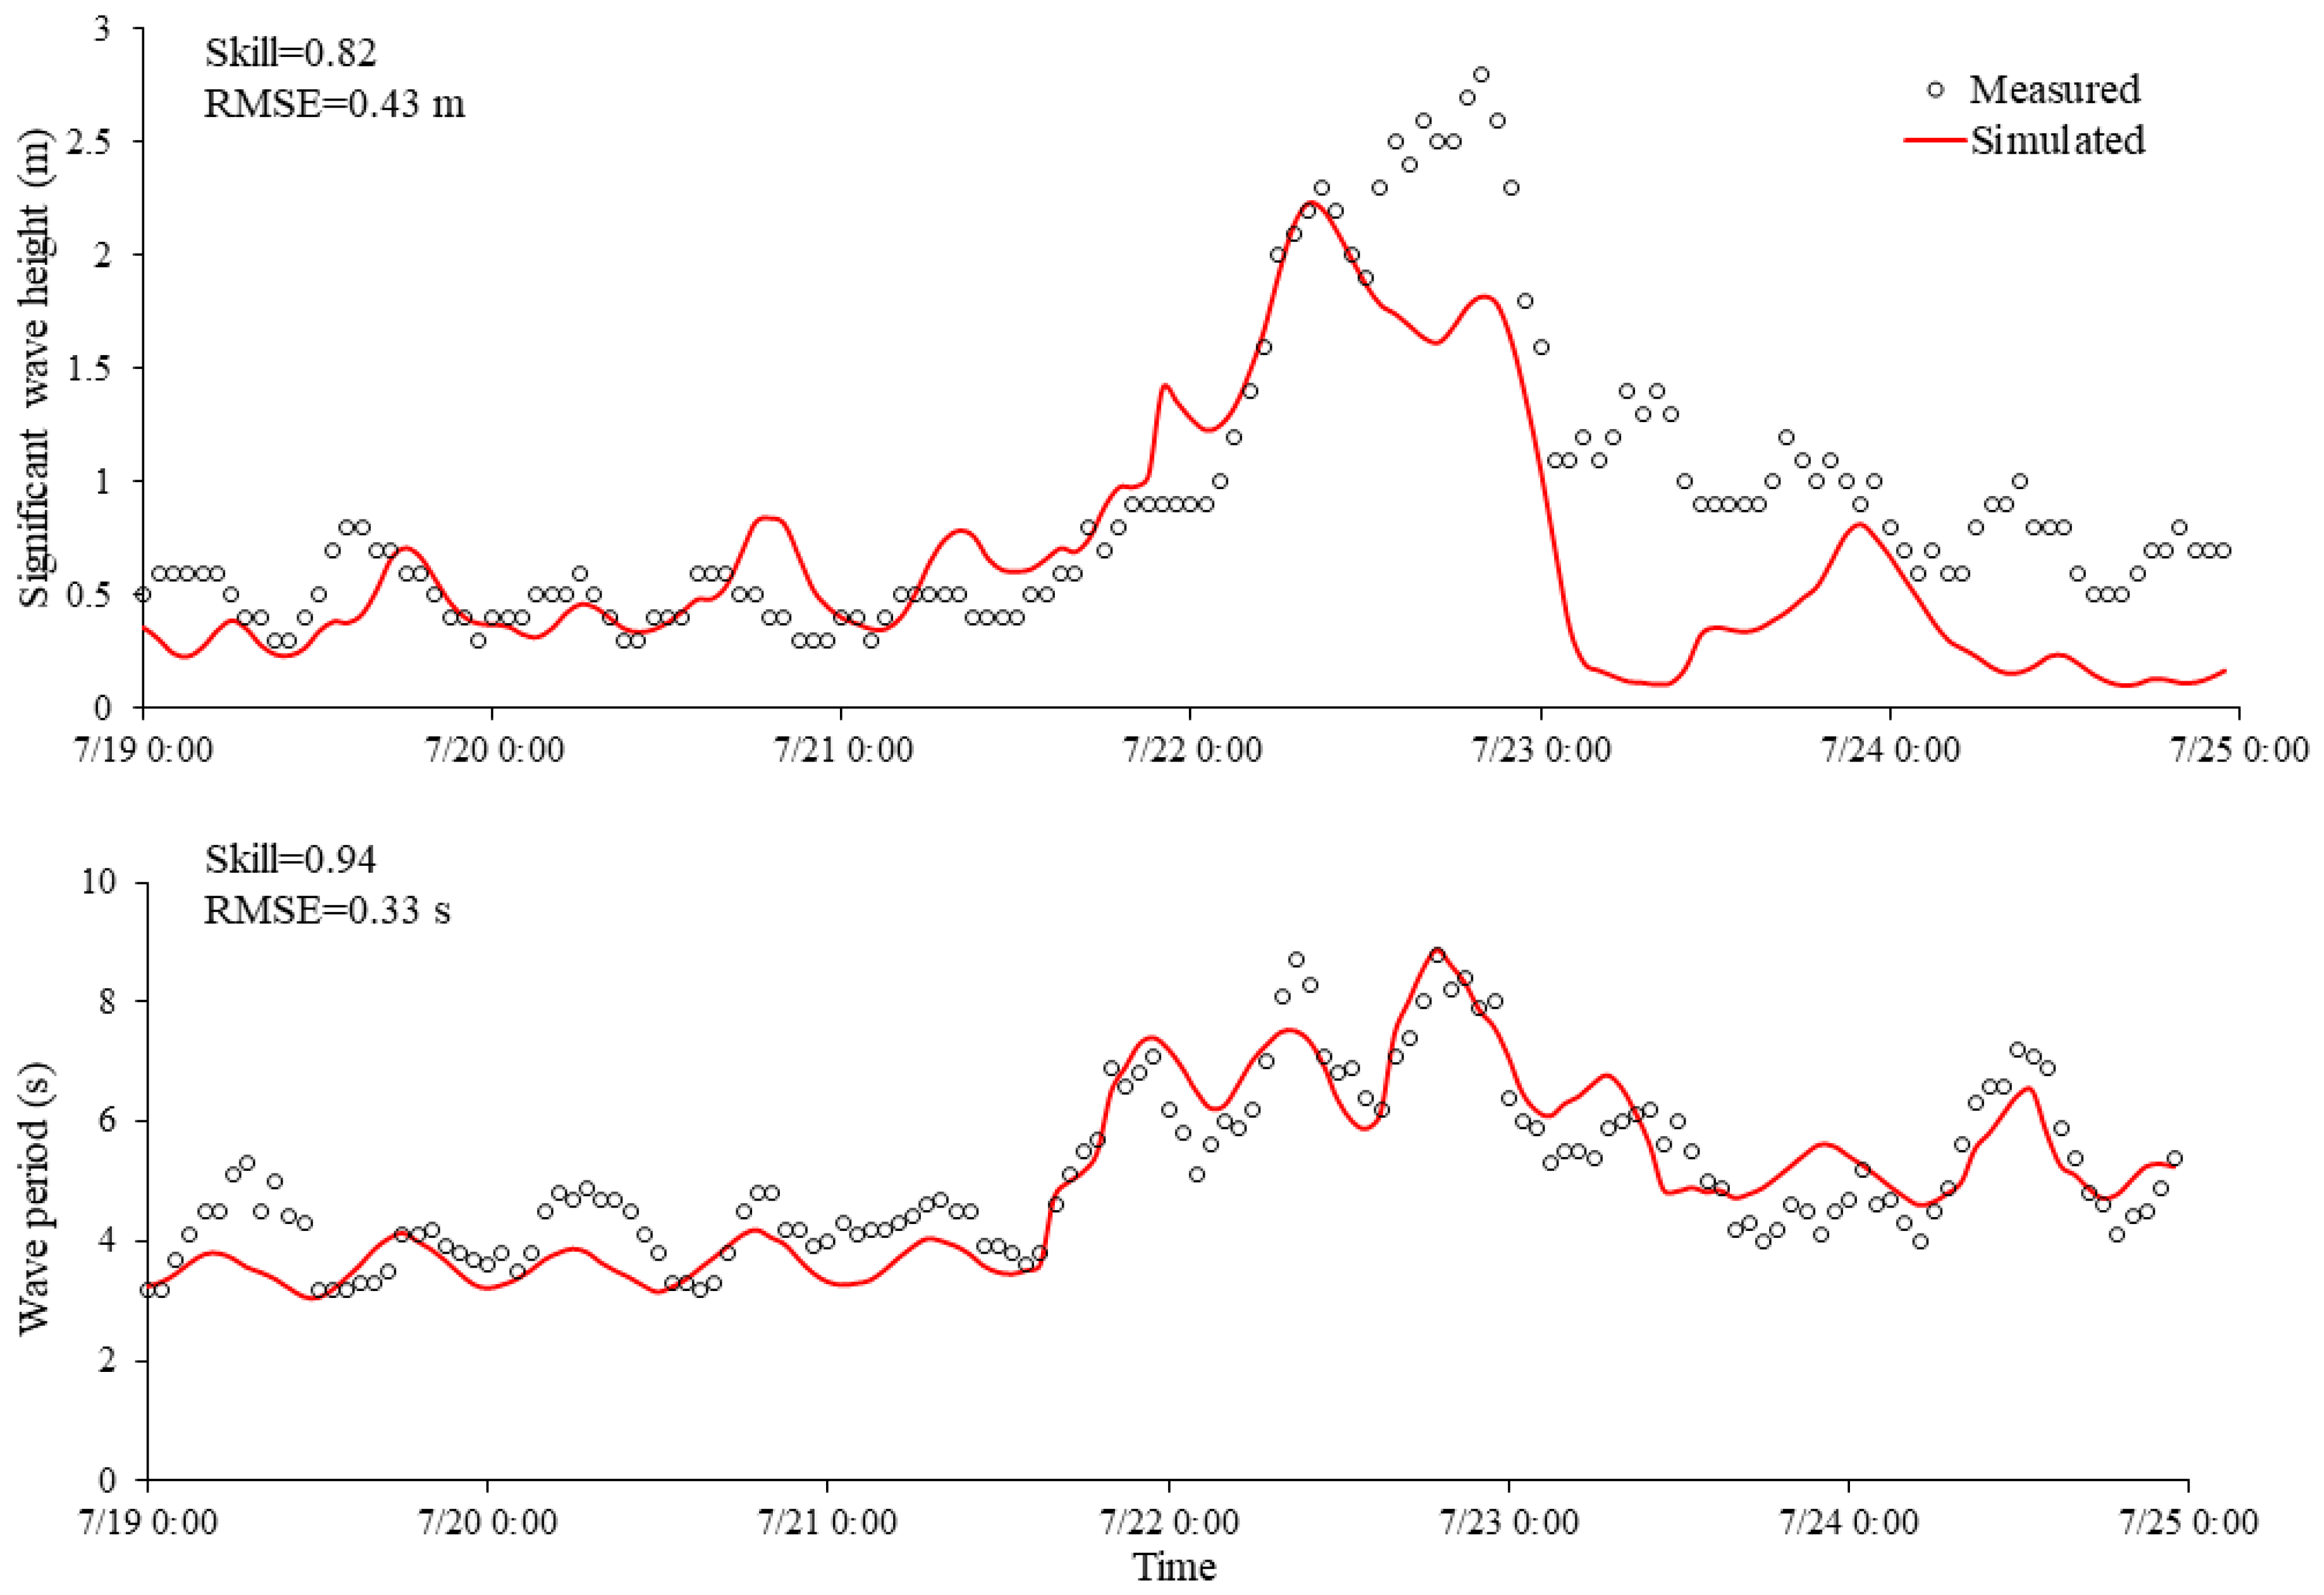
2.3. Wave Module
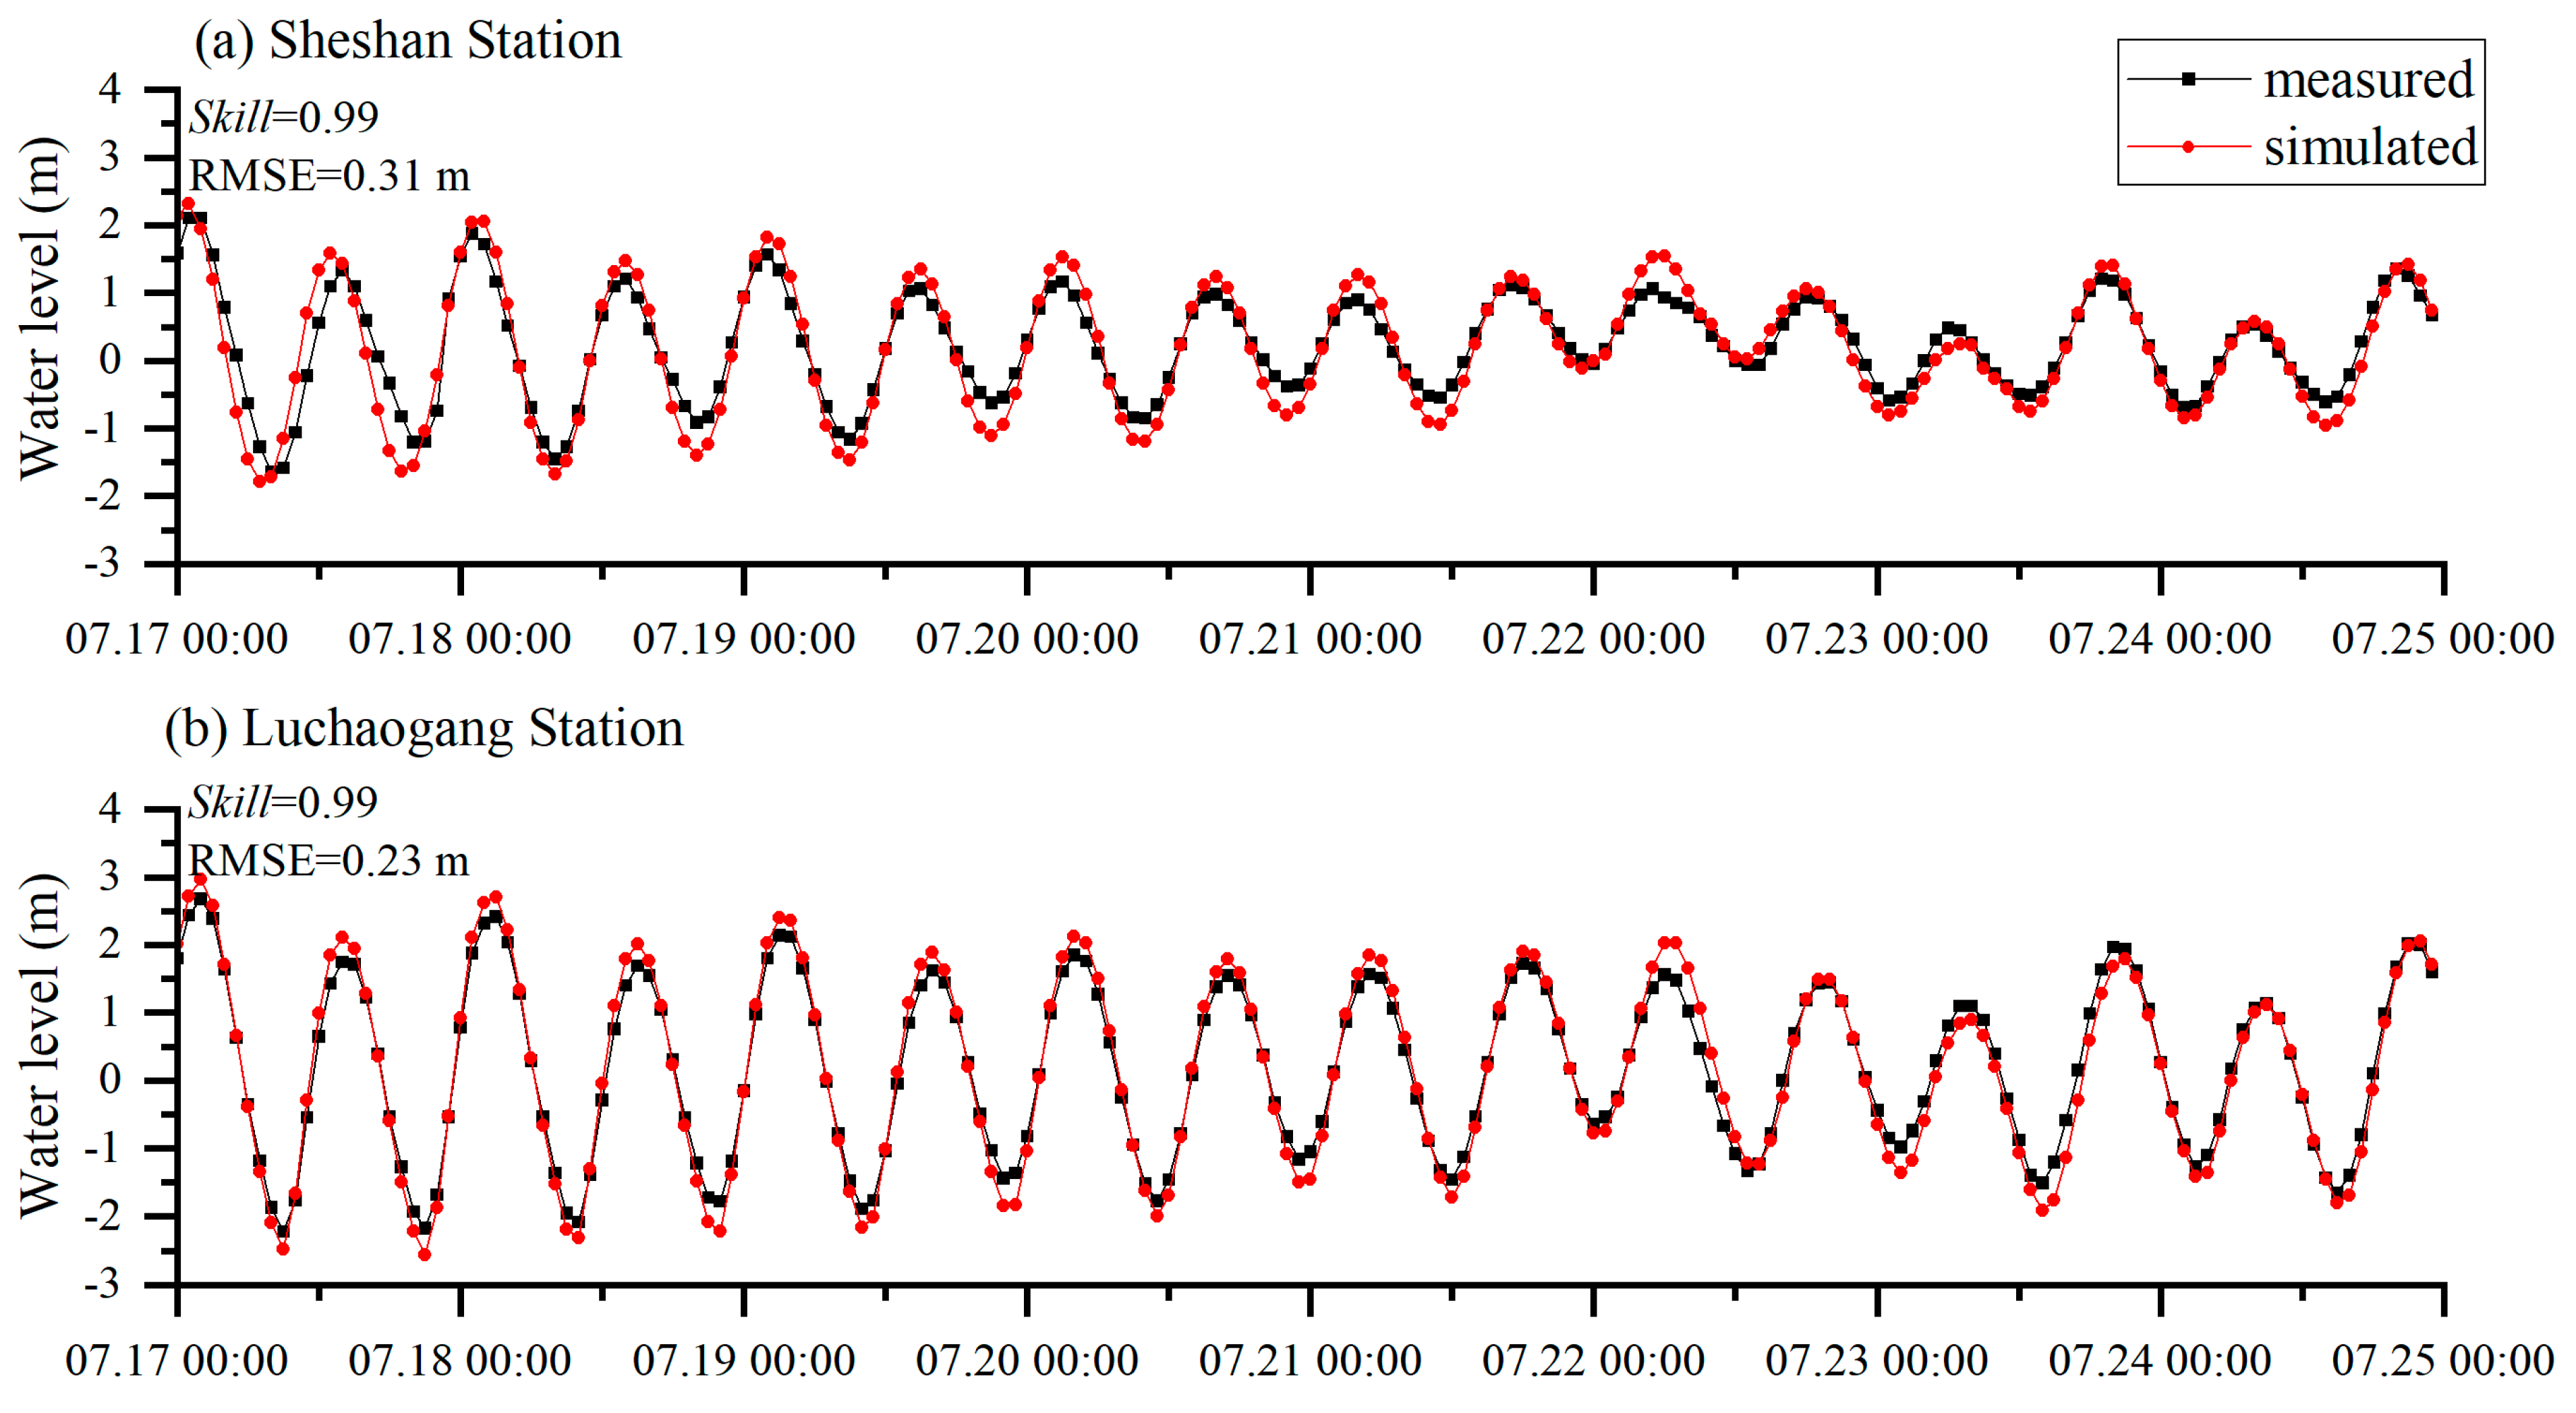
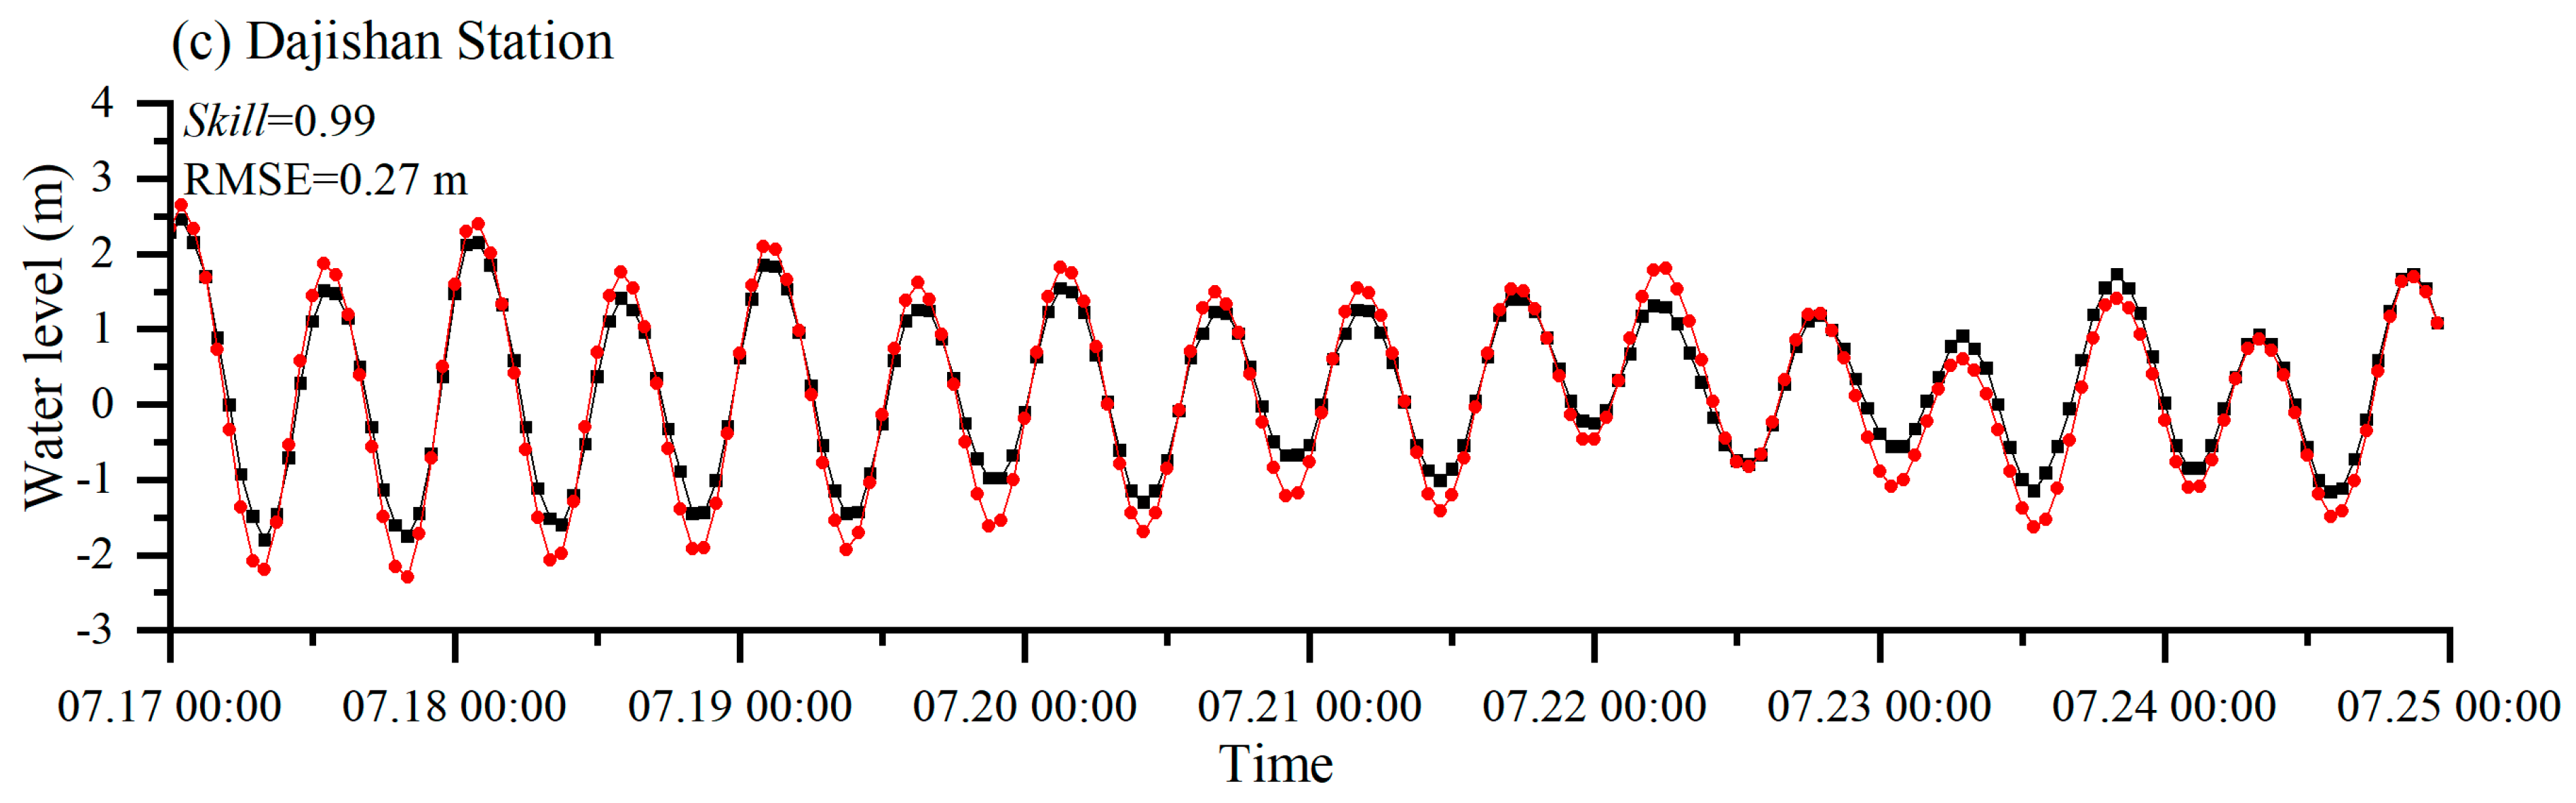
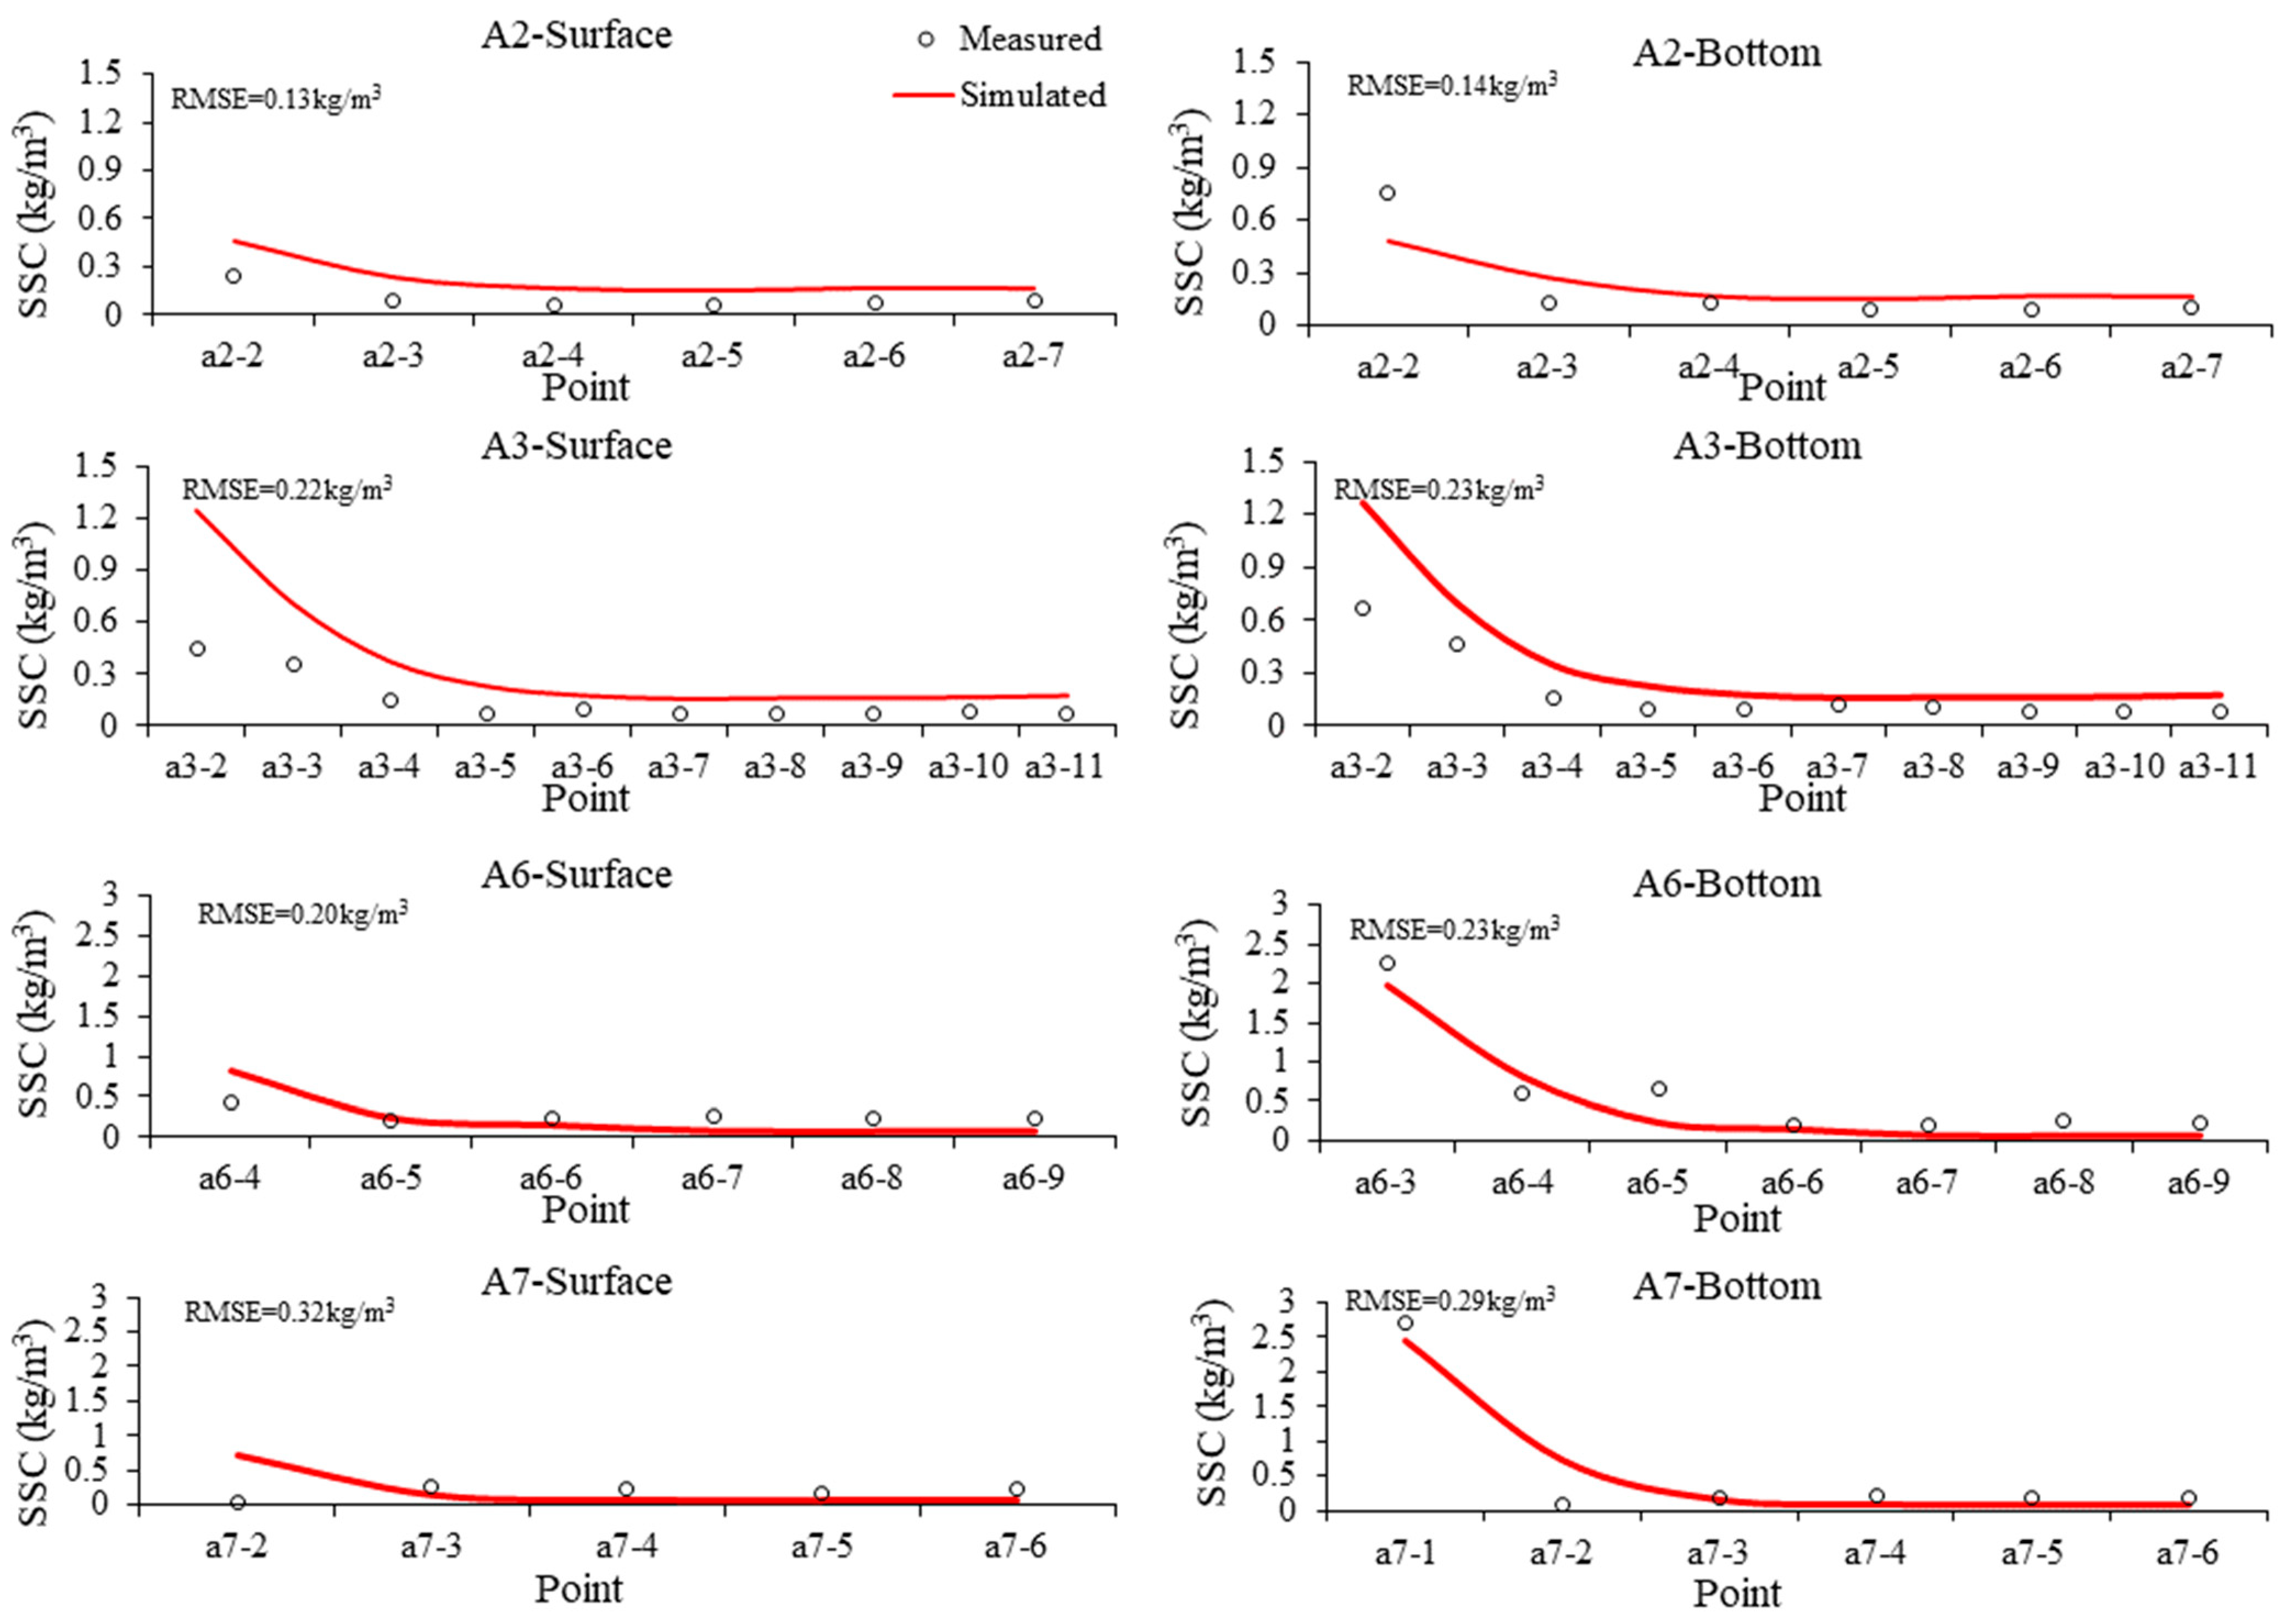
2.4. Model Validation
3. Results
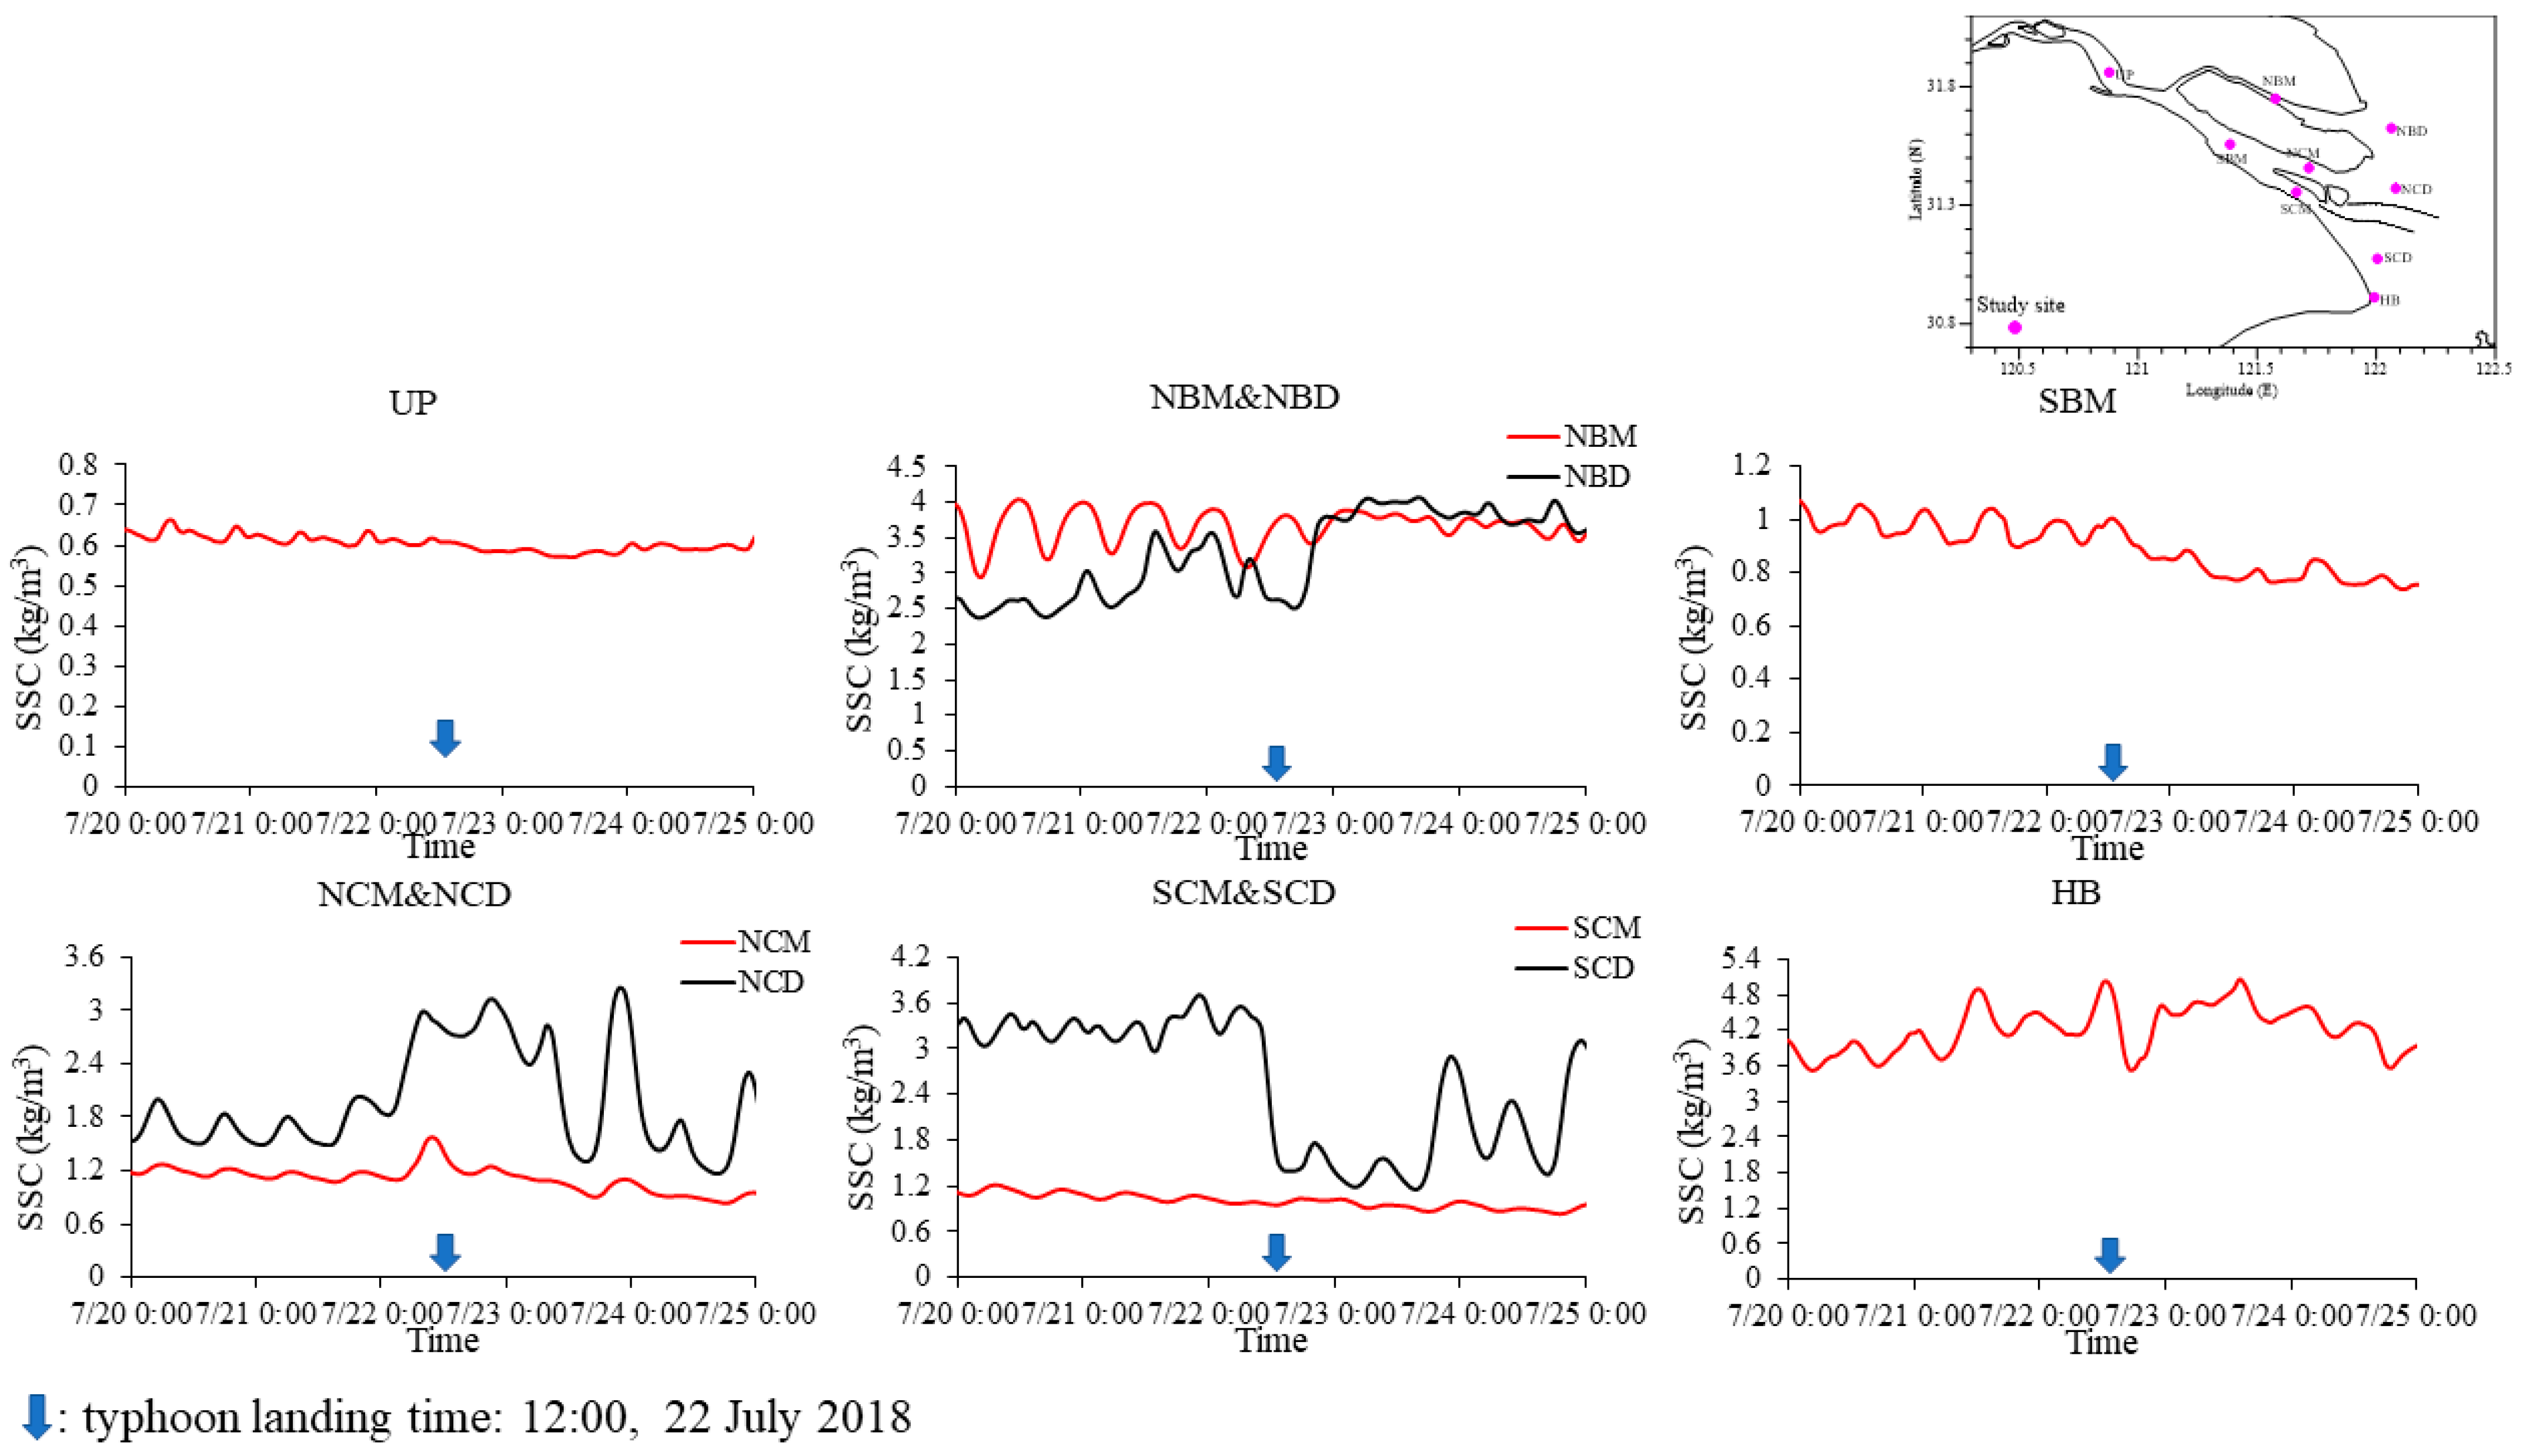
3.1. Changes in SSC in the Main Study Area
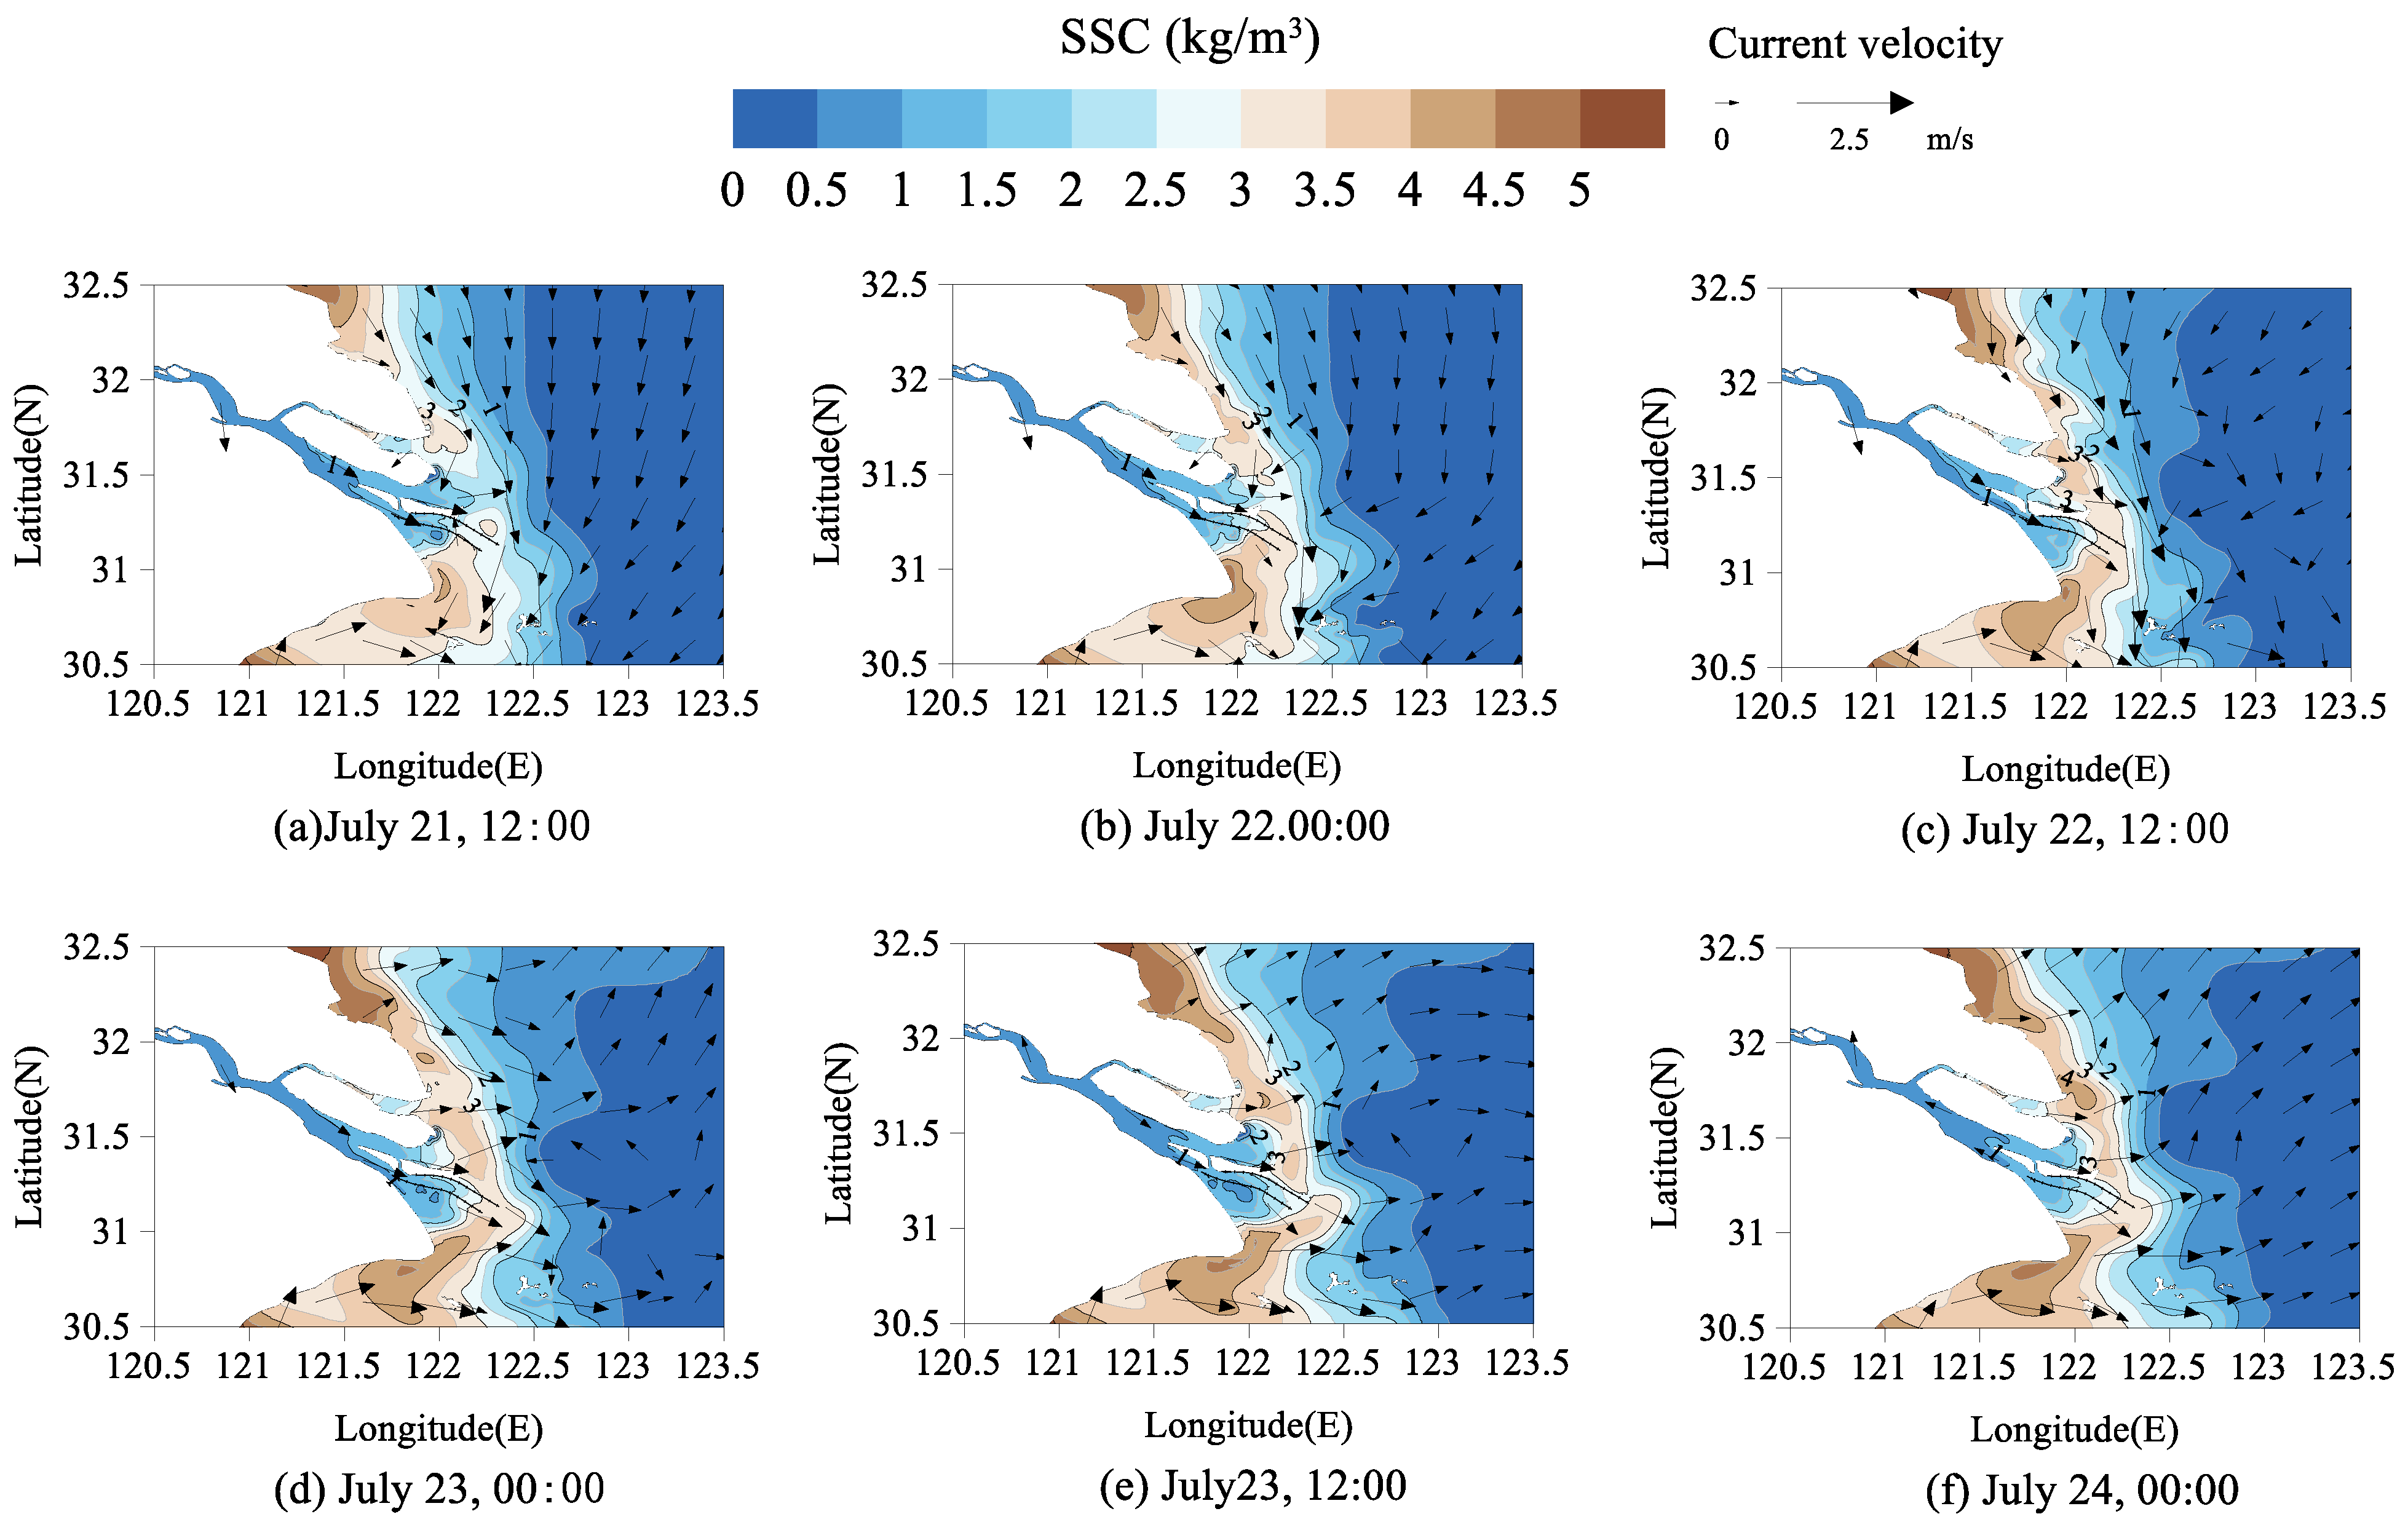
3.2. The Characteristics of SSC Horizontal Distribution
3.3. Vertical Distribution of SSC
4. Discussion
4.1. Wave Impacts on SSC Distribution
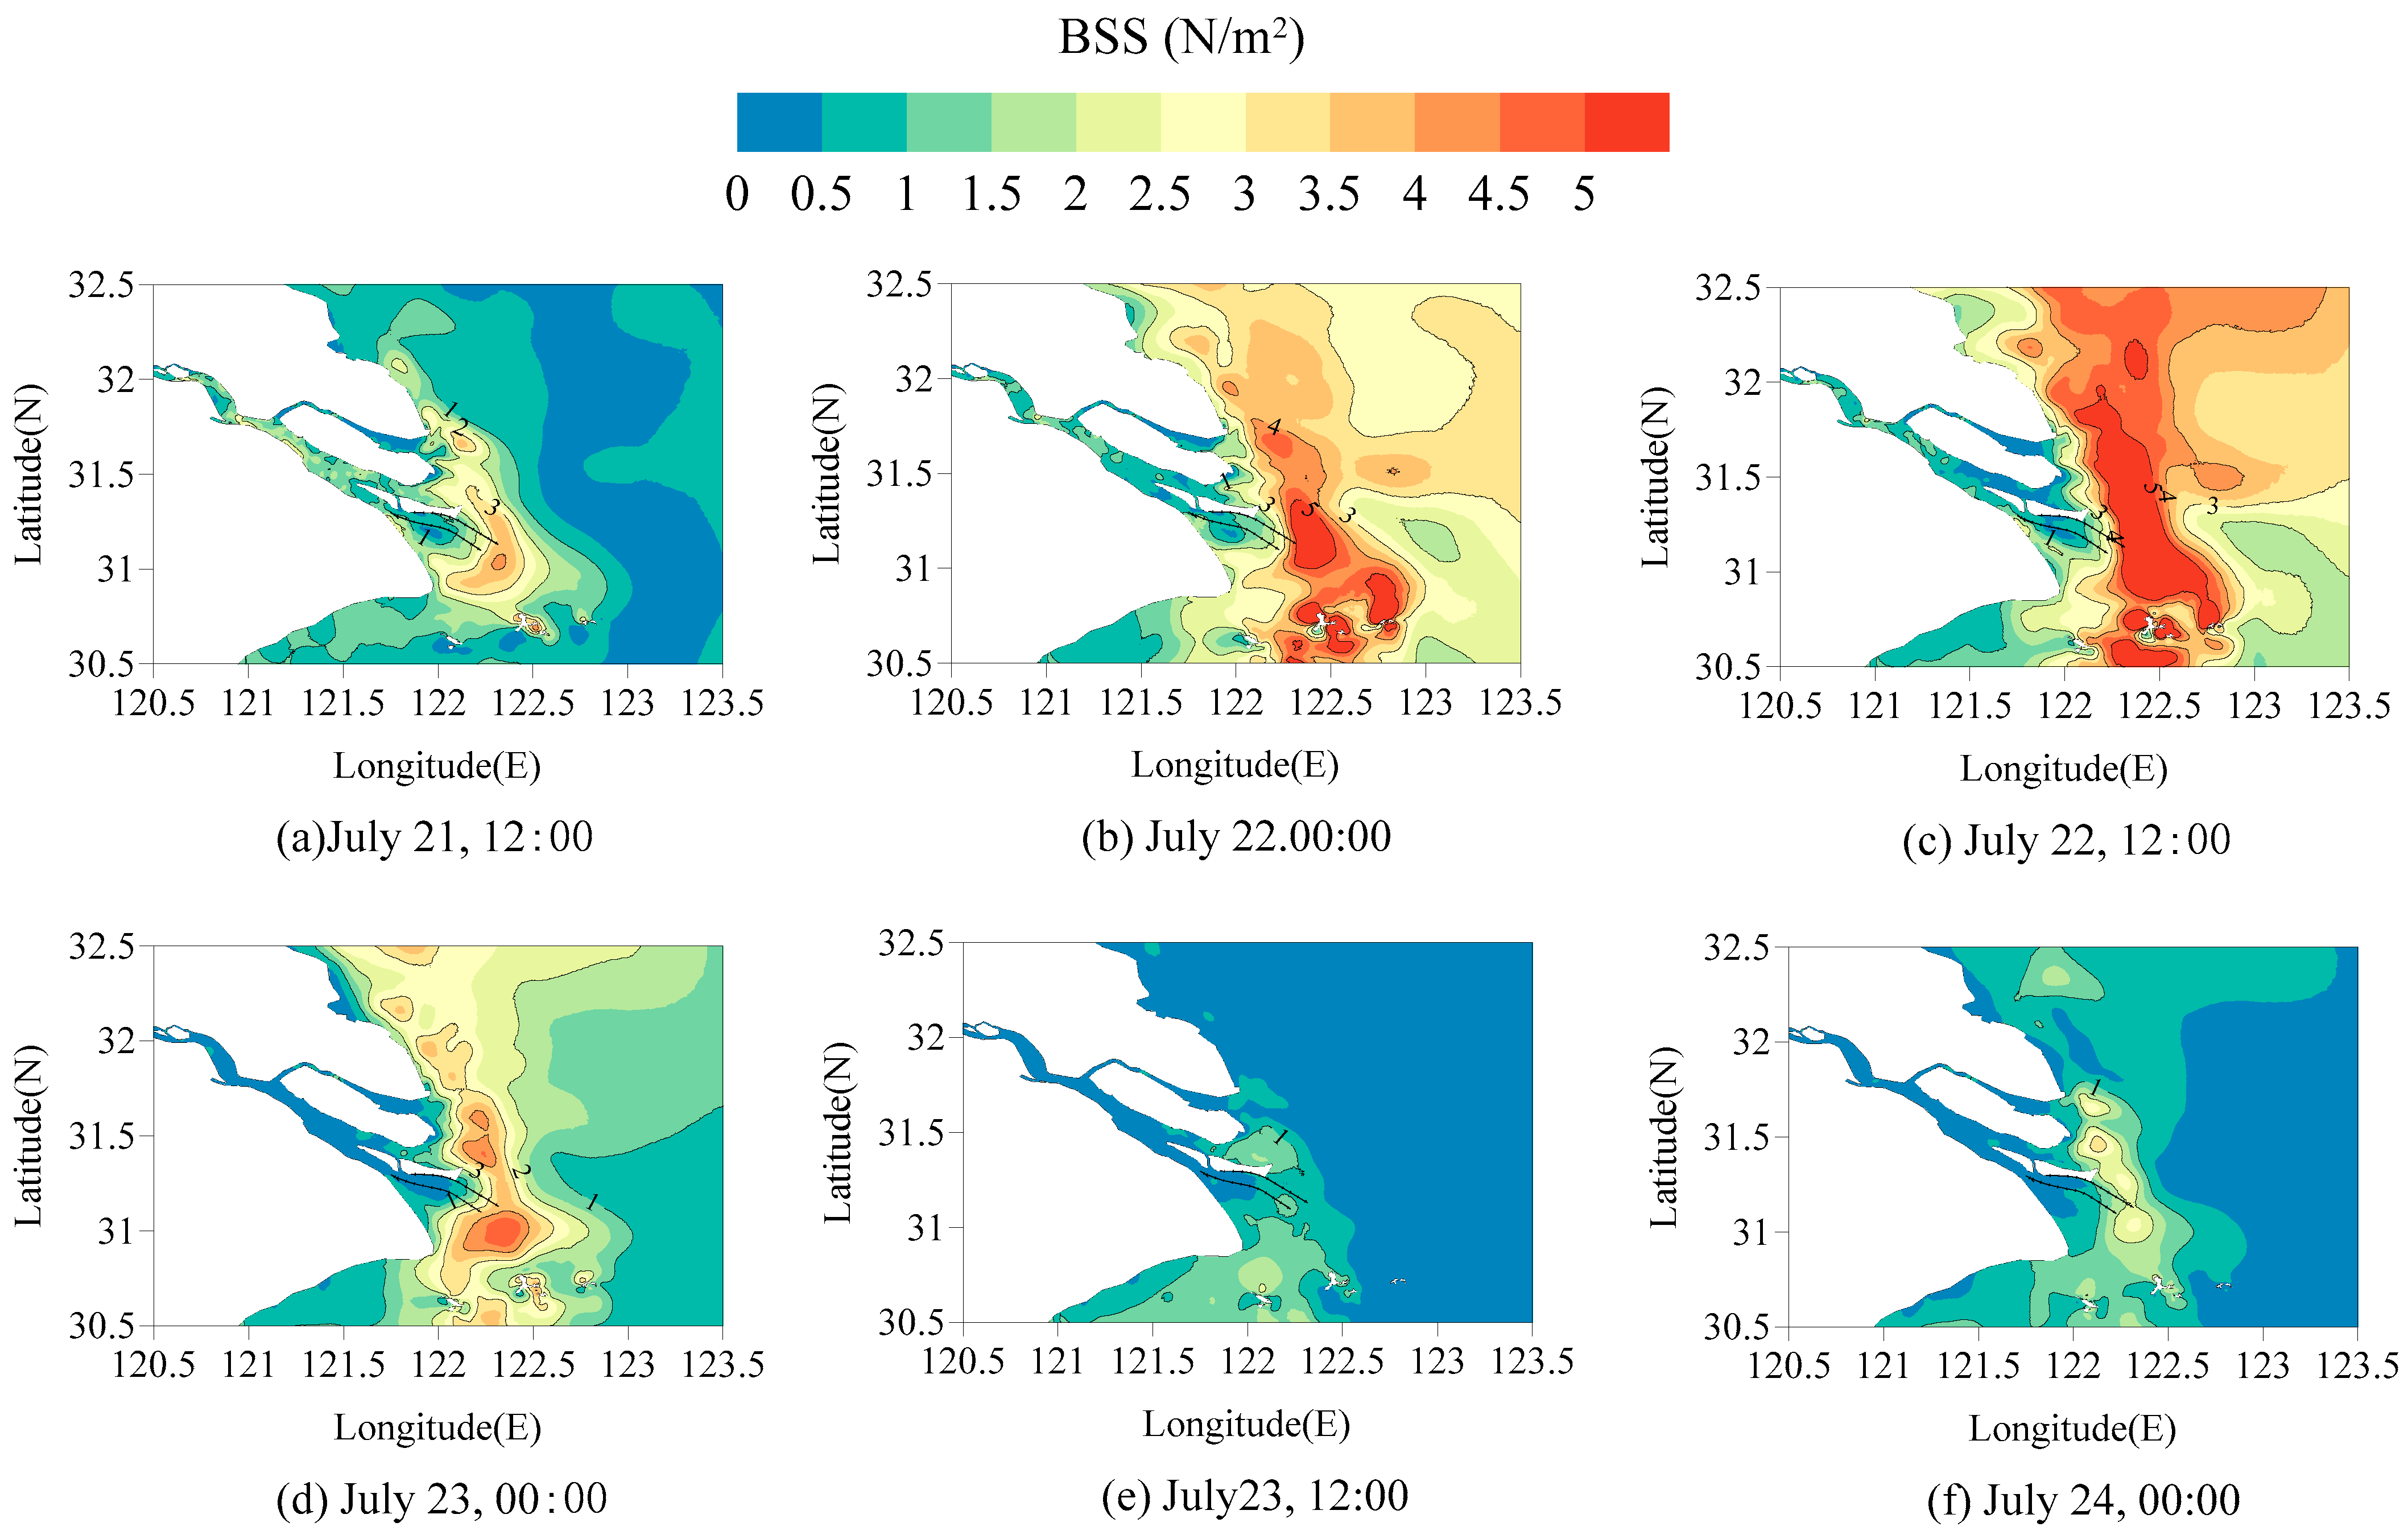
4.2. Storm Wave-Induced SSC Variation
5. Conclusions
Author Contributions
Funding
Data Availability Statement
Acknowledgments
Conflicts of Interest
References
- Van der Wal, D.; Pye, K.; Neal, A. Long-term morphological change in the Ribble estuary, Northwest England. Mar. Geol. 2002, 189, 249–266. [Google Scholar] [CrossRef]
- Xie, D.; Zou, Q.-P.; Mignone, A.; MacRae, J.D. Coastal flooding from wave overtopping and sea level rise adaptation in the northeastern USA. Coast. Eng. 2019, 150, 39–58. [Google Scholar] [CrossRef]
- Aalst, M.V. The impacts of climate change on the risk of natural disasters. Disasters 2006, 30, 5–18. [Google Scholar] [CrossRef] [PubMed]
- Gao, Y.; Li, B.; Feng, Z.; Zuo, X. Global climate change and geological disaster response analysis. J. Geomech. 2017, 23, 65–77. [Google Scholar]
- Oppenheimer, M. A Physical Science Perspective on Disaster: Through the Prism of Global Warming. Soc. Res. Int. Q. 2008, 75, 659–668. [Google Scholar] [CrossRef]
- Jiang, T.; Shi, Y.F. Global climatic warming: The Yangtze floods and potential loss. Adv. Earth Sci. 2003, 18, 277–284. [Google Scholar]
- Chou, J.M.; Dong, W.J.; Xu, H.; Ban, J.H. Assessment on Economic Losses of Tropical Cyclone Disasters Affecting China’s Coastal Areas. Meteoro Log. Environ. Sci. 2022, 45, 1–10. [Google Scholar]
- Sui, G.J.; Tang, D.L. Typhoon Disasters and Regional Economic Divergence: Evidence from Guangdong. Macroeconomy 2012, 220, 18–25. [Google Scholar]
- Ren, Z.; Liu, C.; Ou, Y.; Zhang, P.; Fan, H.; Zhao, X.; Cheng, H.; Teng, L.; Tang, M.; Zhou, F. Deep Learning-Based Simulation of Surface Suspended Sediment Concentration in the Yangtze Estuary during Typhoon In-Fa. Water 2024, 16, 146. [Google Scholar] [CrossRef]
- Yang, J.K. The Impact of Typhoon on Economic Growth in Coastal Areas of China; Jilin University: Jilin, China, 2022. [Google Scholar]
- Liu, J.Q.; Yin, P.; Gao, F.; Chen, B.; Lian, E.G. Water H-O isotopic characteristics of Nandu River and their response to typhoon Kalmaegi. Mar. Geol. Quat. Geol. 2018, 38, 171–177. [Google Scholar]
- Bai, Y.B.; Shi, J.Y.; Lu, C.T.; Zhang, G.J.; Ding, W. Spatio-temporal distribution characteristics of surge in the reach below Nantong of Yangtze Estuary under the influence of Typhoon In-Fa. Hydro-Sci. Eng. 2021, 6, 25–33. [Google Scholar]
- Ren, J.B.; He, Q.; Shen, J.; Xu, F.; Guo, L.C.; Xie, W.M.; Zhu, L. The effect mechanism of a remote typhoon “Sanba” on wave dynamics in the Changjiang Estuary. Mar. Sci. 2020, 44, 12–23. [Google Scholar]
- Sun, D.Y.; Tong, C.; Chen, K.L.; Lin, X.; Huang, J.F. Effects of typhoon Dujuan on contents of Nutrrient in Soil Pore water of marshes and tidal water in Min River Estuary. Wetl. Sci. 2017, 16, 809–817. [Google Scholar]
- Feng, S.Z. The advance of Researches on storm surge. World Sci-Tech R&D 1998, 20, 44–47. [Google Scholar]
- Yang, S.-L.; Eisma, D.; Ding, P.-X. Sedimentary processes on an estuarine marsh island within the turbidity maximum zone of the Yangtze River mouth. Geo-Mar. Lett. 2000, 20, 87–92. [Google Scholar] [CrossRef]
- Bai, Y.; Wang, Z.; Shen, H. Three-dimensional modelling of sediment transport and the effects of dredging in the Haihe estuary. Estuar. Coast. Shelf Sci. 2003, 56, 175–186. [Google Scholar] [CrossRef]
- Pontee, N.; Whitehead, P.; Hayes, C. The effect of freshwater flow on siltation in the Humber estuary, North East UK. Estuar. Coast. Shelf Sci. 2004, 60, 241–249. [Google Scholar] [CrossRef]
- Perillo, G.M.; Syvitski, J.P. Mechanisms of sediment retention in estuaries. Estuar. Coast. Shelf Sci. 2010, 87, 175–176. [Google Scholar] [CrossRef]
- Luan, H.L.; Ding, P.X.; Wang, Z.B.; Ge, J.Z.; Yang, S.L. Decadal morphological evolution of the Yangtze River estuary in response to river input changes and estuarine engineering projects. Geomorphology 2016, 265, 12–23. [Google Scholar] [CrossRef]
- Wei, W.; Mei, X.; Dai, Z.; Tang, Z. Recent morphodynamic evolution of the largest uninhibited island in the Yangtze (Changjiang) estuary during 1998–2014: Influence of the anthropogenic interference. Cont. Shelf Res. 2016, 124, 83–94. [Google Scholar] [CrossRef]
- Yang, S.; Fan, J.; Shi, B.; Bouma, T.; Xu, K.; Yang, H.; Zhang, S.; Zhu, Q.; Shi, X. Remote impacts of typhoons on the hydrodynamics, sediment transport and bed stability of an intertidal wetland in the Yangtze Delta. J. Hydrol. 2019, 575, 755–766. [Google Scholar] [CrossRef]
- Shen, H.; Zhang, C. Mixing of salt water and fresh water in the Changjiang River estuary and its effects on suspended sediment. Chin. Geogr. Sci. 1992, 2, 373–381. [Google Scholar] [CrossRef]
- Chen, S.; Zhang, G.; Yang, S. Temporal and spatial changes of suspended sediment concentration and resuspension in the Yangtze River estuary. J. Geogr. Sci. 2003, 13, 498–506. [Google Scholar]
- Pang, C.; Zhao, E.; Yang, Y. Numerical simulation on the process of salt- water intrusion and its impact on the suspended sediment concentration in the Changjiang (Yangtze) estuary. Chin. J. Oceanol. Limnol. 2010, 28, 609–618. [Google Scholar] [CrossRef]
- Wu, H.; Zhu, J.; Choi, B.H. Links between saltwater intrusion and subtidal cir- culation in the Changjiang Estuary: A model-guided study. Cont. Shelf Res. 2010, 30, 1891–1905. [Google Scholar] [CrossRef]
- Shen, F.; Zhou, Y.; Li, J.; He, Q.; Verhoef, W. Remotely sensed variability of the suspended sediment concentration and its response to decreased river discharge in the Yangtze estuary and adjacent coast. Cont. Shelf Res. 2013, 69, 52–61. [Google Scholar] [CrossRef]
- Hennings, I.; Herbers, D. Suspended sediment signatures induced by shallow water undulating bottom topography. Remote Sens. Environ. 2014, 140, 294–305. [Google Scholar] [CrossRef]
- Schoellhamer, D.H. Anthropogenic Sediment Resuspension Mechanisms in a Shallow Microtidal Estuary. Estuar. Coast. Shelf Sci. 1996, 43, 533–548. [Google Scholar] [CrossRef]
- He, X.; Bai, Y.; Pan, D.; Huang, N.; Dong, X.; Chen, J.; Chen, C.T.; Cui, Q. Using geostationary satellite ocean color data to map the diurnal dynamics of suspended particulate matter in coastal waters. Remote Sens. Environ. 2013, 133, 225–239. [Google Scholar] [CrossRef]
- Xu, H.-J.; Huang, Z.; Bai, Y.-C.; Su, L.-S.; Hong, Y.-C.; Lu, T.-T.; Wang, X. Numerical analysis of sediment deposition in Yangtze River estuary: Insight from conceptual estuary models. Appl. Ocean Res. 2020, 104, 102372. [Google Scholar] [CrossRef]
- Wang, S.; Zhang, G.; Fu, D. Numerical simulation of tides, tidal currents, residual current and shear front in estuary. Period. Ocean Univ. China 2010, 40, 31–40. (In Chinese) [Google Scholar]
- Huang, M.F.; Montgomery, D.R. Altered regional sediment trans- port regime after a large typhoon, southern Taiwan. Geology 2013, 41, 1223–1226. [Google Scholar] [CrossRef]
- Miles, T.; Glenn, S.M.; Schofield, O. Temporal and spatial variability in fall storm induced sediment resuspension on the Mid-Atlantic Bight. Cont. Shelf Res. 2013, 63, S36–S49. [Google Scholar] [CrossRef]
- Jiang, X.; Lu, B.; He, Y. Response of the turbidity maximum zone to fluctuations in sediment discharge from river to estuary in the Changjiang Estuary (China). Estuar. Coast. Shelf Sci. 2013, 131, 24–30. [Google Scholar] [CrossRef]
- Bian, C.; Jiang, W.; Quan, Q.; Wang, T.; Greatbatch, R.J.; Li, W. Distributions of suspended sediment concentration in the Yellow Sea and the East China Sea based on field surveys during the four seasons of 2011. J. Mar. Syst. 2013, 121–122, 24–35. [Google Scholar] [CrossRef]
- Li, Y.; Li, X. Remote sensing observations and numerical studies of a super typhoon-induced suspended sediment concentration variation in the East China Sea. Ocean Model. 2016, 104, 187–202. [Google Scholar] [CrossRef]
- Yan, Q.S. Overview of the storm-generated deposits on nearshore zone and open shelf. Oceanol. Limnol. Sin. 1984, 15, 14–20. (In Chinese) [Google Scholar]
- Suanez, S.; Cariolet, J.-M.; Cancouët, R.; Ardhuin, F.; Delacourt, C. Dune recovery after storm erosion on a high-energy beach: Vougot Beach, Brittany (France). Geomorphology 2012, 139–140, 16–33. [Google Scholar] [CrossRef]
- Wainright, S.C. Sediment-to-water fluxes of particulate material and microbes by resuspension and their contribution to the planktonic food web. Mar. Ecol. Prog. Ser. 1990, 62, 271–281. [Google Scholar] [CrossRef]
- Chen, Z.; Yu, L.; Gupta, A. The Yangtze River: An introduction. Geomorphology 2001, 41, 73–75. [Google Scholar] [CrossRef]
- Yang, S.L.; Zhang, J.; Dai, S.B.; Li, M.; Xu, X.J. Effect of deposition and erosion within the main river channel and large lakes on sediment delivery to the estuary of the Yangtze River. J. Geophys. Res. Earth Surf. 2007, 112, F02005. [Google Scholar] [CrossRef]
- Shen, Q.; Huang, W.; Qi, D. Integrated Modeling of Typhoon Damrey’s Effects on Sediment Resuspension and Transport in the North Passage of Changjiang Estuary, China. J. Waterw. Port Coast. Ocean Eng. 2018, 144, 4018011–4018015. [Google Scholar] [CrossRef]
- Syvitski, J.P.M.; Kettner, A.J.; Overeem, I.; Hutton, E.W.H.; Hannon, M.T.; Brakenridge, G.R.; Day, J.; Vörösmarty, C.; Saito, Y.; Giosan, L.; et al. Sinking deltas of human activities. Nat. Geosci. 2009, 2, 681–686. [Google Scholar] [CrossRef]
- Ma, F.; Jiang, C.; Rauen, W.B.; Lin, B. Modelling sediment transport processes in a macro-tidal estuary. Sci. China Technol. Sci. 2009, 52, 3368–3375. [Google Scholar] [CrossRef]
- Zhu, L.; He, Q.; Shen, J.; Wang, Y. The influence of human activities on morphodynamics and alteration of sediment source and sink in the Changjiang Estuary. Geomorphology 2016, 273, 52–62. [Google Scholar] [CrossRef]
- Mulligan, R.P.; Hay, A.E.; Bowen, A.J. Wave-driven circulation in a coastal bay during the landfall of a hurricane. J. Geophys. Res. Ocean. 2008, 113, C05026. [Google Scholar] [CrossRef]
- DHI Group. Mike 21 & Mike 3 FLOW MODEL FM. Hydrodynamic and Transport Module Scientific Documentation; DHI Group: Hørsholm, Denmark, 2021. [Google Scholar]
- Chen, W.; Chen, K.; Kuang, C.; Zhu, D.Z.; He, L.; Mao, X.; Liang, H.; Song, H. Influence of sea level rise on saline water intrusion in the Yangtze River Estuary. China. Appl. Ocean Res. 2016, 54, 12–25. [Google Scholar] [CrossRef]
- Ren, J.B. Wave Dynamics and Its Impact on Sediment Transport under Typhoons in the Changjiang Estuary; East China Normal University: Shanghai, China, 2020. (In Chinese) [Google Scholar]
- Wang, J.; Kuang, C.; Chen, K.; Fan, D.; Qin, R.; Han, X. Wave–Current Interaction by Typhoon Fongwong on Saline Water Intrusion and Vertical Stratification in the Yangtze River Estuary. Estuar. Coast. Shelf Sci. 2022, 279, 108138. [Google Scholar] [CrossRef]
- Li, Z.; Li, S.; Hou, Y.; Mo, D.; Li, J.; Yin, B. Typhoon-induced wind waves in the northern East China Sea during two typhoon events: The impact of wind field and wave-current interaction. J. Oceanol. Limnol. 2022, 40, 934–949. [Google Scholar] [CrossRef]
- Fan, Y.S. Seabed Erosion and Its Mechanism in the Littoral Area of Yellow River Delta; East China Normal University: Shanghai, China, 2019. (In Chinese) [Google Scholar]
- Zhang, Z.; Wu, H.; Yin, X.; Qiao, F. Dynamical response of Changjiang River plume to a severe Typhoon with the surface wave-induced mixing. J. Geophys. Res. Ocean. 2018, 123, 9369–9388. [Google Scholar] [CrossRef]
- Willmott, C.J. On the validation of models. Phys. Geogr. 1981, 2, 184–194. [Google Scholar] [CrossRef]
- Wang, J.; Kuang, C.; Cheng, S.; Fan, D.; Chen, K.; Chen, J. The Responses of Storm Surges to Representative Typhoons under Wave-Current Interaction in the Yangtze River Estuary. J. Mar. Sci. Eng. 2024, 12, 90. [Google Scholar] [CrossRef]
- Liang, M.; Liu, J.; Lin, Y.; He, Z.; Wei, W.; Jia, L. Typhoon-induced suspended sediment dynamics in the mouth-bar region of a river/wave-dominated estuary. Mar. Geol. 2023, 456, 106972. [Google Scholar] [CrossRef]
- Gao, A.; Zhao, H.Y.; Yang, S.L.; Dai, S.H.; Chen, S.L.; Li, P. Seasonal and tidal variations in suspended sediment concentration under the influence of river runoff, tidal current and wind waves. Adv. Mar. Sci. 2008, 26, 44–50. (In Chinese) [Google Scholar]
- Fan, J.Q. Influence of Typhoon on Sedimentary Dynamic Process of Intertidal Wetland in Yangtze Estuary; East China Normal University: Shanghai, China, 2019. [Google Scholar]
- Rijn, L.C.V. Principles of Sediment Transport in Rivers, Estuaries and Coastal Seas; Morfologie Morf.; Aqua Publications: Madison, WI, USA, 1993. [Google Scholar]
- Liu, H.; He, Q.; Wang, Z.; Weltje, G.J.; Zhang, J. Dynamics and spatial variability of near-bottom sediment exchange in the Yangtze Estuary, China. Estuar. Coast. Shelf Sci. 2010, 86, 322–330. [Google Scholar] [CrossRef]
- Li, X.; Leonardi, N.; Plater, A.J. Wave-driven sediment resuspension and salt marsh frontal erosion alter the export of sediments from macro-tidal estuaries. Geomorphology 2019, 325, 17–28. [Google Scholar] [CrossRef]
- Xu, L.D. Fully Coupled Numerical Modelling of Sediment Transport and Bed Change under Currents and Waves Influences; Zhejiang University: Hangzhou, China, 2019. [Google Scholar]
- Lu, H.F.; Gu, F.F.; Chen, X.E.; Qi, D.M. Effect of sea waves on sediment transport in the sea waters surrounding Zhoushan Islands, China. Period. Ocean Univ. China 2019, 49, 1–9. [Google Scholar]
- Zou, Q.; Hay, A.E. The vertical structure of the wave bottom boundary layer over a sloping bed: Theory and field measurements. J. Phys. Oceanogr. 2003, 33, 1380–1400. [Google Scholar] [CrossRef]
- Lu, J.; Jiang, J.B.; Li, A.C.; Ma, X.C. Impact of Typhoon Chan-hom on the marine environment and sediment dynamics on the inner shelf of the East China Sea: In-situ seafloor observations. Mar. Geol. 2018, 406, 72–83. [Google Scholar] [CrossRef]
- Tang, R.; Shen, F.; Ge, J.; Yang, S.; Gao, W. Investigating typhoon impact on SSC through hourly satellite and real-time field observations: A case study of the Yangtze estuary. Cont. Shelf Res. 2021, 224, 104475. [Google Scholar] [CrossRef]
- Shi, Z.; Ling, H.L. Vertical profiles of fine suspension concentration in the Changjiang Estuary. J. Sediment Res. 1999, 2, 59–64. [Google Scholar]
- Cu, Y.T.; Rong, Z.R. Effects of Breaking and Non-Breaking Surface Wave Mixingon the Changjiang River Plume Dynamics in Summer. J. Geophys. Res. Ocean. 2023, 128, e2022JC019501. [Google Scholar]


| Parameter | Value |
|---|---|
| Density of sediment (kg/m3) | 2650 |
| Density of the bed layer (kg/m3) | 800 |
| Settling velocity (m/s) | 0.0003 |
| Erosion coefficient (kg/m2/s) | 5 × 10⁻⁵ |
| Erosion critical shear stress (N/m2) | 0.2~0.6 |
| Deposition critical shear stress (N/m2) | 0.1 |
| Parameter | Value | |
|---|---|---|
| Wave breaking | 0.8 | |
| Bottom friction | 0.00025 | |
| White capping | Cds | 4.1 |
| δ | 0.5 | |
| Initial condition | JONSWAP wave | |
| Condition | Module | Dynamics | Scenario Name |
|---|---|---|---|
| 1 | Hydrodynamic | Tide only | Astronomic tide (AT) |
| 2 | Hydrodynamic | Tide + wind | Non-wave (NW) |
| 3 | Hydrodynamic + wave | Tide + wind + wave | Wave–current interaction (WCI) |
Disclaimer/Publisher’s Note: The statements, opinions and data contained in all publications are solely those of the individual author(s) and contributor(s) and not of MDPI and/or the editor(s). MDPI and/or the editor(s) disclaim responsibility for any injury to people or property resulting from any ideas, methods, instructions or products referred to in the content. |
© 2024 by the authors. Licensee MDPI, Basel, Switzerland. This article is an open access article distributed under the terms and conditions of the Creative Commons Attribution (CC BY) license (https://creativecommons.org/licenses/by/4.0/).
Share and Cite
Wang, J.; Kuang, C.; Fan, D.; Xing, W.; Qin, R.; Zou, Q. Spatio-Temporal Variation in Suspended Sediment during Typhoon Ampil under Wave–Current Interactions in the Yangtze River Estuary. Water 2024, 16, 1783. https://doi.org/10.3390/w16131783
Wang J, Kuang C, Fan D, Xing W, Qin R, Zou Q. Spatio-Temporal Variation in Suspended Sediment during Typhoon Ampil under Wave–Current Interactions in the Yangtze River Estuary. Water. 2024; 16(13):1783. https://doi.org/10.3390/w16131783
Chicago/Turabian StyleWang, Jie, Cuiping Kuang, Daidu Fan, Wei Xing, Rufu Qin, and Qingping Zou. 2024. "Spatio-Temporal Variation in Suspended Sediment during Typhoon Ampil under Wave–Current Interactions in the Yangtze River Estuary" Water 16, no. 13: 1783. https://doi.org/10.3390/w16131783
APA StyleWang, J., Kuang, C., Fan, D., Xing, W., Qin, R., & Zou, Q. (2024). Spatio-Temporal Variation in Suspended Sediment during Typhoon Ampil under Wave–Current Interactions in the Yangtze River Estuary. Water, 16(13), 1783. https://doi.org/10.3390/w16131783