Article

Research on Failure Modes and Causes of 100-m-High Core Wall Rockfill Dams

1
State Key Laboratory of Hydraulics and Mountain River Engineering, Sichuan University, No. 24 South Section 1, Yihuan Road, Chengdu 610065, China
2
College of Water Resources & Hydropower, Sichuan University, No. 24 South Section 1, Yihuan Road, Chengdu 610065, China
3
Sichuan Academy of Water Conservancy, Mudian Road, Qingyang Zone, Chengdu 610072, China
*
Author to whom correspondence should be addressed.
Water 2024, 16(13), 1809; https://doi.org/10.3390/w16131809
Submission received: 28 April 2024 / Revised: 31 May 2024 / Accepted: 24 June 2024 / Published: 26 June 2024

Abstract

:
Rockfill dams are the most competitive type of dam in complex geological environments. Identifying the failure modes and causes in high dams over 100 m is critical for better guiding high dam designs and implementing safety prevention and control measures. To this end, this paper investigated numerous cases of earth–rock dam breaches and failure modes in rockfill dams globally, with a particular focus on dams over 100 m in height, encompassing all such dams in China. The study categorized dam failure modes based on whether the dams were built before or after 1980. It also examined the causes of dam failures in terms of dam height, foundation characteristics and thickness, and failure time. Additionally, the paper analyzed a rockfill dam in China, with a height of 136 m and over ten years of operation, as a case study. We analyzed the spatial and temporal characteristics and causes of failures, such as dam crest cracking, high-level seepage, and gallery cracking, using the design situation, monitoring data, and numerical simulation. The paper also addressed issues related to dam design and foundation treatment, providing recommendations for improvement. The study indicated that the overall risk of total failure for dams over 100 m is already low. However, longitudinal cracks on the dam crest, core wall seepage, hydraulic splitting, and seepage damage to the dam foundation are primary issues in the current high core wall rockfill dams. These issues are mainly caused by uneven structural deformation of the dam and its foundation. A reasonable design of rockfill materials and foundations can mitigate these failures.

1. Introduction

Around 1940, rockfill materials began to be used as the shell material for core wall dams [1,2], and the term “core wall rockfill dam” appeared. In the late 1960s, the emergence of heavy-duty vibratory rollers and multilayer roller compaction technologies greatly enhanced the compaction density of large-sized rockfill materials and effectively reduced the deformation of rockfill dams. This improvement led to the widespread use and rapid development of rockfill dams with good seismic performance constructed from locally available materials [3,4]. The successive commissioning and operation of the Nurek Core Gravel Dam (300 m) [5], Shiziping (136 m) [6], Pubugou (186 m), Nuozhadu (261.5 m) [7], Lianghekou (295 m), Shuangjiangkou (312 m), and other dams marks a significant breakthrough in the construction of high earth–rock dams.
Rockfill dams exhibit excellent adaptability to various foundations and are widely used in areas with deep overburden. However, the complex geological and topographical conditions in these areas, combined with uncertainties in the materials used to build rockfill dams, have resulted in failures like cracking [8,9] and seepage [10,11] during construction and operation. These issues have hindered the development of high earth–rock dams and increased safety risks [12]. For example, the Ei Infiernillo Dam (148 m) in Mexico [13] experienced rapid water impoundment after filling, causing dam crest settlement and an increasing rate of downstream displacement. Additionally, transverse fine cracks appeared on both the left and right bank abutments. Similarly, the Teton Dam in the United States [14] experienced seepage at its base during a rapid rise in the water level, leading to dam failure due to the inability to lower the water level quickly. Likewise, during the initial impoundment of the Maoergai Dam in China [15], the core wall experienced sudden seepage and internal erosion.
The design concepts and methods employed in constructing high dams today mainly continue those from the middle of the last century. While ongoing efforts continually improve to tackle emerging issues, numerous challenges persist, representing a significant concern in dam safety [16,17]. The primary reason for this is that the evolution trends in the working behavior of some high dams during construction and operation, such as long-term deformation, differ significantly from those of medium and low dams, which exceeds the cognitive scope of the current engineering experience [18,19]. These cognitive limitations pose significant risks to the operation and development of high core wall rockfill dams. Additionally, many failure cases involve damage caused by the collapse of fill outside the dam [20]. Therefore, a thorough examination of the failure modes and causes of high core wall rockfill dams is crucial for identifying the main factors and weaknesses leading to dam failure. This analysis serves as a valuable reference for the development of rockfill material design and prevention and preventive measures.
The failure modes of high core wall rockfill dams differ markedly from those of small and medium-sized dams due to factors such as dam construction materials, complex mechanical properties, high soil stress, numerous influencing factors, and high uncertainty during the construction period [21]. Despite the fact that numerous institutions and scholars have conducted statistics on earth–rock dam failures, there is a notable lack of failure statistics specifically for core wall rockfill dams exceeding 100 m in height. This paper thoroughly examines a large number of earth–rock dam breach and failure cases of core wall rockfill dams, covering 100 dams over 100 m in height, including all such dams in China. The study categorizes and summarizes the failure modes of these dams. Using the construction completion years before and after 1980 as a dividing line, the paper statistically analyzes the failure modes of core wall rockfill dams exceeding 100 m in height during different periods, considering dam height, foundation characteristics and thickness, failure events, and other relevant factors. The analysis includes both original data analysis and numerical simulation analysis of typical failure modes for representative projects, with the goal of investigating the causes of failures and providing suggestions for improvement.

2. An Overview of Earth–Rock Dam Failure Models

The International Commission on Large Dams (ICOLD) has investigated numerous dam breaches and accidents since the 1970s, and China began collecting systematic data on dam breaches in the 1980s. These studies provide a more reliable basis for the statistical analysis of earth–rock dam breach patterns [22]. According to ICOLD statistics [23,24,25], by the end of 2020, there were 2068 dam breaches reported in 57 countries (excluding China). Additionally, three more dam breaches were reported globally in 2021, with earth–rock dams having the highest incidence of dam breaches. The Chinese National Committee on Large Dams (ChinCOLD) reported that 3356 earth–rock dams, including face rockfill dams, have breached since records began in 1954, accounting for 94.32% of all breached dams. Most of these breached earth–rock dams are under 30 m tall, with 3136 such cases, making up 88.14% of the total. This is consistent with the international statistics, which show that dams under 30 m in height account for the majority of failures.
This paper presents a statistical analysis of dam failure data in China, classifying the causes into four groups: flood overtopping [26], poor design and construction quality, improper management, and other reasons. The results are shown in Figure 1. In the early stages, flood overtopping (51.23%) and poor design and construction quality (37.32%) were the leading causes of dam failures. These issues were primarily due to the widespread use of earth–rock dams, lower flood control standards for early-stage reservoirs, and inherent flaws in dam construction due to the country’s poor economic and technological conditions at that time. Entering the 21st century, China initiated extensive reservoir mitigation and reinforcement projects [27]. Consequently, the proportion of dam failures caused by insufficient flooding capacity has decreased dramatically, with excessive floods becoming the leading cause of dam overtopping. This shift is directly related to the increased frequency of disasters caused by global climate change, such as heavy rainfall [28]. In the 21st century, reservoir construction and management in China have become more standardized. However, the proportion of dam collapses due to poor design and construction quality has remained constant at 29.89%. This is directly linked to dam stability, seepage, and engineering flaws caused by improper design and construction.
We conducted a statistical analysis of 94 instances of dam failures in China for dams with heights below 55 m, as shown in Figure 2. This analysis aimed to investigate the causes of dam breaches in earth–rock dams of varying heights during both construction and operation periods. According to the classification by dam height, 73 dams under 30 m failed, accounting for 77.7% of all recorded failures. Regarding the cause of breaches, 28 dams failed due to overflow, representing 29.8%, and 42 dams failed due to quality problems, representing 44.7%. This indicates that dam overflow and quality issues are the primary causes for the failure of small and medium-sized earth–rock dams. Failures due to quality issues and improper design and construction are more common during the construction period, comprising a higher proportion. Conversely, dam failures caused by improper management typically occur during the operation period.

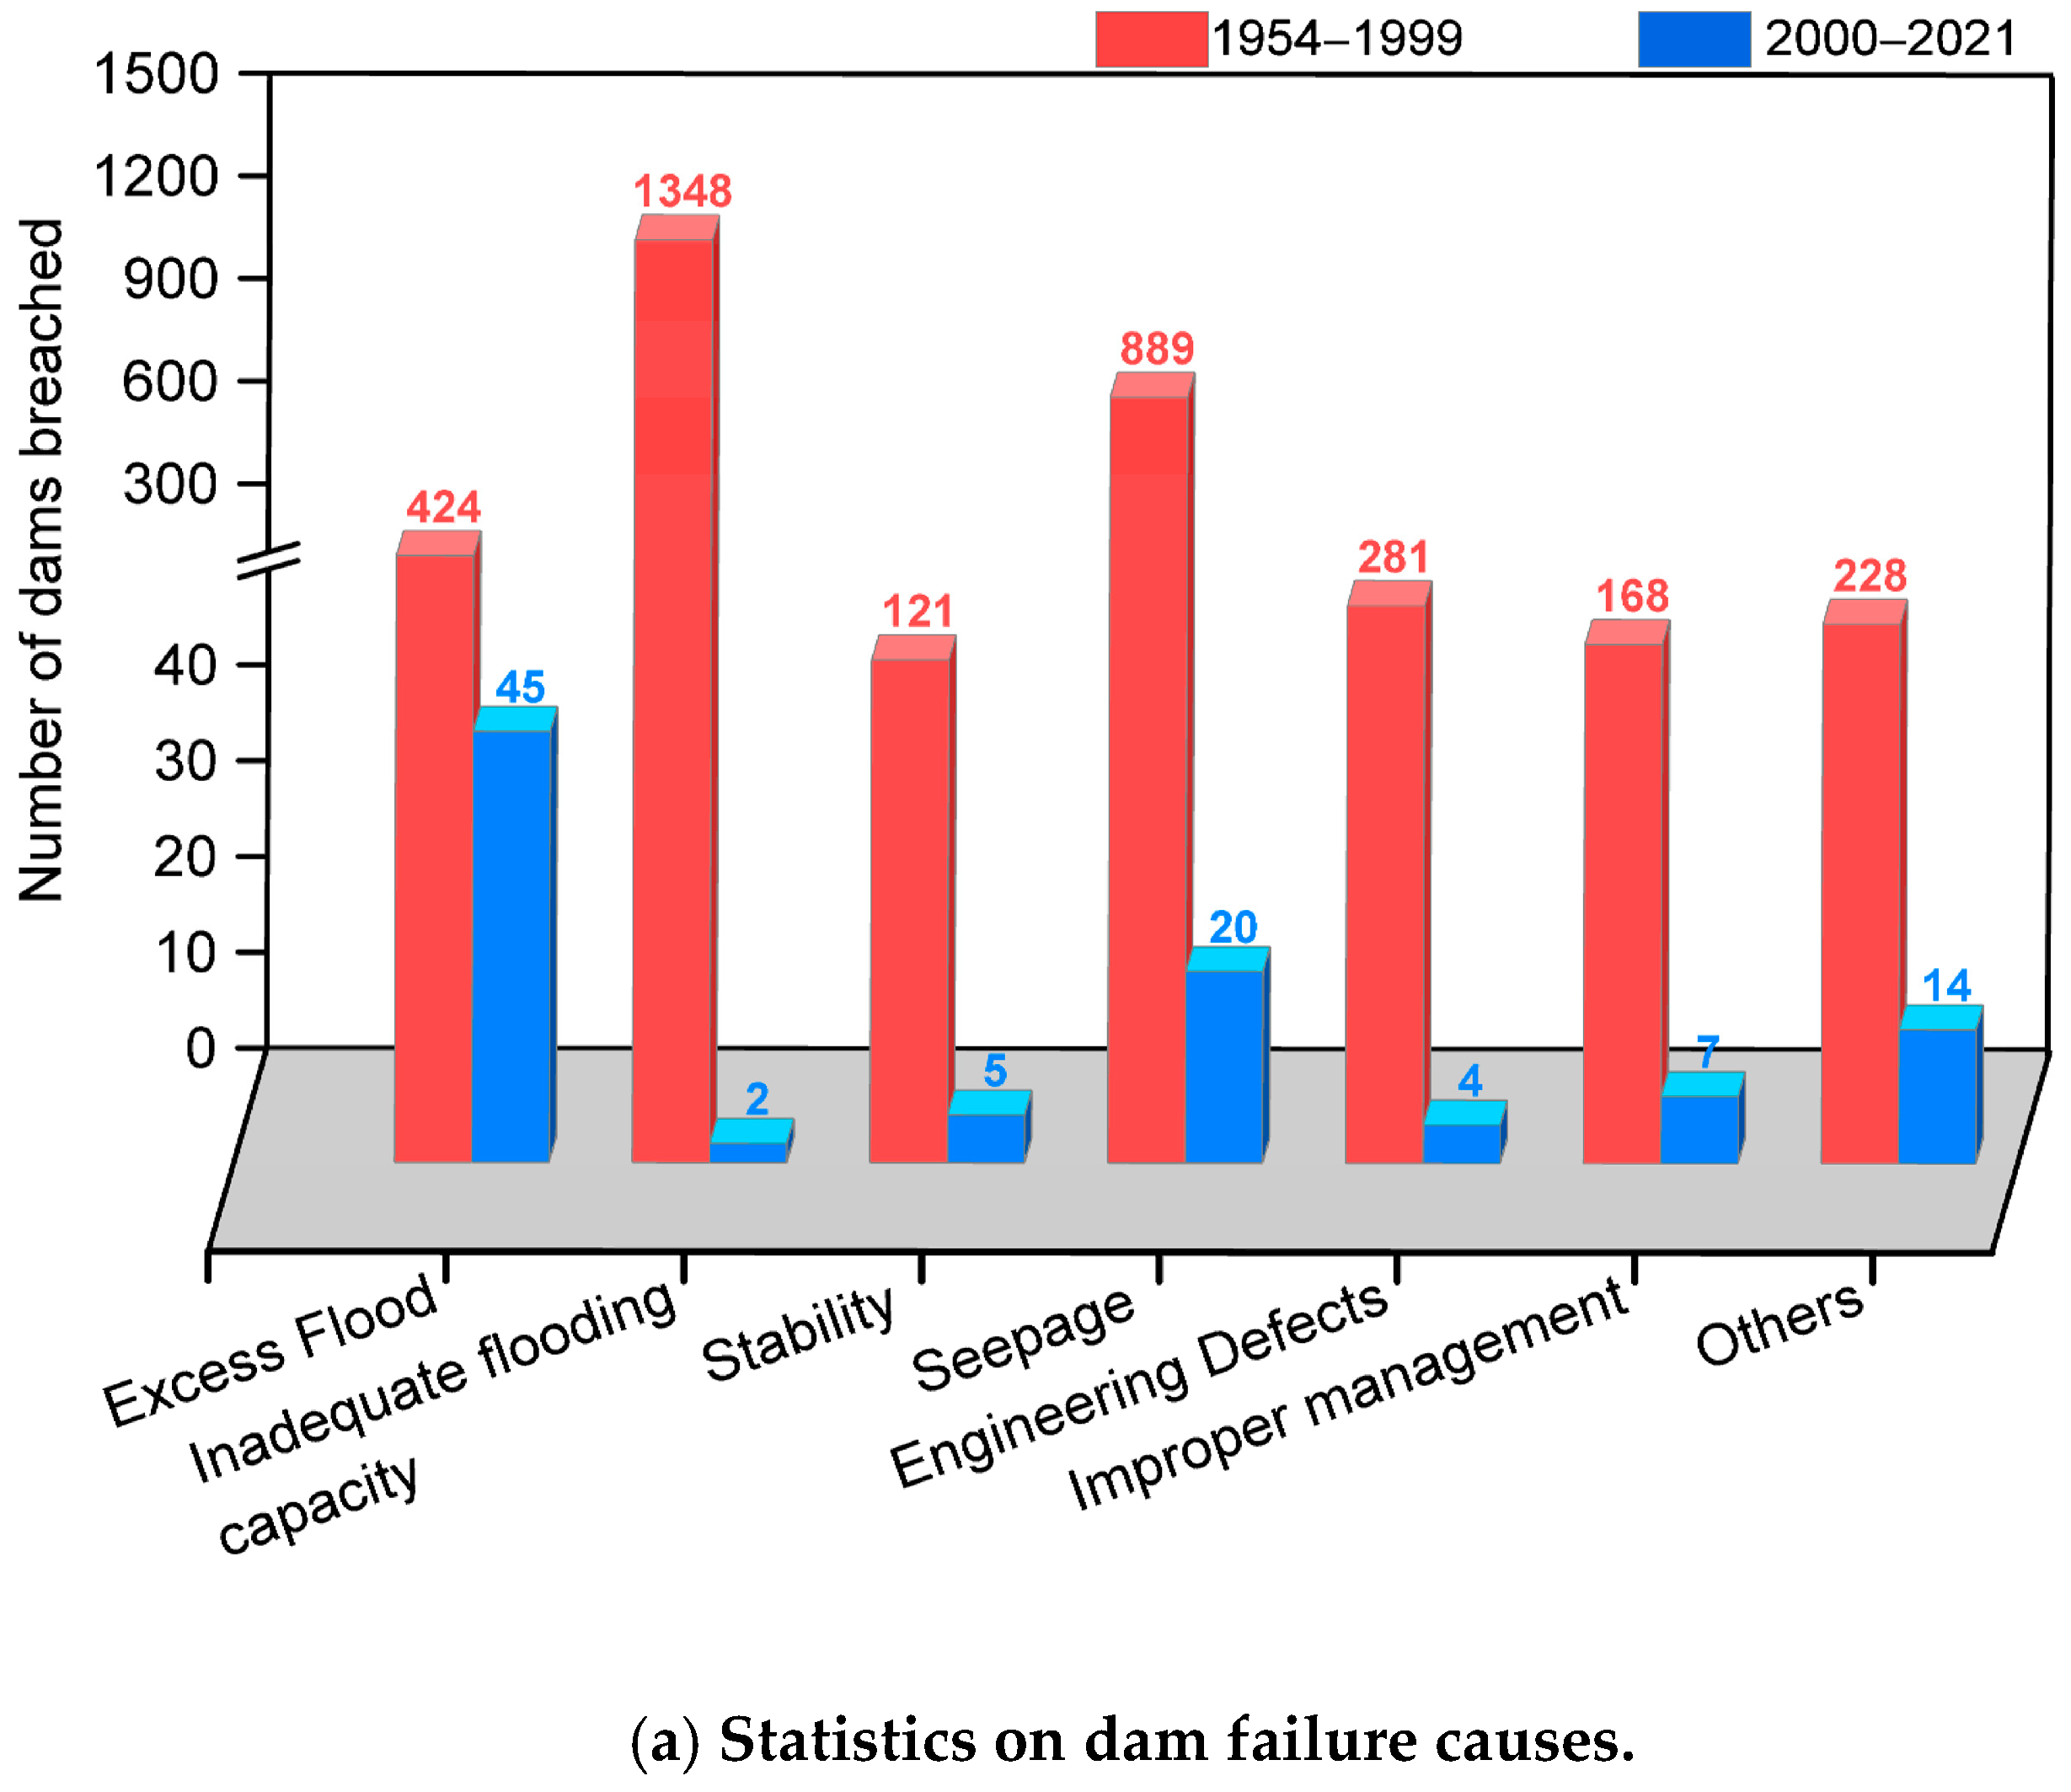
3. Statistical Analysis of Failure Modes in Core Wall Rockfill Dams above 100 Meters

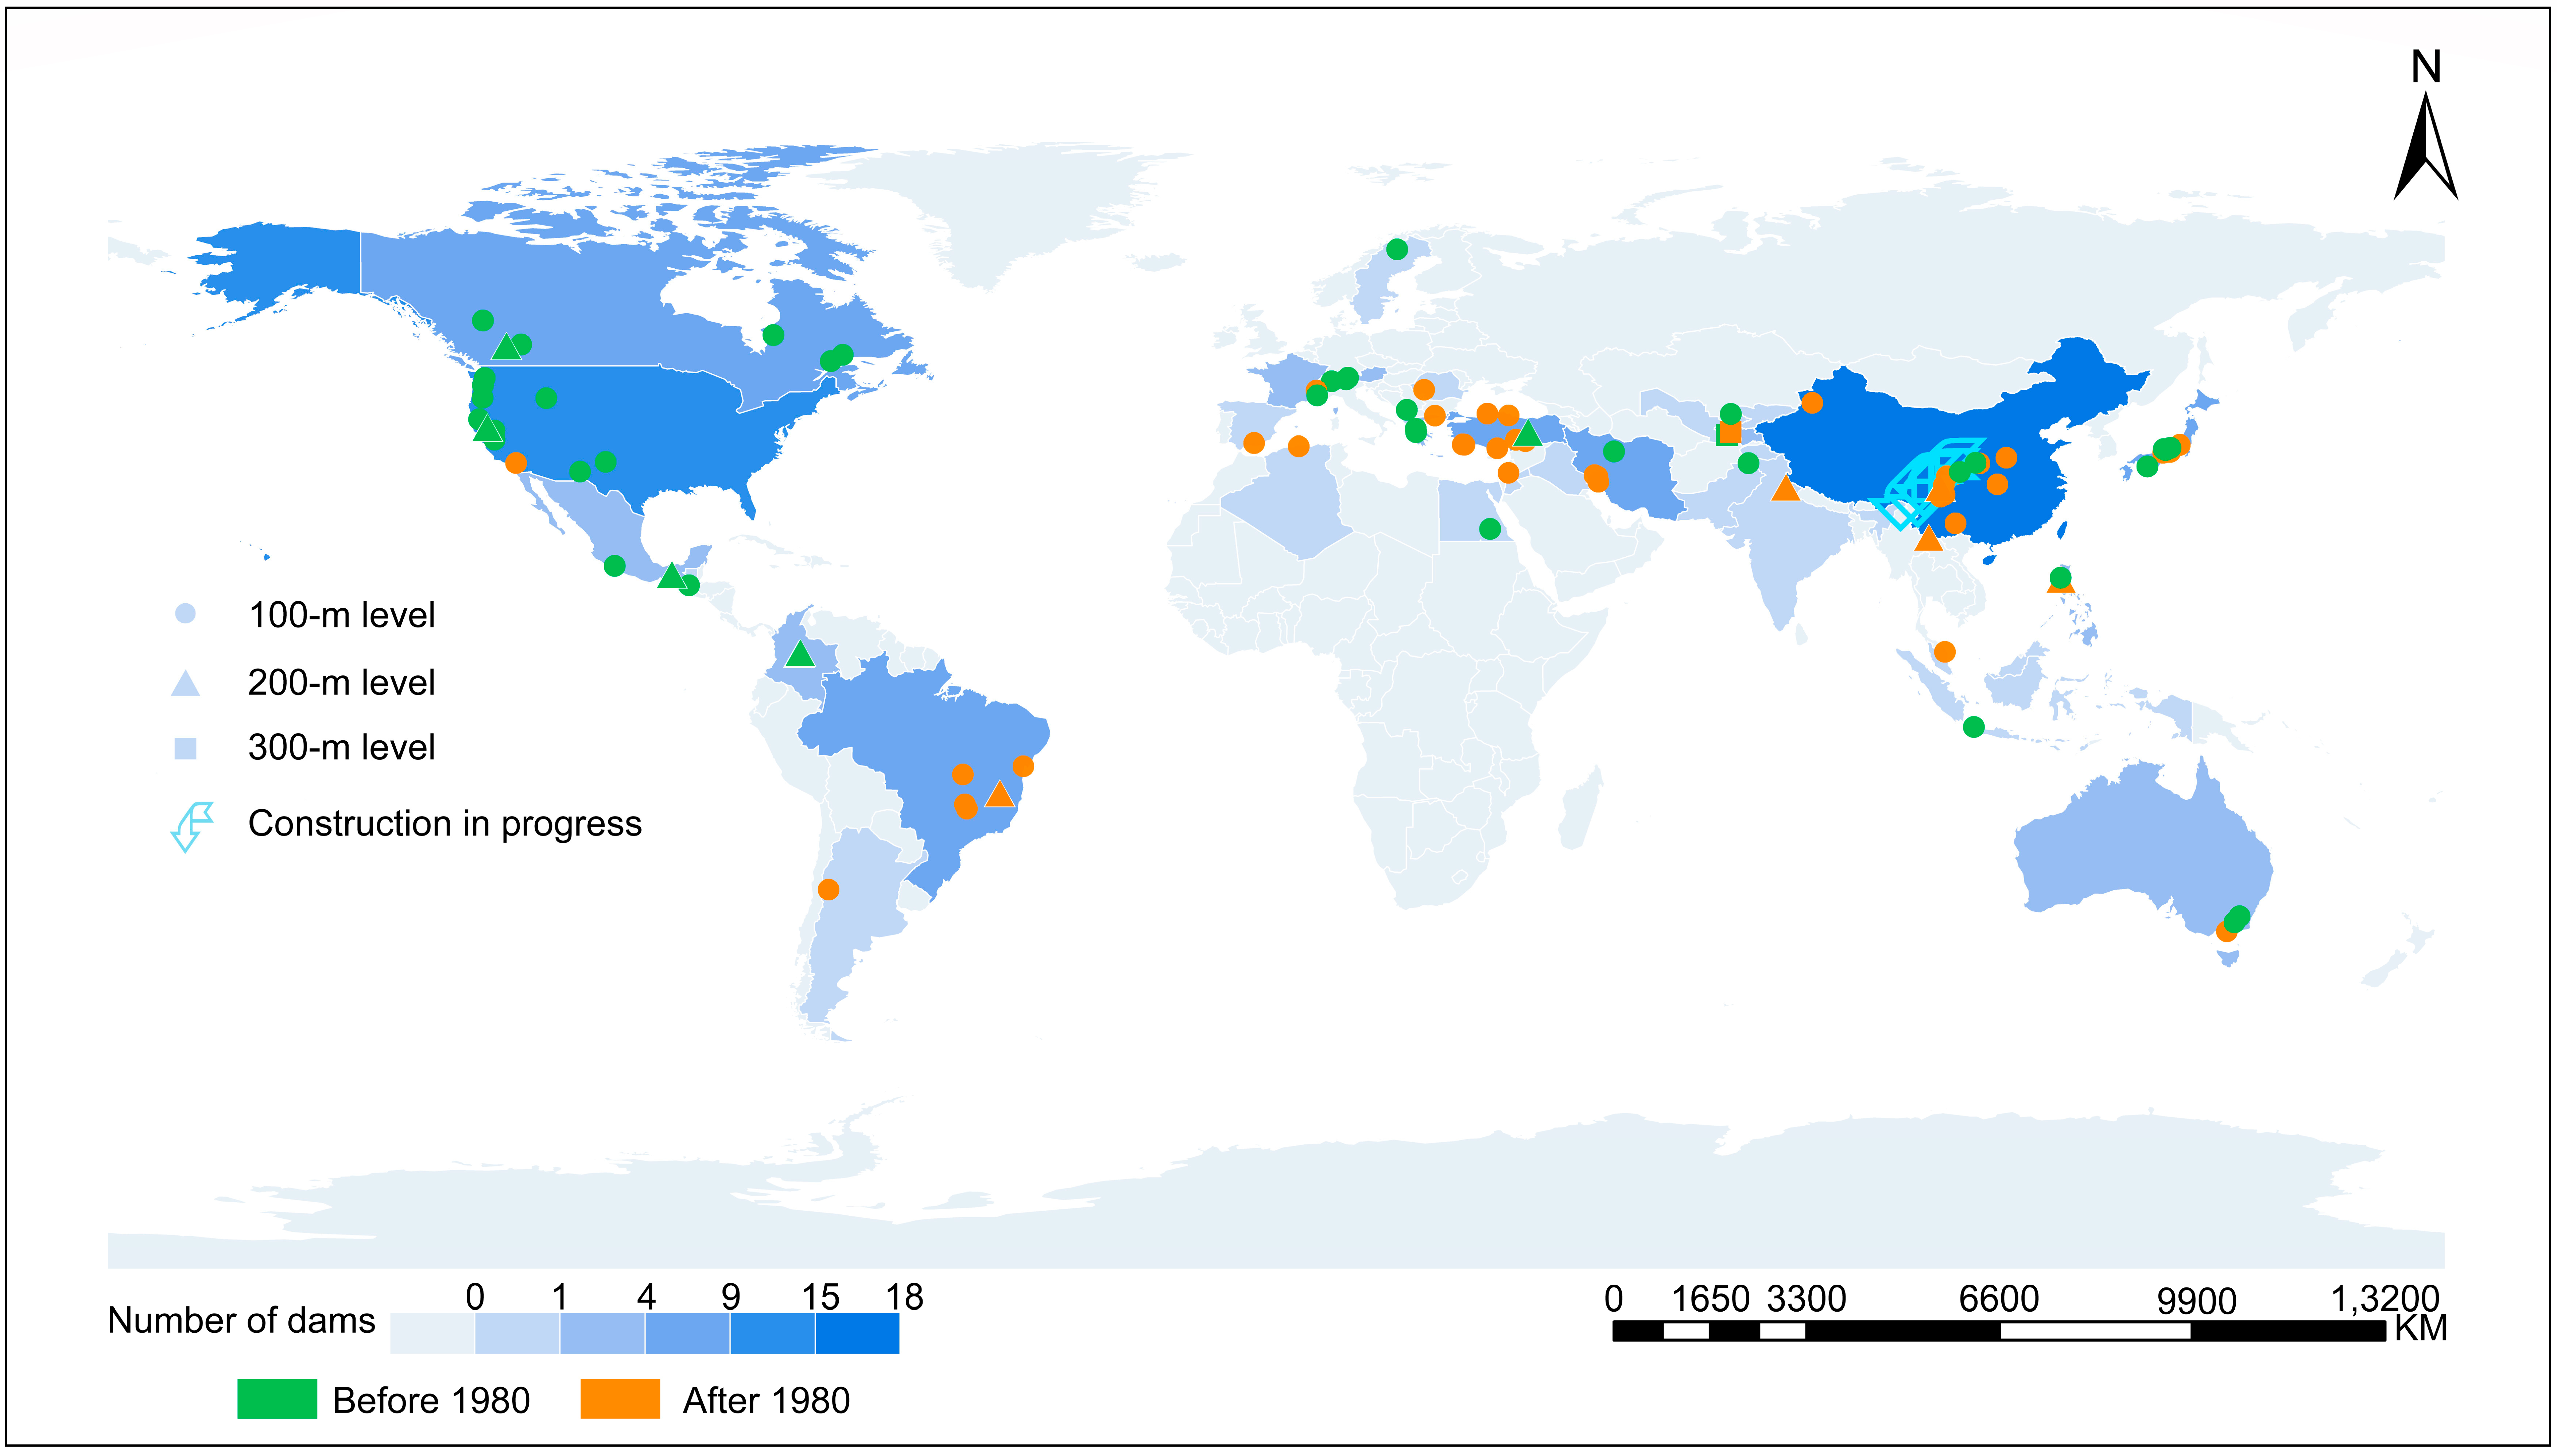
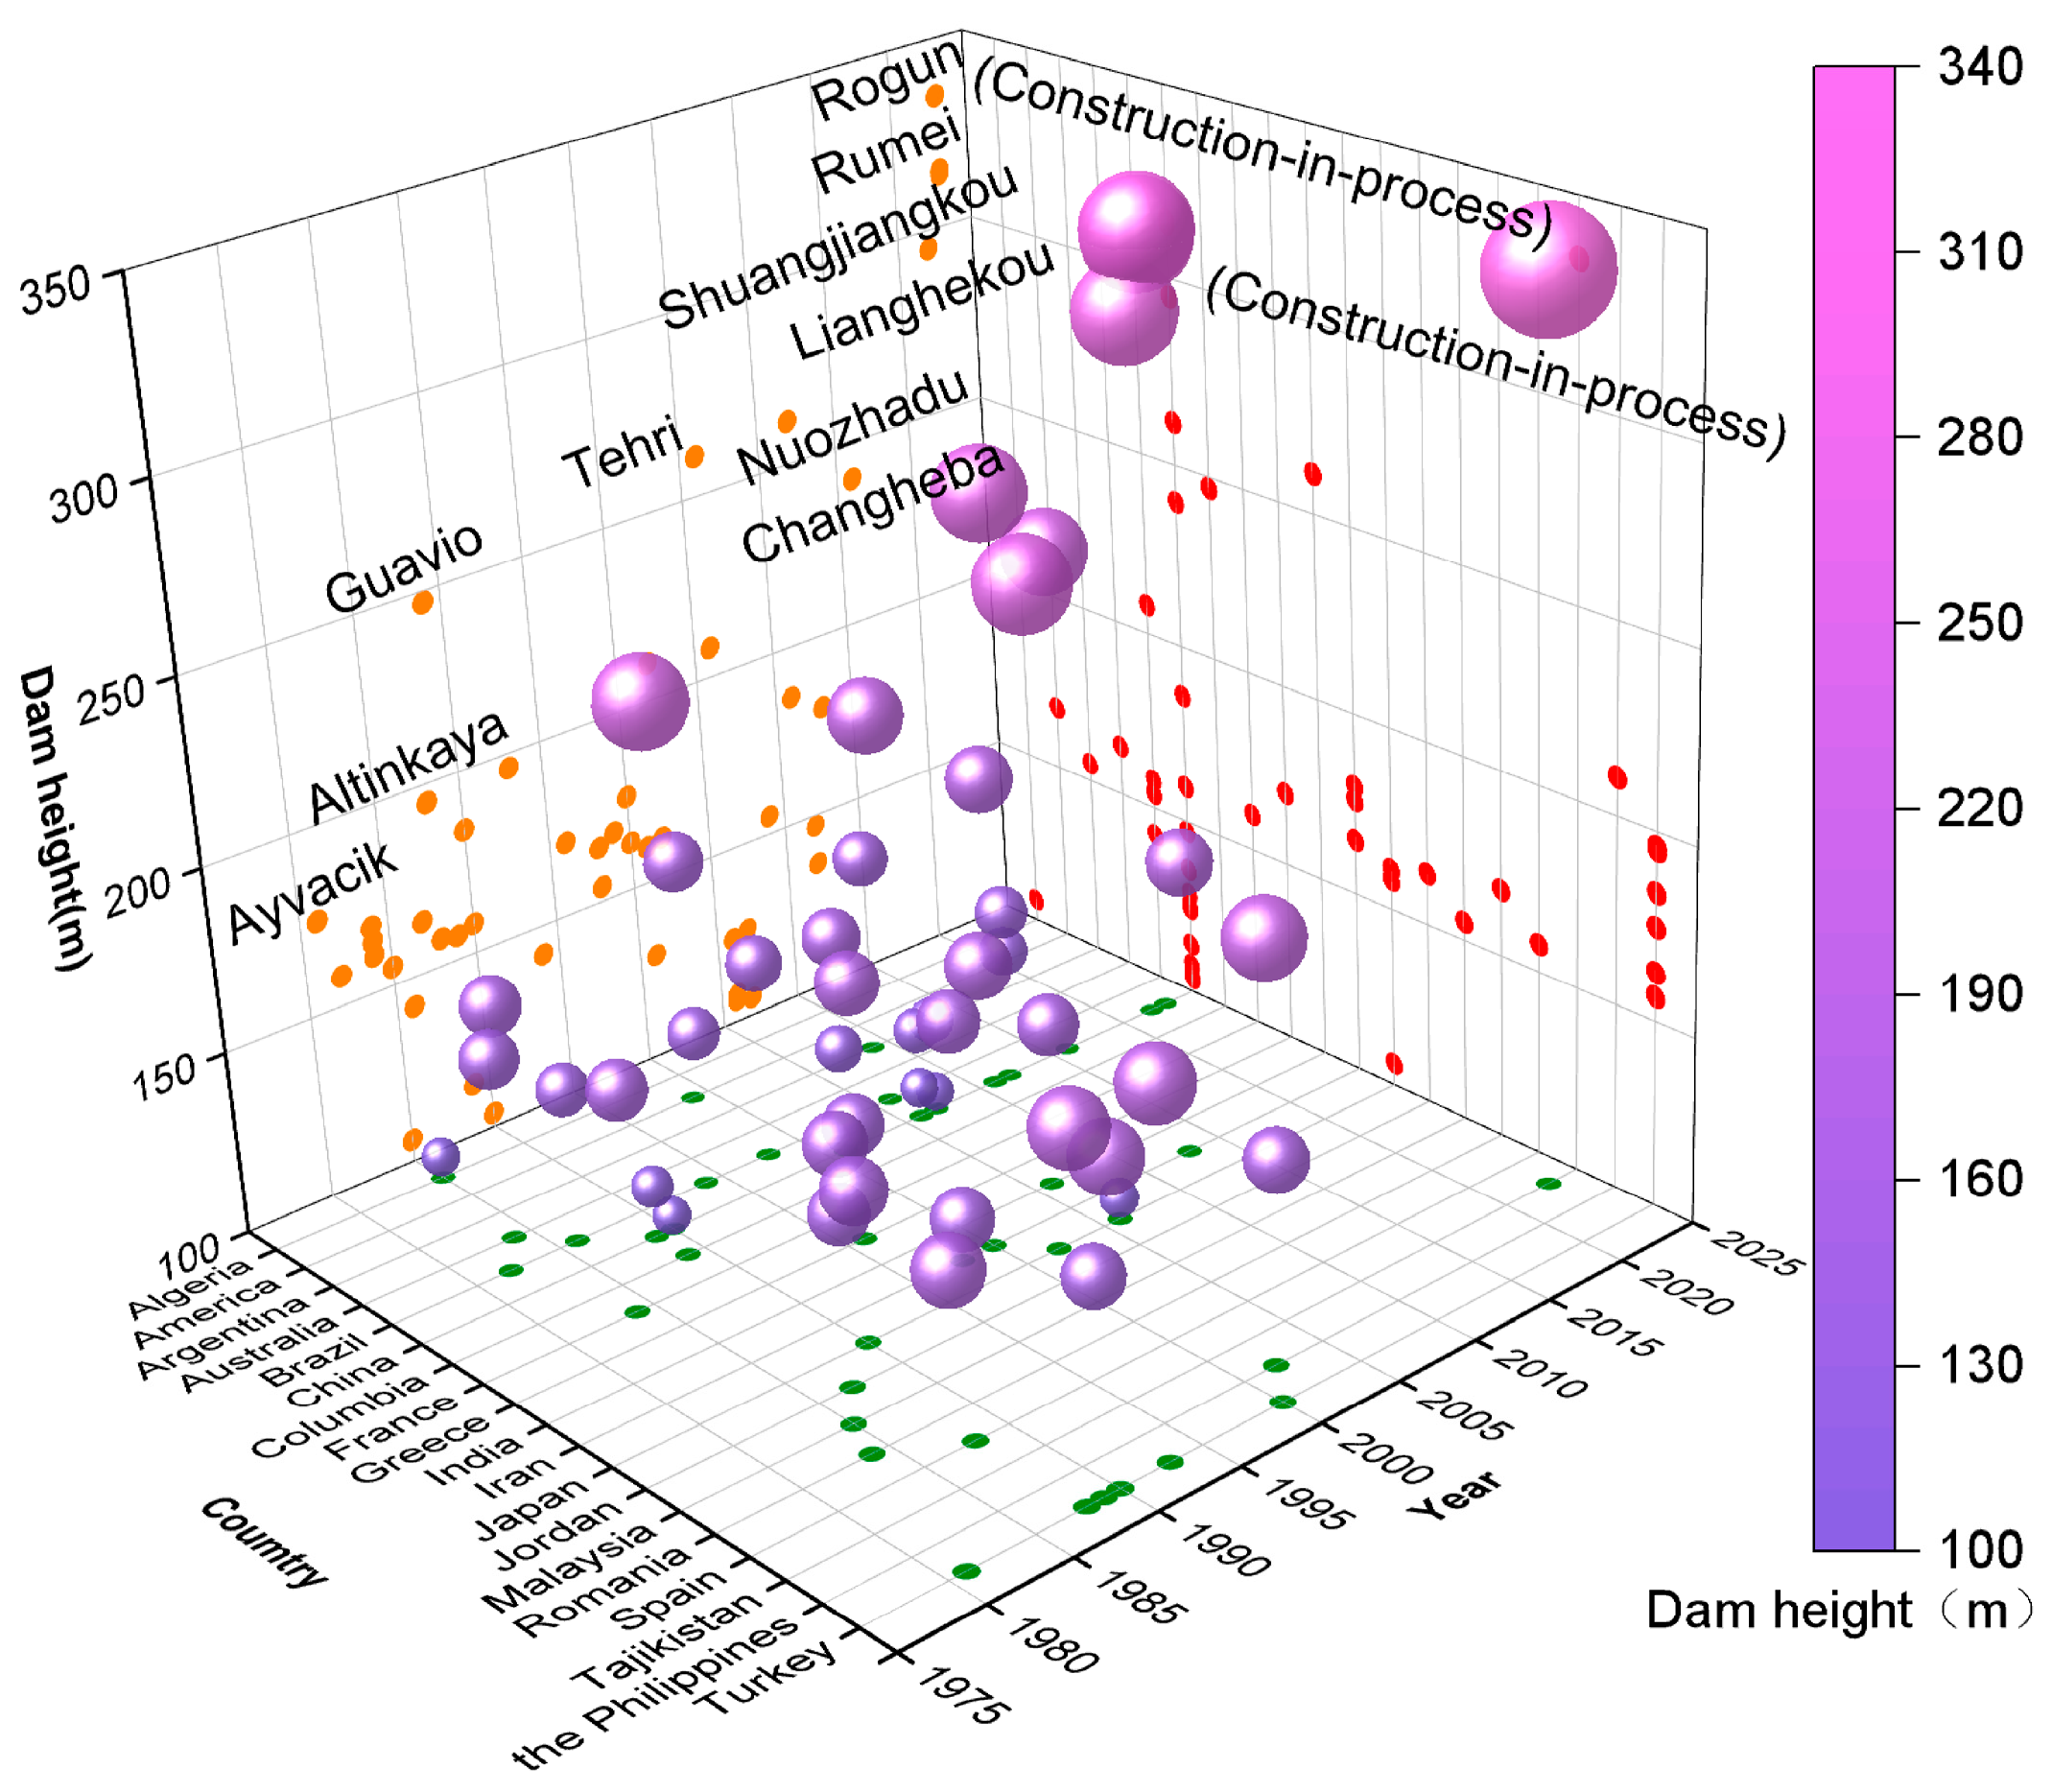
3.1. Statistical Data Scope

The technology for building earth–rock dams below 100 m is now well established. However, the construction of high core wall rockfill dams presents a greater challenge due to their frequent placement on foundations with complex geological conditions. Despite a decreasing risk associated with reservoir dams of the 100 m class and the low incidence of accidents due to dam failures, numerous defects persist, hindering the normal operation of these dams. In this paper, the construction and operation information of 100 core wall rockfill dams exceeding 100 m in height, including all such dams in China, are collected and statistically analyzed. The analysis focuses on their failure modes in relation to dam height, foundation characteristics and thickness, and failure time based on historical development over time.
Based on the construction and development process, Deng et al. [29] referenced the discussion on the development process of core wall rockfill dams by J.B. Cooke, a famous international damming expert. They divided this evolution into five phases: the early stage of core wall dam development (before 1940), the modernization transition period (1940–1964), the period of high-speed core wall dam development (1965–1980), the low period of core wall dam development (1981–2001), and the high period of core wall dam development (after 2002). The “core wall rockfill dam” concept emerged during the transitional stage, and by 1950, dam heights had reached 100 m. Combining statistics from ChinCOLD in 2012 and recent dam construction data, it is estimated that there are around 100 core wall rockfill dams worldwide exceeding 100 m in height (Figure 3). China leads with 18 dams (including 2 under construction), followed by the United States with 13. Turkey, Japan, Canada, and Brazil follow suit, with Australia, Mexico, Colombia, Greece, Iran, Austria, and France each having two or three such dams. Other countries have one to two core wall rockfill dams each [30,31,32,33].
Different countries have gone through distinct phases in the development of water conservation projects. Except for China, most high core wall rockfill dams over 100 m tall were built before the 1980s, with fewer built in recent decades. In contrast, the majority of these dams in China were built during the climax stage of development. As a result, differences in design experience, construction technology, and other factors will result in significant differences in dam failure modes and causes. Therefore, this paper conducts a statistical analysis of the stages before and after 1980.

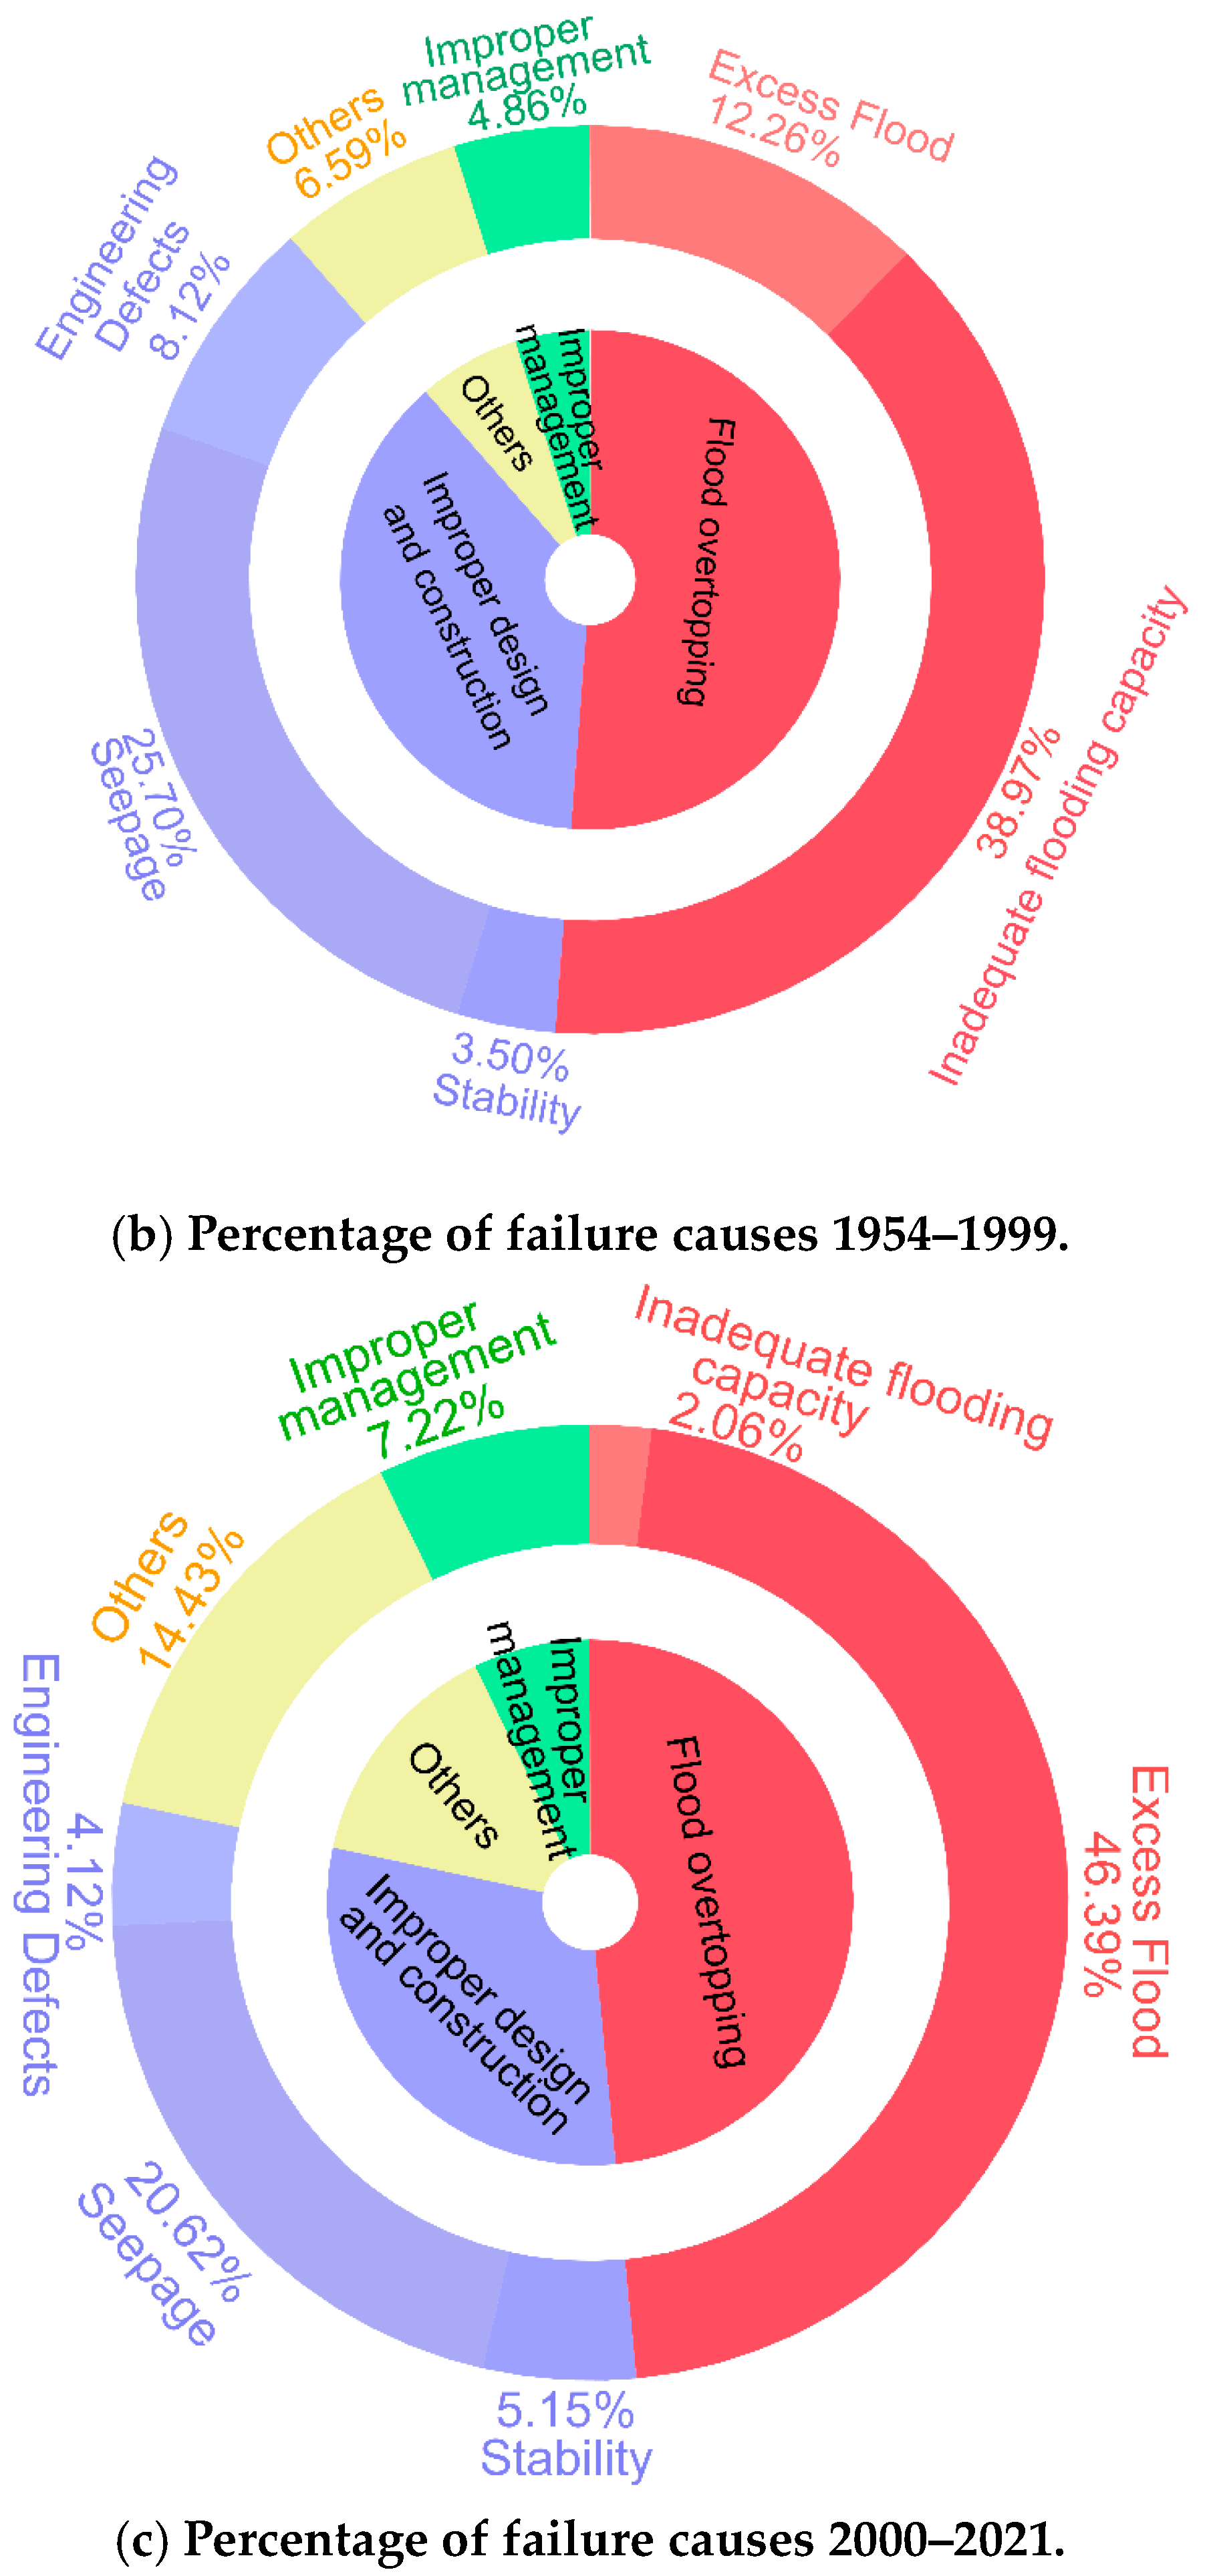
3.2. Failure Modes between 1940 and 1980

Based on previous technological advancements, core wall rockfill dams developed rapidly during this stage. The dam heights increased dramatically, with the tallest core wall dam reaching 300 m, and numerous high core wall rockfill dams were constructed [34]. In order to investigate the failure modes of high core wall rockfill dams between 1940 and 1980, some typical projects with detailed records were examined, as shown in Figure 4. The main failure modes are summarized in Table 1.
According to the statistics, the 11 core wall rockfill dams that failed between 1940 and 1980 mainly experienced longitudinal cracks on the dam crest, core wall seepage, hydraulic splitting, and seepage damage at the dam base. Dam cracking emerged as the most common issue, accounting for 46.67% of the total failures, followed by dam foundation seepage failure (20%) and core wall splitting (20%). Dam cracking in the covering layer was much more common than on the rock foundation. Among the eight dams that cracked, only the Teton Dam was built on a rock foundation. The others were built on a covering layer with a thickness exceeding 20 m. In terms of fault occurrence stages, dam cracking and dam foundation seepage damage mostly occurred during the construction and initial storage periods, while core wall splitting mainly occurred during the operation period.
Among the failures recorded in Table 1, only the Teton Dam collapsed due to core wall splitting, while the others experienced local failures. The main causes of these local failures were a lack of experience, early technical standards that were too low, insufficient filling standards, the use of inappropriate materials, and poor management practices. For example, both the Mud Mountain Dam in the United States and Portage Mountain Dam in Canada used ice moraine soil as core wall materials. However, the factors influencing the seepage stability of moraine soil core walls and their crushing mechanism under high-stress conditions are unknown. Using this soil material for the core wall material of high core wall rockfill dams in the early stage likely resulted in a high incidence of cracking. The Tarbela Dam in Brazil experienced uneven settlement and dam cratering due to improper placement of the monitoring instruments during the filling process.

3.3. Failure Modes after 1981

After 1981, the emphasis on hydropower development in Europe and the United States shifted towards dam safety and environmental protection. This shift led to a noticeable deceleration in dam construction [35,36]. In contrast, China has experienced a surge in the construction of core wall dams since the beginning of the century, reaching a global peak in core wall dam development. Figure 5 depicts the statistics for several core wall rockfill dams that are either currently under construction or were built after 1980, all boasting dam heights over 100 m. Notably, the dams currently under construction are all over 250 m in height, with some even exceeding 300 m. Consequently, analyzing the accident patterns of these high core wall rockfill dams has become a critical issue. Table 2 shows the statistical failure modes for these projects, excluding dams for which no failures have been documented.
The analysis reveals that special issues, such as longitudinal cracks on the dam crest and rapid seepage, persist in high core wall rockfill dams built after 1981. The failure modes are loosely classified into five categories: dam cracking, gallery cracking, core wall splitting, seepage around the bank near the dam area, and seepage damage at the dam base. Notably, there are no high-risk failure modes, such as dam overflow. This indicates that, over years of engineering practice, a comprehensive system for reservoir and dam safety design, construction, and management has been developed. Moreover, the current trend in hydropower development takes the form of watershed terracing, characterized by a large reservoir capacity and high flood control levels. As a result, the risk of failure modes in high dams at the 100-m level due to dam overflow or other causes is extremely low.
Dam crest cracking remains the most common failure mode (31.25%) for core wall rockfill dams over 100 m, followed by foundation gallery cracking and seepage damage around the banks. Dams built on the covering layer exhibit a notably higher failure rate compared to those built on the rock foundation. Among the 11 core wall dams that failed, only one was built on the rock foundation, while the majority of the others were built on the covering layer ranging from 30 to 100 m in thickness. On the one hand, this indicates significant progress in the global dam construction sector since 1981, particularly in the development of high core wall rockfill dams in challenging geological conditions, such as deep covering. On the other hand, as the depth of the covering layer and dam heights increase, the operational behavior of the dam becomes more complex, influenced by an expanding array of unknown factors. Covering layers are more likely to cause large deformations, seepage, uneven settlement, and shear failure, thus increasing the risk of dam failures such as cracking and gallery damage. The causes of cracks in China’s three dams, namely Pubugou, Maoergai, and Xiaolangdi, are initially identified as differences in material properties in the dam distribution areas and uneven distribution of the dam foundation covering layer.
In terms of failure timing, unlike dams built between 1940 and 1980, the majority of core wall rockfill dams constructed after 1981 exhibited large deformations during the initial storage period. Consequently, the initial storage period became the stage with a high incidence of failures, while the proportion of failures during the construction period decreased significantly. This observation suggests that effective solutions for controlling dam failure have been developed under relatively straightforward working conditions. However, there remains a pressing need for improvement in dam failure control under complex operating conditions influenced by water storage.

4. Typical Project Case Study

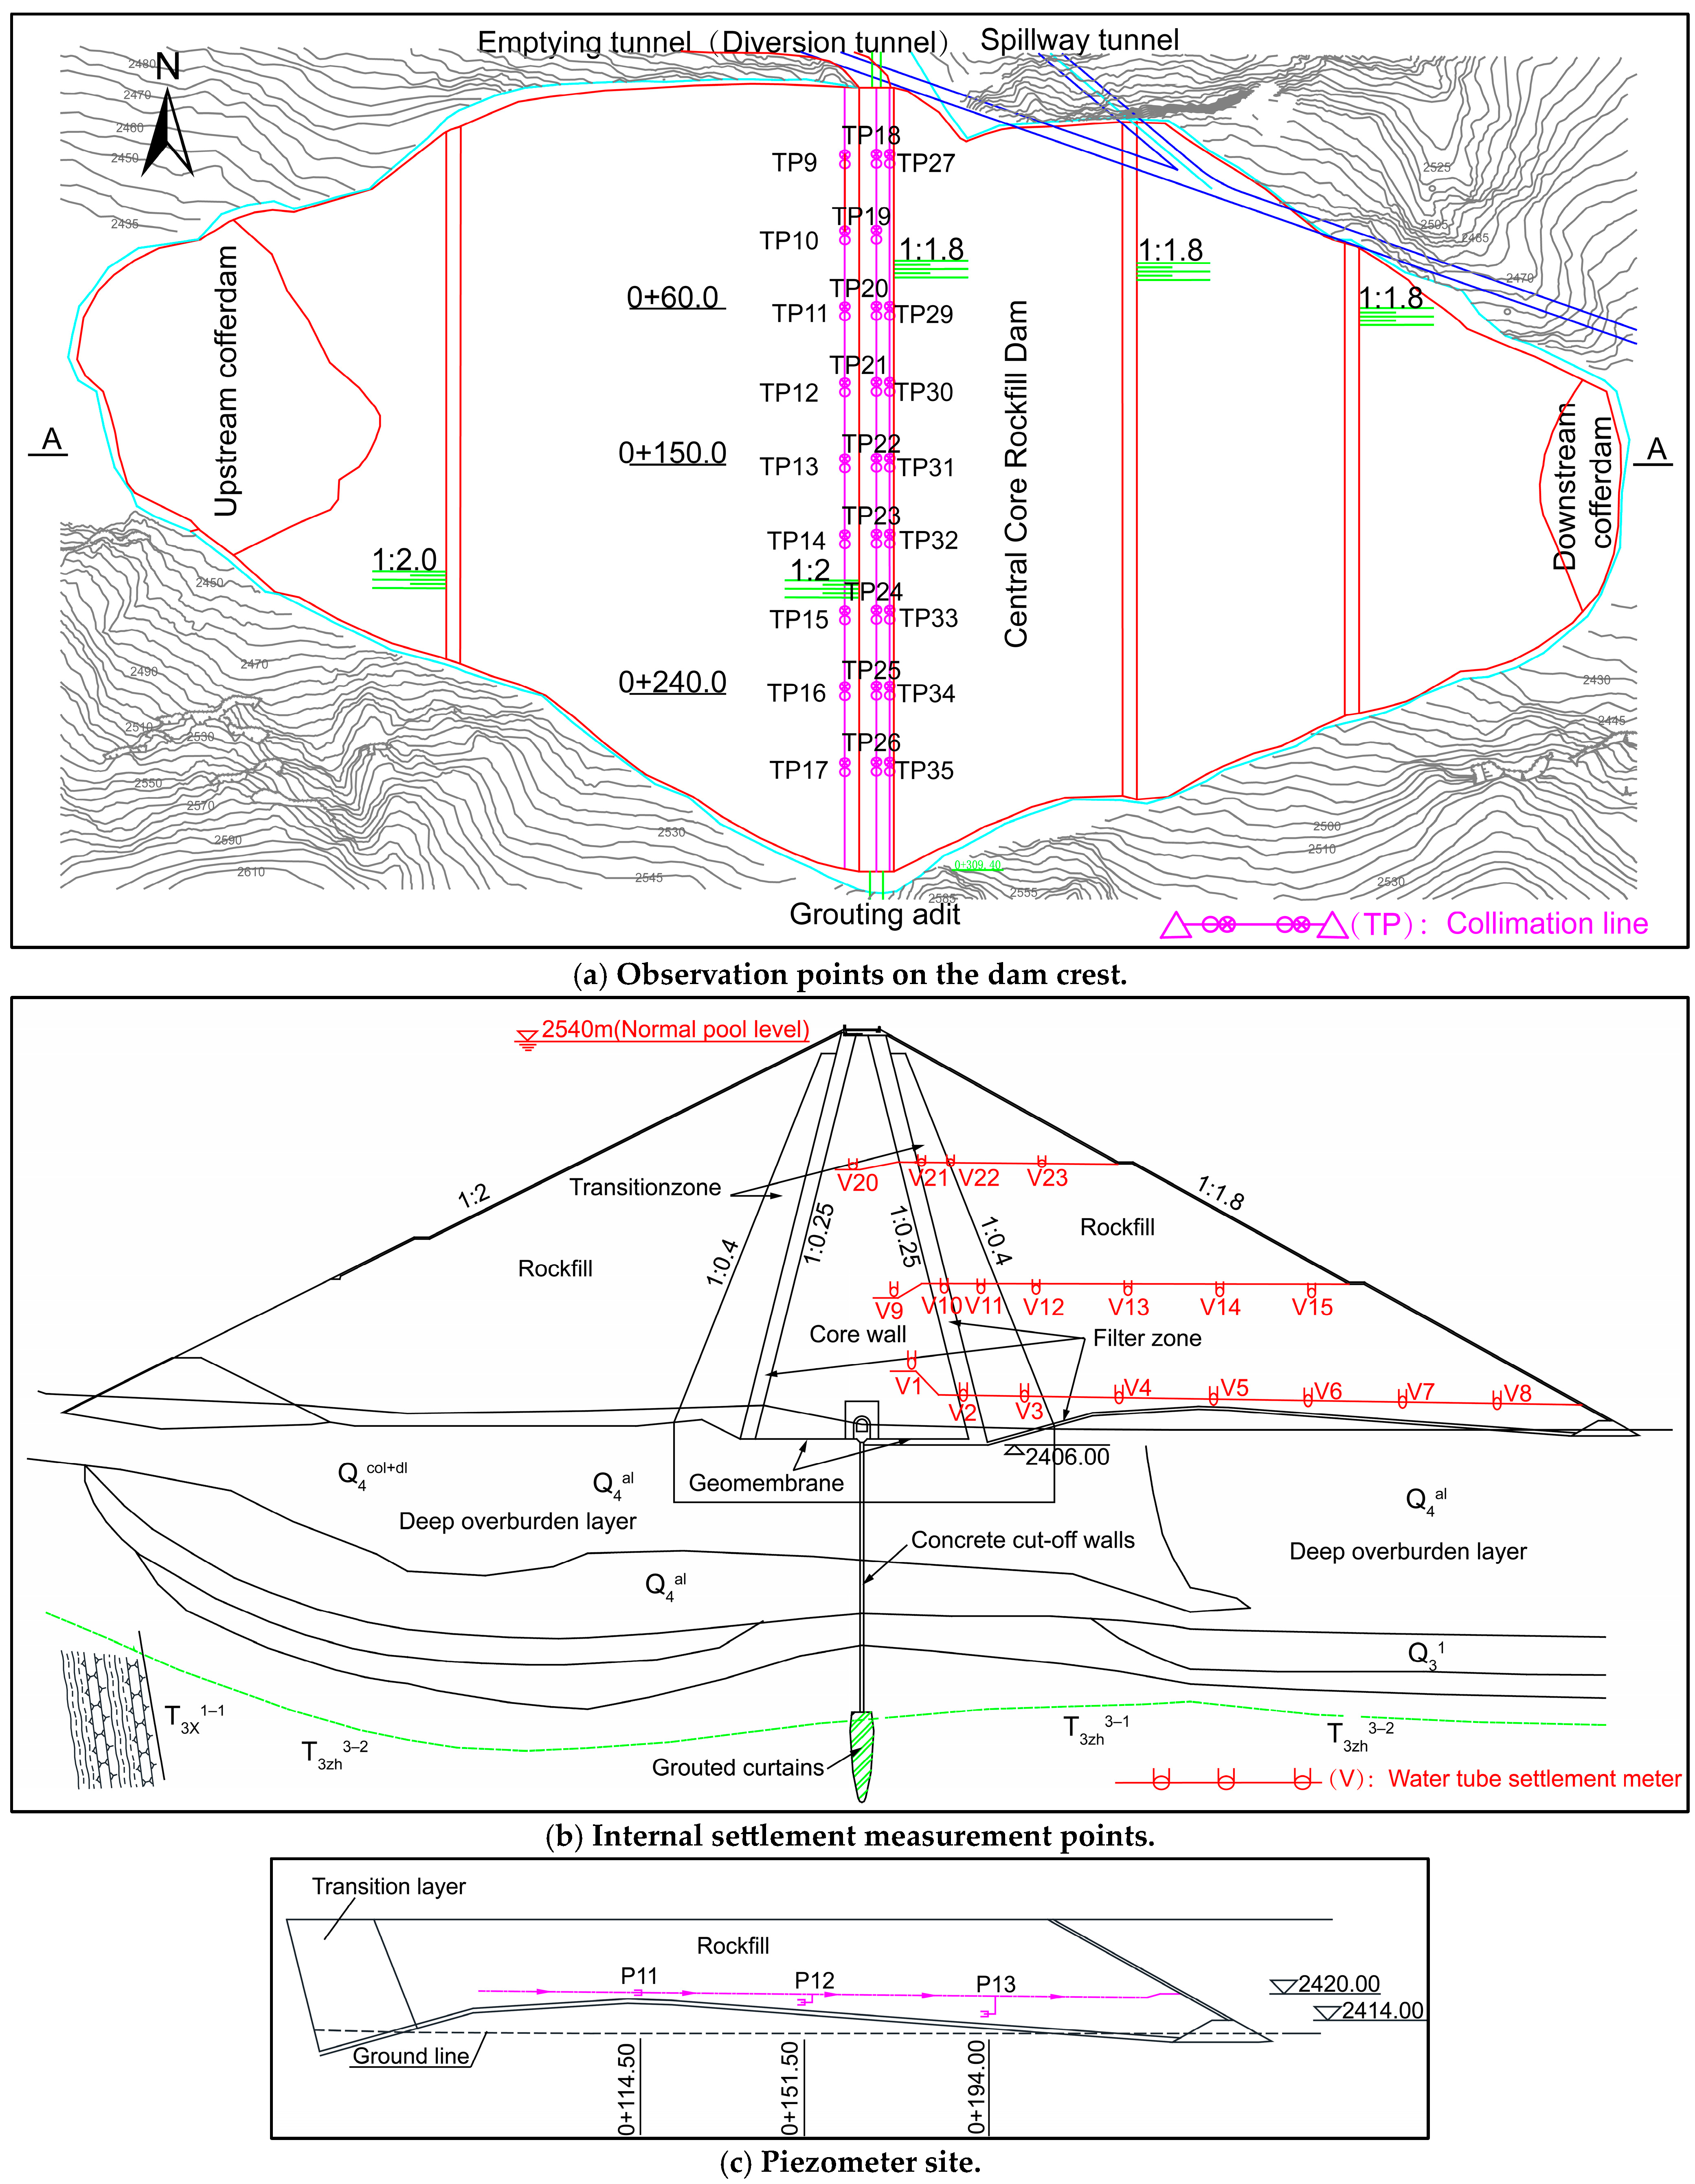
4.1. Project Overview

The 136-m-high core wall rockfill dam built in China in 2012 stands at an elevation of 2544 m, featuring a crest width of 12 m and a maximum dam height of 136 m. The upstream dam slope of the dam is 1:2.0, and the downstream dam slope is 1:1.6. The dam structure comprises four sections: the gravel soil core wall, the filter layer, the transition layer, and the rockfill area. The gravel soil core wall, positioned at an elevation of 2542 m, spans a width of 4 m. The upstream and downstream slopes of the core wall maintain a ratio of 1:0.25. The widest section of the core wall measures 71 m and reaches a bottom elevation of 2408 m. Adjacent to the core wall, there are one filter layer upstream and two downstream, each with a horizontal thickness of 4 m. Surrounding these layers are transition and dam shell materials. In order to prevent pipe surges from the soil in the dam foundation covering layer, a horizontal filter layer, 1 m thick, connects the bottom of the downstream transition layer and rockfill dam shell to the filter layer on the downstream side of the core wall.
The foundation covering layer at the dam site, concentrated in the central section of the river valley, is notably thick and relatively weak, with a depth extending up to 98 m. Characterized by a complex origin type and layered structure, its thickness varies greatly. From old to new, it is divided into five layers:
① Pebble gravel layer with sand (piece) (Q3gl+fgl). This layer constitutes a blended accumulation of glacier ice and water, situated at the riverbed’s base, typically measuring 14 to 18 m in thickness. Drift pebbles are mostly metamorphic sandstone and slate, occasionally intermixed with granite.
② Interbedded silty loam and silt fine sand (Q3l). This layer comprises lacustrine sediments located in the lower reaches of the river, exhibiting a thickness that varies from 7.81 to 8.50 m upstream and 10 to 12 m downstream. This layer is a gray or gray-yellow interlayer of silty loam and silty fine sand with a tight structure and low water permeability.
③ The ③-1 gravel layer with pieces of sandy drift (Q4al) represents an alluvial accumulation and is situated in the middle and lower reaches of the riverbed, with layer ② beneath it. The thickness of this layer ranges from 39 to 58 m. It contains six sand lenses intermittently distributed from the upper cofferdam to the lower cofferdam, consisting of coarse, medium, and fine sand. The thickness of these lenses varies from 1.16 to 4.25 m. The ③-2 gravel soil layer (Q4col+dl+al) is a composite of early collapse slope deposits and river alluvial deposits. Predominantly located on both sides of the Zagunao River, its thickness exhibits significant variations. It was created at the same time as layer ③-1 and interacts with the deposition of the latter. Slate and sandstone make up the crushed gravel, and sandstone makes up the block stone. This layer’s structure is unevenly distributed, with local coarse particles and local fine particles concentrated.
④ Sand layer with gravel and silty loam layer (Q4al). This alluvial accumulation layer is distributed in the upper part of the riverbed and extensively blankets the river valley. This layer contains pebble gravel lenses that are about 10 m thick or less.
⑤ Gravel layer with floating pebbles (Q4al). This layer is a modern riverbed alluvial accumulation distributed on the surface of the riverbed, with a thickness ranging from 3 to 7 m. The drift gravel is mostly metamorphic sandstone, with a medium-fine sand filling and a loose structure.
Among them, layers ①, ③, and ⑤ consist primarily of coarse-grained soil with high water permeability. Layer ②, consisting of silty loam and silty fine sand, exhibits low water permeability and local water barrier properties. However, its thin thickness and short extension distance to the upstream prevent it from forming a reliable relative waterproof layer beneath the dam foundation. Layer ④, which contains crushed gravel silt with low compressive modulus and shear strength, is detrimental to the stability and deformation of the dam body. Therefore, it is strengthened by vibrations and percussions at depths ranging 8 to 15 m.
The reservoir’s normal water storage level is set at 2540 m, with a capacity of 132.7 million m3. The dead water level is at 2460 m, and the verified flood level reaches 2541.09 m. On 21 September 2009, the first phase of the project began with water storage. By 11 October 2009, the water storage had reached 2490 m, and the first phase of water storage had been completed in its entirety. On 1 September 2012, the second phase of water storage began, and on 17 October 2017, the first water storage reached the normal water level of 2540 m.

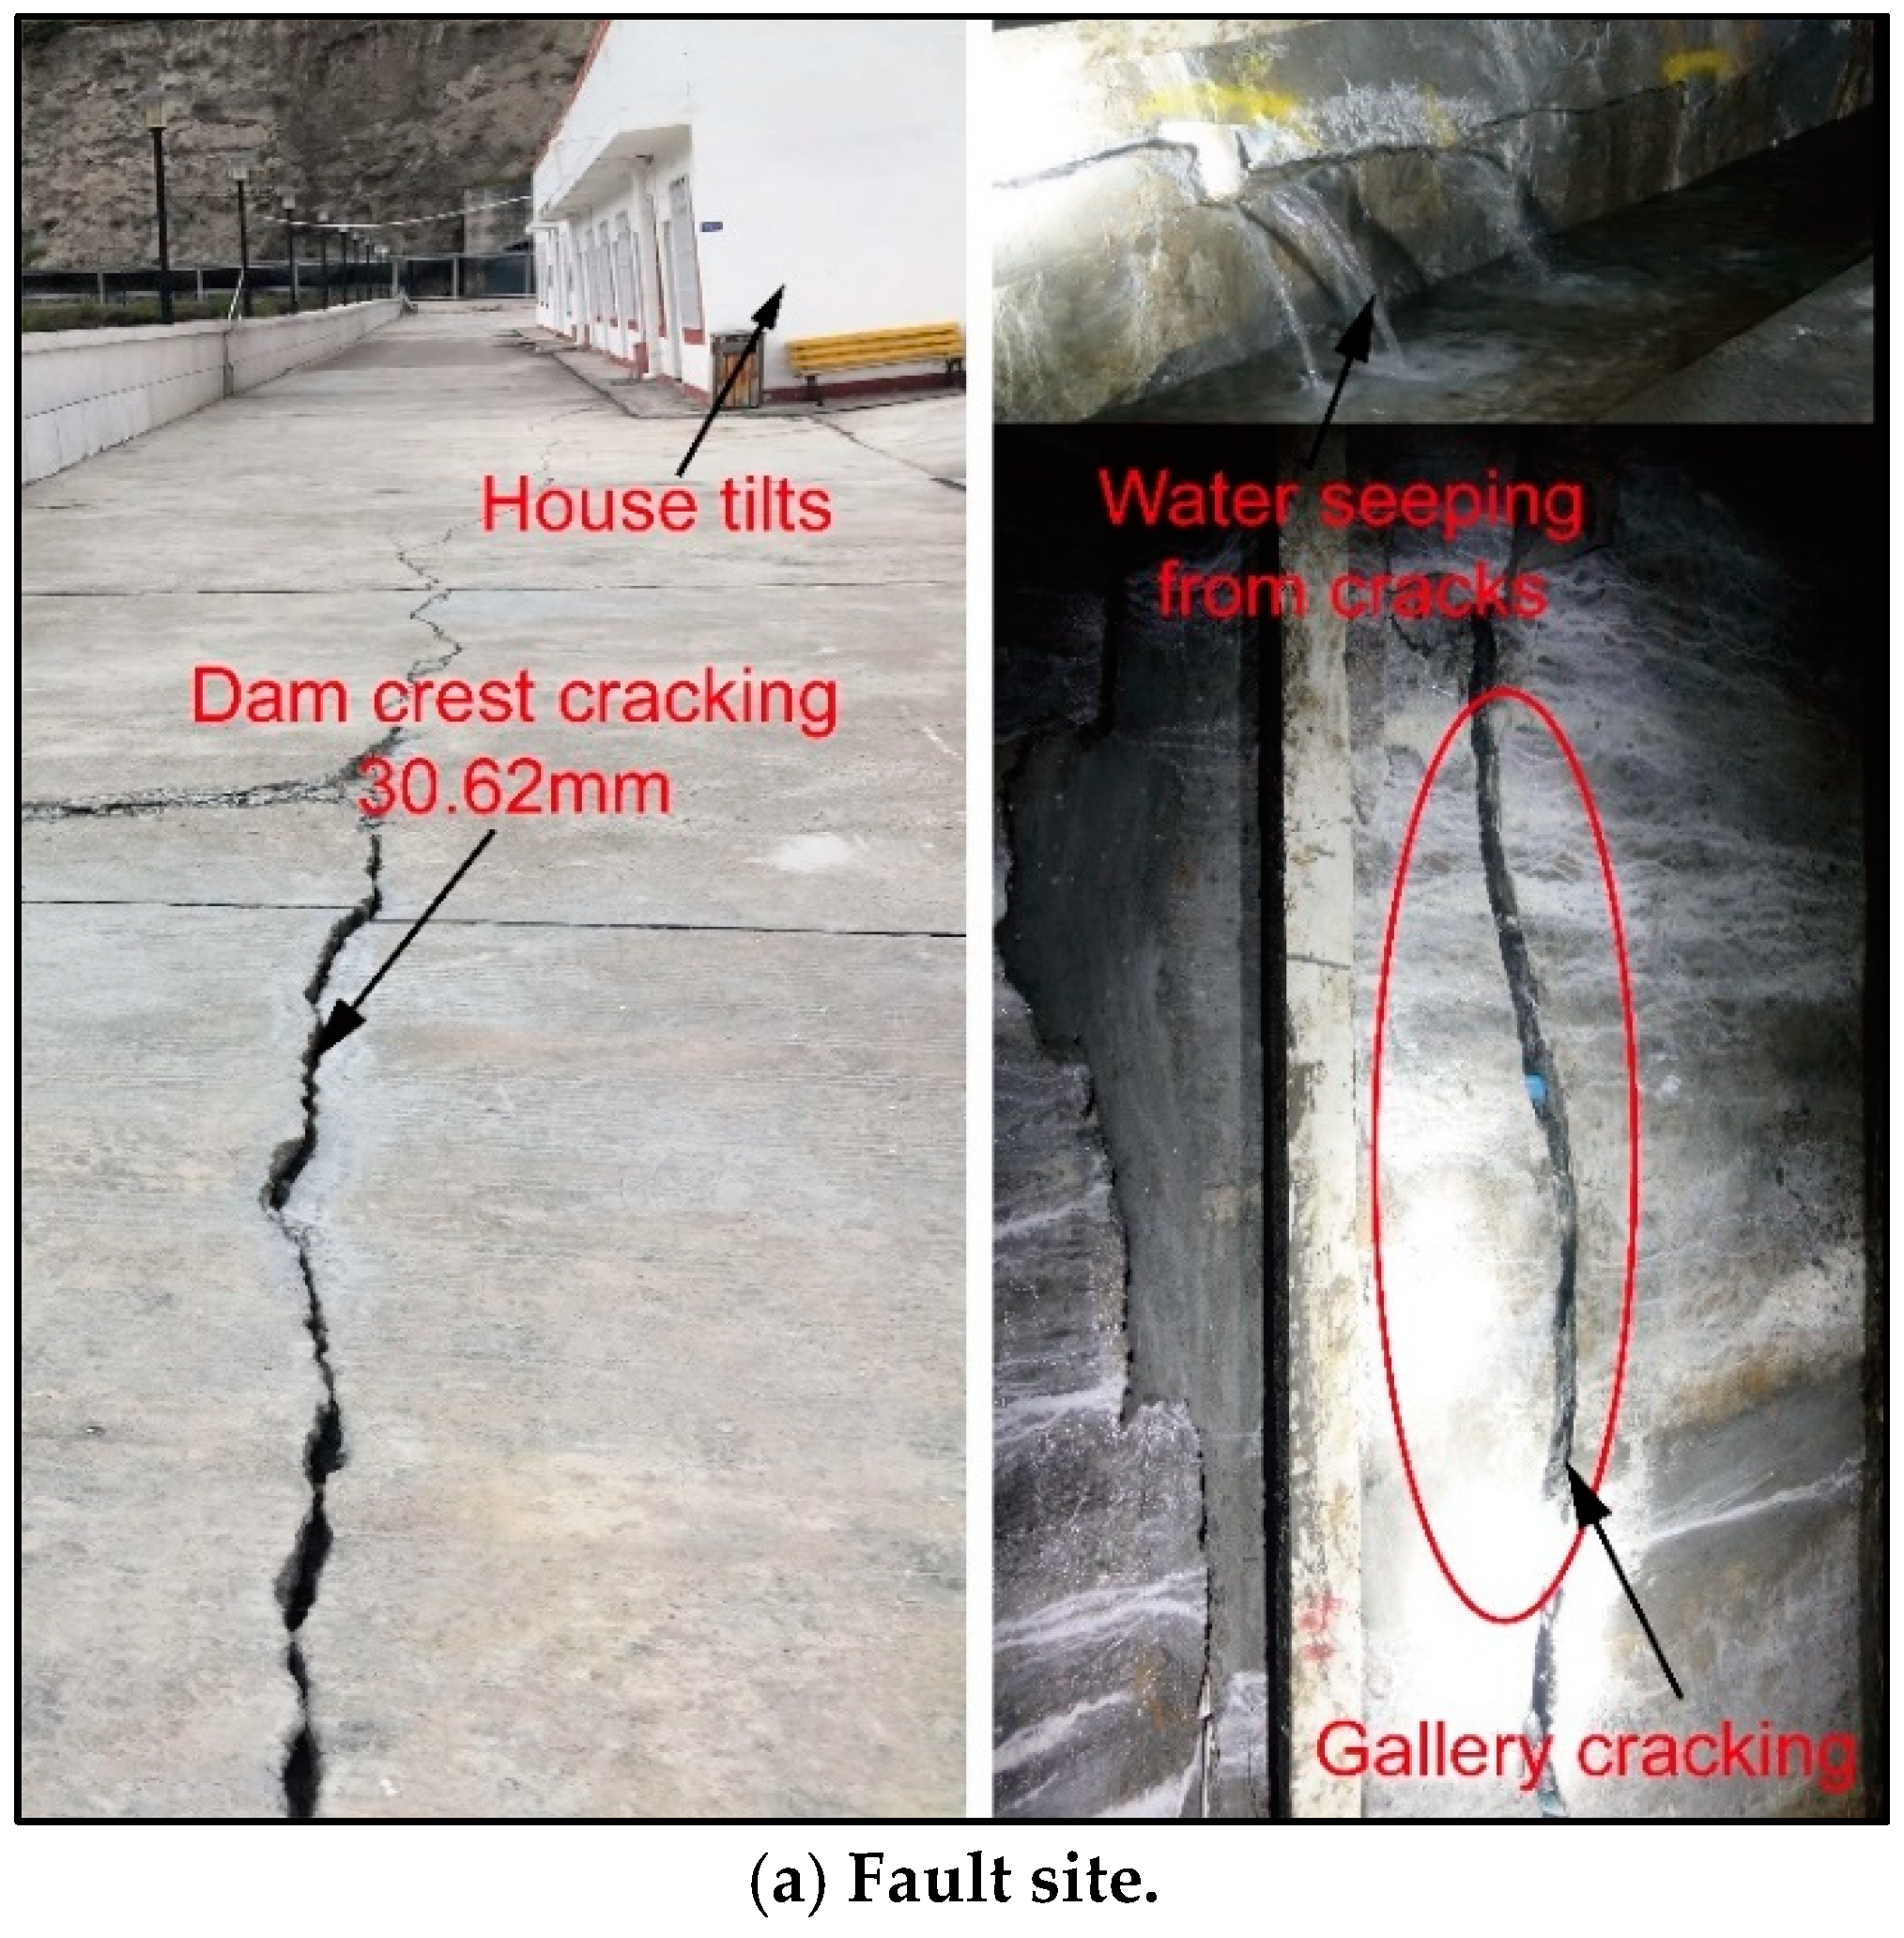
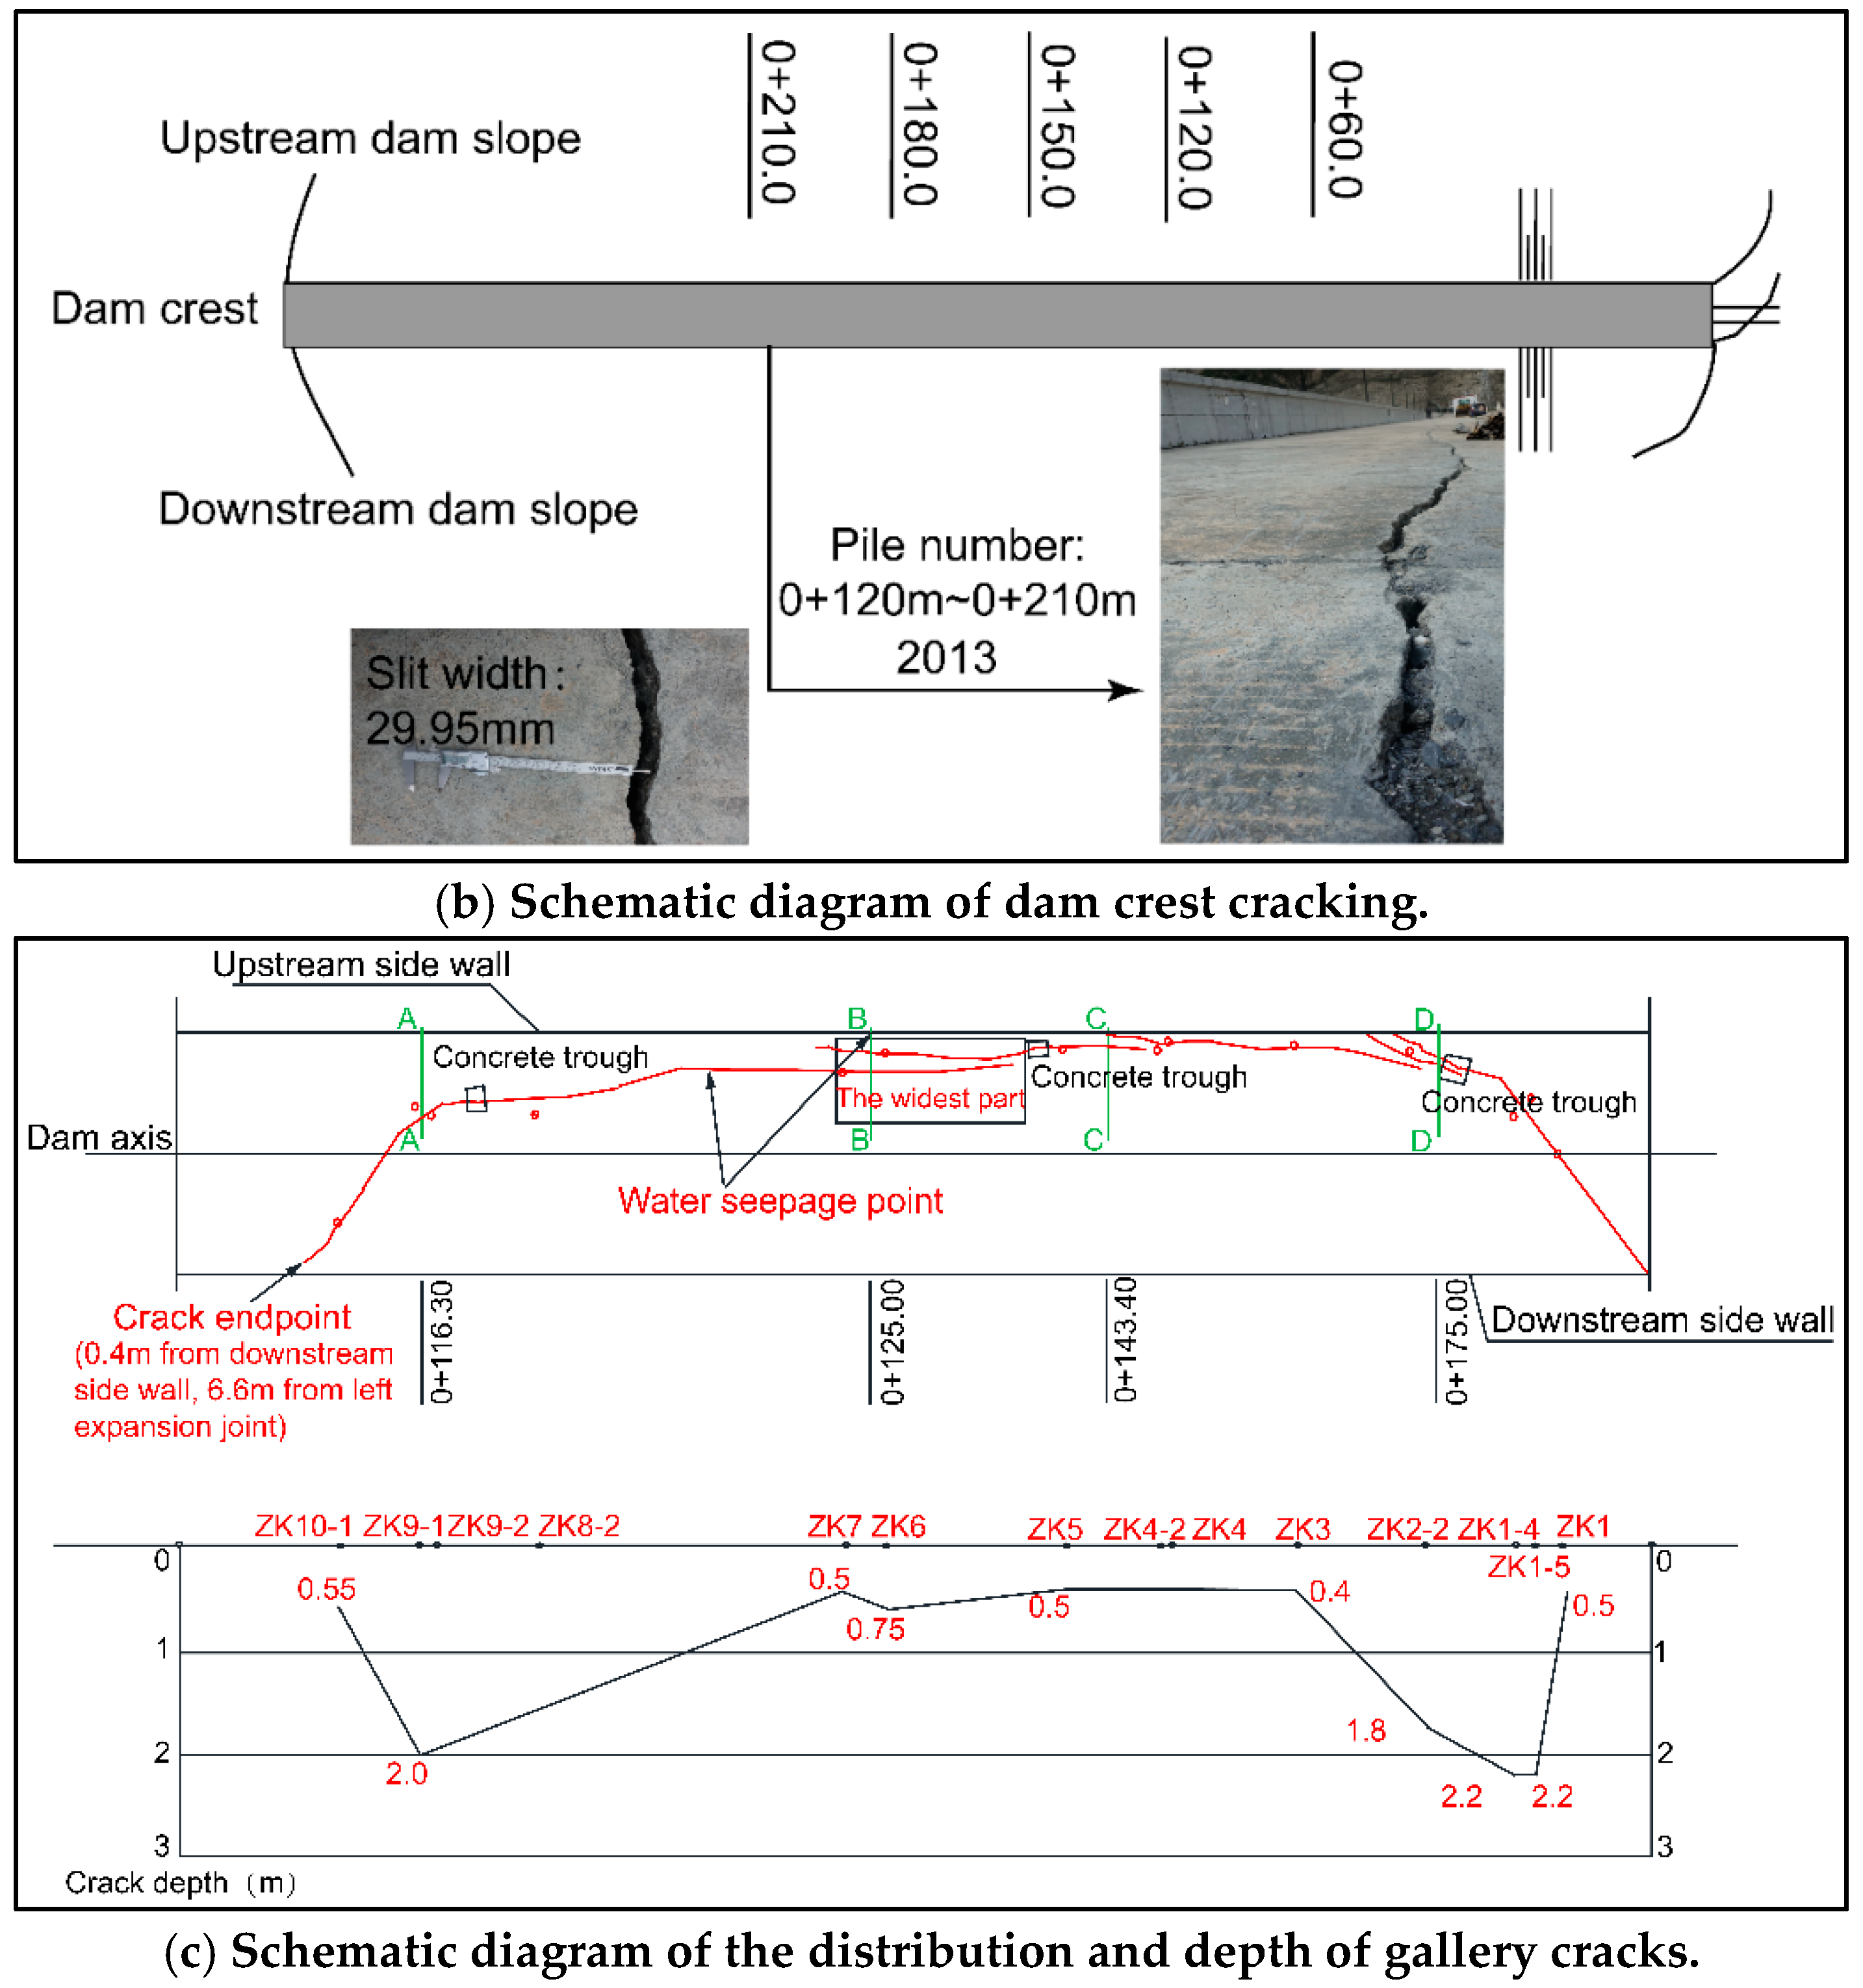
4.2. Situation of Failure Development

As shown in Figure 6, three typical failures have emerged since the commencement of dam operations: dam crest cracking, gallery cracking, and high-level water seepage in the dam body.
Deformations and seepage have increased significantly since the second phase of water impoundment began in September 2012. By early October 2013, when the reservoir reached the elevation of EL2536 m, nearing its normal water storage level, extensive longitudinal cracks were observed on the downstream side of the dam crest, and water seepage appeared in the observation room on the uppermost floor of the downstream horse trail.
On 12 May 2008, a strong earthquake with a magnitude of 8 struck Wenchuan County in Sichuan Province, China, with the dam situated a mere 55 km away. During the inspection for earthquake damage on 6 August, cracks were detected in the bottom plate of the riverbed gallery at the elevation of EL2410.5 m of the dam. Subsequent design scrutiny concluded that these cracks had inflicted structural damage upon the gallery.

4.3. Methods of Analysis

This study examines the causes and influencing factors of dam failures by analyzing the monitoring data, combining finite element simulation results, and comparing dam designs.
To monitor the external deformation of the dam crest, nine displacement markers were installed at the dam’s surface elevation of 2542 m upstream of the dam, along the dam crest axis, and downstream of the dam crest, parallel to the dam axis. The layout is shown in Figure 7a. The internal deformation of the dam was monitored using water pipe settlement meters installed at typical profile elevations of 2420 m, 2460 m, and 2505 m (Figure 7b). The inclination index is primarily used to analyze deformations, and the calculation formula for inclination is
γ = S A S B Δ y = tan δ y
where γ is the calculated inclination; SA and SB are the cumulative settlements measured at a certain calculation date Tj for points A and B, respectively; Δ y is the horizontal distance between points A and B along the river; and δ y is the angle between the line of the settlement point and the horizontal plane.
To monitor seepage from the dam slope, three piezometers were installed in the downstream rockfill area to monitor the seepage pressure at the dam base (Figure 7c). Additionally, the seepage volume of the dam was automatically measured using the seepage meter located at the water measuring weir in the drainage ditch at the dam’s downstream foot.
Finite element simulation was carried out using the FLAC3d secondary development interface. The development integrates the improved Duncan–Zhang model, the Shen Zhujiang creep model, and the Shen Zhujiang three-parameter wetting model. The improvement of the Duncan–Zhang model mainly increases the simulation of shear expansion deformation. When the stress level is less than 0.7, the Duncan–Zhang model is employed to calculate volumetric deformation in coarse-grained soil. When the stress level exceeds 0.7 and the curve relationship indicates the presence of inflection points, the volumetric modulus is calculated using the Rowe shear expansion equation, as shown in Equation (2).
B t n = E t 3 1 σ 3 / σ 1 R l σ 3 / σ 1 lim
where Et is tangent deformation modulus; σ 1 is large principal stresses; σ 3 is minor principal stresses; and Rl is the limiting stress ratio, which is the ratio of the difference in principal stresses at the time of soil damage to its ultimate value.
The simulation process follows the actual construction sequence and water storage arrangement. Initially, the first level involves the initial ground stress calculation of both the bedrock and covering layer. Levels 2–21 simulate construction up to an elevation of 2506 m, and the first phase of levels 22–23 involves water storage up to an elevation of 2490 m. Following this, levels 24–32 encompass construction up to an elevation of 2544 m, followed by water storage to the normal level of 2540 m. The model is shown in Figure 8.
The bedrock is assumed to be a linear elastic material with an elastic modulus of E = 25 GPa and a Poisson’s ratio of 0.17. The Duncan E-B nonlinear model is used to calculate soil and rock material. Table 3 shows the dam’s material strength index and model calculation parameters, while Table 4 shows the creep model parameters. The wetting model parameters for the upstream rockfill material are Cw = 0.00017, nw = 1.38, and dw = 0.00008.

4.4. Failure Analysis

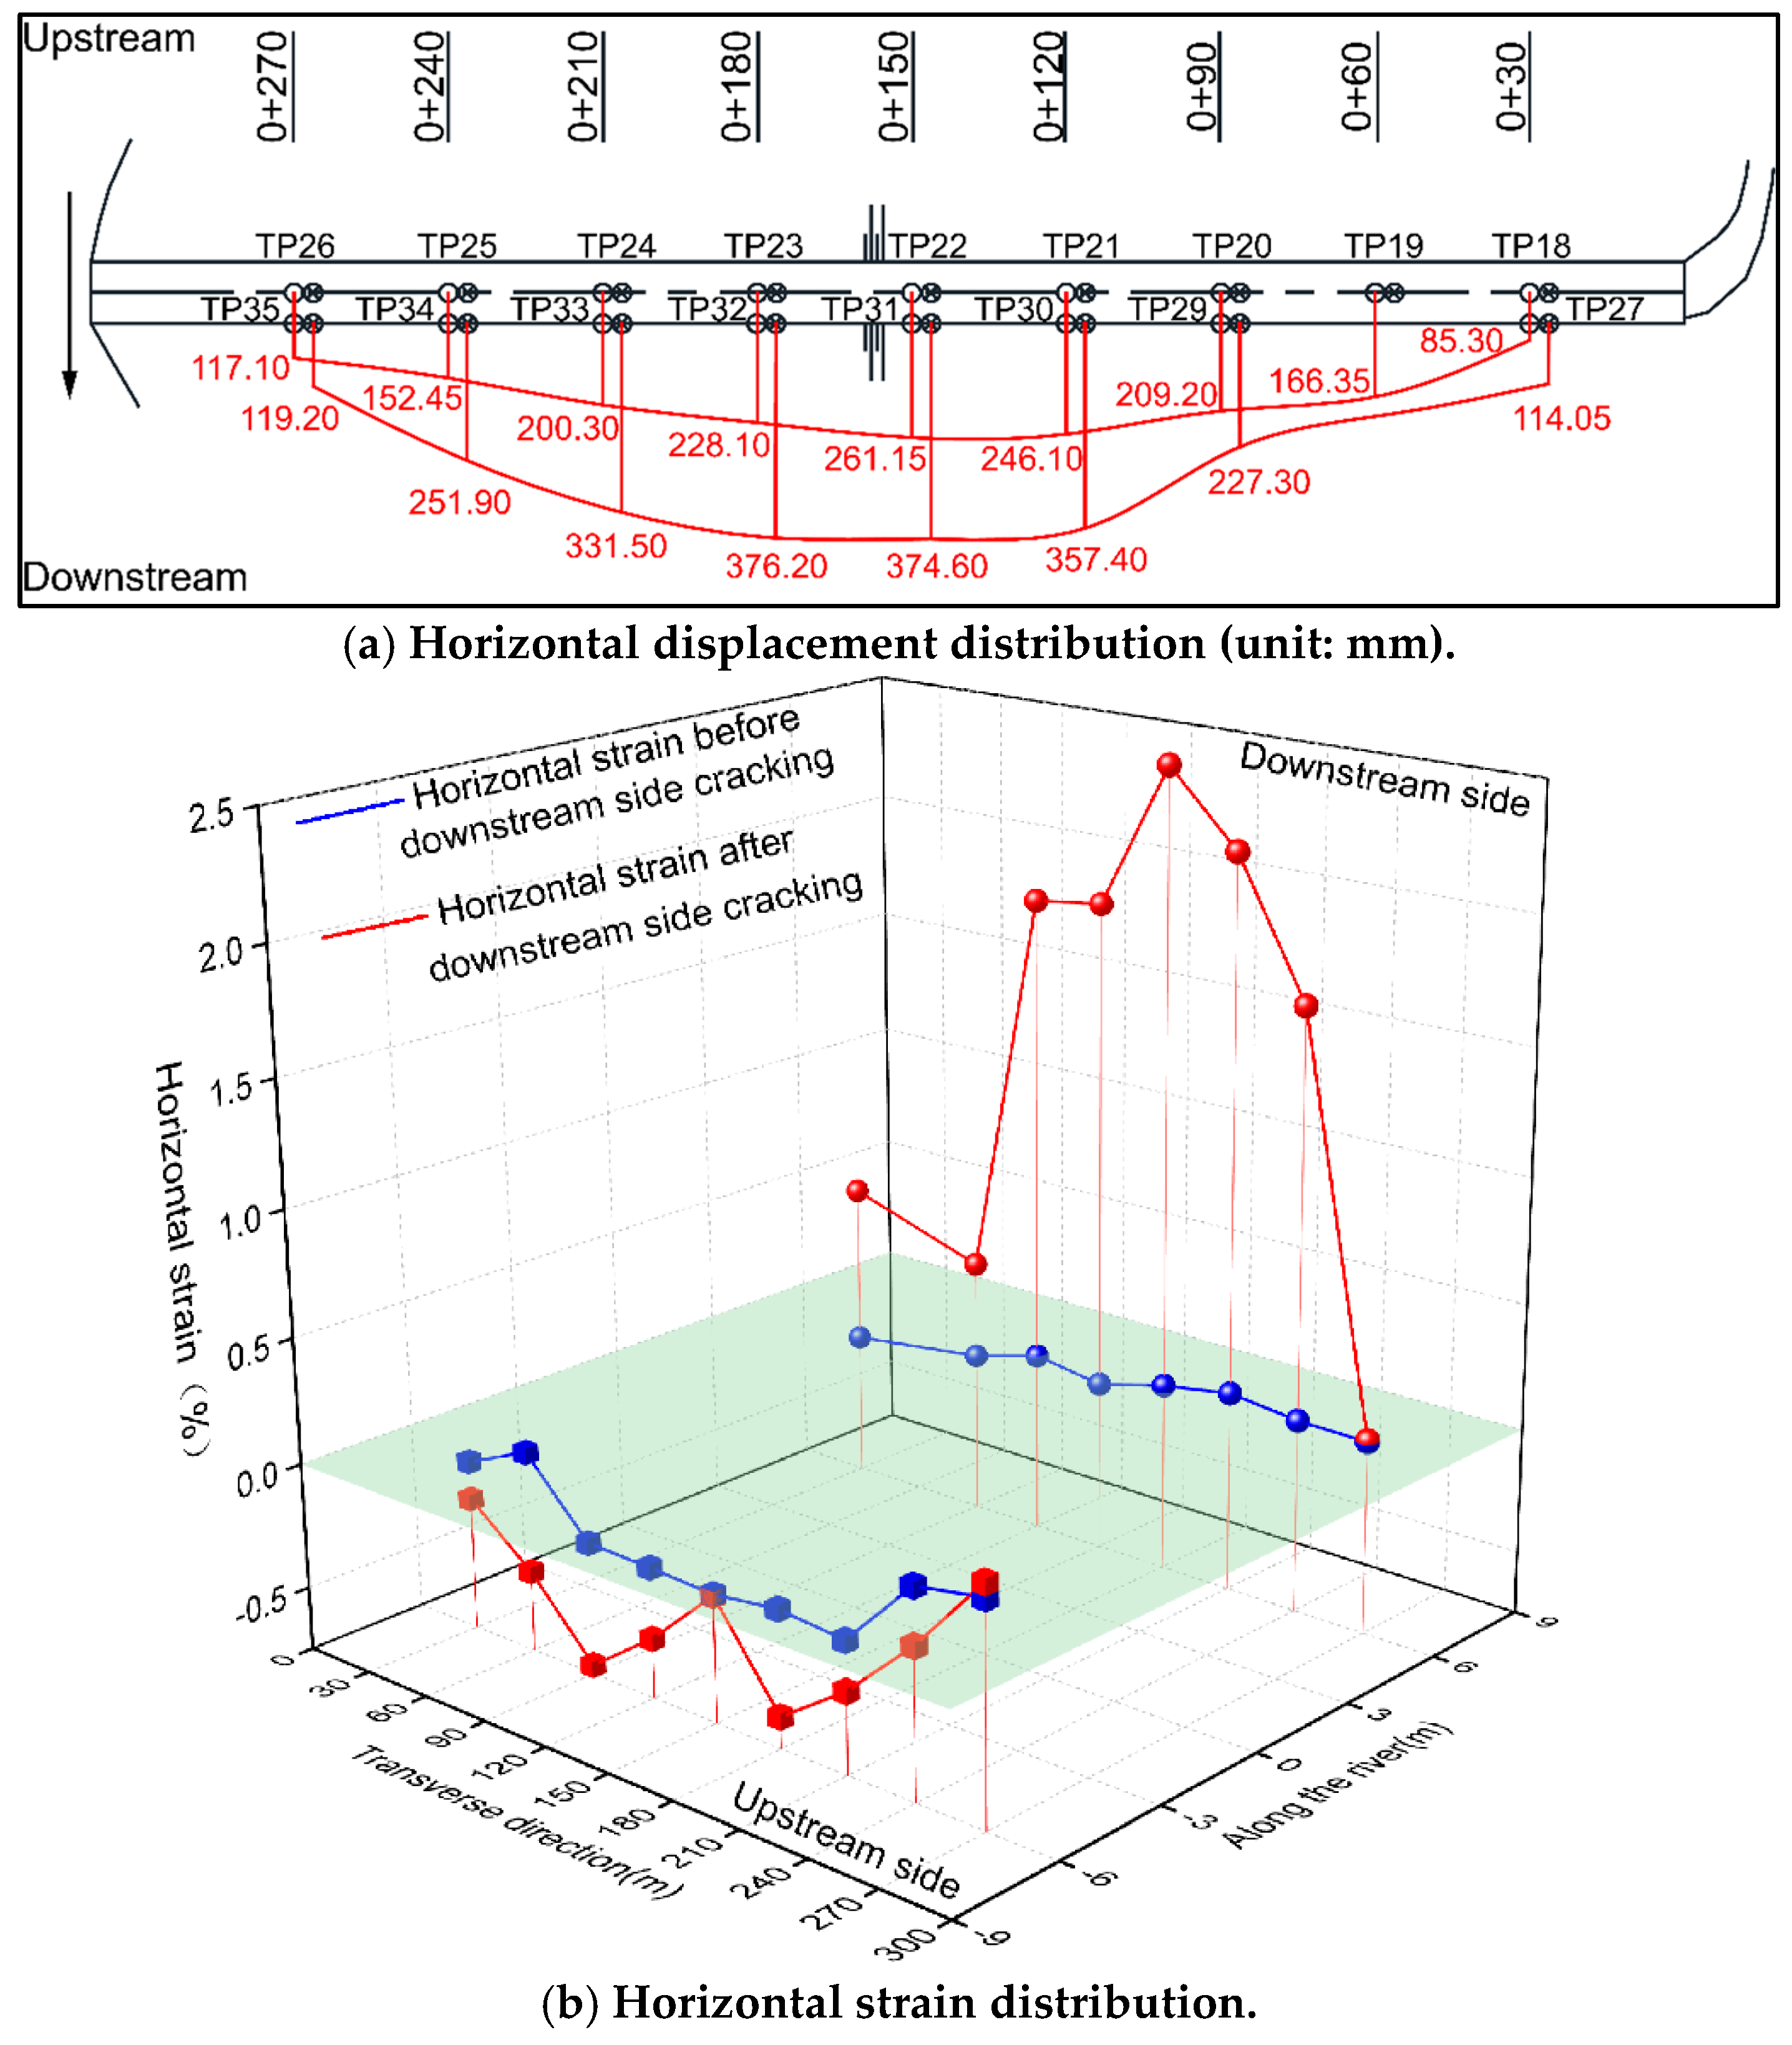
4.4.1. Dam Crest Cracking Study

Uneven Deformation

The monitoring data indicate that dam crest cracking is related to the uneven deformation of the dam. Figure 9a shows the coaxial spatial displacement of a typical dam section over time. The settlement deformation of the dam crest decreases from upstream to downstream along the river, with a significant difference, reaching a maximum of 347.95 mm between adjacent measurement points. The dam gradually increases in the axial direction from both banks towards the riverbed, with the left and right banks showing relatively symmetrical distributions. There is a noticeable uneven deformation between the dam’s upstream and downstream crests, which increases over time. Figure 9b shows the inclination distribution of subsidence deformation along the river as cracks emerged. It is observed that the inclination of settlement deformation along the river on the downstream side of the dam crest is larger in the riverbed bar section, with pile numbers 0 + 120 m to 0 + 210 m. This inclination decreases from the riverbed bar section towards both banks and gradually increases from upstream to downstream. When cracks were detected on October 2013, they corresponded to uneven riverside settlement deformation inclinations ranging from 3.29% to 3.79% in the range between 0 + 120 m and 0 + 210 m.
Figure 10a shows the deformation characteristics of the horizontal displacement of the dam crest in the downstream direction for each dam section during cracking. It is evident that the overall manifestation of horizontal displacement of the dam crest along the river takes the form of an arc deformation downstream. Within the same cross-section, the downstream exhibits greater displacement along the river than the dam axis, with the maximum deformation difference occurring at the riverbed and gradually decreasing towards both banks. Figure 10b shows the calculated horizontal strain distribution along the river. The areas with high tensile stress are primarily located within the range of 0 + 120 m to 0 + 210 m, corresponding to the downstream longitudinal cracks, which is generally consistent with the spatial distribution of the cracks.
Figure 11 shows the internal settlement changes for the typical section EL2460 m. It is clear that uneven deformation within the dam’s low elevation began during the construction period and continued during the initial storage period. During the first phase of water impoundment, the deformation difference between adjacent measuring points ranged from 30 mm to 367 mm, gradually increasing over time. By the time the dam crest cracked in 2013, the deformation difference between adjacent measuring points had reached a maximum of 574.2 mm.
A comprehensive analysis is conducted in connection with the finite element simulation of the deformation inclination calculation results for dam internal parts (Figure 12). The deformation inclination of uneven settlement between the downstream rockfill and the core wall primarily occurs during the construction phase. Due to the steep bank slope, the dam will undergo large shear deformation along that direction, forming a strong shear zone at the base of the adjacent rockfill and core wall. Within a certain width along the dam slope, the finite element calculation yields a deformation inclination value more than 1.6%, and the measured value exceeds 1.82%. The large modulus difference between the dam shell rockfill material and the core wall causes large uneven settlement along the river, leading to more severe miscut deformation. The deformation inclination is larger in the downstream contact area between the dam shell rockfill material and the core wall, with a finite element maximum of around 3%.
This is currently the main issue with rockfill dams. Since the shear zone or miscut deformation occurs within the high compressive stress-bearing interior of the dam, and because the rockfill is a bulk material, internal cracks will not form. However, if it is transmitted to the dam crest as the uneven settlement increases, transverse cracking deformation caused by uneven deformation of the left and right banks or longitudinal cracking deformation caused by uneven deformation of the upstream and downstream banks will develop. At the same time, the combined effect of tensile stress and shear caused by uneven horizontal deformation upstream and downstream will further exacerbate the development of cracks.

Material Influence

Figure 13 compares the settlement differences between measured values at the dam crest and calculated results using both the original and back analysis parameters. The calculated settlement based on the original parameters is about 147.35~370.65 mm lower than the actual measured values. This significant discrepancy fails to accurately reflect the actual deformation process of the dam. In contrast, the back analysis calculation produced results that closely matched the trends observed in the measured values. The average relative error for deformation at the TP13 and TP31 measuring points is 14.06% and 7.00%, respectively, which are within acceptable limits. Compared to the calculated results using the original parameters, the error between the results of the back analysis parameters and the measured values is reduced by 44% to 47.6%. This difference mainly originates from the weakening of the strength of the upstream rockfill, which is weakened by 15% by the finite element simulation for the internal friction angle of the upstream rockfill. According to the construction situation analysis, due to a lack of quarry sites for dam filling, different material sources are used to mix and fill in a ratio of at least 1:1, with some sites requiring only mixed materials. As a result, the quality of the mixed materials is difficult to control, and the properties of the dam material are uneven, resulting in a decrease in the mechanical properties of the rockfill material.
To address uneven deformation, the design will incorporate strict design criteria and improve dam construction materials, such as core wall soil mixed with gravel to enhance compressive strength. However, in practice, it is crucial to strictly control construction quality, optimize the quarry mining program, and rigorously manage the grading of rockfill materials and dam filling construction quality to prevent uneven settlement caused by inconsistent filling.

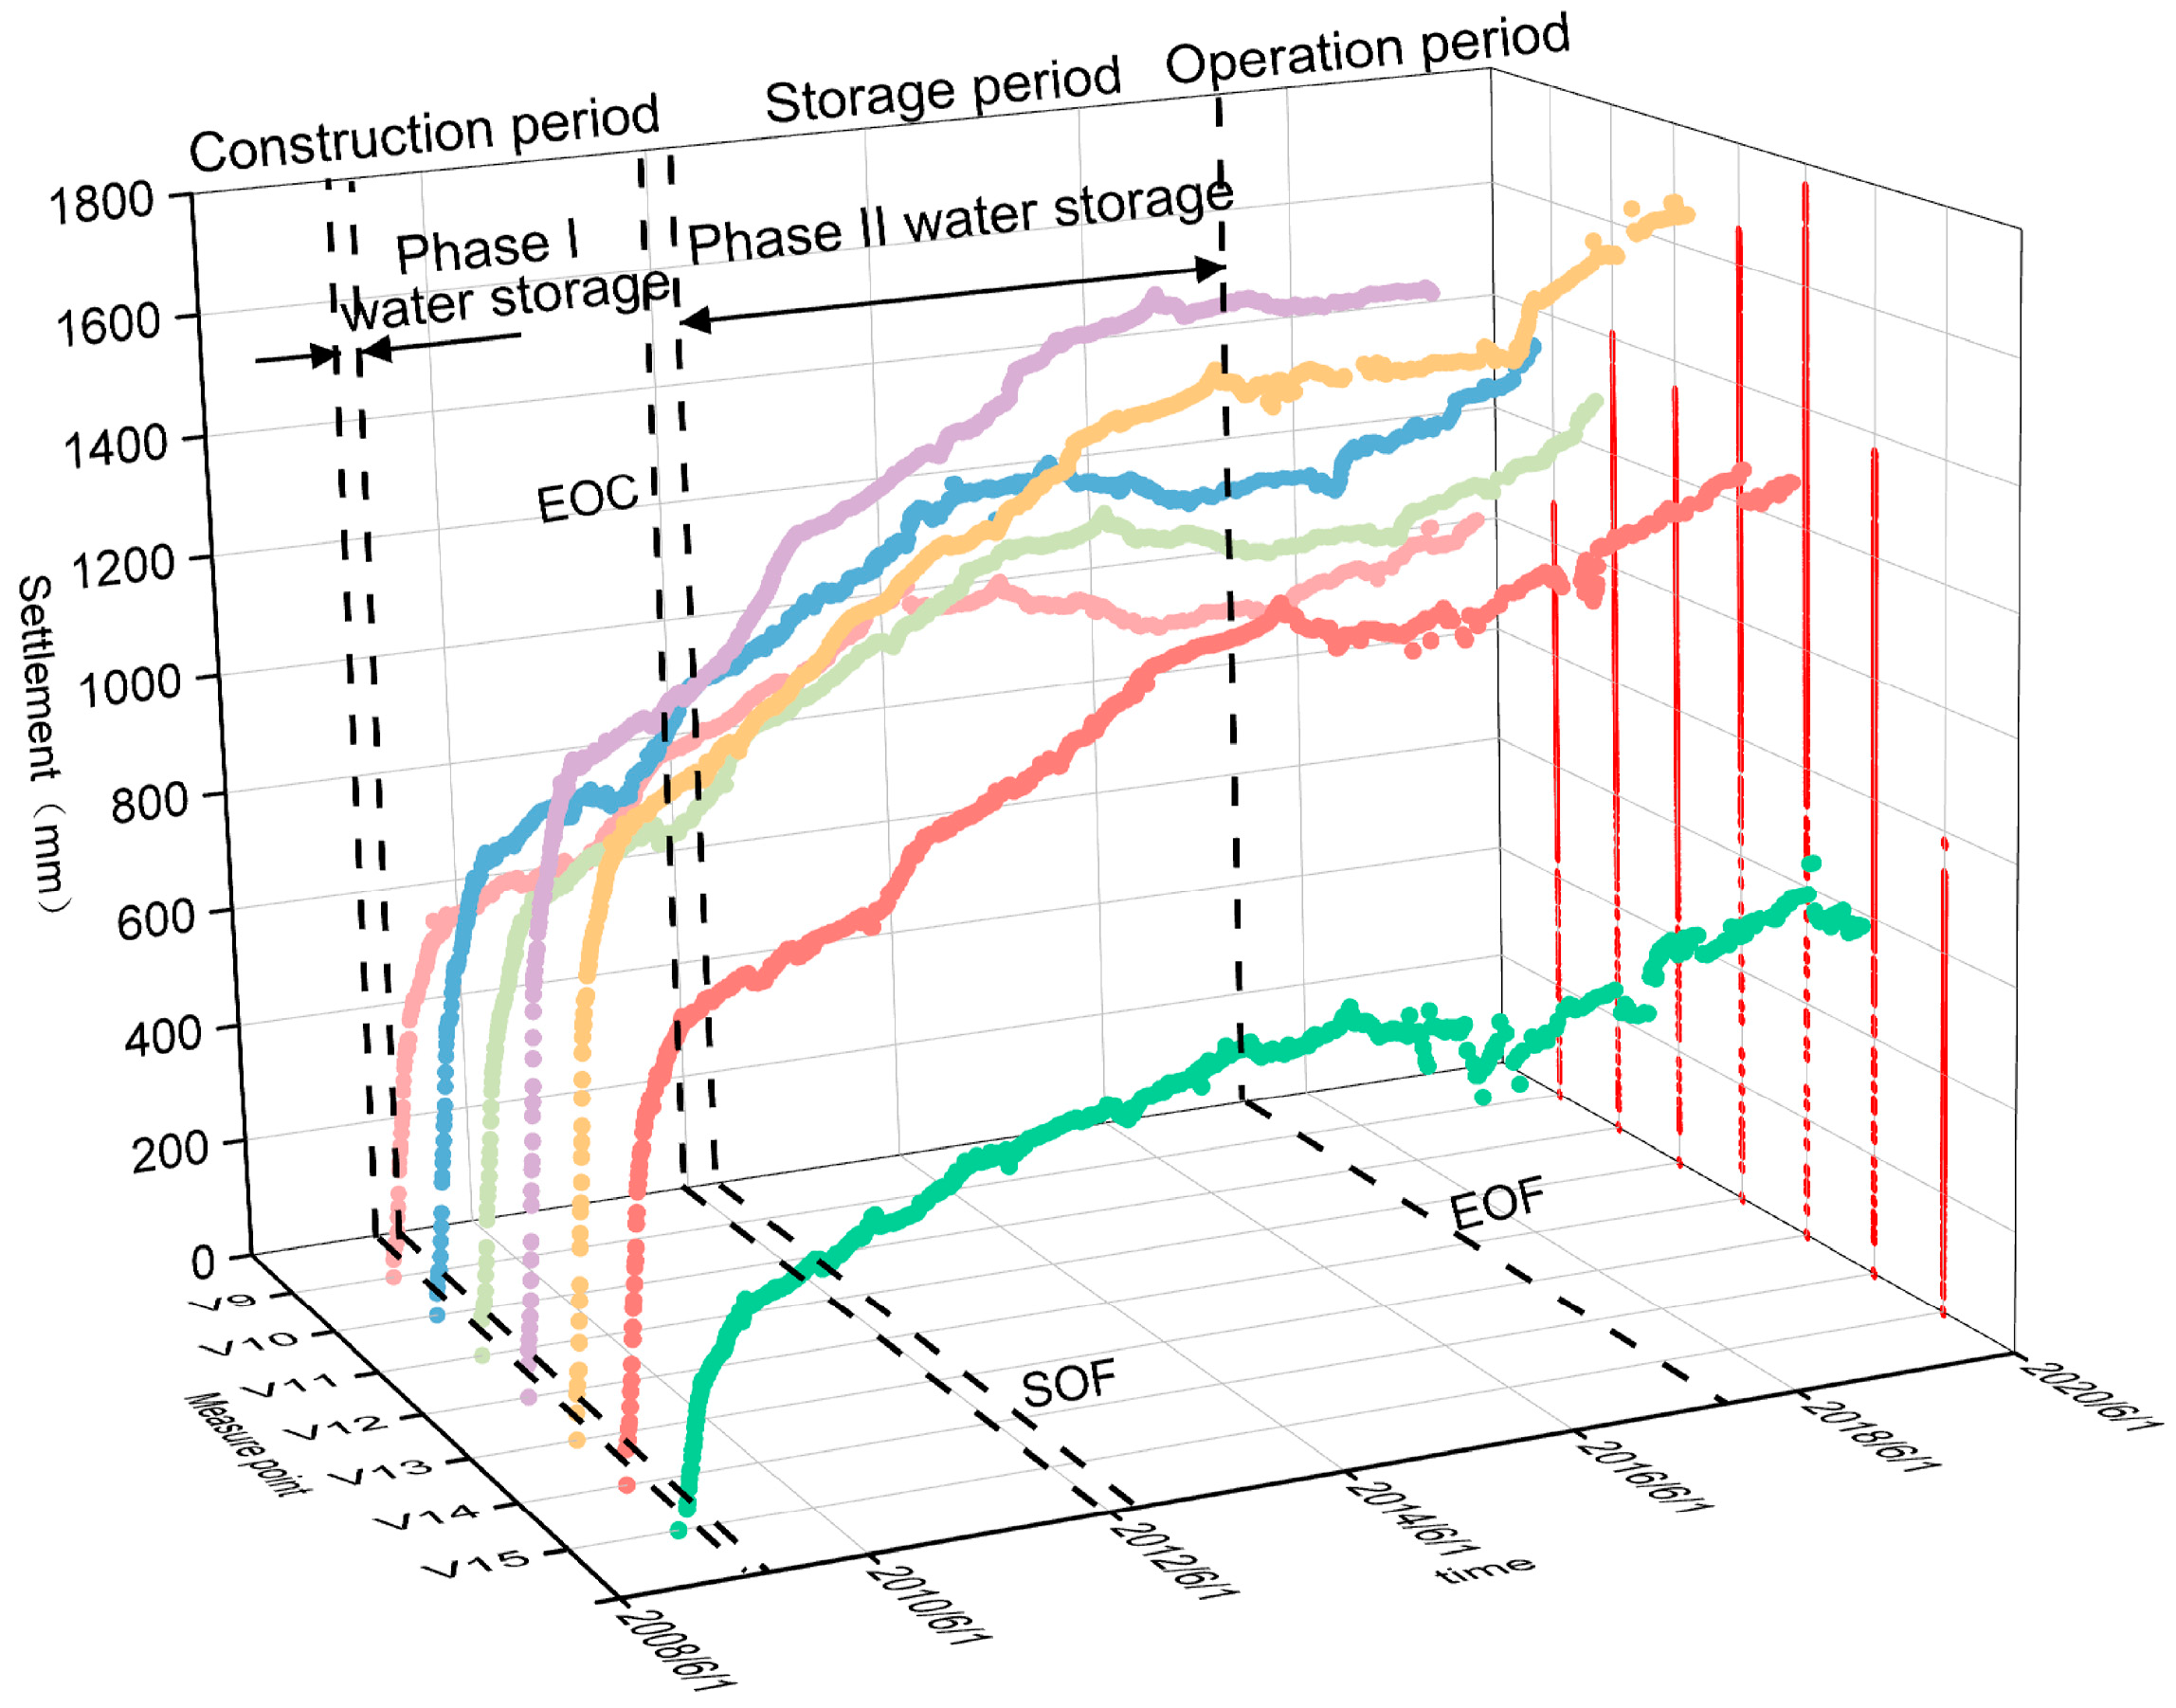
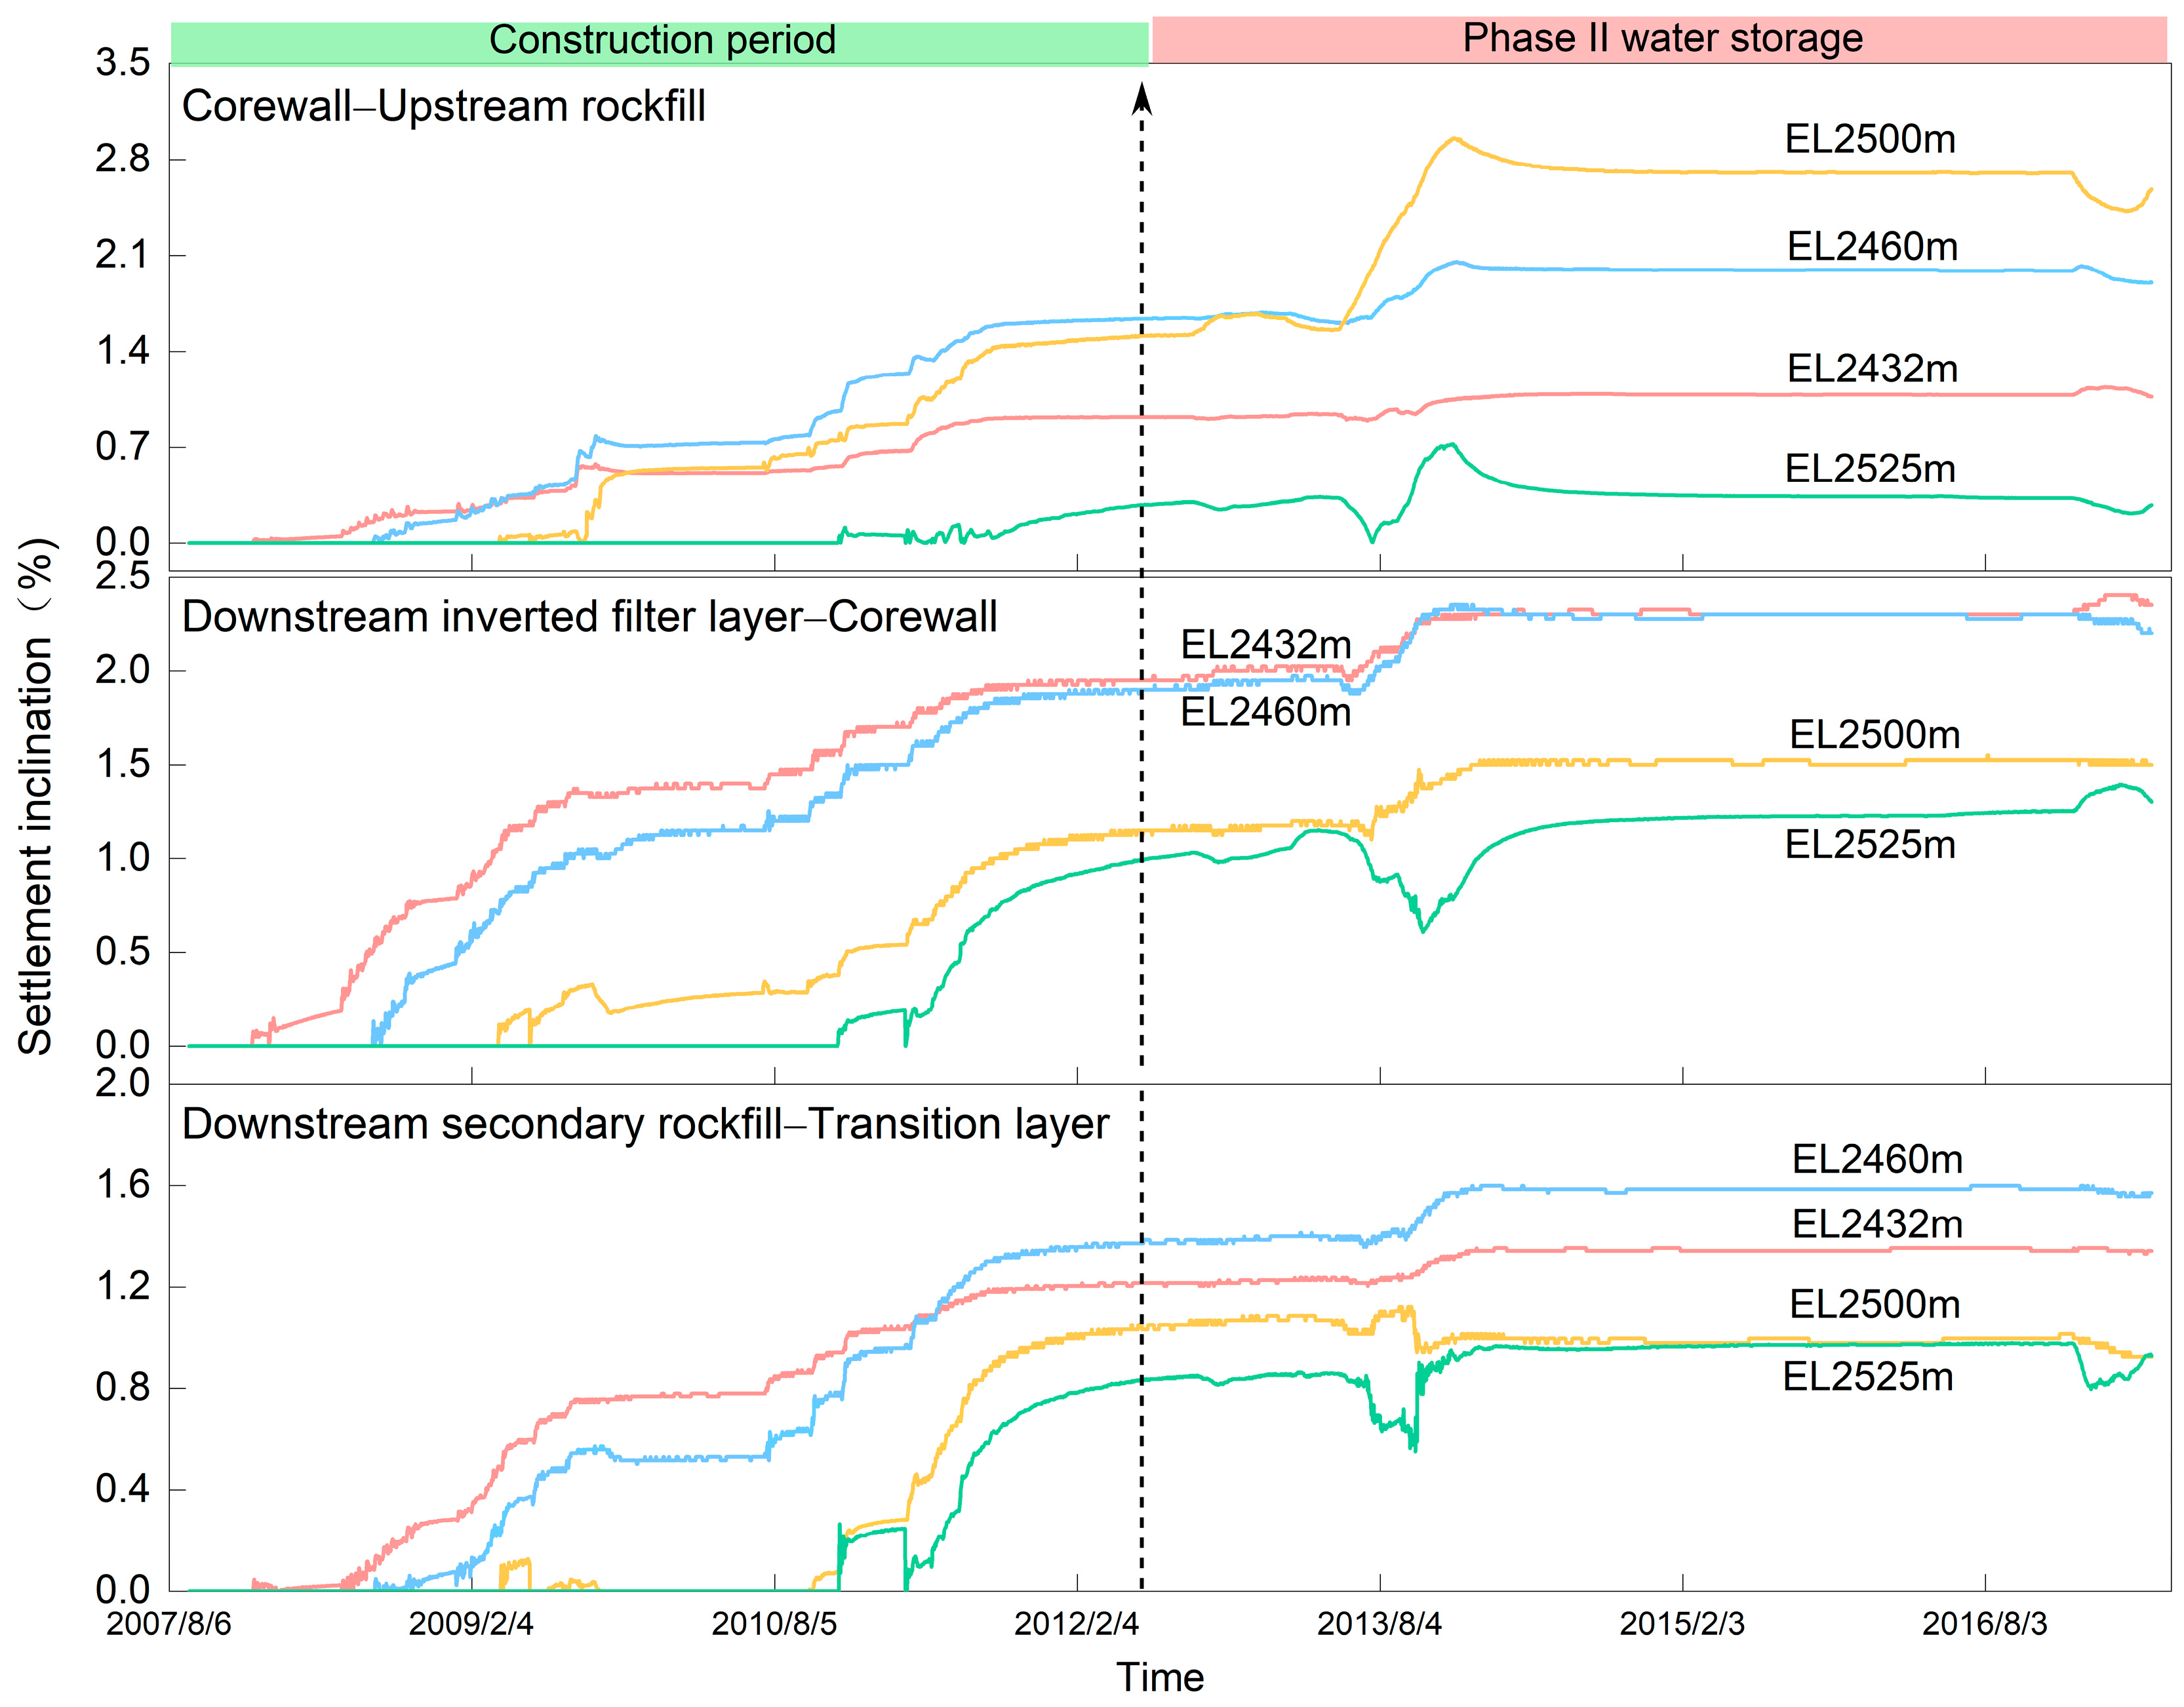
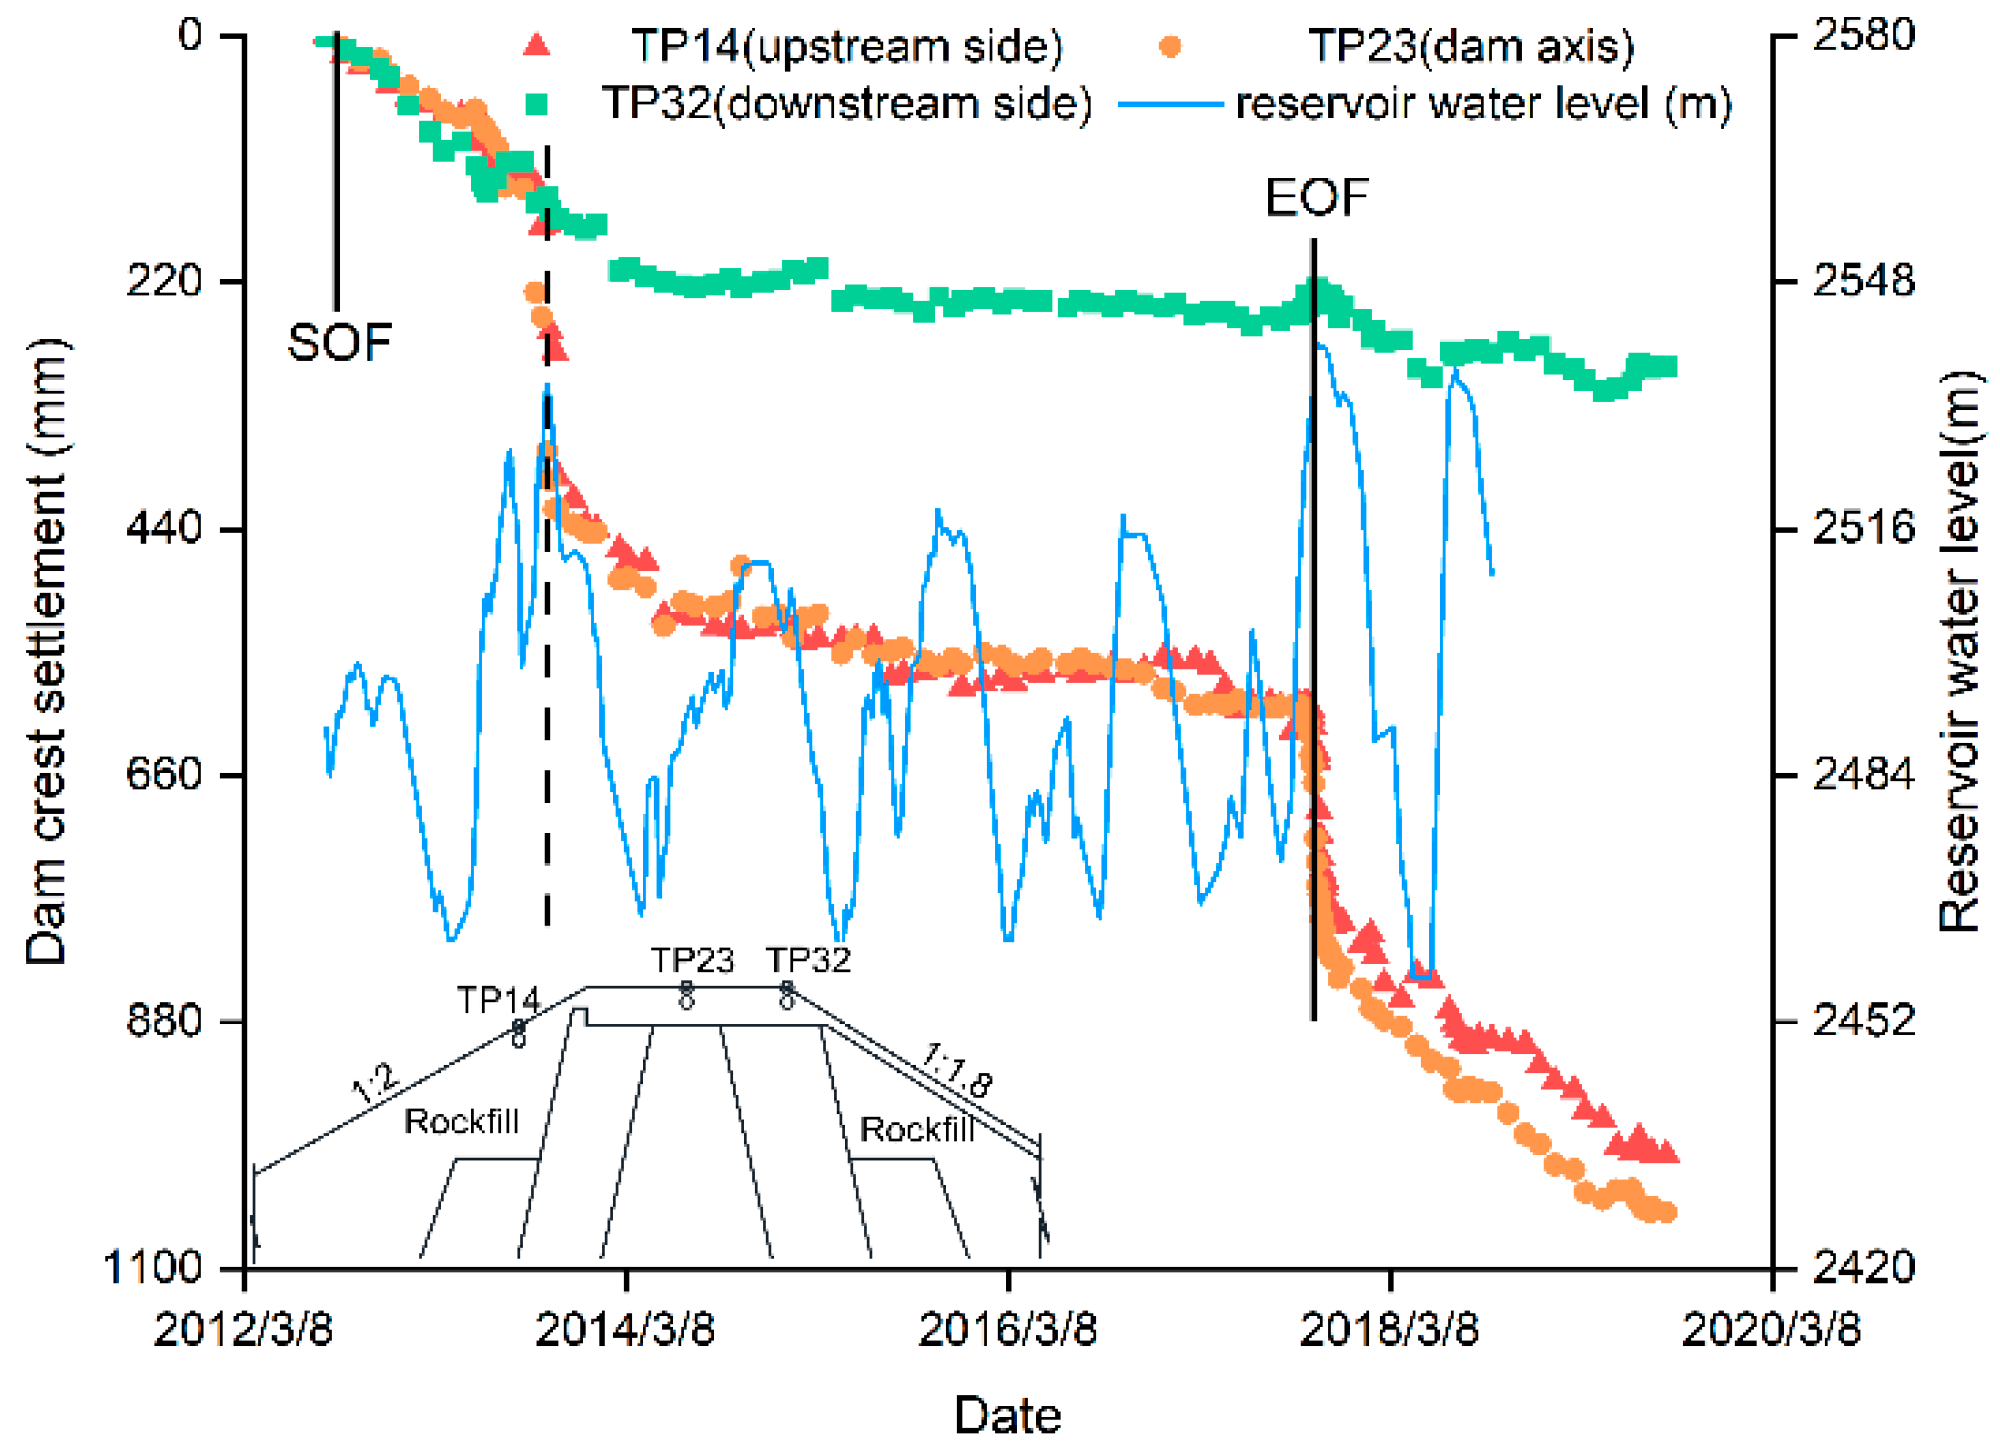
Impact of Water Storage

The initial impoundment is a critical loading condition. As revealed by the failure mode statistics presented in this paper, the majority of the current 100-m core wall rockfill dams experience large deformation during this phase. The initial storage period becomes a stage with a high incidence of failure, and dam failures primarily occur during this stage. Therefore, the monitoring data analysis and finite element calculations emphasize the dam’s uneven deformation during this period.
Figure 14 depicts a line graph of the historical settlement deformation process at the typical section 0 + 180 m. The figure shows that the dam experienced two deformation surges on 8 October 2013 and 17 October 2017. The initial abrupt change coincided with the discovery of cracks on the dam crest, and the following stage demonstrated further crack development. On both occasions, the stage of increasing water storage to high levels was reached, with the first instance occurring when the water storage level reached 2534 m and the second when it reached 2540 m. It is evident that the cracking and deformation of the dam crest are correlated with the water level.
From the inclination time course curves of different sections at the dam crest (Figure 15), it can be seen that the first immersion and rapid rise to high water levels significantly impacted the uneven settlement of the soil. Before the water level was raised, the deformation rate ranged from 0.05 to 1.21 mm/d. However, the first impoundment caused an increase in the deformation rate, ranging from 1.74 to 10.05 mm/d. The deformation inclination of the downriver settlement in each section increased over time, surging particularly in 2013 during the period of rapid water level rise, with the inclination increasing from 0.34% to 3.79%. Following this, the inclination changes became more gradual, with minimal influence from water level fluctuations between storage cycles. However, a surge phenomenon still occurs when the water level rises rapidly to high levels. This behavior is consistent with the wetting of the rockfill materials. After being wetted by water, the particles in the upstream rockfill material will be rearranged as they transition from their natural state to a saturated state. At the same time, the internal friction angle and cohesion decrease, leading to large collapse and settlement after the initial immersion in reservoir water. In contrast, the downstream rockfill is not directly affected by reservoir water and is less susceptible to wetting.
This is further confirmed by the distribution of vertical displacement increment in the 0 + 150 m section during this period compared to the completion period in the numerical calculation results (Figure 16). The overall settlement increment rises with the elevation, and the settlement changes in the upstream rockfill and core wall areas are similar, while the settlement increment in the downstream rockfill is the smallest. The numerical calculation results were analyzed using the deformation inclination method, as shown in Table 5. During the first storage period, the overall increase in deformation inclination along the river settlement was small. Except for a 0.25% increase near the upstream face, all remaining increments were below 0.2%. The greatest deformation inclination increment was 0.46% during the rapid rise in water level in 2013. This indicates that the uneven settlement of the dam during the initial storage period is more sensitive to high storage levels, resulting in more severe wetting deformation. The uneven settlement in different subintervals of the dam increases, resulting in failures such as dam crest cracking and dam seepage due to uneven deformation.
Rockfill is a noncohesive material. When saturation reaches a certain point, it has little effect on the magnitude of wetting deformation. As a result, it is widely assumed that wetting has a greater impact on rockfill dam deformation during the initial storage period and then gradually weakens. The phenomenon of a sharp increase in deformation inclination when the water level reaches a certain elevation during dam operation remains a contentious issue. Some scholars believe this is due to the continued deterioration of the rockfill mass under the dry–wet cycle and repeated stress. To control the uneven deformation caused by the dam’s wetting characteristics during the initial storage period, it is recommended to manage the water storage rate, allow a sufficient settlement period, and then proceed with the construction of the dam crest structure once the settlement is stable to prevent the dam crest cracking.

4.4.2. Dam Seepage Study

Figure 17 depicts the changes in seepage pressure and volume in the rockfill area downstream of the dam over time. Prior to the second phase of water impoundment, the seepage pressure values at each measurement point remained relatively stable. Except for a 0.4-m water head at P11, no significant water head was observed at the other measurement points. The measured seepage pressure was positively correlated with the reservoir water level, especially following a rapid increase in 2013. After impounding water to an elevation of 2536 m, the water head at each measurement point in the downstream rockfill area increased from 2.91 m to 4.20 m over the pre-impoundment levels. According to the dam operation records, the minimum value of the seepage manometer after impoundment is primarily controlled by the water level, which occurs when the water level is low. The maximum value is observed when the reservoir is first impounded to its normal water level, and the maximum seepage manometer value remains relatively constant during subsequent normal high impoundment periods. No obvious anomalies were detected in the measured data. However, in 2017, when the water level rose to a high level, high-level seepage was observed in the uppermost observation room on the downstream horse trail.
The analysis revealed that the seepage manometer functions in a point monitoring mode, potentially missing seepage occurrences in the uppermost downstream range of the horse trail. Consequently, the use of new means that can satisfy surface and body monitoring should be the direction of monitoring development. At the same time, the seepage pressure head at the bottom of the downstream rockfill area is strongly related to changes in the reservoir water level, and the seepage volume at the water collection well doubled, with only a 4-m increase in the maximum water level. This is inconsistent with the general seepage rules of core wall rockfill dams and could be attributed to abnormal high-level seepage. The cause of high-level seepage is currently being investigated and analyzed. To prevent high-level seepage potentially caused by local damage to the core wall from dam crest cracking, the project has implemented grouting treatment on the core wall.

4.4.3. Gallery Cracking Study

Following the Wenchuan Earthquake in 2008, several cracks measuring 10 mm wide and 80 m long appeared in the observation gallery of the dam. Prior to the gallery reinforcement construction, monitoring results during the temporary convergence observation period from 8 November 2008 to 19 March 2009 (Figure 18) revealed that the distances between the top arch point of the four monitoring sections and the measuring points on the upstream and downstream sidewalls decreased, with generally negative changes. The cumulative value was around −8 to −10 mm. Notably, the top arch of the gallery exhibited significant deformation in the free space direction. The cumulative displacement increment between the same elevation measuring points on the upstream and downstream side walls was about 28.00 mm. The upstream and downstream sidewalls of the gallery showed obvious deformation in these directions, with the displacement change rate increasing as the core wall was filled. After the core wall filling stopped for a while, the deformation rate gradually slowed. Combined with the gallery structure analysis, the seepage prevention for the dam foundation covering layer was addressed by constructing a 1.20-m-thick concrete anti-seepage wall in the bedrock, reaching a maximum depth of 103 m. The gravel core wall forms the upper portion of the anti-seepage wall, which is topped by a grouting gallery. The gallery clearance size is 3.50 × 4.00 m, with sidewalls and a top arch thickness of 1.0 m and bottom plate thickness of 3.65 m (Figure 19). Therefore, the core wall exerts pressure on the upper part of the grouting gallery, while the anti–seepage wall supports the lower part, forming a complex stress structure. The earthquake, as an external force, diminished the overall performance of the core wall rockfill dam. The varying deformation of different materials caused significant deformation on both the upstream and downstream sides of the gallery floor, resulting in high tensile stress and leading to cracking in the gallery floor.

5. Discussion and Conclusions

This paper collects statistics on the failure modes of core wall rockfill dams with varying dam heights at different stages of development. Targeting typical project failures, it utilizes design conditions, monitoring data, and numerical simulations to verify each other and investigate the causes of these failures. The following conclusions are drawn:
(1) The failure of small- and medium-sized earth–rock dams is primarily due to overtopping and quality issues. The main cause of dam overtopping and failure has shifted from insufficient flood discharge capacity to excessive floods. This shift results from dam standardization and the increased frequency of extreme heavy rainfall and other disasters caused by global climate change. With the development of high core wall rockfill dams, the risk of overall dam failure has been reduced, now primarily experiencing localized failures. The five main failure modes include dam crest cracking, gallery cracking, core wall splitting, seepage around the bank near the dam area, and seepage damage at the dam base. Failures predominantly occurred during the operational period in the rapid development stage (1940–1980) but have shifted to the initial storage stage during the climax stage of development (after 2002). This stage frequently experiences large deformations and is prone to failure. During impoundment, most high rockfill dams on overburden layers experience varying degrees of cracking, making them more prone to failures like cracking, and gallery cracking.
(2) Dam cracking is primarily caused by uneven deformation. Large, uneven deformation is expected between the steep bank slope and the dam, as well as between the core wall and the rockfill body. During the construction period, the shear force caused by uneven settlement and the tensile stress caused by uneven horizontal deformation along the river will lead to the formation of a shear misalignment zone within the dam. However, since the rockfill material is a bulk material, the crack will not appear within the dam. The wetting effect brought about by water storage causes even more uneven deformation, eventually resulting in cracks at the dam crest. Meanwhile, the complexity of the stockpile makes it difficult to control the dam building materials, increasing the risk of cracks.
(3) The increasing depth of cracks on the dam crest will cause damage to the core wall, potentially resulting in high-level seepage. Whether dam safety “point monitoring” can comprehensively monitor and reflect the actual deformation of the rockfill dam is determined by the deployment scheme of the instrument, which is highly subjective and uncertain. Therefore, diversifying and automating monitoring instruments and methods, and the evolving of dam safety monitoring to “area monitoring” and its universal application, are critical for conducting in-depth research on dam failure mechanisms.
(4) Galleries will be installed at the core wall and dam foundation to facilitate the rapid construction and subsequent maintenance of high earth-rock dams. However, since the upper part of the gallery is under pressure from the core wall and the lower part is supported by the anti-seepage wall, a complex stress structure develops. Additionally, the earthquake, as an external load, reduces the overall performance of the core wall rockfill dam. The deformation of various materials varies greatly, causing obvious deformation on both sides of the gallery floor, upstream and downstream, resulting in high tensile stress and subsequent cracking of the gallery floor. Therefore, the anti-cracking stress analysis of the gallery should be fully considered during the design process.

Author Contributions

Conceptualization, Y.L. and H.Z.; Methodology, Y.L. and H.Z.; Formal analysis and investigation, Y.L. and Y.S.; Visualization, Y.L. and L.L.; Writing—original draft preparation, Y.L.; Writing—review and editing, H.Z. and Y.Y. All authors have read and agreed to the published version of the manuscript.

Funding

This research received no external funding.

Data Availability Statement

Data are contained within the article.

Conflicts of Interest

The authors declare no conflicts of interest.

References

  1. Cooke, J.B. Progress in Rockfill Dams. J. Geotech. Eng. 1984, 110, 1381–1414. [Google Scholar] [CrossRef]
  2. Mahinroosta, R.; Alizadeh, A.; Gatmiri, B. Simulation of collapse settlement of first filling in a high rockfill dam. Eng. Geol. 2015, 187, 32–44. [Google Scholar] [CrossRef]
  3. Chen, C.; Lu, X.; Li, J.; Chen, J.; Zhou, Z.; Pei, L. A novel settlement forecasting model for rockfill dams based on physical causes. Bull. Eng. Geol. Environ. 2021, 80, 7973–7988. [Google Scholar] [CrossRef]
  4. Rahmani, H.; Panah, A.K. Effect of particle size and saturation conditions on the breakage factor of weak rockfill materials under one-dimensional compression testing. Geomech. Eng. 2020, 21, 315–326. [Google Scholar]
  5. Rasskazov, L.N.; Yadgorov, E.K.; Nikolaev, V.B. Field Observations of Soil Settlements, Displacements, and Pore Pressure in Dams. Power Technol. Eng. 2018, 51, 611–620. [Google Scholar] [CrossRef]
  6. Zhang, H.; Chen, J.; Hu, S.; Xiao, Y.; Zeng, B. Deformation Characteristics and Control Techniques at the Shiziping Earth Core Rockfill Dam. J. Geotech. Geoenviron. Eng. 2016, 142, 04015069. [Google Scholar]
  7. Deng, G.; Cao, K.; Chen, R.; Zhang, X.; Yin, Q.; Zhou, H. A simple approach to evaluating leakage through thin impervious element of high embankment dams. Environ. Earth Sci. 2018, 77, 25. [Google Scholar] [CrossRef]
  8. Xu, G.; Han, X.; Zhang, Y.; Wu, C. Dam Crack Image Detection Model on Feature Enhancement and Attention Mechanism. Water 2023, 15, 64. [Google Scholar] [CrossRef]
  9. Zhang, H.; Jing, Y.; Chen, J.; Gao, Z.; Xu, Y. Characteristics and causes of crest cracking on a high core-wall rockfill dam: A case study. Eng. Geol. 2022, 297, 106488. [Google Scholar] [CrossRef]
  10. Qiu, H.; Hu, R.; Huang, Y.; Gwenzi, W. Detection and Quantification of Dam Leakages Based on Tracer Tests: A Field Case Study. Water 2022, 14, 1448. [Google Scholar] [CrossRef]
  11. Pan, L.; Wu, B.; Wang, D.; Zhou, X.; Wang, L.; Zhang, Y. Study on Impoundment Deformation Characteristics and Crack of High Core Rockfill Dam Based on Inversion Parameters. Water 2024, 16, 188. [Google Scholar] [CrossRef]
  12. Zhang, Y.; Wang, W.; Zhu, Y. Investigation on conditions of hydraulic fracturing for asphalt concrete used as impervious core in dams. Constr. Build. Mater. 2015, 93, 775–781. [Google Scholar] [CrossRef]
  13. Echávez, G. Risk Analysis of Cavitation in Hydraulic Structures. World J. Eng. Technol. 2021, 9, 614–623. [Google Scholar] [CrossRef]
  14. Zhang, X.; Wang, C.Y.; Wong, H.; Jiang, T.; Dong, J. Modeling dam deformation in the early stage of internal seepage erosion—Application to the Teton Dam, Idaho, before the 1976 incident. J. Hydrol. 2022, 605, 127378. [Google Scholar] [CrossRef]
  15. Feng, R.; He, Y.L.; Cao, X.X. Different Deformation Patterns in High Core Wall Rockfill Dams: A Case Study of the Maoergai and Qiaoqi Dams. Adv. Civ. Eng. 2019, 2019, e7069375. [Google Scholar] [CrossRef]
  16. Fu, Z.; Chen, S.; Ji, E.; Fu, Z.; Chen, S.; Ji, E. Practices in Constructing High Rockfill Dams on Thick Overburden Layers. In Dam Engineering; IntechOpen: London, UK, 2018. [Google Scholar] [CrossRef]
  17. Wen, L.; Chai, J.; Xu, Z.; Qin, Y.; Li, Y. A statistical review of the behaviour of concrete-face rockfill dams based on case histories. Géotechnique 2018, 68, 749–771. [Google Scholar] [CrossRef]
  18. Liu, Q.; Lu, G.; Dong, J. Prediction of landslide displacement with step-like curve using variational mode decomposition and periodic neural network. Bull. Eng. Geol. Environ. 2021, 80, 3783–3799. [Google Scholar] [CrossRef]
  19. Nie, L.; Wang, H.; Xu, Y. Application of the arctangent function model in the prediction of ground mining subsidence deformation: A case study from Fushun City, Liaoning Province, China. Bull. Eng. Geol. Environ. 2017, 76, 1383–1398. [Google Scholar] [CrossRef]
  20. Lawton, E.C.; Fragaszy, R.J.; Hetherington, M.D. Review of Wetting-Induced Collapse in Compacted Soil. J. Geotech. Eng. 1992, 118, 1376–1394. [Google Scholar] [CrossRef]
  21. Zhou, X.; Chi, S.; Jia, Y.; Shao, X. A new wetting deformation simulation method based on changes in mechanical properties. Comput. Geotech. 2020, 117, 103261. [Google Scholar] [CrossRef]
  22. Yu, S.; Zhang, Q.; Chen, Z.; Hao, J.; Wang, L.; Li, P.; Zhong, Q. Study of the Sheyuegou dam breach—Experience with the post-failure investigation and back analysis. Eng. Fail. Anal. 2021, 125, 105441. [Google Scholar] [CrossRef]
  23. ICOLD. Dam Failures Statistical Analysis; International Commission on Large Dams: Paris, France, 1995. [Google Scholar]
  24. ICOLD. Deterioration of Dams and Reservoirs; International Commission on Large Dams: Paris, France, 1983. [Google Scholar]
  25. ICOLD. Lessons from Dam Incidents; International Commission on Large Dams: Paris, France, 1974. [Google Scholar]
  26. Zhong, Q.M.; Chen, S.S.; Deng, Z.; Mei, S.A. Prediction of Overtopping-Induced Breach Process of Cohesive Dams. J. Geotech. Geoenviron. Eng. 2019, 145, 04019012. [Google Scholar] [CrossRef]
  27. Editorial Committee of China Water Resources Yearbook. China Water Resources Yearbook 2020; China Water & Power Press: Beijing, China, 2020. [Google Scholar]
  28. Sheng, J.; Li, H.; Sheng, T. Statistical analysis of dam failure and its loss of life in China. Hydro-Sci. Eng. 2023, 1–15. [Google Scholar] [CrossRef]
  29. Deng, G.; Ding, Y.; Zhang, Y.; Zhang, Y.; Huang, W. Evolution of earth core embankment dams along with the development of configuration and materials. J. China Inst. Water Resour. Hydropower Res. 2021, 19, 411–423. [Google Scholar]
  30. Lehner, B.; Liermann, C.R.; Revenga, C.; Vörösmarty, C.; Fekete, B.; Crouzet, P.; Wisser, D. High-resolution mapping of the world’s reservoirs and dams for sustainable river-flow management. Front. Ecol. Environ. 2011, 9, 494–502. [Google Scholar] [CrossRef] [PubMed]
  31. Mulligan, M.; van Soesbergen, A.; Sáenz, L. GOODD, a global dataset of more than 38,000 georeferenced dams. Sci. Data 2020, 7, 31. [Google Scholar] [CrossRef] [PubMed]
  32. Wang, J.; Walter, B.A.; Yao, F.; Song, C.; Ding, M.; Maroof, A.S.; Wada, Y. GeoDAR: Georeferenced global Dams and Reservoirs dataset for bridging attributes and geolocations. Earth Syst. Sci. Data 2022, 14, 1869–1899. [Google Scholar] [CrossRef]
  33. Zhang, A.T.; Gu, V.X. Global Dam Tracker: A database of more than 35,000 dams with location, catchment, and attribute information. Sci. Data 2023, 10, 111. [Google Scholar] [CrossRef] [PubMed]
  34. Sherard, J.L. Lessons from the Teton Dam failure. Eng. Geol. 1987, 24, 239–256. [Google Scholar] [CrossRef]
  35. Cetin, H.; Laman, M.; Ertunç, A. Settlement and slaking problems in the world’s fourth largest rock-fill dam, the Ataturk Dam in Turkey. Eng. Geol. 2000, 56, 225–242. [Google Scholar] [CrossRef]
  36. Zhou, X.; Chi, S.; Wang, M.; Jia, Y. Study on wetting deformation characteristics of coarse granular materials and its simulation in core-wall rockfill dams. Int. J. Numer. Anal. Methods Geomech. 2020, 44, 851–873. [Google Scholar] [CrossRef]
Figure 1. Statistics on the causes of earth–rock dam failures.
Water 16 01809 g001aWater 16 01809 g001b
Figure 2. Statistics on the causes of breach of 94 earth–rock dams.
Water 16 01809 g002
Figure 3. Distribution of core wall rockfill dams of 100-m and above in height.
Water 16 01809 g003
Figure 4. Statistics overview of core wall rockfill dams with a dam height of 100 m or more (1940–1980).
Water 16 01809 g004
Figure 5. Profile statistics of core wall rockfill dams with a height of 100 m or greater (1980–present).
Water 16 01809 g005
Figure 6. Dam failure schematic.
Water 16 01809 g006aWater 16 01809 g006b
Figure 7. Layout of the monitoring points.
Water 16 01809 g007
Figure 8. Schematic diagram of meshing.
Water 16 01809 g008
Figure 9. Uneven deformation of the dam crest.
Water 16 01809 g009
Figure 10. Deformation characteristics of horizontal displacement of the dam crest along the river on 8 October 2013.
Water 16 01809 g010
Figure 11. The 0 + 150 section 2460 m elevation water pipe settlement meter measuring point timeline (EOC, construction completed; SOF, water storage begins; EOF, water storage completed).
Water 16 01809 g011
Figure 12. The development process of the dam internal deformation inclination obtained from numerical simulation.
Water 16 01809 g012
Figure 13. Comparison of the calculated and measured results.
Water 16 01809 g013
Figure 14. Settlement duration process line on the dam crest of section 0 + 180 m (SOF, water storage begins; EOF, water storage completed).
Water 16 01809 g014
Figure 15. Downriver settlement deformation inclination of each section of the dam over time.
Water 16 01809 g015
Figure 16. Settlement displacement increment when cracks occur compared to completion.
Water 16 01809 g016
Figure 17. Seepage changes in the dam.
Water 16 01809 g017aWater 16 01809 g017b
Figure 18. Temporary convergence observations.
Water 16 01809 g018aWater 16 01809 g018b
Figure 19. Layout of the anti-seepage wall.
Water 16 01809 g019
Table 1. Failure mode statistics of core wall rockfill dams with a height above 100 m (1940–1980).
Dam (Height)Foundation CharacteristicsFailure StageCasesFailure Mode
Bikou
(105.3 m)
F, 20~34 m; JOperating periodThe earthquake in 2008 caused damage to the dam’s surface and resulted in increased seepage in the grout galleries on both banks.Dam cracking, Seepage around both banks
Djatiluhur
(112 m)
FConstruction periodThe dam’s uneven subsidence causes longitudinal cracking.Dam cracking
Mud Mountain
(131.7 m)
F, 2 m; JConstruction periodCracks parallel to the dam axis appear between the core wall and the transition layer.Dam cracking,
Core wall splitting
Operating periodThe seepage water head in the core wall rises and falls in time with the reservoir water level, causing water seepages at the downstream dam toe.
Hell Hole
(125 m)
-Construction periodAfter a heavy rain in 1964, the top of the construction section’s rockfill slid along with the downstream rockfill, forming a 128-m-wide breach.Dam foundation seepage
Teton
(126.5 m)
JInitial storage periodA whirlpool formed in the reservoir near pile number 0 + 14, and a sunken hole appeared near the dam crest on the downstream dam surface. The dam collapse took about 5 h from the discovery of muddy water.Dam cracking, Core wall splitting, Dam foundation seepage
Tarbela
(143 m)
F, 210~230 mConstruction periodThree sinkholes were discovered on the dam slope of the No. 1 auxiliary dam when the reservoir water level dropped.Dam cracking
Infiernillo
(148 m)
F, 8 mInitial storage periodCracks appeared on both abutments of the dam shortly after the water was impounded.Dam cracking
Gepatsch
(153 m)
F, 122 mInitial storage periodThe dam shell has significant collapse deformation, a strong core wall arching effect, and severe longitudinal cracks on the dam crest.Dam crest cracking,
Dam-slope landslide
Operating periodSeveral bank slopes upstream of the dam deformed by more than ten meters.
La Grande2
(160 m)
F, 20 mInitial storage periodLongitudinal cracks at the junction of the core wall and the dam shell.Dam cracking
Kremasta (165 m)JOperating periodSeepage developed in the dam abutment foundation and worsened over time.Dam foundation seepage
Portage Mountain
(183 m)
JOperating periodThere were collapse pits on the dam crest, concentrated seepage channels in the core wall, and large collapse pits on the tops of the channels.Core wall splitting
Notes: F for covering layer, numbers represent the thickness of the covering layer, J for rocky foundation, and “-” for unknown.
Table 2. Failure mode statistics of core wall rockfill dams above 100 m in height from 1980 to the present.
Dam (Height)Foundation CharacteristicsFailure StageCasesFailure Mode
Lubuge
(103.8 m)
F, 5 m; JConstruction Period, Operating periodThere have been seepage issues since it went into service.
Cracks appeared in the traffic drainage gallery in 2006.
Gallery cracking, Dam seepage
Shitouhe
(114 m)
F, 4~10 m; JConstruction PeriodSeveral concentrated seepages are produced by the right dam abutment rock mass.
As the reservoir water level rises, the amount of seepage increases significantly.
Dam abutment cracking, Seepage around both banks
Qiaoqi
(125.5 m)
F, 57~65 m; JInitial storage periodThe dam foundation gallery’s structural joints seeped in 2007.Dam foundation seepage
Shiziping
(136 m)
F, 90~102 m; JInitial storage periodThe 2008 earthquake caused penetrating cracks in the grouting gallery floor.
Longitudinal cracks appeared on the dam cresy in 2013.
Gallery cracking, Dam crest cracking
Maoergai
(147 m)
F, 30~50 m; JInitial storage periodA longitudinal crack appeared on the dam crest in 2012, and water seepage occurred in the observation room on the downstream dam surface.Dam crest cracking, Suspected core wall splitting
Xiaolangdi
(154 m)
F, 30~40 m; JInitial storage periodAs the water level rises, so does the amount of water seeping into the dam body and dam foundation.Dam foundation seepage
Operating periodOn the inside of the downstream curb, there is a 100-m-long longitudinal crack.Dam crest cracking
Emboreasco
(158 m)
-Operating periodCracks appeared at heights of exceeding 120 m.Dam cracking
Ataturk
(169 m)
JInitial storage periodThe dam crest experienced significant settlement, resulting in longitudinal cracks.Dam crest cracking
Soleyman
(177 m)
-Initial storage periodSeparation of the core wall and the backfilter layer, as well as the backfilter layer and the dam shell rubble.Dam crest cracking
Pubugou
(186 m)
F, 40~60 m; JInitial storage periodLongitudinal cracks appeared on the dam crest and the gallery cracked in 2010.Dam crest cracking, Gallery cracking
Changheba
(240 m)
F, 60~70 m; JConstruction Period16 cracks appeared on the upper part of the right dam abutment slope in 2010.Dam abutment cracking (may cause seepage)
Notes: F for covering layer, numbers represent the thickness of the covering layer, J for rocky foundation, and “-” for unknown.
Table 3. Earth and rock material strength indicators and model calculation parameters.
Earth and Rock MaterialDensity
/(103 kg/m3)
Shear StrengthDuncan-Chang E-Bmodel
φ/(°)Δφ/(°)c/(Kpa)KurRfKnKbm
Upstream rockfill2.1444.2911.04020000.7910000.28668.490.1
Transition material2.154.113.92019800.829900.112462.180.1
Antifiltration material2.164210.2017000.748500.28414.060.2
Core wall material2.2828.90669880.824940.4207.70.4
Downstream rockfill II2.1746.26.6016400.838200.28421.350.22
Downstream rockfill I2.1552.19022000.7911000.35668.490.22
Covering layer ⑤1.4141.802016000.819650.64889.240.27
Covering layer ④-21.383501014000.766000.42889.240.27
Covering layer ④-11.06280308000.764000.52889.240.27
Covering layer ③-21.3832009000.764500.62889.240.27
Covering layer ③-11.38350014000.769500.42889.240.27
Covering layer ②1.06260405000.753000.46889.240.27
Covering layer ①1.41380016000.7511000.42889.240.27
Table 4. Earth and rock material creep parameters.
Earth and Rock Materialα (10−2)b (10−4)c (10−4)d (10−3)m1m2m3
Upstream rockfill0.8931.0551.0551.4700.5140.4160.427
Antifiltration material0.9121.1721.1721.6590.7210.4200.549
Transition material0.8931.1721.1721.6590.6790.4090.551
Core wall material0.6382.1342.1343.7050.9960.6790.518
Downstream rockfill II0.6380.20.20.9090.8480.4550.542
Downstream rockfill I1.10.4660.4661.0090.4080.3650.482
Covering layer0.9860.5180.5181.1210.8480.4550.542
Table 5. Increment of deformation inclination along the river (unit: %).
Upstream RockfillCore Wall—Upstream RockfillCore WallDownstream Rockfill—Core WallDownstream Rockfill
Phase I water storage0–0.250.160–0.170.020
Phase II water storage0–0.010.460–0.020.250–0.04
Disclaimer/Publisher’s Note: The statements, opinions and data contained in all publications are solely those of the individual author(s) and contributor(s) and not of MDPI and/or the editor(s). MDPI and/or the editor(s) disclaim responsibility for any injury to people or property resulting from any ideas, methods, instructions or products referred to in the content.

