Review

Elimination of Residual Chemical Oxygen Demand (COD) in a Low-Temperature Post-Denitrifying Moving Bed Biofilm Reactor (MBBR)

1
Laboratory for Water and Sanitation Engineering, Faculty of Architecture and Civil Engineering, Technical University of Applied Sciences Augsburg, An d. Hochschule 1, 86161 Augsburg, Germany
2
Urban Water Management and Environmental Engineering, Ruhr University Bochum, Universitätsstraße 150, 44801 Bochum, Germany
*
Author to whom correspondence should be addressed.
Water 2024, 16(13), 1829; https://doi.org/10.3390/w16131829
Submission received: 17 May 2024 / Revised: 14 June 2024 / Accepted: 20 June 2024 / Published: 27 June 2024

Abstract

:
Moving bed biofilm reactors (MBBRs) are compact biofilm systems that provide a sustainable solution for biological nitrogen removal. A study was conducted on an innovative post-denitrification method as a polishing step to reduce low nitrate nitrogen concentrations (10 mg/L) to 2.1–4.9 mg/L. The objective was to minimize residual chemical oxygen demand (COD) in the effluent caused by the external carbon source required for this final treatment step. Therefore, four continuous flow reactors with varying synthetic loads and hydraulic retention times (HRTs), as well as two carrier sizes, were operated over 335 days. The results showed that an HRT of 2 h is necessary to successfully reduce the residual COD to 5–6 mg/L. Additionally, it was demonstrated that the protected volume of the biofilm carriers has a significant impact on MBBRs compared to the protected surface, which is commonly discussed in the literature. The available protected volume can limit biofilm growth, as demonstrated by measuring the total biofilm solids (TBS) and biofilm thickness on the carrier at varying COD eliminations. When providing sufficient protected volume for the biofilm through the filling ratio and carrier size, a COD elimination rate of 1.4 to 1.45 kg/(m3d) was achieved with a biofilm thickness of only 500 µm.

Graphical Abstract

1. Introduction

Biofilms are common in nature and have significant implications for environmental processes and wastewater treatment. In wastewater treatment, biofilms are commonly found in fixed trickling filter systems and as free-floating carriers in moving bed biofilm reactors (MBBRs) [1]. MBBRs are compact systems that minimize the production of suspended solids and have a smaller footprint than conventional wastewater treatment systems [2]. It is based on the use of carrier elements that “carry” the microorganisms through the reactor [3,4]. The MBBR process was developed by combining the most favourable aspects of the activated sludge and biofilm processes while eliminating their respective drawbacks [2,5], e.g., preventing clogging by moving carriers. MBBRs have already been implemented in a large number of wastewater treatment plants (WWTPs) and are documented in the literature [6,7,8,9,10,11,12,13,14].
They also provide a sustainable and cost-efficient solution for upgrading large-scale wastewater treatment plants [15]. The effective reduction in nitrate nitrogen in treated wastewater for the upgrading of large wastewater treatment plants to meet stringent effluent standards was investigated in the present study, where a pilot plant was used to demonstrate the stable reduction in nitrate nitrogen from 10.0 mg NO3-N/L to <<5.0 mg NO3-N/L when using a single-stage MBBR as an additional subsequent denitrification system using an external carbon source [16].
The objective of this study was to gain further insight into the elimination of the residual COD caused by the necessary external carbon source present in the effluent of this post-treatment system, which is not well discussed in the literature. Therefore, laboratory reactors were operated for a period of 335 days. Furthermore, the impact of carrier specifications (protected volume/surface) on biofilm growth and possible biofilm limitations were investigated for the optimization of the process.
To further eliminate nitrate from already treated wastewater, an external carbon source is necessary, because no degradable COD should be remaining in the treated wastewater. Several studies [12,17,18,19,20,21] have shown that increasing the influent carbon-to-nitrogen (C/N) ratio can effectively enhance the nitrogen elimination capacity, whereas a low C/N ratio can hamper the elimination performance [18,22,23,24]. In order to eliminate nitrogen and, at the same time, limit the residual COD from the external carbon source that remains in the effluent, a well-balanced C/N ratio (COD/NO3-N) is essential. While achieving efficient nitrate elimination at low concentrations, it was found that residual COD could not completely be eliminated in the effluent. This is problematic for a final polishing step. The only way to reduce the residual COD concentration is to increase the hydraulic retention time (HRT), which in turn reduces the influent loading rate. A significant reduction in residual COD requires sufficient time for the microorganism metabolism, especially at low temperatures where cellular respiration is reduced due to limited enzyme activity. Therefore, the effect of HRT needs to be discussed, particularly when an external carbon source like methanol is used in a final polishing step, as in this study.
Apart from the suitable COD/NO3-N ratio, the conditions of the biofilm on the carriers also influence the MBBR process, e.g., limiting biofilm growth on the protected surface of the carriers. Several studies have focused on the correlation between varying biofilm thickness and bacterial activity. A thicker biofilm was found [25,26,27] to provide greater activity of nitrite-oxidizing bacteria (NOB), but had no effect on ammonia-oxidizing bacteria (AOB). These studies were conducted by limiting biofilm thickness through the carrier geometry. Other studies have shown that a higher removal efficiency can be achieved with a thin biofilm layer on the carriers. This is due to the high rate of substrate diffusion that occurs through the microchannels in the biofilm [28]. The thickness of the biofilm varies for specific carriers, depending on the protected volume inside the carriers. This volume does not directly correlate with the protected surface inside the carriers, which is often provided in the carrier producer’s datasheets. Furthermore, local flow velocities and crossflow fraction may limit the maximum biofilm thickness, biofilm growth, morphology, diversity, structure, and quantity [29]. Another study shows that the local flow velocities in tubular MBBR produce a thinner biofilm with lower NOB activity in a shorter internal channel than in longer tubular media [30]. However, there are options to control the biofilm thickness. A thin biofilm increases the mass transfer because of the diffusion-limited boundary layer thickness. This effects the nutrient supply and exchange of products in the biofilm [31,32,33,34]. These studies provide information about biofilm thickness and the geometrical form of carrier media that can be used in MBBRs.
However, there remains a knowledge gap on the biofilm limitations in the dependency of COD elimination on the carriers in MBBRs. In particular, the protected volume, rather than the protected surface inside the carriers, plays a key role in biofilm limitation. Currently, MBBRs are commonly designed based on the protected surface of the carriers, which varies depending on the filling ratio and type of carrier in the reactor. Rusten et al. [35] suggested that the filling ratio of a carrier should be under 70%, in order to move the carrier suspension freely. Other studies showed that an optimum filling ratio of 40% should be chosen to reach sufficient oxygen transfer efficiency for the attached biofilm [36,37]. But the correlation between filling ratio and protected surface is entirely defined by the specific physical properties of the carriers used. The same filling ratio of different carriers may be associated with different protected surfaces.
Therefore, this study was designed to compare two different carrier sizes of the same carrier type, resulting in different protected surfaces and varying filling ratios. The study identifies the limitations in biofilm growth on MBBR carriers, which can be measured by total biofilm solids (TBS) and the thickness of the biofilm. Therefore, the protected volume available inside the carriers, rather than the available protected biofilm surface associated with the carrier filling ratio, appears to be relevant. Further dependencies were found by varying the nutrient and substrate supply in the influent to the laboratory reactors tested.
The paper had two objectives. The first objective was to achieve a significant reduction in residual COD in the effluent by optimizing the hydraulic retention time (HRT) in the reactors. The second objective was to assess the impact of carrier specifications (protected volume/surface) on biofilm growth in terms of biofilm limitations.

2. Materials and Methods

2.1. Reactors and Carriers

Four reactors were operated in the laboratory, with a volume of 46 L each. The experiments were conducted in two lines, consisting of two reactors in series each (Figure 1). Each reactor operated as a denitrification reactor and, therefore, only mixing was provided to achieve anoxic conditions. Mixing was also provided to move the carriers in the reactor to support proper nutrient transport in the biofilms grown on the carriers. To initialize biological denitrification, carriers from a pilot plant with a similar simulated process with real wastewater [16] were initially used at the beginning of the long-term operation in the laboratory reactors.
To simulate wastewater, nutrients were added to drinking water using peristaltic pumps to generate synthetic wastewater (see Section 2.3). The water temperature was regulated using a cooling thermostat IKA RC5 control (IKA-Werke GmbH & CO. KG, Staufen, Germany) to maintain a constant water temperature. Temperature is a critical parameter for denitrification performance and is highly responsive to changes in different operating conditions. The deviation of water temperature in the reactors varied by a maximum of ±0.2 °C within the range of 12 °C to 16 °C in different experimental setups. The total dissolved oxygen in the drinking water was 6.3–8.0 mg/L, depending on the water temperature. The oxygen in the drinking water was measured with a Hach LDO sc probe (Hach Lange GmbH, Düsseldorf, Germany) using luminescent dissolved oxygen technology. This high concentration of dissolved oxygen in wastewater is commonly found in the effluent of trickling filters [16].
In line one and line two, the two reactors (first and second reactor) were operated in series. The first reactors received the full influent load, while the effluent from the first reactor was fed into the second reactor. Figure 1 shows the operating conditions of the reactors. The main difference between line one and line two lies in the carriers used. Line one was filled with larger carriers with a diameter and length of 17 mm, while, in line two, smaller carriers with a diameter and length of 14 mm were used. The carriers had identical geometries but differed in size HXF17KLL and HXF14KLL (Christian Stöhr GmbH & Co. KG, Marktrodach, Germany).
Due to the smaller size of the carriers in line two, they had a significantly higher protected surface per cubic meter carrier filling (644 m2/m3) compared to the larger carriers in line one (496 m2/m3) (see Table 1). This meant that a lower number of smaller carriers was needed to achieve the same total protected surface as the larger carriers. For a total protected surface of 6.8 m2/reactor in both reactors, a filling ratio of 30% was needed in line one, whereas a filling ratio of only 23% was required for the same protected surface in line two.
In program number 16 (see Table 2), the filling ratio was increased to 40% in the first reactor of line one and to 30% in the first reactor of line two. This led to an increase in the protected surface. A limitation concerning biofilm growth was suspected and the effects of an increased protected surface were investigated.
The total HRT of a line is the sum of the HRTs in both reactors. HRTs of 28 min up to 55 min in each reactor were simulated by flow control.

2.2. Experimental Set-Up

In order to specifically investigate the influences on residual COD as well as biofilm formation on the carriers and possible limitation in biofilm growth during the denitrification process, a series of 19 programs was carried out in laboratory-scale reactors (Figure 1—line one and line two) with different boundary conditions, each lasting between 7 and 36 days. In total, the laboratory-scale reactors were operated for 335 days (Table 2).
In programs 1–3, the water temperature was increased from 12 °C to 14 °C and 16 °C in two-degree increments, to observe the effect of temperature on COD elimination. The COD/NO3-N ratio was maintained at 4.65 mg COD/mg NO3-N by adding methanol, and the hydraulic retention time (HRT) was only 28 min.
The results presented in this paper start with the 4th program, in which the HRT was increased to 55 min in each reactor by reducing the flow rate to 47 L/h. Figure 2 shows the COD elimination and the COD concentration in the effluent of the first and second reactors in line one and line two (program no. 4–12) with a constant water temperature of 16 °C and a nitrate nitrogen concentration in the influent of 10 and 14 mg NO3-N/L, with varying carbon dosages and HRTs (flow rate). Results and discussion to Figure 2 are described in Section 3.1.
Programs 13 to 19 involved a successive reduction in temperature from 16 °C to 12 °C. This was undertaken to compare the results with the previous programs (program no. 4–12) and to make further adjustments to the variable parameters (NO3-Ninlet, CODdosed, and HRT).

2.3. Synthetic Wastewater and Loads

The selected concentrations for NO3-N and PO4-P were based on real effluent concentrations from a large wastewater treatment plant that required further treatment of the effluent and where the investigated subsequent denitrification system was already operated as a pilot plant [16]. To simulate wastewater characteristics, a synthetic wastewater was prepared using temperature-controlled drinking water. Synthetic wastewater has previously been used in several studies to simulate real wastewater [28,38,39,40]. The synthetic wastewater required the presence of NO3-N and PO4-P. To achieve this, stock solutions of sodium nitrate and di-potassium hydrogen phosphate were created using distilled water for NO3-N and PO4-P, respectively. An additional stock solution was prepared using methanol and distilled water as an external carbon source (see Table 3).
Peristaltic pumps were used to dose both stock solutions into the drinking water, which served as the influent to the first reactors in line one and line two. The dosage of the external carbon source, methanol, was determined relative to the NO3-N influent concentration and expressed as COD (see Table 2), ranging from 4.65 to 5.55 mg COD/mg NO3-N. The ratio of COD to methanol was 1.5 COD/CH3OH [41].
The subsequent denitrification system based on MBBR was strongly influenced by temperature fluctuations in the synthetic wastewater. Lower water temperatures resulted in a reduced denitrification performance. To investigate the impact of temperature independently of other parameters in various programs, a cooling thermostat was used to regulate the temperature in the reactors.

2.4. Analytical Methods and Measurements

Continuous NO3-N measurement was conducted using a spectrometer sensor TriOS OPUS (TriOS Mess- und Datentechnik GmbH, Rastede, Germany). In addition, parameters in each line were monitored 2–3 times per week by sampling and analysis in the lab. For analysing PO4-P and COD concentrations, cuvette tests (Hach Lange GmbH, Düsseldorf, Germany). were employed, in combination with a spectrophotometer Hach DR 3900 (Hach Lange GmbH, Düsseldorf, Germany), for analysis. In order to calculate the oxygen consumption in the reactors, oxygen measurements were taken in the influent and directly in the reactor Hach LDO sc probe (Hach Lange GmbH, Düsseldorf, Germany) to determine the difference. The increase in the O2 concentration by aqueous solution of atmospheric oxygen through the water surface could not be measured.
To determine the concentration of excess sludge in the effluent, generated by local shear forces in terms of flow velocity on the biofilms in the reactor, samples of the effluent with a volume of approximately 800 mL were filtered through 90 mm diameter paper filters Whatman 597 (Cytiva Europe GmbH, Freiburg, Germany) particle retention < 7 µm. The mass of excess sludge on the filters was then calculated by measuring through differential weighing after drying at 105 °C. The total biofilm solids (TBS) in the reactors were assessed by weighing five to ten carriers before and after removing the total biomass from these carriers. The carriers were dried in an oven memmert UF160 (Memmert GmbH + Co. KG, Schwabach, Germany) at 105 °C for at least 2 h. In order to detach the biofilm according to [42], the dried carriers were stirred in a 100 mL 1 M NaOH (sodium hydroxide) and 100 mL 1% SDS (sodium dodecyl sulphate) solution at approximately 80 °C on a magnetic stirrer IKA RCT (IKA-Werke GmbH & CO. KG, Staufen, Germany) with standard temperature control. After detachment, the carriers were again dried to mass constancy, and the biomass in the biofilms was calculated using differential weighing. The biofilm thickness was measured by scanning the carriers with a digital microscope Keyence VHX-6000 (Keyence Deutschland GmbH, Neu-Isenburg, Germany) prior to drying. To perform the required measurements of the biofilm thickness under the microscope, a device was constructed to hold the carrier submerged in a water-filled vessel, similar to a clamp. The immersion in water was necessary to enable the biofilm to be measured in its entirety; the biofilm collapses when carriers are not submerged. The biofilm thickness was measured at different positions of the carriers and the mean thickness with minimal variation was calculated and used in this study.

3. Results and Discussion

The objective of this study was to eliminate residual COD in the effluent from a post-denitrification MBBR process in low-strength treated wastewater. Residual COD is rarely discussed in the typical design of a MBBR, because most plants are installed as a main treatment step. However, the presence of residual COD in this suggested application of the MBBR process, particularly when a short hydraulic retention time (HRT) is selected, is problematic in a final treatment process that requires maximum elimination. The results demonstrate that failure to eliminate residual COD results in an undesired increase in the total COD in the effluent.
Furthermore, limitations related to biofilm growth on the carriers is addressed. The paper presents the results of 19 programs conducted with laboratory scale reactors, which span a period of 335 days of operation. The MBBR-based subsequent denitrification system employed in this study was designed to target nitrate nitrogen reduction at low concentrations. Previous research conducted on a pilot plant at a large WWTP using real wastewater and operating as a MBBR demonstrated an average NOx-N elimination efficiency of 71% over a one-year period at temperatures above 15 °C. Stable nitrate nitrogen reduction, from 10.0 mg NO3-N/L to less than 5.0 mg NO3-N/L, was achieved [16]. Previous investigations at the pilot plant and in laboratory reactors have demonstrated that a temperature increase of 1 °C between 12 °C and 20 °C led to an improved denitrification performance of 4.3–4.8% [43]. The elimination efficiency is unexpectedly high in this low concentration range, as the denitrification rate generally increases with increasing nitrate loading [40].
However, being a biological system, the effectiveness of denitrification decreases at lower water temperatures, due to the temperature dependency of the microorganisms’ cellular respiration, which drives the denitrification process. Additionally, the presence of dissolved oxygen in the influent was found to have a negative impact on the denitrification process.

3.1. Elimination of Residual COD

Each program in the study had specific influent concentrations, temperatures, and HRTs (see Table 1 and Table 2). Low HRTs are desirable for economic reasons, as they result in smaller reactor volumes. While even short HRTs of 60 min [16] were sufficient for nitrogen elimination, they caused incomplete elimination of the dosed external carbon source, leading to residual concentrations of COD in the effluent. Reducing the dosed carbon source to lower the COD concentrations in the effluent resulted in decreased nitrogen elimination performance, again leading to high residual COD concentrations in the effluent, paired with unsatisfactorily high nitrate nitrogen concentrations. Therefore, the impact of HRT on residual COD was investigated. The results from different programs with varying HRTs showed that increasing the HRT improved overall COD elimination and significantly reduced the residual COD in the effluent. In the specific case of line one (as shown in Figure 2), operating the first reactor at an HRT of 35 min resulted in a COD elimination ranging from 46% to 64% (programs 7–10). The residual COD entering the second reactor was further reduced, resulting in a total COD elimination (first reactor + second reactor) of 74% to 88%, when both reactors were operated at a total HRT of 70 min. The measured concentrations of residual COD in the effluent ranged from 7 to 11 mg/L in programs 7, 9, and 10, with a maximum value of 15 mg/L in program 8.
In program 8, a limitation in the denitrification process was simulated by reducing the phosphorus concentration (PO4-P) in the synthetic feed. Operating both lines with a feed of 0.3 mg PO4-P/L resulted in a reduction of about 0.15 mg PO4-P/L. It was anticipated that a PO4-P concentration below 0.15 mg PO4-P/L would decrease the biological activity in the biofilms. Consequently, in program 8, the PO4-P concentration in the inflow was reduced to 0.1 mg/L. This led to an insufficient COD elimination in both reactors, with only 74% COD elimination and a residual COD concentration of 15 mg/L in the effluent, which can be problematic for large wastewater treatment plants concerning the effluent requirements.
In program 9, the same conditions as in program 8 were applied, except for an increased PO4-P concentration of 0.2 mg PO4-P/L. This higher phosphorous concentration proved to be sufficient for stable operation, resulting in a COD elimination of 87% and a residual COD concentration reduced to 7 mg/L in the effluent, compared to program 8. All programs demonstrated that PO4-P elimination by incorporation during the denitrification process ranged from 0.4% to 0.5% of the eliminated COD. This is also consistent with common design approaches for activated sludge systems (see [41]).
The residual COD in the subsequent denitrification system is a critical parameter to consider. The primary objective is to minimize external carbon dosing to improve efficiency and reduce the residual COD concentration in the effluent entering the final clarifier and receiving water body. With short HRTs of 35 min in each reactor (program 7–10), the first reactor of line one had a residual COD in the range of 20 to 30 mg COD/L. In the second reactor, the total HRT was 70 min (1st + 2nd reactor), resulting in a residual COD of 6–11 mg COD/L (with sufficient PO4-P concentration to prevent limitations). However, a significantly better and satisfactory COD elimination was achieved by increasing the HRTs to 55 min in each reactor (programs 4–6 and 11–12). The residual COD in the effluent from the first reactor ranged from 10 to 19 mg COD/L. This was further reduced by the second reactor to concentrations between 3 and a maximum of 11 mg COD/L. The highest residual COD concentration of 11 mg/L was observed in program 10, where the nitrate nitrogen and COD load were significantly increased (see Table 3). This increase may have temporarily decreased the denitrification process, resulting in reduced COD elimination. With an HRT of 110 min (almost 2 h), the residual COD in the effluent was less than 5–6 mg/L under regular conditions. The COD elimination in programs 4–6 and 11–12 reached satisfactory levels of 91–95%, effectively removing the external carbon (methanol) dosed in the subsequent denitrification system. However, despite extensive investigation of HRT, it was not possible to completely eliminate the dosed carbon source in the effluent. Longer HRTs were considered impractical due to the large reactor volumes required. Additionally, complete elimination of COD below 6 mg/L could not be further investigated due to limitations in the accuracy of available analytical tests.
The operation of two reactors in series demonstrates the impact of the concentration gradient. Loading the first reactor with the total COD load results in a significantly higher COD elimination of 74–76% at an HRT of 55 min. This effect, where higher initial loads lead to greater COD elimination, is expected and is attributed to the well-established Monod equation principle [44] in biological wastewater treatment. The COD elimination in the second reactor is therefore lower, with a COD elimination of 5–11% based on the residual COD from the first reactor, where the HRTs are the same.
The programs differed in their initial load. A higher COD/NO3-N ratio resulted in greater COD elimination [45]. The COD/NO3-N ratio ranged from 4.65 to 5.55 mg COD/mg NO3-N in programs 1–19. However, this COD/NO3-N dosage range was too narrow to distinguish the effects of temperature and other operating conditions. Previous studies [16] showed that a COD/NO3-N ratio below 4.65 mg COD/mg NO3-N resulted in a sudden lack of denitrification. Increasing the dosage to 5.55 mg COD/mg NO3-N did not appear to be necessary, as there was an increase in residual COD in the effluent even with a 2 h HRT.
In conclusion, reducing the COD/NO3-N ratio alone was not sufficient to decrease the residual COD in the effluent of an MBBR-based subsequent denitrification system operating at low NO3-N concentrations to 10 mg/L. The key is an increase in HRT, which results in a larger reactor size. To achieve a sufficient COD/NO3-N ratio, it is recommended to continuously measure the residual COD in the effluent and adjust it based on the measured water temperature. This is because water temperature is the primary factor influencing denitrification performance.

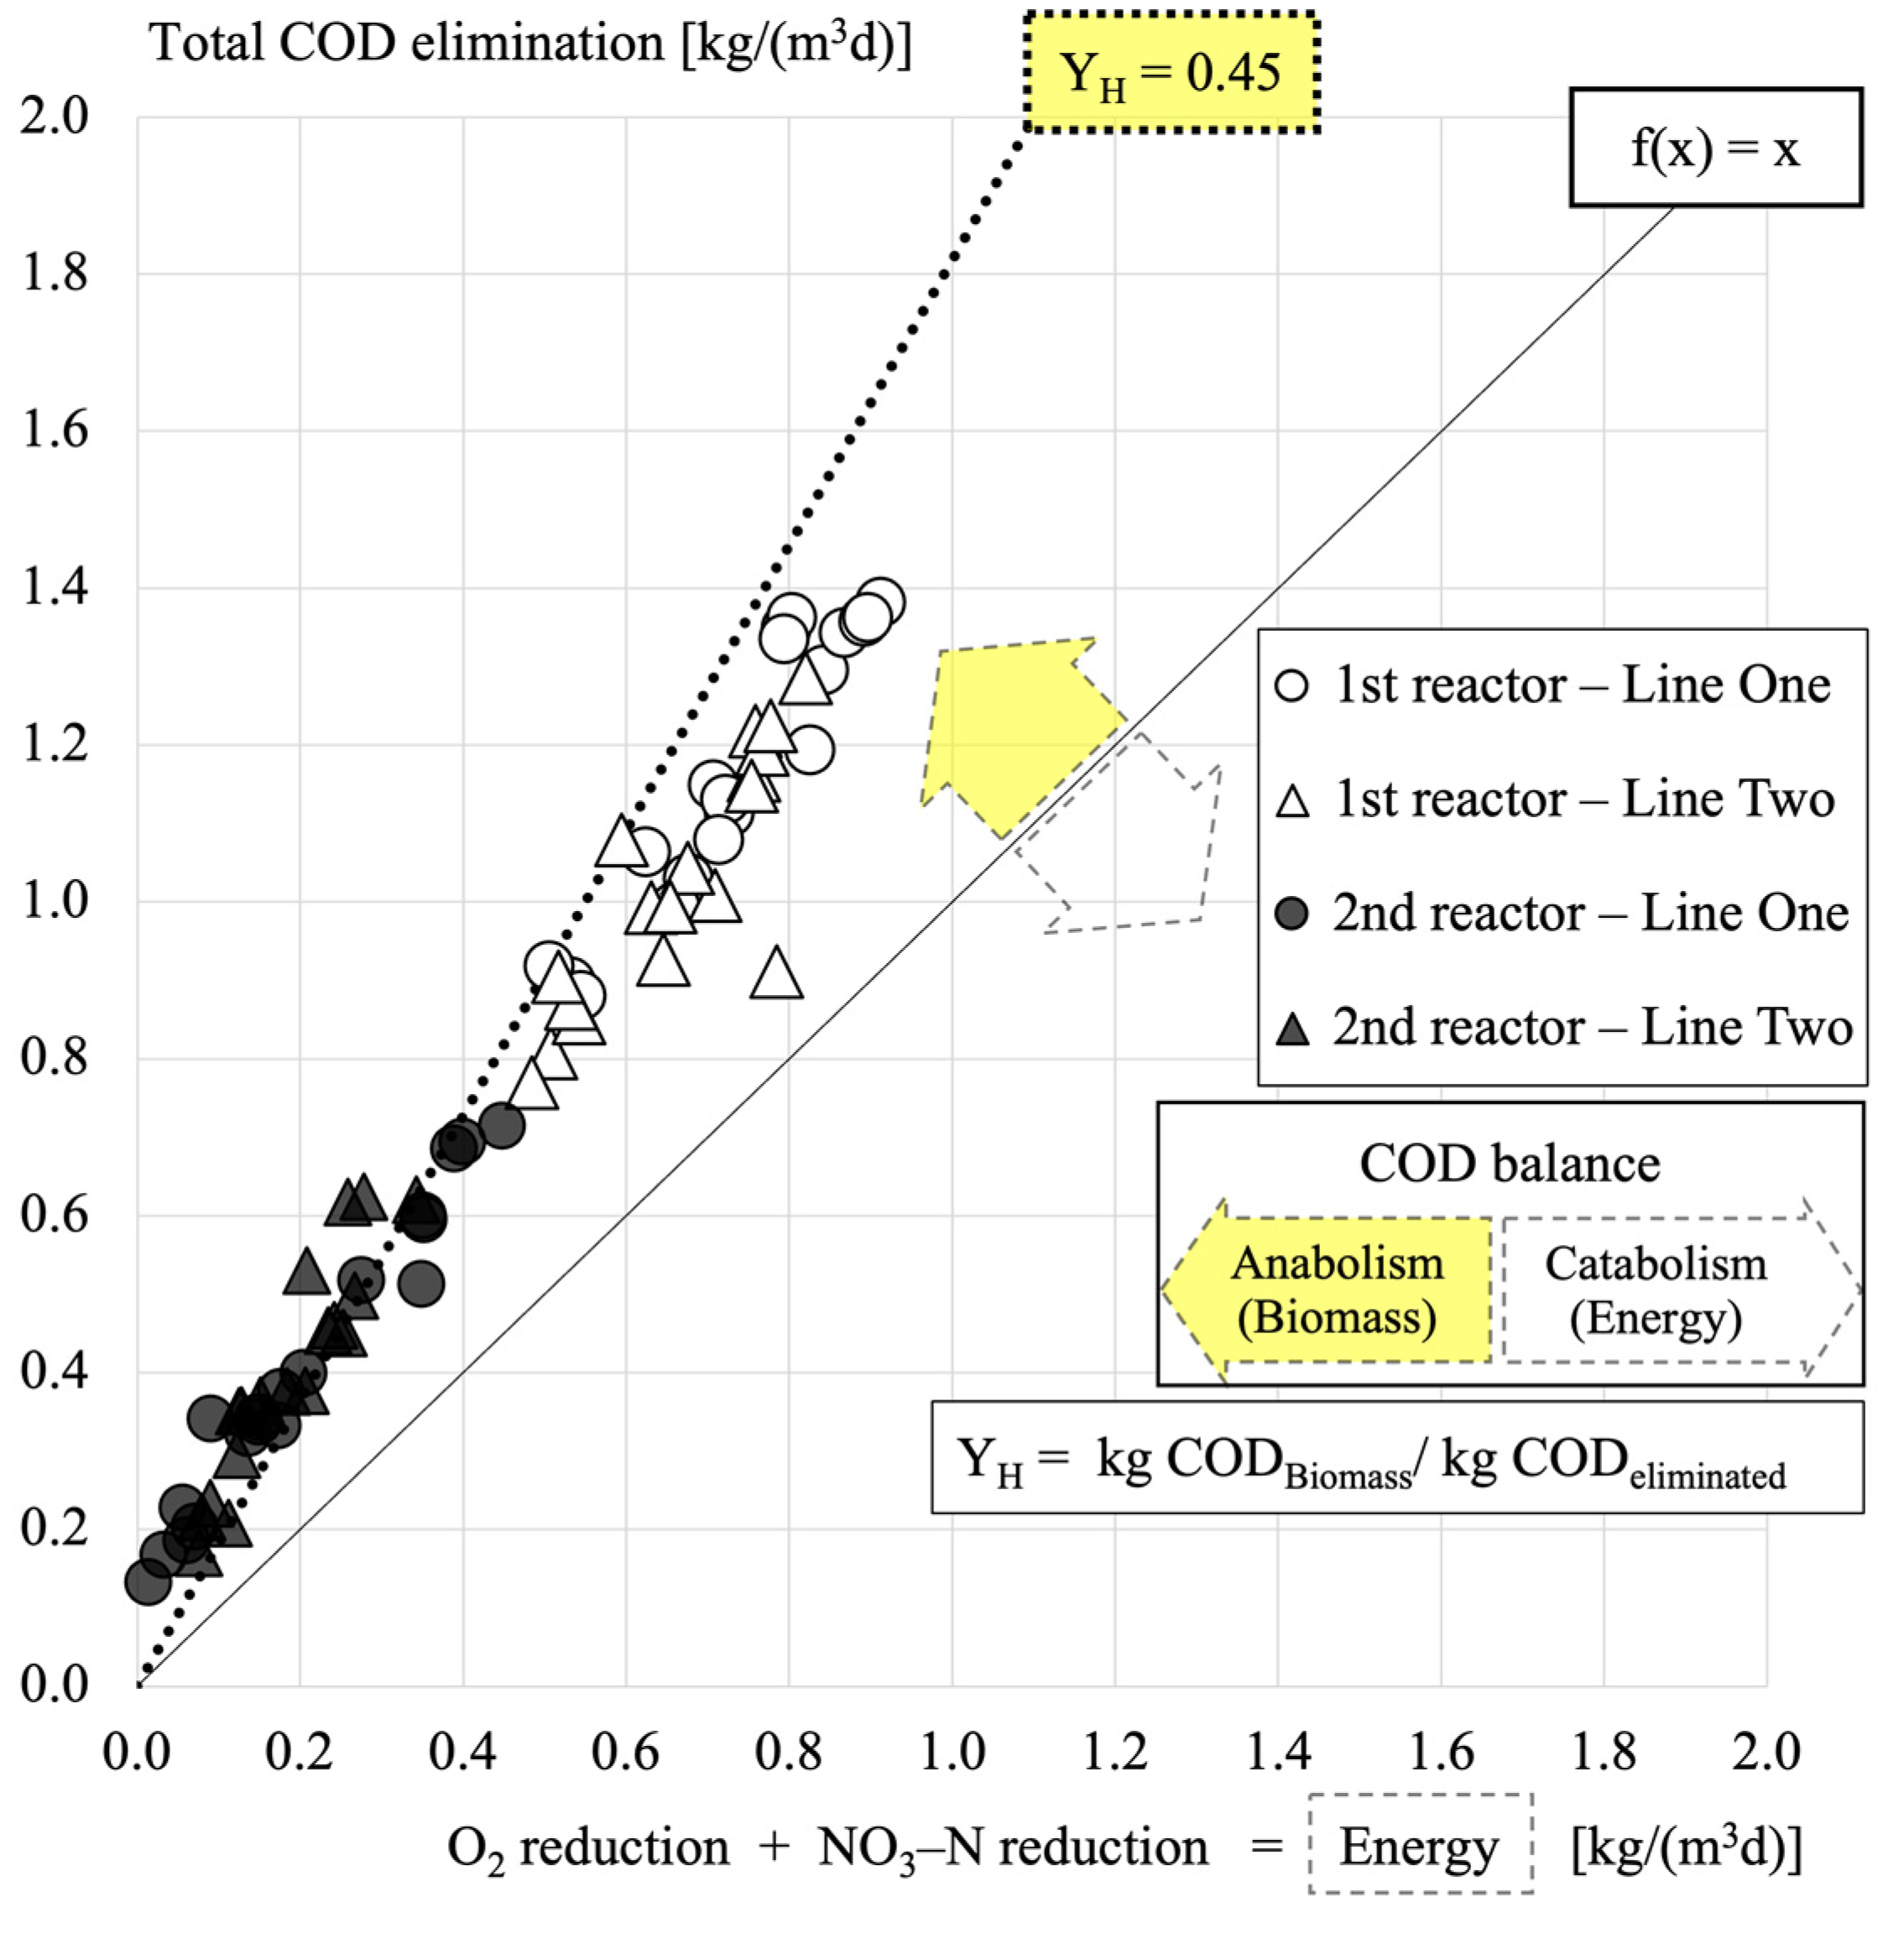
3.2. COD Balance and Excess Sludge Production

The literature extensively covers the impact of temperature on biological denitrification [16,46,47,48]. This study also found that denitrification performance is significantly impaired at temperatures below 16 °C. To mitigate the influence of temperature fluctuations, in programs 3–12, a constant temperature of 16 °C was maintained. Variations in COD elimination and NO3-N reduction during denitrification were attributed to changes in influent load, as shown in Table 2. The reduction in NO3-N and dissolved O2 was also measured. Programs 1–3 and 17–19 demonstrated that increasing the water temperature from 12 °C to 16 °C resulted in a slight improvement in NO3-N reduction, whereas decreasing the water temperature from 16 °C to 12 °C (programs 12–16) led to a significant decline in NO3-N reduction (see Figure 3). This highlights the substantial influence of temperature on biological denitrification. The elimination of COD varied depending on the influent load, ranging from a reduction of 1.1 kg COD/m3d (program 5) to 1.9 kg COD/m3d (program 9) with 10 mg NO3-N in the influent. To compare COD and NO3-N reduction, the anoxic carbon oxidation of NO3-N was calculated using the factor 2.86 O2/NO3-N, based on [49,50]. Furthermore, COD is reduced under aerobic conditions, resulting in the reduction in dissolved oxygen found in the influent (see Table 2).
In addition, Figure 3 displays the overall COD elimination balance, which shows a correlation between the total measured COD elimination, the measured reduction in dissolved O2 (aerobic carbon oxidation), and the reduction in NO3-N (anoxic carbon oxidation). NO3-N reduction accounts for approximately 34–52% of the total COD elimination, indicating that nearly half of the COD elimination occurs with nitrate nitrogen as the electron acceptor during denitrification. Another 10–22% of the COD is reduced by aerobic oxidation with the dissolved oxygen present in the influent. The dissolved oxygen concentrations employed in this study were comparable to those observed in the real wastewater treated from the effluent of a trickling filter in the corresponding pilot plant, as referenced in [16]. Although there may have been a small influx of oxygen from surface solubility, the short HRT suggests that this contribution was likely to be minimal and could not have been accurately measured. As a result, COD consumed in excess of these factors was eliminated, which totalled approximately 35–51% of the dosed COD. The balance clearly demonstrates that, in addition to the stoichiometric COD dosing required for post-denitrification, there is a significant amount of COD elimination occurring. This additional COD elimination can most likely be attributed to the carbon requirements of the microorganisms for their anabolism to biomass. The measured amount of aerobic and anoxic carbon oxidation in the system can balance the energy generated by the microorganisms for their catabolism. Both pathways are essential for the microorganisms in their total metabolism. A proportion of the consumed COD is required for energy production, resulting in the conversion of carbon (COD) into CO2. The remaining COD is utilised for the synthesis of biomass components.
Figure 4 illustrates the correlation between the total COD elimination and the combined reduction in O2 and NO3-N. It is assumed that catabolism involves the energy generated by oxidising partners such as O2 and NO3-N in the total metabolism of microorganisms. Furthermore, additional COD elimination is caused by anabolism for biomass growth. If the total COD elimination is used for energy (catabolism), no carbon would be left for microbial growth of biomass (anabolism). This is indicated by the linear graph f(x) = x. As expected, biomass is continuously produced and could be estimated by measuring the excess sludge in the reactor effluent (see Figure 5).
This balance between biomass and energy can be expressed as a consumption ratio, which has been used in previous studies [51,52]. The average consumption ratio can be expressed as a yield factor (YH) that indicates the COD in biomass of the total eliminated COD in the system. In [36], a YH (for heterotrophic microorganisms) of 0.45 kg CODBiomass/kg CODeliminated was given for the dimensioning of activated sludge systems using the external carbon source of methanol [41]. This implies that 45% of the COD is consumed as biomass and 55% as energy. The average total COD eliminated or consumed in the 2nd reactors is in the range of 0.11 to 0.75 kg COD/(m3d) and is in the range of the YH of 0.45 kg CODBiomass/kg CODeliminated given in [41]. In the first reactors operated at higher loads, the COD elimination was even higher, between 0.75 and 1.4 kg COD/(m3d). Therefore, a lower average consumption ratio would indicate a yield coefficient (YH) lower than 0.45 kg CODBiomass/kg CODeliminated.
Figure 5 shows the total COD elimination in relation to the measurements of excess sludge. Excess sludge in biofilm systems does not correspond to the excess sludge of a conventional activated sludge system. This is because biofilms lose their excess biomass due to shear forces caused by flow on the biofilm, whereas, in activated sludge systems, the growth of excess biomass compared to the total biomass can directly be measured.
In order to facilitate a comparison between the theoretical calculation in accordance with [41] and the measured values (COD elimination and excess sludge), certain assumptions were made for the theoretical calculation. These included converting the sludge age into a biofilm age (BA) using microbial growth yield factors (YH = 0.45) for methanol and a death rate (bH) based on [41]. The assumption for calculation is illustrated in Figure 5, which shows a theoretical BA of 42 days. According to [41], the ASM3 [53] suggests a death rate of 0.17 (1/d) for heterotrophic microorganisms (MO) at a temperature of 12 °C, adjusted by a temperature factor of 1.072(T-15).

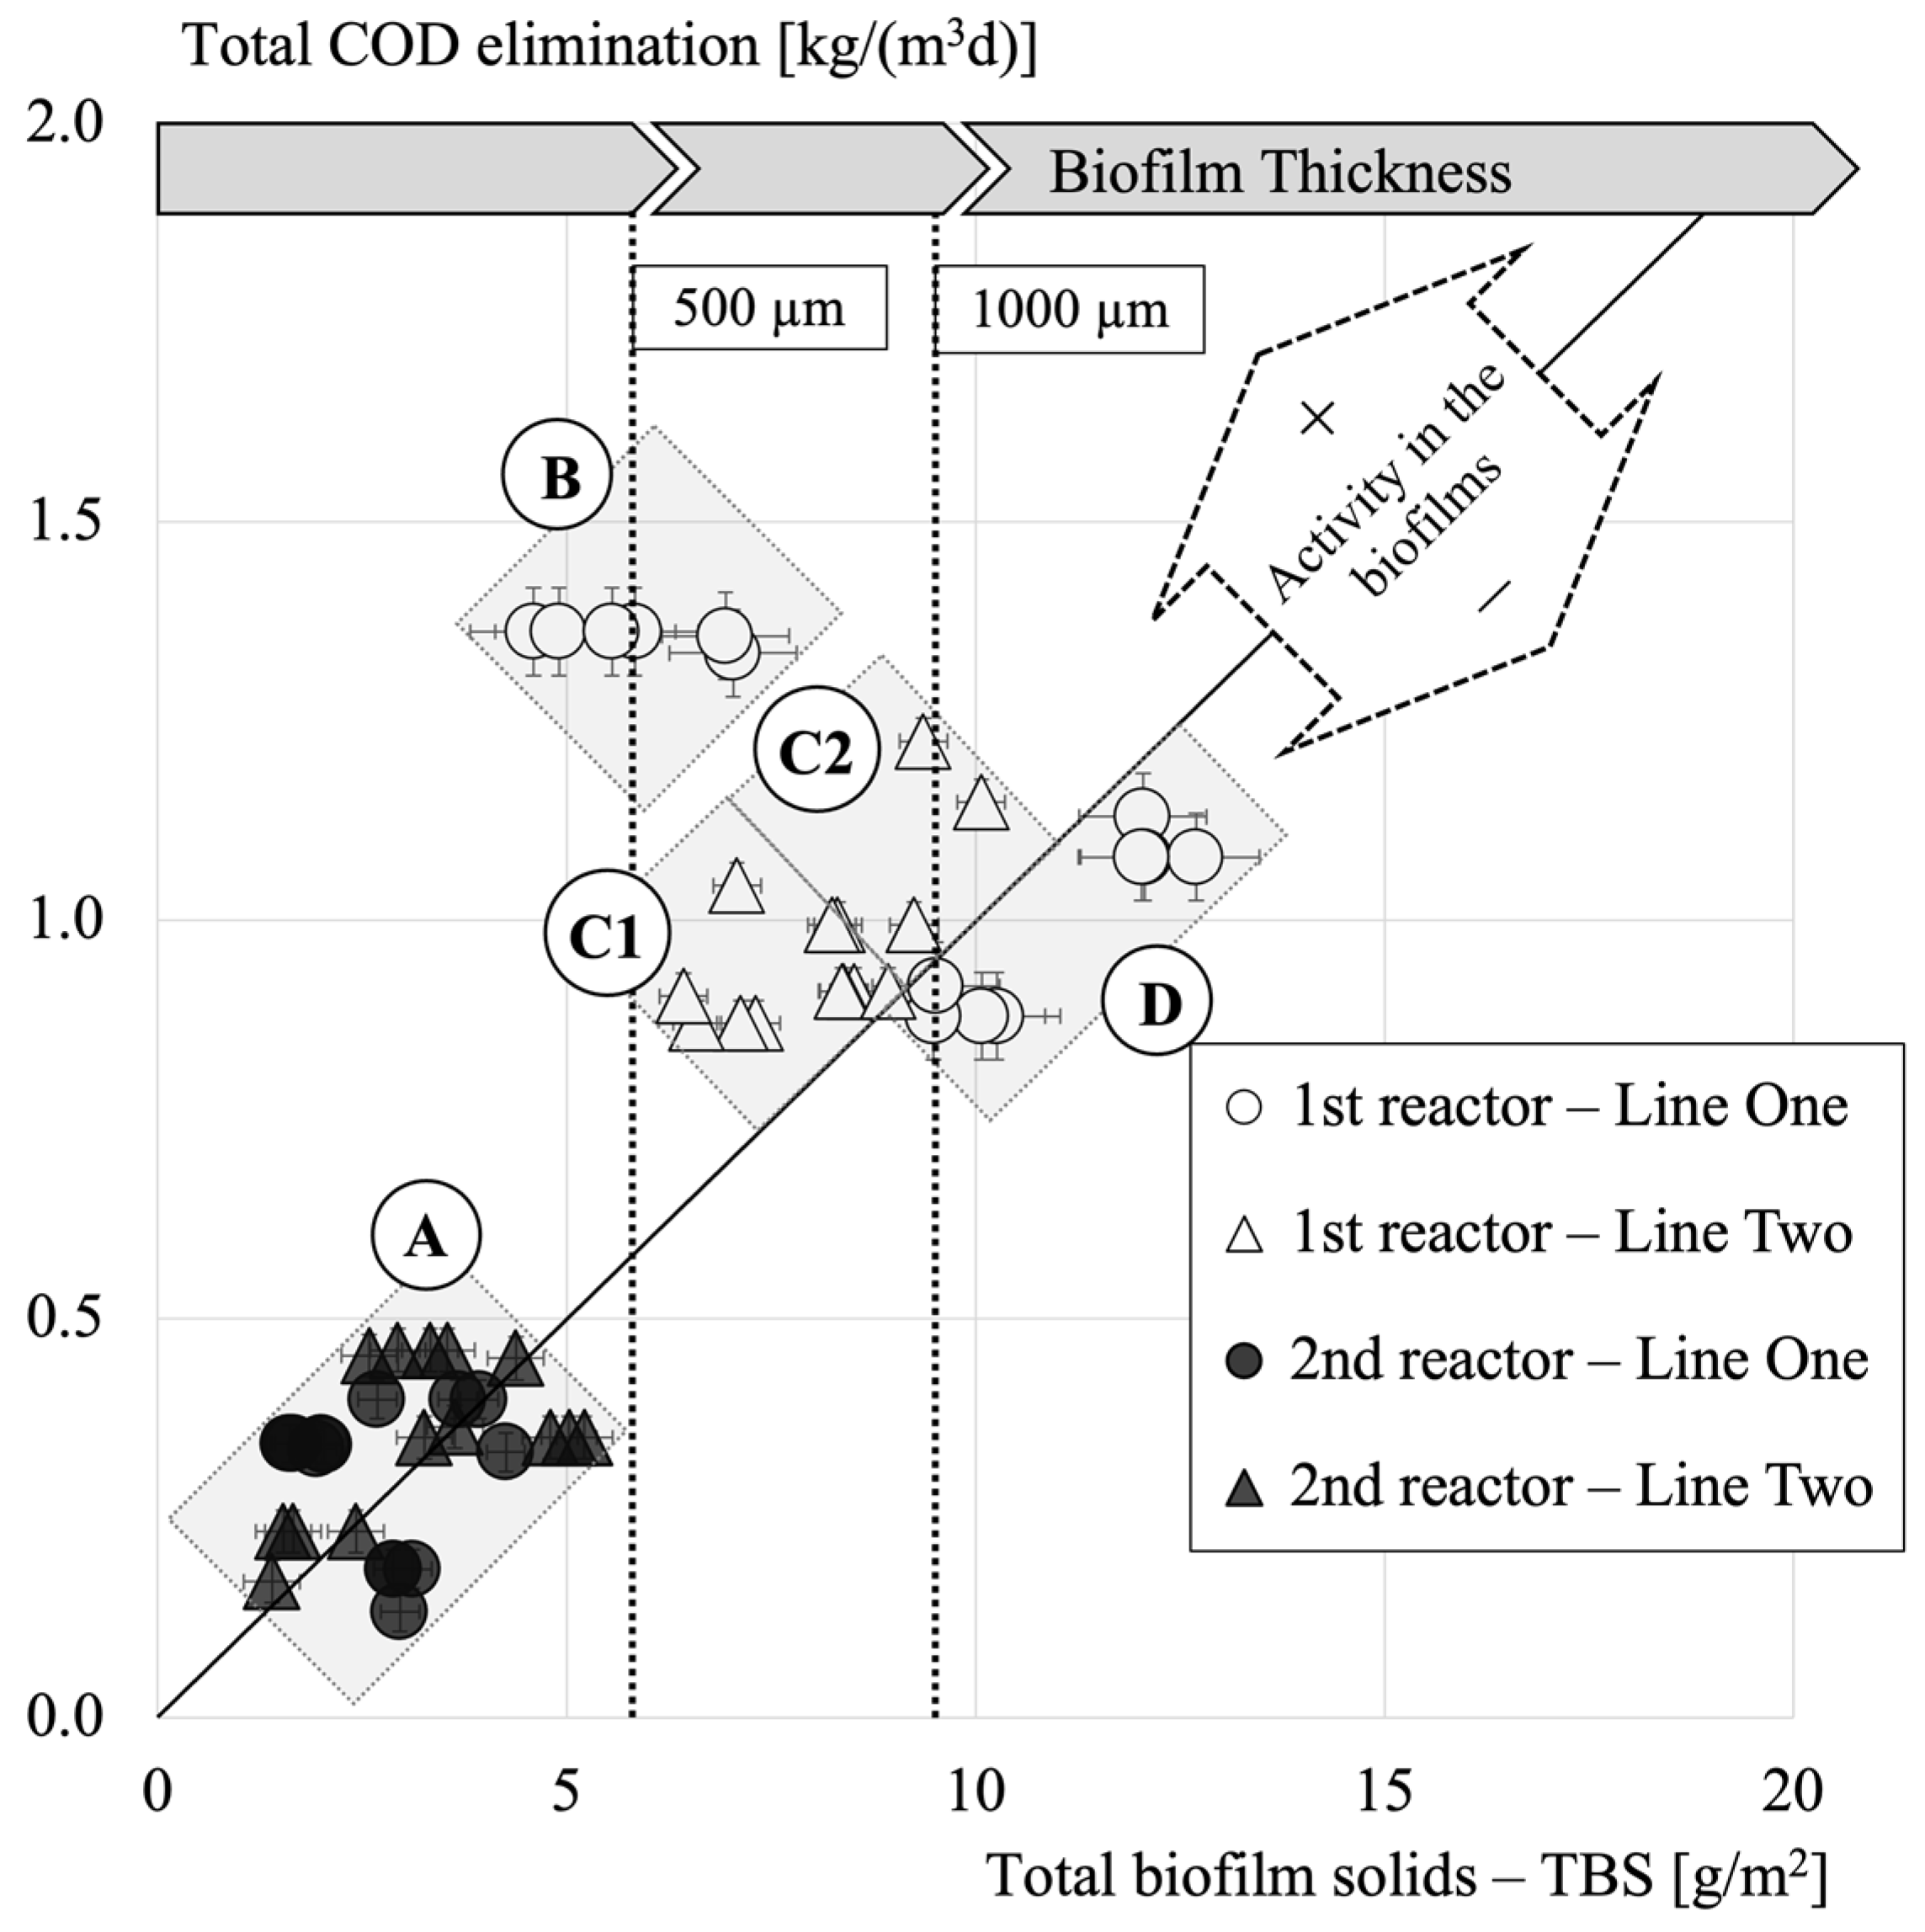
3.3. Biofilm Limitations

Due to the elimination of COD, carbon is incorporated into the total biomass solids (TBS) for the microbial growth [54]. This study aimed to investigate the limitations of the biofilm by using different carriers operating at various loads. Therefore, additional methods were used to classify the biomass in the biofilms. This included measuring the total biomass in each reactor by detaching it from a few carriers and calculating the TBS, as described in Section 2.4. Furthermore, the thickness of the biofilm was measured under the microscope to compare it with the TBS. Figure 6 illustrates the variation in COD elimination as a function of TBS and biofilm thickness, which exhibited a corresponding change in accordance with the different programs in this study.
Data “A” describe the second reactor in line one with a filling ratio of 30% and the second reactor in line two with a filling ratio of 23%. The total protected surface, measuring 6.8 m2 (Table 1), is the same in both reactors, but the filling ratio is different. This is due to variations in carrier size (14 mm and 17 mm), resulting in different protected surfaces for each carrier type (see Table 1). The thickness of the biofilms on both carrier sizes was found to be approximately 500 µm in both reactors. This is similar to the measured COD elimination (0.1–0.45 kg/(m3d)) and TBS (2–6 g/m2).
“D” represents the COD elimination and TBS values of the first reactor in line one with a filling ratio of 30%. TBS ranged from 8 to 13 g/m2, while COD was reduced between 0.8 and 1.2 kg/(m3d) due to significantly higher influent concentrations in the first reactor compared to the second reactor. These values differ from “B”, where the filling ratio was increased from 30% to 40% in the first reactor of line one (program 16). In “B”, COD elimination ranged from 1.4 to 1.45 kg/(m3d), and TBS ranged from 4 to 7 g/m2. Overall, there is a significant difference between “D” and “B”. “D” has higher TBS but lower COD elimination, whereas “B” has lower TBS but higher COD elimination. However, these differences can be explained by the thickness and colour of the biofilms on the carriers.
In “B”, the biofilm thickness is considerably thinner (around 500 µm), while the biofilm thickness is slightly over 1000 µm in “D”. Changes in program 16 led to differences in the biofilms. The carriers in line one were replaced with new clean carriers with no biofilm. It took approximately two weeks for the biofilm thickness to stabilize at around 500 µm under these new conditions, as observed in “B”. The change was made because microscopy of the carriers suggested that the lower layer of biofilm on the carriers might not be active anymore. This layer had a slightly brownish discoloration, which differed significantly from the white colour of the biofilm on the other carriers in the other reactors.
These original carriers “D” in line one were initially operated in a pilot plant, fed with real wastewater, and then transferred to the laboratory reactors of line one. Moreover, the carriers were initially inoculated on top of a nitrifying trickling filter prior to the pilot plant startup, which could have allowed nitrite-oxidizing bacteria (NOB) to colonize the carrier. Therefore, it is possible that an additional population of microorganisms had colonized the biofilms, which were no longer active under the laboratory conditions with synthetic wastewater and anoxic conditions.
The varying biofilm thicknesses, despite identical system conditions, suggests variable biofilm activity. The difference in TBS between “D” and “B” and the lower COD elimination in “D” highlights the crucial role of TBS control for biofilm system efficiency. This indicates the need for further investigation into TBS control in such systems.
To address the challenge of an inactive biofilm that may be diffusion-limited to nutrient transport, the study suggests two practical solutions. The first option is to remove carriers from the system and clean them to eliminate the inactive biofilm layers. However, this approach is impractical in most full-scale scenarios. The second option, which is more feasible, involves adding carriers to increase the available protected surface for the growth of new active biofilm layers.
The evaluation of “C1” reveals a TBS range of 6–8 g/m2 and COD reduction from 0.8 to 1.25 kg/(m3d) in the first reactor of line two, with a filling ratio of 23%, but an identically sized protected surface on the carriers as in the first reactor of line one shown in “D”. “C1” shows a heavily clogged carrier, with some areas having a biofilm thickness exceeding 1000 µm (see Figure 7). Due to the carrier reaching its limits, the filling ratio of the first reactor in line two was increased from 23% to 30% to provide more protected surface (from 6.8 to 8.9 m2) for microbial organisms, leading to increased TBS and COD elimination.
In “C2”, where the filling ratio of the first reactor in line two was increased to 30%, the biofilm thickness does not significantly differ from “C1”. However, the TBS increases to 8–10 g/m2, and COD elimination increases to 1.0–1.2 kg/(m3d). This is attributed to biofilm growth on the new carriers, which offer more protected surface for biofilm formation. The COD elimination in the first reactor of line two does not reach the level achieved in the first reactor of line one, which may be due to the limitation of biofilm growth using the smaller carriers but with a similar protected surface.
The evaluation of TBS and biofilm thickness allows to derive several biofilm properties in the system. Higher COD elimination results in the formation of more TBS, indicating the need for an increased protected surface for the biofilm. However, the protected surface alone is not the decisive factor; the available protected volume is more important, as biofilms can reach thicknesses of up to 1000 µm. The study highlights the differences between the two carrier sizes used, with the larger 17 mm carriers demonstrating better resilience in terms of TBS and biofilm thickness due to their larger protected volume.
The efficiency of biofilm systems is dependent on the performance of the biofilms on the carriers. Thinner biofilms are not generally more efficient than thicker biofilms, but researchers have explored different carriers to control biofilm thickness [34]. Thicker biofilms can impede nutrient transport due to increased diffusion paths [32]. Studies indicate that biofilms with more free space (protected volume) tend to be thinner due to flow velocity stress within the reactor [30]. While limiting biofilm thickness to the maximum available volume may seem logical, inactive biofilm layers can form on the carrier surface. Controlling biofilm thickness through carrier geometry and local flows can help improve nutrient supply and provide a reserve volume in case of inactive biofilm layers. Increasing the protected volume and effectively managing TBS in the system through appropriate carrier selection and filling ratios enhance biofilm resilience.

4. Conclusions

An innovative post-denitrification method as a polishing step of treated wastewater using moving bed biofilm reactors (MBBRs) was carried out in laboratory-scale reactors over a period of 335 days. Four continuous flow reactors were used, with varying loads of synthetic wastewater and hydraulic retention times (HRTs).
Denitrification was found to be effective within the temperature range of 12 °C to 16 °C, achieving a reduction in nitrate nitrogen from 10 mg/L to 2.1–4.9 mg NO3-N/L. However, one primary objective was to eliminate residual COD of the external carbon source, methanol. The results demonstrated that this could not be achieved by adjusting the COD/NO3-N ratio. Denitrification performance was negatively impacted when the carbon dosage fell below 4.65 mg COD/mg NO3-N, resulting in a less than 50% reduction in NO3-N. In order to reach almost complete COD elimination and reduce residual COD to 5–6 mg/L in the effluent, it was essential to increase the HRT to a minimum of 110 min. This aspect is rarely discussed in wastewater treatment, yet it offers significant advantages in design when it comes to efficiency in a polishing or final treatment process where COD has to be reduced to a minimum.
The study even showed that phosphate elimination during the denitrification process ranged from 0.4% to 0.5% of the eliminated COD, which is consistent with typical design principles for activated sludge systems. The evaluation of various operating programs revealed that between 10 and 22% of COD elimination was due to dissolved oxygen in the influent, which is typically found in the effluent of wastewater treatment in trickling filters.
In addition, the distribution of COD elimination between anabolism and catabolism fractions was determined. Microbial growth contributed to approximately 35–51% of COD elimination. The consumption ratio measured closely matched the yield factor of 0.45 kg CODbiomass/kg CODeliminated, as reported in the literature for activated sludge systems that use methanol as a carbon source.
The comparison of different carriers in the reactors revealed their impact on biofilm growth and activity. The maximum COD elimination achieved was 1.4 to 1.45 kg/(m3d), with a biofilm thickness of only 500 µm, which is a highly efficient result. It is important to note that biofilm thickness can reach up to 500–1000 µm even at lower COD elimination. This is due to the presence of inactive biofilm layers, which may result from long operation or changes in process. Therefore, reaching a biofilm thickness of 1000 µm may be limiting biofilm growth.
The limitations in biofilm growth that result from measuring the TBS, biofilm thickness, and COD elimination in the reactors are due to the limited protected volume of the smaller carrier. This demonstrated that the specification of the protected surface of the carrier plays a subordinate role.
Consequently, the selection of carriers employed in the MBBR process has a significant impact on performance and limitations. In this instance, carriers with a diameter and length of 17 mm exhibited greater resilience regarding biofilm growth limitation than the carriers with a diameter and length of 14 mm, despite having identical geometry.

Author Contributions

Conceptualization, S.L. and R.H.; methodology, S.L.; software, S.L.; validation, S.L., R.H. and M.W.; formal analysis, S.L.; investigation, S.L.; resources, S.L.; data curation, S.L.; writing—original draft preparation, S.L.; writing—review and editing S.L., R.H. and M.W.; visualization, S.L.; supervision, R.H. and M.W.; project administration, R.H.; funding acquisition, R.H. All authors have read and agreed to the published version of the manuscript.

Funding

This research was funded by the Bavarian State Ministry of the Environment and Consumer Protection and the Bavarian Environment Agency. Funding number: 67-0270-102566/2022.

Data Availability Statement

Data are contained within the article.

Conflicts of Interest

The authors declare no conflicts of interest.

References

  1. Ødegaard, H. MBBR and IFAS systems. In Advances in Wastewater Treatment; Mannina, G., Ekama, G., Ødegaard, H., Olsson, G., Eds.; IWA Publishing: London, UK, 2019; ISBN 9781780409719. [Google Scholar]
  2. Barwal, A.; Chaudhary, R. To study the performance of biocarriers in moving bed biofilm reactor (MBBR) technology and kinetics of biofilm for retrofitting the existing aerobic treatment systems: A review. Rev Env. Sci Biotechnol 2014, 13, 285–299. [Google Scholar] [CrossRef]
  3. Leiknes, T.; Ødegaard, H. The development of a biofilm membrane bioreactor. Desalination 2007, 202, 135–143. [Google Scholar] [CrossRef]
  4. Rusten, B.; Hem, L.J.; Ødegaard, H. Nitrification of municipal wastewater in moving-bed biofilm reactors. Water Environ. Res. 1995, 67, 75–86. [Google Scholar] [CrossRef]
  5. Bassin, J.; Dezotti, M. Moving Bed Biofilm Reactor (MBBR). In Advanced Biological Processes for Wastewater Treatment; Springer: Cham, Switzerland, 2018. [Google Scholar]
  6. Biswas, K.; Taylor, M.W.; Turner, S.J. Successional development of biofilms in moving bed biofilm reactor (MBBR) systems treating municipal wastewater. Appl. Microbiol. Biotechnol. 2014, 98, 1429–1440. [Google Scholar] [CrossRef] [PubMed]
  7. Andreottola, G.; Foladori, P.; Ragazzi, M. Upgrading of a small wastewater treatment plant in a cold climate region using a moving bed biofilm reactor (MBBR) system. Water Sci. Technol. 2000, 41, 177–185. [Google Scholar] [CrossRef]
  8. Stinson, B.; Peric, M.; Neupane, D.; Laquidara, M.; Locke, E.; Murthy, S.; Bailey, W.; Kharkar, S.; Passarelli, N.; Derminassian, R.; et al. Design and Operating Considerations for a Post Denitrification MBBR to Achieve Limit of Technology Effluent NOx < 1 mg/l and effluent TP < 0.18 mg/L. Proc. Water Environ. Fed. 2009, 2009, 1225–1254. [Google Scholar] [CrossRef]
  9. Ødegaard, H. New Applications for MBBR and IFAS Systems. In Frontiers in Wastewater Treatment and Modelling: FICWTM 2017; Mannina, G., Ed.; Springer: Cham, Switzerland, 2017; pp. 499–507. ISBN 978-3-319-58421-8. [Google Scholar]
  10. Hanner, N.; Aspegren, H.; Nyberg, U.; Andersson, B. Upgrading the Sjölunda WWTP according to a novel process concept. Water Sci. Technol. 2003, 47, 1–7. [Google Scholar] [CrossRef]
  11. Mases, M.; Dimitrova, I.; Nyberg, U.; Gruvberger, C.; Andersson, B. Experiences from MBBR Post-Denitrification Process in Long-term Operation at two WWTPs. Proc. Water Environ. Fed. 2010, 2010, 458–471. [Google Scholar] [CrossRef]
  12. Neupane, D.; Silverio, R.; Longerbeam, C.; Motsch, S.; McGrath, M.; McGettigan, J.; EuDaly, P.; Ortenzio, L.; Foster, D.; Zhao, H. Challenges in Starting up and Operating Attached Growth Denitrifying Process. Proc. Water Environ. Fed. 2014, 2014, 4649–4669. [Google Scholar] [CrossRef]
  13. Kopec, L.; Drewnowski, J.; Kopec, A. The application of moving bed biofilm reactor to denitrification process after trickling filters. Water Sci. Technol. 2016, 74, 2909–2916. [Google Scholar] [CrossRef]
  14. Czarnota, J.; Masłoń, A. Evaluation of the Effectiveness of a Wastewater Treatment Plant with MBBR Technology. Rocz. Ochr. Sr. 2019, 21, 906–925. [Google Scholar]
  15. Mannina, G.; Viviani, G. Hybrid moving bed biofilm reactors: An effective solution for upgrading a large wastewater treatment plant. Water Sci. Technol. 2009, 60, 1103–1116. [Google Scholar] [CrossRef]
  16. Leonhard, S.; Schreff, D.; Thoma, K.; Gander, W.; Wichern, M.; Hilliges, R. Single-stage MBBR as post-treatment step for upgrading large WWTPs—Experiences of one-year pilot plant operation. J. Water Process Eng. 2022, 46, 102570. [Google Scholar] [CrossRef]
  17. Christensen, M.H.; Harremoës, P. Biological denitrification of sewage: A literature review. In Proceedings of the Conference on Nitrogen as a Water Pollutant; Elsevier: Amsterdam, The Netherlands, 1977. [Google Scholar]
  18. Zhou, X.; Jiang, Z.; Gu, J.; Bi, X.; Liu, J.; Wang, X.; Yang, T.; Shi, X.; Cheng, L.; Huang, S.; et al. Performance characteristics and bacterial community analysis of a novel two-step-feed three-stage A/O-MBBR system for nitrogen removal in municipal wastewater. J. Water Process Eng. 2023, 52, 103513. [Google Scholar] [CrossRef]
  19. Chai, H.; Xiang, Y.; Chen, R.; Shao, Z.; Gu, L.; Li, L.; He, Q. Enhanced simultaneous nitrification and denitrification in treating low carbon-to-nitrogen ratio wastewater: Treatment performance and nitrogen removal pathway. Bioresour. Technol. 2019, 280, 51–58. [Google Scholar] [CrossRef] [PubMed]
  20. Zhu, T.; Zhang, Y.; Quan, X.; Li, H. Effects of an electric field and iron electrode on anaerobic denitrification at low C/N ratios. Chem. Eng. J. 2015, 266, 241–248. [Google Scholar] [CrossRef]
  21. Rong, Y.; Liu, X.; Wen, L.; Jin, X.; Shi, X.; Jin, P. Advanced nutrient removal in a continuous A2/O process based on partial nitrification-anammox and denitrifying phosphorus removal. J. Water Process Eng. 2020, 36, 101245. [Google Scholar] [CrossRef]
  22. Pang, W.; Li, H.; He, Y.; Zhou, B.; Ji, C.; Li, T.; Wang, X.; Xie, L. Nitrate reduction pathways and microbial community to different COD/NO3−-N ratios in mesophilic and thermophilic denitrification systems. J. Water Process Eng. 2023, 53, 103797. [Google Scholar] [CrossRef]
  23. Zhou, X.; Zhang, Y.; Li, Z.; Sun, P.; Hui, X.; Fan, X.; Bi, X.; Yang, T.; Huang, S.; Cheng, L.; et al. A novel two-stage anoxic/oxic-moving bed biofilm reactor process for biological nitrogen removal in a full-scale municipal WWTP: Performance and bacterial community analysis. J. Water Process Eng. 2022, 50, 103224. [Google Scholar] [CrossRef]
  24. Fu, Z.; Yang, F.; Zhou, F.; Xue, Y. Control of COD/N ratio for nutrient removal in a modified membrane bioreactor (MBR) treating high strength wastewater. Bioresour. Technol. 2009, 100, 136–141. [Google Scholar] [CrossRef]
  25. Piculell, M.; Welander, P.; Jönsson, K.; Welander, T. Evaluating the effect of biofilm thickness on nitrification in moving bed biofilm reactors. Environ. Technol. 2016, 37, 732–743. [Google Scholar] [CrossRef] [PubMed]
  26. Torresi, E.; Fowler, S.J.; Polesel, F.; Bester, K.; Andersen, H.R.; Smets, B.F.; Plósz, B.G.; Christensson, M. Biofilm Thickness Influences Biodiversity in Nitrifying MBBRs-Implications on Micropollutant Removal. Environ. Sci. Technol. 2016, 50, 9279–9288. [Google Scholar] [CrossRef] [PubMed]
  27. Suarez, C.; Piculell, M.; Modin, O.; Langenheder, S.; Persson, F.; Hermansson, M. Thickness determines microbial community structure and function in nitrifying biofilms via deterministic assembly. Sci. Rep. 2019, 9, 5110. [Google Scholar] [CrossRef] [PubMed]
  28. Shrestha, A. Specific Moving Bed biofilm Reactor in Nutrient Removal from Municipal Wastewater. Ph.D. Thesis, University of Technology, Sydney, Australia, 2013. [Google Scholar]
  29. van Loosdrecht, M. A more unifying hypothesis for biofilm structures. FEMS Microbiol. Ecol. 1997, 24, 181–183. [Google Scholar] [CrossRef]
  30. Garcia, K.A.; McLee, P.; Schuler, A.J. Effects of media length on biofilms and nitrification in moving bed biofilm reactors. Biofilm 2022, 4, 100091. [Google Scholar] [CrossRef] [PubMed]
  31. Stewart, P.S. A review of experimental measurements of effective diffusive permeabilities and effective diffusion coefficients in biofilms. Biotechnol. Bioeng. 1998, 59, 261–272. [Google Scholar] [CrossRef]
  32. Stewart, P.S. Diffusion in biofilms. J. Bacteriol. 2003, 185, 1485–1491. [Google Scholar] [CrossRef] [PubMed]
  33. Wäsche, S.; Horn, H.; Hempel, D.C. Mass transfer phenomena in biofilm systems. Water Sci. Technol. 2000, 41, 357–360. [Google Scholar] [CrossRef]
  34. Piculell, M. New Dimensions of Moving Bed Biofilm Carriers: Influence of Biofilm Thickness and Control Possibilities. Ph.D. Thesis, Lund University, Lund, Sweden, 2016. [Google Scholar]
  35. Rusten, B.; Eikebrokk, B.; Ulgenes, Y.; Lygren, E. Design and operations of the Kaldnes moving bed biofilm reactors. Aquac. Eng. 2006, 34, 322–331. [Google Scholar] [CrossRef]
  36. Barwal, A.; Chaudhary, R. Impact of carrier filling ratio on oxygen uptake & transfer rate, volumetric oxygen transfer coefficient and energy saving potential in a lab-scale MBBR. J. Water Process Eng. 2015, 8, 202–208. [Google Scholar] [CrossRef]
  37. Matheus, M.C.; Lourenço, G.R.; Solano, B.A.; Dezotti, M.W.; Bassin, J.P. Assessing the impact of hydraulic conditions and absence of pretreatment on the treatability of pesticide formulation plant wastewater in a moving bed biofilm reactor. J. Water Process Eng. 2020, 36, 101243. [Google Scholar] [CrossRef]
  38. Kargol, A.K.; Burrell, S.R.; Chakraborty, I.; Gough, H.L. Synthetic wastewater prepared from readily available materials: Characteristics and economics. PLoS Water 2023, 2, e0000178. [Google Scholar] [CrossRef]
  39. Cokgor, E. Anaerobic treatment of synthetic domestic wastewater. Fresenius Environ. Bull. 1998, 7, 531–538. [Google Scholar]
  40. Kermani, M.; Bina, B.; Movahedian, H.; Amin, M.M.; Nikaeen, M. Biological Phosphorus and Nitrogen Removal from Wastewater Using Moving Bed Biofilm Process. Iran. J. Biotechnol. 2009, 7, 19–27. [Google Scholar]
  41. Arbeitsblatt DWA-A 131 Bemessung von Einstufigen Belebungsanlagen; Deutsche Vereinigung für Wasserwirtschaft, Abwasser und Abfall: Hennef, Germany, 2016; ISBN 9783887213312.
  42. Steinbrenner, C. Biochemische und Molekularbiologische Charakterisierung von Biofilmen des WSB®—Verfahrens im Vergleich zu Belebtschlammverfahren unter Besonderer Berücksichtigung der Nitrifikation. Ph.D. Thesis, TU Dresden, Dresden, Germany, 2011. [Google Scholar]
  43. Leonhard, S.; Thoma, K.; Schreff, D.; Wichern, M.; Hilliges, R. Rest-Stickstoff-Elimination aus gereinigtem Abwasser im Bypass: Ein modifiziertes Verfahren mit Wirbelschwebebett-Technologie. gwf Wasser|Abwasser 2024, 165, 73–79. [Google Scholar] [CrossRef]
  44. Monod, J. The Growth of Bacterial Cultures. Annu. Rev. Microbiol. 1949, 3, 371–394. [Google Scholar] [CrossRef]
  45. Ødegaard, H.; Rusten, B.; Westrum, T. A new moving bed biofilm reactor—Applications and results. Water Sci. Technol. 1994, 29, 157–165. [Google Scholar] [CrossRef]
  46. Welander, U.; Mattiasson, B. Denitrification at low temperatures using a suspended carrier biofilm process. Water Res. 2003, 37, 2394–2398. [Google Scholar] [CrossRef]
  47. Comeau, Y.; Henze, M.; van Loosdrecht, M.C.M.; Ekama, G.A.; Brdjanovic, D. Biological Wastewater Treatment: Microbial Metabolism; IWA Publishing: London, UK, 2008; pp. 19–32. ISBN 9781843391883. [Google Scholar]
  48. Barjenbruch, K.; Hiltbrand, R.; Kosarik, J.M.; Laplante, R.E. Examination of a Lake-Effect Snow Event with the Focus on New Technology; 1997. Available online: https://repository.library.noaa.gov/view/noaa/6688 (accessed on 20 June 2024).
  49. Mahro, B. Zur Bedeutung des Nitratsauerstoffs bei der biologischen Abwasserreinigung. KA Korresp. Abwasser Abfall 2006, 2006, 916–919. [Google Scholar]
  50. Vocks, M.; Adam, C.; Lesjean, B.; Gnirss, R.; Kraume, M. Enhanced post-denitrification without addition of an external carbon source in membrane bioreactors. Water Res. 2005, 39, 3360–3368. [Google Scholar] [CrossRef]
  51. McCarty, P.L. Biological denitrification of wastewaters by addition of organic materials. In Proceedings of the 24th Annual Purdue Industrial Waste Conference, Purdue University, Lafayette, IN, USA, 6–8 May 1969; pp. 1271–1285. [Google Scholar]
  52. Weissbrodt, D.G.; Laureni, M.; van Loosdrecht, M.C.M.; Comeau, Y. (Eds.) Biological Wastewater Treatment: Principles, Modeling and Design, 2nd ed.; IWA Publishing: London, UK, 2020. [Google Scholar]
  53. Gujer, W.; Henze, M.; Mino, T.; van Loosdrecht, M. Activated Sludge Model No. 3. Water Sci. Technol. 1999, 39, 183–193. [Google Scholar] [CrossRef]
  54. Heijnen, J.J.; Robbert Kleerebezem, R. (Eds.) Bioenergetics of Microbial Growth; Wiley: Hoboken, NJ, USA, 2010. [Google Scholar]
Figure 1. Schematic sketch of line one with 17 mm carriers and line two with 14 mm carriers.
Water 16 01829 g001
Figure 2. COD elimination [%] and COD concentration in the effluent [mg/L] as a function of the hydraulic retention time (HRT) of the 1st and 2nd reactor in line one in program no. 4–12—constant water temperature 16 °C, nitrate nitrogen concentrations in the influent of 10–14 mg NO3-N/L.
Water 16 01829 g002
Figure 3. Total COD elimination balance between the aerobic and anoxic carbon oxidation in line one—programs no. 1–19. NO3-N reduction = NO3-Nreduced·2.86 O2/NO3-N.
Water 16 01829 g003
Figure 4. Total COD elimination as a function of measured O2 reduction plus NO3-N reduction indicating the yield in denitrification. NO3-N reduction = NO3-Nreduced·2.86 O2/NO3N.
Water 16 01829 g004
Figure 5. Total COD elimination as a function of measured excess sludge in the effluent of the 1st reactor and 2nd reactor in Line One.
Water 16 01829 g005
Figure 6. COD elimination as a function of total biofilm solids (TBS) and the biofilm thickness of the 1st and 2nd reactors in line one and line two.
Water 16 01829 g006
Figure 7. Photo documentation of biofilm thickness with digital microscope A = 17 mm carrier (2nd reactor—line one) and 14 mm carrier (2nd reactor—line two); D/B = 17 mm carrier (1st reactor—line one) with filling ratio 30%/40%; C1/C2 = 14mm carrier (1st reactor—line two) with a filling ratio 23%/30%.
Water 16 01829 g007
Table 1. Reactor conditions and carrier specification.
Line OneLine Two
1st Reactor2nd Reactor1st Reactor2nd Reactor
Reactor volume [L]46464646
Filling ratio [%]30 and 403023 and 3023
Carrier media (Hel-x—Christian Stöhr Ltd.)HXF17KLLHXF17KLLHXF14KLLHXF14KLL
Diameter and length of the carrier [mm]17171414
Total protected surface [m2/reactor]6.8 and 9.16.86.8 and 8.96.8
Protected surface [m2/m3Carrier]496496644644
Protected surface [m2/m3Volume Reactor]148 and 198148148 and 193148
HRT per reactor [min]28–5528–5528–5528–55
HRT per line [min]56–11056–110
Table 2. Influent concentrations to line one and two and configuration of investigated programs.
Line One and Line Two
ProgramDurationNO3-NCOD/NO3-NCODdosed (1)PO4-PDissolved O2Temp.Flow Rate OneFlow Rate Two
[d][mg/L][mg/mg][mg/L][mg/L][mg/L][°C][L/h][L/h]
136104.6546.50.37.91294
223104.6546.50.37.8149447
318104.6546.50.37.4169493
415105.5555.50.37.3164747
513104.6546.50.36.9164847
615105.5555.50.36.9164847
713105.5555.50.36.6167474
814105.5555.50.16.6167476
97105.5555.50.26.3167576
1014144.6565.10.36.4167576
1114144.6565.10.36.5164749
1214145.2573.50.36.7164749
1314144.6565.10.36.7144749
1414144.6565.10.36.7144849
1529104.6546.50.36.9144748
16 (2)24104.6546.50.37.4124748
1716145.2573.50.37.9124748
1813145.2573.50.37.8144748
1929145.2573.50.38.0164748
Note: (1) Carbon dosage with methanol (CH3OH) as a function of nitrate nitrogen feed concentration—COD/CH3OH ratio = 1.5. (2) Increase in filling ratio from 30 to 40% in the 1st reactor of line One and from 23 to 30% in the 1st reactor of line Two (see Section 2.1).
Table 3. Composition for synthetic wastewater and external carbon source in the inlet of the reactors.
IngredientWastewater ConstituentsChemical FormulaProducer
Drinking water, temperature-controlled WaterH2OAugsburg municipal utilities
Sodium nitrate, untreatedNO3-NNaNO3BASF SE, Ludwigshafen, Germany
Di-potassium hydrogen phosphate, purePO4-PK2HPO4AppliChem GmbH, Darmstadt, Germany
Methanol pure 99.5%Carbon sourceCH3OHhäberle Labortechnik GmbH+Co.KG, Lonsee-Ettlenschieß, Germany
Disclaimer/Publisher’s Note: The statements, opinions and data contained in all publications are solely those of the individual author(s) and contributor(s) and not of MDPI and/or the editor(s). MDPI and/or the editor(s) disclaim responsibility for any injury to people or property resulting from any ideas, methods, instructions or products referred to in the content.

