Article

The Hydrogeochemical Processes of Groundwater in the Bieletan Area, the Western Potash Production Region in China

1
Xi’an Center of China Geological Survey, Xi’an 710119, China
2
Key Laboratory for Groundwater and Ecology in Arid and Semi-Arid Areas, China Geological Survey, Xi’an 710119, China
*
Author to whom correspondence should be addressed.
Water 2024, 16(13), 1833; https://doi.org/10.3390/w16131833
Submission received: 27 May 2024 / Revised: 17 June 2024 / Accepted: 26 June 2024 / Published: 27 June 2024
(This article belongs to the Special Issue Mine and Water)

Abstract

:
The hydrogeochemical research of groundwater in the Bieletan area, China’s largest potash producing zone, used a variety of methods, including multivariate analysis, saturation index, and hydrogeochemical modeling. Water samples were collected and analyzed for physicochemical parameters, along with soluble ions from soil cores. The results showed that total dissolved solids (TDS) of groundwater exceeded 300 g/L, with the main hydrochemical characteristics being Cl-Mg type and Cl-Na type. Groundwater is recharged by lake water and canal water, with evaporation being the main factor affecting water chemistry. Hydrogeochemical modeling analyzed the processes occurring from these two different recharge sources: mineral precipitation mainly occurred with lake water recharge, while mineral dissolution mainly occurred with canal water recharge. Regarding potash dissolution, canal water and lake water recharge resulted in 8.860 mmol/L of polyhalite dissolution and 0.278 mmol/L of carnallite dissolution, respectively. This study highlights the complex hydrogeochemical processes controlling groundwater in the potash-rich Bieletan area, providing insights for water resource management and potash mining.

Graphical Abstract

1. Introduction

Potash is considered a strategic resource because potassium is an essential nutrient for plants, as well as for animals and humans [1,2,3]. Potash resources are abundant worldwide, but both resources and production are primarily concentrated in a few countries such as Canada [4], Russia [5], and Belarus [6]. Due to limited land availability, China’s agricultural production heavily relies on fertilizers, especially potash, to increase crop yields [7,8]. Most potash mines around the world use traditional underground mining methods to extract solid potash [9,10]. Solution mining is another method that involves extracting potash-bearing solutions from groundwater. The extracted saturated potash solution is then transferred to evaporation ponds, where the salt and potash are concentrated through evaporation. This method of potash extraction is used in countries such as Chile [11,12], the United States [13], and China [14].
Qarhan Salt Lake is the largest salt lake in China. The Bieletan area, situated in the western part of Qarhan Salt Lake, is the largest potash production region in Qarhan Salt Lake and China. The potash-bearing layers in the Bieletan area are thin and lenticular, with multiple sedimentary strata that are generally thin and discontinuous. Therefore, solution mining is used to extract potash from these layers. Understanding the hydrogeochemical processes occurring during groundwater flow is crucial for the development and utilization of potash [15]. Xiao et al. used isotopic and numerical simulation methods to study the origin of groundwater in the Qarhan Salt Lake area, finding that the contribution of modern groundwater to the salt lake area is minimal [16]. Li et al. used PHREEQC to study the factors affecting the dissolution of solid potash minerals in the Qarhan Salt Lake area [17]. However, previous studies have primarily concentrated on the groundwater origin and potash development in the study area, paying less attention to the hydrogeochemical processes of groundwater during potash extraction. Understanding these processes is crucial for comprehending the hydrogeochemical mechanisms of groundwater.
A suite of hydrogeochemical techniques, including multivariate statistics, saturation indices, and hydrogeochemical modeling, is extensively employed to investigate groundwater sources, influencing factors, and hydrogeochemical processes [18,19,20,21,22]. De Caritat et al. used multivariate statistical analysis and saturation indices to study the factors influencing groundwater chemistry in the arid regions of Saudi Arabia [23]. El Alfy et al. investigated the groundwater sources in the Lake Woods region of Australia using saturation indices and hydrogeochemical modeling, concluding that the weathering of potassium silicates in the main aquifer is the source of potassium enrichment [24]. Parisi et al. investigated the spatiotemporal distribution of groundwater chemistry in the arid and semi-arid regions of southern Italy using multivariate statistical analysis and hydrogeochemical methods [25]. These studies demonstrate that the combination of these methods can effectively analyze hydrogeochemical processes in groundwater.
This study combines multivariate statistics, saturation indices, and hydrogeochemical modeling methods to analyze the hydrogeochemical processes of groundwater in the Bieletan area by examining soluble salts in soil and groundwater chemical indicators. The objectives of this study are to (1) examine the hydrogeochemical characteristics of groundwater in the Bieletan area; (2) analyze the key influencing factors of groundwater; and (3) investigate the primary hydrogeochemical processes occurring during groundwater recharge.

2. Study Area

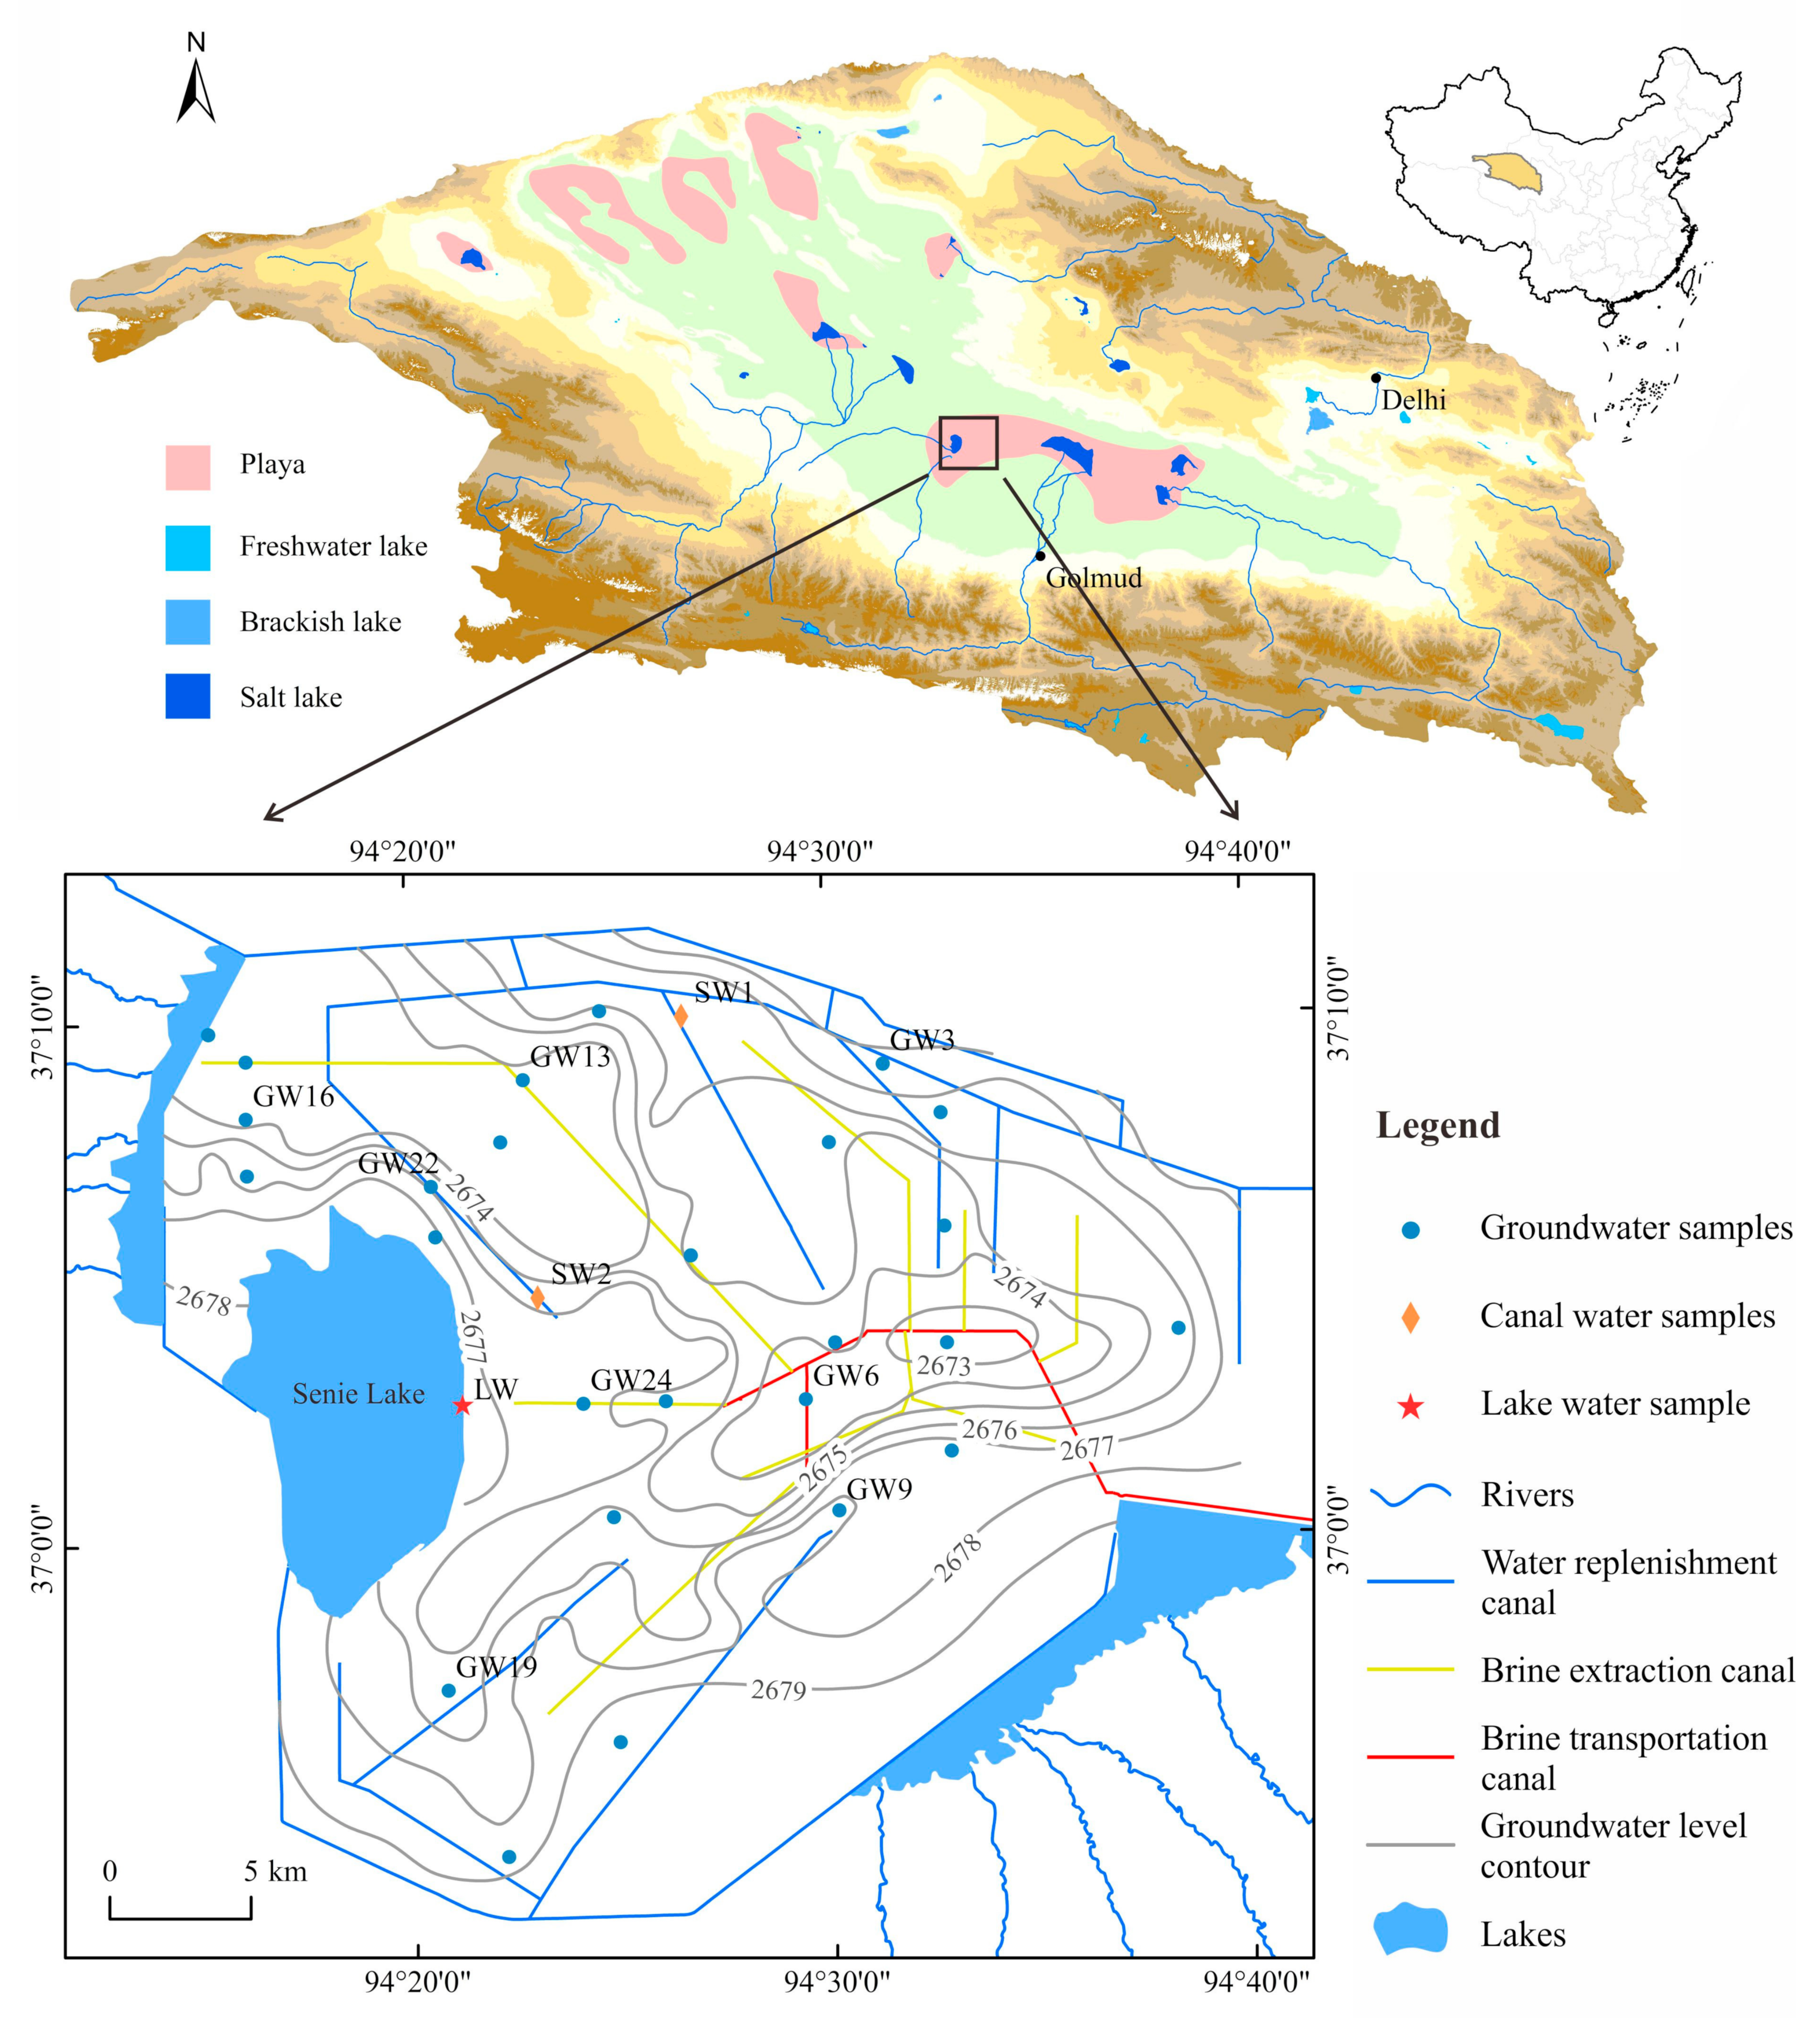
2.1. Location and Climate

The Qaidam Basin is a large, closed basin located in the northwest of China. Surrounded by mountains exceeding 4000 m in height, the basin’s core plain has an average elevation of around 2800 m. This central plain is covered by dry salt flats and numerous shallow saline lakes (Figure 1). It contains roughly 27 salt lakes [26]. Eight rivers converge in the Qarhan Salt Lake area, which includes four major lakes from west to east: Senie Lake, Dabuxun Lake, South Huobuxun Lake, and North Huobuxun Lake [27]. These lakes are all terminal lakes. The Bieletan area, where Senie Lake is located, serves as the primary production area for potassium and lithium salts in the Qarhan Salt Lake area. The Bieletan area, covering approximately 950 km2, extends between east longitudes 94°00′00″–94°55′00″ and north latitudes 36°45′00″–37°18′00″. Situated at elevations ranging from 2678 to 2681 m, it features relatively flat terrain.
The mountain ranges in the southwest of the Qaidam Basin block warm and wet air currents from the Indian Ocean, creating a climate dominated by cold air masses from Siberia, characterized as a dry continental climate. The Bieletan area has a dry environment with low relative humidity, low moisture content, strong atmospheric transparency, long daylight hours, intense solar radiation, relatively high temperatures, and a short frost-free season. The Bieletan area has an average annual temperature of 5.3 °C, with 24.1 mm of precipitation and 3500 mm of evaporation. The average relative humidity is 26%, and the average wind speed is 4.3 m/s, primarily from the northwest and southwest directions.

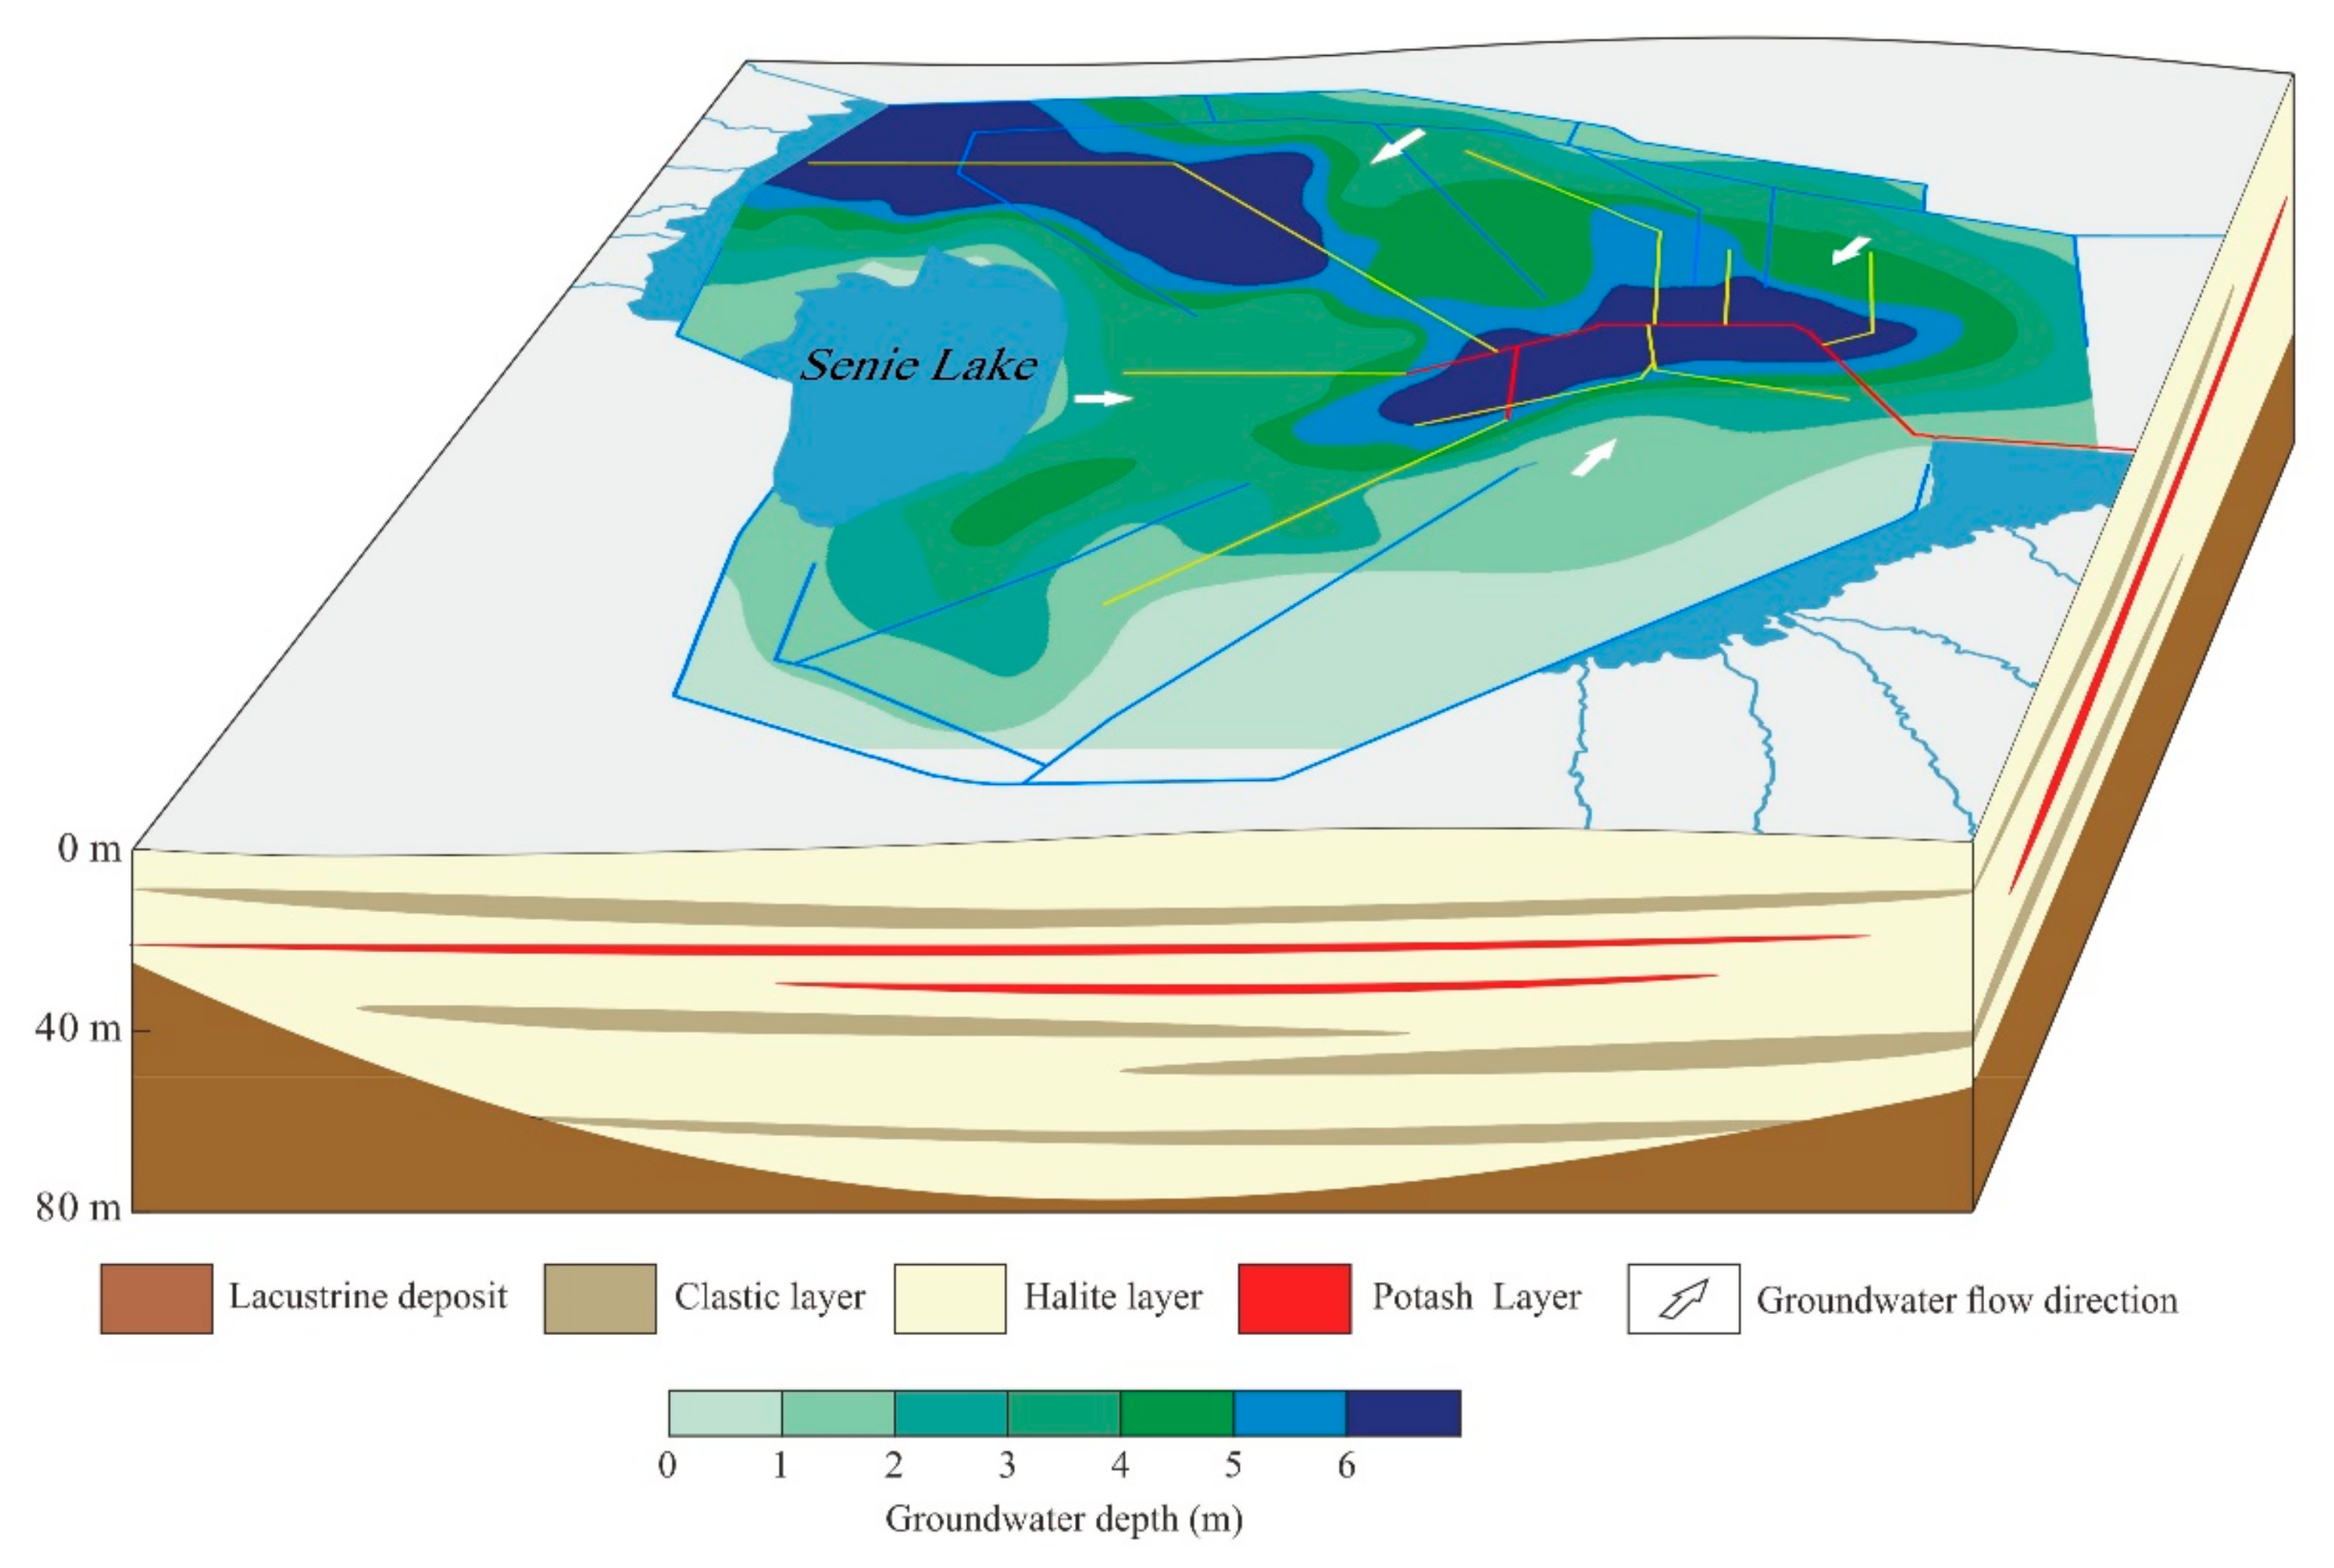
2.2. Geological and Hydrogeological Settings

The Qaidam Basin, situated within a complex network of compressive structures in the northeastern Qinghai-Tibet Plateau, represents the largest topographic depression on the plateau [28]. This geological environment has fostered the formation of extensive halite deposits intertwined with clastic sediment [29]. The Bieletan region, entirely covered in quaternary sediments, has sediment thicknesses of up to 2700 m. The upper portion has salt-bearing strata up to 70 m thick, mostly formed of clastic, halite, and potash layers (Figure 2). The postal layer is predominantly located in the uppermost layers. Shallow groundwater is primarily found in the upper quaternary porous sediments, which are also the focus of this study. Senie Lake and artificial water replenishment canals are the main sources of groundwater recharge. Groundwater primarily flows from the surrounding areas toward the central area, with evaporation and human extraction serving as the main discharge processes. Extracted groundwater is transported through brine transportation canals to salt farms beyond the study area. It is evident that there are two groundwater depression funnels in the research region, associated with groundwater extraction.

3. Material and Methods

3.1. Sampling Collection

This study collected 26 groundwater samples in September 2023. Additionally, 2 replenishment canal samples and 1 Senie Lake water sample were collected to investigate their impact on groundwater recharge. The water quality data included measurements of pH, concentrations of specific cations (K+, Na+, Ca2+, Mg2+), anions (SO42−, Cl, CO32−, HCO3), TDS, Li+, and water density. In October 2023, a total of 21 soluble salt samples were collected from three boreholes (GW6, GW16, GW19). Each borehole yielded 7 soluble salt samples from depths of 0.5 m, 1 m, 2 m, 3 m, 5 m, 7 m, and 10 m below the surface, respectively. Dissolved ions in these samples were detected by analyzing the filtrate, which was filtered after the soil sample was mixed with no-CO2 water by a ratio of 1 (soil) to 5 (water) and vibrated for 3 min. The detection of all samples included measurements of pH, concentrations of specific cations (K+, Na+, Ca2+, Mg2+), anions (SO42−, Cl, CO32−, HCO3), and Li+. All samples were analyzed by the Xi’an Center of the China Geological Survey. The concentrations of K+, Na+, Ca2+, Mg2+, and Li+ were analyzed using an Inductively Coupled Plasma Optical Emission Spectrometer (ICP-OES) (PerkinElmer Inc., Shelton, WA, USA). SO42− was also measured using ICP-OES. Cl was determined by silver nitrate titration, while CO32− and HCO3 were analyzed using titration methods. TDS were measured by drying and weighing. To ensure the validity and accuracy of the data, duplicate analyses were performed for each sample, with the replicates showing an error within ±5%. The accuracy and precision of the analyses were verified by analyzing certified reference materials (CRMs) under the same conditions, thereby guaranteeing the reliability of the data. Additionally, blank samples were included in the analysis to monitor and control potential contamination during sample handling and processing. The ion charge balance error percentage (%CBE) is used to calculate the ion balance error of water samples. The ion charge balance error percentage is calculated according to Formula (1):
% CEB = ( | TC - TA | ) ( TC - TA ) × 100 %
where TC and TA represent the total concentrations of cations and anions, respectively. The units for both cations and anions are milliequivalents per liter (meq/L). The ion balance error for all water samples was less than 1.69%, and the ion balance error for soluble salts was less than 9.65%. An ion balance error of less than 10% is considered to provide reliable chemical analysis results for hydrogeochemical investigations [30].

3.2. Saturation Index

The Saturation Index (SI) is crucial for evaluating the equilibrium and reactivity between minerals and groundwater [31]. The SI of minerals in water was calculated according to the following Formula (2):
SI = log ( IAP K sp )
where, IAP is the ion activity product of the dissolving mineral, and Ksp is the solubility product constant of the mineral. PHREEQC 3.7.3 was used to calculate the SI of possible mineral phases [32]. A positive SI indicates supersaturation (precipitation potential), a negative SI indicates undersaturation (dissolution potential), and an SI of zero indicates equilibrium.

3.3. Hydrogeochemical Modeling

Geochemical simulation is an essential tool for studying the evolution of water chemistry, and inverse modeling is one of the key modeling methods for hydrogeochemical research [33,34]. In this study, PHREEQC is employed for geochemical simulation. Determining the initial and final solutions along the groundwater flow path is a necessary step in modeling. Inverse modeling calculates the moles of minerals dissolved in or precipitated from the solution based on mass balance rules to explain the compositional differences between the initial and final endpoint solutions [35]. The mass balance of the conceptual models can be expressed as the following Formula (3):
j = 1 n a i j x j = b i
where aij represents the stoichiometric coefficient of element i in mineral j, xj denotes the molar quantity of minerals or gases that have either dissolved, precipitated, or degassed, and bi signifies the change in concentration of element i in the final water solution relative to the initial water solution.

4. Results

4.1. Characteristics of Major Indices

The statistical summary of chemical analysis results for groundwater (GW), replenishment canal water samples (SW), and lake water (LW) is presented in Table 1. The pH values of GW range from 7.76 to 8.71, with an average of 8.41. The average pH for SW is 8.85, and for LW it is 8.75. Therefore, all water bodies in the study area exhibit weak alkalinity. The average concentrations of K+, Na+, and Ga2+ in GW are 9.98 g/L, 47.95 g/L, and 0.73 g/L, respectively, whereas in SW they are 0.72 g/L, 5.62 g/L, and 0.11 g/L, respectively. For LW, the concentrations of K+, Na+, and Ga2+ are 2.52 g/L, 4.70 g/L, and 0.05 g/L, respectively. This suggests that the average concentrations of K+, Na+, and Ga2+ are higher in GW compared to SW and LW. The average concentrations of Mg2+ and CO32− in GW are 47.94 g/L and 0.08 g/L, respectively, while in SW they are 52.02 g/L and 0.37 g/L, and in LW they are 106.56 g/L and 0.78 g/L, respectively. This indicates that the average concentrations of Mg2+ and CO32− in GW are lower compared to SW and LW. The average concentrations of SO42−, Cl, and total dissolved solids (TDS) in GW are 11.89 g/L, 213.24 g/L, and 332.03 g/L, respectively, while in SW they are 8.62 g/L, 152.27 g/L, and 219.73 g/L, and in LW they are 16.61 g/L, 297.79 g/L, and 428.46 g/L, respectively. The average concentrations of SO42−, Cl, and TDS are higher in GW compared to SW but lower compared to LW. The coefficient of variability (CV) represents the ratio of the standard deviation (SD) to the mean, with a higher CV indicating greater variability. The CV values for the chemical components of GW range from 1% to 149%, with Ca2+ and HCO3 having CV values greater than 100% and Cl, pH, TDS, and density having CV values less than 10%.
The statistical results of core soluble salts are presented in Table 2, showing the average contents of K+, Na+, Ca2+, and Mg2+ in borehole cores to be 3.31, 150.01, 5.40, and 8.10 g/kg, respectively. The average contents of SO42−, Cl, CO32−, and HCO3 are 10.32, 302.70, 0.08, and 0.15 g/kg, respectively. The average content of Li+ is 0.13 g/kg. The pH average of core leachates is 8.28, ranging from 8.03 to 8.53, indicating alkaline properties across the cores, which is one of the reasons for the alkalinity of groundwater in the study area. Na+ and Cl have the largest amounts in soluble salts. K+ and Li+ have the largest coefficients of variation, indicating an unequal distribution throughout the strata.

4.2. Correlation Analysis

Correlation analysis is a valuable tool in groundwater chemistry studies for identifying relationships between different chemical parameters, understanding the underlying geochemical processes [36]. The findings of a Spearman correlation study performed to evaluate the possible link between various ions of the soluble salts are shown in Table 3. The analysis examined the correlation coefficients among 21 sets of 10 ions. The substantial correlation coefficients between Na+ and Cl, Ca2+ and SO42−, Mg2+ and CO32−, Mg2+ and HCO3, with values of 0.99, 0.78, 0.79, and 0.86, respectively, indicate widespread distribution of rock salt minerals, gypsum, and dolomite in the region. Negative correlation coefficients between K+, Mg2+, CO32−, HCO3, and Na+, Cl suggest that the formation of rock salt in the area inhibits the formation of other minerals.
Table 4 analyzes the correlation coefficients of major ions in groundwater. TDS show a positive correlation with most indicators, notably significant positive correlations with K+, Mg2+, Cl, and Li+. Conversely, TDS exhibit a significant negative correlation with Na+ and Ca2+. The negative correlations of Na+ and Ca2+ with other indicators suggest that they are subjected to inhibition by other ions. Specifically, the correlation coefficients between Na+ and Mg2+, and between Na+ and Cl, are highest at −0.98 and −0.91, respectively. This indicates that the dissolution of Na+ is most strongly inhibited by Mg2+ and Cl. The highest correlation coefficient between Ca2+ and SO42− is −0.87, suggesting that Ca2+ is most strongly inhibited by SO42−. Additionally, Mg2+ and Cl demonstrate a high degree of correlation, suggesting they share a common source, likely due to the dissolution of halite and magnesium chloride. The correlation coefficients of Mg2+, CO3 and HCO3 with pH are 0.48, 0.53 and 0.44, respectively, indicating a positive correlation, whereas those of Na+ and Ca2+ with pH are −0.49 and −0.44, indicating a negative correlation.

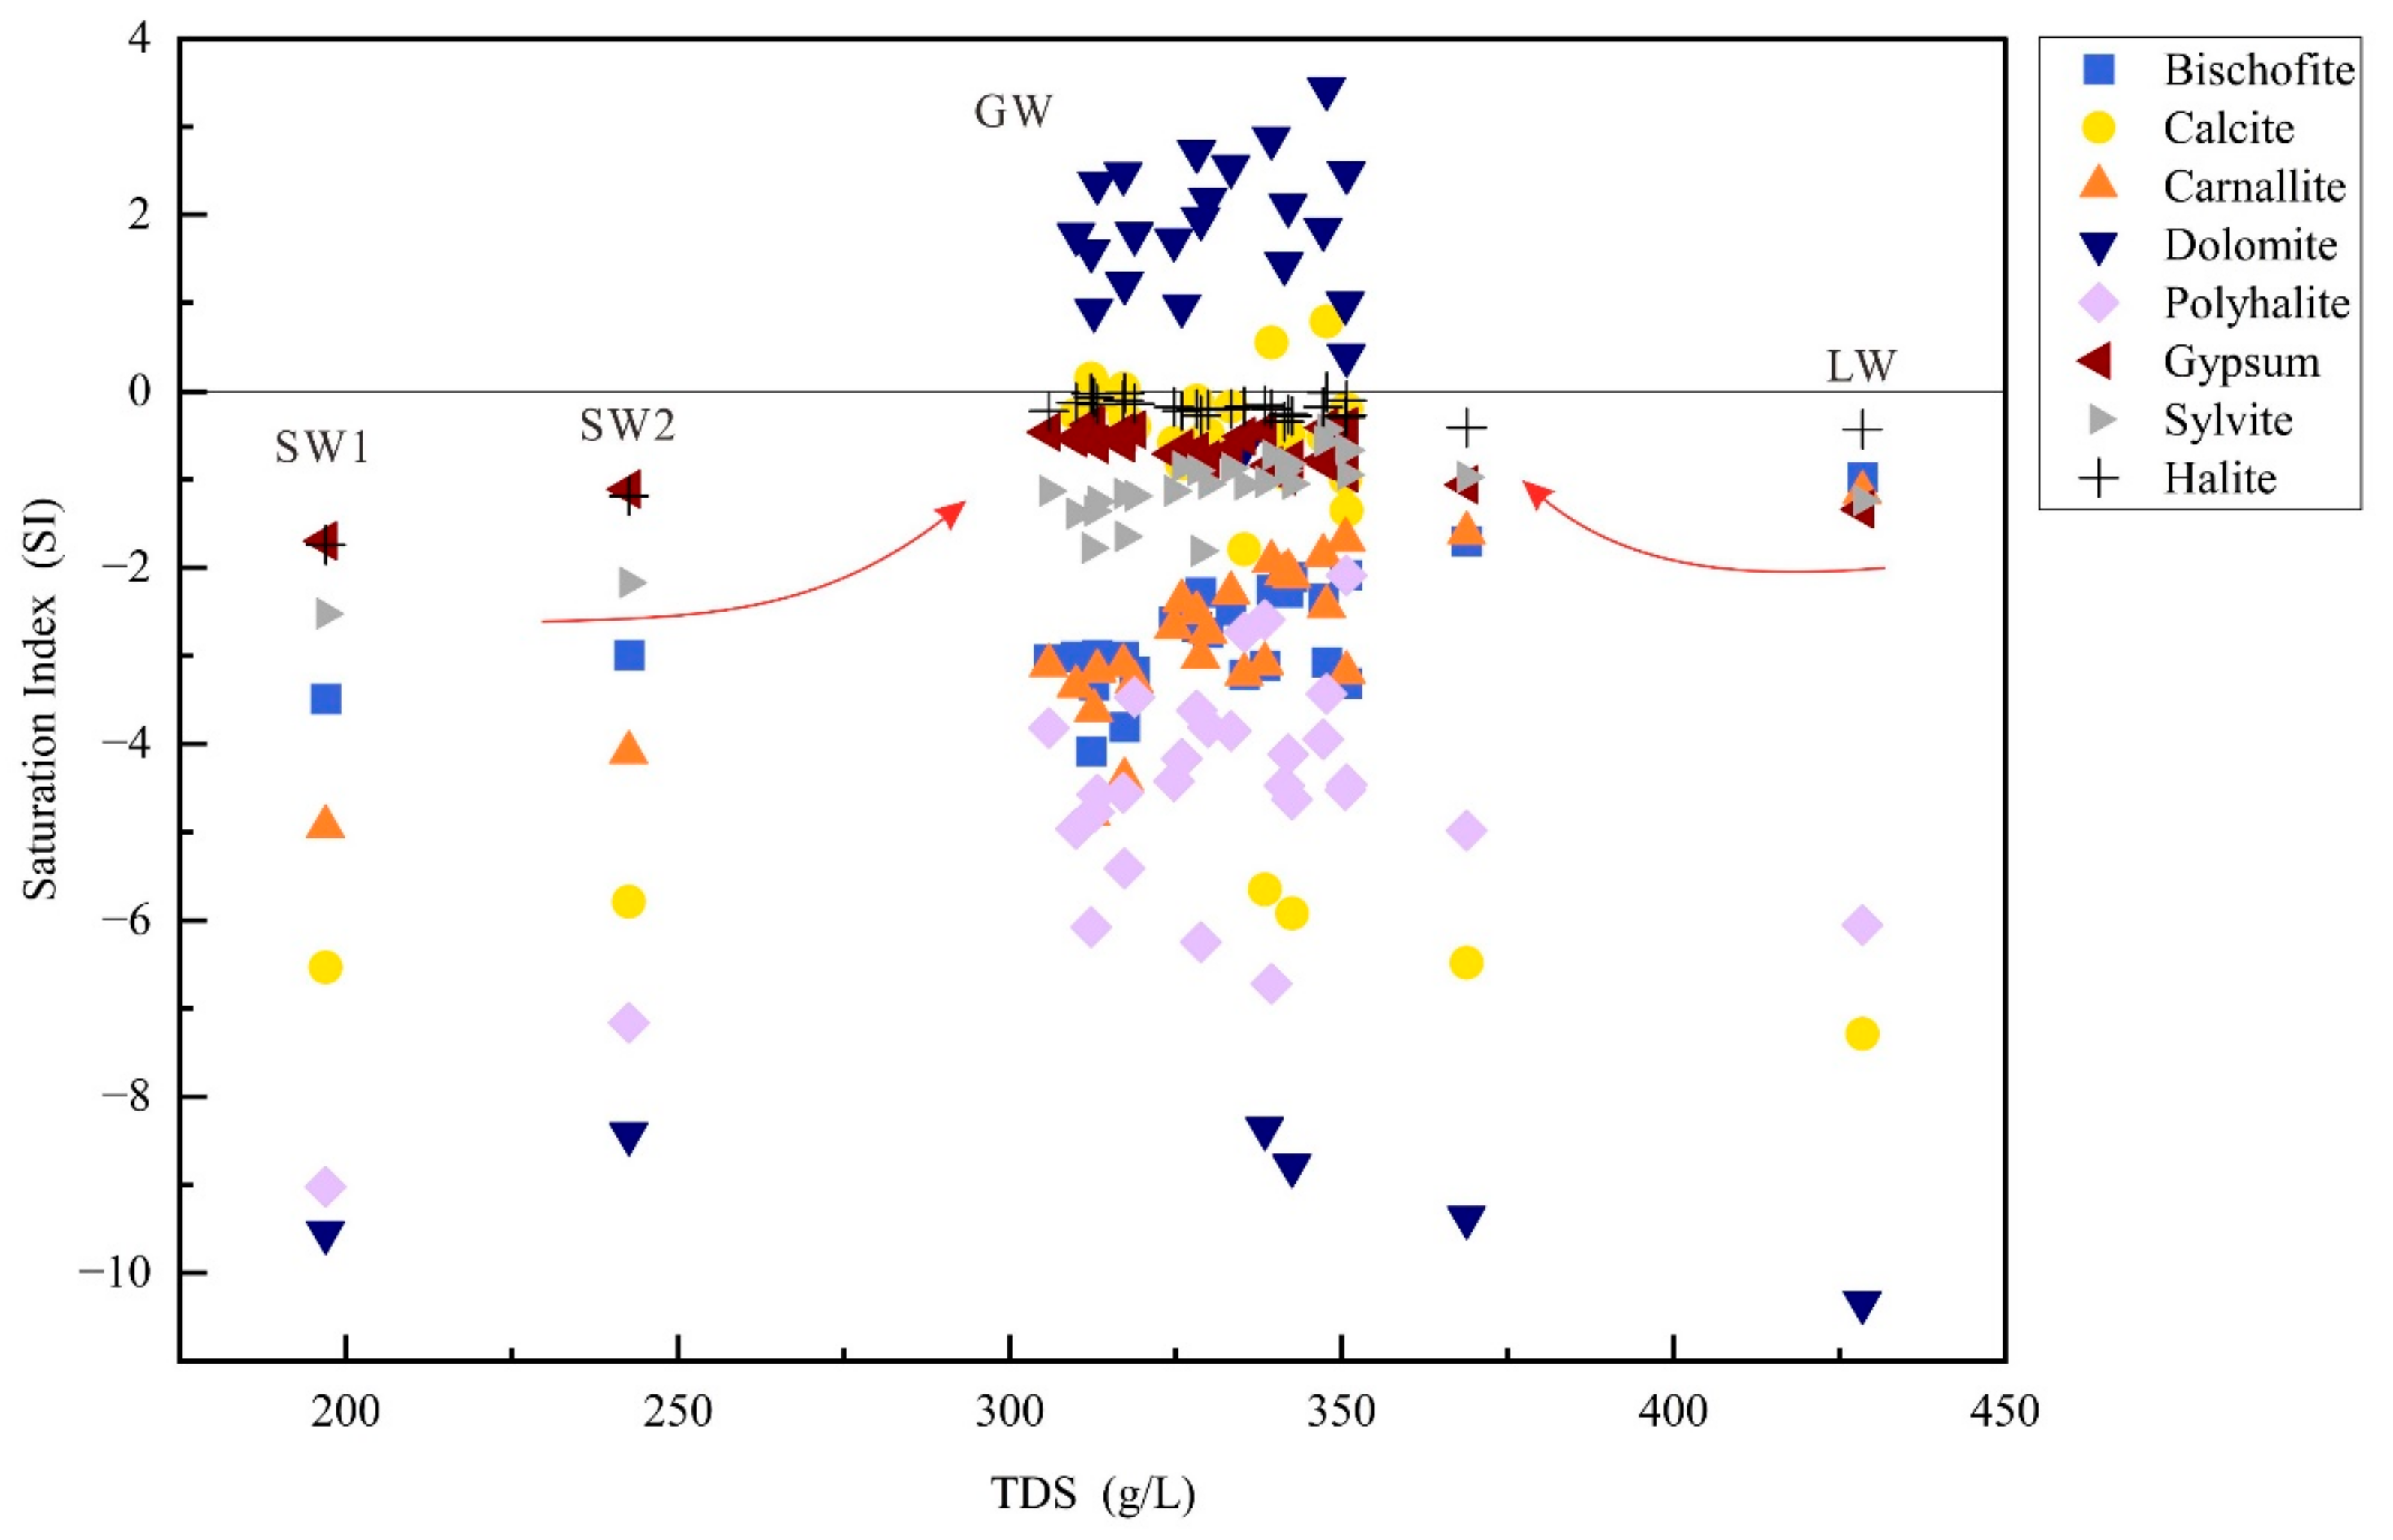
4.3. Saturation Index (SI)

The SI is crucial for studying groundwater chemistry processes, serving as a key parameter used to assess the equilibrium state between groundwater and minerals [37,38]. As illustrated in Figure 3, the distribution of saturation indices in the water samples from the survey area reveals that all minerals in the LW and SW water samples have SI values less than 0, indicating undersaturation. In most water samples from the GW body, the saturation indices of dolomite minerals are greater than 0, indicating saturation, while calcite and halite in the GW body are distributed near the SI = 0 line, indicating equilibrium. The saturation indices of the remaining minerals, polyhalite, bischofite, carnallite, and sylvite, are less than 0, indicating an undersaturated state. During the replenishment of GW by SW water, the saturation indices of most minerals increase, suggesting mineral dissolution in the aquifer. Similarly, during the replenishment of GW by LW water, the saturation indices of polyhalite, calcite, and dolomite significantly increase, indicating mineral dissolution during water transport. Conversely, the saturation indices of bischofite and carnallite minerals decrease, suggesting mineral precipitation during water transport.

4.4. Hydrochemical Processes: Inverse Modeling

Reverse hydrogeochemical modeling employs mass balance models to determine the amount of mineral dissolution or precipitation occurring between two different points in groundwater flow processes [39]. In this study, PHREEQC is utilized for reverse water-rock interaction modeling, quantitatively representing water–rock interactions and validating hydrogeochemical processes occurring during groundwater recharge based on the groundwater flow field, in order to study the hydrogeochemical processes occurring along the groundwater recharge routes from lake water and canal water. The reaction simulation paths selected were LW to GW24 and SW1 to GW13, as illustrated in Figure 4. Figure 4a,b show schematic diagrams of groundwater flow patterns between points LW and GW24, and points SW1 and GW13, respectively. Figure 4c,d compare the hydrochemical characteristics between points LW and GW24, and points SW1 and GW13, displaying variations in major indices. From LW to GW24, it can be observed that the concentrations of Na+, K+, and Ca2+ increase, while the values of the other indices decrease. From SW1 to GW13, the concentration of CO32− decreases, while the other indices increase. This indicates significant differences in the hydrochemical processes occurring along the paths from LW to GW24 and from SW1 to GW13.
The transfer of mineral components in groundwater along the flow paths is reported in Table 5. For LW to GW24, along the flow path, cation exchange leads to the entry of 18.72 mmol/L of Ca2+ into groundwater and 37.45 mmol/L of Na+ out of groundwater. The primary water–rock interactions causing changes in groundwater chemistry include the precipitation of bischofite, carnallite, and gypsum, with precipitation rates of 15.980 mmol/L, 17.860 mmol/L, and 36.490 mmol/L, respectively. Additionally, polyhalite and halite dissolve, with dissolution rates of 8.860 mmol/L and 38.100 mmol/L, respectively.
For SW1 to GW13, along the flow path, cation exchange results in 2.671 mmol/L of Ca2+ entering groundwater and 5.342 mmol/L of Na+ leaving groundwater. The main water–rock interactions causing changes in groundwater chemistry are the precipitation of calcite and gypsum, with precipitation rates of 5.626 mmol/L and 0.017 mmol/L, respectively. Additionally, carnallite, dolomite, and halite dissolve, with dissolution rates of 0.278 mmol/L, 2.820 mmol/L, and 6.346 mmol/L, respectively.

5. Discussion

5.1. Hydrogeochemistry

The Piper diagram is frequently utilized for analyzing the hydrochemical types of groundwater. As shown in Figure 5, the anions of GW water are primarily distributed in Zones C (Magnesium type) and D (Sodium type), while cations are mainly distributed in Zone G (Chloride type). Therefore, the hydrochemical types of GW are identified as Cl-Mg type and Cl-Na type. SW and LW exhibit anion distributions in Zone C (Magnesium type) and cation distributions in Zone G (Chloride type), indicating that the hydrochemical types of SW and LW are Cl-Mg type. All water bodies belong to the low-Ca high-Cl type, with the lowest Na+ + K+ content and the highest Mg2+ content in SW and LW waters, suggesting that during the migration process from SW and LW to GW, the concentration of Na+ + K+ gradually increases while the concentration of Mg2+ decreases. The concentration of Cl is highest in all water bodies, indicating that Cl is the dominant anion during water migration, and its variation is relatively small.

5.2. Water–Rock Interaction

The Gibbs diagram is a widely used tool for understanding the natural formation mechanisms of water bodies [40,41]. According to the Gibbs diagram, there are three primary mechanisms: Evaporation Dominance, Rock Dominance, and Precipitation Dominance. As shown in Figure 6, all the water sample points are clustered in the upper right corner, indicating that the formation mechanism of all the water samples is predominantly influenced by evaporation.
To further analyze the factors influencing the formation of water chemistry, scatter plots depicting the relationships between various components were created as shown in Figure 7. Figure 7a,b illustrate the relationships between Cl vs. Na+ and Cl vs. Mg2+, respectively. It can be observed that Na+ is negatively correlated with Cl. As the Cl concentration increases in the GW water bodies, the Na+ concentration decreases exponentially, with all water samples falling below the 1:1 line. This indicates that the excess Cl may originate from the dissolution of minerals such as carnallite and bischofite. The Na+ concentrations in LW and SW are lower compared to those in GW, suggesting that as LW and SW recharge the groundwater, the Na+ concentration rises, indicating the dissolution of halite. Mg2+ shows a positive correlation with Cl, with its concentration increasing as Cl concentration rises. This is attributed to the dissolution of carnallite and bischofite. Figure 7c shows the relationship between Ca2+ and SO42−. In GW, Ca2+ is negatively correlated with SO42−, with most water samples lying below the 1:1 line. This suggests that the dissolution of gypsum is not the source of Ca2+ and SO42− in the study area. Additionally, there is evidence of Ca2+ depletion and SO42− enrichment, indicating that the dissolution of polyhalite affects the sources of Ca2+ and SO42−.
Figure 7d displays the relationship between (Ca2+ + Mg2+) and (HCO3 + SO42−). All water samples are located above the 1:1 line, indicating that the contributions of calcite, dolomite, and gypsum dissolution to the concentrations of (Ca2+ + Mg2+) in groundwater are minimal. Instead, the dissolution of other minerals, such as polyhalite, increases the concentrations of Ca2+ and Mg2+.

5.3. Cation Exchange Interaction

Cation exchange is another crucial mechanism that governs water chemistry [42]. Chloro-alkaline indices (CAI-I and CAI-II) serve as valuable tools for evaluating the direction of alternating cation adsorption processes. These indices are calculated as follows:
CAI - I = Cl Na + + K + Cl
CAI - II = Cl Na + + K + HCO 3 + SO 4 2 + CO 3 2 + NO 3
If both are negative values, it indicates cation exchange as shown in Equation (6) occurring in the groundwater system. Conversely, if both are positive values, it indicates reverse cation exchange as shown in Equation (7).
Na 2 X + Ca 2 +   2 Na + + CaX 2
2 Na + + CaX 2   Ca 2 + + Na 2 X
As shown in Figure 8a, all sampling points in the study area lie in the first quadrant, indicating cation exchange as described in Equation (7), where adsorbed Ca2+ is replaced by Na+. This process leads to an increase in Ca2+ concentration and a decrease in Na+ concentration in groundwater. There is an outlier in the Figure 8a with a very high CAI-II value, indicating strong cation exchange at this point, which has led to a significant decrease in Na+. It is hypothesized that this point may have been more strongly influenced by confined groundwater recharge. Additionally, the relationship between [(Ca2+ + Mg2+) − (HCO3 + SO42−)] vs. [Na+ + K+ − Cl] and is commonly used to study cation exchange. [(Ca2+ + Mg2+) − (HCO3 + SO42−)] represents the increase or decrease in Ca2+ and Mg2+ in the water body, excluding dissolution of gypsum, calcite, and dolomite. [Na+ + K+ − Cl] represents the increase or decrease in Na+, excluding the dissolution of halite. If cation exchange is the primary process controlling groundwater mineralization, their relationship should be linear, and the slope should be close to −1. As shown in Figure 8b, there is a good linear relationship between [(Ca2+ + Mg2+) − (HCO3 + SO42−)] vs. [Na+ + K+ − Cl] in the study area, with a linear regression slope of −1.019, which is very close to the theoretical value of −1.0. This indicates the involvement of Na+, Ca2+, and Mg2+ in cation exchange in groundwater.

5.4. Hydrogeochemical Processes

Chloro-alkaline indices and reverse hydrogeochemical modeling show that cation exchange has a greater impact on groundwater chemistry during groundwater recharge from lake water than from canal water, with the cation exchange process being stronger in the former. Carnallite precipitates along the flow path of groundwater recharge from lake water, whereas it dissolves along the flow path of groundwater recharge from canal water. Gypsum precipitates along both lake water and canal water flow paths for groundwater recharge, but the precipitation rate is faster in lake water recharge. During the processes of groundwater recharge from both lake water and canal water, halite experiences varying degrees of dissolution, with a faster dissolution rate in lake water, possibly due to the cation exchange processes occurring along the flow paths.

6. Conclusions

This paper investigates groundwater, surface water, and soluble salts in the Bieletan region. Utilizing multivariate techniques, saturation indices, and hydrogeochemical modeling, the study identifies the hydrochemical characteristics of groundwater, the main influencing factors on groundwater, and the hydrogeochemical processes occurring during different recharge processes in the Bieletan area. The following key conclusions are summarized:
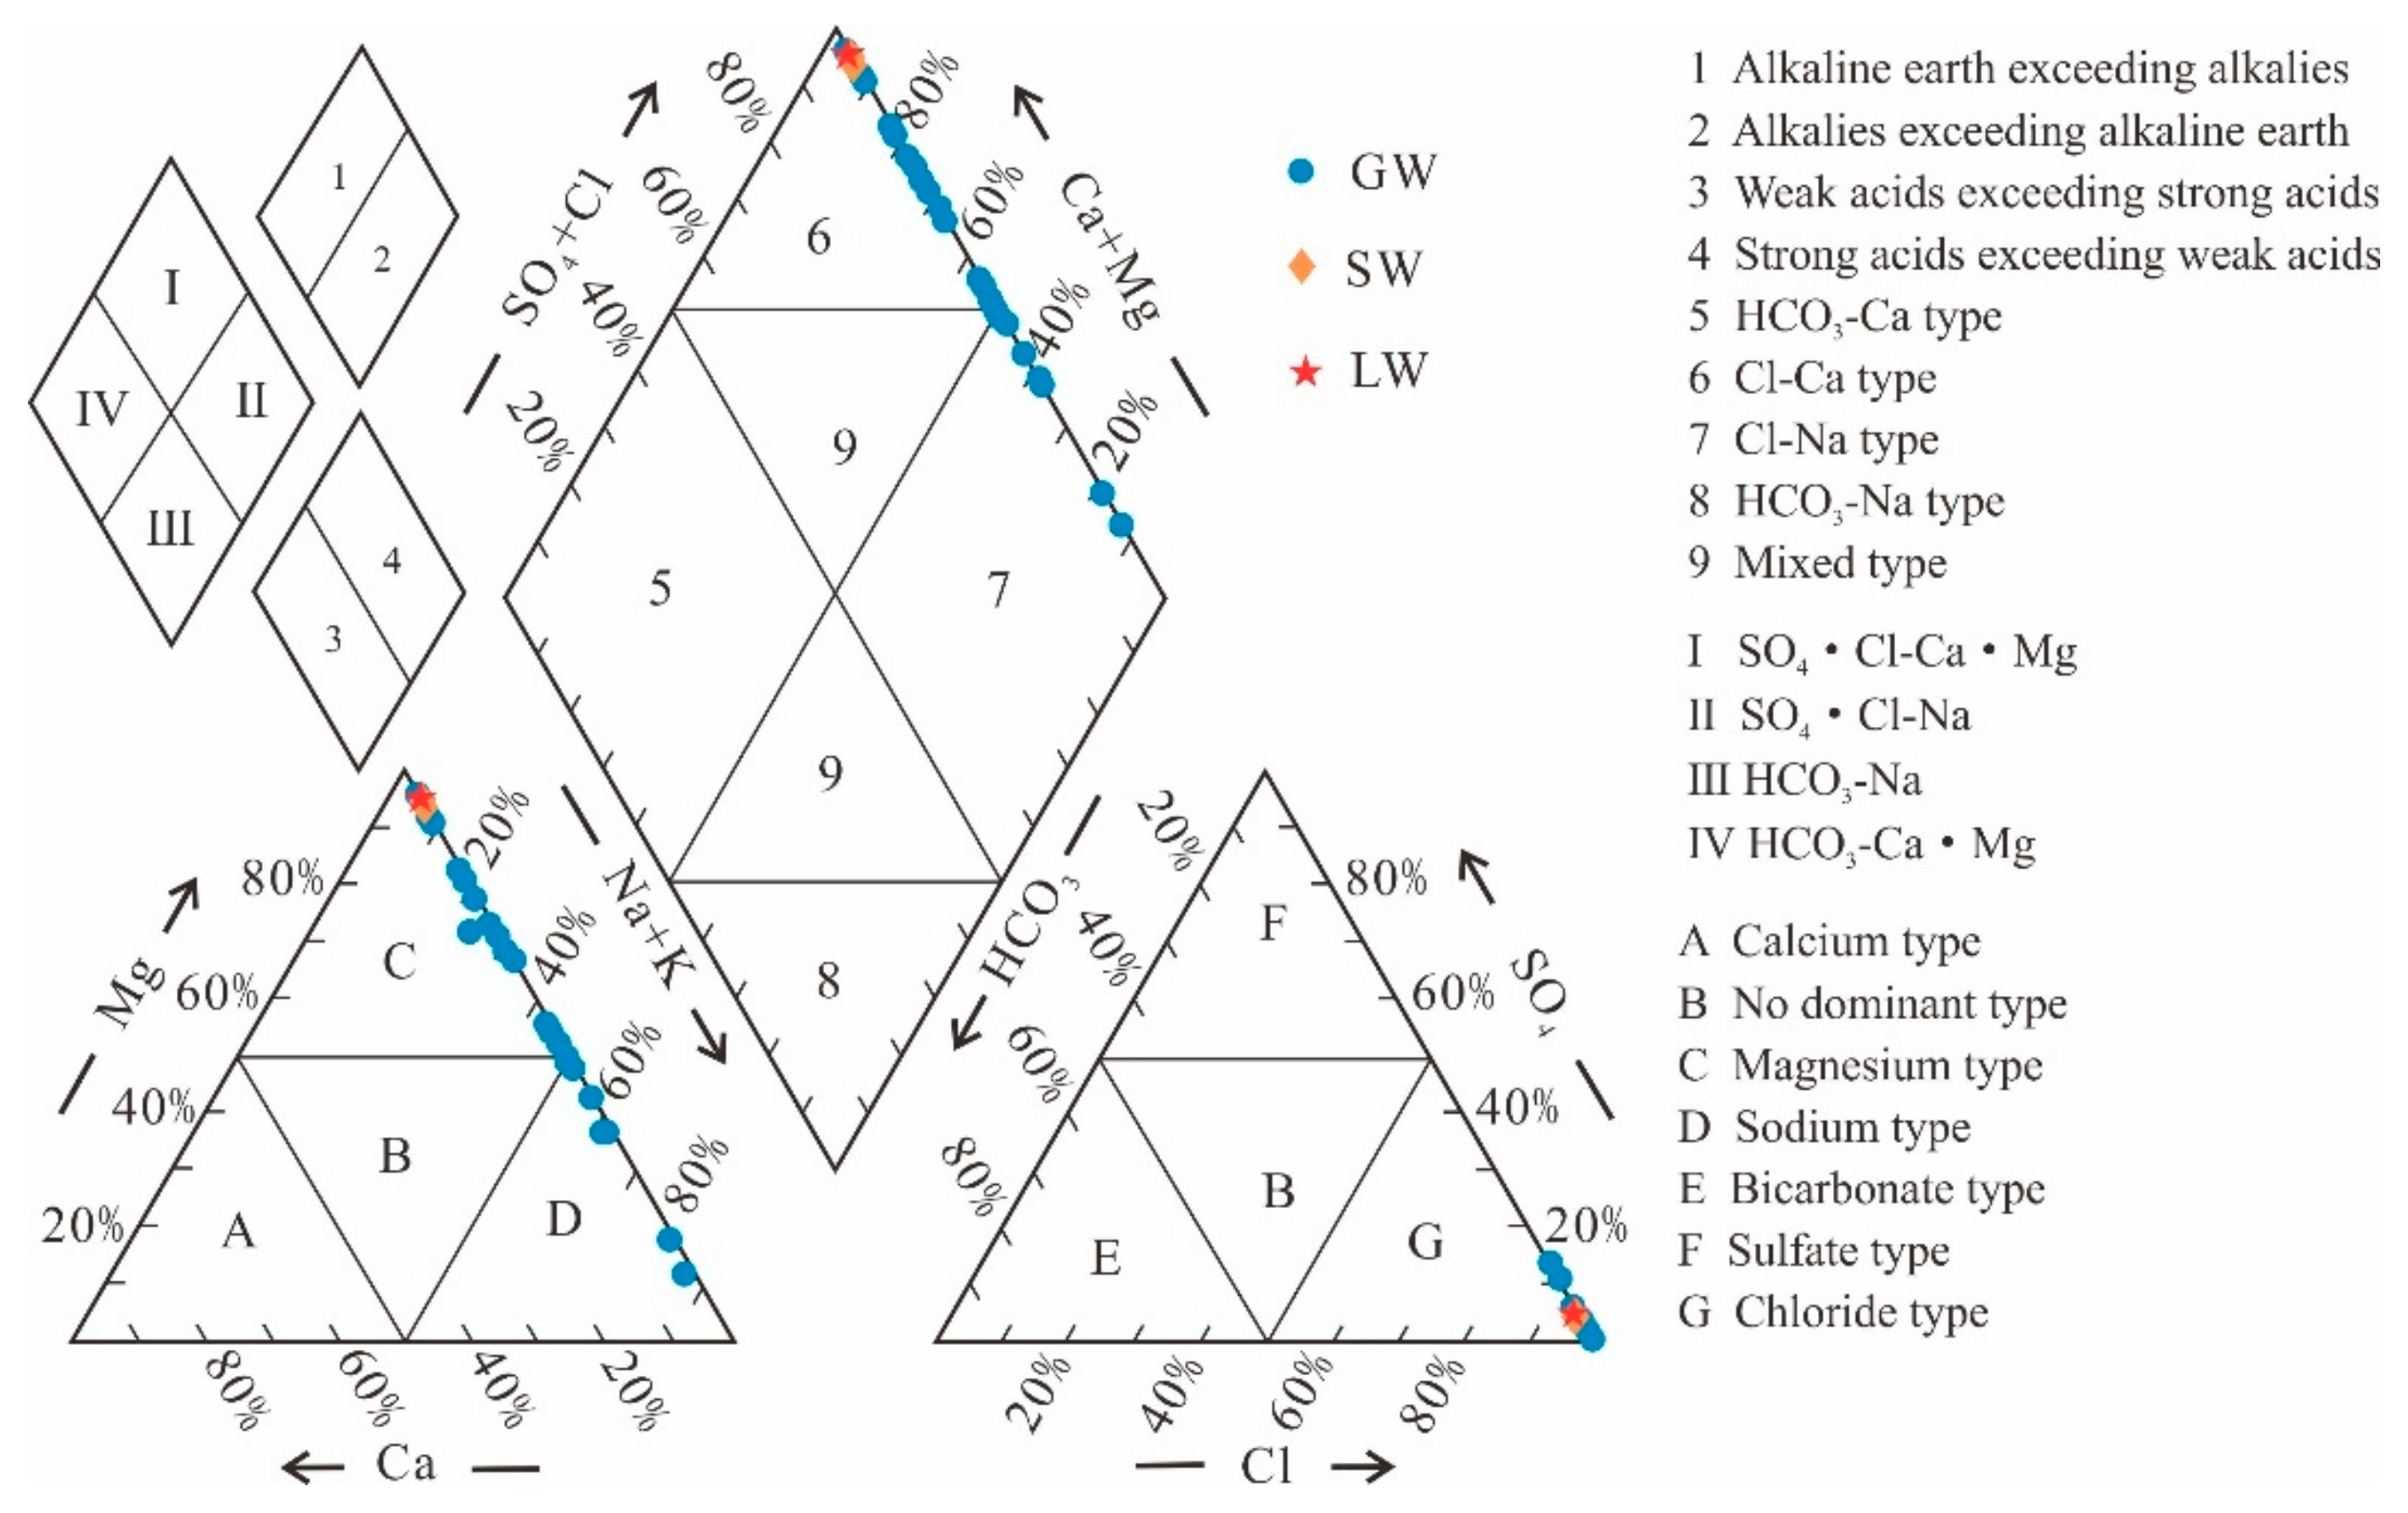
  • Groundwater (GW) cation concentrations are ranked as Na+ > Mg2+ > K+ > Ga2+, while in the case of lake water (LW) and stream water (SW), cation concentrations are Mg2+ > Na+ > K+ > Ga2+. The anion concentrations in GW are ranked as Cl > SO42− > HCO3 > CO32−, whereas in LW and SW, the order is Cl > SO42− > CO32− > HCO3. The mean total dissolved solids (TDS) values for GW and SW are 332.03 g/L and 219.73 g/L, respectively, while for LW, it is 428.46 g/L. The hydrochemical types of GW are classified as Cl-Mg type and Cl-Na type, whereas LW and SW are categorized as Cl-Mg type.
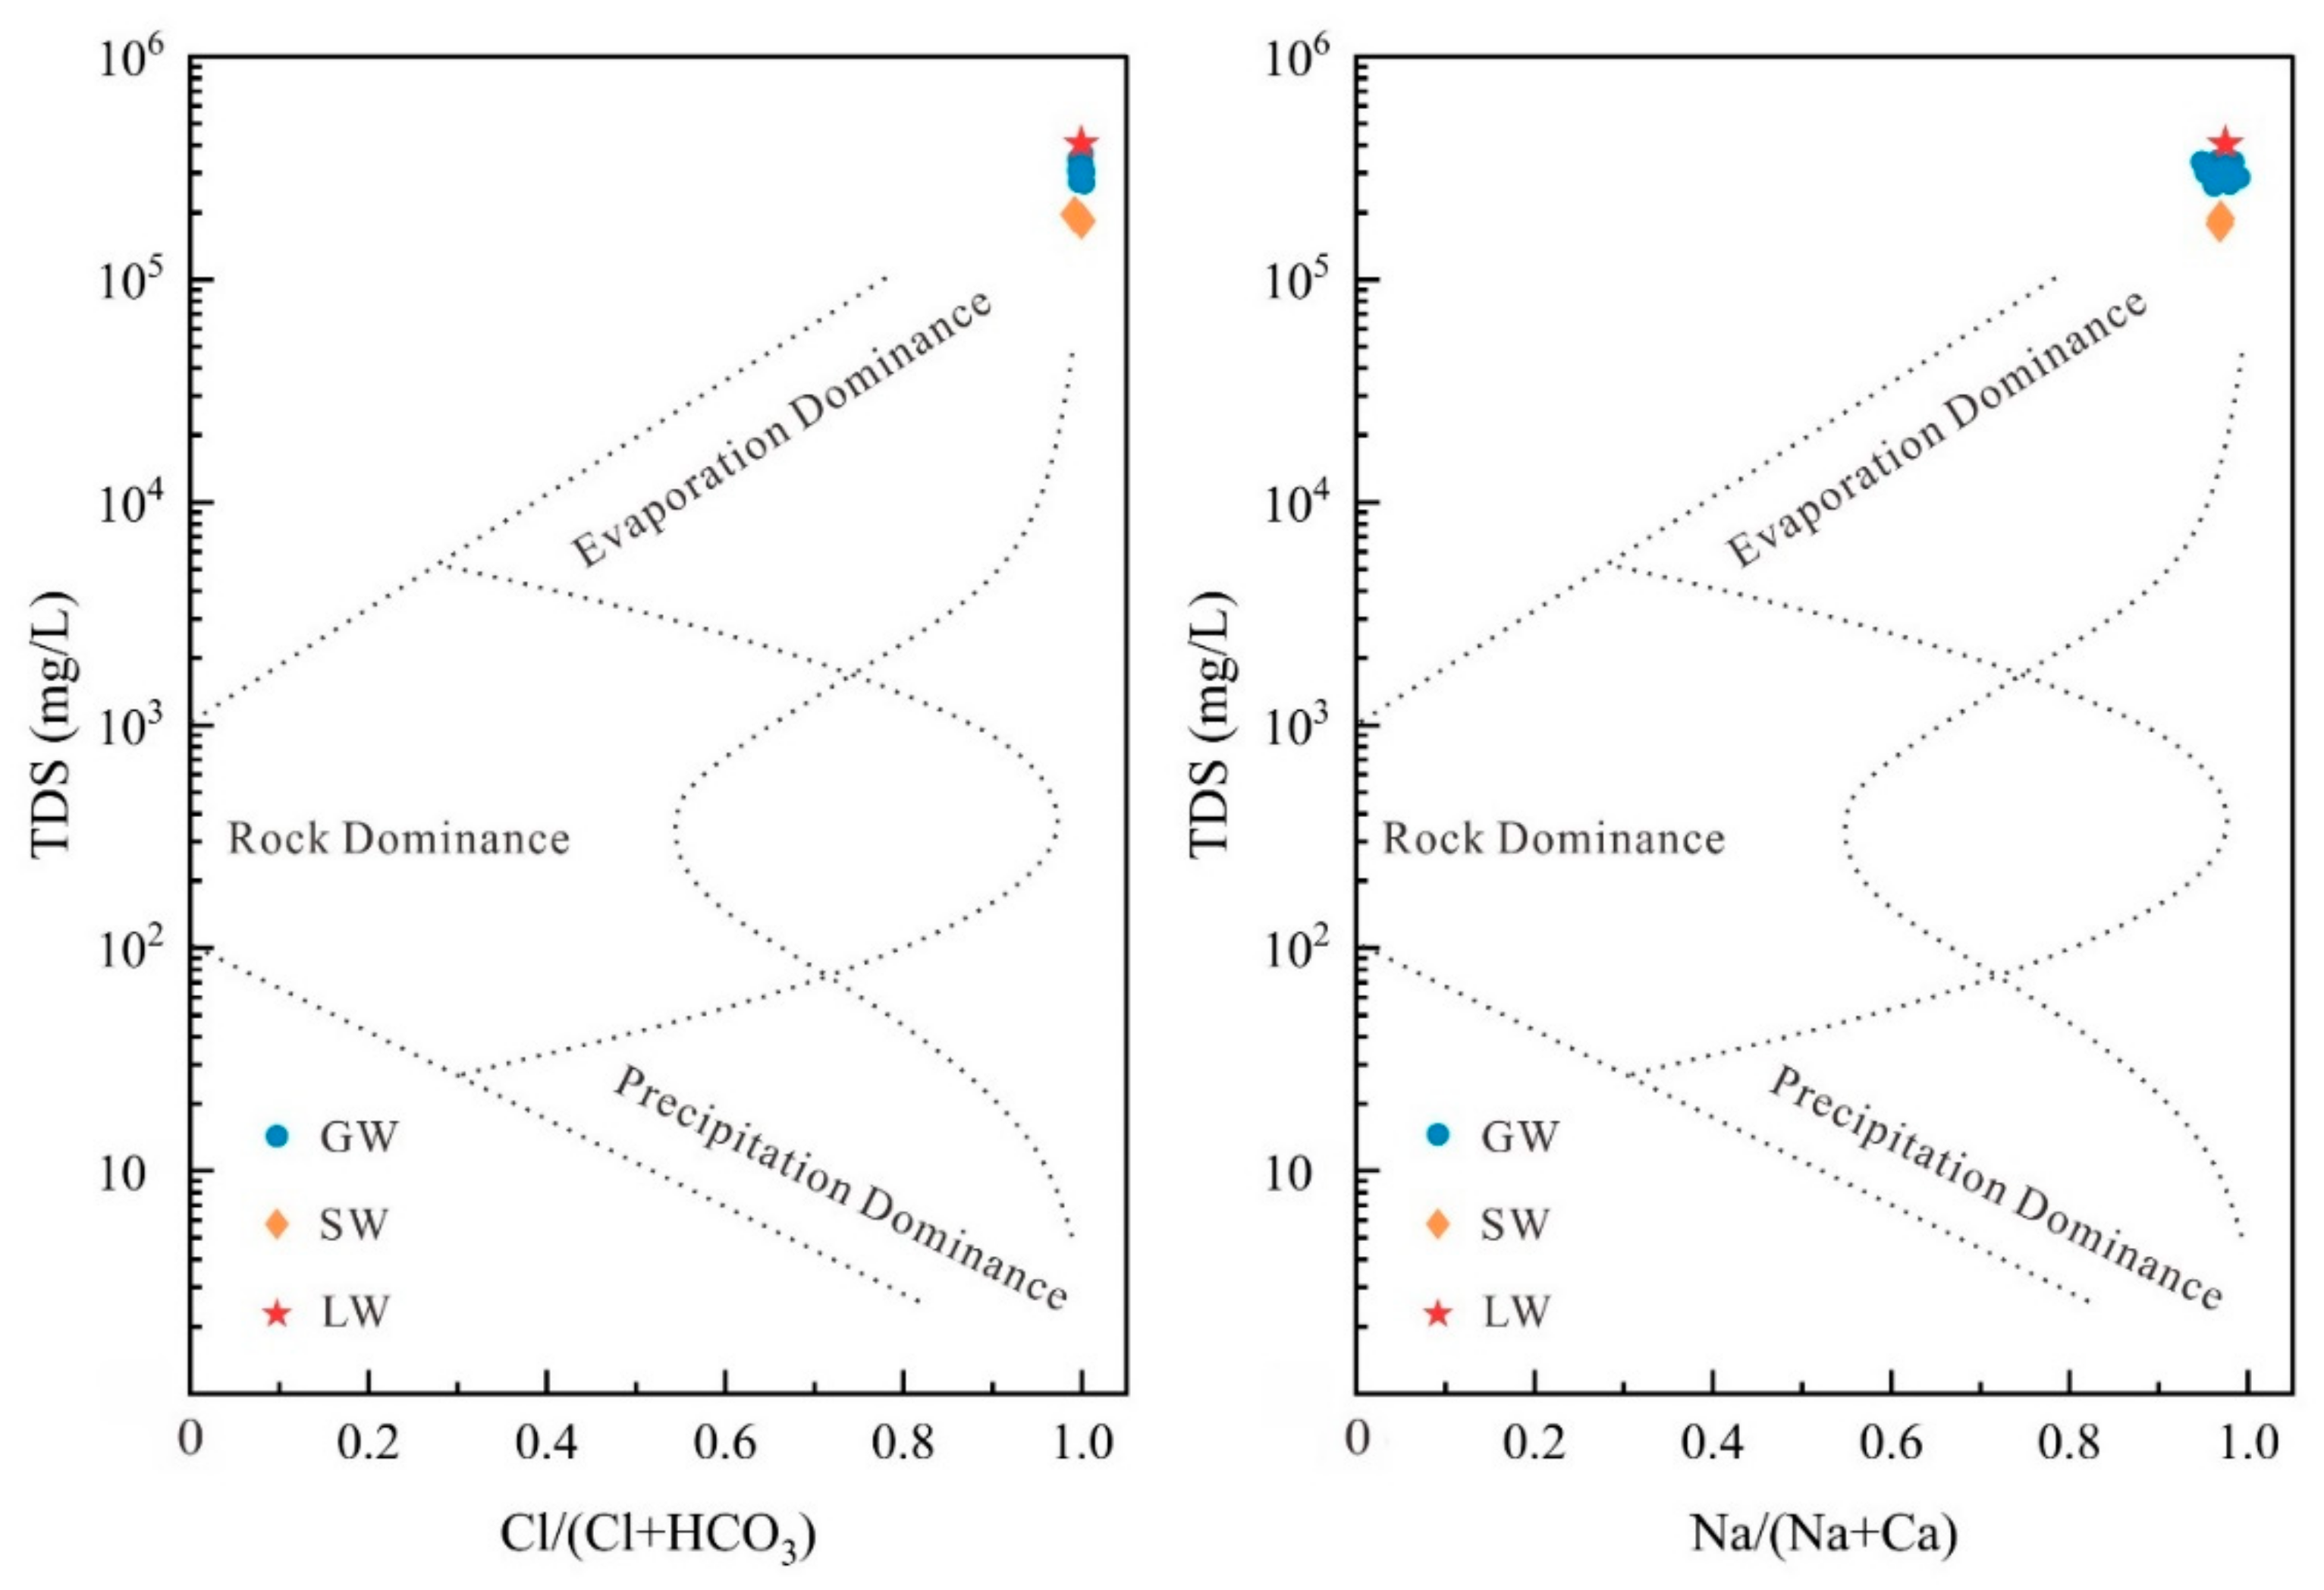
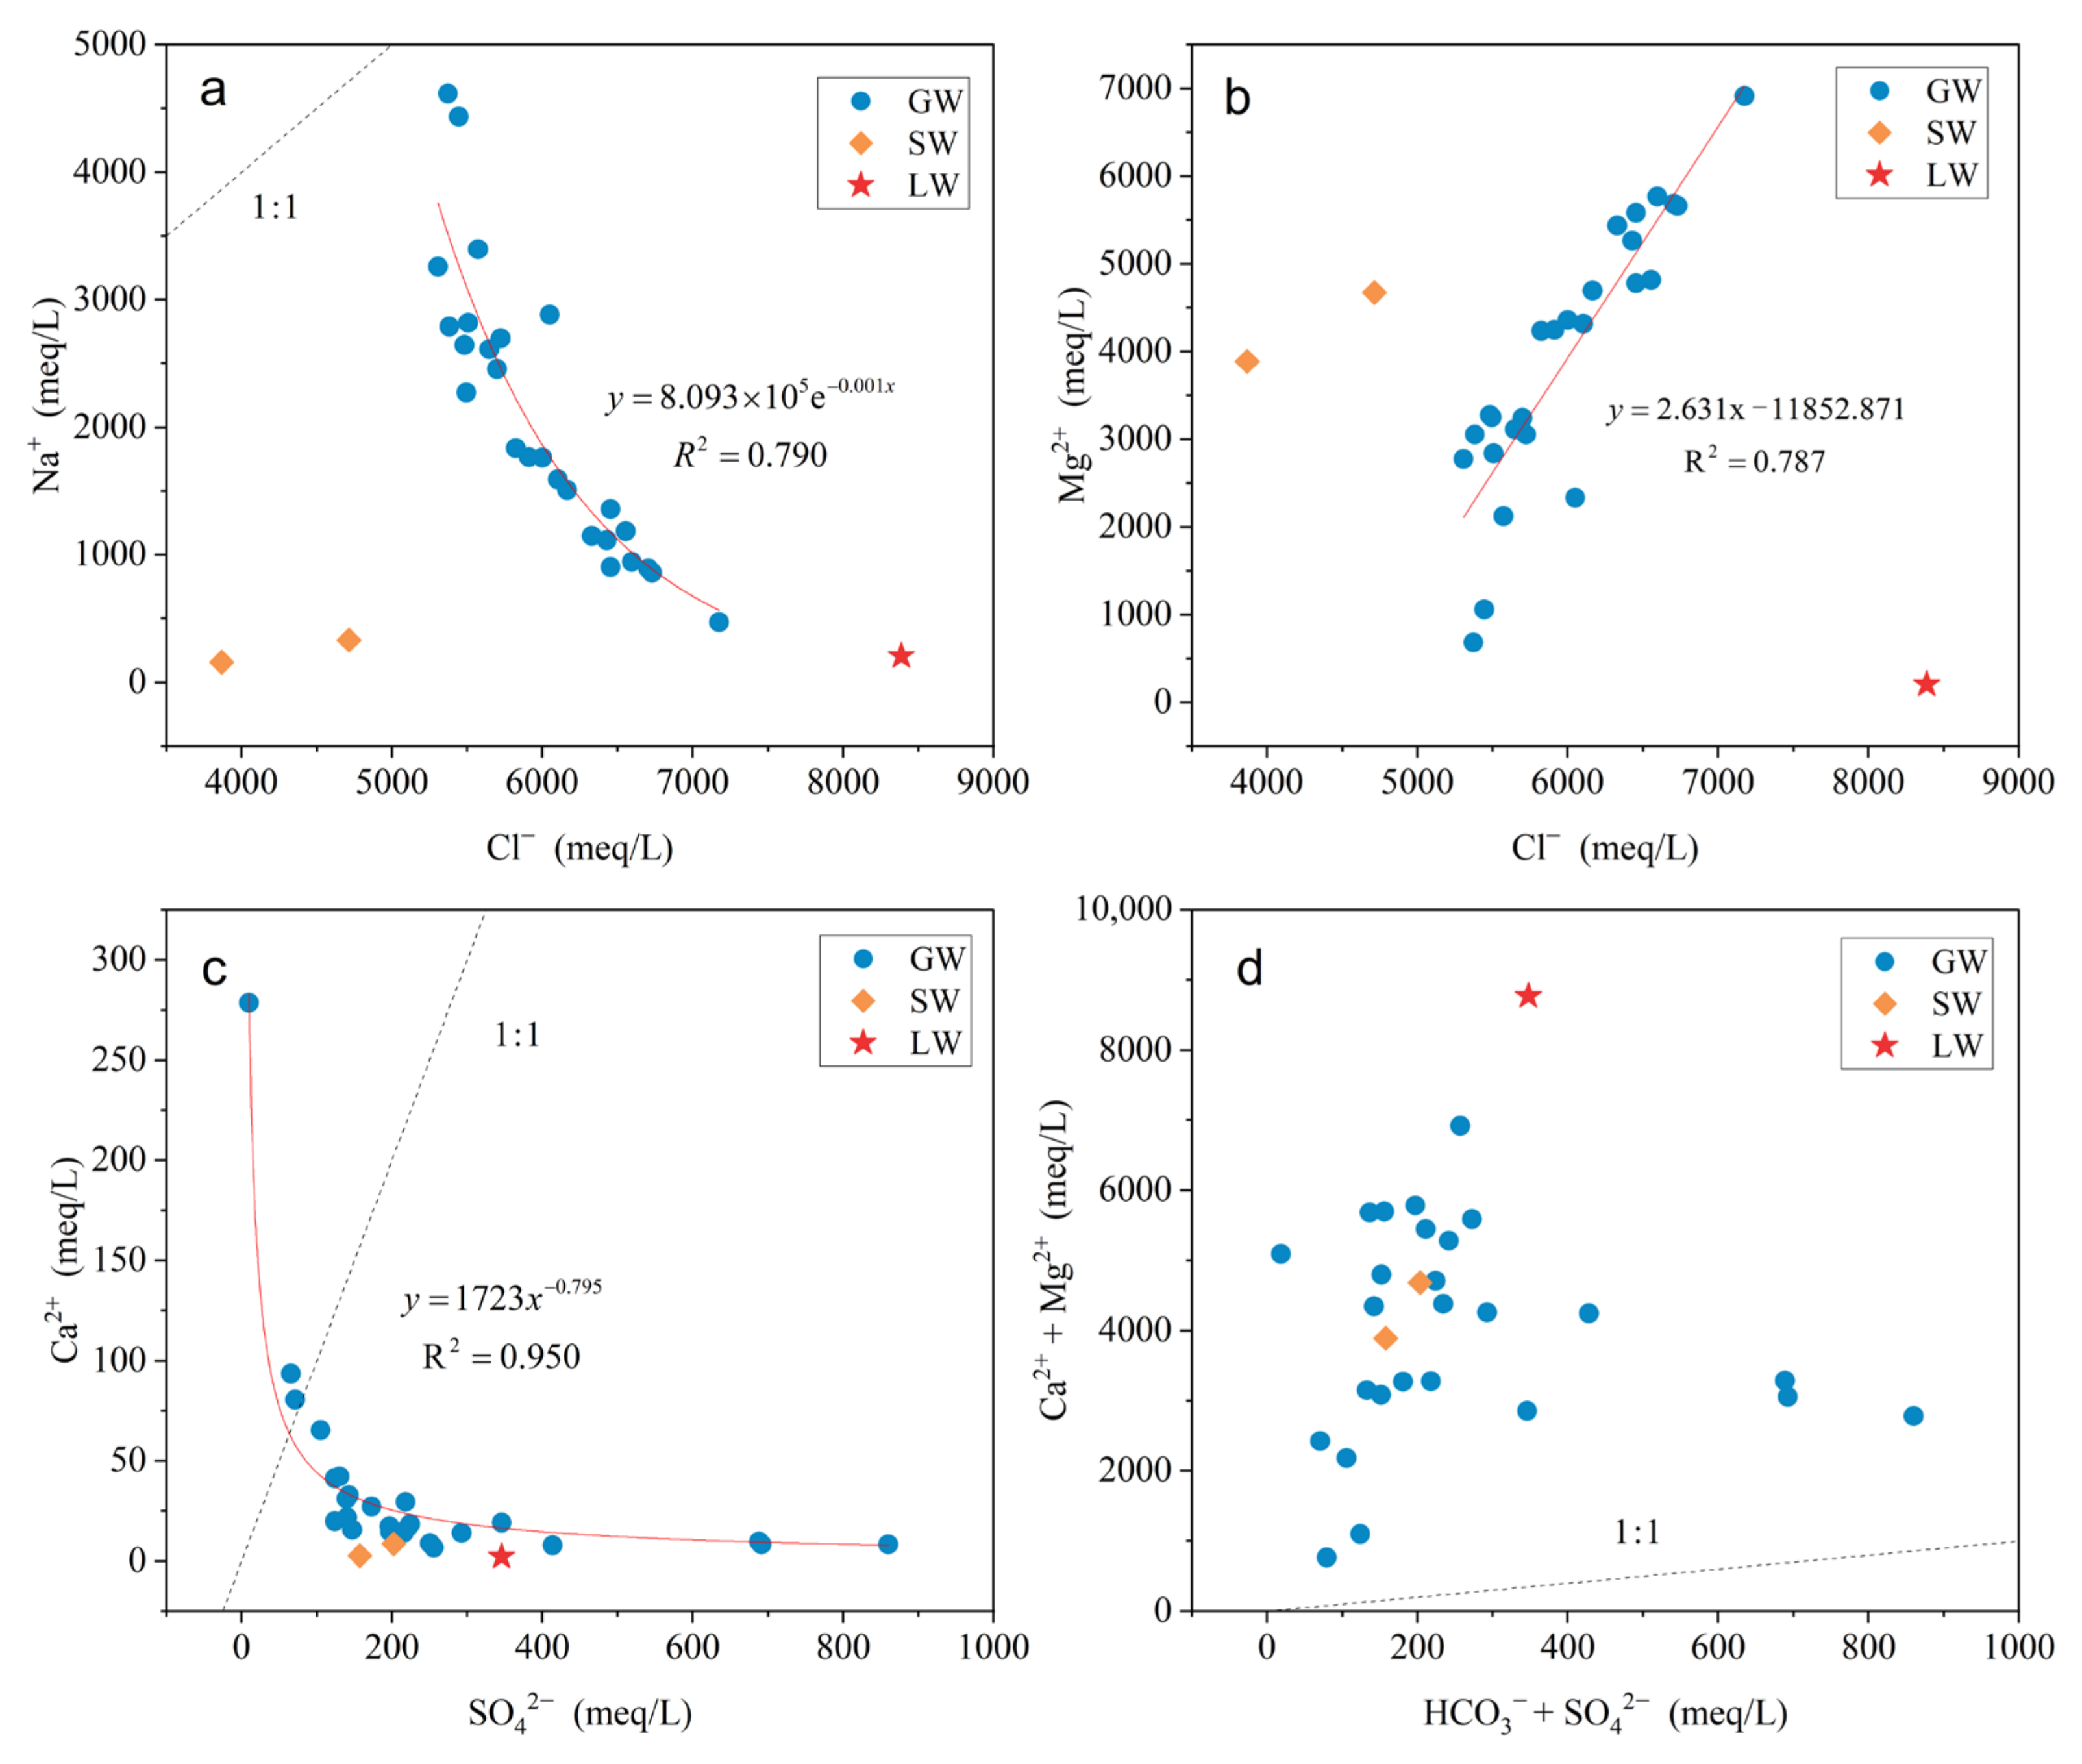
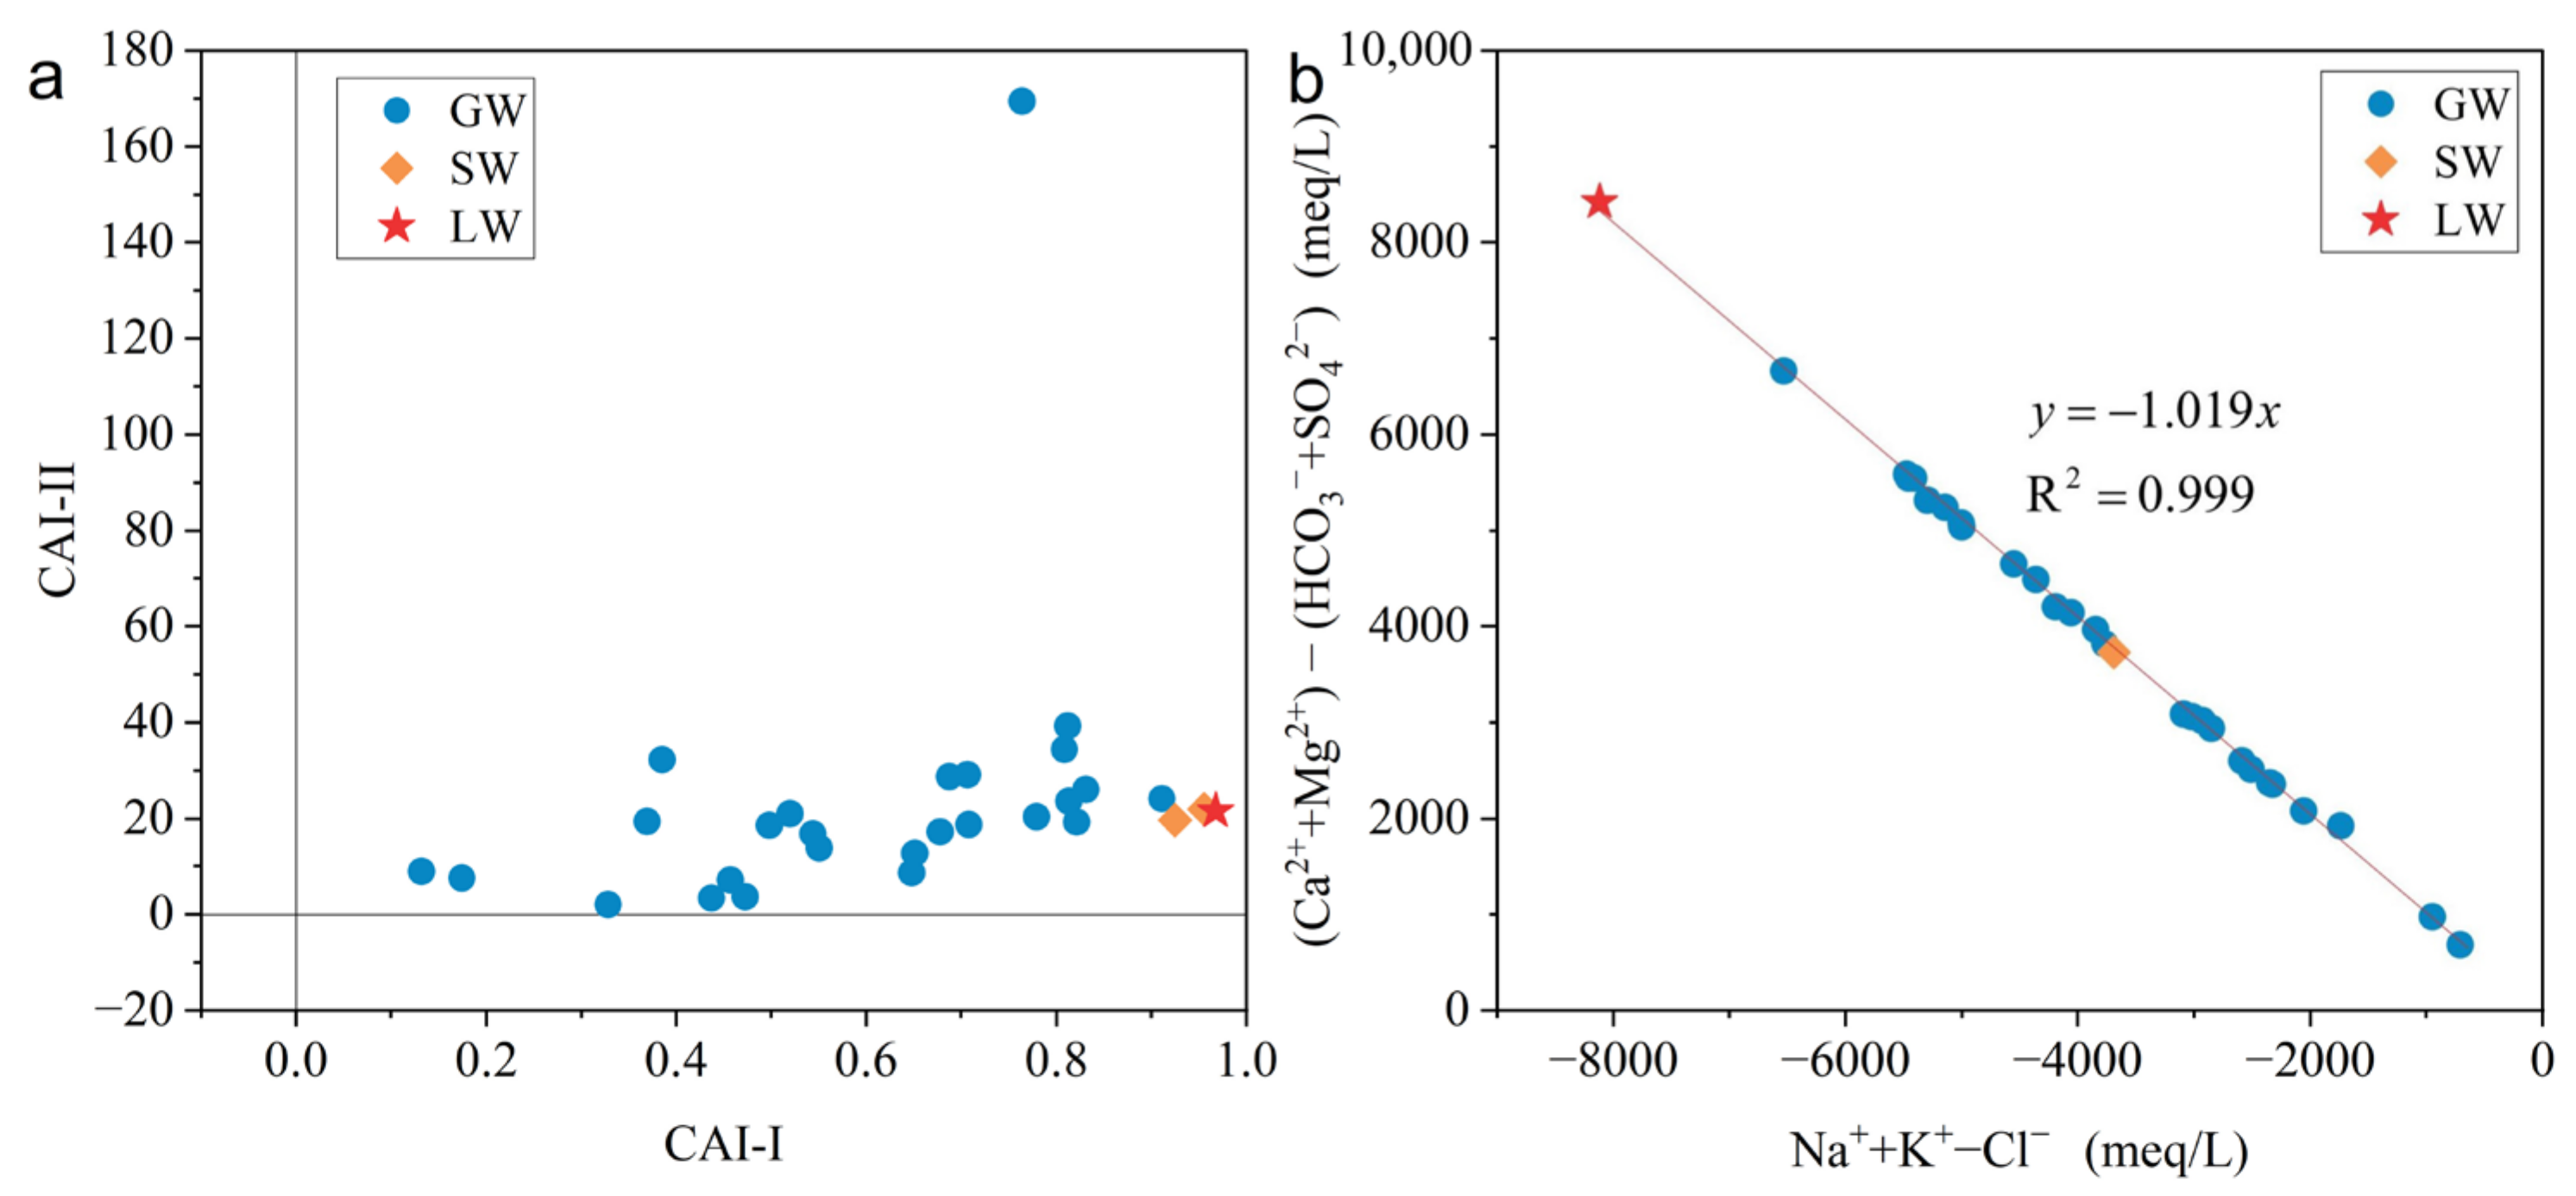
  • Evaporation is the primary mechanism governing the formation of GW, LW, and SW. Cation exchange and mineral precipitation/dissolution are identified as the primary factors influencing water chemistry. Minerals in LW and SW are generally undersaturated, while in GW, apart from dolomite, calcite, and halite, which are saturated or near-saturated, other minerals remain undersaturated.
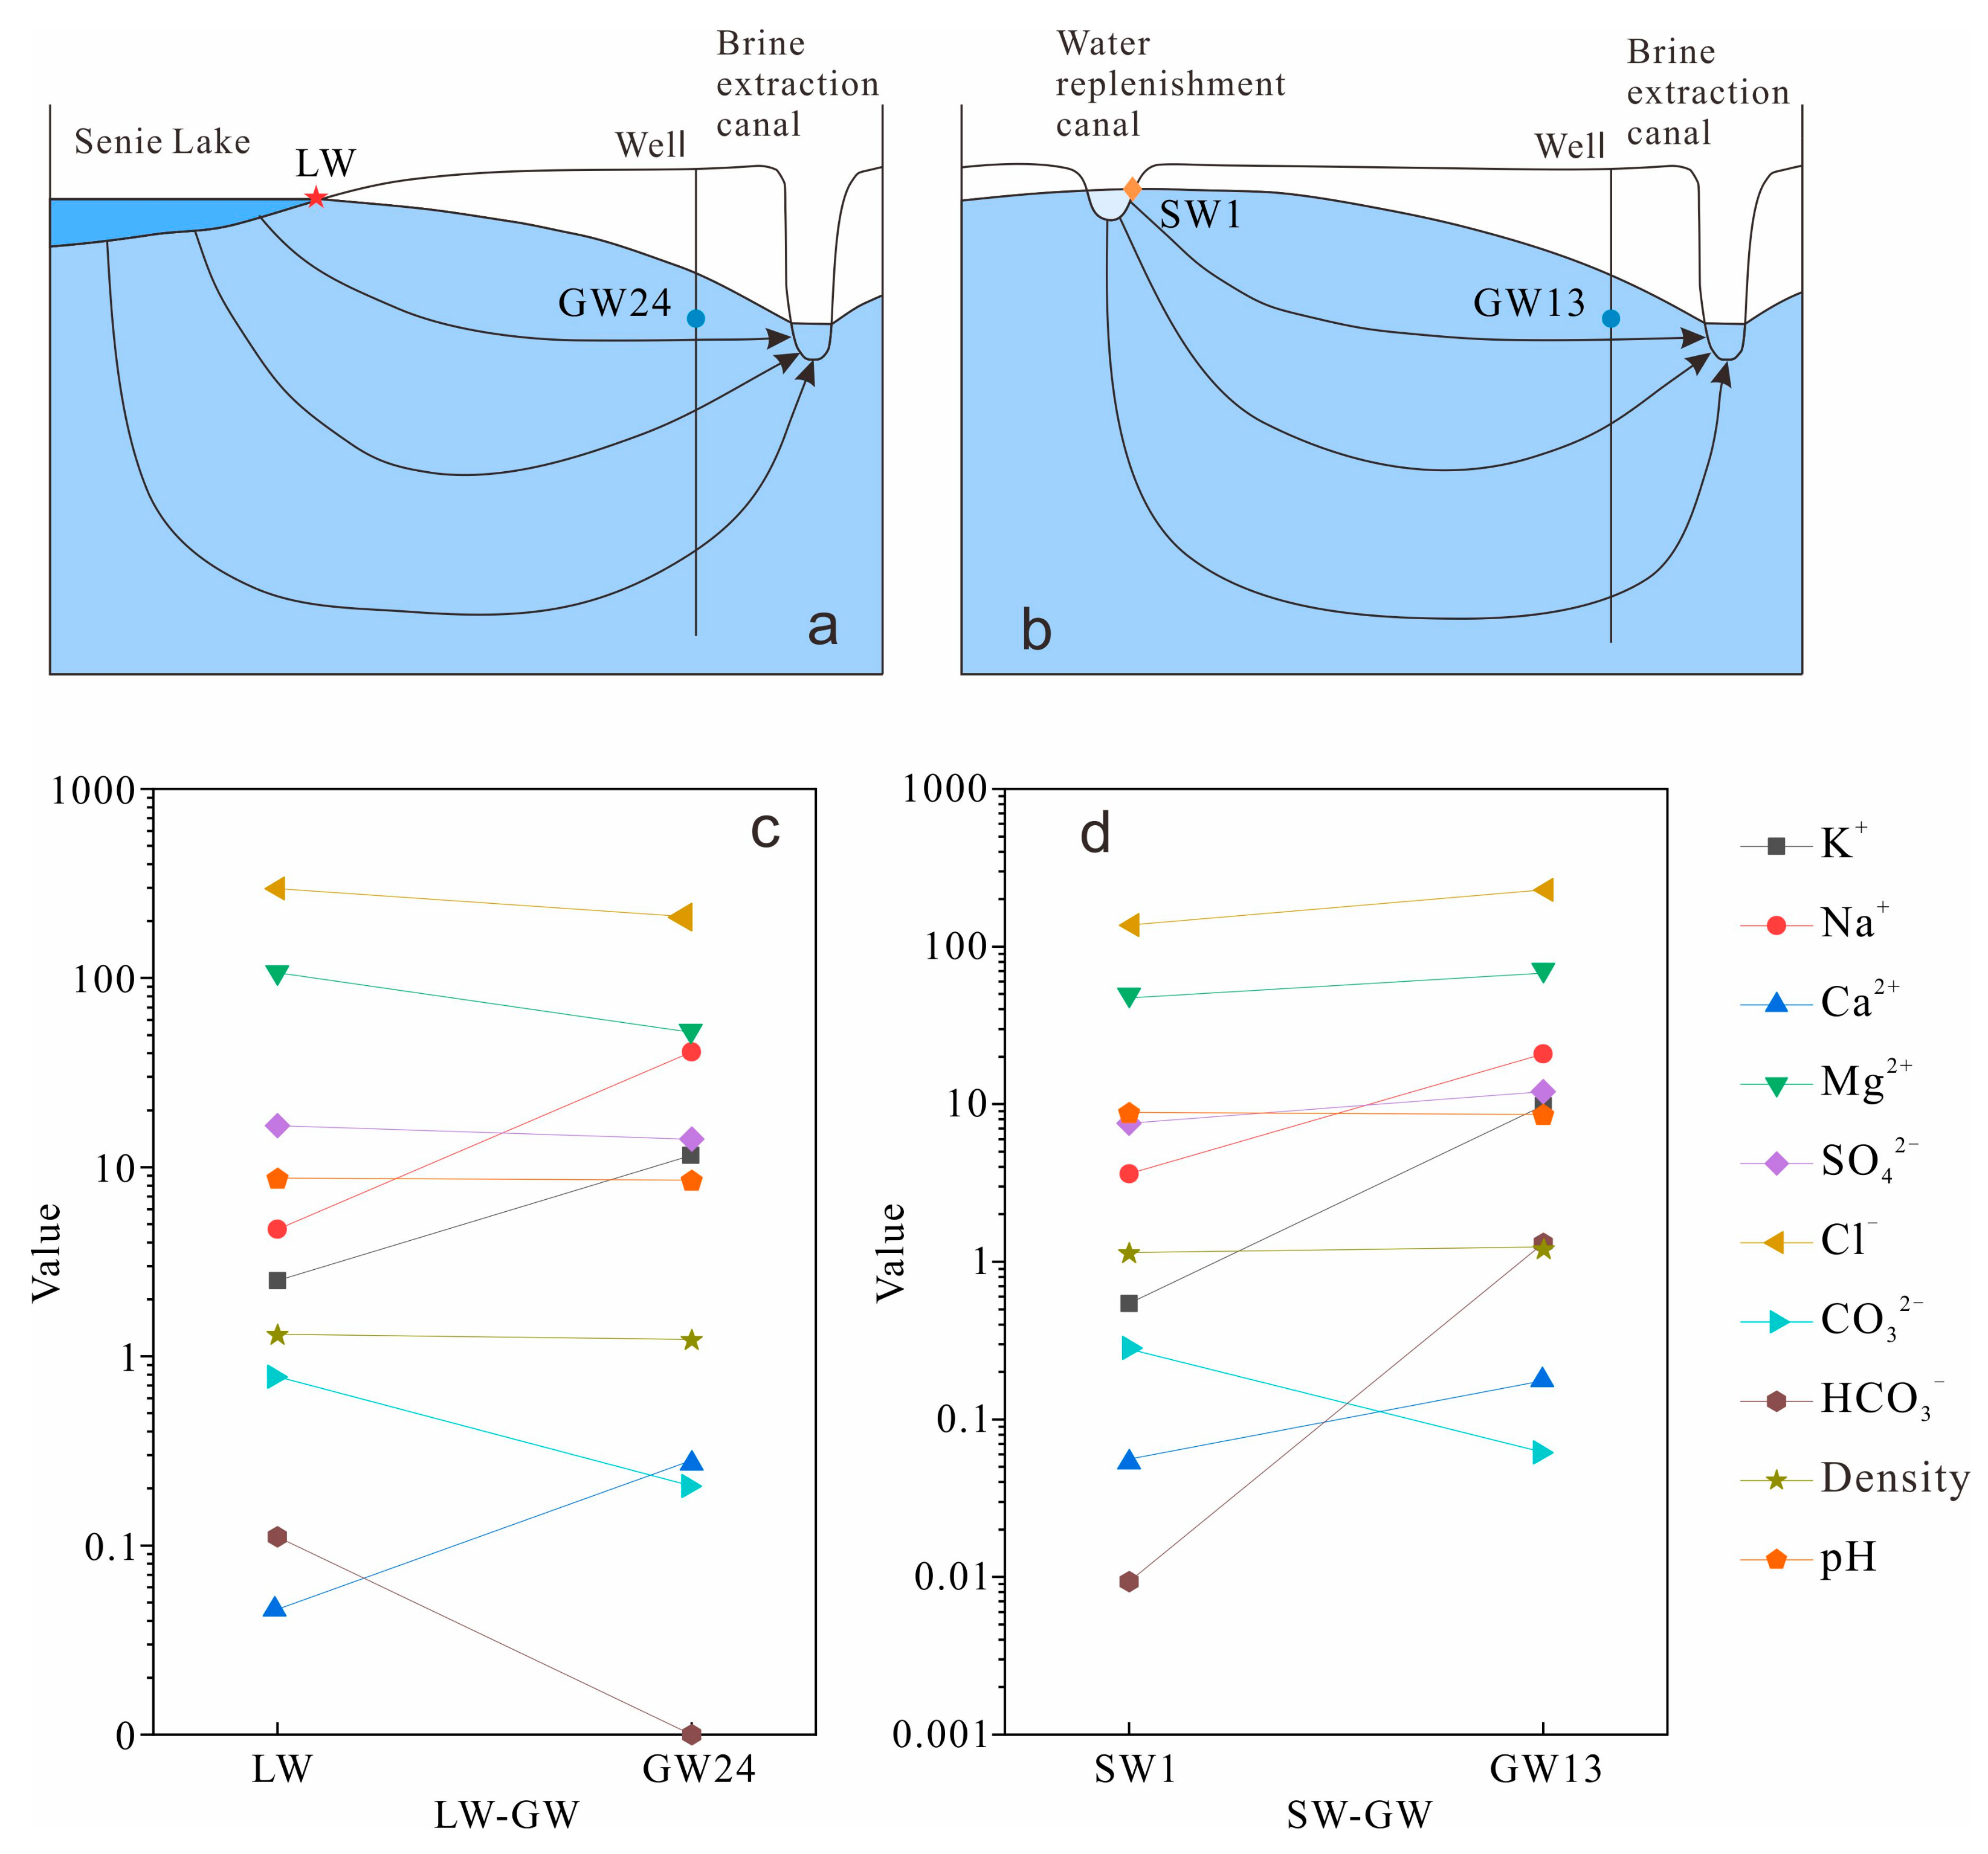
  • GW receives recharge from two distinct sources, LW and SW. These two different water bodies undergo distinct hydrogeochemical processes during groundwater recharge. The rates of cation exchange and mineral dissolution are faster in LW, where mineral precipitation predominantly occurs, whereas mineral dissolution is more prevalent in SW.

Author Contributions

Investigation, R.D., X.G. and X.Y.; writing—original draft preparation, R.D. and X.G.; writing—review and editing, L.C.; visualization, X.L., X.Y., Q.Z. and Q.W. All authors have read and agreed to the published version of the manuscript.

Funding

China Strategic Geological Survey Project: Water Resources Survey in the Salt Lake Area of the Qaidam Basin (DD20230301); Qinghai Environmental Geological Survey Bureau Science and Technology Project “Study on Water Balance and Hydrodynamic Mechanism of the Qarhan Salt Lake under Changing Environmental Conditions” (2023-ZK-01); Key Research and Development Program of Shaanxi (2022SF-327).

Data Availability Statement

Dataset available upon request from the authors.

Acknowledgments

We thank QingHai Salt Lake Industry Co., Ltd., for their assistance with the field investigation. We also extend our gratitude to Mounan Ma, Xiaoyong Wang, and Bin Luo for their hard work and support during the field investigation.

Conflicts of Interest

The authors declare no conflicts of interest.

References

  1. Song, Y.; Hu, H.; Ye, C.; Zhao, Y.; Ma, L.; Zhang, J.; Yan, Q.; Lin, Y. Evaluation on liquefaction effect of potassium dissolution extraction from low-grade solid potash ore in Qarhan Salt Lake, northern of Tibetan Plateau. Carbonates Evaporites 2024, 39, 56. [Google Scholar] [CrossRef]
  2. Zoroddu, M.A.; Aaseth, J.; Crisponi, G.; Medici, S.; Peana, M.; Nurchi, V.M. The essential metals for humans: A brief overview. J. Inorg. Biochem. 2019, 195, 120–129. [Google Scholar] [CrossRef] [PubMed]
  3. Bhateria, R.; Jain, D. Water quality assessment of lake water: A review. Sustain. Water Resour. Manag. 2016, 2, 161–173. [Google Scholar] [CrossRef]
  4. Rawashdeh, R.A.; Xavier-Oliveira, E.; Maxwell, P. The potash market and its future prospects. Resour. Policy 2016, 47, 154–163. [Google Scholar] [CrossRef]
  5. Dmitrieva, D.; Ilinova, A.; Kraslawski, A. Strategic management of the potash industry in Russia. Resour. Policy 2017, 52, 81–89. [Google Scholar] [CrossRef]
  6. al Rawashdeh, R.; Maxwell, P. Analysing the world potash industry. Resour. Policy 2014, 41, 143–151. [Google Scholar] [CrossRef]
  7. Song, X.; Geng, Y.; Zhang, Y.; Zhang, X.; Gao, Z.; Li, M. Dynamic potassium flows analysis in China for 2010–2019. Resour. Policy 2022, 78, 102803. [Google Scholar] [CrossRef]
  8. Chen, W.; Geng, Y.; Hong, J.; Yang, D.; Ma, X. Life cycle assessment of potash fertilizer production in China. Resour. Conserv. Recycl. 2018, 138, 238–245. [Google Scholar] [CrossRef]
  9. Broughton, P.L. Economic geology of southern Saskatchewan potash mines. Ore Geol. Rev. 2019, 113, 103117. [Google Scholar] [CrossRef]
  10. Kumar Katta, A.; Davis, M.; Kumar, A. Assessment of greenhouse gas mitigation options for the iron, gold, and potash mining sectors. J. Clean. Prod. 2020, 245, 118718. [Google Scholar] [CrossRef]
  11. Cabello, J. Lithium brine production, reserves, resources and exploration in Chile: An updated review. Ore Geol. Rev. 2021, 128, 103883. [Google Scholar] [CrossRef]
  12. Bustos-Gallardo, B.; Bridge, G.; Prieto, M. Harvesting Lithium: Water, brine and the industrial dynamics of production in the Salar de Atacama. Geoforum 2021, 119, 177–189. [Google Scholar] [CrossRef]
  13. Wurtsbaugh, W.A.; Miller, C.; Null, S.E.; DeRose, R.J.; Wilcock, P.; Hahnenberger, M.; Howe, F.; Moore, J. Decline of the world’s saline lakes. Nat. Geosci. 2017, 10, 816–821. [Google Scholar] [CrossRef]
  14. Song, H.; Fan, Q.; Li, Q.; Chen, T.; Yang, H.; Han, C. Recharge processes limit the resource elements of Qarhan Salt Lake in western China and analogues in the evaporite basins. J. Oceanol. Limnol. 2023, 41, 1226–1242. [Google Scholar] [CrossRef]
  15. Li, R.; Liu, C.; Jiao, P.; Hu, Y.; Liu, W.; Wang, S. Simulation study on the mining conditions of dissolution of low grade solid potash ore in Qarhan Salt Lake. Sci. Rep. 2021, 11, 10539. [Google Scholar] [CrossRef] [PubMed]
  16. Xiao, Y.; Hao, Q.; Luo, Y.; Wang, S.; Dang, X.; Shao, J.; Huang, L. Origin of Brines and Modern Water Circulation Contribution to Qarhan Salt Lake in Qaidam Basin, Tibetan Plateau; EDP Sciences: Les Ulis, France, 2019; Volume 98, p. 12025. [Google Scholar]
  17. Li, R.; Liu, C.; Jiao, P.; Liu, W.; Tang, D.; Wang, S. The effect of solvent chemistry on potassium dissolution extraction from low-grade solid potash ore in Qarhan Salt Lake, China. Appl. Geochem. 2020, 115, 104550. [Google Scholar] [CrossRef]
  18. Tziritis, E.; Skordas, K.; Kelepertsis, A. The use of hydrogeochemical analyses and multivariate statistics for the characterization of groundwater resources in a complex aquifer system. A case study in Amyros River basin, Thessaly, central Greece. Environ. Earth Sci. 2016, 75, 339. [Google Scholar] [CrossRef]
  19. Nematollahi, M.J.; Clark, M.J.R.; Ebrahimi, P.; Ebrahimi, M. Preliminary assessment of groundwater hydrogeochemistry within Gilan, a northern province of Iran. Environ. Monit. Assess. 2018, 190, 242. [Google Scholar] [CrossRef]
  20. Chidambaram, S.; Anandhan, P.; Prasanna, M.V.; Ramanathan, A.L.; Srinivasamoorthy, K.; Senthil Kumar, G. Hydrogeochemical Modelling for Groundwater in Neyveli Aquifer, Tamil Nadu, India, Using PHREEQC: A Case Study. Nat. Resour. Res. 2012, 21, 311–324. [Google Scholar] [CrossRef]
  21. Guo, W.; Li, P.; Du, Q.; Zhou, Y.; Xu, D.; Zhang, Z. Hydrogeochemical Processes Regulating the Groundwater Geochemistry and Human Health Risk of Groundwater in the Rural Areas of the Wei River Basin, China. Expo. Health 2024, 16, 291–306. [Google Scholar] [CrossRef]
  22. Duan, R.; Li, P.; Wang, L.; He, X.; Zhang, L. Hydrochemical characteristics, hydrochemical processes and recharge sources of the geothermal systems in Lanzhou City, northwestern China. Urban Clim. 2022, 43, 101152. [Google Scholar] [CrossRef]
  23. de Caritat, P.; Bastrakov, E.N.; Jaireth, S.; English, P.M.; Clarke, J.D.A.; Mernagh, T.P.; Wygralak, A.S.; Dulfer, H.E.; Trafford, J. Groundwater geochemistry, hydrogeology and potash mineral potential of the Lake Woods region, Northern Territory, Australia. Aust. J. Earth Sci. 2019, 66, 411–430. [Google Scholar] [CrossRef]
  24. El Alfy, M.; Lashin, A.; Abdalla, F.; Al-Bassam, A. Assessing the hydrogeochemical processes affecting groundwater pollution in arid areas using an integration of geochemical equilibrium and multivariate statistical techniques. Environ. Pollut. 2017, 229, 760–770. [Google Scholar] [CrossRef] [PubMed]
  25. Parisi, A.; Alfio, M.R.; Balacco, G.; Güler, C.; Fidelibus, M.D. Analyzing spatial and temporal evolution of groundwater salinization through Multivariate Statistical Analysis and Hydrogeochemical Facies Evolution-Diagram. Sci. Total Environ. 2023, 862, 160697. [Google Scholar] [CrossRef]
  26. Qin, Z.; Li, Q.; Li, W.; Fan, Q.; Chen, T.; Wu, C.; Wang, J.; Shan, F. Elemental Variations and Mechanisms of Brines in the Context of Large-Scale Exploitation: A Case Study of Xitaijnar Salt Lake, Qaidam Basin. Aquat. Geochem. 2023. [Google Scholar] [CrossRef]
  27. Fan, Q.; Lowenstein, T.K.; Wei, H.; Yuan, Q.; Qin, Z.; Shan, F.; Ma, H. Sr isotope and major ion compositional evidence for formation of Qarhan Salt Lake, western China. Chem. Geol. 2018, 497, 128–145. [Google Scholar] [CrossRef]
  28. Guo, J.; Wei, X.; Long, G.; Wang, B.; Fan, H.; Xu, S. Three-dimensional structural model of the Qaidam basin: Implications for crustal shortening and growth of the northeast Tibet. Open Geosci. 2017, 9, 174–185. [Google Scholar] [CrossRef]
  29. Stober, I.; Zhong, J.; Bucher, K. From freshwater inflows to salt lakes and salt deposits in the Qaidam Basin, W China. Swiss J. Geosci. 2023, 116, 5. [Google Scholar] [CrossRef]
  30. Karunanidhi, D.; Aravinthasamy, P.; Subramani, T.; Kumar, D.; Setia, R. Investigation of health risks related with multipath entry of groundwater nitrate using Sobol sensitivity indicators in an urban-industrial sector of South India. Environ. Res. 2021, 200, 111726. [Google Scholar] [CrossRef]
  31. Zhu, G.; Wu, X.; Ge, J.; Liu, F.; Zhao, W.; Wu, C. Influence of mining activities on groundwater hydrochemistry and heavy metal migration using a self-organizing map (SOM). J. Clean. Prod. 2020, 257, 120664. [Google Scholar] [CrossRef]
  32. Wu, J.; Li, P.; Qian, H. Hydrochemical characterization of drinking groundwater with special reference to fluoride in an arid area of China and the control of aquifer leakage on its concentrations. Environ. Earth Sci. 2015, 73, 8575–8588. [Google Scholar] [CrossRef]
  33. Morán-Ramírez, J.; Ledesma-Ruiz, R.; Mahlknecht, J.; Ramos-Leal, J.A. Rock–water interactions and pollution processes in the volcanic aquifer system of Guadalajara, Mexico, using inverse geochemical modeling. Appl. Geochem. 2016, 68, 79–94. [Google Scholar] [CrossRef]
  34. Pérez-Ceballos, R.; Canul-Macario, C.; Pacheco-Castro, R.; Pacheco-Ávila, J.; Euán-Ávila, J.; Merino-Ibarra, M. Regional Hydrogeochemical Evolution of Groundwater in the Ring of Cenotes, Yucatán (Mexico): An Inverse Modelling Approach. Water 2021, 13, 614. [Google Scholar] [CrossRef]
  35. Guo, Y.; Lyu, Z.; Wang, G.; Ma, L.; Xu, Q.; Huang, X.; Gao, S. Hydrogeochemical simulation of groundwater in Eastern Fengfeng mining area. Coal Geol. Explor. 2016, 44, 101–105. [Google Scholar] [CrossRef]
  36. Li, P.; Wu, J.; Qian, H. Assessment of groundwater quality for irrigation purposes and identification of hydrogeochemical evolution mechanisms in Pengyang County, China. Environ. Earth Sci. 2013, 69, 2211–2225. [Google Scholar] [CrossRef]
  37. Adimalla, N.; Venkatayogi, S. Geochemical characterization and evaluation of groundwater suitability for domestic and agricultural utility in semi-arid region of Basara, Telangana State, South India. Appl. Water Sci. 2018, 8, 44. [Google Scholar] [CrossRef]
  38. Zaidi, F.K.; Nazzal, Y.; Jafri, M.K.; Naeem, M.; Ahmed, I. Reverse ion exchange as a major process controlling the groundwater chemistry in an arid environment: A case study from northwestern Saudi Arabia. Environ. Monit. Assess. 2015, 187, 607. [Google Scholar] [CrossRef] [PubMed]
  39. Xu, F.; Li, P.; Du, Q.; Yang, Y.; Yue, B. Seasonal Hydrochemical Characteristics, Geochemical Evolution, and Pollution Sources of Lake Sha in an Arid and Semiarid Region of Northwest China. Expo. Health 2023, 15, 231–244. [Google Scholar] [CrossRef]
  40. Chaudhary, V.; Satheeshkumar, S. Assessment of groundwater quality for drinking and irrigation purposes in arid areas of Rajasthan, India. Appl. Water Sci. 2018, 8, 218. [Google Scholar] [CrossRef]
  41. Li, P.; He, X.; Guo, W. Spatial groundwater quality and potential health risks due to nitrate ingestion through drinking water: A case study in Yan’an City on the Loess Plateau of northwest China. Hum. Ecol. Risk Assess. 2019, 25, 11–31. [Google Scholar] [CrossRef]
  42. Jia, H.; Qian, H.; Zheng, L.; Feng, W.; Wang, H.; Gao, Y. Alterations to groundwater chemistry due to modern water transfer for irrigation over decades. Sci. Total Environ. 2020, 717, 137170. [Google Scholar] [CrossRef] [PubMed]
Figure 1. Location of the study area, and water sampling sites.
Water 16 01833 g001
Figure 2. Geological model and groundwater depth of the study area.
Water 16 01833 g002
Figure 3. Relationship between Mineral Saturation Index and Total Dissolved Solids (TDS), with red arrows indicating the evolution direction of the mineral saturation index.
Water 16 01833 g003
Figure 4. Schematic diagram of groundwater flow patterns between points (a) LW and GW24, and (b) SW1 and GW13, black arrows represent groundwater flowlines. Comparison of hydrochemical characteristics between points (c) LW and GW24, and (d) SW1 and GW13 (values in g/L except pH and density in g/cm3).
Water 16 01833 g004
Figure 5. Piper diagram of water samples.
Water 16 01833 g005
Figure 6. Gibbs diagram of water samples.
Water 16 01833 g006
Figure 7. Scatter diagrams of (a) Cl vs. Na+, (b) Cl vs. Mg2+, (c) Ca2+ vs. SO42−, and (d) (Ca2+ + Mg2+) vs. (HCO3 + SO42−) in water samples.
Water 16 01833 g007
Figure 8. Plots of (a) CAI-II versus CAI-I and (b) (Ca2+ + Mg2+) − (HCO3 + SO42−) versus Na+ + K+ − Cl.
Water 16 01833 g008
Table 1. Statistical analysis of hydrogeochemical parameters of water samples (in g/L except pH and density in g/cm3).
TypeIDpHK+Na+Ca2+Mg2+SO42−ClTDSCO32−HCO3Li+Density
GWGW18.494.0560.02037.816.24200.54309.960.150.180.091.21
GW28.2332.8166.241.8728.393.13214.80347.6700.320.111.23
GW36.761.85106.121.628.323.43190.74312.2300.480.021.20
GW48.5620.9731.230.4458.086.74229.06347.220.090.700.171.24
GW58.616.7962.040.6637.126.84203.21317.090.040.540.091.22
GW68.655.6156.520.5439.428.28202.32313.160.050.520.101.22
GW78.4915.3020.500.3169.067.06237.97350.730.050.520.111.24
GW88.576.7040.530.3453.0110.65213.02324.770.040.770.091.23
GW98.671.2726.380.2966.039.47224.60328.760.130.820.121.23
GW108.5215.8019.780.4068.825.94238.87350.540.050.780.271.25
GW118.5512.0125.620.2864.0010.33228.17341.9701.630.511.24
GW128.638.3942.200.1651.4819.85206.78329.870.080.900.221.23
GW138.619.7820.780.1867.8112.04229.06341.370.061.310.481.24
GW148.309.4764.110.1737.0933.19191.05335.3200.100.251.23
GW158.429.6260.860.1939.8133.05194.64338.440.080.020.261.23
GW168.447.7852.240.5939.5010.48195.09305.91000.211.21
GW178.406.7764.820.3934.4816.61195.54318.830.0700.211.22
GW188.4711.4834.670.3757.0110.77218.86333.310.1900.141.23
GW198.526.6921.710.3570.099.43234.11342.530.210.060.141.24
GW208.616.6210.820.1384.0412.27254.74368.800.320.090.181.26
GW218.422.40101.940.8312.865.95193.30317.320.0100.021.21
GW227.854.5578.081.3125.795.04197.78312.6500.060.071.21
GW238.5412.0274.890.1733.6941.30188.36350.750.1600.321.24
GW248.5611.5940.640.2851.5914.04209.89328.220.2100.181.23
GW258.7112.3436.600.6352.476.69216.64325.960.110.180.051.23
GW268.1714.0127.295.5858.560.47232.63339.4500.520.311.23
Min6.761.2710.8208.320.47188.36305.91000.021.20
Max8.7132.81106.125.5884.0441.30254.74368.800.321.630.511.26
Mean8.419.8747.950.7047.9411.89213.14332.030.080.400.181.23
SD0.386.5825.211.0918.589.8418.3115.880.080.440.120.01
CV(%)5675314939839597109681
SWSW18.880.543.630.0647.257.55137.26196.890.280.010.111.15
SW28.810.907.620.1756.789.70167.28242.580.470.090.121.18
mean8.850.725.620.1152.028.62152.27219.730.370.050.111.16
LWLW8.752.524.700.05106.516.61297.79428.460.780.110.221.31
Table 2. Statistical analysis of physiochemical parameters of soluble ions (in g/kg except pH).
IndicesSoluble Ions
MinMaxMeanSDCV (%)
pH8.038.538.280.161.93
K+0.3616.623.313.72112.19
Na+2.53313.40150.01117.4778.31
Ca2+0.3711.815.403.2059.25
Mg2+0.4020.598.106.2777.46
SO42−1.9626.8010.325.7455.57
Cl31.40570.00302.70198.4865.57
CO32−0.000.280.080.0677.95
HCO30.050.320.150.0959.78
Li+0.000.420.130.14110.67
Table 3. Correlation matrix of the main ions in soluble salt.
K+Na+Ca2+Mg2+ClSO42−CO32−HCO3Li+pH
K+1−0.420.040.82 **−0.40.45 *0.40.62 **0.59 **0.12
Na+ 10.58 **−0.76 **0.99 **0.19−0.82 **−0.87 **−0.89 **−0.71 **
Ca2+ 1−0.220.61 **0.78 **−0.47 *−0.35−0.57 **−0.47 *
Mg2+ 1−0.73 **0.190.79 **0.86 **0.87 **0.57 **
Cl 10.21−0.79 **−0.85 **−0.88 **−0.71 **
SO42− 1−0.150.01−0.11−0.2
CO32− 10.80 **0.85 **0.73 **
HCO3− 10.81 **0.63 **
Li+ 10.71 **
pH 1
Note: ** indicates a significant correlation at the 0.01 level; * indicates a significant correlation at the 0.05.
Table 4. Correlation matrix of GW.
K+Na+Ca2+Mg2+ClSO42−CO32−HCO3Li+TDSpH
K+1−0.32−0.070.280.38−0.010.010.160.48 *0.63 **−0.01
Na+ 10.38−0.98 **−0.91 **−0.06−0.44 *−0.47 *−0.37−0.55 **−0.49 *
Ca2+ 1−0.42 *−0.12−0.87 **−0.52 **−0.08−0.55 **−0.48 *−0.44 *
Mg2+ 10.89 **0.110.48 *0.43 *0.370.57 **0.48 *
Cl 1−0.210.330.49 **0.190.59 **0.37
SO42− 10.44 *−0.220.51 **0.190.28
CO32− 1−0.130.180.350.53 **
HCO3 10.130.210.44 *
Li+ 10.54 **0.02
TDS 10.11
pH 1
Note: ** indicates a significant correlation at the 0.01 level; * indicates a significant correlation at the 0.05.
Table 5. Mineral phase transfer for different pathways calculated by PHREEQC.
Phaseρ/(mmol/L)
Chemical FormulaLW-GWSW-GW
CaX2CaX218.7202.671
NaXNaX−37.450−5.342
BischofiteMgCl2·6H2O−15.980/
CalciteCaCO3/−5.626
CarnalliteKMgCl3·6H2O−17.8600.278
DolomiteCaMg(CO3)2/2.820
PolyhaliteK2MgCa2(SO4)4·2H2O8.860/
GypsumCaSO4·2H2O−36.490−0.017
HaliteNaCl38.1006.346
Note: positive value indicates that the mineral phase has dissolved into groundwater, whereas negative values indicate that mineral phases may precipitate out of groundwater.
Disclaimer/Publisher’s Note: The statements, opinions and data contained in all publications are solely those of the individual author(s) and contributor(s) and not of MDPI and/or the editor(s). MDPI and/or the editor(s) disclaim responsibility for any injury to people or property resulting from any ideas, methods, instructions or products referred to in the content.

