Article

Hydrochemical Characteristics and Water Quality Evaluation of Groundwater in the Luohe Formation of Binchang Mining Area, China

1
Environmental Protection Management Division, CHN Energy Shendong Clal Group Co., Ltd., Yulin 719315, China
2
Key Laboratory of Mine Geological Hazards Mechanism and Control, MNR, Xi’an 710054, China
3
Shaanxi Institute of Geo-Environment Monitoring, Xi’an 710054, China
4
Loess and Ecological Restoration Department of Xi’an Center of China Geological Survey, Ministry of Natural Resources, Xi’an 710054, China
*
Author to whom correspondence should be addressed.
Water 2024, 16(13), 1913; https://doi.org/10.3390/w16131913
Submission received: 23 May 2024 / Revised: 22 June 2024 / Accepted: 26 June 2024 / Published: 4 July 2024
(This article belongs to the Special Issue Mine and Water)

Abstract

:
The groundwater of the Luohe Formation in Binchang mining area is the main source of water for industrial and agricultural use and for drinking water for residents in the area. In order to study the hydrochemical characteristics and water-quality status of Luohe Formation groundwater in the mining area, statistical analysis, Piper three-line diagram, ion ratio relationship, and other methods were used to study the hydrochemical characteristics and formation factors of the groundwater. The Nemerow index evaluation method and the fuzzy comprehensive evaluation method based on principal component analysis were used to evaluate the groundwater quality in the mining area. The results show that the groundwater is weakly acidic as a whole, and the content of SO42− and Cl have strong variability in terms of spatial distribution. The groundwater chemical type gradually evolves from SO4 • HCO3 • Cl–Na, SO4–Na and SO4 • Cl–Na-type water in the north of the mining area to SO4 • HCO3 • Cl–Na • Ca, HCO3 • SO4–Na • Mg, and SO4 • Cl–Na • Ca • Mg-type water in the south. The formation of the hydrochemical composition of groundwater in the study area may be related to multiple factors such as cation-alternating adsorption, carbonate and sulfate dissolution, and hydraulic exchange with the groundwater of the upper Huachi Formation. Comparing the evaluation results of the Nemerow index method and the principal component analysis method, the latter’s evaluation results can take into account the contribution of each indicator to the overall groundwater quality, and to a certain extent can weaken the control effect of a certain pollution indicator, exceeding the limit on the entire evaluation result. Therefore, the evaluation results based on the principal component analysis method are more credible.

1. Introduction

Groundwater resources are the material basis for supporting social and economic development and maintaining the functional balance and diversified services of ecosystems [1]. However, recent years have seen an increase in groundwater pollution due to human activities [2]. Western China, rich in coal resources, suffers from a fragile ecological environment and scarce water resources [3,4]. The intense and concentrated exploitation of coal in recent years has damaged aquifer structures, leading to issues such as declining groundwater levels [5,6], water resource leakage [7,8,9,10], and worsening water quality [11]. This has significantly diminished the ecological functionality of coal mining areas. Under the same geological background, the concentration of the main chemical indicators of groundwater in the coal mining area is significantly higher than that in the non-mining area. Coal is rich in harmful elements such as Cl and Pb, which have a strong carcinogenic risk and threaten the drinking water safety of residents [12]. Therefore, research on the hydrochemical characteristics of groundwater in mining areas, scientific evaluation of groundwater quality, and the timely grasp of groundwater environmental conditions can effectively promote the protection and rational development of water resources.
Factor analysis and multivariate statistical analysis have been favored in the analysis of hydrochemical characteristics [13]. Principal component analysis, systematic clustering, the Piper diagram, and the Gibbs diagram are mostly used to analyze the genesis and evolution of groundwater hydrochemistry [14,15,16]. Spatial analysis of principal component load scores and hydrochemical types can be used to study the controlling factors of groundwater chemical formation [17].
Water-quality evaluation is primarily divided into single-factor evaluation and comprehensive evaluation methods. The single-factor evaluation method directly highlights excessive components and regions of groundwater quality [18]. Li Lijun et al. used single-factor evaluation and the superposition index method to assess groundwater pollution in Songyuan City and analyzed its impact [19]. The comprehensive evaluation method fully reflects the overall status of groundwater quality. Comprehensive evaluation methods include the water quality index method [20], fuzzy comprehensive evaluation method [21], geostatistics method [22,23], and provenance extension method [24]. The fuzzy comprehensive evaluation method is widely used. Dahiya et al. [25] used the fuzzy comprehensive evaluation model to assess water quality at 42 groundwater sampling sites in Haryana State, Southern India. The results showed that about 64% of the groundwater was of satisfactory or acceptable quality. Peng et al. [26] used the fuzzy comprehensive evaluation method to assess water quality at 34 groundwater sampling points in Zhaoyuan City, Shandong Province. The results showed that 88% of the water was polluted. However, the fuzzy comprehensive evaluation method is cumbersome. The evaluation process becomes more complex with more water sample data, and constructing the weight matrix is the most critical problem.
The analytic hierarchy process, principal component analysis [27], entropy weight method [28], rough set method [29], and factor analysis are commonly employed to identify key evaluation indicators and determine their weights. Xia et al. [30] enhanced the fuzzy comprehensive evaluation model using principal component analysis. This simplification significantly streamlined the evaluation process, yielding satisfactory results.
The Binchang mining area, situated in the hill and gully regions of the Eastern Longdong Loess Plateau, serves as the central construction zone for the Huanglong coal base. According to statistics, Binzhou City and Changwu County in the mining area have total water resources of 7687 million m3 and 45,494 million m3, respectively. However, in areas with severe water shortages, the per capita water resources are merely 210.00 m3 and 249.60 m3. The aquifer of the Lower Cretaceous Luohe Formation, rich in water, is the principal source for industrial, agricultural, and drinking water in the Binchang mining area, holding significant strategic reserve value [31]. Since the 1980s, the exploration and development of coal resources in the area have led to the opening of several modern fully mechanized mines, resulting in subsequent groundwater pollution. Based on the analysis of hydrogeological characteristics, the chemical characteristics and formation factors of groundwater in the Cretaceous Luohe Formation in the Binchang mining area of Shaanxi Province are discussed by means of statistical analysis, Piper diagram, and ion combination ratio analysis. Groundwater quality in the mining area is evaluated using the Nemerow index method and fuzzy comprehensive evaluation based on principal component analysis. The expected outcomes of this research are to offer theoretical support for the development and utilization of groundwater resources in the mining area.

2. General Situation of the Research Area

2.1. Current Situation of Coal Resources Development

The Binchang mining area, the principal site within the Huanglong coal base, serves as the main mining district in Shaanxi Province. This area is the primary energy provider for Shaanxi’s Guanzhong district. Spanning 46.00 km east to west and 36.50 km north to south, the mining area covers 978.00 km2. Geological exploration of the coalfield in the Binchang mining area started in the 1980s, with reserves reaching 7.562 billion tons by the end of 2016. Currently, the mining area houses 13 operational coal mines, comprising 12 large-scale mines with capacities of at least 1.20 Mt/a and one medium-sized mine with a capacity of 0.45–1.20 Mt/a. The mining area’s total production capacity stands at 49.60 Mt/a. As shown in Table 1. The mining area’s coal-bearing stratum, the Jurassic Yan’an Formation, includes eight coal seams. The entire area permits mining of the No. 4 coal seam, which varies in thickness from 0.15 to 35.04 m and averages 10.64 m.

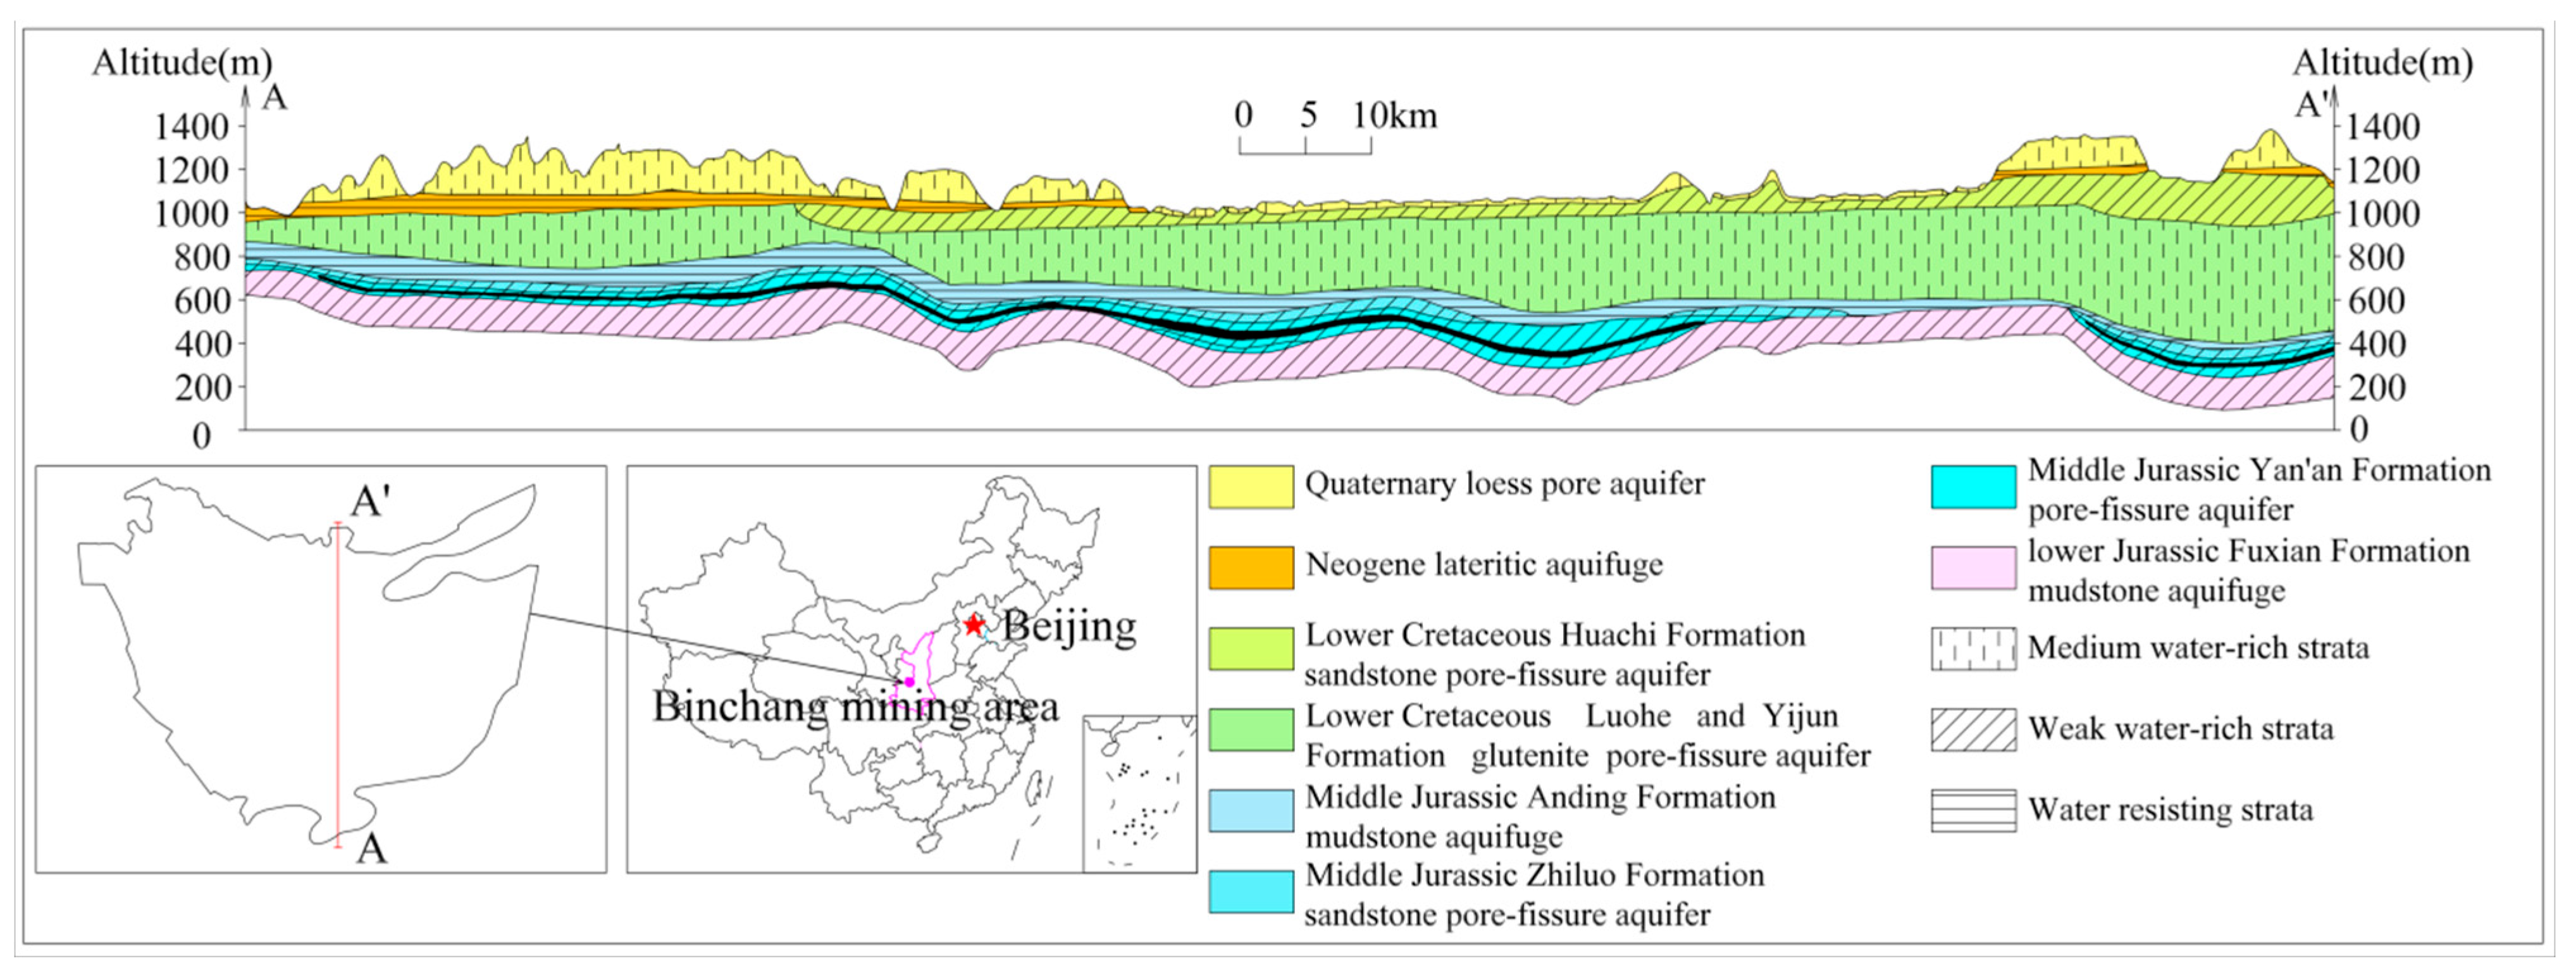
2.2. Aquifer Characteristics

The Binchang mining area is situated in the southwestern margin of the Ordos Basin, within the southern hydrogeological unit of the Cretaceous groundwater basin. The area predominantly lies in the Jinghe River Basin, which is categorized as the Jinghe Hydrogeological Unit. The study area is within this unit. Groundwater development and utilization in the study area have shifted from primarily relying on Quaternary loose layer groundwater, with Cretaceous Luohe sandstone shallow groundwater as a supplement, to primarily using Cretaceous Luohe Formation sandstone groundwater, with Quaternary loose-layer groundwater as a supplement. The aquifers in the Binchang mining area, from top to bottom, include: the Quaternary Holocene alluvial–diluvial aquifer, Quaternary Pleistocene sandy loess and sandy clay aquifer, Neogene red clay impermeable layer, Cretaceous Huachi Formation sandstone aquifer, Cretaceous Luohe Formation pore-fissure aquifer group, Yijun Formation conglomerate pore-fissure aquifer group, Anding Formation impermeable layer, Zhiluo Formation fissure aquifer, Yan’an Formation fissure aquifer, Fuxian Formation mudstone impermeable layer, and Triassic sandstone aquifer (Figure 1). Among these, the Cretaceous Luohe Formation aquifer stands out for its high water abundance, excellent water quality, and significant water supply and ecological importance.

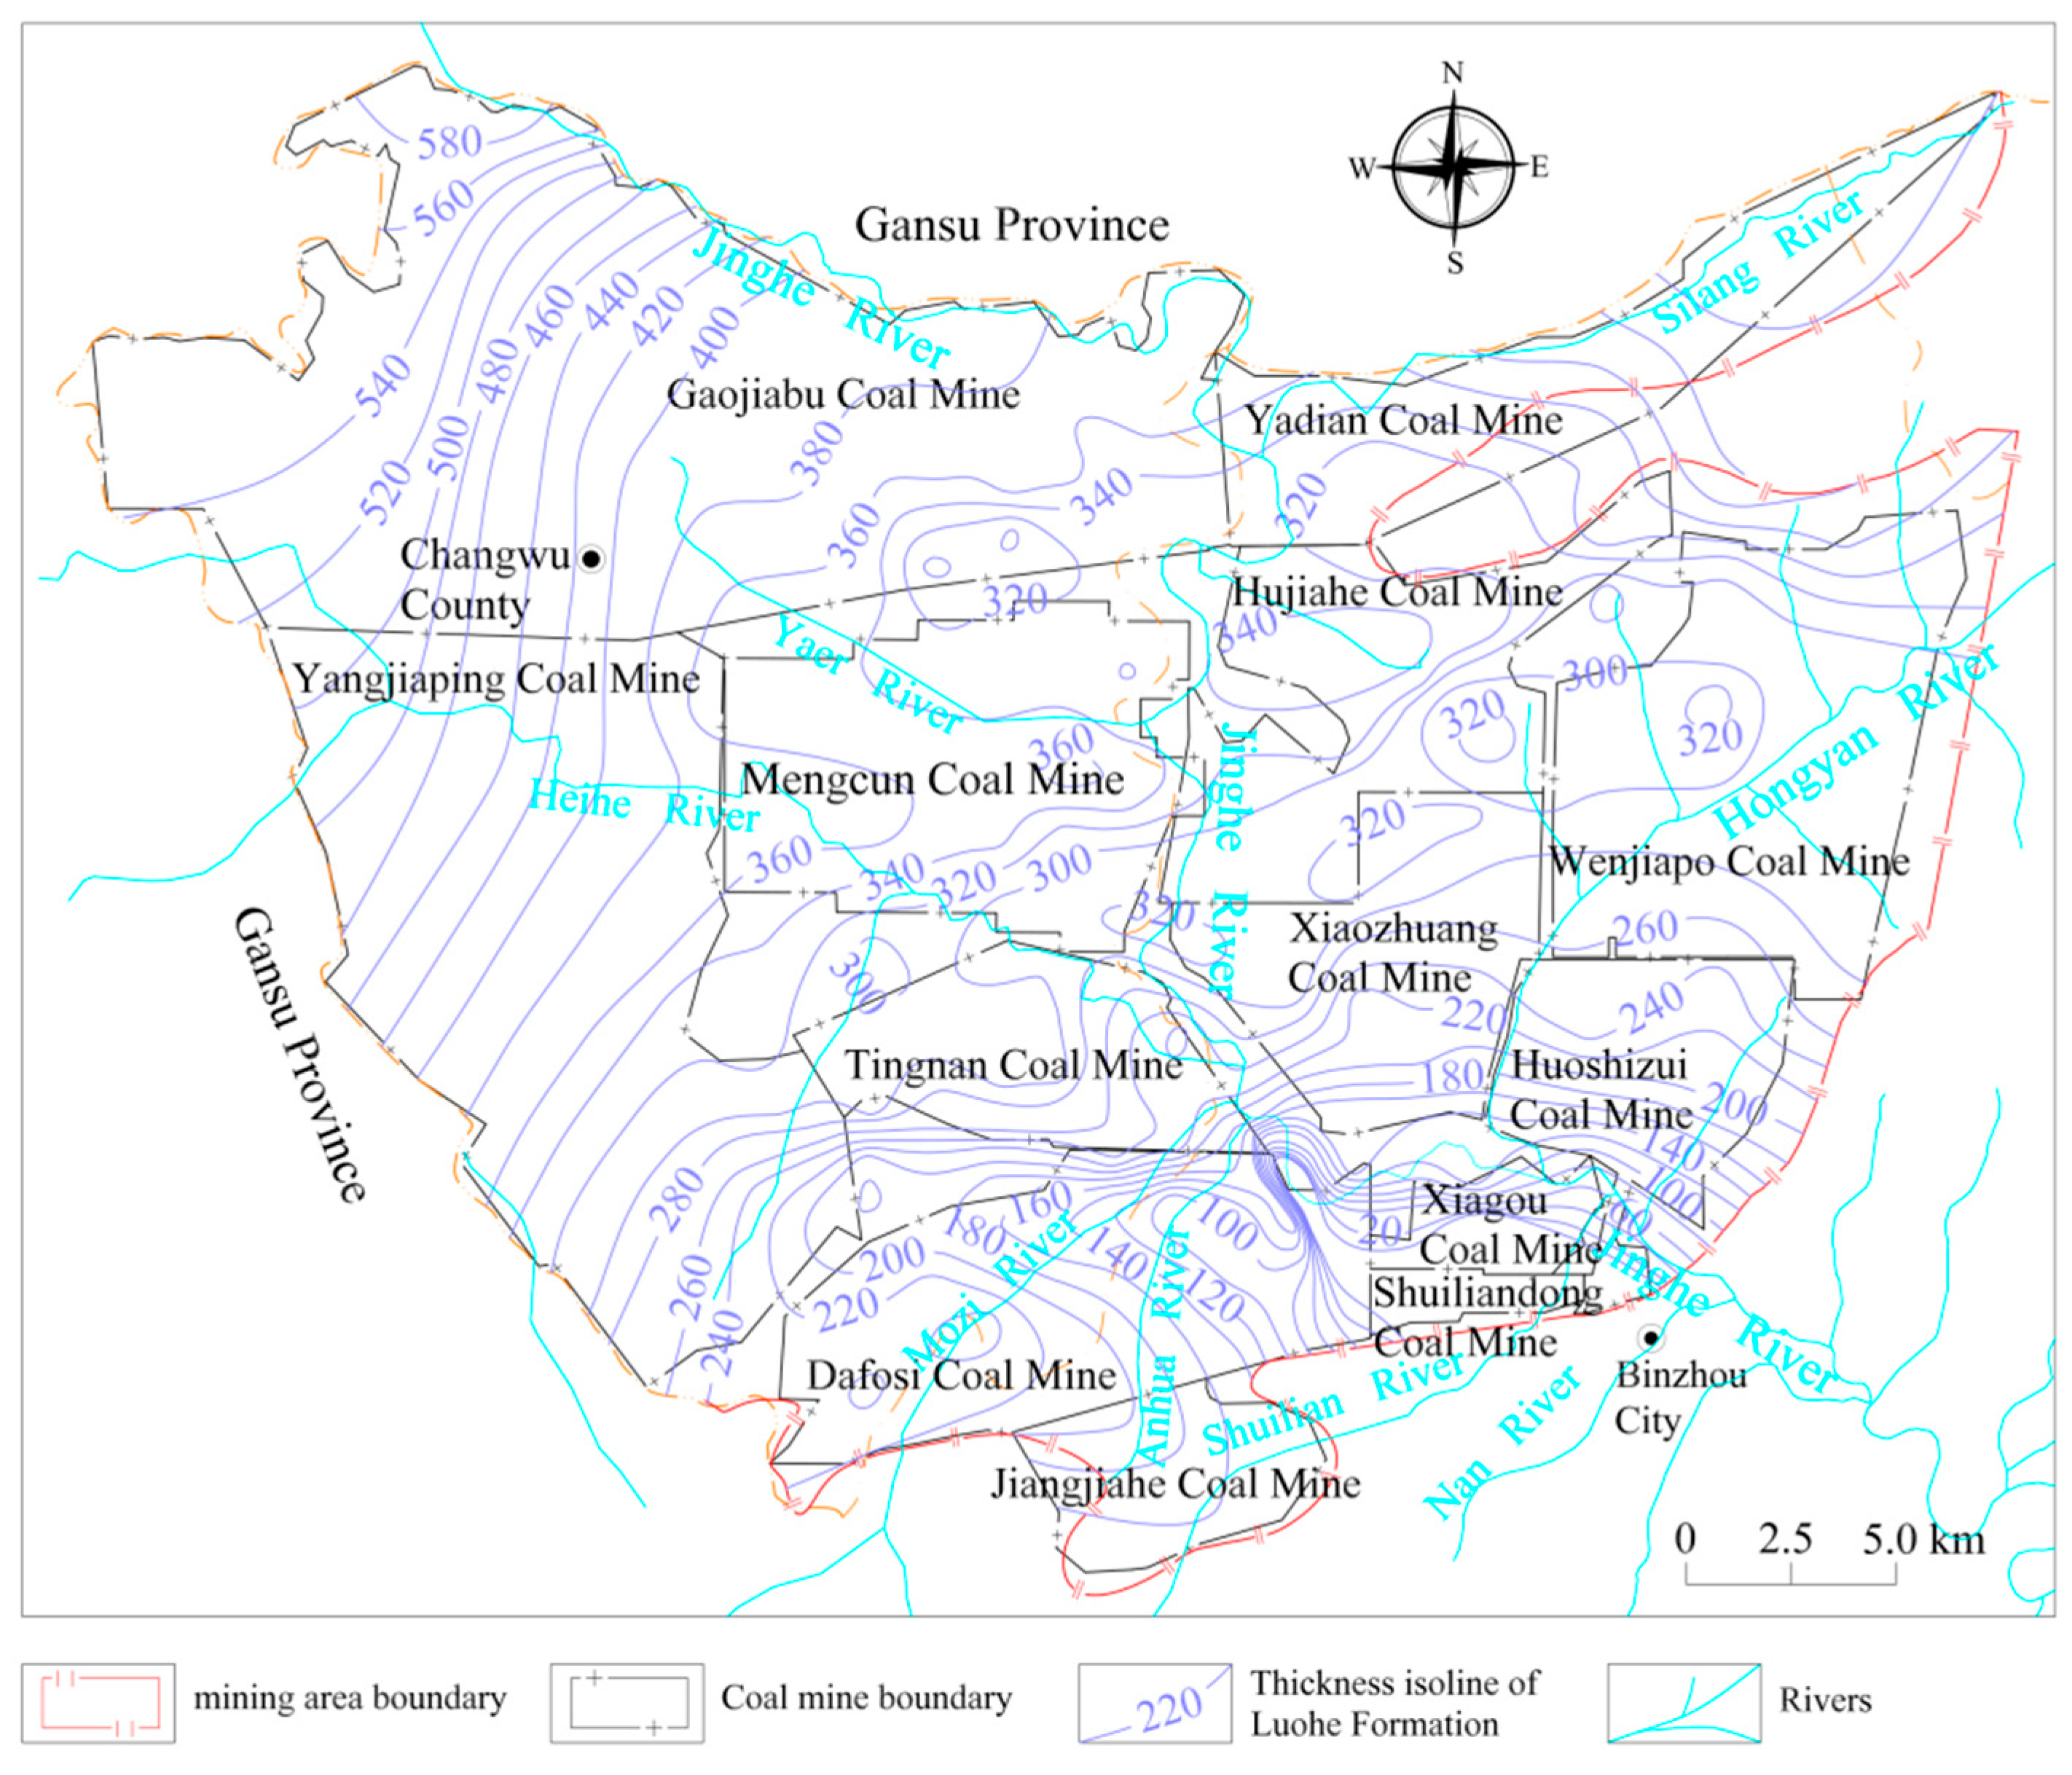
2.3. Aquifer Occurrence Characteristics of Cretaceous Luohe Formation

The Luohe Formation from the Cretaceous period is mainly exposed in the East Valley of Jinghe and its tributaries. In the northern part of the minefield, this formation lies beneath the Cretaceous Huachi Formation, with thicknesses ranging from 0 to 580.84 m, and typically between 200 and 300 m. The Luohe Formation primarily consists of purple to dark purple medium- to coarse-grained sandstone, along with conglomerate, sandy conglomerate, mudstone, and sandy mudstone. The bottom interface of the Luohe Formation is a continuous plane surface, contacting the underlying Yijun Formation strata. The formation’s base typically inclines northwest, forming a monocline. Due to its geological structure, the thickness of the Luohe Formation gradually decreases from northwest to southeast, disappearing at the southeastern boundary of the mining area (Figure 2).
Vertically, the Luohe Formation is affected by alternating sedimentation of meandering-braided-meandering river facies from the bottom to the top and shows obvious segmentation. The floodplain and channel deposits of the meandering river sedimentary section are well-developed, displaying clear positive cycles and a binary structure. The lower structure consists of edge beach deposits, characterized mainly by lateral accretion, while the upper structure is composed of floodplain deposits, primarily formed by vertical deposition. The sediment section of the middle-braided river exhibits a positive cycle progressing from bottom to top. The sediments primarily consist of gravel and sand. The sediment features relatively coarse grains, and it is more water-rich compared to the sediments of the upper and lower meandering rivers [33].

3. Sample Collection, Testing, and Analysis

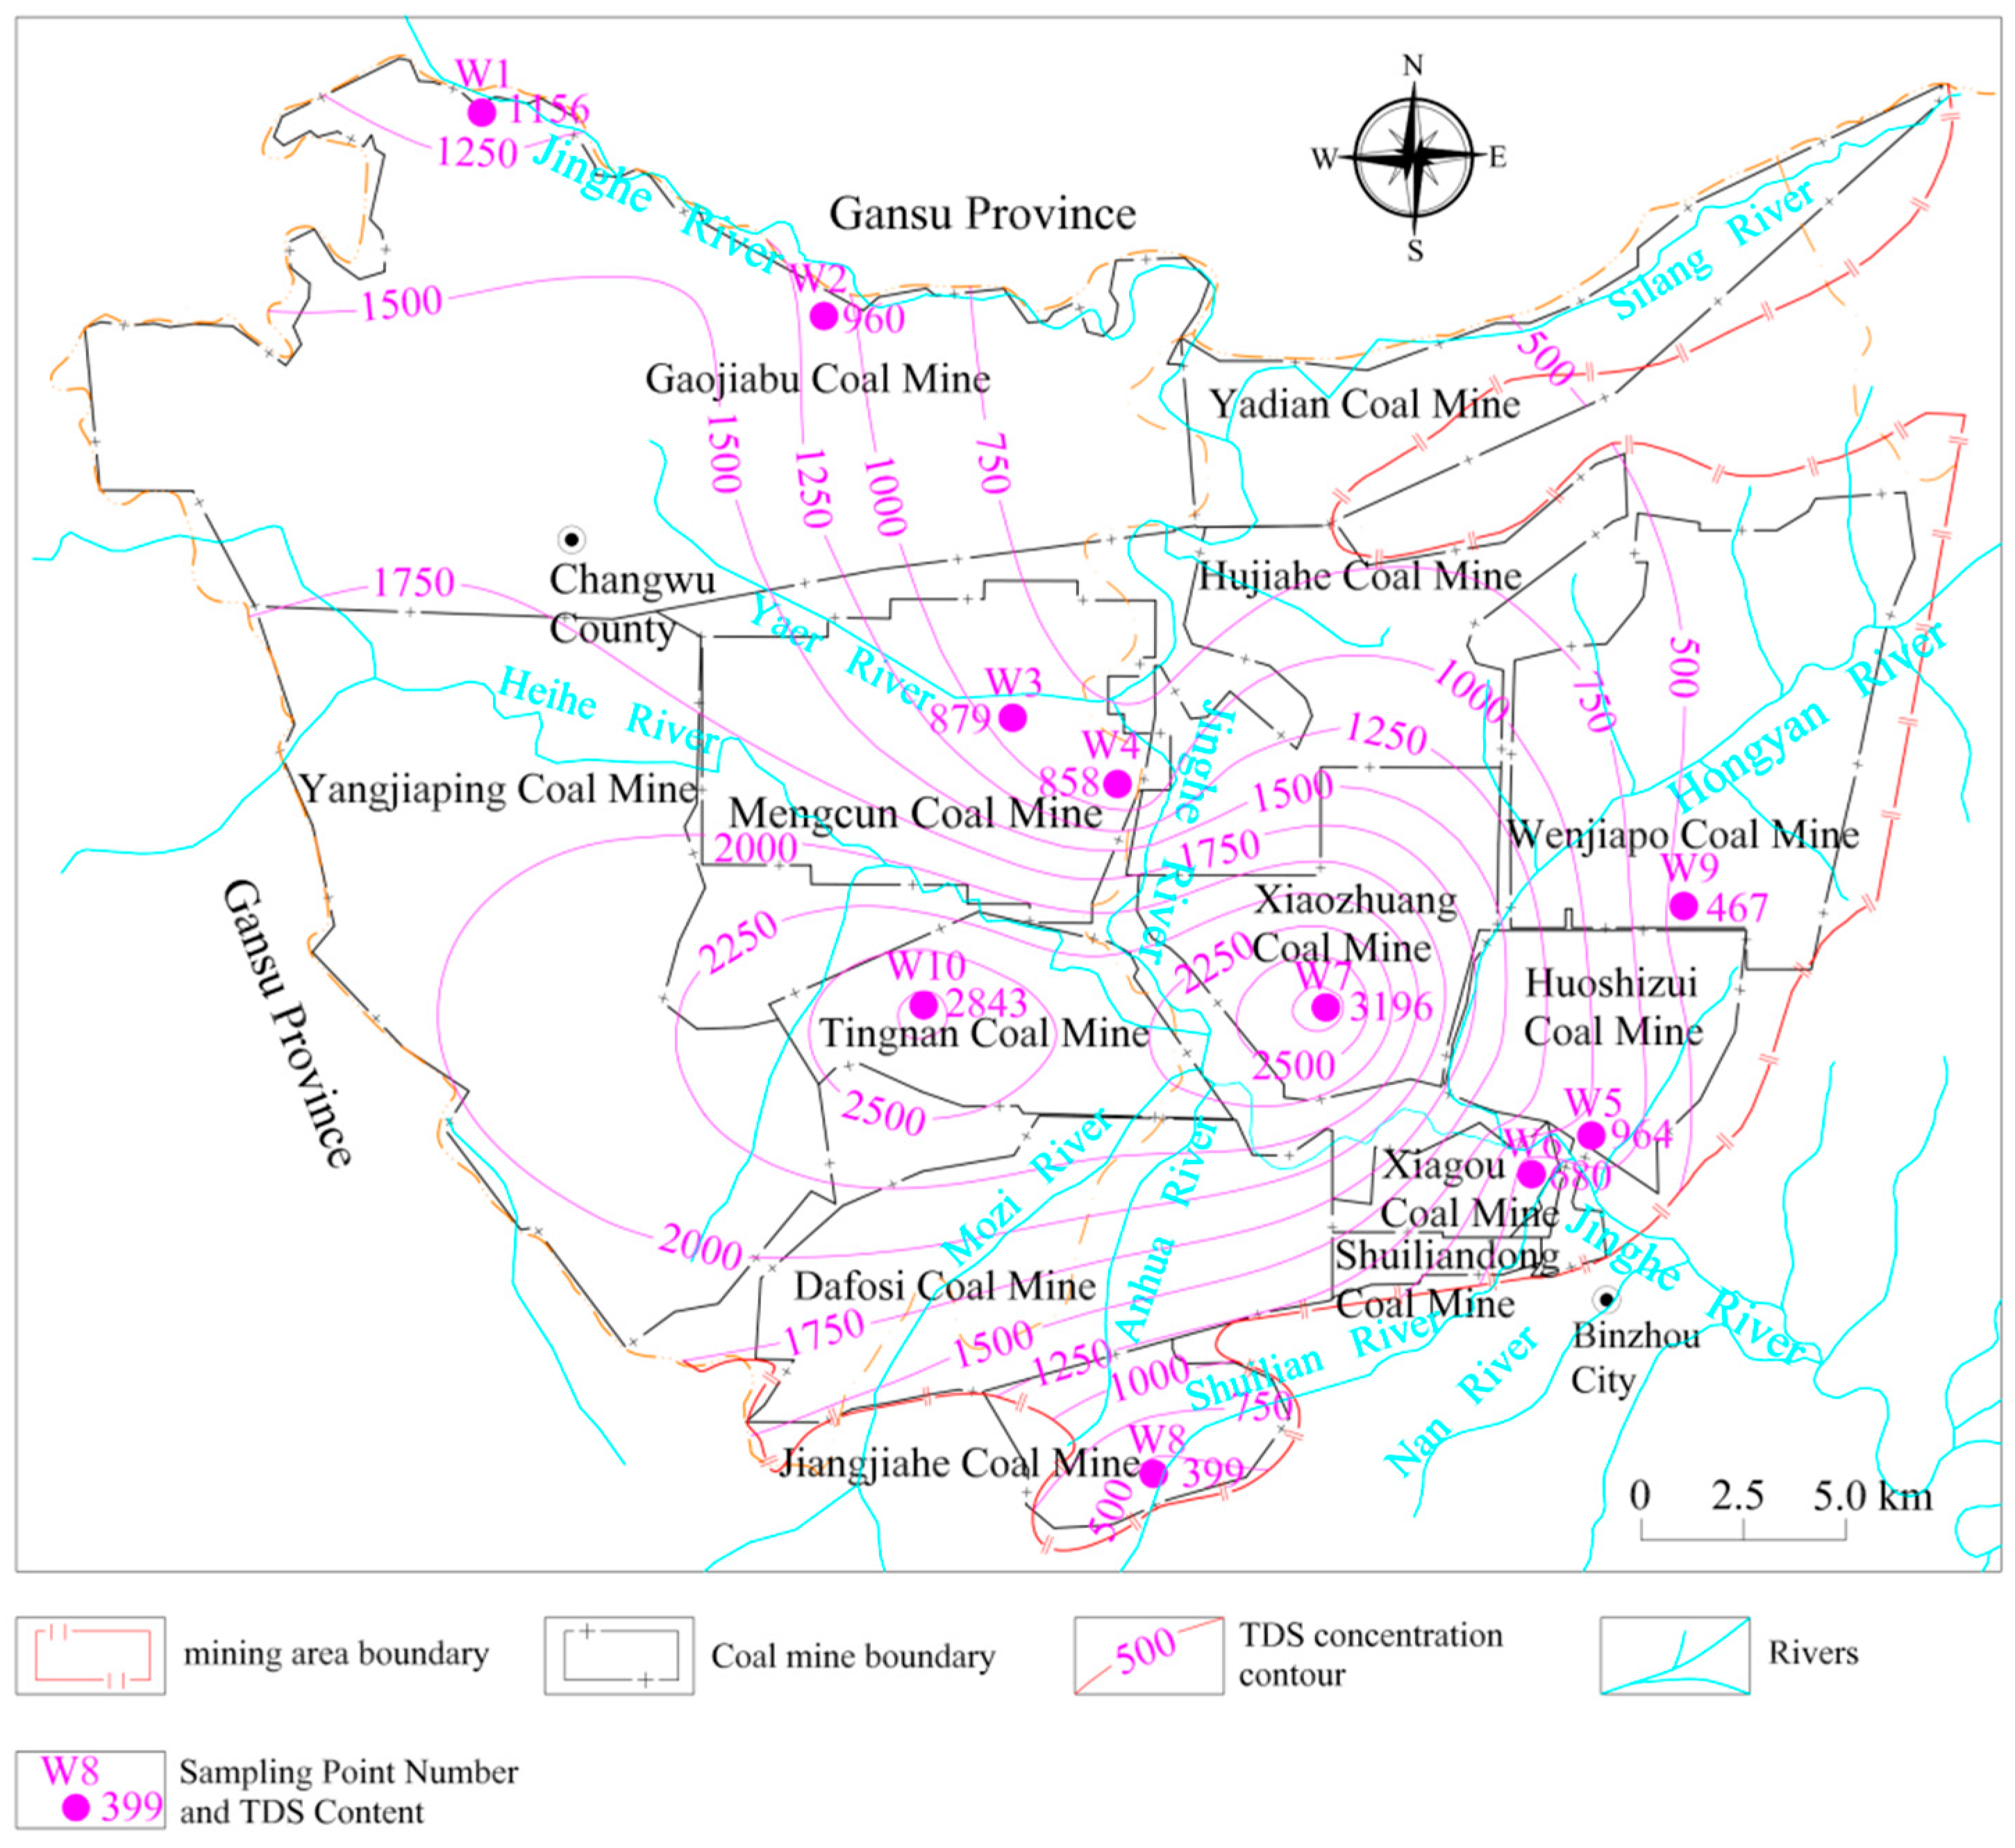
3.1. Sample Collection and Testing

The groundwater of the Luohe Formation in the Cretaceous System is a vital water source for industrial, agricultural, and residential use in the Binchang mining area. To investigate water environment issues caused by coal mining in the area, water samples were collected from 10 Luohe Formation groundwater monitoring wells in the Binchang mining area. Groundwater samples were collected, stored, and sent for inspection following HJ/T164-2004 “Technical Specifications for Groundwater Environmental Monitoring”. Before sampling, the pre-cleaned and sterilized 5 L high-density polyethylene bottles were rinsed 2–3 times, and samples were filtered with a low-speed vacuum pump during sampling. After collection, samples were stored in a dark, low-temperature environment and sent to the laboratory for testing within the specified time. Key detection indicators include total dissolved solids (TDS), K+, Na+, Ca2+, Mg2+, CODMn, Cl, SO42−, HCO3, NO3, F, NH3-N, and pH. pH was measured using a portable water quality analyzer, TDS by the weighing method, K+ and Na+ via flame atomic absorption spectrophotometry, Ca2+ and Mg2+ by ethylenediaminetetraacetic acid titration, Cl, SO42−, and F by ion chromatography, HCO3 by the acid–base method, and NH3-N by neutralization titration and sodium reagent spectrophotometry. Analysis results are presented in Table 2.

3.2. Analytical Methods

After completing the sample tests, we used SPSS19 software to calculate and correlate the results. The Piper tri-line diagram was generated using Aquachem 3.7 software, and groundwater quality in the study area was assessed using the Nemerow index and fuzzy comprehensive evaluation methods, which are based on principal component analysis.

3.2.1. Nemerow Index Evaluation Method

The Nemerow index evaluation method is as follows:
The evaluation scores of each individual index are determined according to Table 3. The classification criteria of each index are based on the water quality criteria of “Specification for regional groundwater contamination investigation and evaluation” (DZ/T0288-2015) and “Standard for groundwater quality” (GB/T14848-2017) (Table 4).
The comprehensive evaluation score is calculated by the following formula [34]:
F = F max 2 + F ¯ 2 2
where
F ¯ = 1 n F i
Fi is the evaluation score of each individual index, dimensionless; Fmax is the maximum value of the evaluation score Fi for each individual index, dimensionless; and n is the number of indicators [34].
The groundwater quality classification of each sample is determined according to Table 5.

3.2.2. Fuzzy Comprehensive Evaluation Method Based on Principal Component Analysis

The fuzzy comprehensive evaluation method based on principal component analysis transforms multiple evaluation indexes into several comprehensive evaluation indexes by the principal component analysis method and then evaluates the water quality by the fuzzy comprehensive evaluation method.
Assuming that there are n samples and m indices for each sample, the original data matrix X can be expressed as an n × m order matrix:
X = x 11 x 12 x 1 m x 21 x 22 x 2 m x 31 x 32 x 3 m x n 1 x n 2 x nm
The correlation coefficients of each index are calculated by the following formula:
r ij = k = 1 n x ki x i ¯ x kj x j ¯ k = 1 n x ki x i ¯ 2 k = 1 n x kj x j ¯ 2
where x kj is the ion content of the j index of the k water sample, mg/L; x i and x j are the measured values of the ion content of the i and j index, mg/L; and i, j = 1, 2, ..., m.
According to the value of the correlation coefficient obtained, the correlation coefficient matrix R is obtained.
R = r 11 r 12 r 1 m r 21 r 22 r 2 m r 31 r 32 r 3 m r n 1 r n 2 r nm
The λ are obtained by solving the eigenvalue equation λ I R = 0 and arranged in the order of λ 1 > λ 2 > λ 3 > … > λ m > 0. Then, the following formula is used to calculate the cumulative variance contribution rate. Principal components were extracted according to the criterion of cumulative variance contribution rate greater than 80%.
α i = λ i i = 1 m λ i
where α i is the variance contribution rate of component i, % and λ i is the eigenvalue of component i, dimensionless.
The magnitude of principal component loads indicates their correlation with the principal component. Principal component loads are calculated using the formulas below:
l ij = λ i e ij
where e ij is the eigenvector of the correlation coefficient matrix.
For each principal component, the main control factor is selected based on the load value and used as the evaluation criterion in fuzzy comprehensive evaluation.
A fuzzy relation matrix is derived from the membership degrees of evaluation factors to evaluation grades. If yip represents the membership degree of the first evaluation factor to the pth evaluation grade index, the corresponding membership function is defined as follows:
For grade I (evaluation grade p = 1), the membership function is:
y i 1 =   1 x ki c i 1 c i 2 x ki c i 2 c i 1 c i 1 < x ki < c i 2 0   x ki c i 2
For grade II to IV (evaluation grade p = 2, 3, and 4), the membership function is:
y ip = 1 c ip x ki c ip c ip 1 c ip 1 x ki c ip c ip + 1 x ki c ip + 1 c ip   c ip < x ki < c ip + 1 0   c ki c ip + 1   or   x ki c ip 1
For grade V (evaluation grade p = 5), the membership function is:
y i 5 =   0 x ki c i 4 1 c i 5 x ki c i 5 c i 4   c i 4 < x ki < c i 5 1   x ki c i 5
In the formulas above, x ki represents the measured value of the i-th evaluation factor in k water samples (mg/L). c ip is the boundary value for the i-th evaluation factor corresponding to the p-th evaluation grade (mg/L). y ip denotes the degree of membership for the i-th evaluation factor relative to the p-th evaluation grade, and it is dimensionless.
Y = y 11 y 12 y 13 y 14 y 15 y 21 y 22 y 23 y 24 y 25 y 31 y 32 y 33 y 34 y 35 y i 1 y i 2 y i 3 y i 4 y i 5
The formula below determines the weight of each evaluation index in assessing groundwater quality:
W ki = x ki / s i i = 1 n x ki / s i
where s i is the arithmetic average of the standard values of each grade of the I evaluation factor, mg/L.
The weight set of each evaluation factor of K water samples can be expressed as W = (Wk1, Wk2, …, Wkn). The comprehensive evaluation model is B = WR = (b1, b2, …, bm), where bm is the membership degree of each water quality grade for each sample.

4. Results and Discussion

4.1. Analysis of Chemical Characteristics of Groundwater

4.1.1. Hydrochemical Characteristics of Major Ions

Table 2 shows that the groundwater pH varies from 7.60 to 8.59, with a small coefficient of variation, and the groundwater is weakly acidic as a whole. The TDS content of groundwater is 399.00–3196.00 mg/L, which is weak–medium salinity groundwater. Figure 3 shows that the TDS content of groundwater is higher in the eastern and northern mining areas but lower in the Jinghe Valley area. These relationships are mainly because of the large thickness of the loess layer and the deep burial of the aquifer in the eastern and western part of the mining area, combined with the influence of the mudstone aquifuge at the bottom of the overburden Huachi Formation, poor groundwater recharge conditions, and slow groundwater circulation, resulting in a higher TDS content of groundwater. The groundwater in the Jinghe River Basin is shallow and directly exposed on both sides of the valley. The recharge condition of atmospheric precipitation is good, the groundwater circulation is frequent, and the TDS content is high.
The variation coefficients of Cl and SO42− concentrations are both greater than 1.0. Analysis indicates that the larger variation in SO42− concentration is related to the distribution of Huachi Formation aquifers in the upper part of the Luohe Formation. The Huachi Formation aquifer, primarily in the northern section of the mining area, ranges from 0 to 260 m in thickness and thins out in the southern part. This aquifer contains substantial amounts of gypsum. Disturbances from coal mining weaken hydraulic exchanges between the Huachi and Luohe Formation aquifers, facilitating SO42− migration to the Luohe Formation. In the southern mining area, especially at sampling points W6, W7, W8, and W9, the Huachi Formation is absent, resulting in generally low SO42− concentrations. The high variation coefficient of Cl concentrations in groundwater indicates significant influence from environmental factors, such as mining activities, coal washery operations, and other anthropogenic activities.

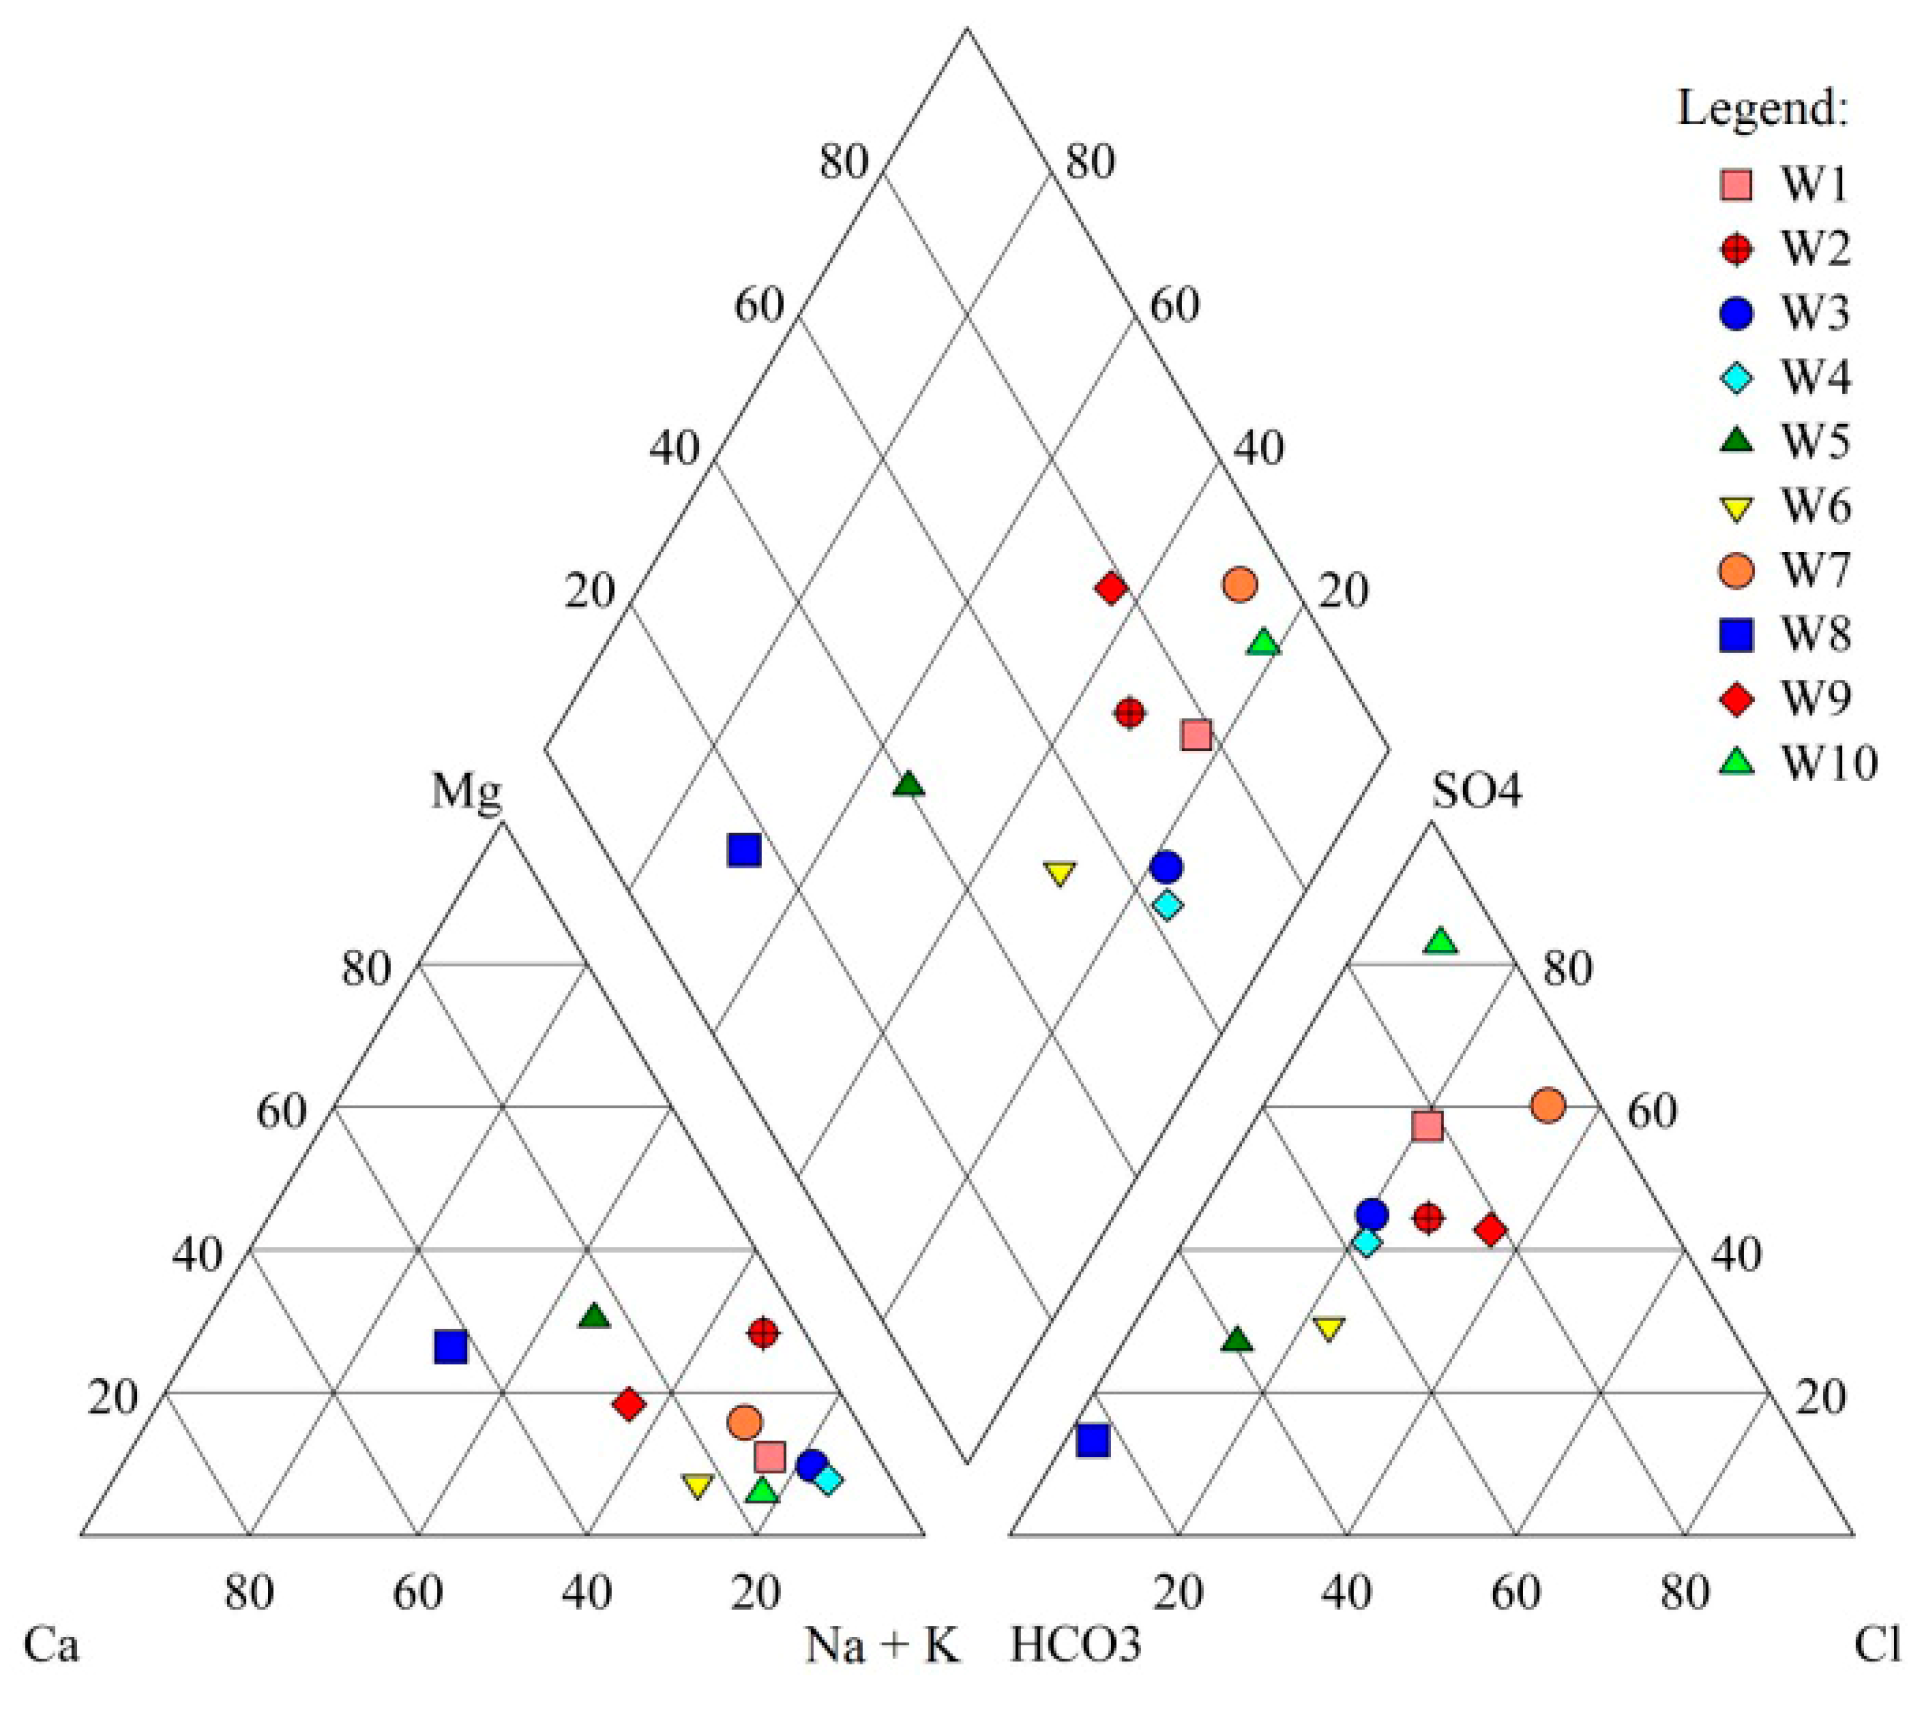
4.1.2. Chemical Types of Groundwater

Figure 4 shows that the main ions in the groundwater of the Luohe Formation are K+ + Na+, SO42−, HCO3, and Cl. In the deeper groundwater burial area of the Luohe Formation, the groundwater chemical types are mainly SO4 • HCO3 • Cl–Na, SO4–Na and SO4 • Cl–Na. In the shallower aquifer area, the groundwater chemical types are transformed into SO4 • HCO3 • Cl–Na • Ca, HCO3 • SO4–Na • Mg and SO4 • Cl–Na • Ca • Mg. Generally, the chemical types of groundwater in the Binchang mining area are complex.

4.1.3. Ion Combination Ratio Analysis

The ion combination ratio serves to investigate the formation of chemical constituents in water and their ionic origins [14]. Chloride ions (Cl) are relatively stable in groundwater; the ratio ρ(Na+)/ρ(Cl) frequently helps identify the sodium (Na+) source. If Na+ originates from salt rock dissolution, then ρ(Na+)/ρ(Cl) equals 1. As depicted in Figure 5a, an increase in TDS leads to ρ(Na+)/ρ(Cl) significantly exceeding 1, suggesting multiple sources of Na+ beyond rock salt dissolution. Given that Ca2+ and Mg2+ adsorb more readily to particle surfaces than Na+, the process of cationic alternating adsorption facilitates Na+ enrichment as TDS increases. If the primary sources of Ca2+ and Mg2+ in groundwater are carbonates and sulfates, then ρ(Ca2+ + Mg2+)/[ρ(SO42−) + 0.5ρ(HCO3)] equals 1. According to Figure 5b, the value of ρ(Ca2+ + Mg2+)/[ρ(SO42−) + 0.5ρ(HCO3)] is less than 1 in most samples, suggesting additional sources for Ca2+ and Mg2+, which confirms the validity of cationic alternating adsorption. If the primary source of Ca2+, Mg2+, and SO42− is sulfate dissolution, then the ratio ρ(Ca2+ + Mg2+)/ρ(SO42−) equals 1. Figure 5c demonstrates that most water samples lie on both sides of the line ρ(Ca2+/Mg2+)/ρ(SO42−) = 1, suggesting that sources other than sulfate dissolution contribute to the presence of Ca2+, Mg2+, and SO42− in the Luohe Formation’s groundwater. When ρ(Ca2+/Mg2+)/ρ(SO42−) > 1, additional sources such as carbonate rock dissolution contribute to the levels of Ca2+ and Mg2+. When ρ(Ca2+/Mg2+)/ρ(SO42−) < 1, other sources like hydraulic exchange with the Huachi Formation aquifer increase SO42− levels. If carbonate dissolution primarily sources Ca2+, Mg2+, and HCO3, then the ratio ρ(Ca2+ + Mg2+)/0.5ρ(HCO3) equals 1. Figure 5d reveals that most water samples have a ρ(Ca2+ + Mg2+)/0.5ρ(HCO3) ratio greater than 1, implying additional sources beyond carbonate dissolution for Ca2+, Mg2+, and HCO3. The analysis of these ions indicates a complex chemical environment in the Luohe Formation’s groundwater, heavily influenced by the regional geology and mining activities in the Binchang area. The chemical composition of water in the Luohe Formation is likely influenced by cationic adsorption, carbonate and sulfate dissolution, and hydraulic interactions with the Huachi Formation groundwater.

4.2. Groundwater Quality Evaluation

4.2.1. Evaluation Results of the Nemerow Index Evaluation Method

According to the different water-quality standards of different indicators and the actual detection values of various indicators of water samples, the comprehensive evaluation score F of water quality of each water sample was calculated. The calculation results are shown in Table 8. Table 8 shows that there were zero water samples in Class I, three water samples in Class II, zero water samples in Class III, three water samples in Class IV, and four water samples in Class V. The groundwater quality of sampling points was mainly concentrated in Class IV and V, and the groundwater quality was generally poor.

4.2.2. Results of the Fuzzy Comprehensive Evaluation Using Principal Component Analysis

Using the introduced calculation method, we computed the variance contribution rate for each component. The calculation results are shown in Table 6. According to the cumulative contribution rate of more than 80%, three principal components were extracted, and the load matrix of principal components is shown in Table 7. Table 7 shows that TDS, Na+, Ca2+, and SO42− had higher loads of principal component 1; F had a higher load of principal component 2; and pH had a higher load of principal component 3. Therefore, the seven indicators of TDS, Na+, Ca2+, SO42−, Cl, F, and pH were selected as the main evaluation indicators. The water quality of ten samples in the study area was assessed using fuzzy comprehensive evaluation. This yielded the membership degrees and fuzzy evaluation grades for each sample. Table 8 shows that there was one water sample in Class I, two water samples in Class II, three water samples in Class III, three water samples in Class IV, and zero water samples in Class V. The groundwater quality of sampling was mainly concentrated in Classes III and IV.

4.2.3. Comparative Analysis of Evaluation Results

The evaluation process of the Nemerow index method is relatively simple. According to the evaluation results, only three groundwater samples of potable groundwater of grade I to III are found, accounting for 30% of the total water samples. Although this method clearly indicates the over-standard status of pollution indicators, this method overemphasizes the maximum pollution factors, often leading to a higher overall pollution degree of the evaluation results because of the over-limit of one index, ignoring the overall contribution of each pollutant to groundwater pollution. Consequently, this method cannot objectively describe the continuity of environmental quality.
The fuzzy comprehensive evaluation method can show the objectively existing fuzziness and uncertainty in groundwater environmental quality, but the evaluation method is more cumbersome. By principal component analysis, the author deletes some variables that are closely related and establishes as few variables as possible that can reflect the overall water quality information, reducing the complexity of the evaluation process. Through the fuzzy comprehensive evaluation model of principal component screening, the information provided by all principal component data is fully utilized, and its contribution to the overall groundwater quality is considered. To some extent, this method can weaken the control effect of one index exceeding the limit on the whole evaluation result. According to the evaluation results, seven groundwater samples of potable groundwater samples of grade I to III are found, accounting for 70% of the water samples.
According to the location of sampling points and the analysis of evaluation results, the water samples of type V water quality are mainly distributed north of the Gaojiabao coal mine, west of the Tingnan coal mine, and south of the Xiaozhuang coal mine. The analysis indicates that all three coal mines are large-scale, each with a production capacity of 5.00 Mt/a and high mining intensity. Field investigations reveal that all three water samples originate near the mining face. Strong disturbances to the Luohe Formation’s aquifer due to extensive pre-mining water exploration and drainage projects have led to sequential contamination of the aquifers. Other water samples are located in the Jinghe Wetland Reserve, Water Source Reserve, or far away from the current mining activity area. The disturbance caused by human factors such as mining activities to groundwater is relatively small, and all of them meet the potable water standards of grade III and above.

5. Conclusions

(1) The Cretaceous Luohe Formation aquifer is abundant in water with excellent quality. It is a crucial water source for industry, agriculture, and drinking water for residents in the mining area and its surroundings. Horizontally, the Luohe Formation’s thickness generally decreases from northwest to southeast. Vertically, it shows distinct segmentation due to alternating sedimentation of meandering and braided river phases.
(2) Among the groundwater chemical indicators, the pH value is relatively stable and typically weakly acidic. The content levels of SO42− and Cl vary significantly across different locations. The groundwater chemical type transitions from SO4 • HCO3 • Cl–Na, SO4–Na, and SO4 • Cl–Na types in the northern mining area to SO4 • HCO3 • Cl–Na • Ca, HCO3 • SO4–Na • Mg, and SO4 • Cl–Na • Ca • Mg types in the south. The groundwater hydrochemical composition is influenced by multiple factors, including cation adsorption, carbonate and sulfate dissolution, and hydraulic exchange with the upper Huachi Formation groundwater.
(3) Significant differences exist in the groundwater quality evaluation results obtained by the Nemerow index and the fuzzy comprehensive evaluation method based on principal component analysis. The latter method provides more reasonable and reliable results. In the study area, 70% of groundwater samples meet Class III water standards or higher. Poor groundwater quality areas are mainly found to the north of Gaojiabao coal mine, the west of Tingnan coal mine, and the south of Xiaozhuang coal mine, where coal mining intensity is relatively high.

Author Contributions

Conceptualization, X.W. and R.L.; conceptualization and writing—original draft, K.S.; writing—original draft and Formal analysis, W.M.; data curation and writing—review & editing, J.P.; investigation and methodology, J.C. and K.Z.; visualization, S.G. and C.L.; software, C.L.; Investigation, P.Z. All authors have read and agreed to the published version of the manuscript.

Funding

This paper is sponsored by the Natural Science Basic Research Program of Shaanxi Province, China (2019JLZ-03). This study would not have been possible without a ministry–province cooperation-based pilot project entitled “A Technological System for Ecological Remediation Evaluation of Open-Pit Mines” initiated by the Ministry of Natural Resources in 2023.

Data Availability Statement

The data used to support the findings of this study are available from the corresponding author upon request.

Conflicts of Interest

Author Xu Wang was employed by the company CHN Energy Shendong Clal Group Co., Ltd. The remaining authors declare that the research was conducted in the absence of any commercial or financial relationships that could be construed as a potential conflict of interest.

References

  1. Ouedraogo, I.; Defourny, P.; Vanclooster, M. Mapping the groundwater vulnerability for pollution at the pan African scale. Sci. Total Environ. 2016, 544, 939–953. [Google Scholar] [CrossRef] [PubMed]
  2. Kazakis, N.; Voudouris, K.S. Groundwater vulnerability and pollution risk assessment of porous aquifers to nitrate: Modifying the DRASTIC method using quantitative parameters. J. Hydrol. 2015, 525, 13–25. [Google Scholar] [CrossRef]
  3. Fan, L.M. On the Water–Preserved Mining. J. China Coal Soc. 2017, 42, 27–35. (In Chinese) [Google Scholar] [CrossRef]
  4. Fan, L.M. Some Scientific Subjects in Water-Preserved Coal Mining. J. China Coal Soc. 2019, 44, 667–674. (In Chinese) [Google Scholar] [CrossRef]
  5. Ma, X.D.; Fan, L.M.; Zhang, X.T.; Zhang, H.Q.; Zhang, Y.F.; Shen, T. Driving force analysis for water and wetlands evolution at Yushenfu mining area. J. China Coal Soc. 2015, 40, 1126–1133. (In Chinese) [Google Scholar] [CrossRef]
  6. Fan, L.M.; Li, T.; Xiang, M.X.; He, W.Z.; Wu, B.Y.; Peng, J.; Li, Y.H.; Li, C.; Zheng, M.M.; Chen, J.P.; et al. Effect of Coal Mining on Springs in Yushenfu Mining Area of China. Geofluids 2018, 3, 3564360. [Google Scholar] [CrossRef]
  7. Fan, L.; Ma, X. A review on investigation of water-preserved coal mining in western China. Int. J. Coal Sci. Technol. 2018, 5, 411–416. [Google Scholar] [CrossRef]
  8. Sun, K.; Fan, L.M.; Xia, Y.C.; Li, C.; Chen, J.P.; Wu, B.Y.; Peng, J. Research on carrying capacity of geological environment based on the concept of coal mining under water-containing. J. China Coal Soc. 2019, 44, 830–839. (In Chinese) [Google Scholar] [CrossRef]
  9. Ma, X.D.; Huang, J.T.; Li, J.X.; Ning, S.X. Groundwater level threshold under the constrain of ecology security in mining area. J. China Coal Soc. 2019, 44, 675–680. (In Chinese) [Google Scholar] [CrossRef]
  10. Fan, L.; Ma, L.; Yu, Y.; Wang, S.; Xu, Y. Water-conserving mining influencing factors identification and weight determination in northwest China. Int. J. Coal Sci. Technol. 2019, 6, 95–101. [Google Scholar] [CrossRef]
  11. Wu, B.Y.; Bian, H.Y.; Peng, J.; Xiang, M.X.; Li, W.L. Hydrochemical Characteristics Analysis of Groundwater in the Western Eco-Enviroment Fragility Area. Yellow River 2019, 41, 65–69. (In Chinese) [Google Scholar] [CrossRef]
  12. Hussain, R.; Wei, C.; Luo, K. Hydrogeochemical characteristics, source identification and health risks of surface water and groundwater in mining and non-mining areas of Handan, China. Environ. Earth Sci. 2019, 78, 402. [Google Scholar] [CrossRef]
  13. Saha, P.; Paul, B. Groundwater quality assessment in an industrial hotspot through interdisciplinary techniques. Environ. Monit. Assess. 2019, 191, 326. [Google Scholar] [CrossRef] [PubMed]
  14. Cloutier, V.; Lefebvre, R.; Therrien, R.; Savard, M.M. Multivariate statistical analysis of geochemical data as indicative of the hydrogeochemical evolution of groundwater in a sedimentary rock aquifer system. J. Hydrol. 2008, 353, 294–313. [Google Scholar] [CrossRef]
  15. Liu, J.; Hao, Y.; Gao, Z.; Wang, M.; Liu, M.; Wang, Z.; Wang, S. Determining the factors controlling the chemical composition of groundwater using multivariate statistics and geochemical methods in the Xiqu coal mine, North China. Environ. Earth Sci. 2019, 78, 364. [Google Scholar] [CrossRef]
  16. Li, X.H.; Wang, R.; Li, J.F. Study on hydrochemical characteristics and formation mechanism of shallow groundwater in eastern Songnen Plain. J. Groundw. Sci. Eng. 2018, 6, 161–170. [Google Scholar] [CrossRef]
  17. Chen, L.W.; Xu, D.Q.; Yin, X.X.; Xie, W.P.; Zeng, W. Analysis on hydrochemistry and its control factors in the concealed coal mining area in North China: A case study of dominant inrush aquifers in Suxian mining area. J. China Coal Soc. 2017, 42, 996–1004. (In Chinese) [Google Scholar] [CrossRef]
  18. Huan, H.; Lian, X.Y.; Yang, Y.; Jia, Y.F.; Jiang, Y.H. Study on screening method for groundwater quality assessment based on Level Difference Method. Res. Environ. Sci. 2020, 33, 402–410. (In Chinese) [Google Scholar] [CrossRef]
  19. Li, L.J.; Ma, L.; Zhang, J.; Zhao, Y.N.; Chen, C.Y.; Wang, H.Y.; Yu, Q.H.; Sun, C. Groundwater pollution assessment and pollution factor analysis in Songyuan City, Jilin Province. Acta Geosci. Sin. 2014, 35, 156–162. (In Chinese) [Google Scholar] [CrossRef]
  20. Wu, C.; Wu, X.; Qian, C.; Zhu, G. Hydrogeochemistry and groundwater quality assessment of high fluoride levels in the Yanchi endorheic region, northwest China. Appl. Geochem. 2018, 98, 404–417. [Google Scholar] [CrossRef]
  21. Chabukdhara, M.; Gupta, S.K.; Kotecha, Y.; Nema, A.K. Groundwater quality in Ghaziabad district, Uttar Pradesh, India: Multivariate and health risk assessment. Chemosphere 2017, 179, 167–178. [Google Scholar] [CrossRef] [PubMed]
  22. Boufekane, A.; Saighi, O. Assessing groundwater quality for irrigation using geostatistical method—Case of wadi Nil Plain (North-East Algeria). Groundw. Sustain. Dev. 2019, 8, 179–186. [Google Scholar] [CrossRef]
  23. Khanoranga; Khalid, S. An assessment of groundwater quality for irrigation and drinking purposes around brick kilns in three districts of Balochistan province, Pakistan, through water quality index and multivariate statistical approaches. J. Geochem. Explor. 2019, 197, 14–26. [Google Scholar] [CrossRef]
  24. Wang, M.W.; Zhou, T.L.; Dong, J.Q.; Long, J.Y. A novel extension evaluation model of groundwater quality based on con-nection cloud model. China Environ. Sci. 2018, 38, 3035–3041. (In Chinese) [Google Scholar] [CrossRef]
  25. Dahiya, S.; Singh, B.; Gaur, S.; Garg, V.; Kushwaha, H. Analysis of groundwater quality using fuzzy synthetic evaluation. J. Hazard. Mater. 2007, 147, 938–946. [Google Scholar] [CrossRef] [PubMed]
  26. Peng, K.N.; Zhang, W.; Zhu, H.H.; Zhou, J.W.; Wan, H.J.; Zhao, J. Hydro-chemical characteristics and quality evaluation of groundwater in Zhaoyuan city. Saf. Environ. Eng. 2018, 25, 106–111, 138. (In Chinese) [Google Scholar] [CrossRef]
  27. Banerji, S.; Mitra, D. Geographical information system-based groundwater quality index assessment of northern part of Kolkata, India for drinking purpose. Geocarto Int. 2019, 34, 943–958. [Google Scholar] [CrossRef]
  28. Cui, Y.; Feng, P.; Jin, J.; Liu, L. Water Resources Carrying Capacity Evaluation and Diagnosis Based on Set Pair Analysis and Improved the Entropy Weight Method. Entropy 2018, 20, 359. [Google Scholar] [CrossRef] [PubMed]
  29. He, H.; Tian, C.; Fang, J.; Jin, G.; An, L. Evaluation of the environmental quality associated with near-surface groundwater characteristics in coal-mining areas based on rough set and uncertainty measure theory. Desalination Water Treat. 2019, 152, 139–147. [Google Scholar] [CrossRef]
  30. Xia, Y.T.; Gui, H.R.; Zhao, H.H.; Li, J.; Guan, L.S. Temporal variability of hydro-chemical characteristics and water quality assessment of collapse pond in Zhuxianzhuang coal mining area, China. Fresenius Eviron. Bull. 2019, 28, 402–409. [Google Scholar]
  31. Guo, X.M.; Dong, S.N. Seepage law of bedrock aquifer and water–preserved mining technology in deep coal seam mining. J. China Coal Soc. 2019, 44, 804–811. (In Chinese) [Google Scholar] [CrossRef]
  32. Sun, K.; Fan, L.; Xia, Y.; Li, C.; Chen, J.; Gao, S.; Wu, B.; Peng, J.; Ji, Y. Impact of coal mining on groundwater of Luohe Formation in Binchang mining area. Int. J. Coal Sci. Technol. 2020, 8, 88–102. [Google Scholar] [CrossRef]
  33. Li, C.F.; Hu, W.Y.; Liu, Y.F. Vertical hydrogeological characteristics of Luohe aquifer and its significance of water-preserved coal mining. J. China Coal Soc. 2019, 44, 847–856. (In Chinese) [Google Scholar] [CrossRef]
  34. Liu, G.; Liu, Y.H.; He, T.Y.; Zeng, Y.; Huang, Q.Q. Study on water chemistry and water quality evaluation of groundwater in a landfill. Environ. Sci. Technol. 2019, 42, 221–228. (In Chinese) [Google Scholar] [CrossRef]
Figure 1. Hydrogeological section of the Binchang mining area [32].
Water 16 01913 g001
Figure 2. The contour of the Luohe Formation’s thickness in the Binchang mining area [32].
Water 16 01913 g002
Figure 3. TDS isoline of groundwater in the Luohe Formation, Binchang mining area.
Water 16 01913 g003
Figure 4. Piper diagram of the groundwater of the Luohe Formation in the Binchang mining area.
Water 16 01913 g004
Figure 5. Correlation of major ions in the groundwater of the Luohe Formation in the Binchang mining area.
Water 16 01913 g005
Table 1. Capacity and status of the main coal mines in the Binchang mining area [32].
Coal MineCapacity
(Mt/a)
StatusCoal MineCapacity
(Mt/a)
Status
Mengcun 6.00Production Wenjiapo 3.20Production
Xiaozhuang 5.00Production Dafosi 3.00Production
Hujiahe 5.00Production Huoshizui 3.00Production
Tingnan 5.00Production Xiagou 3.00Production
Yangjiaping 5.00ConstructionShuiliandong 1.50Production
Gaojiabu 5.00Production Jiangjiahe 0.90Production
Yadian 4.00Construction
Table 2. Statistical results of groundwater hydrochemical parameters in the Binchang mining area.
Sample DateNa+
(mg/L)
K+
(mg/L)
Ca2+
(mg/L)
Mg2+
(mg/L)
Cl
(mg/L)
SO42−
(mg/L)
HCO3
(mg/L)
TDS
(mg/L)
pHCODMn
(mg/L)
F
(mg/L)
NH3–N
(mg/L)
NO3
(mg/L)
W1284.00 3.11 42.10 21.90 128.00 476.00 230.00 1156.00 8.24 0.64 0.69 0.06 0.35
W2306.00 2.60 20.00 69.30 131.00 288.00 232.00 960.00 8.59 0.82 0.60 0.02 0.36
W3262.00 2.62 23.80 16.60 102.00 302.00 296.00 879.00 8.30 0.42 0.52 0.07 0.24
W4270.00 3.02 21.40 13.30 96.70 247.00 284.00 858.00 8.25 0.45 0.76 0.09 1.59
W5170.00 3.48 79.31 60.99 46.00 125.60 350.50 964.00 7.60 0.58 0.37 0.02 341.70
W6177.00 2.40 52.33 9.92 93.57 160.20 330.10 680.00 7.74 1.13 0.31 0.02 15.52
W7792.50 4.92 131.60 94.21 606.40 1467.00 189.90 3196.00 7.76 0.78 0.41 0.03 2.55
W850.40 1.92 63.78 23.80 8.75 48.04 382.70 399.00 7.70 0.36 0.50 0.26 6.72
W9103.50 1.78 42.52 18.35 60.13 97.96 62.90 467.00 8.06 0.49 0.45 0.02 8.00
W10728.00 6.90 134.10 29.75 145.90 1694.00 195.70 2843.00 7.71 0.77 1.00 0.55 2.58
Max792.50 6.90 134.10 94.21 606.40 1694.00 382.70 3196.00 8.59 1.13 1.00 0.55 341.70
Min50.40 1.78 20.00 9.92 8.75 48.04 62.90 399.00 7.60 0.36 0.31 0.02 0.24
Mean314.34 3.28 61.09 35.81 141.85 490.58 255.38 1240.20 8.00 0.64 0.56 0.11 37.96
Std.249.28 1.55 42.27 28.66 168.55 589.74 93.93 969.07 0.34 0.24 0.21 0.17 106.83
Cv0.79 0.47 0.69 0.80 1.19 1.20 0.37 0.78 0.04 0.37 0.37 1.50 2.81
Table 3. Ratings for groundwater quality classes of a single factor.
IIIIIIIVV
Fi013610
Table 4. Groundwater quality classification standards.
Na+
(mg/L)
Ca2+
(mg/L)
Mg2+
(mg/L)
Cl
(mg/L)
SO42−
(mg/L)
TDS
(mg/L)
pHCODMn
(mg/L)
F
(mg/L)
NH3–N
(mg/L)
NO3
(mg/L)
I≤100≤100≤10≤50≤50≤3006.5 ≤ pH ≤ 8.5≤1.0≤1.0≤0.02≤2.0
II≤150≤200≤20≤150≤150≤5006.5 ≤ pH ≤ 8.5≤2.0≤1.0≤0.10≤5.0
III≤200≤400≤50≤250≤250≤10006.5 ≤ pH ≤ 8.5≤3.0≤1.0≤0.50≤20.0
IV≤400≤800≤200≤350≤350≤20005.5 ≤ pH < 6.5; 8.5 < pH ≤ 9.0≤10.0≤2.0≤1.50≤30.0
V>400>800>200>350>350>2000pH < 5.5; pH > 9.0>10.0>2.0>1.50>30.0
Table 5. Rating scale of groundwater quality classification.
IIIIIIIVV
FF < 0.800.80 ≤ F < 2.502.50 ≤ F < 4.254.25 ≤ F < 7.20F ≥ 7.20
Table 6. Computation results of the variance contribution rate of each component.
ComponentCharacteristic ValueContribution Rate of VarianceAccumulate
(%)
15.20047.27347.273
22.28920.81368.086
31.71315.57683.662
40.9248.40192.063
50.6005.45297.515
60.2101.90799.422
70.0430.39199.813
80.0190.17699.989
90.0010.011100.000
104.050 × 10−173.682 × 10−16100.000
11−2.313 × 10⁻¹⁶−2.103 × 10−15100.000
Table 7. Principal component load matrix.
IndexComponent
123
Na+0.9640.0800.203
Ca2+0.886−0.131−0.417
Mg2+0.564−0.6040.216
Cl0.772−0.3690.425
SO42−0.9750.1940.038
TDS0.9890.0000.075
pH−0.3770.3010.807
CODMn0.372−0.2910.185
F-0.3440.8570.016
NH3–N0.4790.702−0.474
NO3−0.118−0.570−0.594
Table 8. Evaluation results of groundwater quality types
Sample
Date
Nemerow Index
Evaluation Method
Principal Component Analysis-Based Fuzzy Comprehensive Evaluation Method.
FGroundwater Quality TypesSubordination DegreeGroundwater Quality Types
W17.329V0.1100.1540.2060.2060.323V
W24.609IV0.1070.0970.4990.2980.000III
W34.452IV0.1260.1660.5190.1890.000III
W44.398IV0.1590.1650.5040.1710.000III
W57.266V0.2100.3600.4300.0000.000III
W62.386II0.1990.4570.3440.0000.000II
W77.794V0.0300.0280.0380.0000.905V
W82.280II0.4910.2480.2600.0000.000I
W92.236II0.4480.5100.0420.0000.000II
W107.640V0.0610.0720.0390.0000.829V
Disclaimer/Publisher’s Note: The statements, opinions and data contained in all publications are solely those of the individual author(s) and contributor(s) and not of MDPI and/or the editor(s). MDPI and/or the editor(s) disclaim responsibility for any injury to people or property resulting from any ideas, methods, instructions or products referred to in the content.

