
Graph Neural Networks for Sensor Placement: A Proof of Concept towards a Digital Twin of Water Distribution Systems


Abstract
1. Introduction
- Proof of concept of a novel sensors placement methodology;
- Implementation of a pressure estimation method based on graph neural networks;
- Use-case development proving feasibility.
2. Methodology
| Algorithm 1 Optimal sensor placement for WDS’ metamodel. |
| Require: : Number of sensors to be tested. Require: : Number of particles in the particle swarm optimization (PSO) algorithm. Require: : Number of iterations limit. Ensure: Optimal set of sensors. Initialize n to 0. while do Generate a random population of particles. Initialize k to 0. while do for to do Train a Graph Convolutional Network (GCN) using particle i-th. Evaluate the metamodel performance with criterion function. Update position and velocity of particle i-th using PSO. end for end while end while |
2.1. Graph Estimation
2.2. Graph Convolutional Metamodel
2.3. Sensors Graph Network
2.4. Particle Swarm Optimization
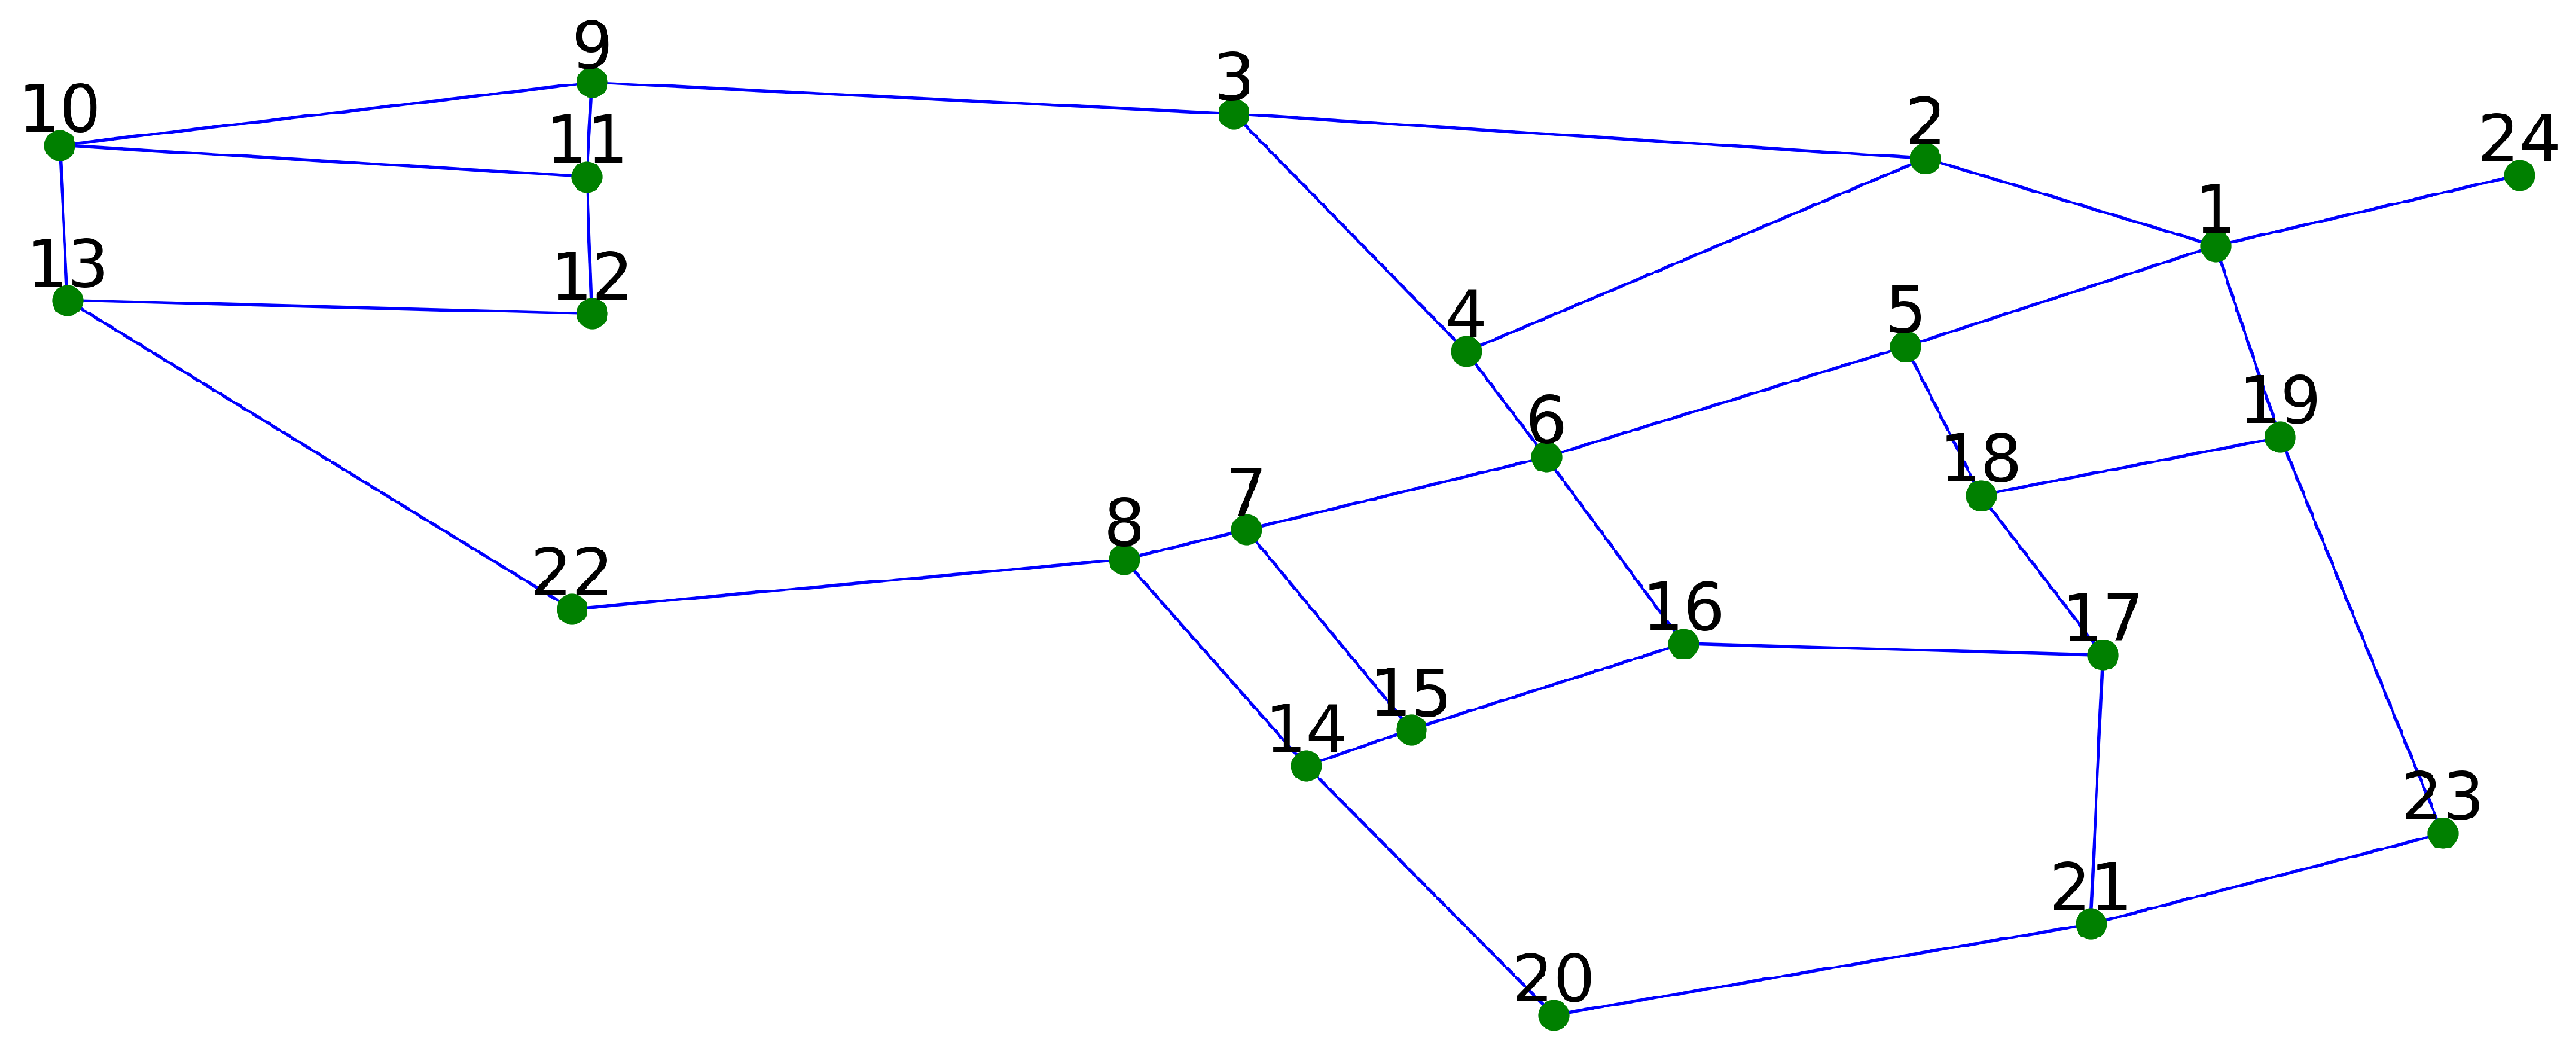
3. Case Study
4. Results
5. Discussion
6. Conclusions
Author Contributions
Funding
Data Availability Statement
Conflicts of Interest
References
- Sangiorgio, M.; Weber, E.; Cananzi, D.; Zatarain Salazar, J.; Micotti, M.; Castelletti, A. Climate change adaptation through integrated management of water reuse technologies. In Proceedings of the EGU General Assembly Conference Abstracts, Vienna, Austria, 23–28 April 2023. [Google Scholar]
- Kristvik, E.; Muthanna, T.M.; Alfredsen, K. Assessment of future water availability under climate change, considering scenarios for population growth and ageing infrastructure. J. Water Clim. Chang. 2019, 10, 1–12. [Google Scholar] [CrossRef]
- Berglund, E.Z.; Pesantez, J.E.; Rasekh, A.; Shafiee, M.E.; Sela, L.; Haxton, T. Review of modeling methodologies for managing water distribution security. J. Water Resour. Plan. Manag. 2020, 146, 03120001. [Google Scholar] [CrossRef] [PubMed]
- Benedict, S.; Hussein, H. An analysis of water awareness campaign messaging in the case of Jordan: Water conservation for state security. Water 2019, 11, 1156. [Google Scholar] [CrossRef]
- Makropoulos, C.; Savić, D. Urban hydroinformatics: Past, present and future. Water 2019, 11, 1959. [Google Scholar] [CrossRef]
- Zanfei, A.; Menapace, A.; Brentan, B.M.; Righetti, M. How does missing data imputation affect the forecasting of urban water demand? J. Water Resour. Plan. Manag. 2022, 148, 04022060. [Google Scholar] [CrossRef]
- Zanfei, A.; Menapace, A.; Granata, F.; Gargano, R.; Frisinghelli, M.; Righetti, M. An Ensemble Neural Network Model to Forecast Drinking Water Consumption. J. Water Resour. Plan. Manag. 2022, 148, 04022014. [Google Scholar] [CrossRef]
- Brentan, B.M.; Luvizotto, E., Jr.; Herrera, M.; Izquierdo, J.; Pérez-García, R. Hybrid regression model for near real-time urban water demand forecasting. J. Comput. Appl. Math. 2017, 309, 532–541. [Google Scholar] [CrossRef]
- Herrera, M.; Torgo, L.; Izquierdo, J.; Pérez-García, R. Predictive models for forecasting hourly urban water demand. J. Hydrol. 2010, 387, 141–150. [Google Scholar] [CrossRef]
- Zanfei, A.; Brentan, B.M.; Menapace, A.; Righetti, M. A short-term water demand forecasting model using multivariate long short-term memory with meteorological data. J. Hydroinform. 2022, 24, 1053–1065. [Google Scholar] [CrossRef]
- Mazzoni, F.; Alvisi, S.; Blokker, M.; Buchberger, S.G.; Castelletti, A.; Cominola, A.; Gross, M.P.; Jacobs, H.E.; Mayer, P.; Steffelbauer, D.B.; et al. Investigating the characteristics of residential end uses of water: A worldwide review. Water Res. 2022, 230, 119500. [Google Scholar] [CrossRef]
- Ferreira, B.; Carriço, N.; Barreira, R.; Dias, T.; Covas, D. Flowrate Time Series Processing in Engineering Tools for Water Distribution Networks. Water Resour. Res. 2022, 58, e2022WR032393. [Google Scholar] [CrossRef]
- Loureiro, D.; Silva, C.; Cardoso, M.A.; Mamade, A.; Alegre, H.; Rosa, M.J. The Development of a Framework for Assessing the Energy Efficiency in Urban Water Systems and Its Demonstration in the Portuguese Water Sector. Water 2020, 12, 134. [Google Scholar] [CrossRef]
- Mamade, A.; Loureiro, D.; Alegre, H.; Covas, D. Top-down and bottom-up approaches for water-energy balance in Portuguese supply systems. Water 2018, 10, 577. [Google Scholar] [CrossRef]
- Kostner, M.K.; Zanfei, A.; Alberizzi, J.C.; Renzi, M.; Righetti, M.; Menapace, A. Micro hydro power generation in water distribution networks through the optimal pumps-as-turbines sizing and control. Appl. Energy 2023, 351, 121802. [Google Scholar] [CrossRef]
- Capelo, M.; Brentan, B.; Monteiro, L.; Covas, D. Near–real time burst location and sizing in water distribution systems using artificial neural networks. Water 2021, 13, 1841. [Google Scholar] [CrossRef]
- Cabral, M.; Loureiro, D.; Covas, D. Using economic asset valuation to meet rehabilitation priority needs in the water sector. Urban Water J. 2019, 16, 205–214. [Google Scholar] [CrossRef]
- Marsili, V.; Alvisi, S.; Maietta, F.; Capponi, C.; Meniconi, S.; Brunone, B.; Franchini, M. Extending the application of connectivity metrics for characterizing the dynamic behaviour of water distribution networks. Water Resour. Res. 2023, 59, e2023WR035031. [Google Scholar] [CrossRef]
- Fu, G.; Jin, Y.; Sun, S.; Yuan, Z.; Butler, D. The role of deep learning in urban water management: A critical review. Water Res. 2022, 223, 118973. [Google Scholar] [CrossRef] [PubMed]
- Herrera, M.; Proselkov, Y.; Pérez-Hernández, M.; Parlikad, A.K. Mining graph-Fourier transform time series for anomaly detection of internet traffic at core and metro networks. IEEE Access 2021, 9, 8997–9011. [Google Scholar] [CrossRef]
- Zanfei, A.; Menapace, A.; Brentan, B.M.; Righetti, M.; Herrera, M. Novel approach for burst detection in water distribution systems based on graph neural networks. Sustain. Cities Soc. 2022, 86, 104090. [Google Scholar] [CrossRef]
- Zanfei, A.; Brentan, B.M.; Menapace, A.; Righetti, M.; Herrera, M. Graph convolutional recurrent neural networks for water demand forecasting. Water Resour. Res. 2022, 58, e2022WR032299. [Google Scholar] [CrossRef]
- Menapace, A.; Zanfei, A.; Righetti, M. Tuning ANN hyperparameters for forecasting drinking water demand. Appl. Sci. 2021, 11, 4290. [Google Scholar] [CrossRef]
- Sitzenfrei, R. Using complex network analysis for water quality assessment in large water distribution systems. Water Res. 2021, 201, 117359. [Google Scholar] [CrossRef] [PubMed]
- Sitzenfrei, R.; Wang, Q.; Kapelan, Z.; Savić, D. Using complex network analysis for optimization of water distribution networks. Water Resour. Res. 2020, 56, e2020WR027929. [Google Scholar] [CrossRef] [PubMed]
- Sitzenfrei, R.; Hajibabaei, M.; Hesarkazzazi, S.; Diao, K. Dual graph characteristics of water distribution networks—How optimal are design solutions? Complex Intell. Syst. 2022, 9, 147–160. [Google Scholar] [CrossRef] [PubMed]
- Xing, L.; Sela, L. Graph Neural Networks for State Estimation in Water Distribution Systems: Application of Supervised and Semisupervised Learning. J. Water Resour. Plan. Manag. 2022, 148, 04022018. [Google Scholar] [CrossRef]
- Bartos, M.; Kerkez, B. Pipedream: An interactive digital twin model for natural and urban drainage systems. Environ. Model. Softw. 2021, 144, 105120. [Google Scholar] [CrossRef]
- Garrido-Baserba, M.; Corominas, L.; Cortès, U.; Rosso, D.; Poch, M. The fourth-revolution in the water sector encounters the digital revolution. Environ. Sci. Technol. 2020, 54, 4698–4705. [Google Scholar] [CrossRef] [PubMed]
- Menapace, A.; Zanfei, A.; De Luca, A.; Pauli, D.D.; Righetti, M. Towards a Digital Twin Model for the Management of the Laives Aqueduct. Environ. Sci. Proc. 2022, 21, 70. [Google Scholar] [CrossRef]
- Conejos Fuertes, P.; Martínez Alzamora, F.; Hervás Carot, M.; Alonso Campos, J. Building and exploiting a Digital Twin for the management of drinking water distribution networks. Urban Water J. 2020, 17, 704–713. [Google Scholar] [CrossRef]
- Berglund, E.Z.; Shafiee, M.E.; Xing, L.; Wen, J. Digital twins for water distribution systems. J. Water Resour. Plan. Manag. 2023, 149, 02523001. [Google Scholar] [CrossRef]
- Bonilla, C.A.; Zanfei, A.; Brentan, B.; Montalvo, I.; Izquierdo, J. A digital twin of a water distribution system by using graph convolutional networks for pump speed-based state estimation. Water 2022, 14, 514. [Google Scholar] [CrossRef]
- Bronstein, M.M.; Bruna, J.; LeCun, Y.; Szlam, A.; Vandergheynst, P. Geometric deep learning: Going beyond euclidean data. IEEE Signal Process. Mag. 2017, 34, 18–42. [Google Scholar] [CrossRef]
- Ostfeld, A.; Uber, J.G.; Salomons, E.; Berry, J.W.; Hart, W.E.; Phillips, C.A.; Watson, J.P.; Dorini, G.; Jonkergouw, P.; Kapelan, Z.; et al. The battle of the water sensor networks (BWSN): A design challenge for engineers and algorithms. J. Water Resour. Plan. Manag. 2008, 134, 556–568. [Google Scholar] [CrossRef]
- Zanfei, A.; Menapace, A.; Santopietro, S.; Righetti, M. Calibration procedure for water distribution systems: Comparison among hydraulic models. Water 2020, 12, 1421. [Google Scholar] [CrossRef]
- Marzola, I.; Alvisi, S.; Franchini, M. A Comparison of Model-Based Methods for Leakage Localization in Water Distribution Systems. Water Resour. Manag. 2022, 36, 5711–5727. [Google Scholar] [CrossRef]
- Taormina, R.; Galelli, S. Deep-learning approach to the detection and localization of cyber-physical attacks on water distribution systems. J. Water Resour. Plan. Manag. 2018, 144, 04018065. [Google Scholar] [CrossRef]
- Murillo, A.; Taormina, R.; Tippenhauer, N.O.; Salaorni, D.; van Dijk, R.; Jonker, L.; Vos, S.; Weyns, M.; Galelli, S. High-fidelity cyber and physical simulation of water distribution systems. I: Models and Data. J. Water Resour. Plan. Manag. 2023, 149, 04023009. [Google Scholar] [CrossRef]
- Murillo, A.; Taormina, R.; Tippenhauer, N.O.; Galelli, S. High-fidelity cyber and physical simulation of water distribution systems. II: Enabling cyber-physical attack localization. J. Water Resour. Plan. Manag. 2023, 149, 04023010. [Google Scholar] [CrossRef]
- Adedoja, O.S.; Hamam, Y.; Khalaf, B.; Sadiku, R. A state-of-the-art review of an optimal sensor placement for contaminant warning system in a water distribution network. Urban Water J. 2018, 15, 985–1000. [Google Scholar] [CrossRef]
- Ferreira, B.; Carriço, N.; Covas, D. Optimal Number of Pressure Sensors for Real-Time Monitoring of Distribution Networks by Using the Hypervolume Indicator. Water 2021, 13, 2235. [Google Scholar] [CrossRef]
- Francés-Chust, J.; Brentan, B.M.; Carpitella, S.; Izquierdo, J.; Montalvo, I. Optimal placement of pressure sensors using fuzzy DEMATEL-based sensor influence. Water 2020, 12, 493. [Google Scholar] [CrossRef]
- Righetti, M.; Bort, C.M.G.; Bottazzi, M.; Menapace, A.; Zanfei, A. Optimal selection and monitoring of nodes aimed at supporting leakages identification in WDS. Water 2019, 11, 629. [Google Scholar] [CrossRef]
- Giudicianni, C.; Campisano, A.; Di Nardo, A.; Creaco, E. Pulsed Demand Modeling for the Optimal Placement of Water Quality Sensors in Water Distribution Networks. Water Resour. Res. 2022, 58, e2022WR033368. [Google Scholar] [CrossRef]
- Menapace, A.; Avesani, D. Global Gradient Algorithm extension to distributed pressure driven pipe demand model. Water Resour. Manag. 2019, 33, 1717–1736. [Google Scholar] [CrossRef]
- Giustolisi, O.; Savic, D.; Kapelan, Z. Pressure-driven demand and leakage simulation for water distribution networks. J. Hydraul. Eng. 2008, 134, 626–635. [Google Scholar] [CrossRef]
- Kausar, R.; Farid, H.; Riaz, M. A numerically validated approach to modeling water hammer phenomena using partial differential equations and switched differential-algebraic equations. J. Ind. Intell. 2023, 1, 75–86. [Google Scholar] [CrossRef]
- Covas, D.; Stoianov, I.; Mano, J.F.; Ramos, H.; Graham, N.; Maksimovic, C. The dynamic effect of pipe-wall viscoelasticity in hydraulic transients. Part II—Model development, calibration and verification. J. Hydraul. Res. 2005, 43, 56–70. [Google Scholar] [CrossRef]
- Piazza, S.; Sambito, M.; Freni, G. Analysis of optimal sensor placement in looped water distribution networks using different water quality models. Water 2023, 15, 559. [Google Scholar] [CrossRef]
- Zanfei, A.; Menapace, A.; Brentan, B.M.; Sitzenfrei, R.; Herrera, M. Shall we always use hydraulic models? A graph neural network metamodel for water system calibration and uncertainty assessment. Water Res. 2023, 242, 120264. [Google Scholar] [CrossRef]
- Rossman, L.A. EPANET 2: Users Manual; U.S. Environmental Protection Agengy: Washington, DC, USA, 2000.
- Kipf, T.N.; Welling, M. Semi-supervised classification with graph convolutional networks. arXiv 2016, arXiv:1609.02907. [Google Scholar]
- Grattarola, D.; Alippi, C. Graph neural networks in tensorflow and keras with spektral. arXiv 2020, arXiv:2006.12138. [Google Scholar]
- Abadi, M.; Barham, P.; Chen, J.; Chen, Z.; Davis, A.; Dean, J.; Devin, M.; Ghemawat, S.; Irving, G.; Isard, M.; et al. Tensorflow: A system for large-scale machine learning. In Proceedings of the 12th USENIX Symposium on Operating Systems Design and Implementation (OSDI 16), Savannah, GA, USA, 2–4 November 2016; pp. 265–283. [Google Scholar]
- Nebro, A.J.; Durillo, J.J.; Garcia-Nieto, J.; Coello, C.C.; Luna, F.; Alba, E. SMPSO: A new PSO-based metaheuristic for multi-objective optimization. In Proceedings of the 2009 IEEE Symposium on Computational Intelligence in Multi-Criteria Decision-Making (MCDM), Nashville, TN, USA, 30 March–2 April 2009; IEEE: Piscataway, NJ, USA, 2009; pp. 66–73. [Google Scholar]
- Clerc, M.; Kennedy, J. The particle swarm-explosion, stability, and convergence in a multidimensional complex space. IEEE Trans. Evol. Comput. 2002, 6, 58–73. [Google Scholar] [CrossRef]
- Hadka, D. Platypus—A Free and Open Source Python Library for Multiobjective Optimization. 2017. Available online: https://github.com/Project-Platypus/Platypus (accessed on 15 November 2023).
- Giustolisi, O.; Todini, E. On the approximation of distributed demands as nodal demands in WDN analysis. In Proceedings of the XXXI National Hydraulics and Hydraulic Construction Conference, Perugia, Italy, 9–12 September 2008. [Google Scholar]
- Giustolisi, O.; Laucelli, D. Water distribution network pressure-driven analysis using the enhanced global gradient algorithm (EGGA). J. Water Resour. Plan. Manag. 2011, 137, 498–510. [Google Scholar] [CrossRef]
- Sangiorgio, M.; Cananzi, D.; Weber, E.; Salazar, J.Z.; Castelletti, A. Surrogate modeling for water reuse planning in complex water systems. IFAC-PapersOnLine 2022, 55, 111–116. [Google Scholar] [CrossRef]
- Klise, K.A.; Murray, R.; Haxton, T. An Overview of the Water Network Tool for Resilience (WNTR); Sandia National Lab. (SNL-NM): Albuquerque, NM, USA, 2018. [Google Scholar]
- Giudicianni, C.; Herrera, M.; Di Nardo, A.; Greco, R.; Creaco, E.; Scala, A. Topological placement of quality sensors in water-distribution networks without the recourse to hydraulic modeling. J. Water Resour. Plan. Manag. 2020, 146, 04020030. [Google Scholar] [CrossRef]
- Sarrate, R.; Blesa, J.; Nejjari, F.; Quevedo, J. Sensor placement for leak detection and location in water distribution networks. Water Sci. Technol. Water Supply 2014, 14, 795–803. [Google Scholar] [CrossRef]


| Flow (l/s) | Pressure (m) | |
|---|---|---|
| mean | 30.840 | 17.442 |
| standard deviation | 53.226 | 5.444 |
| min | 0.310 | 13.680 |
| max | 261.886 | 27.284 |
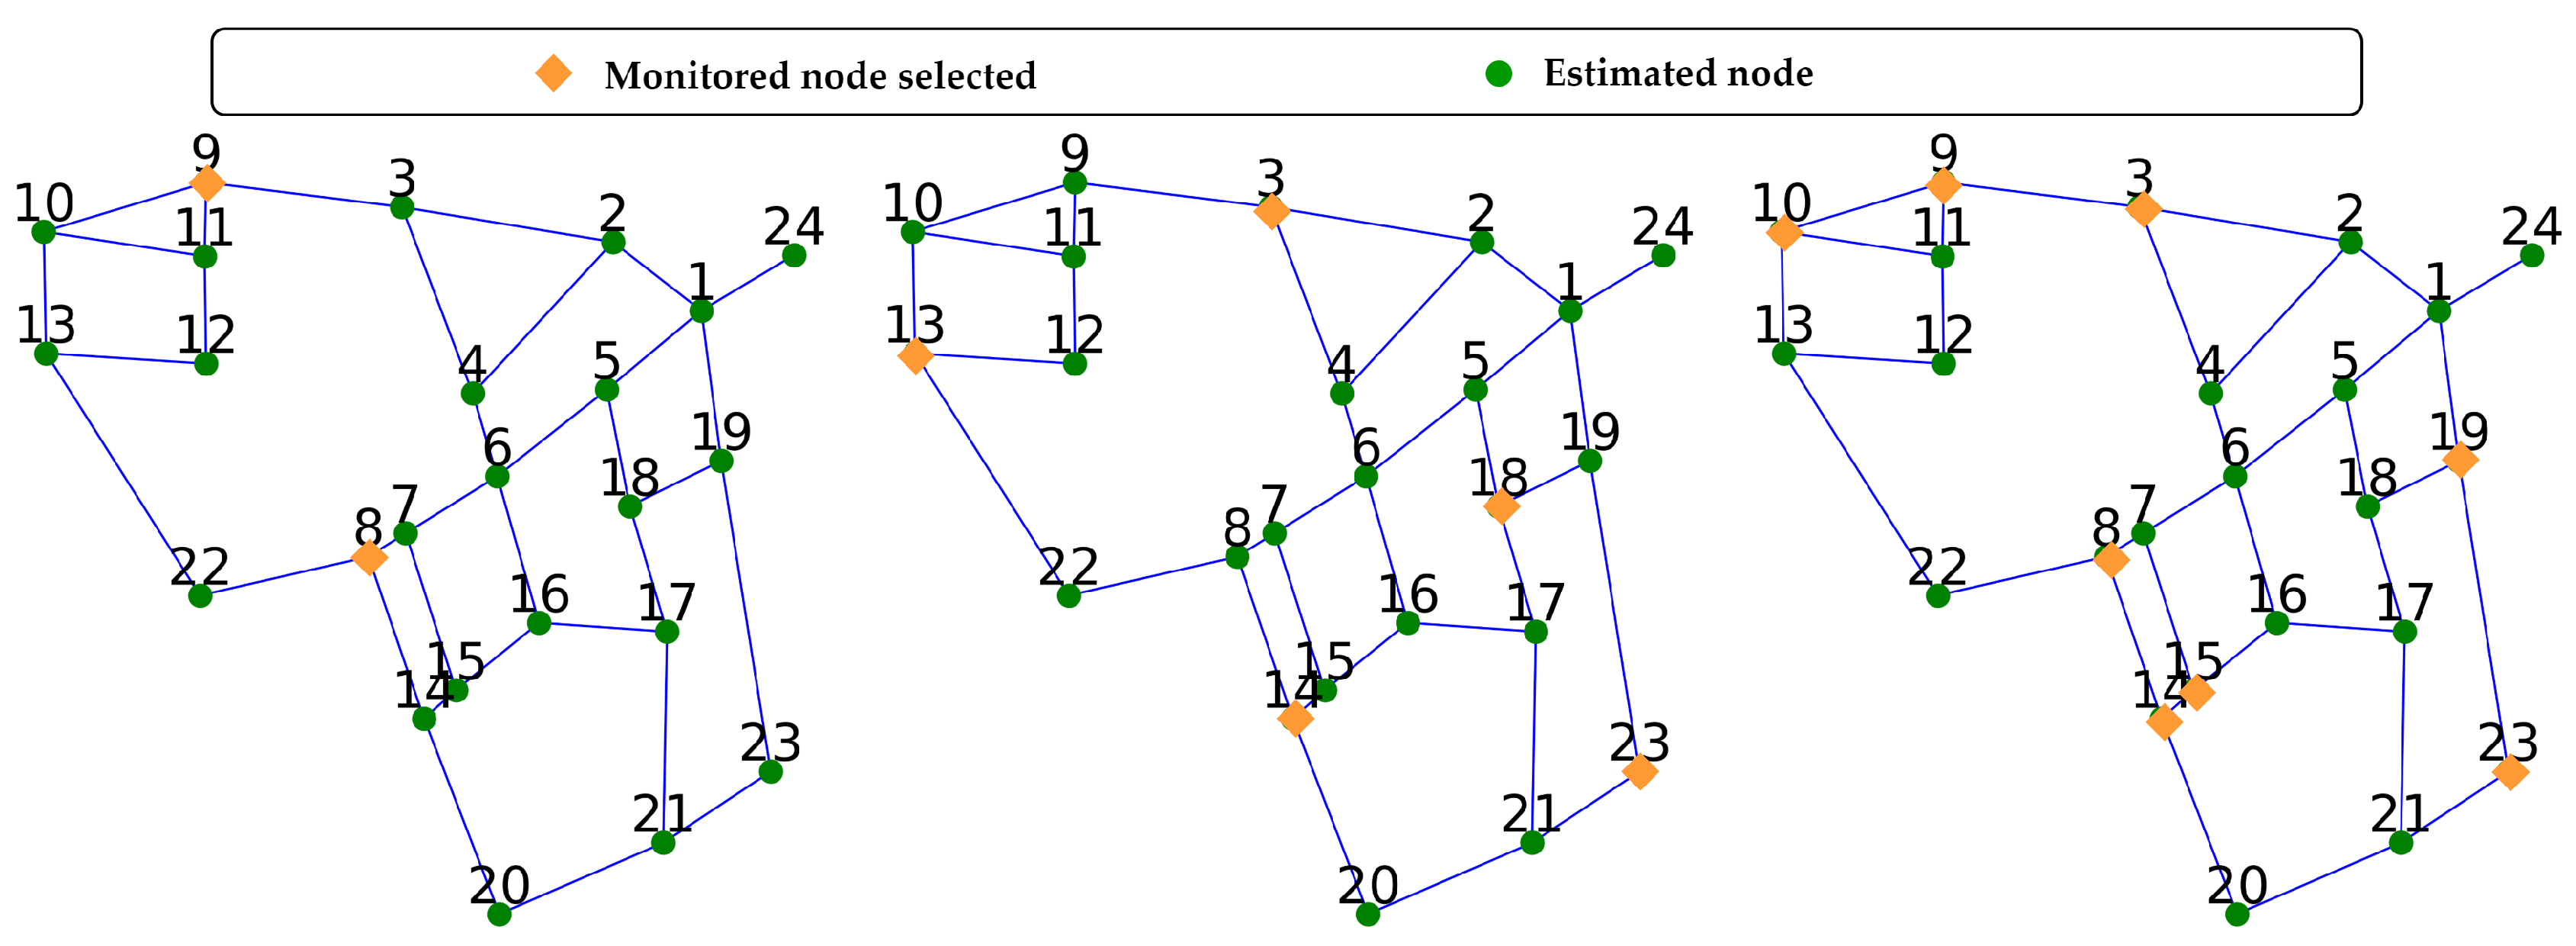
| Number of Sensors | Sensor Selection | RMSE (m) | MAE (m) |
|---|---|---|---|
| 1 | 0.165 | 0.125 | |
| 2 | , | 0.143 | 0.107 |
| 3 | , , | 0.129 | 0.098 |
| 4 | , , , | 0.126 | 0.095 |
| 5 | , , , , | 0.127 | 0.096 |
| 6 | , , , , , | 0.125 | 0.095 |
| 7 | , , , , , , | 0.123 | 0.0093 |
| 8 | , , , , , , , | 0.121 | 0.091 |
| 9 | , , , , , , , , | 0.119 | 0.090 |
| 10 | , , , , , , , , , | 0.118 | 0.089 |
| 11 | , , , , , , , , , , | 0.117 | 0.088 |
Disclaimer/Publisher’s Note: The statements, opinions and data contained in all publications are solely those of the individual author(s) and contributor(s) and not of MDPI and/or the editor(s). MDPI and/or the editor(s) disclaim responsibility for any injury to people or property resulting from any ideas, methods, instructions or products referred to in the content. |
© 2024 by the authors. Licensee MDPI, Basel, Switzerland. This article is an open access article distributed under the terms and conditions of the Creative Commons Attribution (CC BY) license (https://creativecommons.org/licenses/by/4.0/).
Share and Cite
Menapace, A.; Zanfei, A.; Herrera, M.; Brentan, B. Graph Neural Networks for Sensor Placement: A Proof of Concept towards a Digital Twin of Water Distribution Systems. Water 2024, 16, 1835. https://doi.org/10.3390/w16131835
Menapace A, Zanfei A, Herrera M, Brentan B. Graph Neural Networks for Sensor Placement: A Proof of Concept towards a Digital Twin of Water Distribution Systems. Water. 2024; 16(13):1835. https://doi.org/10.3390/w16131835
Chicago/Turabian StyleMenapace, Andrea, Ariele Zanfei, Manuel Herrera, and Bruno Brentan. 2024. "Graph Neural Networks for Sensor Placement: A Proof of Concept towards a Digital Twin of Water Distribution Systems" Water 16, no. 13: 1835. https://doi.org/10.3390/w16131835
APA StyleMenapace, A., Zanfei, A., Herrera, M., & Brentan, B. (2024). Graph Neural Networks for Sensor Placement: A Proof of Concept towards a Digital Twin of Water Distribution Systems. Water, 16(13), 1835. https://doi.org/10.3390/w16131835