Article

Graph Neural Networks for Sensor Placement: A Proof of Concept towards a Digital Twin of Water Distribution Systems

by
Andrea Menapace
1,*,
Ariele Zanfei
2,
Manuel Herrera
3 and
Bruno Brentan
4
1
Faculty of Agricultural, Environmental and Food Sciences, Free University of Bozen-Bolzano, Piazza Università 5, 39100 Bolzano, Italy
2
AIAQUA S.r.l., Via Volta 13/A, 39100 Bolzano, Italy
3
Institute for Manufacturing, Deptartment of Engineering, University of Cambridge, 17 Charles Babbage Rd, Cambridge CB3 0FS, UK
4
Hydraulic Engineering and Water Resources Department, School of Engineering, Universidade Federal de Minas Gerais, Belo Horizonte 31270-901, Brazil
*
Author to whom correspondence should be addressed.
Water 2024, 16(13), 1835; https://doi.org/10.3390/w16131835
Submission received: 13 May 2024 / Revised: 18 June 2024 / Accepted: 24 June 2024 / Published: 27 June 2024

Abstract

:
Urban water management faces new challenges due to the rise of digital solutions and abundant data, leading to the development of data-centric tools for decision-making in global water utilities, with AI technologies poised to become a key trend in the sector. This paper proposes a novel methodology for optimal sensor placement aimed at supporting the creation of a digital twin for water infrastructure. A significant innovation in this study is the creation of a metamodel to estimate pressure at consumption nodes in a water supply system. This metamodel guides the optimal sensor configuration by minimizing the difference between estimated and observed pressures. Our methodology was tested on a synthetic case study, showing accurate results. The estimated pressures at each network node exhibited low error and high accuracy across all sensor configurations tested, highlighting the potential for future development of a digital twin for water distribution systems.

1. Introduction

In light of socio-economic factors and the escalating frequency of extreme weather events, future water resource availability is poised to undergo significant transformation [1]. The impact of climate change is evident in the heightened occurrence of droughts and floods worldwide, placing considerable strain on existing water systems [2]. However, the majority of present infrastructure systems are ill prepared to cope with these challenges and the resultant changes in asset condition [3]. Hence, they need to adapt their operational decision-making systems and management strategies and use water resources to ensure water safety and security [4]. Based on the vast data availability by water utilities today, research and innovation play an essential role in developing innovative, data-driven methods and technologies to support sustainable water management. Hydroinformatics and other disruptive technologies based on acquiring knowledge from data are emerging as new tools to improve and optimize urban water management [5]. Overall, a wide range of engineering and science projects have been developed in multiple areas, also emphasizing the whole data-driven chain that starts inevitably from the importance of ‘good’ data [6]. The increase in computational power is also essential for developing models, and data-driven learning concepts have become state of the art in applied science. The water resource field has followed the same path, where researchers have explored the latest decade’s novel tools for improving the management of water resources. For instance, predicting water demand may allow optimizing the water resource use [7,8,9,10,11], reducing the waste of water and energy. Furthermore, we also include robust flowrate data treatment and analysis tools [12], enhanced methodologies for assessing and improving water and energy efficiency [13,14,15], ANN for burst location [16], reliable methods for condition assessment and asset management [17,18], and multiple other tasks.
Complex network theory and graph neural networks have recently received increased attention in a plethora of data-driven challenges in engineering and science, including water resources management [19]. In this regard, network-based approaches come up with a spatial representation of data in non-Euclidean domains, preserving such an internal structure of data and providing new insights for the analysis and synthesis of complex systems [20]. With today’s high data availability, the application of machine learning on graphs has become the basis for developing even more robust and accurate models for various network-related tasks, such as node-level classification, clustering, and link estimation, among many others. Multiple real-life problems may benefit from the use of graph machine learning (or graph learning, for short). Water resource management is an ideal framework to explore graph learning methods, providing novel and innovative solutions to multiple problems. Actually, we are in front of a research challenge starting to explore the feasibility of graph learning approaches for burst detection [21], water demand forecasting [22,23], quality analysis [24], the optimization of water distribution [25,26], and state estimation [27], among others.
In the review of [19], the concept of the digital twin is mentioned as one crucial topic that is generating interest in the scientific community. Most of the proposed digital twin models are based on physical hydraulic simulators [28,29,30,31,32]. Nonetheless, a few other studies have tackled this topic from a deep learning and data-driven perspective also concerning state estimation [33]. It is foreseen that the next methodological step will be based on deep geometric learning [27,34], as it is currently one of the most critical technologies for digital twins. Indeed, digital twins will rely on an important amount of data that have to be collected by sensors and monitoring systems.
The positioning of sensors in a network has been a crucial topic for many years. It is worth mentioning that in 2008, such a topic was the target of the Battle of the Water Sensor Networks [35]. Indeed, water networks are complex systems that require monitoring for adequate operation and management. It is the case for calibration procedures [36], anomaly detection [37], cyber-security [38,39,40], and many more. However, for obvious economic reasons, it is not possible to place a sensor everywhere. Hence, there is a need to find an optimal sensor configuration that is related to the aim of sensor placement operation. The scientific literature has multiple application methodologies for such an optimal placement [41], for instance, optimal sensor location for friction calibration and burst location [42], leakage detection [43,44], and quality sensors for contaminant detection [45], among others. In addition, different numerical approaches can yield varying results in water distribution network simulations, affecting hydraulic behavior [46,47], transient analysis [48,49], and also sensor positioning as demonstrated by [50] in the case of optimal quality monitoring.
This paper proposes an innovative solution to the challenge of positioning pressure sensors in a water distribution network. It is important to highlight that the proposed approach is based on innovative criteria that are related to breakthrough technologies that attempt to create a framework for digital twins in drinking water resources management. As a difference from conventional approaches, the proposed methodology aims at finding the best sensors configuration that minimizes the error made by a metamodel [51] designed for estimating the pressures of the network through the knowledge extracted from a graph sensor network. This metamodel development is based on graph convolutional neural networks coupled with a meta-heuristic algorithm to perform the optimization task. Summarizing, the novelties of this proposal are as follows:
  • Proof of concept of a novel sensors placement methodology;
  • Implementation of a pressure estimation method based on graph neural networks;
  • Use-case development proving feasibility.
Nowadays, digital twins of water networks are rising as an innovative tool for managing water distribution systems. Nevertheless, most applications still use the conventional hydraulic approach for simulations. In the authors’ view, digital twins will go beyond the conventional concepts of water network management. In fact, we believe that a digital twin should serve as a comprehensive decision support system for water supply operations and management, seamlessly integrating real-time data streams from the network’s sensors. To demonstrate the feasibility of this approach, this paper presents a proof of concept for the development of a novel data-driven digital twin for water supply systems, utilizing graph learning techniques instead of conventional hydraulic models. It is important to emphasize that this paper does not propose a specific digital twin implementation. Instead, it focuses on the concept of digital twins and explores data-driven approaches to sensor placement for supporting future digital twin development.
The paper is organized as follows: Section 2 proposes the main aspects of the methodology, focusing on the metamodel part and highlighting the main idea behind the sensor placement application. Section 3 presents a synthetic case study used to show the feasibility of the proposed approach. The results are presented and discussed in Section 4 and Section 5, highlighting the novelties of the graph neural network metamodel approach as well as the limitations of the present study. Section 6 summarizes the work while providing a number of possible future research related to the digital twin concept.

2. Methodology

The methodology proposed in this paper explores novel criteria for placing sensors. The idea behind it is to find the configuration of pressure sensors that better allows a metamodel to estimate the hydraulics of a network. Although, the current work focuses on pressure estimation, the generalization to other hydraulic features is straightforward. Figure 1 shows a flowchart of the proposal.
Figure 1 highlights the three main steps of the proposed methodology: data generation, particle swarm optimization (PSO), and metamodel for pressure estimation. First, the network model is loaded, and a data generation process is performed. The data generation is needed for creating a dataset for training and testing the metamodel and aims at providing multiple network simulations obtained with different sets of hydraulic parameters. Such a simulation is made in a steady-state condition, using the well-known EPANET [52] hydraulic solver. With this dataset, the second part can start based on a meta-heuristic optimization. In this case, a PSO aims at finding the pressure monitoring system that allows the metamodel to achieve the best performance while estimating the pressure of the network. Each time, a different graph neural network metamodel is trained over the generated dataset with a different input graph based on the output of the variables from the PSO. Hence, the PSO keeps iterating, and once the optimization ends, the optimal sensors configuration is found. It is worth highlighting that the present work does not consider all the critical locations that a real case study might have, such as district metering areas to monitor, locations with low pressure, etc. In fact, the proposed methodology aims at finding the configuration of the sensors that allow the metamodel to perform optimally in terms of pressure estimation and leaks and anomalies detection and localization. For a more detailed description of the metamodel mechanism, it is reminded to refer to [51]. Algorithm 1 describes the pseudo-code for the general methodology of this proposal.
Algorithm 1 Optimal sensor placement for WDS’ metamodel.
Require:  N sensors : Number of sensors to be tested.
Require:  N particles : Number of particles in the particle swarm optimization (PSO) algorithm.
Require:  k limit : Number of iterations limit.
Ensure: Optimal set of sensors.
 Initialize n to 0.
while  n < N sensors  do
   Generate a random population of N particles particles.
   Initialize k to 0.
   while  k < k limit  do
       for  i 1 to N particles  do
           Train a Graph Convolutional Network (GCN) using particle i-th.
           Evaluate the metamodel performance with criterion function.
           Update position and velocity of particle i-th using PSO.
       end for
        k k + 1
   end while
    n n + 1
end while

2.1. Graph Estimation

As mentioned above, the study is based on the development of a metamodel that estimates the pressure of the network in a digital twin framework. The metamodel of this paper is based on a graph convolutional neural network [53] and it is an application of the one presented by [51]. Given its recent emergence and advanced nature within the literature, this metamodel represents a fitting choice for achieving the precise state estimation of pressure within water distribution networks. The inherent quality of this selected metamodel not only facilitates the development but also enables the rigorous testing of the reliability of the proposed optimal sensor placement methodology.
Figure 2 presents a summary of the process.
The main idea of the proposed metamodel is to build a GCN to estimate the pressure state of the whole network topology from the sensor network. Hence, the GCN model is designed to take as input the learned graph of the sensor network, having pressure measurements as graph node features. The adjacency matrix of the graph of the sensor network (i.e., the model input) is built by the correlation between the different measures taken at each sensor node. For creating such a model, a dataset is generated by varying multiple hydraulic parameters to have different sets of realistic, physical-based pressures. Such parameters are the nodal demands and the pipe roughness and the parameters in the current case study are subject to random modification, with each parameter’s variation that can range from −100% to +100%, and being independent of the others and having a nominal value based on a uniform distribution [51]. This allows having a physically informed model that is trained over this dataset. Hence, the model learns to estimate the whole network pressures starting only from the measurements available from the sensors.
Given that the input graph is composed of the measurements from the monitoring nodes selected at each iteration of the PSO, the metamodel estimation will provide different performance results at each round of the optimization. Therefore, at each iteration of the PSO, the metamodel performance is evaluated on a testing portion of the generated dataset to assess whether the sensor configuration is optimal for the estimation or not. This idea is the basis of finding the optimal sensors configuration for digital twins, which have to estimate the network behavior starting from the data coming from the sensor location.

2.2. Graph Convolutional Metamodel

In this paper, a GCN [53] model is designed to estimate the network pressures starting from only the information coming from some monitored nodes. To this end, it is proposed to model the monitoring nodes as a graph G = ( V , E , A ) , where the terms V and E represent the set of N nodes and L edges, and A is the adjacency matrix of the graph that mathematically describes the interaction among edges, respectively. In particular, each node of the graph is assigned to the attribute of the pressure measurement, while the link represents the correlation among each measured point. A GCN model will extract the necessary information from the graph and will operate estimation. The convolution operation is widely known for its ability to extract spatial information since it is based on the idea of sharing weights between neighbors. General graph convolutional neural networks (GCNs) are capable of processing graph data with a similar locality principle to the CNNs, after the definition of suitable operations and/or data transformation [22]. Furthermore, such models have started to be used in urban water for some operation and management tasks [21,22,33]. In this study, the GCN seeks to provide the complete pressure estimation of a network by using the node features coming from only some nodes that are monitored [51]. Shortly, the GCN model follows the notation of [53] and provides the output as expressed in Equation (1):
Y = A ˜ X W ,
The matrix A ˜ denotes the adjacency matrix, which represents the graph derived from the dataset. The dimension of A ˜ is n by n, n being the number of nodes in the graph. Matrix X is employed to store the data features for each node, with dimensions n by f, where f represents the number of features. Additionally, matrix W serves as the weight matrix, having dimensions f by o, where o is the number of outputs. Lastly, the estimated output Y from the Graph Convolutional Network (GCN) is a matrix sized n by o. A ˜ n , n can be defined by Equation (2):
A ˜ = ( D ^ 1 / 2 A ^ D ^ 1 / 2 )
where A ^ = A + I is the adjacency matrix built upon the input graph, where the links represent the correlation between the different input data for the model, A is the correlation matrix, and D ^ is the degree matrix. For further details, see [53].
As for all deep learning models, the tuning of the hyperparameters is a very important part [23]. Due to the high computational requirement of the proposed procedure that has to test multiple models for each simulation of the sensor placement optimization algorithm, it is proposed to use a metamodel with a fixed configuration. Therefore, the hyperparameters of the GCN model are fixed, and they were chosen based on a grid search that is performed on a static configuration of five sensors. On one hand, this represents a simplification because the tuning of the model should be made for each different set of inputs. On the other hand, such an approach is not feasible due to the overly high computational requirement. Hence, the GCN metamodel is composed of three layers of 32, 64 and 32 units, respectively.
All the models have been implemented in Python 3.6.7 using the Spektral [54] and Tensorflow [55] libraries.

2.3. Sensors Graph Network

The input of the metamodel based on a GCN is the graph built over the monitored nodes. This sensor graph network is responsible for the metamodel output, which has to extract as much information as possible from the sensors graph network. Therefore, it is proposed to use a PSO algorithm to optimally choose this sensors graph network. The aim of the PSO is, given a fixed number of sensors, to find the configuration that optimally allows the metamodel to predict the remaining pressures of the water system. Therefore, the PSO iterates over different sensors configurations to minimize the error made by the metamodel in the estimation process. To this end, it is used as measure of the mean squared error (MSE), expressed by Equation (3)
M S E = 1 N i = 1 N ( y i y i ^ ) 2 ,
where y i represents the true values, y i ^ the estimated values, and N the number of estimated values.

2.4. Particle Swarm Optimization

In this section, it is described the optimization algorithm adopted in this study, which is the speed-constrained multi-objective particle swarm optimization algorithm [56] (SMPSO, hereafter). The SMPSO is a more complex variant of the classic PSO, designed to handle both single- and multi-objective optimizations. Compared to the more classic PSO algorithms, the SMPSO is characterized by a velocity constraint mechanism, which is designed to prevent the so-called ‘swarm explosion’ [57], which is an inconsistent movement of the particles when the velocities are high. Moreover, the algorithm is formulated with an external archive to store the solutions that are non-dominated and also, the polynomial mutation is applied to perturb the possible solutions. Nevertheless, the main idea of the SMPSO remains to perform an iterative process to explore the space of the solution. Such a process is performed by initializing some particles, named bees. Afterwards, the particle has to be located in order to seek the optimal solution. The particle locations follows a sequence of three steps: particle initialization, calculation of the particle velocity, and, finally, the update of the particle position and of the archive.
For more detailed information on the SMPSO algorithm, refer to [56]. For details regarding the implementation library, see the Platypus framework [58].

3. Case Study

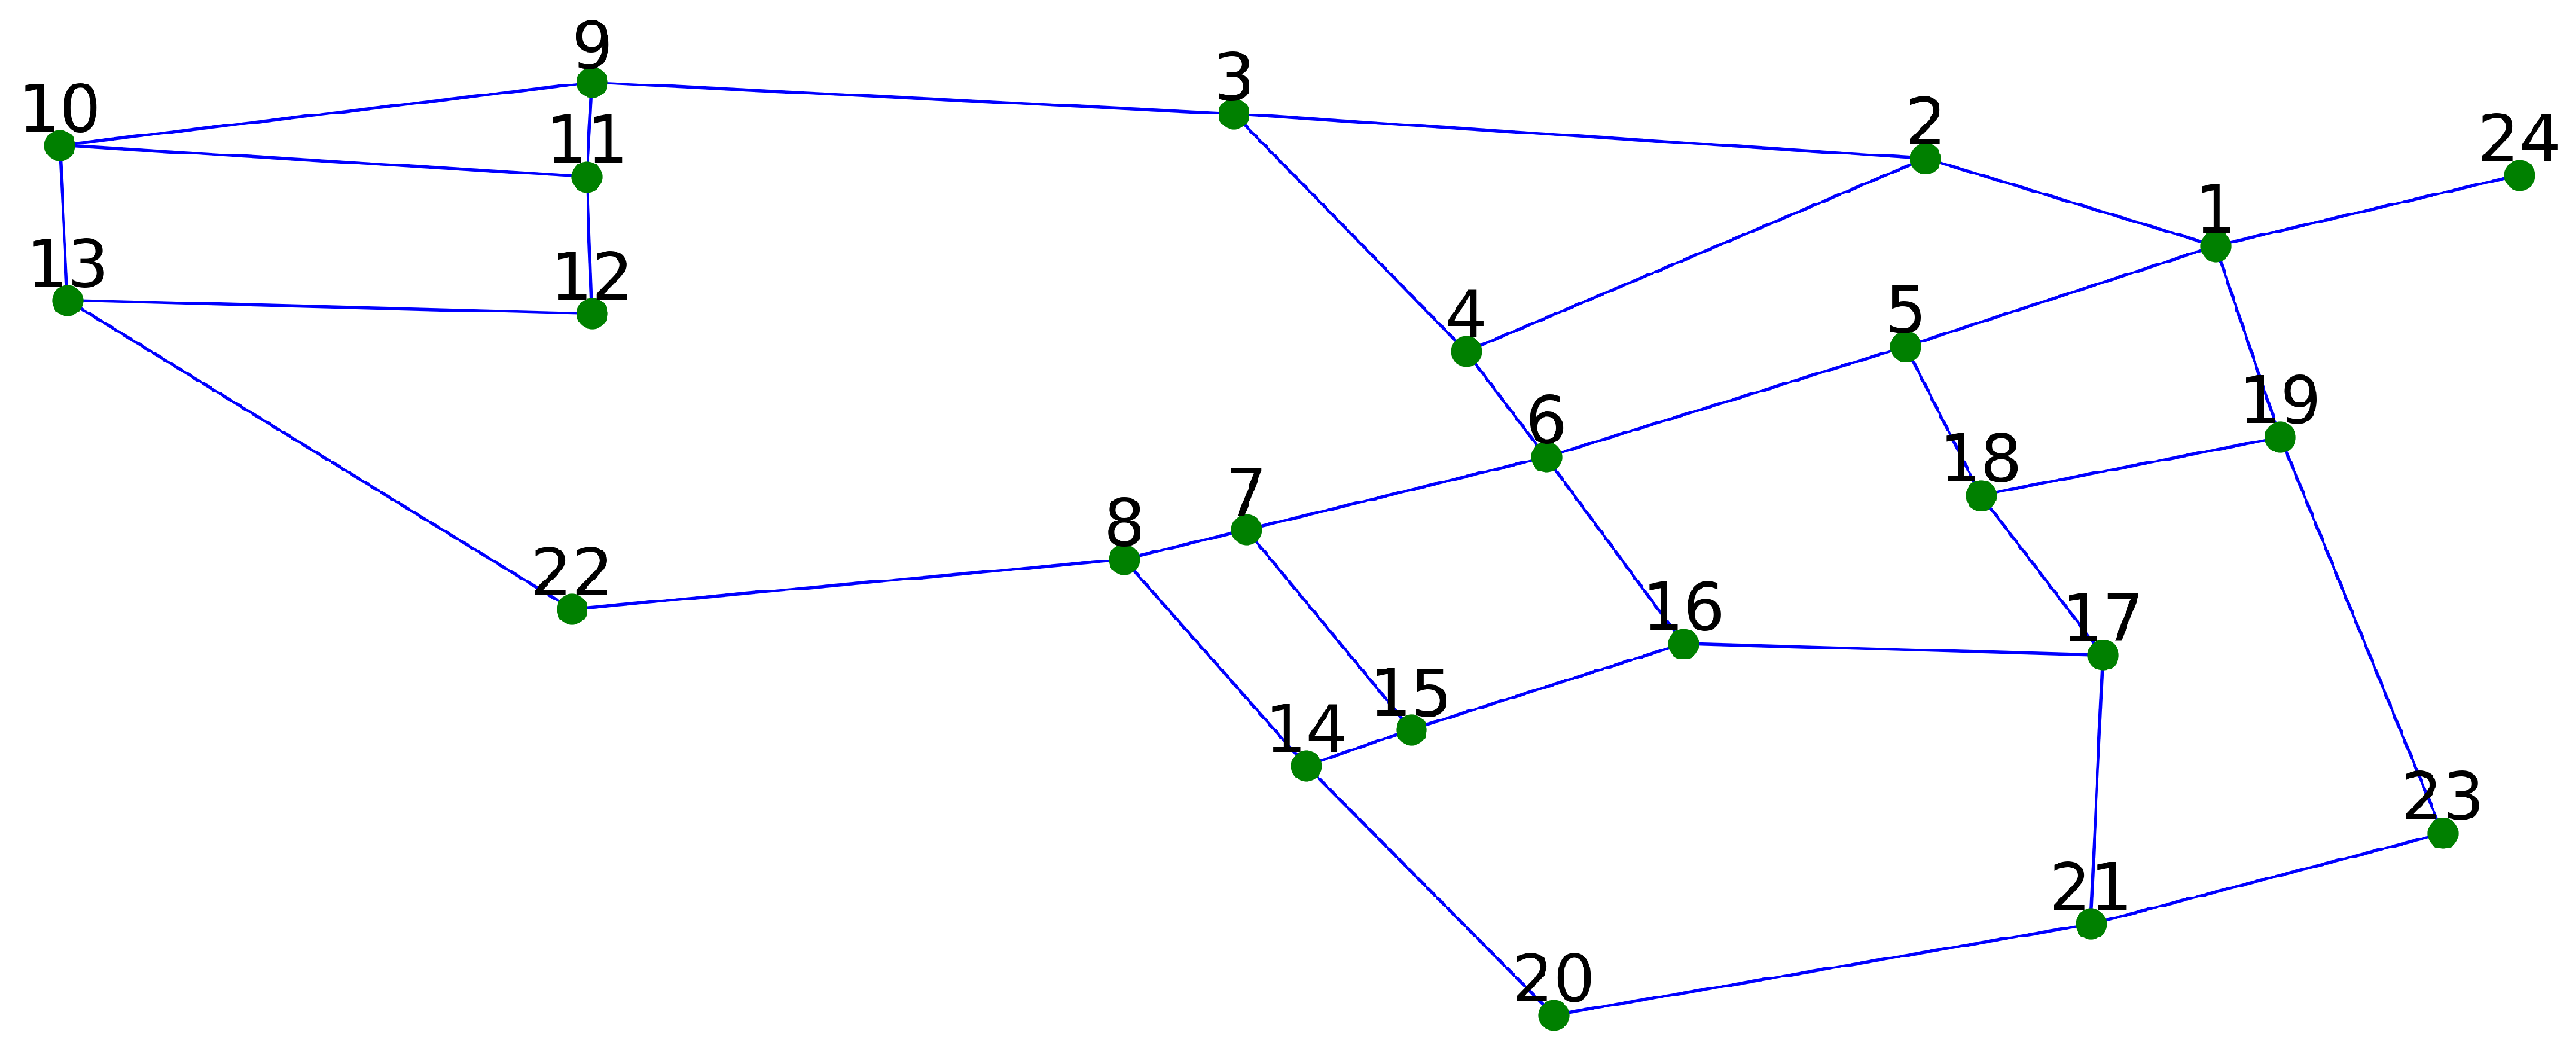
In this study, the network used for testing the methodology is the well-known Apulian network [59], which has been adopted for multiple problems related to water networks [44,60,61]. The Apulian network is well suited for this study, as it is a relatively simple network, ideal for a proof of concept. Simultaneously, it allows for the demonstration of the methodology’s reliability in a real-world, highly skeletonized test case. Figure 3 shows the layout of this network, which consists of 1 reservoir, 23 nodes, and 34 pipes.
This is a very skeletonized network that suffers pressure deficit, which is a common situation for many water distribution systems. Therefore, the adoption of a pressure-driven simulation is fundamental to correctly analyze such a network. Table 1 shows the main characteristics of the steady-state simulation of the adopted case study.
As previously mentioned, for developing the proposed methodology, a data generation procedure is made for creating the dataset needed for training and testing the metamodel. Given that the purpose of this paper is a proof-of-concept methodology, the generation of the data is made by making only slight variations in the pipe roughness coefficients and in the demand pattern during a steady-state simulation of the network. This operation allows to create multiple physically based sets of data that have to inform the metamodel physically. Furthermore, the generation is made only for regular data, meaning without considering anomalies, and it is made for creating a dataset of 10,000 samples that accounts for different network hydraulic behavior. It is worth mentioning that the size of the case study was arbitrarily chosen, and it is mostly related to the case study’s complexity. In fact, such dimension should be evaluated for each case study and in relation to its complexity. The methodology is carried out using the WNTR [62] library in Python.

4. Results

This section reports the results of the proposed methodology tested on the synthetic Apulian network. In particular, the different configurations are evaluated based on the ability of the metamodel to accurately estimate the pressure of the remaining nodes. To evaluate this ability, the dataset generated is divided into a portion for training the metamodel (80%) and a portion for testing (20%). In this latter portion, the model’s ability to estimate the other nodal pressure is evaluated using the MSE metric and also the mean absolute error (MAE), which can be read as states in the expression of Equation (4):
M A E = 1 N . i = 1 N | y i y ^ i | .
Equation (4) is calculated by comparing the true values y i (i.e., the pressure values of the testing portion of the generated dataset) and the estimated values y i ^ (i.e., the estimated values output of the metamodel). The results are shown in Table 2, with also the addition of the square root of the MSE (i.e., the RMSE). The metrics are evaluated by averaging the performance of ten models due to the stochastic behavior of such methods. In fact, each trained model might perform slightly differently due to the intrinsic nature of the training process. Therefore, it is proposed to average the performance of 10 equal models to have a robust result.
Given the simple layout of the network, almost all network configurations appear to provide good results. The average estimation error is around 0.1 m for each estimated node of the network. As expected, Table 2 highlights that the metamodel performance improves with the increase in the sensor number. Furthermore, it appears that the error is higher for some configurations with more sensors than for some with fewer sensors. Despite not being intuitive, it has to be pointed out that each configuration is different in terms of the number of estimated nodes. This difference makes the comparison between each configuration not feasible. However, for such configurations of the network, through just a few pressure sensors, it will be possible to have reliable pressure estimation in view of a digital twin. Although this work wants to propose only a proof of concept for a methodology for sensor placement, it is worth mentioning that the metamodel has been trained and tested over regular hydraulic data (not considering anomalies). Such performance could easily differ in the case of real data, or when considering data with high variability, affected by anomalies such as leakages. Furthermore, such changes in the input data would require some re-training of the metamodel, considering also the scope of the metamodel itself.
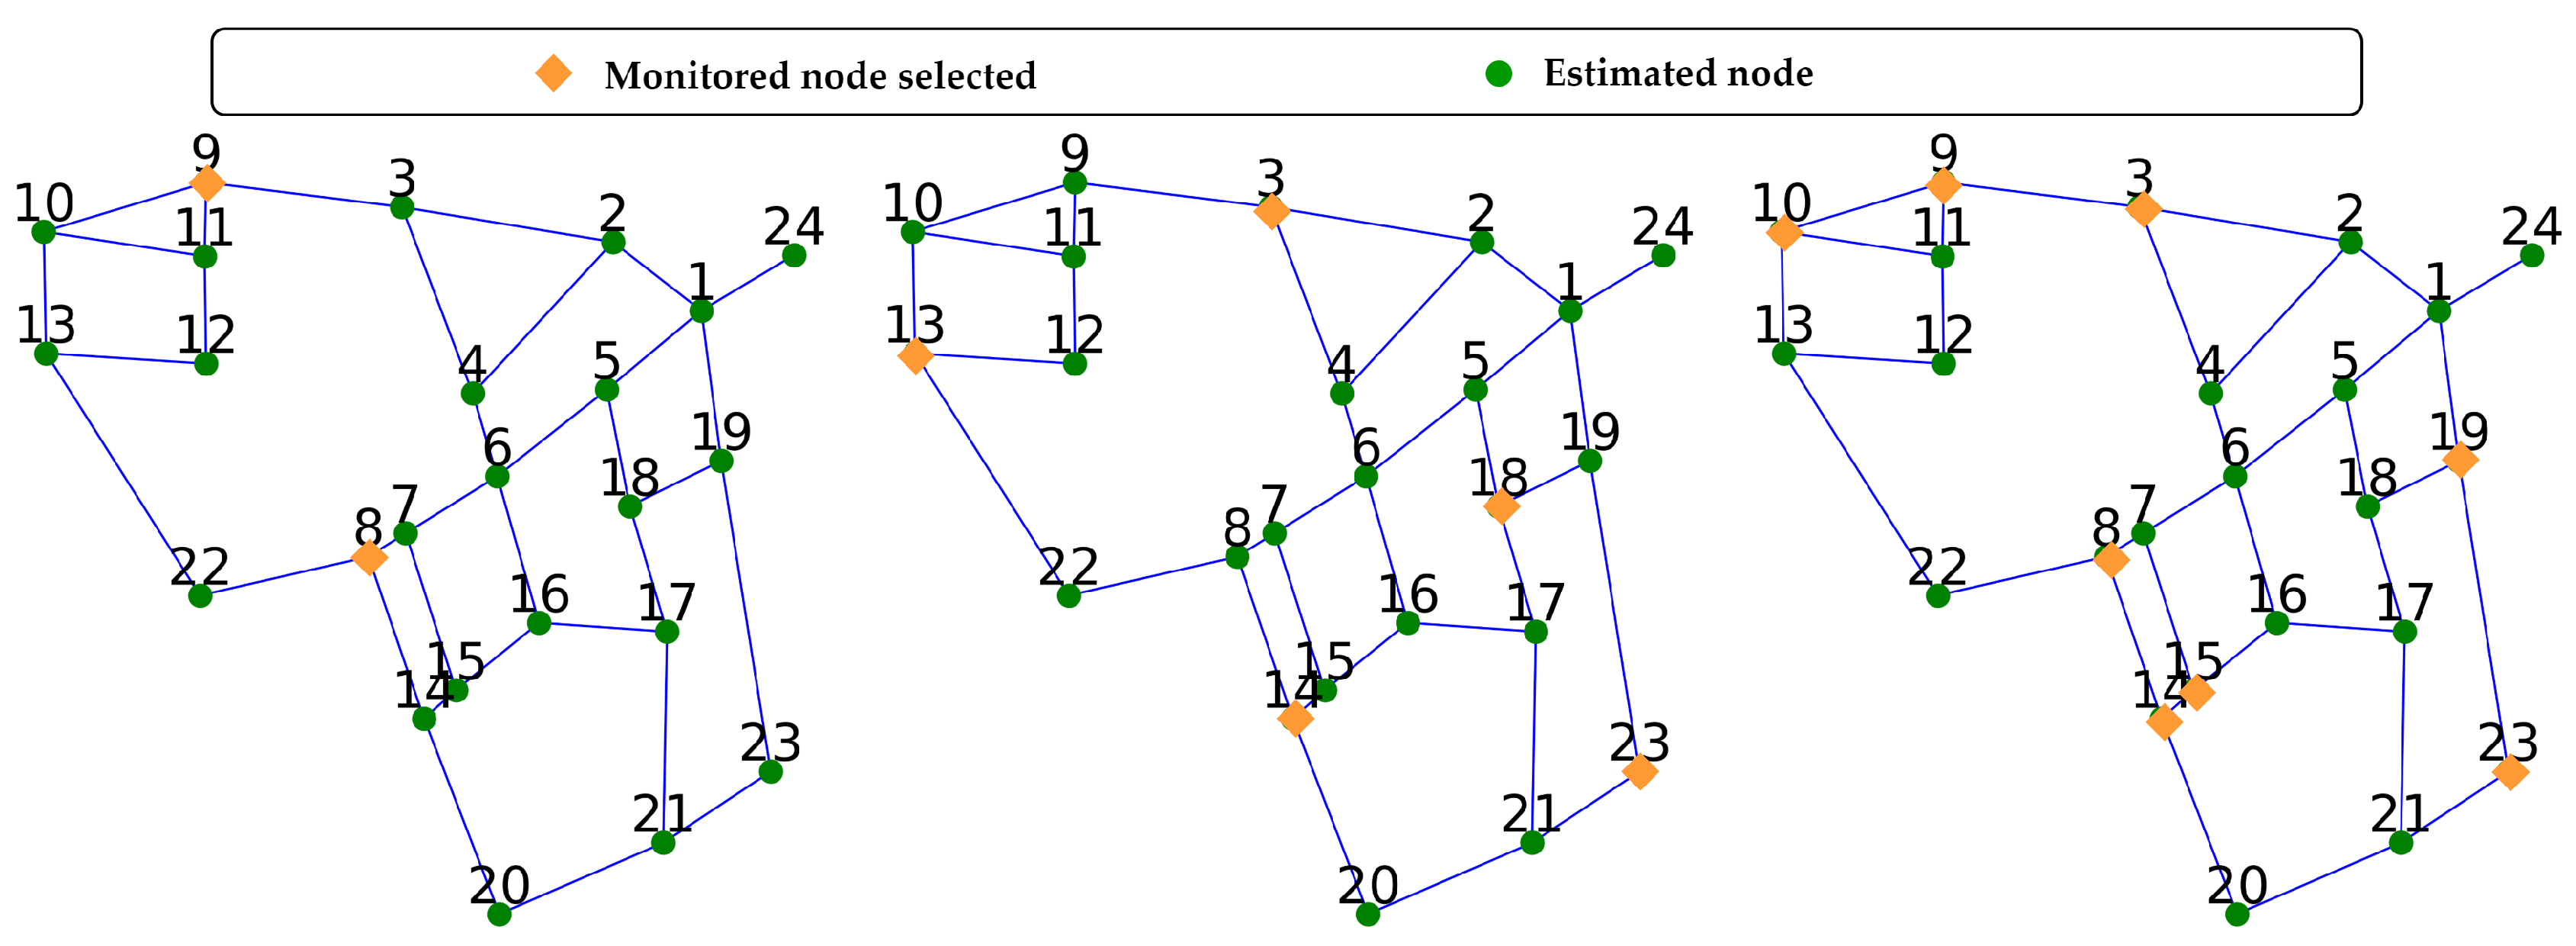
Figure 4 shows the position of the sensors for the configuration of the network with 2, 5, and 8 monitored nodes.
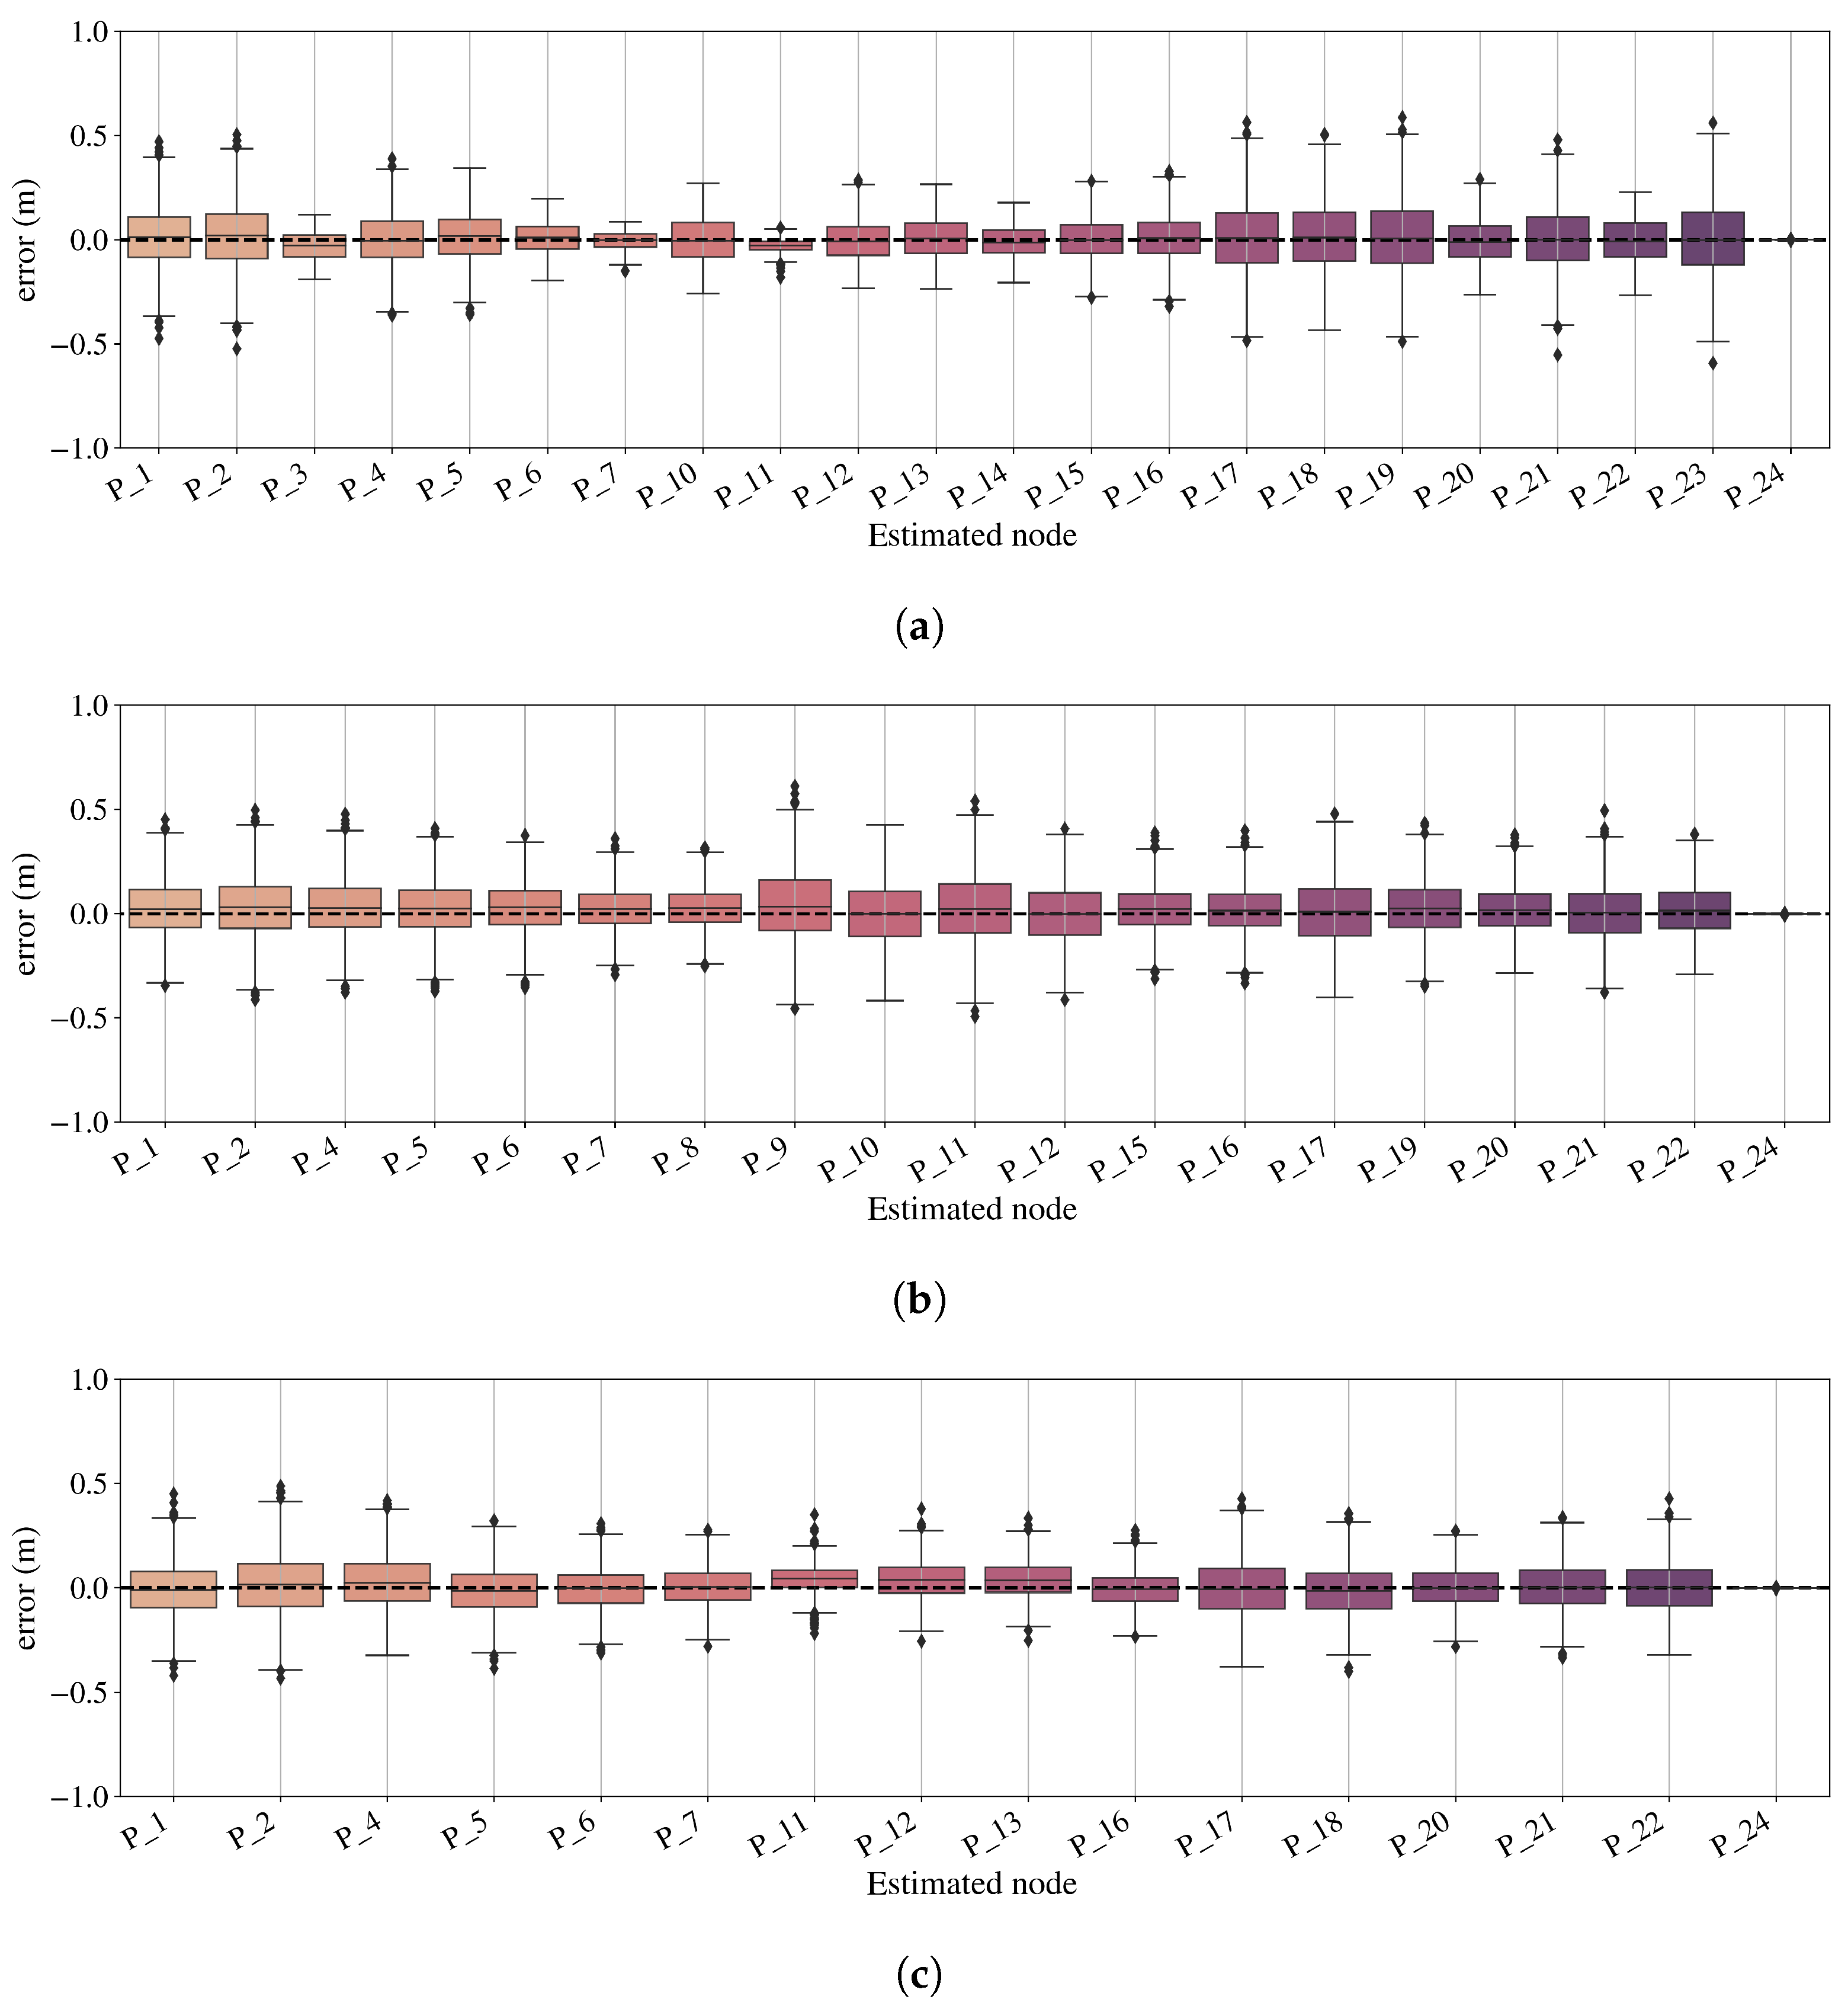
Given the simple layout of the test cases presented, it is possible to note that the different configurations of the sensors are well distributed along the network. Nevertheless, Figure 5 shows the error distribution for each estimated node in the three configurations depicted in Figure 4. These error distributions are shown through box plots referring to the testing portion of the dataset.
Figure 5 shows that the three depicted configurations of sensors allow the metamodel to accurately predict the pressure of the network. Despite the three configurations showing different accuracy in the pressure–node estimation, the error is approximately always less than 0.5 m at each node. This shows that the proposed methodology is able to find an optimal configuration for estimation purposes. Such accuracy is a promising result for the development of the future digital twin of a water system infrastructure.
Finally, as further proof of the goodness of the model, Figure 6 shows the distribution of the estimation error made by the metamodel built with 5 sensors.
As depicted in Figure 6, the error made by the metamodel is focused around the zero error with a normal distribution. Furthermore, all the models pass the Kolmogorov–Smirnov test with an almost zero p-value. It is noteworthy to highlight that through a comparison with the conventional node-ranking approach for sensor placement [63], we have substantiated the advantages of employing a metamodel tailored to address this specific task.

5. Discussion

The proposed methodology is a proof of concept of a new idea of sensor placement based on novel criteria, which is to minimize the pressure estimation error provided by a metamodel. Generally, sensor placement methodologies aim at finding the optimal position for the sensor in order to accomplish different purposes, like efficient leak detection [43,64] or contaminant detection [41,45]. Instead, the current research focuses on a metamodel that has the potential to serve as the foundation for the development of digital twins [51]. This prospect is further enhanced by the emergence of new technologies within the realm of geometric deep learning. The results highlight that the methodology proposed could find the position of some sensors that maximize the accuracy of the graph convolution neural networks that aim at estimating the network pressure in each node of the network. Furthermore, the findings provide backing for this objective as evidenced by the minimal errors observed across all the configurations that were tested. However, it is not possible to provide direct comparisons with other optimal sensor positioning methods because this work is the first to aim at minimizing the error in metamodel pressure estimation.
Although the methodology developed show promising results, it is also important to highlight that it is a proof of concept and so has multiple limitations that need to be taken into account. First of all, the data used are only regular data and do not account for anomalies, e.g., leaks, bursts or the malfunction of regulating devices. Clearly, this problem will surely affect the difference in terms of performance between the configuration that has a higher number of sensors compared to the ones that have a lower number. Moreover, the network complexity should be taken into account in future applications. The Apulian network appears as a very suitable test case for the proof-of-concept aim of the present study. However, the metamodel for estimation should also be tested in a network with some discontinuity and regulation elements. The authors are of the opinion that the implementation of such a procedure is likely; furthermore, it holds true that such a utilization could pose as a forthcoming obstacle for these metamodels.
Finally, the computational requirements of such an approach are quite expansive. To give an idea of these requirements, the metamodel with one sensor need almost 29 s to be trained, while the one with six sensors requires approximately 33 s, and the one with 11 sensors takes 40 s. In addition, the PSO algorithm requires approximately from 8 to 10 h to converge. These numbers have been achieved on a conventional laptop, running on a single CPU with an i7-12700H and 16 GB of Ram. On a larger and more complex network, such an approach would require some further optimization in the process.

6. Conclusions

The current investigation introduces a new approach to the placement of sensors. This could be interpreted as a demonstration of the possibility of determining the optimal sensor locations to gather data to be utilized by a metamodel based on graph convolutional neural networks. The objective of the metamodel is to predict the pressure of a water distribution network exploiting the sensor data. Consequently, a particle swarm optimization (PSO) technique is utilized to determine the optimal sensor locations that minimize the prediction error of the metamodel. This approach is evaluated on the configuration of the Apulian network to illustrate its applicability.
The methodology shows promising results. The estimated pressures of each node of the network exhibit a low error with high accuracy in the estimation in all the configurations tested. Despite the constraints linked with a proof of concept, the manuscript explores how the suggested approach can offer a creative framework in the time ahead. Specifically, the implementation of a digital replica of a water system will be at the focal point of the research endeavor. An extra uniqueness of the manuscript is the utilization of a graph comprehension technique to approximate the pressure of the network.
Future works will further explore the application of such a methodology, accounting for more complex networks but also for multiple objectives, like combining the minimization of the estimation error and the ability to detect leakages. Moreover, future works will explore the graph learning framework as the basis for embedding a metamodel in a digital twin.

Author Contributions

All authors have contributed equally. All authors have read and agreed to the published version of the manuscript.

Funding

This research has been supported by the Ministry of University and Research (MUR) under the Project of Relevant Interest—PRIN2022—“Hybrid Transient–Machine Learning Approach for Anomaly Detection and Classification in Water Transmission Mains (TANDEM)” (CUP: J53D23002110006).

Data Availability Statement

The data that support the findings of this study are available from the corresponding author upon reasonable request.

Conflicts of Interest

The authors declare no conflicts of interest.

References

  1. Sangiorgio, M.; Weber, E.; Cananzi, D.; Zatarain Salazar, J.; Micotti, M.; Castelletti, A. Climate change adaptation through integrated management of water reuse technologies. In Proceedings of the EGU General Assembly Conference Abstracts, Vienna, Austria, 23–28 April 2023. [Google Scholar]
  2. Kristvik, E.; Muthanna, T.M.; Alfredsen, K. Assessment of future water availability under climate change, considering scenarios for population growth and ageing infrastructure. J. Water Clim. Chang. 2019, 10, 1–12. [Google Scholar] [CrossRef]
  3. Berglund, E.Z.; Pesantez, J.E.; Rasekh, A.; Shafiee, M.E.; Sela, L.; Haxton, T. Review of modeling methodologies for managing water distribution security. J. Water Resour. Plan. Manag. 2020, 146, 03120001. [Google Scholar] [CrossRef] [PubMed]
  4. Benedict, S.; Hussein, H. An analysis of water awareness campaign messaging in the case of Jordan: Water conservation for state security. Water 2019, 11, 1156. [Google Scholar] [CrossRef]
  5. Makropoulos, C.; Savić, D. Urban hydroinformatics: Past, present and future. Water 2019, 11, 1959. [Google Scholar] [CrossRef]
  6. Zanfei, A.; Menapace, A.; Brentan, B.M.; Righetti, M. How does missing data imputation affect the forecasting of urban water demand? J. Water Resour. Plan. Manag. 2022, 148, 04022060. [Google Scholar] [CrossRef]
  7. Zanfei, A.; Menapace, A.; Granata, F.; Gargano, R.; Frisinghelli, M.; Righetti, M. An Ensemble Neural Network Model to Forecast Drinking Water Consumption. J. Water Resour. Plan. Manag. 2022, 148, 04022014. [Google Scholar] [CrossRef]
  8. Brentan, B.M.; Luvizotto, E., Jr.; Herrera, M.; Izquierdo, J.; Pérez-García, R. Hybrid regression model for near real-time urban water demand forecasting. J. Comput. Appl. Math. 2017, 309, 532–541. [Google Scholar] [CrossRef]
  9. Herrera, M.; Torgo, L.; Izquierdo, J.; Pérez-García, R. Predictive models for forecasting hourly urban water demand. J. Hydrol. 2010, 387, 141–150. [Google Scholar] [CrossRef]
  10. Zanfei, A.; Brentan, B.M.; Menapace, A.; Righetti, M. A short-term water demand forecasting model using multivariate long short-term memory with meteorological data. J. Hydroinform. 2022, 24, 1053–1065. [Google Scholar] [CrossRef]
  11. Mazzoni, F.; Alvisi, S.; Blokker, M.; Buchberger, S.G.; Castelletti, A.; Cominola, A.; Gross, M.P.; Jacobs, H.E.; Mayer, P.; Steffelbauer, D.B.; et al. Investigating the characteristics of residential end uses of water: A worldwide review. Water Res. 2022, 230, 119500. [Google Scholar] [CrossRef]
  12. Ferreira, B.; Carriço, N.; Barreira, R.; Dias, T.; Covas, D. Flowrate Time Series Processing in Engineering Tools for Water Distribution Networks. Water Resour. Res. 2022, 58, e2022WR032393. [Google Scholar] [CrossRef]
  13. Loureiro, D.; Silva, C.; Cardoso, M.A.; Mamade, A.; Alegre, H.; Rosa, M.J. The Development of a Framework for Assessing the Energy Efficiency in Urban Water Systems and Its Demonstration in the Portuguese Water Sector. Water 2020, 12, 134. [Google Scholar] [CrossRef]
  14. Mamade, A.; Loureiro, D.; Alegre, H.; Covas, D. Top-down and bottom-up approaches for water-energy balance in Portuguese supply systems. Water 2018, 10, 577. [Google Scholar] [CrossRef]
  15. Kostner, M.K.; Zanfei, A.; Alberizzi, J.C.; Renzi, M.; Righetti, M.; Menapace, A. Micro hydro power generation in water distribution networks through the optimal pumps-as-turbines sizing and control. Appl. Energy 2023, 351, 121802. [Google Scholar] [CrossRef]
  16. Capelo, M.; Brentan, B.; Monteiro, L.; Covas, D. Near–real time burst location and sizing in water distribution systems using artificial neural networks. Water 2021, 13, 1841. [Google Scholar] [CrossRef]
  17. Cabral, M.; Loureiro, D.; Covas, D. Using economic asset valuation to meet rehabilitation priority needs in the water sector. Urban Water J. 2019, 16, 205–214. [Google Scholar] [CrossRef]
  18. Marsili, V.; Alvisi, S.; Maietta, F.; Capponi, C.; Meniconi, S.; Brunone, B.; Franchini, M. Extending the application of connectivity metrics for characterizing the dynamic behaviour of water distribution networks. Water Resour. Res. 2023, 59, e2023WR035031. [Google Scholar] [CrossRef]
  19. Fu, G.; Jin, Y.; Sun, S.; Yuan, Z.; Butler, D. The role of deep learning in urban water management: A critical review. Water Res. 2022, 223, 118973. [Google Scholar] [CrossRef] [PubMed]
  20. Herrera, M.; Proselkov, Y.; Pérez-Hernández, M.; Parlikad, A.K. Mining graph-Fourier transform time series for anomaly detection of internet traffic at core and metro networks. IEEE Access 2021, 9, 8997–9011. [Google Scholar] [CrossRef]
  21. Zanfei, A.; Menapace, A.; Brentan, B.M.; Righetti, M.; Herrera, M. Novel approach for burst detection in water distribution systems based on graph neural networks. Sustain. Cities Soc. 2022, 86, 104090. [Google Scholar] [CrossRef]
  22. Zanfei, A.; Brentan, B.M.; Menapace, A.; Righetti, M.; Herrera, M. Graph convolutional recurrent neural networks for water demand forecasting. Water Resour. Res. 2022, 58, e2022WR032299. [Google Scholar] [CrossRef]
  23. Menapace, A.; Zanfei, A.; Righetti, M. Tuning ANN hyperparameters for forecasting drinking water demand. Appl. Sci. 2021, 11, 4290. [Google Scholar] [CrossRef]
  24. Sitzenfrei, R. Using complex network analysis for water quality assessment in large water distribution systems. Water Res. 2021, 201, 117359. [Google Scholar] [CrossRef] [PubMed]
  25. Sitzenfrei, R.; Wang, Q.; Kapelan, Z.; Savić, D. Using complex network analysis for optimization of water distribution networks. Water Resour. Res. 2020, 56, e2020WR027929. [Google Scholar] [CrossRef] [PubMed]
  26. Sitzenfrei, R.; Hajibabaei, M.; Hesarkazzazi, S.; Diao, K. Dual graph characteristics of water distribution networks—How optimal are design solutions? Complex Intell. Syst. 2022, 9, 147–160. [Google Scholar] [CrossRef] [PubMed]
  27. Xing, L.; Sela, L. Graph Neural Networks for State Estimation in Water Distribution Systems: Application of Supervised and Semisupervised Learning. J. Water Resour. Plan. Manag. 2022, 148, 04022018. [Google Scholar] [CrossRef]
  28. Bartos, M.; Kerkez, B. Pipedream: An interactive digital twin model for natural and urban drainage systems. Environ. Model. Softw. 2021, 144, 105120. [Google Scholar] [CrossRef]
  29. Garrido-Baserba, M.; Corominas, L.; Cortès, U.; Rosso, D.; Poch, M. The fourth-revolution in the water sector encounters the digital revolution. Environ. Sci. Technol. 2020, 54, 4698–4705. [Google Scholar] [CrossRef] [PubMed]
  30. Menapace, A.; Zanfei, A.; De Luca, A.; Pauli, D.D.; Righetti, M. Towards a Digital Twin Model for the Management of the Laives Aqueduct. Environ. Sci. Proc. 2022, 21, 70. [Google Scholar] [CrossRef]
  31. Conejos Fuertes, P.; Martínez Alzamora, F.; Hervás Carot, M.; Alonso Campos, J. Building and exploiting a Digital Twin for the management of drinking water distribution networks. Urban Water J. 2020, 17, 704–713. [Google Scholar] [CrossRef]
  32. Berglund, E.Z.; Shafiee, M.E.; Xing, L.; Wen, J. Digital twins for water distribution systems. J. Water Resour. Plan. Manag. 2023, 149, 02523001. [Google Scholar] [CrossRef]
  33. Bonilla, C.A.; Zanfei, A.; Brentan, B.; Montalvo, I.; Izquierdo, J. A digital twin of a water distribution system by using graph convolutional networks for pump speed-based state estimation. Water 2022, 14, 514. [Google Scholar] [CrossRef]
  34. Bronstein, M.M.; Bruna, J.; LeCun, Y.; Szlam, A.; Vandergheynst, P. Geometric deep learning: Going beyond euclidean data. IEEE Signal Process. Mag. 2017, 34, 18–42. [Google Scholar] [CrossRef]
  35. Ostfeld, A.; Uber, J.G.; Salomons, E.; Berry, J.W.; Hart, W.E.; Phillips, C.A.; Watson, J.P.; Dorini, G.; Jonkergouw, P.; Kapelan, Z.; et al. The battle of the water sensor networks (BWSN): A design challenge for engineers and algorithms. J. Water Resour. Plan. Manag. 2008, 134, 556–568. [Google Scholar] [CrossRef]
  36. Zanfei, A.; Menapace, A.; Santopietro, S.; Righetti, M. Calibration procedure for water distribution systems: Comparison among hydraulic models. Water 2020, 12, 1421. [Google Scholar] [CrossRef]
  37. Marzola, I.; Alvisi, S.; Franchini, M. A Comparison of Model-Based Methods for Leakage Localization in Water Distribution Systems. Water Resour. Manag. 2022, 36, 5711–5727. [Google Scholar] [CrossRef]
  38. Taormina, R.; Galelli, S. Deep-learning approach to the detection and localization of cyber-physical attacks on water distribution systems. J. Water Resour. Plan. Manag. 2018, 144, 04018065. [Google Scholar] [CrossRef]
  39. Murillo, A.; Taormina, R.; Tippenhauer, N.O.; Salaorni, D.; van Dijk, R.; Jonker, L.; Vos, S.; Weyns, M.; Galelli, S. High-fidelity cyber and physical simulation of water distribution systems. I: Models and Data. J. Water Resour. Plan. Manag. 2023, 149, 04023009. [Google Scholar] [CrossRef]
  40. Murillo, A.; Taormina, R.; Tippenhauer, N.O.; Galelli, S. High-fidelity cyber and physical simulation of water distribution systems. II: Enabling cyber-physical attack localization. J. Water Resour. Plan. Manag. 2023, 149, 04023010. [Google Scholar] [CrossRef]
  41. Adedoja, O.S.; Hamam, Y.; Khalaf, B.; Sadiku, R. A state-of-the-art review of an optimal sensor placement for contaminant warning system in a water distribution network. Urban Water J. 2018, 15, 985–1000. [Google Scholar] [CrossRef]
  42. Ferreira, B.; Carriço, N.; Covas, D. Optimal Number of Pressure Sensors for Real-Time Monitoring of Distribution Networks by Using the Hypervolume Indicator. Water 2021, 13, 2235. [Google Scholar] [CrossRef]
  43. Francés-Chust, J.; Brentan, B.M.; Carpitella, S.; Izquierdo, J.; Montalvo, I. Optimal placement of pressure sensors using fuzzy DEMATEL-based sensor influence. Water 2020, 12, 493. [Google Scholar] [CrossRef]
  44. Righetti, M.; Bort, C.M.G.; Bottazzi, M.; Menapace, A.; Zanfei, A. Optimal selection and monitoring of nodes aimed at supporting leakages identification in WDS. Water 2019, 11, 629. [Google Scholar] [CrossRef]
  45. Giudicianni, C.; Campisano, A.; Di Nardo, A.; Creaco, E. Pulsed Demand Modeling for the Optimal Placement of Water Quality Sensors in Water Distribution Networks. Water Resour. Res. 2022, 58, e2022WR033368. [Google Scholar] [CrossRef]
  46. Menapace, A.; Avesani, D. Global Gradient Algorithm extension to distributed pressure driven pipe demand model. Water Resour. Manag. 2019, 33, 1717–1736. [Google Scholar] [CrossRef]
  47. Giustolisi, O.; Savic, D.; Kapelan, Z. Pressure-driven demand and leakage simulation for water distribution networks. J. Hydraul. Eng. 2008, 134, 626–635. [Google Scholar] [CrossRef]
  48. Kausar, R.; Farid, H.; Riaz, M. A numerically validated approach to modeling water hammer phenomena using partial differential equations and switched differential-algebraic equations. J. Ind. Intell. 2023, 1, 75–86. [Google Scholar] [CrossRef]
  49. Covas, D.; Stoianov, I.; Mano, J.F.; Ramos, H.; Graham, N.; Maksimovic, C. The dynamic effect of pipe-wall viscoelasticity in hydraulic transients. Part II—Model development, calibration and verification. J. Hydraul. Res. 2005, 43, 56–70. [Google Scholar] [CrossRef]
  50. Piazza, S.; Sambito, M.; Freni, G. Analysis of optimal sensor placement in looped water distribution networks using different water quality models. Water 2023, 15, 559. [Google Scholar] [CrossRef]
  51. Zanfei, A.; Menapace, A.; Brentan, B.M.; Sitzenfrei, R.; Herrera, M. Shall we always use hydraulic models? A graph neural network metamodel for water system calibration and uncertainty assessment. Water Res. 2023, 242, 120264. [Google Scholar] [CrossRef]
  52. Rossman, L.A. EPANET 2: Users Manual; U.S. Environmental Protection Agengy: Washington, DC, USA, 2000.
  53. Kipf, T.N.; Welling, M. Semi-supervised classification with graph convolutional networks. arXiv 2016, arXiv:1609.02907. [Google Scholar]
  54. Grattarola, D.; Alippi, C. Graph neural networks in tensorflow and keras with spektral. arXiv 2020, arXiv:2006.12138. [Google Scholar]
  55. Abadi, M.; Barham, P.; Chen, J.; Chen, Z.; Davis, A.; Dean, J.; Devin, M.; Ghemawat, S.; Irving, G.; Isard, M.; et al. Tensorflow: A system for large-scale machine learning. In Proceedings of the 12th USENIX Symposium on Operating Systems Design and Implementation (OSDI 16), Savannah, GA, USA, 2–4 November 2016; pp. 265–283. [Google Scholar]
  56. Nebro, A.J.; Durillo, J.J.; Garcia-Nieto, J.; Coello, C.C.; Luna, F.; Alba, E. SMPSO: A new PSO-based metaheuristic for multi-objective optimization. In Proceedings of the 2009 IEEE Symposium on Computational Intelligence in Multi-Criteria Decision-Making (MCDM), Nashville, TN, USA, 30 March–2 April 2009; IEEE: Piscataway, NJ, USA, 2009; pp. 66–73. [Google Scholar]
  57. Clerc, M.; Kennedy, J. The particle swarm-explosion, stability, and convergence in a multidimensional complex space. IEEE Trans. Evol. Comput. 2002, 6, 58–73. [Google Scholar] [CrossRef]
  58. Hadka, D. Platypus—A Free and Open Source Python Library for Multiobjective Optimization. 2017. Available online: https://github.com/Project-Platypus/Platypus (accessed on 15 November 2023).
  59. Giustolisi, O.; Todini, E. On the approximation of distributed demands as nodal demands in WDN analysis. In Proceedings of the XXXI National Hydraulics and Hydraulic Construction Conference, Perugia, Italy, 9–12 September 2008. [Google Scholar]
  60. Giustolisi, O.; Laucelli, D. Water distribution network pressure-driven analysis using the enhanced global gradient algorithm (EGGA). J. Water Resour. Plan. Manag. 2011, 137, 498–510. [Google Scholar] [CrossRef]
  61. Sangiorgio, M.; Cananzi, D.; Weber, E.; Salazar, J.Z.; Castelletti, A. Surrogate modeling for water reuse planning in complex water systems. IFAC-PapersOnLine 2022, 55, 111–116. [Google Scholar] [CrossRef]
  62. Klise, K.A.; Murray, R.; Haxton, T. An Overview of the Water Network Tool for Resilience (WNTR); Sandia National Lab. (SNL-NM): Albuquerque, NM, USA, 2018. [Google Scholar]
  63. Giudicianni, C.; Herrera, M.; Di Nardo, A.; Greco, R.; Creaco, E.; Scala, A. Topological placement of quality sensors in water-distribution networks without the recourse to hydraulic modeling. J. Water Resour. Plan. Manag. 2020, 146, 04020030. [Google Scholar] [CrossRef]
  64. Sarrate, R.; Blesa, J.; Nejjari, F.; Quevedo, J. Sensor placement for leak detection and location in water distribution networks. Water Sci. Technol. Water Supply 2014, 14, 795–803. [Google Scholar] [CrossRef]
Figure 1. Flowchart of the overall procedure.
Water 16 01835 g001
Figure 2. Metamodel representation.
Water 16 01835 g002
Figure 3. Layout of the water network used in this study.
Water 16 01835 g003
Figure 4. Three solutions for sensor placement: 2, 5, and 8 monitored nodes.
Water 16 01835 g004
Figure 5. Pressure estimation error of the metamodel with 2 (a), 5 (b), and 8 (c) monitored nodes.
Water 16 01835 g005
Figure 6. Error distribution of the metamodel with 5 sensors.
Water 16 01835 g006
Table 1. Main information of a steady-state simulation of the case study.
Flow (l/s)Pressure (m)
mean30.84017.442
standard deviation53.2265.444
min0.31013.680
max261.88627.284
Table 2. Results of the sensors placement methodology.
Number of SensorsSensor SelectionRMSE (m)MAE (m)
1 P 6 0.1650.125
2 P 8 , P 9 0.1430.107
3 P 19 , P 9 , P 8 0.1290.098
4 P 12 , P 2 , P 15 , P 4 0.1260.095
5 P 18 , P 14 , P 23 , P 13 , P 3 0.1270.096
6 P 3 , P 7 , P 10 , P 11 , P 15 , P 8 0.1250.095
7 P 21 , P 11 , P 16 , P 3 , P 10 , P 8 , P 20 0.1230.0093
8 P 10 , P 8 , P 14 , P 15 , P 9 , P 23 , P 3 , P 19 0.1210.091
9 P 12 , P 3 , P 23 , P 9 , P 6 , P 2 , P 13 , P 16 , P 20 0.1190.090
10 P 20 , P 17 , P 9 , P 23 , P 13 , P 4 , P 14 , P 16 , P 10 , P 18 0.1180.089
11 P 22 , P 3 , P 16 , P 9 , P 5 , P 18 , P 13 , P 17 , P 14 , P 4 , P 23 0.1170.088
Disclaimer/Publisher’s Note: The statements, opinions and data contained in all publications are solely those of the individual author(s) and contributor(s) and not of MDPI and/or the editor(s). MDPI and/or the editor(s) disclaim responsibility for any injury to people or property resulting from any ideas, methods, instructions or products referred to in the content.