Article

Projection of Changes in Rainfall and Drought Based on CMIP6 Scenarios on the Ca River Basin, Vietnam

1
Department of Civil and Environmental Engineering, Kookmin University, Seoul 02707, Republic of Korea
2
Department of River Engineering and Disaster Management, Thuyloi University, Hanoi 100000, Vietnam
3
Department of Civil and Energy System Engineering, Kyonggi University, Suwon-si 16956, Republic of Korea
4
High Meadows Environmental Institute, Princeton University, Princeton, NJ 08544, USA
5
Climate and Air Quality Research Group, Korea Environment Institute, Sejong 30147, Republic of Korea
*
Author to whom correspondence should be addressed.
Water 2024, 16(13), 1914; https://doi.org/10.3390/w16131914
Submission received: 8 June 2024 / Revised: 23 June 2024 / Accepted: 2 July 2024 / Published: 4 July 2024
(This article belongs to the Section Water and Climate Change)

Abstract

:
In this study, future precipitation and drought in the Ca river basin, Vietnam, were projected based on an ensemble of 27 CMIP6 models for four climate change scenarios. The impact of climate change on precipitation and drought was investigated. Monthly precipitation observation data were adjusted using the bias correction method. To detect drought events, the Standard Precipitation Index (SPI) was employed. Changes in drought were assessed using SPI3, SPI6, and SPI12. Although the amount of annual total precipitation slightly increased, the drought events may become more severe. There is a high likelihood of increased drought intensity and severity in Vietnam due to climate change. The frequency of droughts is likely to change depending on the location and climate change scenario. We found that the frequency and severity of droughts may be altered depending on the window size of SPI. The short-term drought events will be more frequent and severe, and long-term drought events will become more severe in the Ca river basin.

1. Introduction

Climate change is leading to significant changes in the intensity, frequency, and amount of rainfall in Vietnam [1,2,3]. To mitigate the adverse effects of these rainfall changes on human life, it is critical to project future changes in rainfall driven by climate change [4,5,6]. Drought is one of the disasters with adverse effects, including socio-economic damages, in Vietnam [7]. Sutton, et al. [8] reported that most parts of Vietnam have experienced severe droughts since the 1997–1998 El Niño event. This includes the Red River Delta, the South–Central region, southern Vietnam, and the Central Highlands. The 1997–1998 drought damaged 120,000 ha of farmland and cost 445 million US dollars. Several studies have been conducted to investigate drought characteristics in Vietnam [9,10,11,12]. These studies have only assessed the impact and characteristics of drought events in the past. For future planning in agricultural adaptation and water resource management, it is essential to understand the possible future changes in the various characteristics of drought events in Vietnam.
The long-term future climate changes may be difficult to project based on the observed data sets. Climate change scenarios have been suggested to assess changes in the phenomena of interest and their impact [13]. A number of studies have made an attempt to project the changes in rainfall, heavy rainfall, flood, and drought [14,15,16,17]. Some studies have investigated the changes in rainfall events using climate change scenarios in Vietnam [18,19,20,21]. Li, et al. [22] examined the impacts of climate change on the future of the Standard Precipitation Evapotranspiration Index (SPEI) and the temporal trend of the dry-season Standard Precipitation Index (SPI) in the Mekong River Basin. The results reported that droughts will, generally, reduce in the future over most of the study area. Nguyen-Ngoc-Bich, et al. [23] projected drought characteristics based on the Palmer drought severity index using the Coordinated Regional Climate Downscaling Experiment (CORDEX)—Southeast Asia project. They showed that substantial increases in drought duration, severity, and intensity, and decreases in the inter-arrival time, are found over the Red River Delta, northern parts of the North Central sub-region, parts of the Central Highlands, and over southern Vietnam.
Recently, Coupled Model Intercomparison Project Phase 6 (CMIP6) climate change scenarios released [24,25,26]. Different scenarios that account for the uncertainty and diversity of human development pathways are needed to project the possible future impacts of climate change. The Shared Socioeconomic Pathways (SSPs) are a set of five narratives that depict alternative futures of social, economic, and environmental changes in the world. They serve as inputs for CMIP6, which is a framework for coordinated climate model experiments and assessments. Each SSP has a different set of assumptions about population growth, urbanization, economic development, energy use, land use, and environmental policies. Consequently, it becomes imperative to project and analyze spatial and temporal changes in Vietnam’s rainfall events using these advanced CMIP6 climate change scenarios.
Dong, et al. [27] investigated the seasonal characteristics of drought in the Lancang-Mekong River Basin (LMRB) under future climate projections using CMIP6. They showed that the LMRB tends to experience a wetter wet season and a drier dry season with the rising temperature considered based on SPEI, while the temporal trend of dry-season SPI is not significant. They provided large-scale changes in drought characteristics such as duration, severity, and intensity. Because the changes in the drought characteristics may help understand the regional scale, projecting the drought events for the finer scale may be needed in planning future policies on a regional scale.
The precipitation simulation needs to be adjusted using the bias correction method to deal with biases. To evaluate the effects and changes in future precipitation based on projection data, it is necessary to apply the bias correction method. Trinh-Tuan, et al. [28] investigated the influence of applying the bias correction method in future projections of precipitation simulated using CMIP6 models. They found that the application of the bias correction method drastically reduced errors in precipitation simulation data.
There are very few studies analyzing the characteristics of drought in Vietnam using CMIP6 scenarios. Future projections based on climate change scenarios are inherently fraught with considerable uncertainty. To mitigate this uncertainty, it is essential to employ a multi-model ensemble approach. Nevertheless, previous studies have utilized a limited number of ensembles. While the spatial resolutions of most CMIP6 models are appropriate for analyzing drought characteristics over large areas, leading to numerous analyses targeting Vietnam as a whole, there is a need for future projections focused on smaller areas for effective water resource policymaking. To facilitate the assessment of local characteristics, the application of bias correction methods is indispensable.
Previous studies on drought projection in Vietnam have certain limitations. These include the use of a limited number of CMIP6 models, projections made without bias correction methods, and the lack of an in-depth analysis of local characteristics. In order to gain a deeper understanding of the potential changes in future droughts as a result of climate change, it is essential to conduct an analysis of the region’s future drought characteristics while considering the previously mentioned limitations.
Hence, this study aims to investigate spatial and temporal changes in rainfall events in the Ca river basin in Vietnam using the climate change scenarios from CMIP6, applying the bias correction method. An ensemble of 27 CMIP6 models for climate change scenarios simulation data was collected. Four climate change scenarios such as SSP126, SSP245, SSP370, and SSP585 were chosen. The biases in the monthly precipitation simulation data from 27 models for four scenarios were adjusted using the Quantile Delta Mapping (QDM) method. SPI was employed as a drought index for detecting drought events. The changes in annual and seasonal precipitation were investigated. In addition, the characteristics of drought events were projected and the changes of them were assessed. To the best of our knowledge, this is the first study to apply a massive number of CMIP6 model outputs with the use of bias correction in the specific watershed (Ca river basin) in Vietnam. The current study will contribute to planning the long-term water resource strategies and policy in the Ca river basin. As a result, the findings of the current study may help to reduce the socio-economic losses from future drought in the studied basin. Moreover, this can be a good reference in the future drought forecast in Vietnam.

2. Materials and Methods
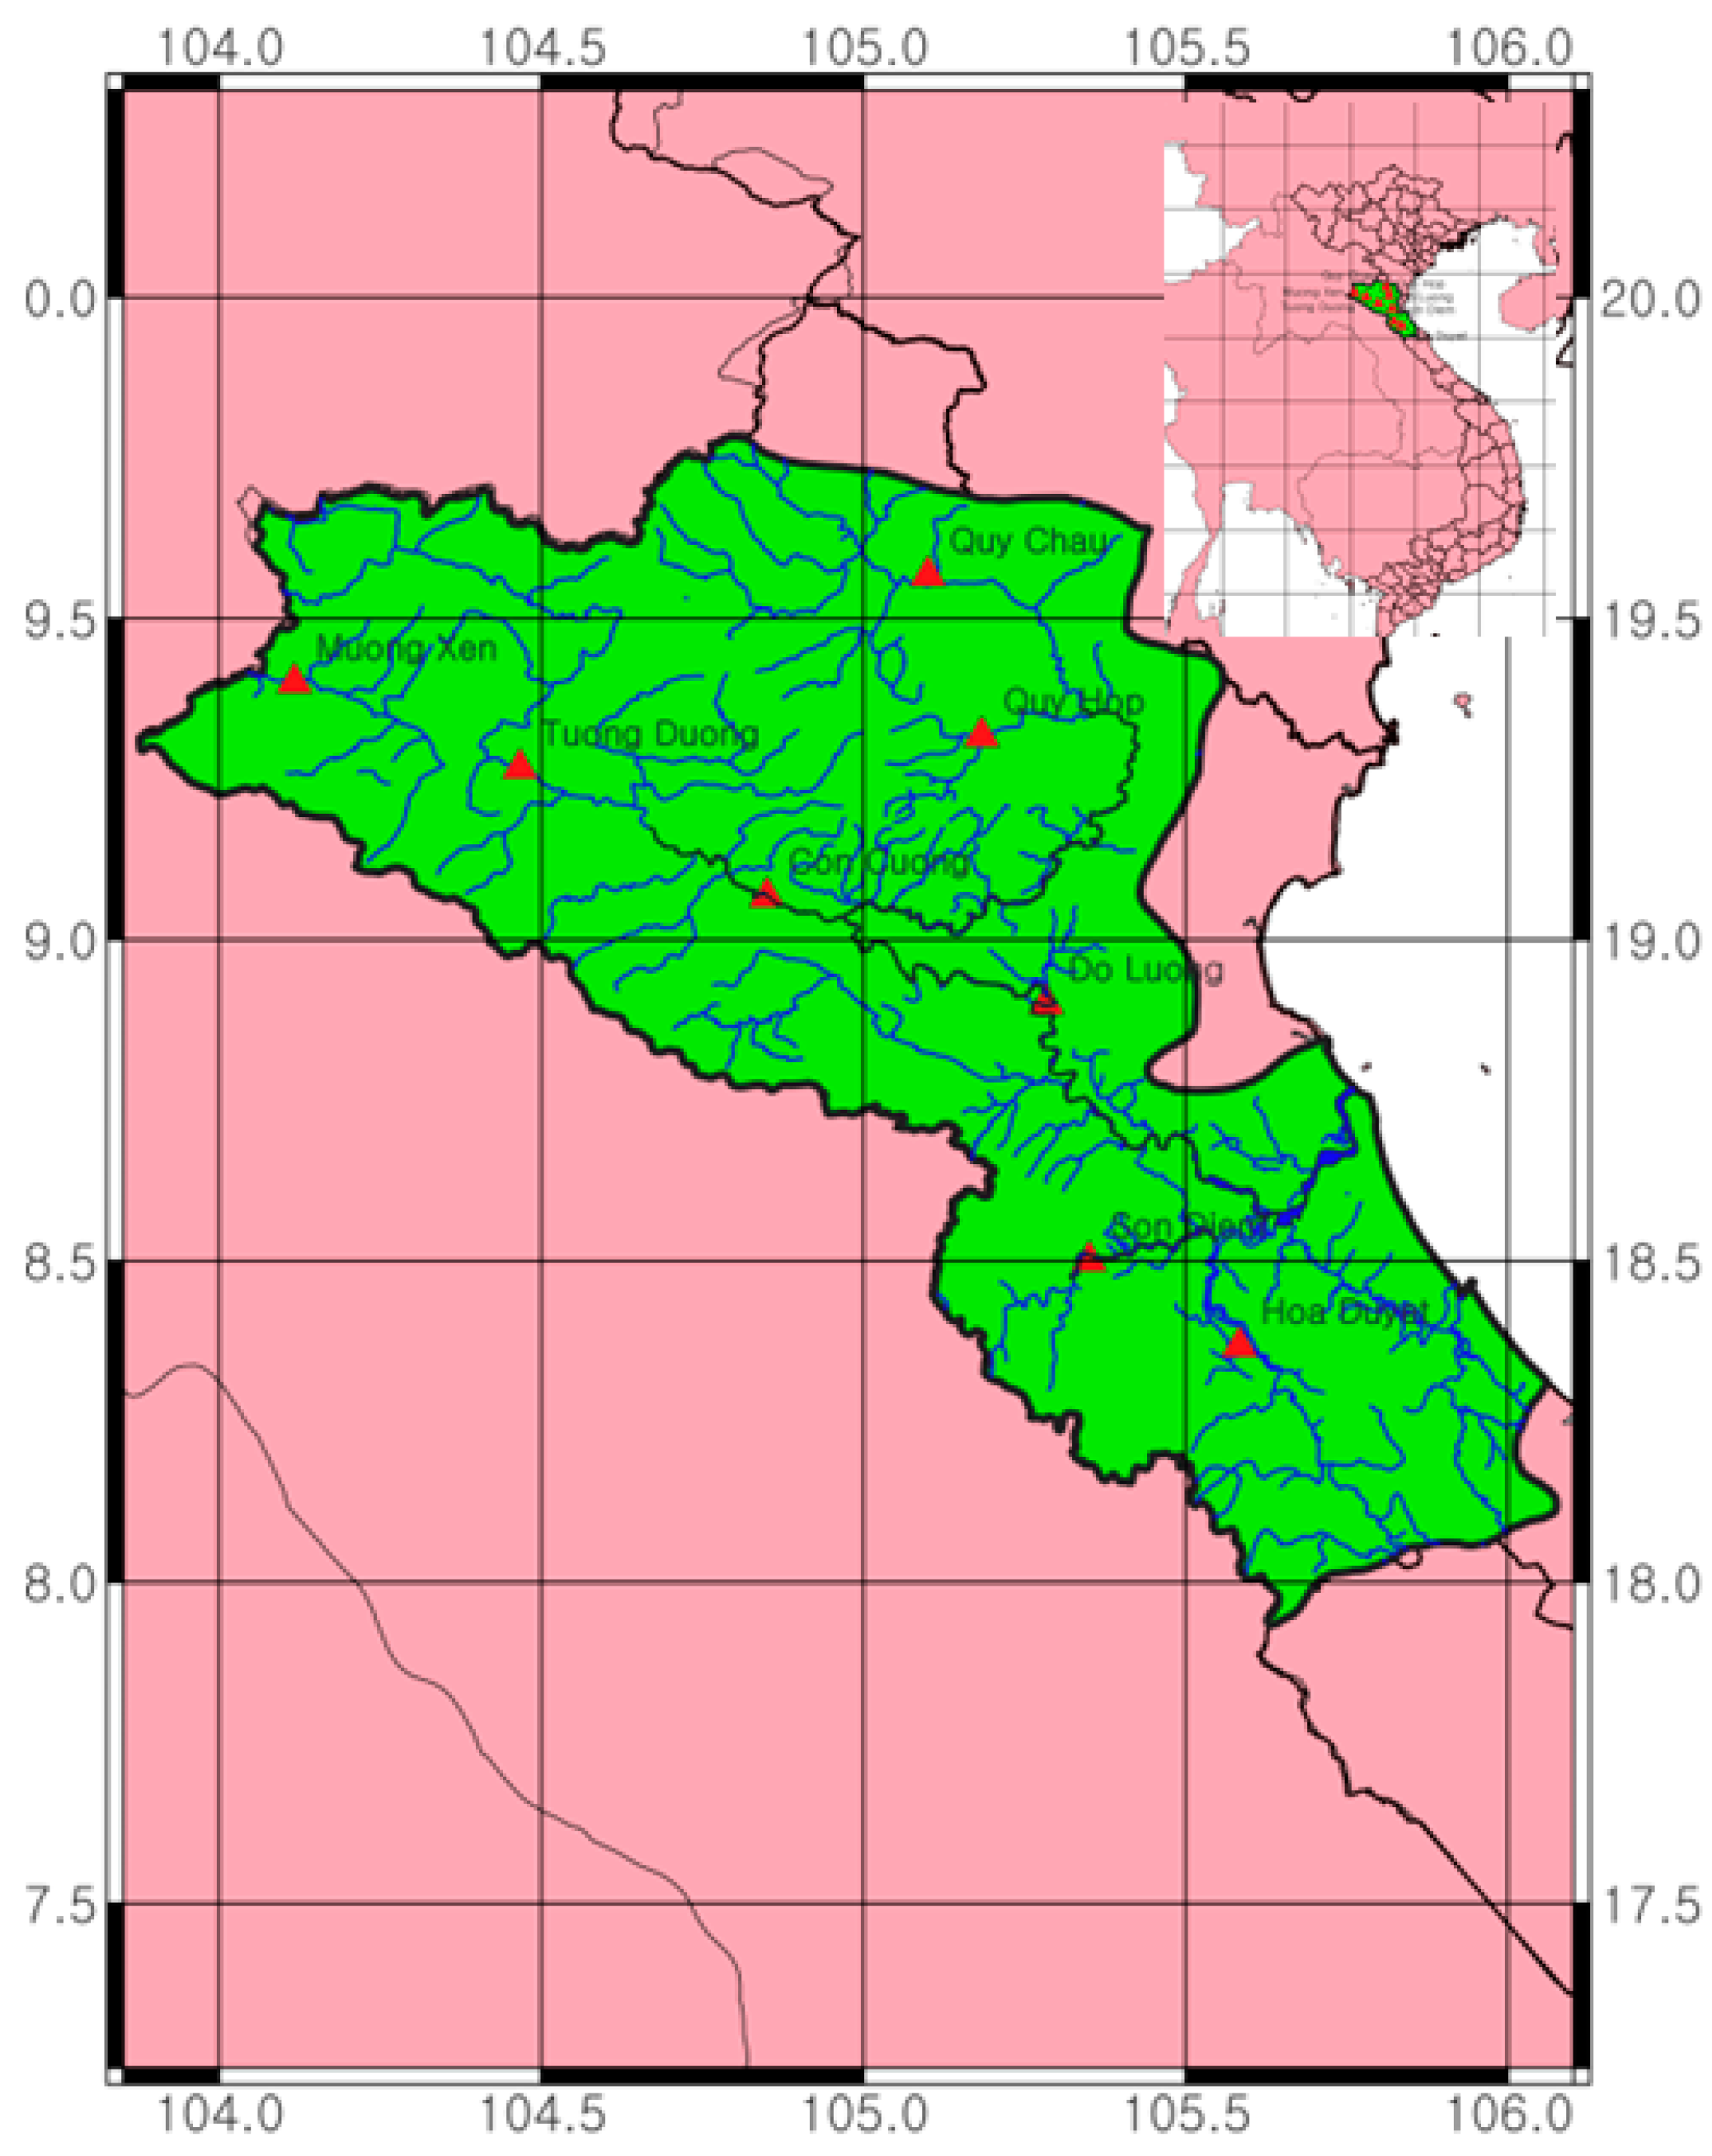
2.1. Study Area

The Ca river is one of the large basins located in North–Central Vietnam, with a length of 531 km and an area of 27,200 km2. The Ca river originates from Mt. Muong Khut, and Mt. Muong Lap (1800–2000 m) flows northwest to southeast and then flows into the East Sea through the mouth of the Cua Hoi River. The Ca river basin is in the north of central Vietnam, with 18°15′–20°10′30″ N 103°45′20″–105°15′20″ E. The start and end of the dry season are not the same throughout the Ca river basin. The upper Ca river starts to dry from November until the following May, which is similar to the dry season for northern rivers. In the middle reaches of the Ca river, the dry season starts again in late November and early December and ends in late July and early August. Low flows are very unevenly distributed throughout the basin from the upper Ca river to Yen Thuong, with the smallest low flows usually occurring in March. Figure 1 presents the geographical location of the Ca river basin.

2.2. Data

2.2.1. Observed Monthly Rainfall Data

The locations of the rain gauge stations are presented in Figure 1. Additionally, the location and data availability period are stated in Table 1. Observed monthly precipitation across the Ca river basin presents a large spatial variation. The Muong Xen station, located in the northwest, along with the Do Luong, Son Diem, and Hoa Duyet stations, located in the southeast, had an average rainfall exceeding 500 mm during the months of September and October. Conversely, the locations of Tuong Duong, Con Cuong, Quy Chau, and Quy Hop present a more uniform distribution of rainfall from May to October.
In Figure 2, The intra-annual monthly rainfall of the Ca river basin presents dichotomous patterns. The summer months (JJA) and autumn (SON) are characterized by a predominance of rainfall, marking them as a rainy season. In contrast, the winter (DJF) and spring (MAM) periods are noticeably drier and are considered the dry season. The classification of November is vague, as it could feasibly be included in either the dry or wet season, depending on the specific location. To maintain analytical consistency in the current study, November is incorporated into the autumn season and is thus considered part of the rainy season.
Table 2 presents the duration, severity, and intensity of the drought event based on SPI during 1997/98, which is one of the most severe drought events in Vietnam. The definition of drought events and their properties are described in Section 2.4. When the window size of SPI increases, the severity increases. Based on the intensity, overall, the drought events based on SPI6 have the largest intensity, albeit not for every station. The largest values of duration and severity are observed in SPI12. Based on SPI12, the drought event during 1997/98 continued longer than one year. Their intensities also were large.

2.2.2. Climate Change Scenario Data

Rainfall simulation data based on climate change scenarios were applied using simulation data from the Scenario Model Intercomparison Project (ScenarioMIP) of CMIP6. A total of 27 models were implemented, and monthly rainfall simulation data produced by these models were used. The CMIP6 models used in the current study are presented in Table 3.
For projecting changes in precipitation and drought in the Ca river basin, Vietnam, the current study employed four SSP-RCP scenarios: SSP1-RCP2.6 (SSP126), SSP2-RCP4.5 (SSP245), SSP3-RCP7.0 (SSP370), and SSP5-RCP8.5 (SSP585). The SSP126 scenario indicates a low-emission scenario with rapid and inclusive development, low environmental impacts, and limited warming to below 2 °C by 2100. The SSP245 scenario represents a medium-emission scenario with gradual and balanced development, some environmental progress, and stabilized warming at about 3 °C by 2100. The SSP370 indicates a high-emission scenario with slow and uneven development, increased conflicts and degradation, and warming of about 5 °C by 2100. The SSP585 scenario means a very high-emission scenario with rapid and unequal growth, high energy demand and emissions, and warming of about 6 °C by 2100. The future climate change simulation period was from 2016 to 2100, and it was divided into three periods—near future (P1: 2016–2040), future (P2: 2041–2070), and distant future (P3: 2071–2100)—for analysis. All used outputs of 27 CMIP6 models for four scenarios were interpolated into the domain, and the resolution of NIMS-UKESM had the finest spatial resolution using bilinear interpolation. The spatial resolution of NIMS-UKESM is around 25 km.

2.3. Bias Correction Methods

Climate model outputs intuitively have biases to the observed meteorological data [53,54]. To attenuate the biases in the climate model outputs, various bias correction methods have been studied and suggested [55]. The quantile mapping (QM) method is one of the most common methods for correcting the biases [56,57]. Particularly, this method has shown good performance in reducing biases in climate change scenarios [58,59]. Thus, the QM method is employed as the bias correction method for the climate change scenarios in this study.

2.3.1. Quantile Mapping Method

QM is a method used for bias correction in climate model data by comparing the Cumulative Distribution Function (CDF) of model outputs with observational data. The general formula for the QM method can be defined as follows:
x ^ m , p t = F 1 o , h F m , h x m , p t ,
where x ^ m , p t and x m , p t represents the monthly precipitation corrected by QM and monthly precipitation simulated from the climate model at time t in the simulation period, respectively. F 1 o , h and F m , h represent the inverse function of the CDF from the observational data and the CDF of the raw data from the climate model, respectively.

2.3.2. Quantile Delta Mapping Method

QDM is an approach that considers the trend inherent in the original data within the QM method by incorporating a delta (Δ) value. The QDM method can be represented as follows:
x ^ m ( t ) = x ^ o , m ( t ) · m ( t )
where the x ^ m ( t ) represents the bias-corrected value over time (t) and is calculated using the bias-corrected climate model data (m), using observational values (o) and the QM method. x ^ o , m ( t ) indicates the bias-corrected values for the historical period. m ( t ) indicates the long-term trend of climate change scenario data in the QDM method. m t can be calculated using the following equation.
m t = x m , p t F m , h 1 F m , p t x m , p t
where h and p represent the historical period and the projection period, respectively. The scenario data are classified as Reference (1979–2014), P1 (2015–2040), P2 (2041–2070), P3 (2071–2100); therefore, the period of the scenario data is the same for all points, and the observed data are applied differently depending on the data period of each point. In this study, the MBC library in R language was used to carry out the quantile delta mapping method [60]. The schematic diagram of QDM is presented in Figure 3.

2.4. Standardized Precipitation Index

SPI was developed in recognition of the varying impacts that rainfall deficits have on groundwater, reservoir storage, soil moisture, snow cover, and river discharge [61,62]. SPI is typically set with window sizes of 3, 6, and 12 months, assessing precipitation deficits for specific intervals to determine the effects of drought on different water sources. SPI, calculated for time scales, can be applied diversely depending on the area of interest. Since the calculated SPI introduces a probability distribution, it can determine not only the current drought but also the probability of rainfall needed to end the drought, proportionate to the rainfall deficit linearly. Drought events can be determined based on the SPI value. A drought event is determined by consecutive months that had an SPI value less than the given threshold, which is −1 in this study [63,64]. This value was employed as the value of the threshold in the current study. Duration, severity, and intensity indicate the number of consecutive months of a given drought event, the absolute value of a sum of the SPI value deducted by a negative one, and the mean of severity over the duration, respectively. A period is evaluated as a drought if its duration is one month or longer. Values of SPI are calculated based on bias-adjusted rainfall data from 27 CMIP6 models.

3. Results

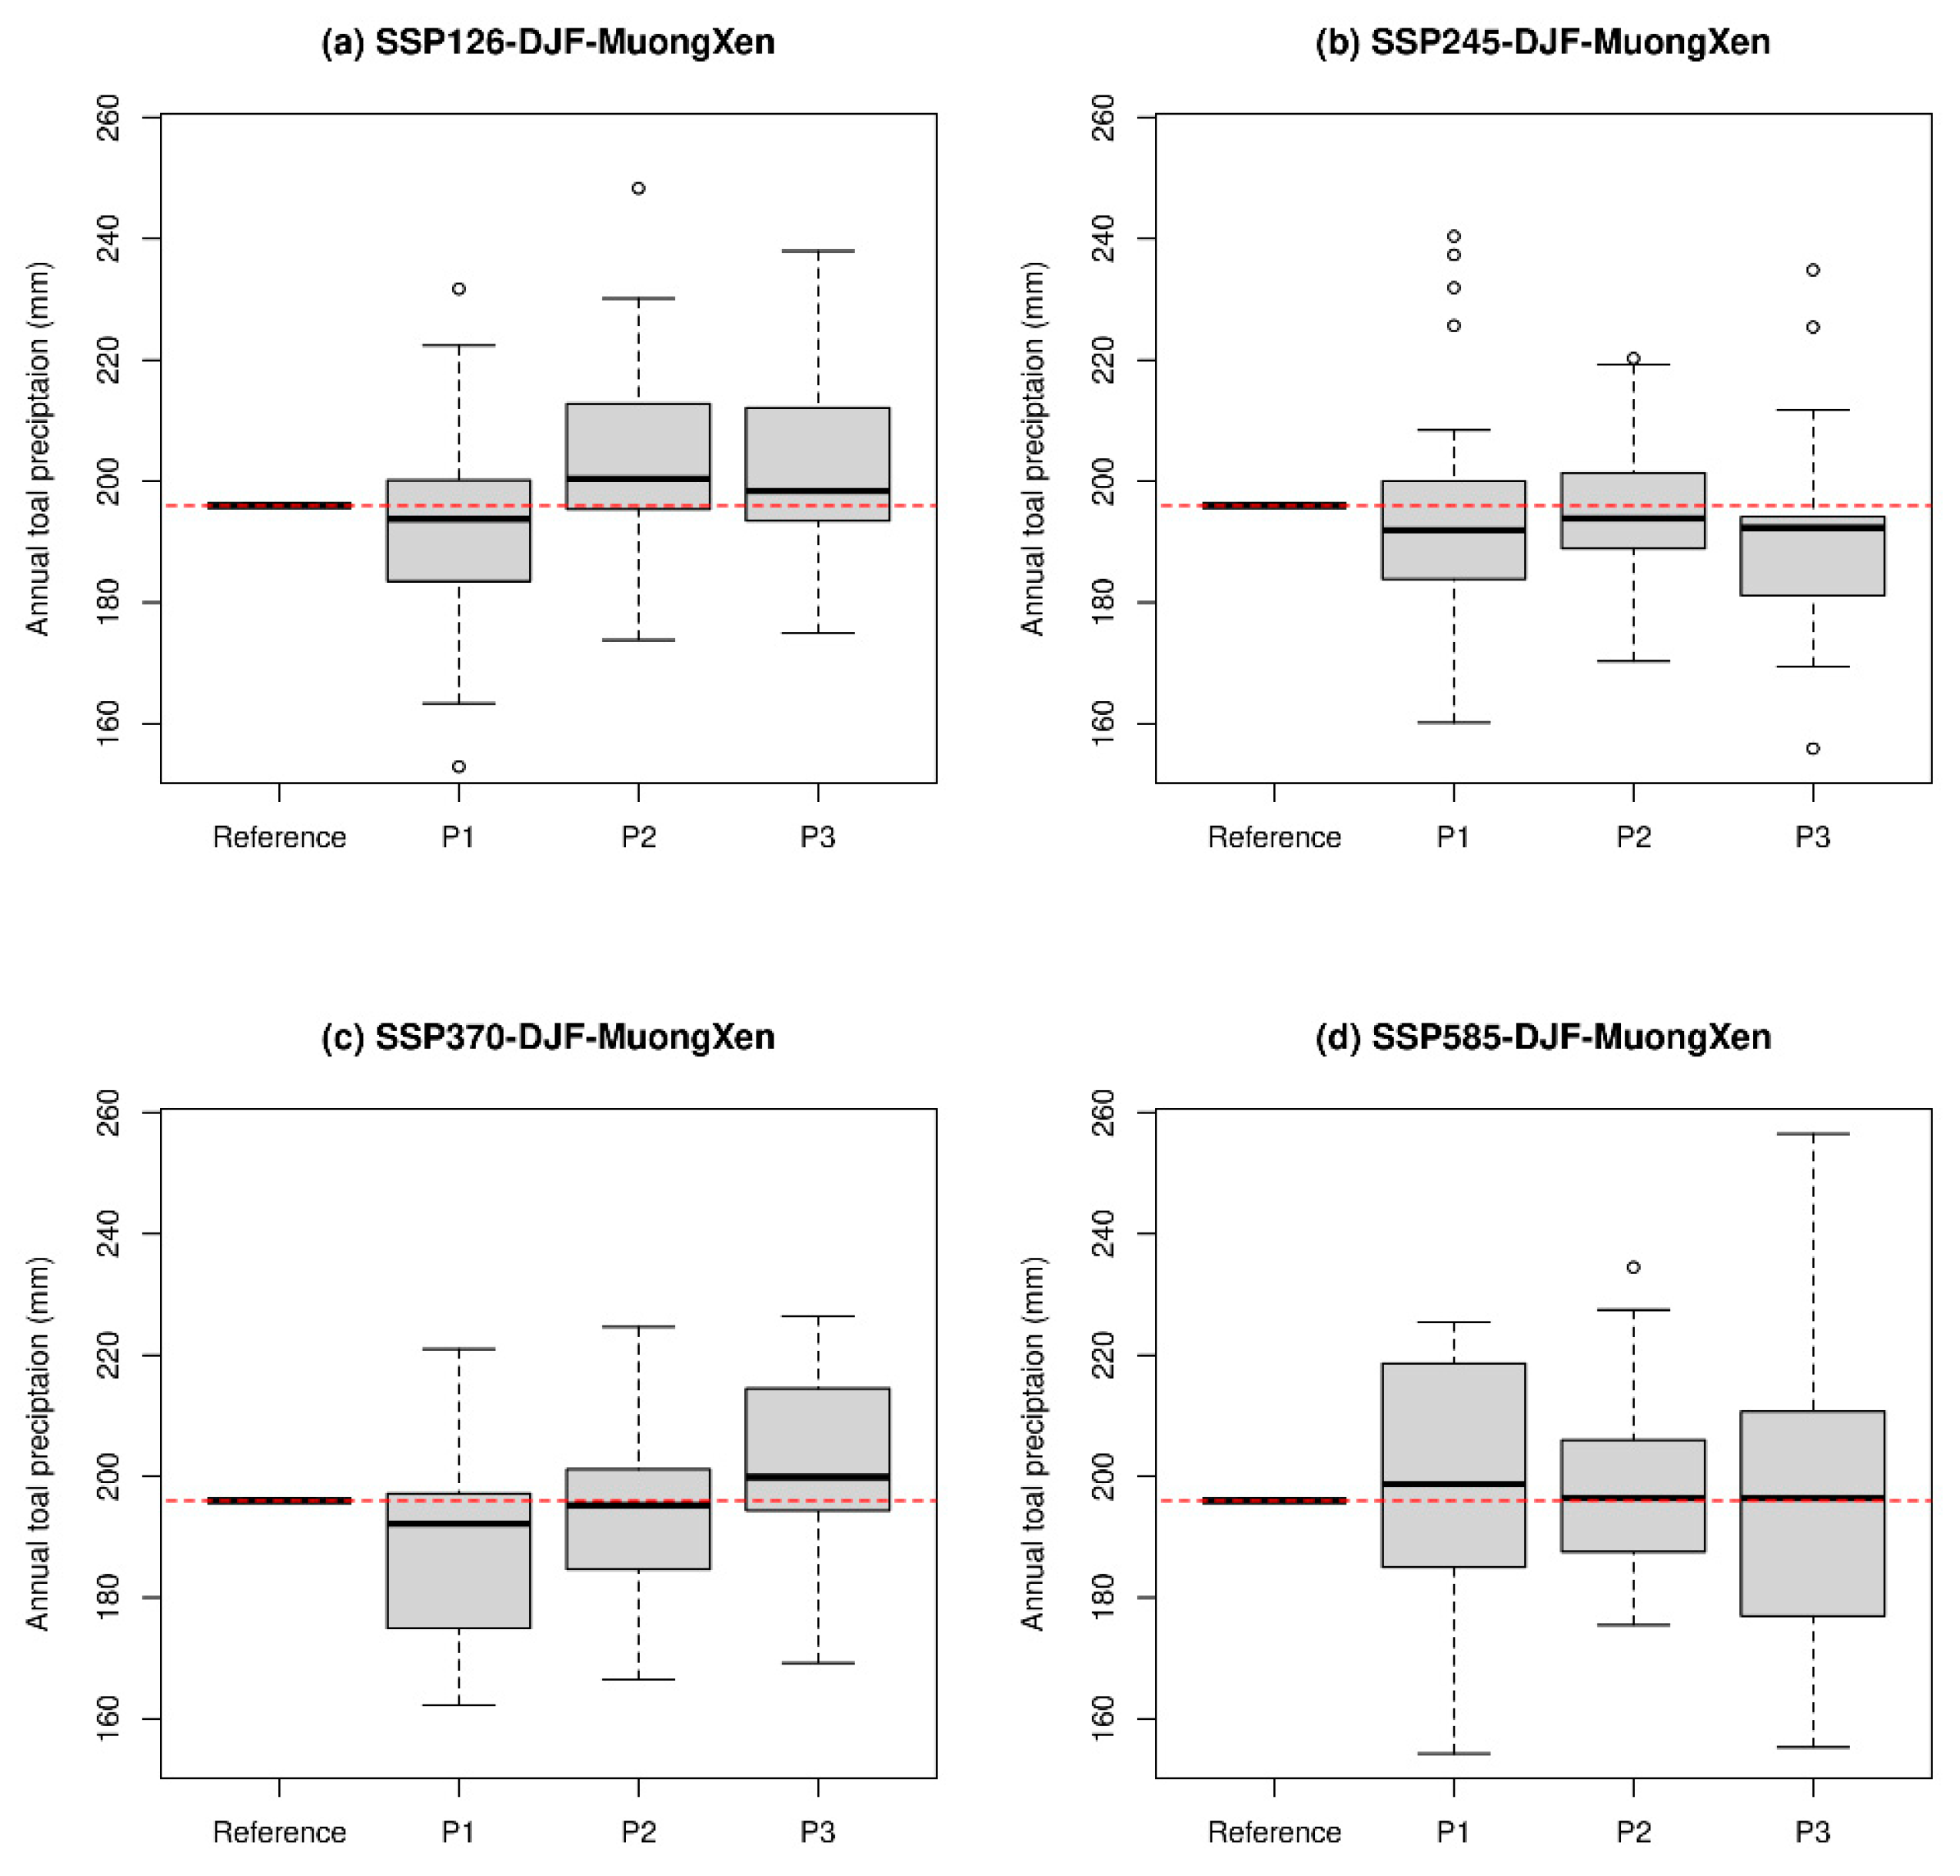
3.1. Projection of Annual and Seasonal Precipitation Changes in Ca River Basin

Utilizing data from 27 CMIP6 climate change scenario models, we examined the changes in annual rainfall at eight rain gauge stations within the Ca river basin. The future projections of monthly precipitation for the eight stations were extracted from the CMIP6 climate change scenarios, and the QDM method was applied to map the monthly precipitation simulation data and observation data. The bias-corrected monthly precipitation simulation data for eight stations were obtained. These bias-corrected data were used to calculate annual total precipitation and seasonal precipitation.
Figure 4 presents the annual total precipitation changes at Muong Xen station based on climate change scenarios from 27 CMIP models. The results were analyzed based on three periods—near future (P1: 2016–2040), future (P2: 2041–2070), and distant future (P3: 2071–2100). The results show that the total annual rainfall tended to increase in the far future for all sites, and the uncertainty of the data increased with the far future simulation. Based on the median values, Muong Xen, Con Cuong, Do Lung, and Son Diem stations show a trend of decreasing annual maximum rainfall in P1 and increasing rainfall values over time. For Tuong Duong, Quy Chau, and Quy Hop, the median value does not decrease from P1 and continues to increase over time. Even in the same river basin, there are large differences in rainfall at different locations. Muong Xen has the largest annual rainfall value and Tuong Duong has the smallest annual rainfall value.
The analysis of seasonal rainfall was conducted for spring (March, April, May: MAM), summer (June, July, August: JJA), autumn (September, October, November: SON), and winter (December, January, February: DJF). Figure 5 shows the seasonal precipitation of MAM (spring) changes at Muong Xen station. The spring rainfall exhibits different change trends across the climate change scenarios, unlike the annual rainfall data. For SSP126, the rainfall decreases in P1, increases in P2, and decreases again in P3, resulting in a lower rainfall than present except for the P2 period. For SSP245 and SSP370, the rainfall is lower than present, and, for SSP585, the rainfall is lower in P1 and P2 but higher in P3 than present. The uncertainty of the model is found to increase as the simulated data projected the distant future in all scenarios. In the case of summer rainfall, the pattern of change is very different between stations. In the case of SSP126, rainfall tends to increase over time. In the case of SSP245, there is no change at some stations, an increase at some stations, and a decrease at some stations, making it the most variable scenario by region. SSP370 and SSP585 show the same trend. Figure 6 presents the seasonal precipitation changes of SON (autumn) at Muong Xen station. In the case of fall rainfall, the pattern of change is similar for each location, but the median value is different. Rainfall tended to increase over time regardless of the climate change scenario. The autumn season is a representative rainy season in Vietnam, and it is believed that the increase in annual rainfall is caused by the increase in autumn rainfall. There are many stations where the rainfall in the P1 period is lower than in the historical period. However, depending on the station, there are also stations where there is no or very small decrease in P1.
Figure 7 shows the seasonal precipitation changes of SON (autumn) in Muong Xen station. The change patterns of winter precipitation differ depending on the location, but they exhibit no considerable change in general. The variations of winter precipitation are contingent on the climate change scenarios. SSP126 shows a marginal increase trend. SSP245 presents a declining trend in numerous locations. SSP370 and SSP585 demonstrate no change or a marginal increase trend depending on the period.

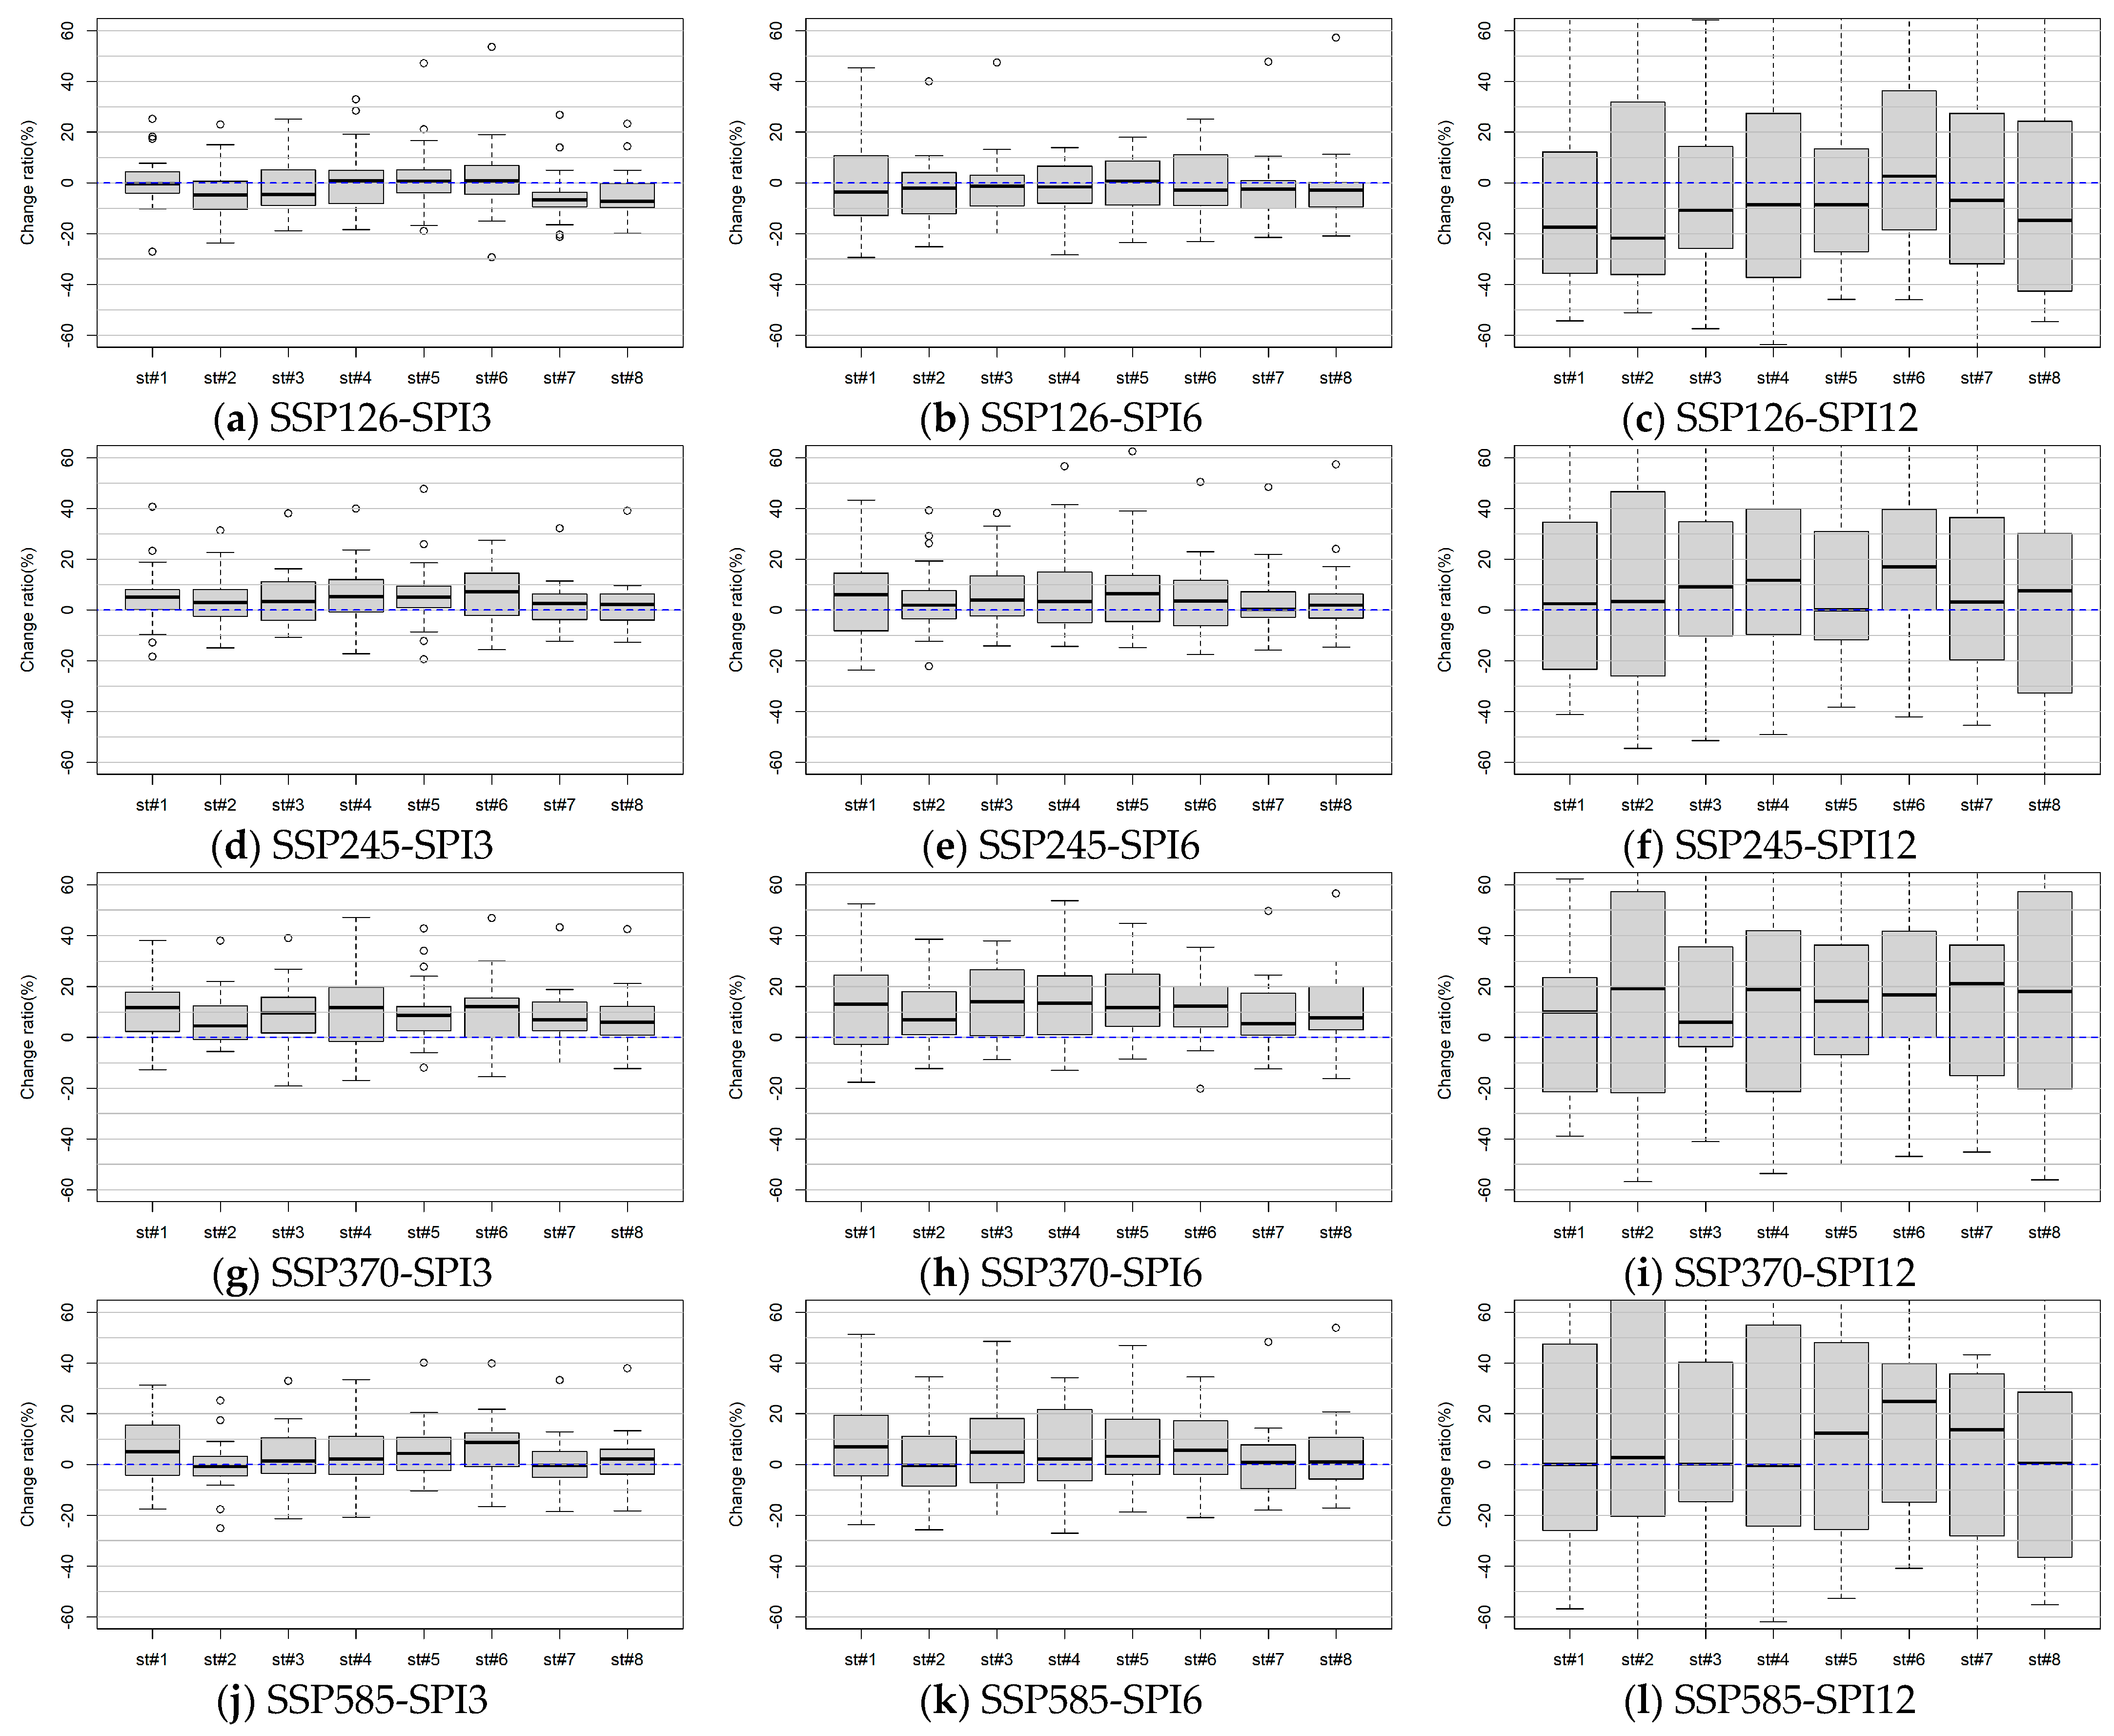
3.2. Projection of Drought Event Changes Based on SPI in Ca River Basin

Since drought events have long durations, they can exist for more than one year. Therefore, the analysis was carried out for the entire future period without looking at the changes in drought according to P1, P2, and P3. The changes in the frequency of drought events per year for SPI3, SPI6, and SPI12 based on the four scenarios of SSP126, SSP245, SSP370, and SSP585 from the 27 CMIP models are shown in Figure 8.
The change ratio indicates the ratio of a numeric value, e.g., frequency, severity, and intensity, from future scenario simulation over that from historical simulation. Overall, the frequency of drought events increases for SPI3 and SPI6 while the number of drought events for SPI12 slightly decreases. The values of the change ratios for three SPIs such as SPI3, SPI6, and SPI12 are 2.7%, 1.55%, and −0.42%, respectively. These findings suggest that the Ca river basin may experience more frequent drought events for short durations. The changes in the frequency of drought events for each station vary depending on the applied SPI and climate change scenarios. For SPI3, the frequency of the drought event per year for station #7 has a very slight decrease (−0.2%), and station #8 has a very slight increase (0.5%). The number of drought events per year for stations #2, #3, and #4 also increased slightly (1–2%). The frequency for stations #1, #5, and #6 increased by 8.8%, 3%, and 5.5%, respectively. Although the number of drought events per year varies with the employed climate change scenarios, overall patterns have not been observed. The mean values of change ratios in the frequency of drought events per year for the employed four climate change scenarios such as SSP126, SSP45, SSP370, and SSP585 are −2.5%, 0.2%, 7.8%, and −0.4%, respectively. The frequency of drought events per year changes depending on the four climate change scenarios but there is no clear pattern. The average changes in the frequency of drought events per year for the four climate change scenarios used (SSP126, SSP45, SSP370, and SSP585) are −2.5%, 0.2%, 7.8%, and −0.4%, respectively.
The changes in mean values of severities per drought event for SPI3, SPI6, and SPI12 based on the four scenarios of SSP126, SSP245, SSP370, and SSP585 from the 27 CMIP models are shown in Figure 9. The future drought events in the Ca river basin will be more severe according to the climate change scenarios used. The larger the window size of SPI, the higher the change ratio in the drought severity. The severity for SPI3, SPI6, and SPI12 is expected to increase by 1.6%, 3.8%, and 5.2% on average, respectively. These results indicate that the Ca river basin will likely face more severe drought events in the future, especially for the long-term ones. For SPI12, the average drought severity drops slightly by −0.5% at station #8 and rises slightly by 2.6% at station #4. It rises more at stations #3 and #7, by 4.4% and 3.8%, respectively. Stations #1, #2, #5, and #6 show increases higher than 5%, with station #6 having the biggest increase of 15.4%.
The increases in the mean values of drought severity are observed except for the SSP126 scenario. The mean values of change ratios for the employed four climate change scenarios such as SSP126, SSP45, SSP370, and SSP585 are −1.7%, 4.2%, 7.7%, and 4.0%, respectively. In general, the SSP370 scenario presents the worst drought situations for the Ca river basin. In the SSP370 scenario, the average values of severity for all the SPIs and stations used are positive. These results suggest that the drought events become more intense in the Ca river basin. The highest rise in the severity changes of drought events is 21.6%, and it occurs at station #6 for SPI12 with SSP585.
The changes in mean values of intensities per drought event for SPI3, SPI6, and SPI12 based on the four scenarios of SSP126, SSP245, SSP370, and SSP585 from the 27 CMIP models are shown in Figure 10. The intensities of the drought events in the Ca river basin increase in the future based on Figure 10. The drought intensity varies more with a bigger window size of SPI. The average change ratio for SPI3, SPI6, and SPI12 is projected to be 3.9%, 5.7%, and 11.5%, respectively.
The mean change ratios in the intensity of drought events for the four climate change scenarios (SSP126, SSP45, SSP370, and SSP585), are −0.5%, 7.6%, 12.9%, and 8.2%, respectively. Like the results shown in the severity change, the SSP370 scenario presents the most intensive drought situations for the Ca river basin. In the SSP370 scenario, the mean values of intensity for all the SPIs and the stations are larger than 10%. The highest increment in the intensity of drought events is 15.5%, and it occurs at station #6 for SPI6 with SSP370. The mean values of the number of events, duration, and severity of drought events based on SPI3 for the used scenario are depicted in Table 4. The general results of Table 4 are similar to the aforementioned results.

4. Discussion

Annual total precipitation on the Ca river basin may increase in the future based on all used CMIP6 climate change scenarios. If the annual total precipitation increases, one will usually expect to see less frequent and severe drought events and more frequent and intense heavy rainfall events. This study yielded results that were different from the expectations. Intra-annual variability of precipitation in the Ca river basin could increase in the future based on the results of projecting future seasonal precipitation from the CMIP6 climate change scenarios. Overall, decreases in MAM precipitation were projected while the projection results led to the increases in SON precipitation expected for the P1 period. Though there were fluctuations in the projected DJF and JJA precipitation, the magnitudes of deviation were small compared to the deviations in the projected MAM and SON projections. These results lead to the inference that the intra-annual variability of precipitation in the Ca river basin probably increases in the future. Eventually, the amount of precipitation during dry seasons, including MAM and DJF, becomes scarcer; meanwhile, during rainy seasons, including JJA and SON, it will be more plentiful. Subsequently, the increment in the intra-annual variability led to an increase in the frequency and magnitude of flood and drought events in the Ca river basin.
This study did not conduct an analysis of the floods; therefore, their magnitude of increase can be evaluated as the result of the current study. However, the fundamental results that can help us gauge the future influence of climate change on meteorological drought were obtained and can be inferred from the results. The study results showed an increase in the frequency and severity of droughts based on the SPI for a short period. A potential explanation for why the drought events based on the SPI3 are more frequent and intense is that the precipitation reductions may not last for more than one season. The results of seasonal precipitation projection showed that precipitation in the MAM season is the only one that decreases, while the other seasons may have increased or small changes in seasonal precipitation. Thus, the drought frequency would not change much or even decline when SPI with a window size longer than three months was employed.
The results showed that as the window size of SPI increased, the frequency of drought events decreased, but the severity of drought events also increased as the window size of SPI increased. In the situation where the annual precipitation increases, decreases in the frequency of drought occurrence based on SPI12 and SPI6 were observed in the results of the projection while the severity of drought events increased. These results suggest that very large drought events occurred during a specific period in the simulation period. It is essential that there is a high probability of mega-drought events in the Ca river basin due to climate change.
The results and findings in the current study are like the previous studies for drought projection in Vietnam [23,65]. In their studies, the MAM precipitation in the future decreased while the SON precipitation increased. The two studies employed observed data in ground gauge stations in bias corrections. Tran-Anh, Ngo-Duc, Espagne, and Trinh-Tuan [65] reported that the severity of drought events in the regions in which the Ca river basin will increase in the future based on CMIP5 climate change scenarios. Dong, Liu, Baiyinbaoligao, Hu, Khan, Wen, Chen, and Tian [27] projected future changes in the characteristics of drought events under climate change scenarios from CMIP6. Because the results focus on the LMRB, we are unable to compare the results of our analysis. Because the results of the current study are similar to others, even after the application of different climate change scenarios, the projection results of the current study may be reliable.
Based on the results of the current study, the window size of SPI had a significant impact on the uncertainty of the simulation. For the bias-corrected monthly precipitation of the simulation results for the historical period, the deviations for the mean, variance, skewness, and kurtosis were below 0.5%. We validated that the bias correction method was effective. The increase in uncertainty might be attributed to the different patterns of long-term serial dependence of monthly precipitation among CMIP6 climate models. Since drought is a phenomenon that spans over a long period, it is essential to consider how to adjust the bias in long-term serial dependence if it occurs. However, for the future scenario simulation, the climate had changed; thus, there was a possibility that the long-term serial dependence changed. Therefore, adjusting the long-term serial dependence in the simulated data can spoil the projection results. The authors believe that more discussion is required on this part through follow-up studies.
In this study, the return period approach has not been employed in assessing the risk of drought events. Although the duration and severity of the drought events can be used to assess drought risk, this has a limitation that is unable to consider two variables simultaneously. The return period of joint probability between duration and severity would be a good option to account for quantifying drought risk. Hence, joint probability and conditional probability for the condition of interest in drought events should be estimated using multivariate frequency analysis.

5. Conclusions

This study examined how monthly rainfall in the Ca river basin, Vietnam, changed over space and time under CMIP6’s climate change scenario. It projected changes in monthly precipitation in the Ca river basin using data from 27 CMIP6 climate change scenario models. It used bias-corrected monthly precipitation simulation data for eight stations. For projecting changes in drought characteristics, SPI3, SPI6, and SPI12 were calculated using the bias-corrected monthly precipitation. The main findings of this study were as follows:
(1)
Intra-annual variability of precipitation in the Ca river basin could increase in the future. The increment in the intra-annual variability can increase the frequency and magnitude of flood and drought events in the Ca river basin. An increase in total annual rainfall in the far future for all stations was projected, with uncertainty increasing with the far future simulation. Seasonal rainfall analysis showed different change trends across the climate change scenarios. MAM precipitation will decrease while SON precipitation will increase.
(2)
The short-term drought events will occur more frequently in the Ca river basin. An increase in the frequency of drought events was based on SPI3 and SPI6, while the number of drought events based on SPI12 slightly decreased. The changes in the frequency of drought events for each station varied depending on the applied SPI and climate change scenarios.
(3)
The Ca river basin will face more severe drought events in the future, with significant spatial variation among the stations. The change patterns also depend on the climate change scenarios. For example, the SSP370 scenario indicates the most severe drought conditions for the Ca river basin, while the SSP126 scenario suggests a minor reduction in drought severity.
The window size of SPI had a significant impact on the uncertainty of the simulation. As the window size of SPI increases, the uncertainty in the drought projection increases. The uncertainty increased for the future scenarios due to different patterns of long-term serial dependence among the climate models. Further research is needed on how to deal with the bias in long-term serial dependence for drought projection.
The current study can contribute to planning long-term water resource management and policy in the Ca river basin. Subsequently, the findings of the current study may attenuate the socio-economic damages from future drought in the studied basin. Additionally, this would be a good benchmark and reference for future drought projections in Vietnam.

Author Contributions

Conceptualization, J.-Y.S., P.V.C. and M.-J.U.; methodology, J.-Y.S.; software, J.-Y.S.; validation, J.-Y.S.; formal analysis, J.-Y.S.; investigation, J.-Y.S. and M.-J.U.; resources, J.-Y.S.; data curation, P.V.C.; writing—original draft preparation, J.-Y.S.; writing—review and editing, J.-Y.S., H.K. and K.S.; visualization, J.-Y.S.; supervision, J.-Y.S.; project administration, J.-Y.S.; funding acquisition, M.-J.U. All authors have read and agreed to the published version of the manuscript.

Funding

This work was partially supported by the National Research Foundation of Korea (NRF) grant funded by the Korean government (MSIT) (No. NRF-2022R1A2C2004034). This work was supported partially by the National Research Foundation of Korea (NRF) grant funded by the Korean government (MSIT) (No. NRF-RS-2023-00209531).

Data Availability Statement

The CMIP6 climate change scenario data can be downloaded at https://aims2.llnl.gov/search/cmip6. The observed rainfall data of the Ca river basin can be obtained by requesting the observed data from the Vietnam Meteorological and Hydrological Administration.

Acknowledgments

This work was partially supported by the National Research Foundation of Korea (NRF) grant funded by the Korean government (MSIT) (No. NRF-2022R1A2C2004034). This work was supported partially by the National Research Foundation of Korea (NRF) grant funded by the Korean government (MSIT) (No. NRF-RS-2023-00209531).

Conflicts of Interest

The authors declare no conflicts of interest.

References

  1. Do, V.Q.; Phung, M.L.; Truong, D.T.; Pham, T.T.T.; Dang, V.T.; Nguyen, T.K. The Impact of Extreme Events and Climate Change on Agricultural and Fishery Enterprises in Central Vietnam. Sustainability 2021, 13, 7121. [Google Scholar] [CrossRef]
  2. Nguyen Duc, K.; Ancev, T.; Randall, A. Evidence of climatic change in Vietnam: Some implications for agricultural production. J. Environ. Manag. 2019, 231, 524–545. [Google Scholar] [CrossRef]
  3. Phuong, D.N.D.; Dat, N.L.T.; Loi, N.K. Multiple trend tests on air temperature and precipitation anomalies in Vietnam. J. Water Clim. Chang. 2022, 13, 1340–1353. [Google Scholar] [CrossRef]
  4. Dau, Q.V.; Kuntiyawichai, K.; Adeloye, A.J. Future Changes in Water Availability Due to Climate Change Projections for Huong Basin, Vietnam. Environ. Process. 2020, 8, 77–98. [Google Scholar] [CrossRef]
  5. Luo, P.; Mu, D.; Xue, H.; Ngo-Duc, T.; Dang-Dinh, K.; Takara, K.; Nover, D.; Schladow, G. Flood inundation assessment for the Hanoi Central Area, Vietnam under historical and extreme rainfall conditions. Sci. Rep. 2018, 8, 12623. [Google Scholar] [CrossRef] [PubMed]
  6. Zhao, W.; Kinouchi, T.; Nguyen, H.Q. A framework for projecting future intensity-duration-frequency (IDF) curves based on CORDEX Southeast Asia multi-model simulations: An application for two cities in Southern Vietnam. J. Hydrol. 2021, 598, 126461. [Google Scholar] [CrossRef]
  7. Vietnam, U. Vietnam Drought and Saltwater Intrusion: Transitioning from Emergency to Recovery; UNDP (United Nations Development Programme): Hanoi, Vietnam, 2016. [Google Scholar]
  8. Sutton, W.R.; Srivastava, J.P.; Rosegrant, M.; Thurlow, J.; Sebastian, L. Striking a Balance: Managing El Niño and La Niña in Vietnam’s Agriculture; World Bank: Washington, DC, USA, 2019. [Google Scholar]
  9. Nguyen, D.-Q.; Renwick, J.; McGregor, J. Variations of surface temperature and rainfall in Vietnam from 1971 to 2010. Int. J. Climatol. 2014, 34, 249–264. [Google Scholar] [CrossRef]
  10. Phuong, D.N.D.; Hai, L.M.; Dung, H.M.; Loi, N.K. Temporal Trend Possibilities of Annual Rainfall and Standardized Precipitation Index in the Central Highlands, Vietnam. Earth Syst. Environ. 2022, 6, 69–85. [Google Scholar] [CrossRef]
  11. Stojanovic, M.; Liberato, M.L.R.; Sorí, R.; Vázquez, M.; Phan-Van, T.; Duongvan, H.; Hoang Cong, T.; Nguyen, P.N.B.; Nieto, R.; Gimeno, L. Trends and Extremes of Drought Episodes in Vietnam Sub-Regions during 1980–2017 at Different Timescales. Water 2020, 12, 813. [Google Scholar] [CrossRef]
  12. Le, P.V.V.; Phan-Van, T.; Mai, K.V.; Tran, D.Q. Space–time variability of drought over Vietnam. Int. J. Climatol. 2019, 39, 5437–5451. [Google Scholar] [CrossRef]
  13. Skea, J.; Shukla, P.; Al Khourdajie, A.; McCollum, D. Intergovernmental Panel on Climate Change: Transparency and integrated assessment modeling. WIREs Clim. Chang. 2021, 12, e727. [Google Scholar] [CrossRef]
  14. Li, H.; Li, Z.; Chen, Y.; Xiang, Y.; Liu, Y.; Kayumba, P.M.; Li, X. Drylands face potential threat of robust drought in the CMIP6 SSPs scenarios. Environ. Res. Lett. 2021, 16, 114004. [Google Scholar] [CrossRef]
  15. Thanh Thuy, L.T.; Kawagoe, S.; Sarukkalige, R. Estimation of probable maximum precipitation at three provinces in Northeast Vietnam using historical data and future climate change scenarios. J. Hydrol. Reg. Stud. 2019, 23, 100599. [Google Scholar] [CrossRef]
  16. Seo, M.; Kim, S.; Kim, H.; Kim, H.; Shin, J.-Y.; Heo, J.-H. Evaluation of Statistical PMP Considering RCP Climate Change Scenarios in Republic of Korea. Water 2023, 15, 1756. [Google Scholar] [CrossRef]
  17. Kim, H.; Villarini, G. Higher emissions scenarios lead to more extreme flooding in the United States. Nat. Commun. 2024, 15, 237. [Google Scholar] [CrossRef] [PubMed]
  18. Ngo-Duc, T.; Kieu, C.; Thatcher, M.; Nguyen-Le, D.; Phan-Van, T. Climate projections for Vietnam based on regional climate models. Clim. Res. 2014, 60, 199–213. [Google Scholar] [CrossRef]
  19. Raghavan, S.V.; Vu, M.T.; Liong, S.Y. Ensemble climate projections of mean and extreme rainfall over Vietnam. Glob. Planet. Chang. 2017, 148, 96–104. [Google Scholar] [CrossRef]
  20. Vu, M.T.; Raghavan, V.S.; Liong, S.Y. Ensemble Climate Projection for Hydro-Meteorological Drought over a river basin in Central Highland, Vietnam. KSCE J. Civ. Eng. 2015, 19, 427–433. [Google Scholar] [CrossRef]
  21. Vu, M.T.; Vo, N.D.; Gourbesville, P.; Raghavan, S.V.; Liong, S.Y. Hydro-meteorological drought assessment under climate change impact over the Vu Gia–Thu Bon river basin, Vietnam. Hydrol. Sci. J. 2017, 62, 1654–1668. [Google Scholar] [CrossRef]
  22. Li, Y.; Lu, H.; Yang, K.; Wang, W.; Tang, Q.; Khem, S.; Yang, F.; Huang, Y. Meteorological and hydrological droughts in Mekong River Basin and surrounding areas under climate change. J. Hydrol. Reg. Stud. 2021, 36, 100873. [Google Scholar] [CrossRef]
  23. Nguyen-Ngoc-Bich, P.; Phan-Van, T.; Ngo-Duc, T.; Vu-Minh, T.; Trinh-Tuan, L.; Tangang, F.T.; Juneng, L.; Cruz, F.; Santisirisomboon, J.; Narisma, G.; et al. Projected evolution of drought characteristics in Vietnam based on CORDEX-SEA downscaled CMIP5 data. Int. J. Climatol. 2021, 41, 5733–5751. [Google Scholar] [CrossRef]
  24. Wang, T.; Tu, X.; Singh, V.P.; Chen, X.; Lin, K. Global data assessment and analysis of drought characteristics based on CMIP6. J. Hydrol. 2021, 596, 126091. [Google Scholar] [CrossRef]
  25. Phuong, D.N.D.; Vu, N.D.; Loi, N.K. Historical trends and future projections of annual rainfall from CMIP6 models in Ho Chi Minh City, Vietnam. Clim. Res. 2024, 92, 97–115. [Google Scholar] [CrossRef]
  26. Feng, T.; Zhu, X.; Dong, W. Historical assessment and future projection of extreme precipitation in CMIP6 models: Global and continental. Int. J. Climatol. 2023, 43, 4119–4135. [Google Scholar] [CrossRef]
  27. Dong, Z.; Liu, H.; Baiyinbaoligao; Hu, H.; Khan, M.Y.A.; Wen, J.; Chen, L.; Tian, F. Future projection of seasonal drought characteristics using CMIP6 in the Lancang-Mekong River Basin. J. Hydrol. 2022, 610, 127815. [Google Scholar] [CrossRef]
  28. Trinh-Tuan, L.; Matsumoto, J.; Tangang, F.T.; Juneng, L.; Cruz, F.; Narisma, G.; Santisirisomboon, J.; Phan-Van, T.; Gunawan, D.; Aldrian, E.; et al. Application of Quantile Mapping Bias Correction for Mid-Future Precipitation Projections over Vietnam. Sola 2019, 15, 1–6. [Google Scholar] [CrossRef]
  29. Bi, D.; Dix, M.; Marsland, S.; O’Farrell, S.; Sullivan, A.; Bodman, R.; Law, R.; Harman, I.; Srbinovsky, J.; Rashid, H.A.; et al. Configuration and spin-up of ACCESS-CM2, the new generation Australian Community Climate and Earth System Simulator Coupled Model. J. South. Hemisph. Earth Syst. Sci. 2020, 70, 225–251. [Google Scholar] [CrossRef]
  30. Ziehn, T.; Chamberlain, M.A.; Law, R.M.; Lenton, A.; Bodman, R.W.; Dix, M.; Stevens, L.; Wang, Y.-P.; Srbinovsky, J. The Australian Earth System Model: ACCESS-ESM1.5. J. South. Hemisph. Earth Syst. Sci. 2020, 70, 193–214. [Google Scholar] [CrossRef]
  31. Semmler, T.; Danilov, S.; Gierz, P.; Goessling, H.F.; Hegewald, J.; Hinrichs, C.; Koldunov, N.; Khosravi, N.; Mu, L.; Rackow, T.; et al. Simulations for CMIP6 With the AWI Climate Model AWI-CM-1-1. J. Adv. Model. Earth Syst. 2020, 12, e2019MS002009. [Google Scholar] [CrossRef]
  32. Wu, T.; Lu, Y.; Fang, Y.; Xin, X.; Li, L.; Li, W.; Jie, W.; Zhang, J.; Liu, Y.; Zhang, L.; et al. The Beijing Climate Center Climate System Model (BCC-CSM): The main progress from CMIP5 to CMIP6. Geosci. Model Dev. 2019, 12, 1573–1600. [Google Scholar] [CrossRef]
  33. Rong, X.; Li, J.; Chen, H.; Xin, Y.; Su, J.; Hua, L.; Zhou, T.; Qi, Y.; Zhang, Z.; Zhang, G.; et al. The CAMS Climate System Model and a Basic Evaluation of Its Climatology and Climate Variability Simulation. J. Meteorol. Res. 2018, 32, 839–861. [Google Scholar] [CrossRef]
  34. Chai, Z. CAS CAS-ESM2.0 Model Output Prepared for CMIP6 CMIP. 2020. Available online: https://www.wdc-climate.de/ui/cmip6?input=CMIP6.CMIP.CAS.CAS-ESM2-0 (accessed on 7 June 2024).
  35. Danabasoglu, G.; Lamarque, J.-F.; Bacmeister, J.; Bailey, D.A.; DuVivier, A.K.; Edwards, J.; Emmons, L.K.; Fasullo, J.; Garcia, R.; Gettelman, A.; et al. The Community Earth System Model Version 2 (CESM2). J. Adv. Model. Earth Syst. 2020, 12, e2019MS001916. [Google Scholar] [CrossRef]
  36. Lin, Y.; Huang, X.; Liang, Y.; Qin, Y.; Xu, S.; Huang, W.; Xu, F.; Liu, L.; Wang, Y.; Peng, Y.; et al. Community Integrated Earth System Model (CIESM): Description and Evaluation. J. Adv. Model. Earth Syst. 2020, 12, e2019MS002036. [Google Scholar] [CrossRef]
  37. Cherchi, A.; Fogli, P.G.; Lovato, T.; Peano, D.; Iovino, D.; Gualdi, S.; Masina, S.; Scoccimarro, E.; Materia, S.; Bellucci, A.; et al. Global Mean Climate and Main Patterns of Variability in the CMCC-CM2 Coupled Model. J. Adv. Model. Earth Syst. 2019, 11, 185–209. [Google Scholar] [CrossRef]
  38. Döscher, R.; Acosta, M.; Alessandri, A.; Anthoni, P.; Arsouze, T.; Bergman, T.; Bernardello, R.; Boussetta, S.; Caron, L.P.; Carver, G.; et al. The EC-Earth3 Earth system model for the Coupled Model Intercomparison Project 6. Geosci. Model Dev. 2022, 15, 2973–3020. [Google Scholar] [CrossRef]
  39. He, B.; Yu, Y.; Bao, Q.; Lin, P.; Liu, H.; Li, J.; Wang, L.; Liu, Y.; Wu, G.; Chen, K.; et al. CAS FGOALS-f3-L model dataset descriptions for CMIP6 DECK experiments. Atmos. Ocean. Sci. Lett. 2020, 13, 582–588. [Google Scholar] [CrossRef]
  40. Li, L.; Yu, Y.; Tang, Y.; Lin, P.; Xie, J.; Song, M.; Dong, L.; Zhou, T.; Liu, L.; Wang, L.; et al. The Flexible Global Ocean-Atmosphere-Land System Model Grid-Point Version 3 (FGOALS-g3): Description and Evaluation. J. Adv. Model. Earth Syst. 2020, 12, e2019MS002012. [Google Scholar] [CrossRef]
  41. Swapna, P.; Krishnan, R.; Sandeep, N.; Prajeesh, A.G.; Ayantika, D.C.; Manmeet, S.; Vellore, R. Long-Term Climate Simulations Using the IITM Earth System Model (IITM-ESMv2) With Focus on the South Asian Monsoon. J. Adv. Model. Earth Syst. 2018, 10, 1127–1149. [Google Scholar] [CrossRef]
  42. Volodin, E.M.; Mortikov, E.V.; Kostrykin, S.V.; Galin, V.Y.; Lykossov, V.N.; Gritsun, A.S.; Diansky, N.A.; Gusev, A.V.; Iakovlev, N.G.; Shestakova, A.A.; et al. Simulation of the modern climate using the INM-CM48 climate model. Russ. J. Numer. Anal. Math. Model. 2018, 33, 367–374. [Google Scholar] [CrossRef]
  43. Volodin, E.M.; Mortikov, E.V.; Kostrykin, S.V.; Galin, V.Y.; Lykossov, V.N.; Gritsun, A.S.; Diansky, N.A.; Gusev, A.V.; Iakovlev, N.G. Simulation of the present-day climate with the climate model INMCM5. Clim. Dyn. 2017, 49, 3715–3734. [Google Scholar] [CrossRef]
  44. Boucher, O.; Servonnat, J.; Albright, A.L.; Aumont, O.; Balkanski, Y.; Bastrikov, V.; Bekki, S.; Bonnet, R.; Bony, S.; Bopp, L.; et al. Presentation and Evaluation of the IPSL-CM6A-LR Climate Model. J. Adv. Model. Earth Syst. 2020, 12, e2019MS002010. [Google Scholar] [CrossRef]
  45. Lee, J.; Kim, J.; Sun, M.-A.; Kim, B.-H.; Moon, H.; Sung, H.M.; Kim, J.; Byun, Y.-H. Evaluation of the Korea Meteorological Administration Advanced Community Earth-System model (K-ACE). Asia-Pac. J. Atmos. Sci. 2020, 56, 381–395. [Google Scholar] [CrossRef]
  46. Tatebe, H.; Ogura, T.; Nitta, T.; Komuro, Y.; Ogochi, K.; Takemura, T.; Sudo, K.; Sekiguchi, M.; Abe, M.; Saito, F.; et al. Description and basic evaluation of simulated mean state, internal variability, and climate sensitivity in MIROC6. Geosci. Model Dev. 2019, 12, 2727–2765. [Google Scholar] [CrossRef]
  47. Müller, W.A.; Jungclaus, J.H.; Mauritsen, T.; Baehr, J.; Bittner, M.; Budich, R.; Bunzel, F.; Esch, M.; Ghosh, R.; Haak, H.; et al. A Higher-resolution Version of the Max Planck Institute Earth System Model (MPI-ESM1.2-HR). J. Adv. Model. Earth Syst. 2018, 10, 1383–1413. [Google Scholar] [CrossRef]
  48. Mauritsen, T.; Bader, J.; Becker, T.; Behrens, J.; Bittner, M.; Brokopf, R.; Brovkin, V.; Claussen, M.; Crueger, T.; Esch, M.; et al. Developments in the MPI-M Earth System Model version 1.2 (MPI-ESM1.2) and Its Response to Increasing CO2. J. Adv. Model. Earth Syst. 2019, 11, 998–1038. [Google Scholar] [CrossRef]
  49. Yukimoto, S.; Kawai, H.; Koshiro, T.; Oshima, N.; Yoshida, K.; Urakawa, S.; Tsujino, H.; Deushi, M.; Tanaka, T.; Hosaka, M.; et al. The Meteorological Research Institute Earth System Model Version 2.0, MRI-ESM2.0: Description and Basic Evaluation of the Physical Component. J. Meteorol. Soc. Japan. Ser. II 2019, 97, 931–965. [Google Scholar] [CrossRef]
  50. Seland, Ø.; Bentsen, M.; Olivié, D.; Toniazzo, T.; Gjermundsen, A.; Graff, L.S.; Debernard, J.B.; Gupta, A.K.; He, Y.C.; Kirkevåg, A.; et al. Overview of the Norwegian Earth System Model (NorESM2) and key climate response of CMIP6 DECK, historical, and scenario simulations. Geosci. Model Dev. 2020, 13, 6165–6200. [Google Scholar] [CrossRef]
  51. Lee, W.L.; Wang, Y.C.; Shiu, C.J.; Tsai, I.; Tu, C.Y.; Lan, Y.Y.; Chen, J.P.; Pan, H.L.; Hsu, H.H. Taiwan Earth System Model Version 1: Description and evaluation of mean state. Geosci. Model Dev. 2020, 13, 3887–3904. [Google Scholar] [CrossRef]
  52. Seo, G.-Y.; Ahn, J.-B.; Cha, D.-H.; Suh, M.-S.; Min, S.-K.; Chang, E.-C.; Byun, Y.-H.; Kim, J.-U. Evaluation of multi-RCM ensembles for simulating spatiotemporal variability of Asian summer monsoon precipitation in the CORDEX-East Asia Phase 2 domain. Int. J. Climatol. 2023, 43, 3710–3729. [Google Scholar] [CrossRef]
  53. Shin, J.-Y.; Kim, K.R.; Lee, Y.H. Spatial prediction of outdoor thermal comfort using an operational NWP model for city and regional scales: A case study in Korea. Urban Clim. 2022, 45, 101286. [Google Scholar] [CrossRef]
  54. Shin, J.-Y.; Kim, K.R.; Ha, J.-C. Seasonal forecasting of daily mean air temperatures using a coupled global climate model and machine learning algorithm for field-scale agricultural management. Agric. For. Meteorol. 2020, 281, 107858. [Google Scholar] [CrossRef]
  55. Shin, J.-Y.; Lee, T.; Park, T.; Kim, S. Bias correction of RCM outputs using mixture distributions under multiple extreme weather influences. Theor. Appl. Climatol. 2019, 137, 201–216. [Google Scholar] [CrossRef]
  56. Cannon, A.J.; Sobie, S.R.; Murdock, T.Q. Bias Correction of GCM Precipitation by Quantile Mapping: How Well Do Methods Preserve Changes in Quantiles and Extremes? J. Clim. 2015, 28, 6938–6959. [Google Scholar] [CrossRef]
  57. Kim, S.; Joo, K.; Kim, H.; Shin, J.-Y.; Heo, J.-H. Regional quantile delta mapping method using regional frequency analysis for regional climate model precipitation. J. Hydrol. 2021, 596, 125685. [Google Scholar] [CrossRef]
  58. Heo, J.-H.; Ahn, H.; Shin, J.-Y.; Kjeldsen, T.R.; Jeong, C. Probability Distributions for a Quantile Mapping Technique for a Bias Correction of Precipitation Data: A Case Study to Precipitation Data Under Climate Change. Water 2019, 11, 1475. [Google Scholar] [CrossRef]
  59. Qin, X.; Dai, C. Comparison of different quantile delta mapping schemes in frequency analysis of precipitation extremes over mainland Southeast Asia under climate change. J. Hydrol. 2022, 606, 127421. [Google Scholar] [CrossRef]
  60. Cannon, A. MBC: Multivariate Bias Correction of Climate Model Outputs, Version 0.10-6; R package. 2023. Available online: https://rdrr.io/cran/MBC/man/MBC-package.html (accessed on 7 June 2024).
  61. McKee, T.B.; Doesken, N.J.; Kleist, J. The relationship of drought frequency and duration to time scales. In Proceedings of the 8th Conference on Applied Climatology, Anaheim, CA, USA, 17-22 January 1993; pp. 179–183. [Google Scholar]
  62. Lloyd-Hughes, B.; Saunders, M.A. A drought climatology for Europe. Int. J. Climatol. 2002, 22, 1571–1592. [Google Scholar] [CrossRef]
  63. Lee, T.; Modarres, R.; Ouarda, T.B.M.J. Data-based analysis of bivariate copula tail dependence for drought duration and severity. Hydrol. Process. 2013, 27, 1454–1463. [Google Scholar] [CrossRef]
  64. Abu Arra, A.; Şişman, E. Characteristics of hydrological and meteorological drought based on intensity-duration-frequency (IDF) curves. Water 2023, 15, 3142. [Google Scholar] [CrossRef]
  65. Tran-Anh, Q.; Ngo-Duc, T.; Espagne, E.; Trinh-Tuan, L. A high-resolution projected climate dataset for Vietnam: Construction and preliminary application in assessing future change. J. Water Clim. Chang. 2022, 13, 3379–3399. [Google Scholar] [CrossRef]
Figure 1. Geographical locations of Ca River and the used rain gauge stations (red colored triangle).
Water 16 01914 g001
Figure 2. Boxplots of observed monthly precipitation for eight stations employed in the present study.
Water 16 01914 g002
Figure 3. Schematic diagram of quantile delta mapping method.
Water 16 01914 g003
Figure 4. Annual total precipitation changes in Muong Xen station based on climate change scenarios.
Water 16 01914 g004
Figure 5. Seasonal precipitation of MAM (spring) changes in Muong Xen station based on climate change scenarios.
Water 16 01914 g005
Figure 6. Seasonal precipitation changes of SON (autumn) in Muong Xen station based on climate change scenarios.
Water 16 01914 g006
Figure 7. Seasonal precipitation changes of DJF (winter) in Muong Xen station based on climate change scenarios.
Water 16 01914 g007
Figure 8. Change ratios of the number of drought events per year based on 27 CMIP6 models for the Ca river basin.
Water 16 01914 g008aWater 16 01914 g008b
Figure 9. Change ratios of the mean severity of drought events based on 27 CMIP6 models for the Ca river basin.
Water 16 01914 g009
Figure 10. Change ratios of the mean intensity of drought events based on 27 CMIP6 models for the Ca river basin.
Water 16 01914 g010
Table 1. Geographical information and available data period.
NoStationLonLatAvailable Period
1Muong Xen104.11719.4001959–2015
2Tuong Duong104.46719.2671975–2015
3Con Cuong104.85019.0671971–2016
4Do Luong105.28318.9001975–2016
5Son Diem105.35018.5001961–2015
6Hoa Duyet105.58318.3671959–2015
7Quy Chau105.10019.5671975–2016
8Quy Hop105.18319.3171975–2016
Table 2. Duration, severity, and intensity of the drought event during 1997/98 in the Ca river basin.
IndexVariablest#1st#2st#3st#4st#5st#6st#7st#8
SPI3Duration (month)44114432
Severity−5.38−9.13−1.35−1.12−4.51−5.38−5.97−2.51
Intensity−1.34−2.28−1.35−1.12−1.13−1.34−1.99−1.26
SPI6Duration (month)53324532
Severity−9.54−5.33−4.25−3.22−5.25−9.54−4.27−3.43
Intensity−1.91−1.78−1.42−1.61−1.31−1.91−1.43−1.72
SPI12Duration (month)222214121722911
Severity−46.38−45.46−24.19−19.49−31.00−46.38−13.30−14.54
Intensity−2.11−2.07−1.73−1.62−1.82−2.11−1.48−1.32
Table 3. List of the CMIP6 models used in this study.
No.CMIP6 Model NameCountryKey References
1ACCESS-CM2AustraliaBi, et al. [29]
2ACCESS-ESM1-5AustraliaZiehn, et al. [30]
3AWI-ESM-1-1-LRGermanySemmler, et al. [31]
4BCC-CSM2-MRChinaWu, et al. [32]
5CAMS-CSM1-0ChinaRong, et al. [33]
6CAS-ESM2-0ChinaChai [34]
7CESM2-WACCMUSADanabasoglu, et al. [35]
8CIESMChinaLin, et al. [36]
9CMCC-ESM2ItalyCherchi, et al. [37]
10EC-Earth3-Veg-LREuropeDöscher, et al. [38]
11EC-Earth3-VegEuropeDöscher, et al. [38]
12EC-Earth3EuropeDöscher, et al. [38]
13FGOALS-f3-LChinaHe, et al. [39]
14FGOALS-g3ChinaLi, et al. [40]
15IITM-ESMIndiaSwapna, et al. [41]
16INM-CM4-8RussiaVolodin, et al. [42]
17INM-CM5-0RussiaVolodin, et al. [43]
18IPSL-CM6A-LRFranceBoucher, et al. [44]
19KACE-1-0-GRepublic of KoreaLee, et al. [45]
20MIROC6JapanTatebe, et al. [46]
21MPI-ESM1-2-HRGermanyMüller, et al. [47]
22MPI-ESM1-2-LRGermanyMauritsen, et al. [48]
23MRI-ESM2-0JapanYukimoto, et al. [49]
24NorESM2-LMNorwaySeland, et al. [50]
25NorESM2-LMNorwaySeland, et al. [50]
26TaiESM1TaiwanLee, et al. [51]
27NIMS-UKESMRepublic of KoreaSeo, et al. [52]
Table 4. Mean values of the number of events, duration, and severity of drought events based on SPI3 for the used scenarios.
ScenarioVariablest#1st#2st#3st#4st#5st#6st#7st#8
HISTNo. of events0.7150.9790.9330.8360.8250.7331.0061.003
Duration (month)1.9563.2222.6382.2132.1061.9713.4933.353
Severity−2.381−5.606−3.665−2.775−2.648−2.404−5.945−5.341
SSP126No. of events0.7210.9850.9140.7990.8020.7261.0121.009
Duration (month)1.9473.1092.5662.1732.1141.9703.3413.197
Severity−2.401−5.362−3.590−2.776−2.686−2.433−5.640−5.081
SSP245No. of events0.7870.9830.9410.8480.8370.7551.0031.007
Duration (month)2.0113.2362.6862.2552.2032.0793.4913.340
Severity−2.493−5.774−3.795−2.905−2.802−2.586−6.068−5.444
SSP370No. of events0.8230.9970.9660.8790.8930.8241.0051.014
Duration (month)2.1023.2802.7742.3392.2412.0983.5623.435
Severity−2.644−6.005−3.969−3.060−2.884−2.629−6.395−5.724
SSP585No. of events0.7730.9910.9440.8490.8510.7710.9971.000
Duration (month)2.0073.1472.6412.2212.1762.0553.4293.293
Severity−2.516−5.588−3.739−2.876−2.782−2.559−5.990−5.387
Disclaimer/Publisher’s Note: The statements, opinions and data contained in all publications are solely those of the individual author(s) and contributor(s) and not of MDPI and/or the editor(s). MDPI and/or the editor(s) disclaim responsibility for any injury to people or property resulting from any ideas, methods, instructions or products referred to in the content.

