Article

Distribution and Comprehensive Risk Evaluation of Cr, Cd, Fe, Zn, and Pb from Al Lith Coastal Seawater, Saudi Arabia

by
Talal Alharbi
,
Abdelbaset S. El-Sorogy
* and
Khaled Al-Kahtany
Geology and Geophysics Department, College of Science, King Saud University, P.O. Box 2455, Riyadh 11451, Saudi Arabia
*
Author to whom correspondence should be addressed.
Water 2024, 16(13), 1923; https://doi.org/10.3390/w16131923
Submission received: 28 May 2024 / Revised: 18 June 2024 / Accepted: 3 July 2024 / Published: 5 July 2024
(This article belongs to the Special Issue Coastal Processes and Climate Change)

Abstract

:
Seawater contamination is a global challenge due to its hazardous effects on marine organisms and human health. Twenty-three surface seawater samples were collected from the Al Lith intertidal area along the Saudi Red Sea coast to evaluate the ecological risks and document the potential sources of Cr, Cd, Fe, Zn, and Pb. Contamination factor (CF), contamination degree (Cd), water quality index (WQI), and heavy metal pollution index (HPI), as well as multivariate tools were applied. The average concentrations of HMs (μg/L) had the following order: Zn (6.616) > Pb (0.284) > Cd and Cr (0.268) > Fe (0.197). CF results showed moderate contamination of seawater with Cd and low contamination of Cr, Fe, Zn, and Pb. However, 26.09% of the samples showed considerable contamination with Cd. Average Cd values revealed low contamination with HMs, while 17.39% of the samples showed moderate contamination. HPI average values indicated medium pollution of Al Lith seawater, while 13 samples reported high pollution. The higher HPI values were reported in samples characterized by higher concentrations of HMs, particularly Cd and Zn. Correlation matrix and principal component analysis suggested anthropogenic sources for Pb and Zn, mostly from industrial and agricultural effluents, landfilling, and domestic wastewater, apart from their natural sources.

1. Introduction

Coastal areas exhibit remarkable diversity in terms of geology, ecology, biology, and topography. Sea-level rise, climate change, and human activities are factors that lead to alterations in these vulnerable and constantly changing settings [1,2,3]. In addition, the growth of industries and the fast economic expansion of coastal regions contribute significantly to environmental pollution. These places release millions of tons of pollutants into water bodies [4,5]. The quality of coastal water is a major problem due to pollution, disturbance of marine ecosystems, and erosion induced by construction activities, which can result in the release of pollutants and create long-term damage [3]. Furthermore, industrial development serves as a significant contributor to environmental pollution; however, it also plays a crucial role in stimulating economic expansion [4]. Hence, the swift economic growth of coastal regions has led to a consistent rise in pollution due to the significant influence of human activities on the marine ecosystem. These activities are the main sources of human-made contaminants that have placed coastal areas under growing strain [5].
Heavy metals (HMs) enter the aquatic ecosystem due to natural processes and anthropogenic activities, including weathering of nearby rocks, atmosphere deposition, and agricultural, industrial, stormwater, sewage treatment, and domestic wastes. Arsenic, mercury, chromium, cadmium, lead, nickel, copper, and zinc are the eight most common types of coastal contaminants listed by the Environment Protection Agency [6]. Some HMs, such as As, Pb, Cd, Cr, and Ni, are characterized by their persistence and bioaccumulate in aquatic organisms, and their influence varies depending on their concentration and available chemical forms [7,8]. Additionally, toxic HMs can be taken up by marine organisms, entering the food chain and potentially being transferred to higher trophic levels and affecting human health [8,9]. The concentration of any HMs in humans can be too low, sufficient, or harmful depending on the levels of these HMs in the environment and the extent of exposure [10].
The consumption of marine species that are contaminated with potentially harmful HMs, such as lead, arsenic, cadmium, and nickel, is the primary route by which humans are exposed to these metals. HMs pose a threat not only to human health but also to the biodiversity of aquatic life, as demonstrated by the ongoing decrease in the population and variety of freshwater fish and other aquatic species. The human body experiences a range of chronic health issues as a result of metal toxicity. These include brain and nerve disorders, blood disorders, structural damage, alterations in kidney function, dermal lesions, and various types of cancer, such as skin, lung, bladder, and kidney cancer. Additionally, metal toxicity can lead to skin changes like hyperkeratosis and pigmentation changes, as well as mineralization of bones and teeth. Other symptoms may include stomach irritation, vomiting, and diarrhea [8,11,12].
The Saudi Red Sea coast along Jeddah, Yanbu, Duba, Sharma, Al-Wajh, Jazan, and Sharm Al-Kharrar has been intensively studied regarding HM contamination in sediments and seawaters (e.g., [13,14,15,16,17,18,19,20,21,22]). Lithogenic sources were responsible for introducing Co, Ni, Pb, and Sb into the saltwater of the Jazan coastline. On the other hand, Cr mostly comes from human activities, while both lithogenic and anthropogenic sources are thought to have contributed to the presence of Cu and Zn in the area. Urbanization, agriculture, and industry are suggested as potential human-caused sources of pollutants on the Jazan shoreline. The primary lithogenic sources in the investigated area are the soils formed on undifferentiated Quaternary rocks [17]. However, statistical analyses conducted on seawater samples from the Yanbu coastal area revealed that Cd, Co, Hg, Zn, and Ni have anthropogenic origins, likely stemming from industrial, farming, or fishing activities in the vicinity of Yanbu City. On the other hand, Cu, Fe, Pb, Mn, Sb, Al, Cr, Ni, and As are likely derived from a combination of natural sources and human activities [22].
The study area was chosen because it encompasses a significant portion of the downstream region of Wadi Al Lith. This area is characterized by dry to hyper-arid conditions, with rainfall occurring only from November to March and even then only for a few days. The purpose of this selection is to determine whether the weathering of the Arabian Shield is responsible for the presence of hazardous materials (HMs) in the area. Moreover, the Al Lith region has had significant economic development and a substantial increase in population over the past decade. Additionally, the coastal region experiences inundation as well as the discharge of industrial and home waste, including HMs. Finally, no study has been conducted on seawater monitoring in the Al Lith coastal area. Therefore, the main purposes of the present study are to assess the ecological risk of Cr, Cd, Fe, Zn, and Pb in Al Lith seawater, Red Sea coast, Saudi Arabia, using CF, Cd, mCd, and HPI, and to identify the possible sources of HMs utilizing statistical analysis.

2. Materials and Methods

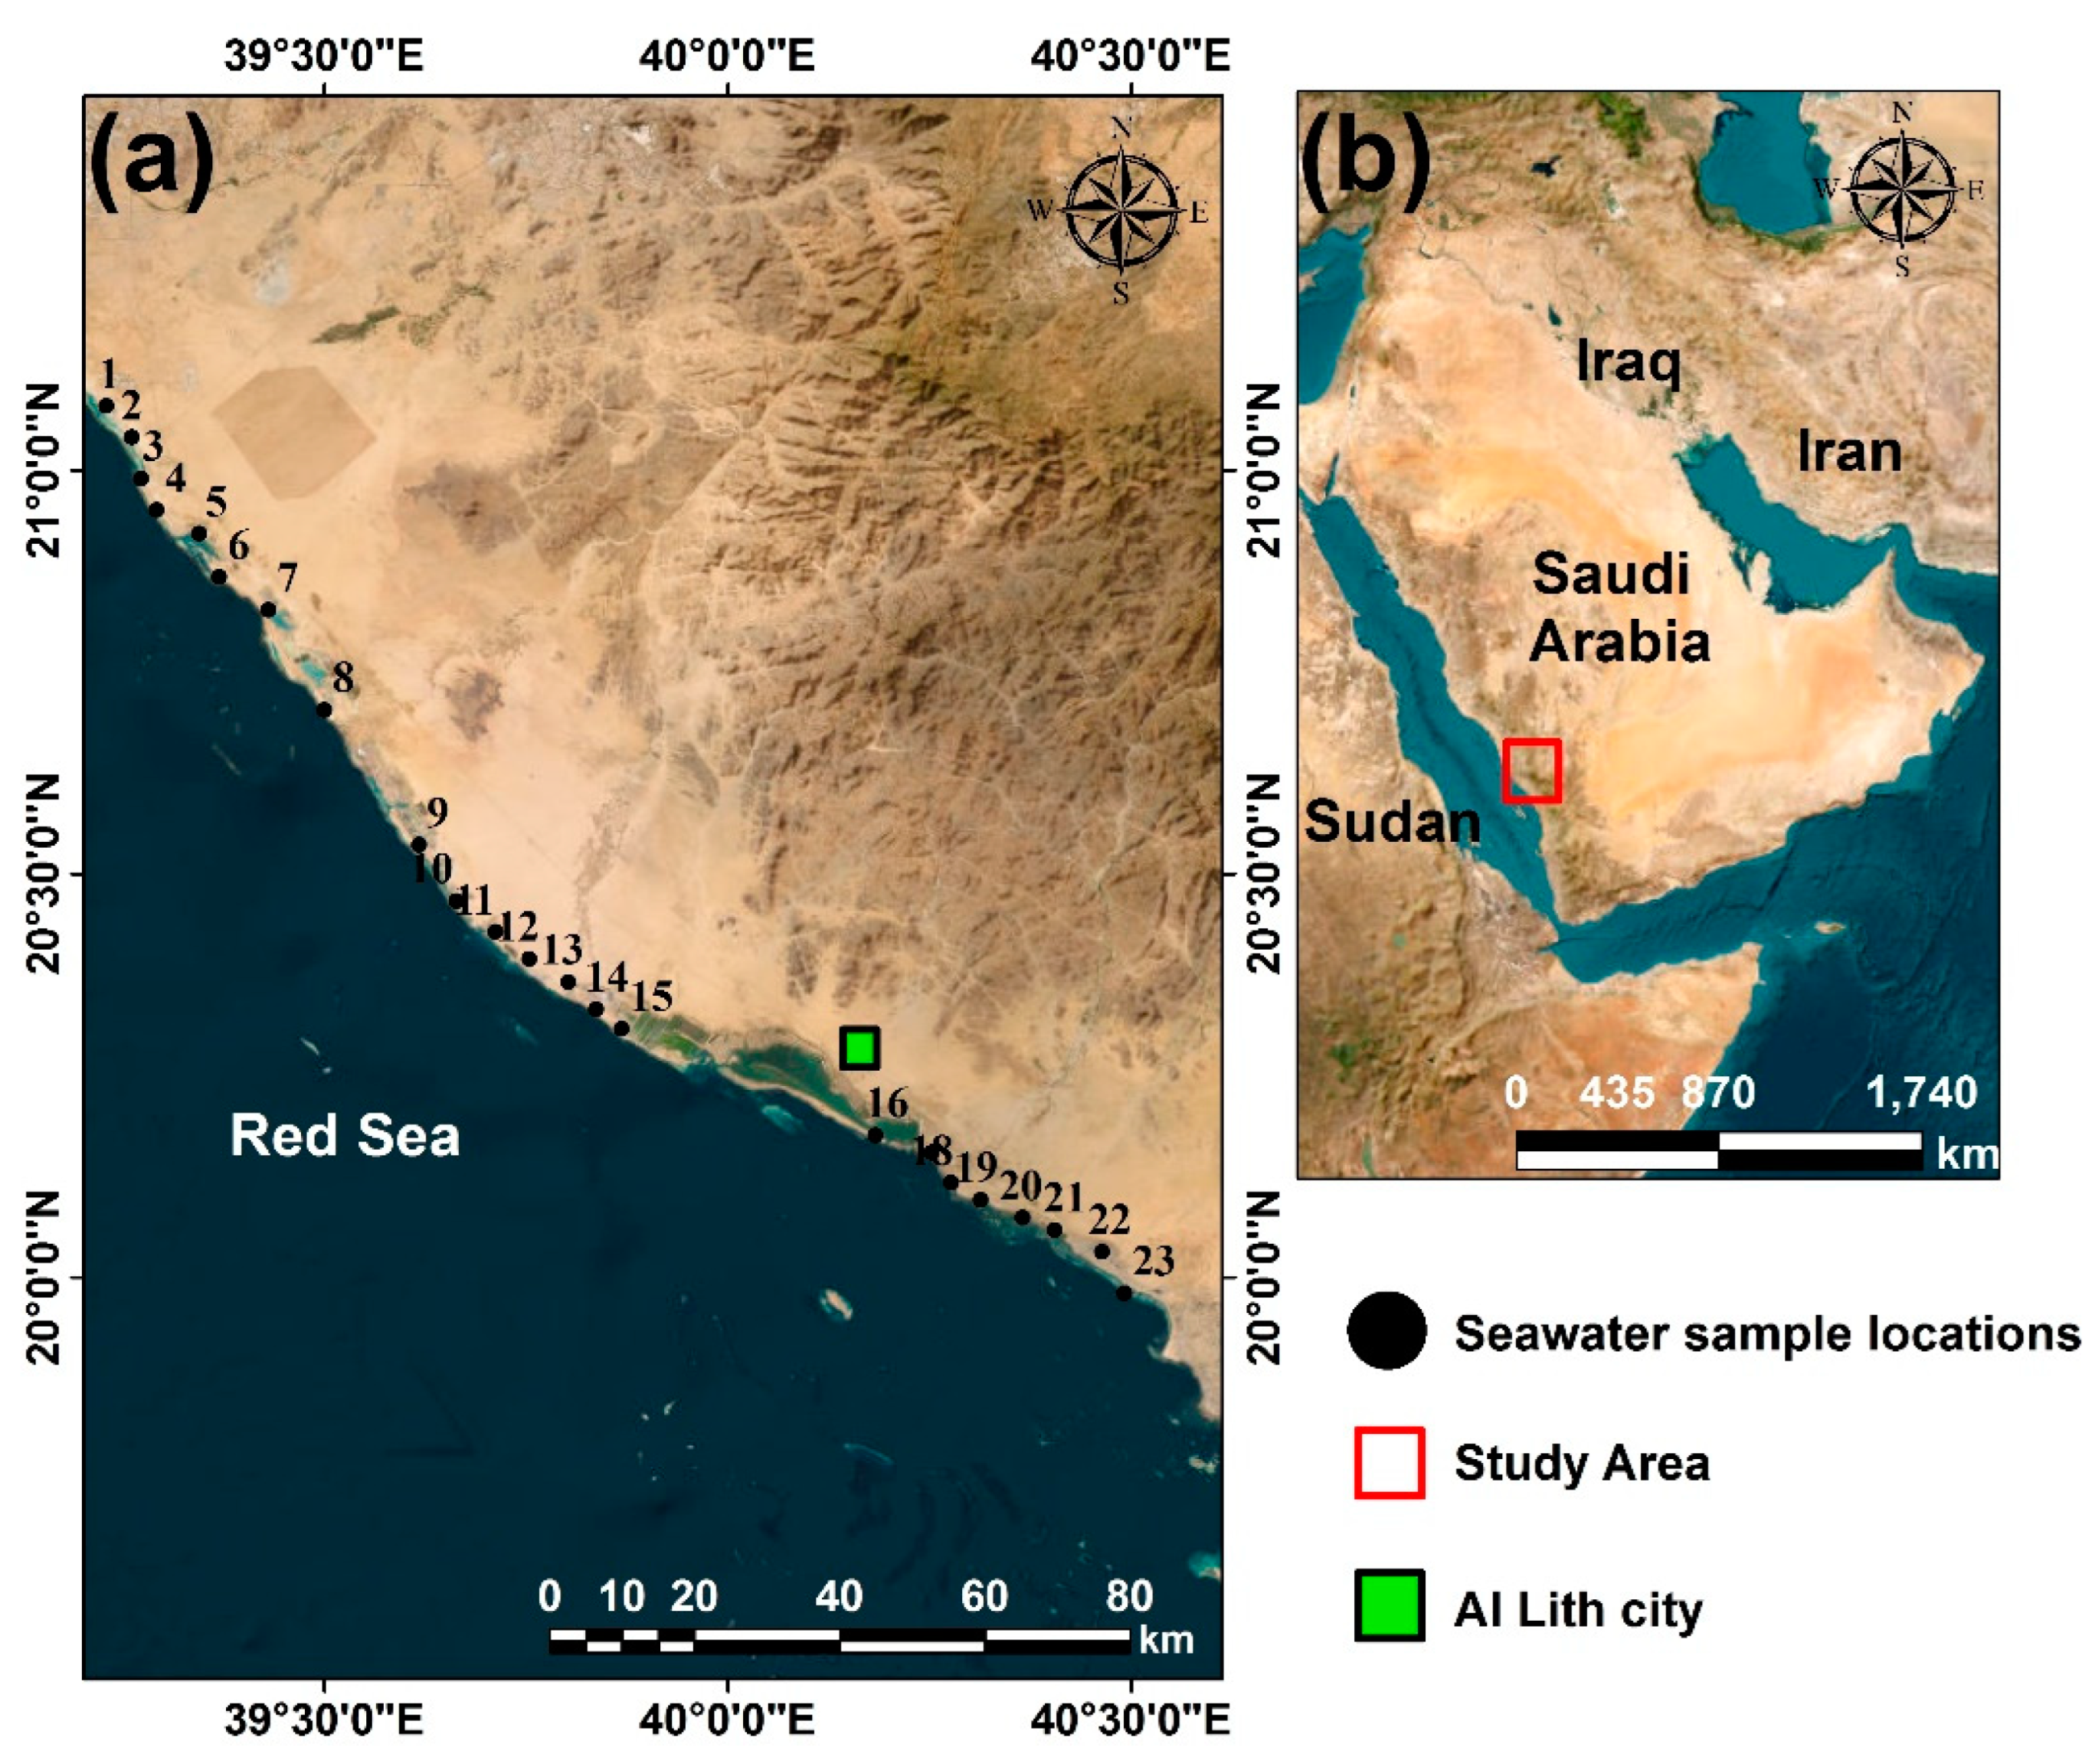
2.1. Study Area and Analytical Methods

Al Lith City is located in the Makkah region of Saudi Arabia, approximately 180–200 Km to the south of Jeddah City. The basement rocks of the Arabian Shield are found in the eastern portion of the Al Lith area and run parallel to the Red Sea. They were formed by the uplifting of Precambrian rock due to Red Sea rifting and collectively reflect the diverse geological history of the area, shaped by various tectonic and environmental processes over millions of years [23]. On the other hand, the western half of the area is covered with deposits of sand, gravel, silt, and mud from the Quaternary period [24,25]. A total of twenty-three samples of saltwater from the subtidal zone were obtained (Figure 1). The sediment in the beach under study consists of mud, fine- to coarse-grained sands, and terrestrial gravels. It contains various marine organisms, such as corals, gastropods, bivalves, echinoids, seagrass, and foraminifers. These organisms have been transported to the beach by waves and currents [17].
At each site, several samples were taken from a depth of 0.5 m using 500 mL clean, sterilized polyethylene bottles, then placed in a cooler and transported to the laboratory. Prior to sampling, the bottles were washed with seawater at the same site three times [20,21]. The selection of sample locations was decided using GPS technology. To prevent precipitation and sorption to the container walls, the samples were acidified with 5 mL of 10% HNO3 [26]. Graphite furnace atomic absorption spectroscopy (Analytik Jena, Jena, Germany) was used to measure the concentrations of Cr, Cd, Fe, Zn, and Pb at Yarmouk University, Jardon. These HMs in the research area are the primary pollution concern due to their high priority and toxicity, as recognized by the WHO and USEPA lists.
Prior to measurements, the saltwater samples were diluted by a factor of 10 with deionized water. Single-element and multi-element standard solutions (Merck, Sigma-Aldrich, Darmstadt, Germany) were used to prepare all multi-element stock solutions. The single- and multi-element working standards were generated by sequentially diluting the stock solutions using volume/volume dilution. The calibration standards and blank solution were acid-matched with the sample solutions using a 1% (v/v) HNO3 and 1% (v/v) HCl solution. The seawater samples were filtered using Whatman filter paper, if necessary, and were acidified immediately after filtration. The calibration levels for each element were selected based on the prescribed threshold values. A minimum of five calibration standards were utilized for each element, as outlined below. Initially, the samples were examined using Flame Atomic Absorption Spectroscopy (FAAS) to identify any outliers. Subsequently, if necessary, the samples were re-analyzed using Graphite furnace atomic absorption spectroscopy (GFAAS) to ensure the accuracy of the results. The internal standard quality control samples were evaluated and showed a strong connection with the estimated values. Duplication was employed to calculate the sample mean reading (Table S1).

2.2. Pollution Indices and Multivariate Analyses

Pearson correlation and principal component analysis (PCA) are widely used statistical methods for identifying the possible sources of the dissolved HMs in the seawater samples and interpreting datasets [27,28]. These statistical methods were applied using IBM SPSS Statistics 29 and OriginPro 2023b software. The contamination factor (CF), contamination degree (Cd), modified contamination factor (mCd), and heavy metal pollution index (HPI) were utilized to evaluate the level of contamination in seawater. The modified contamination factor (mCd) can serve as a water quality indicator (WQI) for a thorough evaluation of saltwater contamination and quality [29,30]. The calculation methods of the contamination indices utilized in this investigation are summarized in Equations (1)–(5) and Table 1 [31,32].
CF = C (HMs)/C (Background)
Cd = ∑CF
WQI = mCdeg = ∑CF/n
HPI = W i Q i W i
Q i = ( M i I i S i I i )
CF is the contamination factor; C (HMs) is the analytical value; C (Background) is the upper permissible concentration for the ith component; Qi is the sub-index of the ith parameter; Wi is the unit weight for the ith parameter; Mi, Ii, and Si are the monitored HM, ideal, and standard values of the ith parameter, respectively. The sign (−) indicates the numerical difference in the two values, ignoring the algebraic sign.

3. Results and Discussion

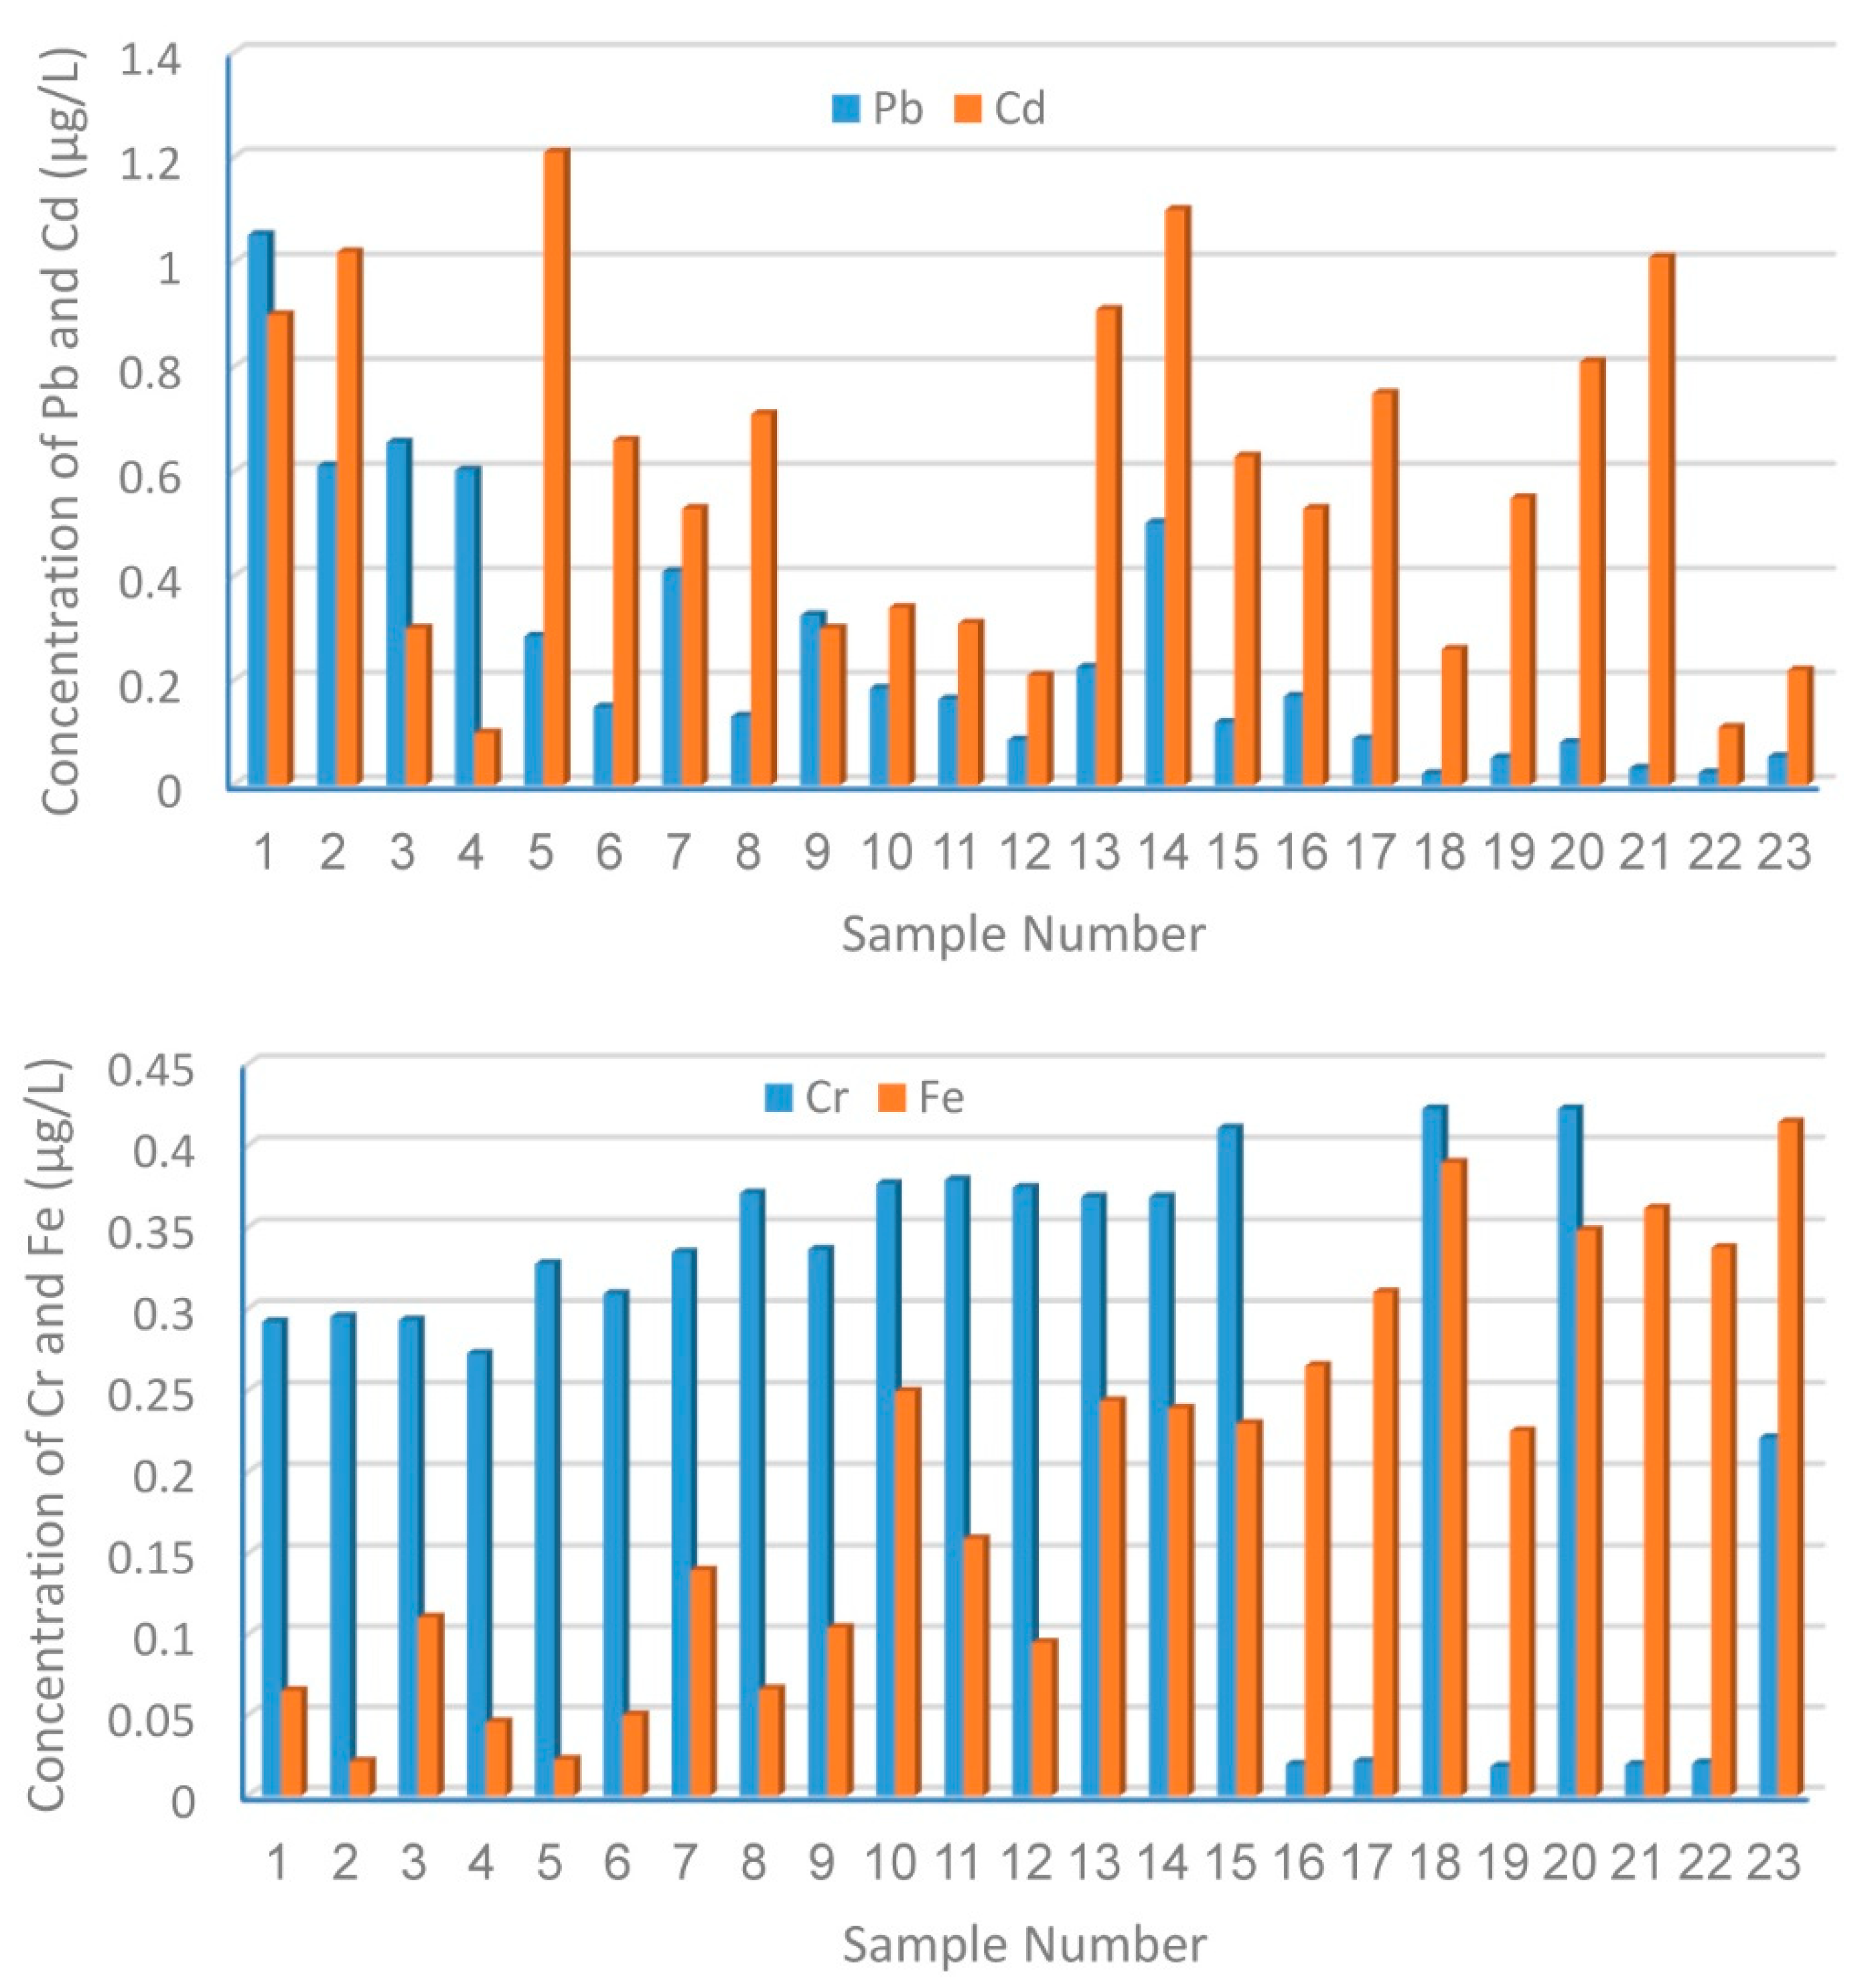
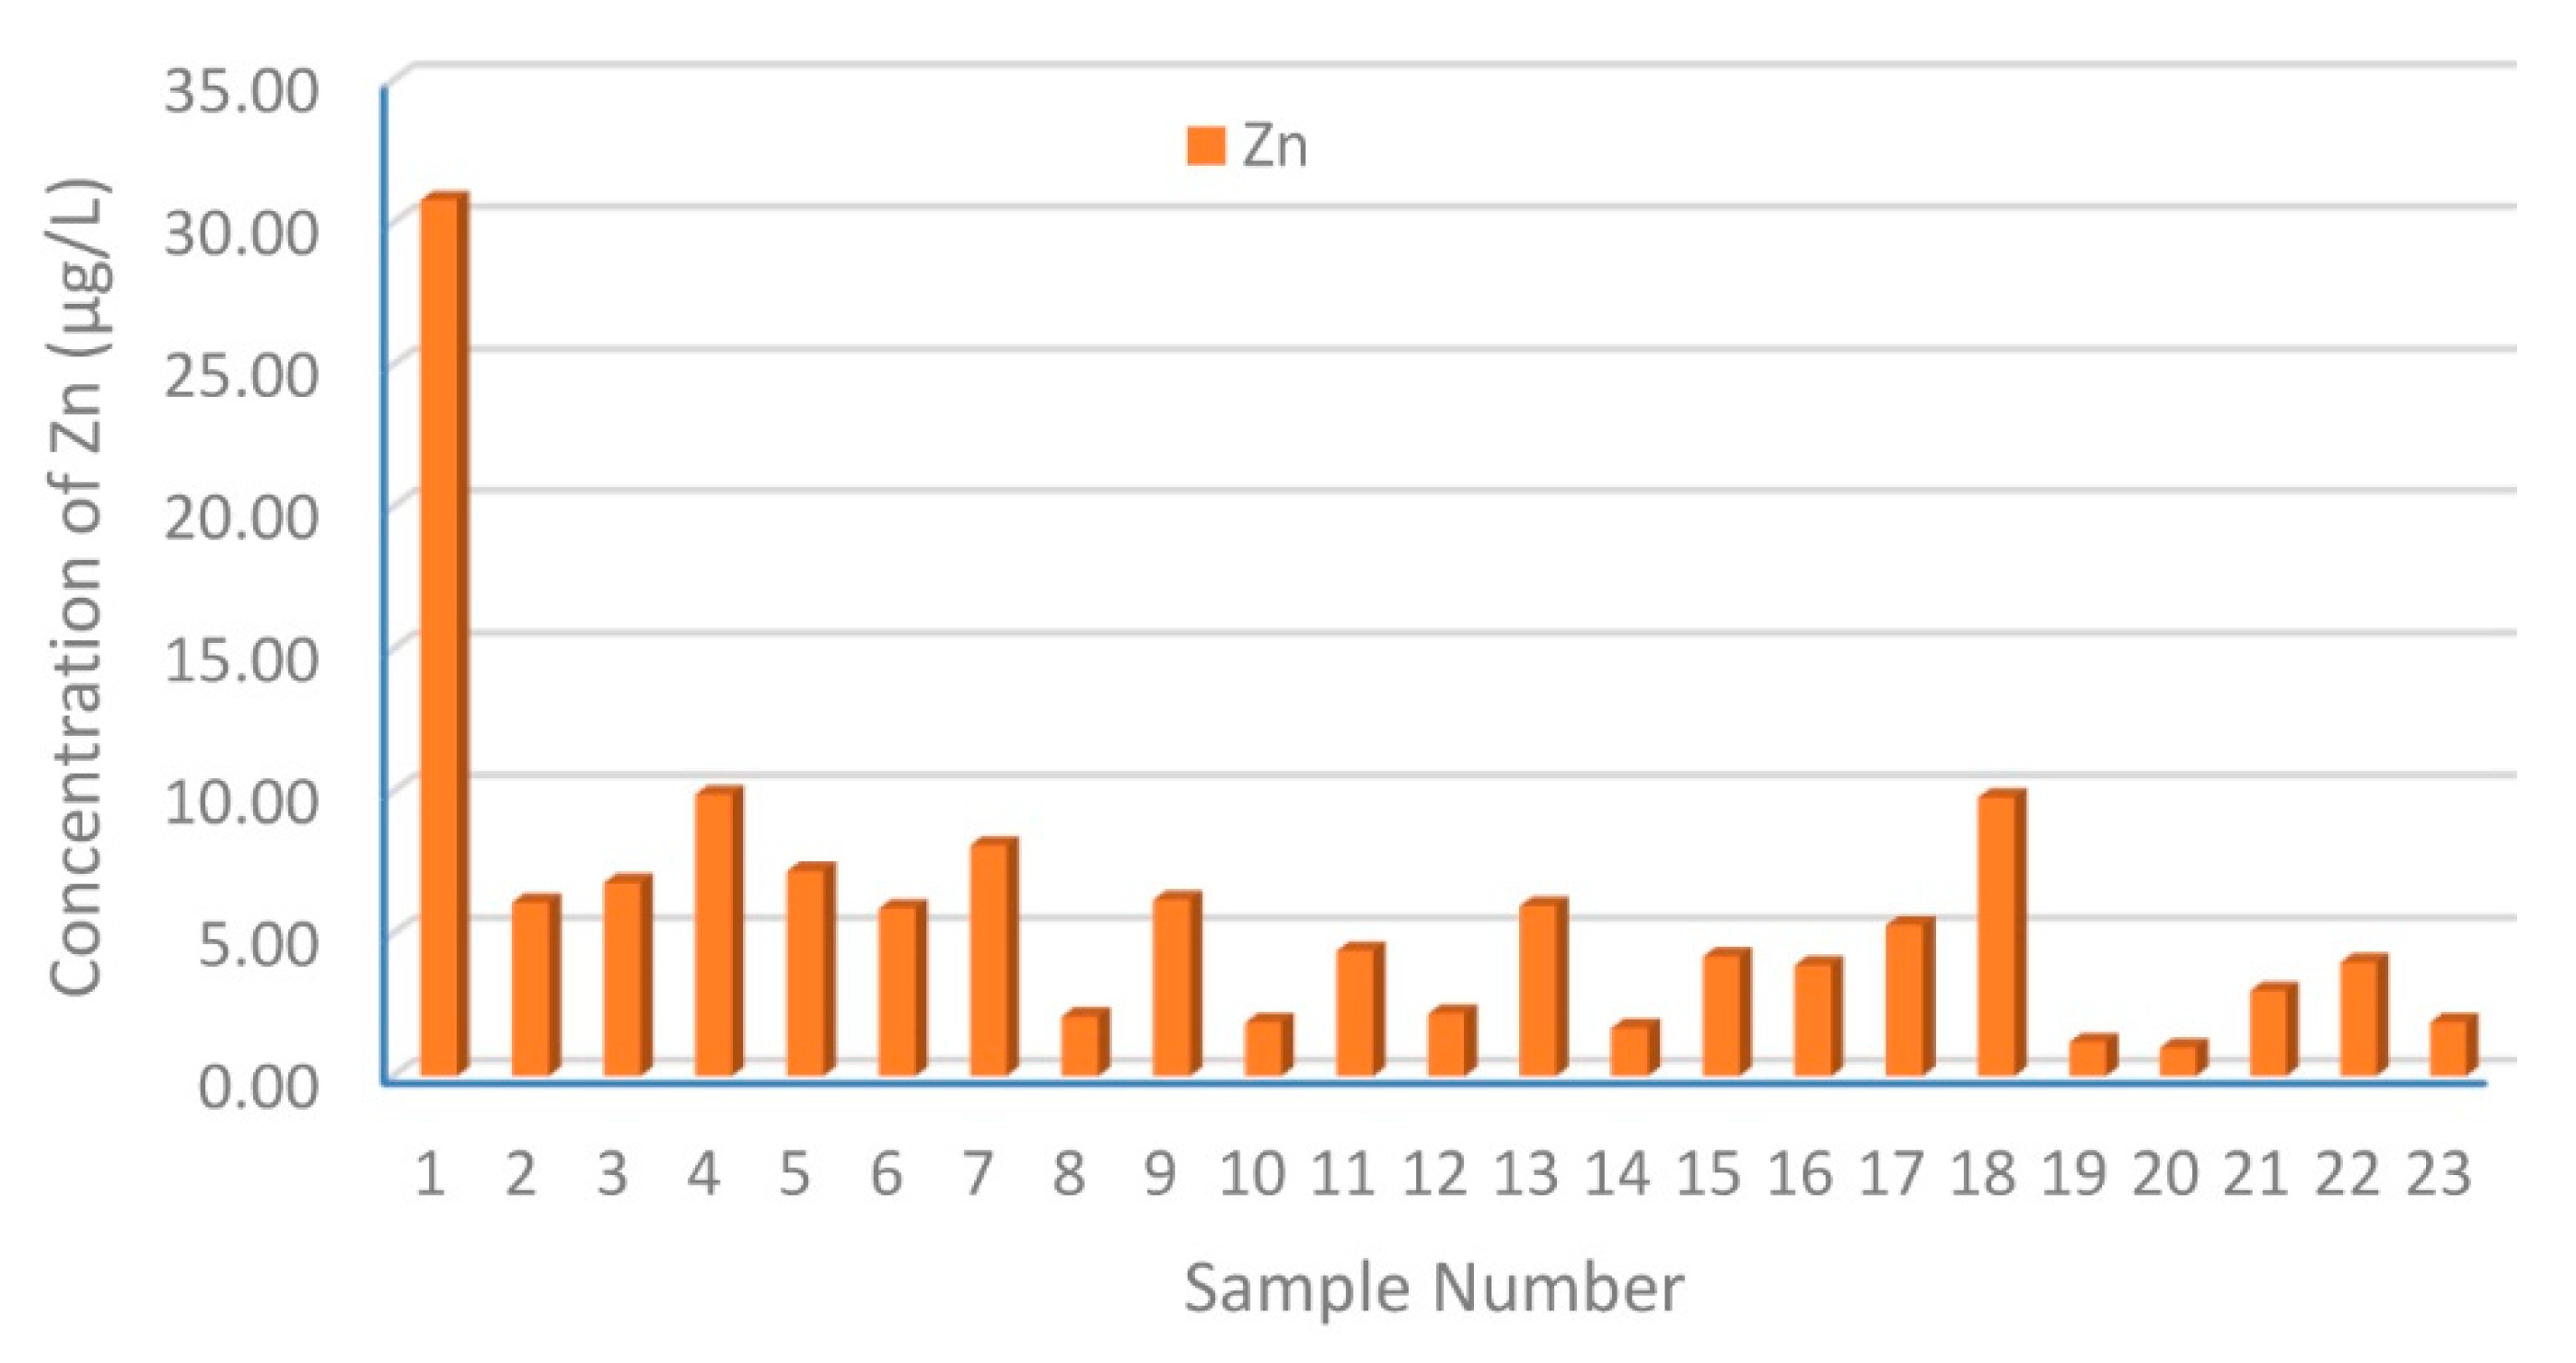
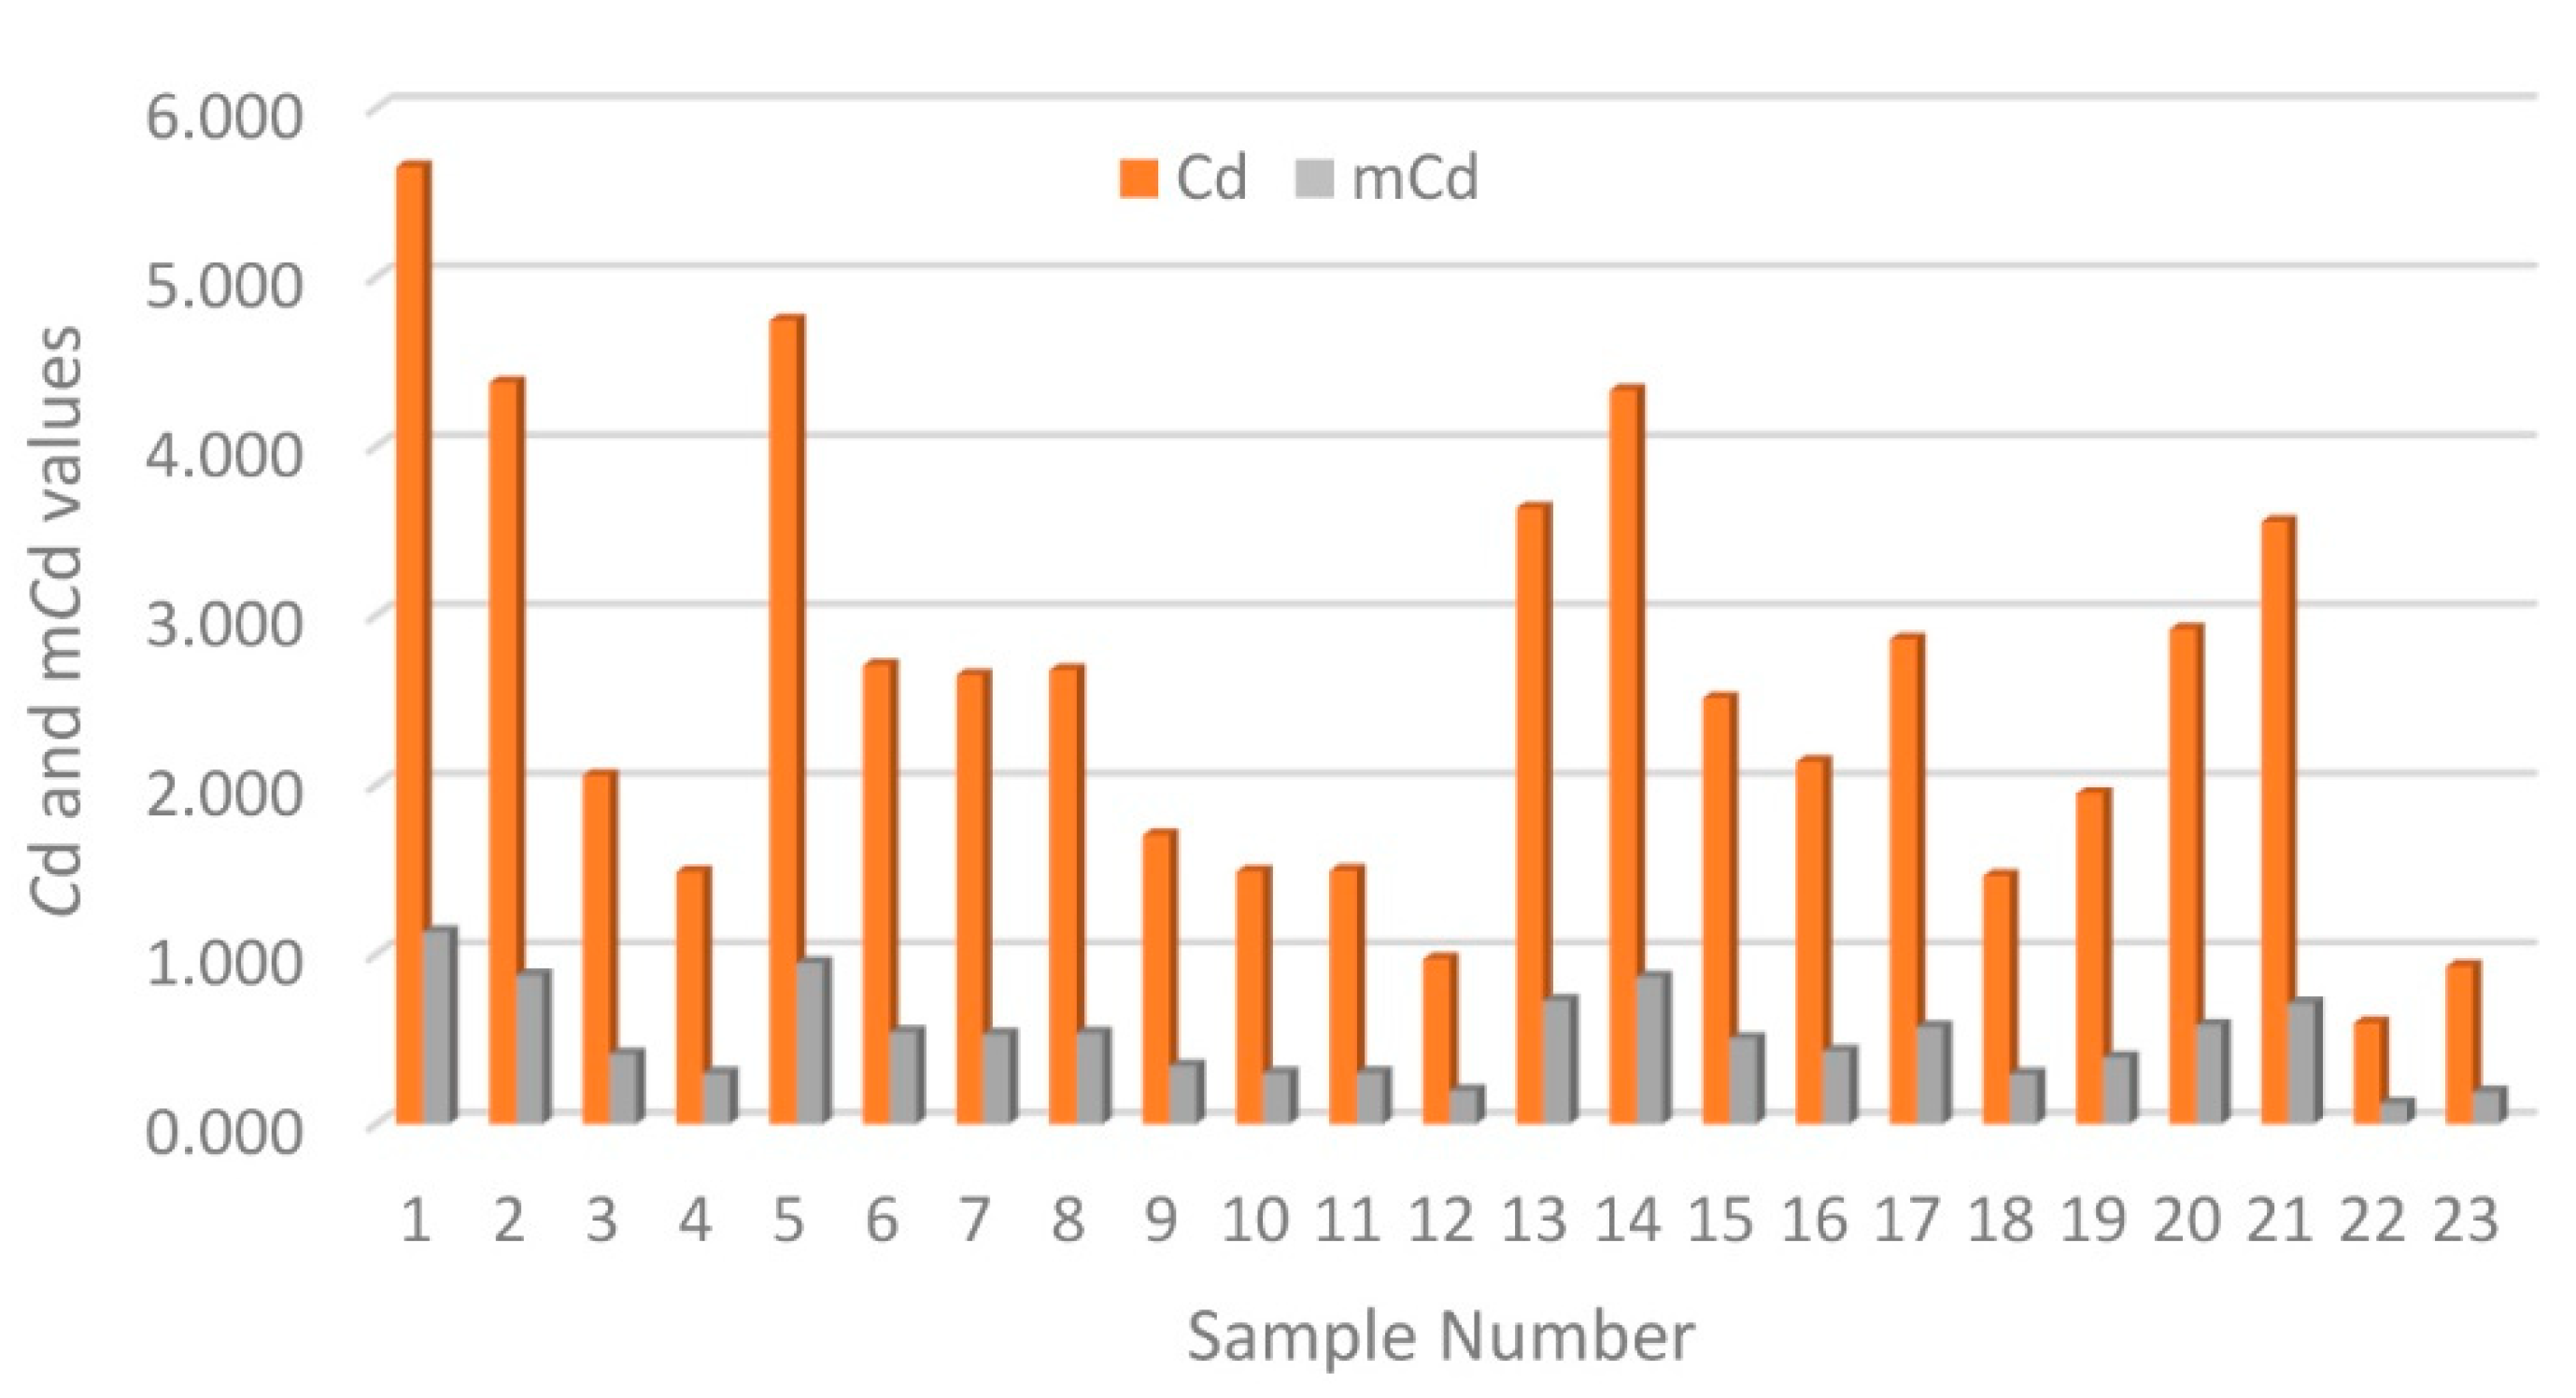
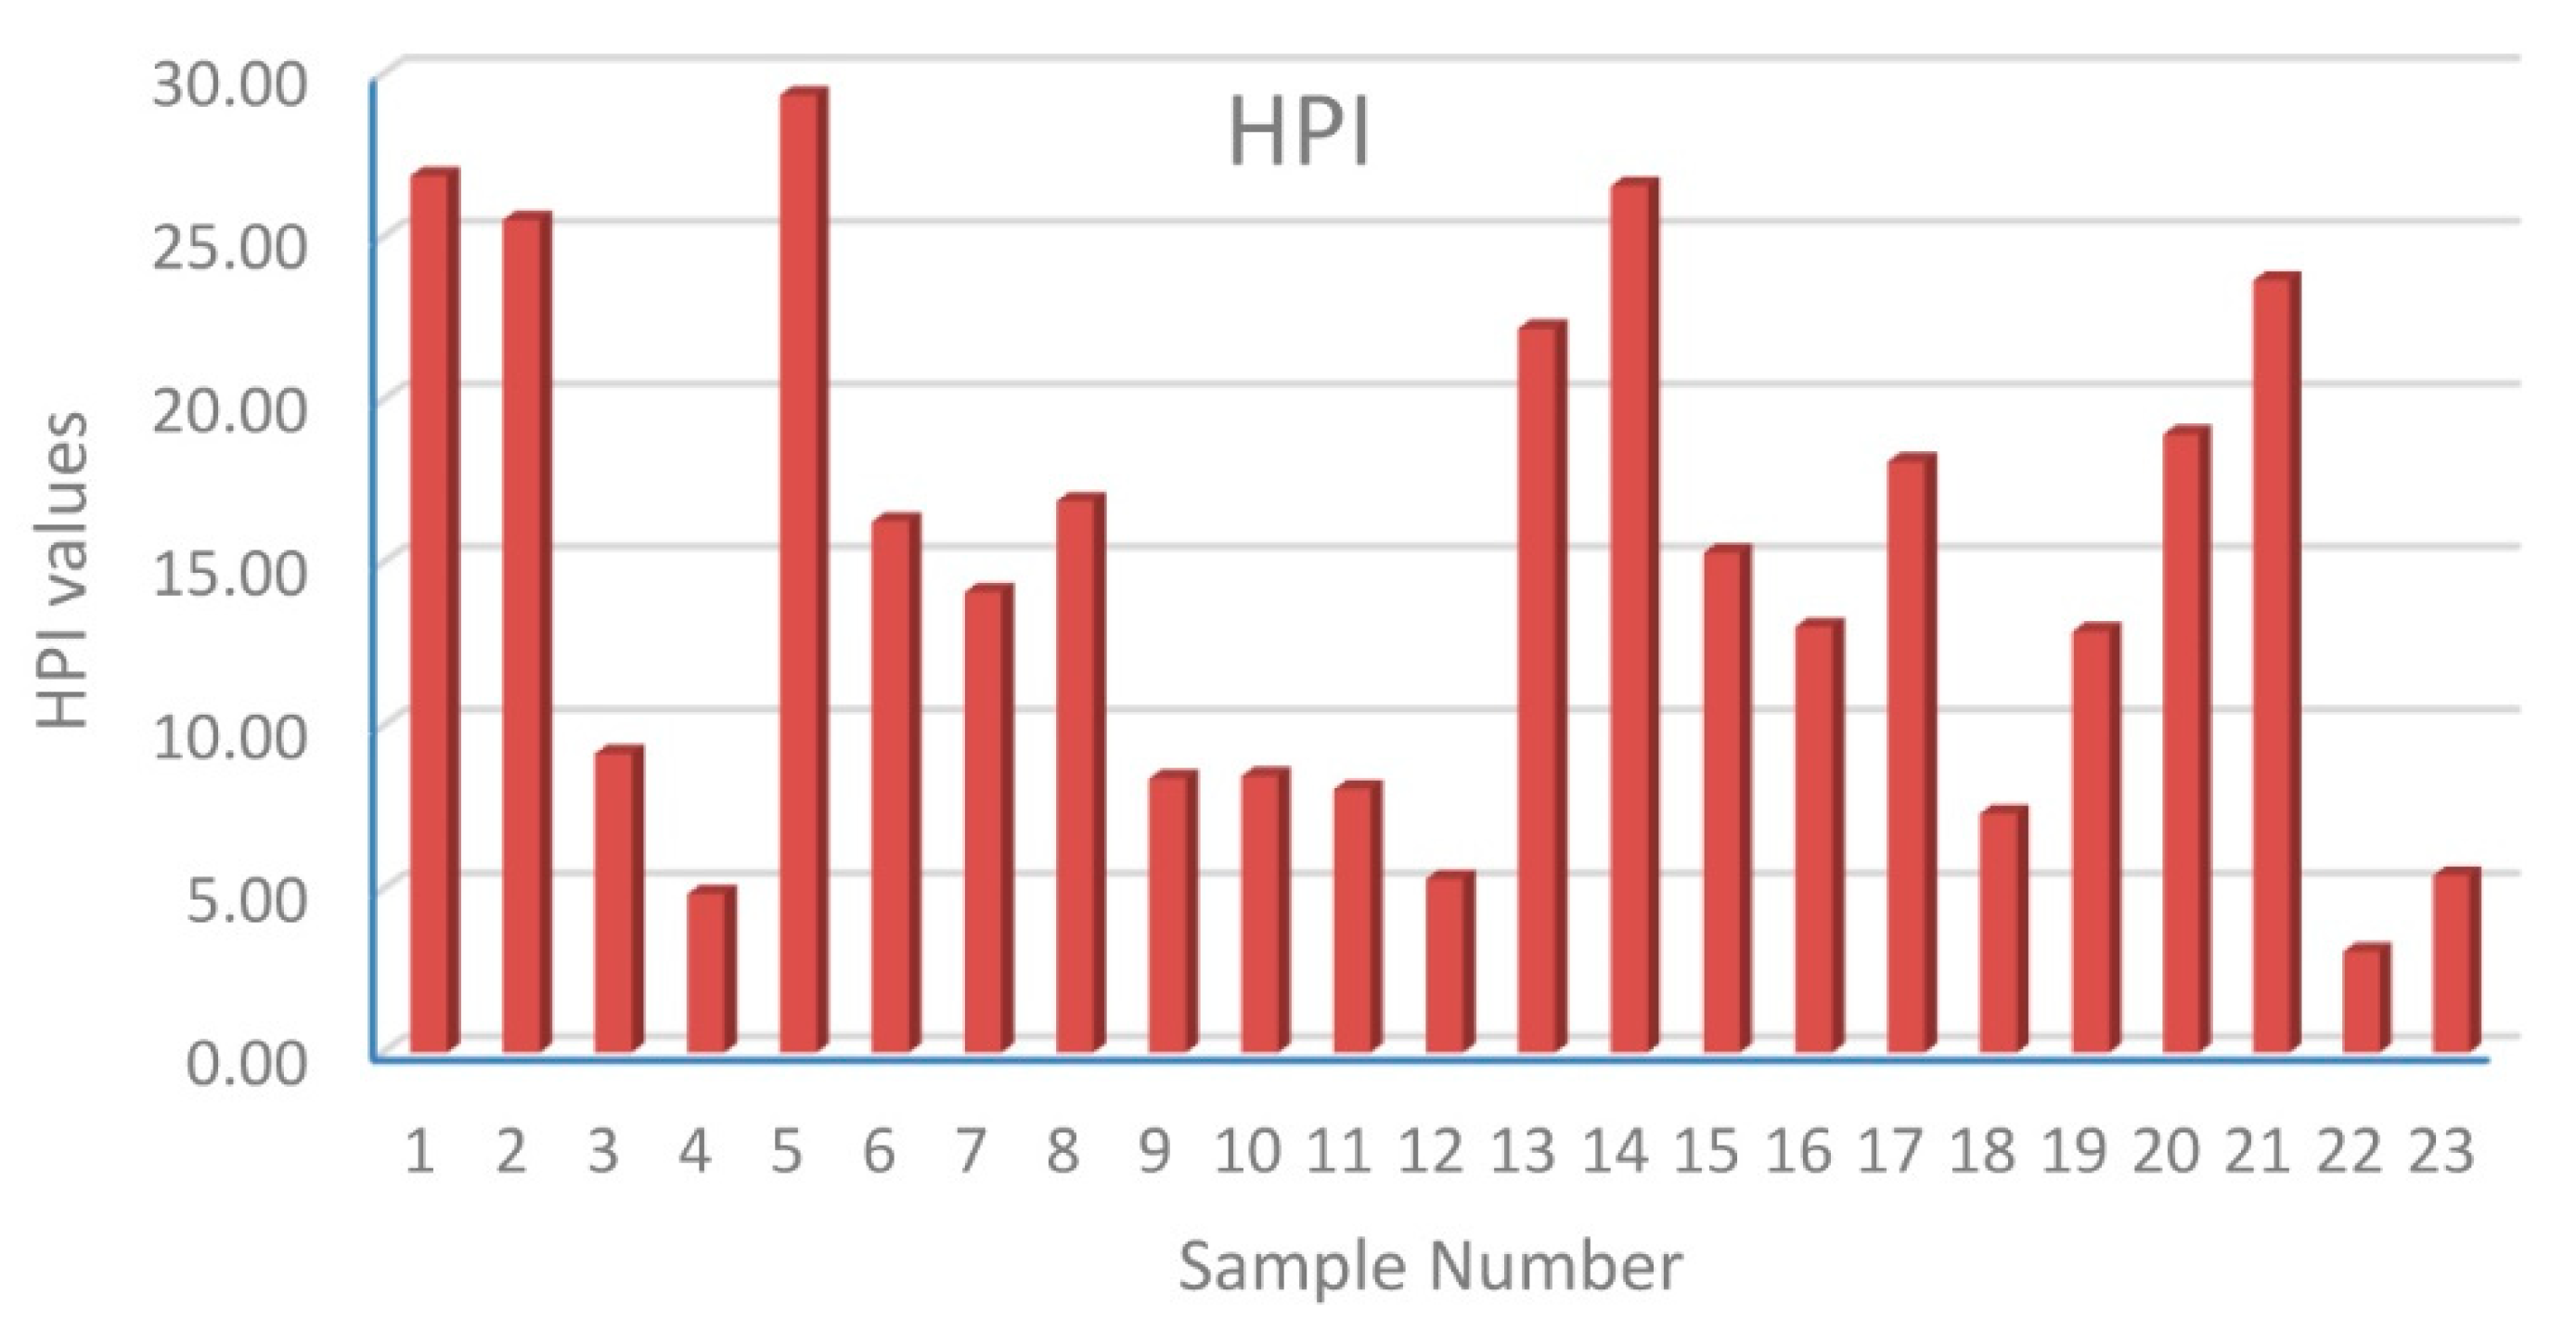
3.1. Distribution and Contamination Assessment of HMs

Supplementary Table S2 displays the lowest, highest, and average levels of HMs as well as the outcomes of the pollution indices employed in this study. The average concentrations of HMs took the following descending order: Zn (6.616 μg/L) > Cd (0.59 μg/L) > Pb (0.284 μg/L) > Cr (0.26860 μg/L) > Fe (0.197 μg/L). The distribution of HMs in each sample location within the research area exhibited a fluctuating pattern without a specific orientation (Figure 2). Nevertheless, certain individual samples exhibited variations in HM amounts, either increasing or decreasing. For example, sample 1, located in the northern region of the research area, had the greatest concentrations of zinc and lead, measuring 30.800 and 1.053 μg/L, respectively. Conversely, samples 20 and 18 in the southern region displayed the lowest concentrations of these two HMs, measuring 1.00 and 0.021 μg/L, respectively. The samples with the highest concentrations of chromium and iron were 20 and 23, respectively, in the southern region of the research area. The concentration of chromium in sample 20 was 0.423 μg/L, while the concentration of iron in sample 23 was 0.414 μg/L. On the other hand, the samples with the lowest concentrations of chromium and iron were 19 and 2, respectively. The concentration of chromium in sample 19 was 0.018 μg/L, while the concentration of iron in sample 2 was 0.021 μg/L. In relation to Cd, samples 2 and 4 in the northern region of the research area exhibited the greatest and lowest concentrations (1.020 and 0.100 μg/L, respectively). The observed rise in HM values in certain individual samples can be ascribed to the composition of the mud and fine sediment present at these locations, which possess the capacity to retain HMs and then release them into the water column [34].
The average levels of HMs in Table 2 were less than the maximum admissible concentration [35]. Average Cr and Fe values were less than those reported from the Al-Uqair coastline, Saudi Arabia [36], the Gulf of Aqaba, Saudi Arabia [37], the Yanbu coastline, Red Sea, Saudi Arabia [22], and Al-Khobar, Arabian Gulf, Saudi Arabia [38]. Moreover, the average Zn value was lower than those reported from Al-Uqair and Al-Khobar seawaters in the Arabian Gulf, Saudi Arabia [36,38]. Differently, the average Zn and Cd values were greater than those reported from Yanbu, the Jazan coastlines, Red Sea, the Sharm Al-Kharrar lagoon, Saudi Arabia, and the Gulf of Aqaba [17,20,39].

3.2. Ecological Assessment of HMs

Assessing the quality of water in surface bodies is an essential aspect of managing surface water. Therefore, evaluating the water quality in aquatic ecosystems of developing countries is currently a significant concern. Water quality indicators have garnered significant interest in recent years in water environment research due to their potential for causing toxic effects, persistence, and bioaccumulation issues that can impact aquatic ecosystems [41,42]. The contamination factor (CF) is a useful method for comparing the levels of HM content [32]. The evaluation of the CF at different sampling sites in Al Lith seawater demonstrated a wide range of circumstances (Table 3). Overall, the seawater samples showed varying levels of contamination with different HMs. The CF values for the HMs followed the following order: Cd (1.97) > Zn (0.331) > Pb (0.284) > Cr (0.054) > Fe (0.00099). This indicates that Cd had a moderate contamination factor, while the other HMs had relatively low levels of contamination [22]. Samples 1, 2, 5, 13, 14, and 31, which account for 26.09% of the samples, had CF values greater than 3 for Cd, indicating a significant contamination factor (Table 3). Furthermore, sample 1 exhibited a moderate contamination factor for Pb and Zn, with values of 1.053 and 1.54, respectively.
The contamination degree (Cd) evaluates the degree of contamination [31]. This assesses the extent to which pollution affects water quality in relation to specific hazardous materials. The water contamination degrees were calculated using Cd values, which represent the amounts of certain hazardous materials that exceeded the permissible limits [43]. The Cd values exhibited substantial diversity among the many investigated sites along the Al Lith shoreline. The Cd results varied from 0.60 to 5.65, with an average of 2.61, suggesting that the overall examined seawaters had low contamination levels [31,44]. Nevertheless, the analysis of Cd values for each sample location (Figure 3) revealed that samples 1, 2, 5, and 14 (which account for 17.39% of the total samples) exhibited Cd levels ranging from 4 to 8, indicating a moderate level of contamination [45]. The distribution pattern of the mCd (WQI) closely resembles that of the Cd. The water quality index (WQI) is a reliable approach for assessing water quality and providing assistance to policy-makers. It combines various water quality criteria into a single numerical value that reflects the overall quality of water [46,47]. The WQI values varied from 0.119 to 1.130, with an average of 0.521, suggesting that the saltwater was not polluted [32].
The heavy metal contamination index (HPI) is a valuable tool for evaluating the influence of particular HMs on the overall quality of water and the suitability of surface water for human consumption [48]. The HPI values indicate the combined impact of various elements on the overall water quality, according to the recommended standard levels (Si) for each metal [49]. Results of HPI for Al Lith seawater ranged from 3.10 to 29.37, with an average of 14.90 (Figure 4), indicating a moderate level of pollution [22]. Out of the total samples, 13 (1, 2, 5–8, 13–17, and 19–21) exhibited HPI values exceeding 10, indicating a high level of pollution. Additionally, seven samples (3, 9–12 18, and 23) had HPI values ranging from 5 to 10, suggesting a moderate level of pollution. The remaining three samples were classified as having low pollution [33]. The samples with higher concentrations of HMs, including Cd, Pb, and Zn, revealed higher HPI values. The samples with higher pollution indices were primarily taken at the mouth of Wadi Al Lith. This suggests that the related HMs may have originated from the volcanic and metamorphic rocks of the Arabian Shield [17].

3.3. Potential Sources of HMs

Environmental data are often analyzed using multivariate modeling techniques, such as cluster analysis (CA) and principal component analysis (PCA), to discover potential sources of pollutants that impact aquatic systems. The strategy described is an efficient method for managing natural resources and aids in the identification of optimal solutions for pollution issues [50,51]. PCA and CA are employed to categorize HMs or examined parameters into separate factors or groups, depending on the anticipated source of contribution. These techniques aid in the arrangement and streamlining of extensive datasets, offering valuable insights [52]. Industrial operations and the use of sewage sludge or superphosphate have significantly contributed to the introduction of lead (Pb) and cadmium (Cd) into the environment [8,10]. Lead–acid batteries are the primary global application of Pb. Furthermore, Cd is mostly utilized in the manufacturing of Ni-Cd and Ag-Cd batteries. Additionally, the nonferric metal industry and agricultural practices are human-made sources of zinc (Zn). The bauxite parent material naturally contains a high concentration of zinc.
Correlation analysis is a method used to quantify the degree of linear relationship between two variables and to find the sources of HMs that have a strong correlation [53,54]. The correlation matrix in Table 4 revealed negative and weak correlations among all HM pairs, except for a positive correlation between Pb and Zn (r = 0.738). This suggests that the sources of Pb and Zn in the study area are primarily anthropogenic. Zinc is a crucial constituent of diverse alloys, pipes, batteries, and home devices. Additionally, it is extensively employed as a catalyst in numerous rubber, lubricant, and pesticide goods [55]. The primary sources of Pb include Pb-containing paints, industrial and agricultural effluents, landfilling, and home wastewaters, together with natural sources of Pb and Zn [56,57]. The absence of substantial correlations among numerous HM pairs suggests the presence of multiple sources of contamination [58]. Furthermore, the lack of a significant association between Fe and other HMs indicates that these HMs do not primarily come from natural sources and that iron oxy-hydroxides do not contribute to the distribution of HMs in the analyzed samples [52].
Principal component analysis (PCA) categorizes HMs into many main components by examining the interplay among various variables [58]. PCA in the study area produces two PCs, which account for 46.10% and 22.41% of the variance, respectively. Together, these components explain a total of 68.51% of the variation (Table 5). PC1 shows a substantial positive loading with Zn (0.757) and Pb (0.903), implying anthropogenic factors, mostly from industrial and agricultural effluents. PC2 has a positive loading with Cd (0.681), indicating another anthropogenic source. The high loading of Zn in the two PCs could be related to mixed natural and human factors [59,60].
The successful reduction in maritime pollution relies not only on technological advancements and natural methods but also on strong policy and regulation. Implementing rigorous regulations on waste disposal, industrial emissions, and runoff can successfully reduce the influx of new pollutants [61]. Promoting the adoption of environmentally friendly technologies and sustainable behaviors is an effective way to reduce pollution at its source. Stringent policy implementation and widespread public education campaigns are essential for the preservation of cleaner and more sustainable marine ecosystems [62].

4. Conclusions

This study employed the use of CF, Cd, WQI, and HPI, as well as CA and PCA, to evaluate the ecological hazards posed by Cr, Cd, Fe, Zn, and Pb in seawaters along the Al Lith coastal area and identify the possible origins of these HMs. The HMs were arranged in descending order according to their average: zinc (6.616 μg/L) > cadmium (0.59 μg/L) > lead (0.284 μg/L) > chromium (0.26860 μg/L) > iron (0.197 μg/L). The distribution of HMs per sample location in the study area exhibited a shifting pattern, with certain individual samples displaying varying levels of increase or reduction. The increase in HM values in certain samples could be due to the presence of mud and fine sediment at these locations, which retain HMs and subsequently release them into the water column. However, the average levels of HMs were below the maximum allowable concentration set by the World Health Organization. The studied seawater showed low to moderate contamination levels based on the measurements of CF, Cd, WQI, and HPI. Nevertheless, certain individual samples exhibited significant pollution levels. The samples with higher concentrations of heavy metals, including cadmium (Cd) and zinc (Zn), showed higher levels of contamination. Both CA and PCA proposed that the basement rocks of the Arabian Shield are natural sources of HMs, but anthropogenic sources might be responsible. Nevertheless, human activities have been identified as the main causes of Pb, Cd, and Zn contamination, mostly through the release of pollutants from industrial, agricultural, and home sources. Future studies should focus on investigating the long-term effects of human interventions on coastal ecosystems and aquatic species in the Al Lith coastal area. Moreover, physicochemical parameters and water quality indices, supported by GIS techniques, multivariate modeling, and future investigations, should evaluate the efficacy of different management strategies and remediation initiatives designed to reduce HM concentrations and improve overall water quality in the area.

Supplementary Materials

The following supporting information can be downloaded at https://www.mdpi.com/article/10.3390/w16131923/s1; Table S1: The internal standard quality control samples; Table S2: Concentration of HMs (μg/L) along with results of some contamination indices applied in this study.

Author Contributions

Conceptualization, T.A.; investigation, A.S.E.-S.; methodology, T.A., A.S.E.-S. and K.A.-K.; software, T.A. and A.S.E.-S.; supervision, T.A.; visualization, T.A.; writing—original draft, T.A., A.S.E.-S. and K.A.-K.; writing—review and editing, T.A., A.S.E.-S. and K.A.-K. All authors have read and agreed to the published version of the manuscript.

Funding

Researchers Supporting Project (Number RSPD2024R791), King Saud University, Riyadh, Saudi Arabia.

Data Availability Statement

Data are contained within the article.

Acknowledgments

The authors extend their appreciation to Researchers Supporting Project number (RSPD2024R791), King Saud University, Riyadh, Saudi Arabia. Moreover, the authors thank the anonymous reviewers for their valuable suggestions and constructive comments.

Conflicts of Interest

The authors declare no conflicts of interest.

References

  1. Wang, C.; Zou, X.; Feng, Z.; Hao, Z.; Gao, J. Distribution and transport of heavy metals in estuarine–inner shelf regions of the East China Sea. Sci. Total Environ. 2018, 644, 298–305. [Google Scholar] [CrossRef] [PubMed]
  2. Er-Ramy, N.; Nachite, D.; Anfuso, G.; Williams, A.T. Coastal Scenic Quality Assessment of Moroccan Mediterranean Beaches: A Tool for Proper Management. Water 2022, 14, 1837. [Google Scholar] [CrossRef]
  3. Pásková, M.; Štekerová, K.; Zanker, M.; Lasisi, T.T.; Zelenka, J. Water pollution generated by tourism: Review of system dynamics models. Heliyon 2024, 10, e23824. [Google Scholar] [CrossRef]
  4. Zhang, G.; Zhang, P.; Zhang, Z.G.; Li, J. Impact of environmental regulations on industrial structure upgrading: An empirical study on Beijing-Tianjin-Hebei region in China. J. Clean. Prod. 2019, 238, 117848. [Google Scholar] [CrossRef]
  5. Azdem, D.; Mabrouki, J.; Moufti, A.; El Hajjaji, S.; Fatni, A. Assessment of heavy metal contamination in seawater in Agadir coastline, Morocco. Desalination Water Treat. 2024, 317, 100129. [Google Scholar] [CrossRef]
  6. Athar, M.; Vohora, S.B. Heavy Metals and Environment; New Age International: Delhi, India, 1995. [Google Scholar]
  7. Shafiq, H.B.; Ajaz, M.; Rasool, S.A. Bacterial and toxic pollutants in lakes of river Indus. Pak. J. Bot. 2011, 43, 1765–1772. [Google Scholar]
  8. Hader, D.-P.; Helbling, E.W.; Villafane, V.E. Anthropogenic Pollution of Aquatic Ecosystems; Springer Nature: Cham, Switzerland, 2021; 426p. [Google Scholar] [CrossRef]
  9. Wang, W. Interactions of trace metals and different marine food chains. Mar. Ecol. Prog. Ser. 2002, 243, 295–309. [Google Scholar] [CrossRef]
  10. Steffan, J.J.; Brevik, E.C.; Burgess, L.C.; Cerdà, A. The effect of soil on human health: An overview. Eur. J. Soil Sci. 2018, 69, 159–171. [Google Scholar] [CrossRef]
  11. Abadin, H.; Ashizawa, A.; Stevens, Y.; Llados, F.; Diamond, G.; Sage, G.; Quinones, A.; Bosch, S.; Swarts, S. Toxicological Profile for Lead, Atlanta (GA): Agency for Toxic Substances and Disease Registry (US); Lewis Publishers: Boca Raton, FL, USA, 2007. [Google Scholar]
  12. Nishijo, M.; Nakagawa, H.; Suwazono, Y.; Nogawa, K.; Kido, T. Causes of death in patients with Itai-itai disease suffering from severe chronic cadmium poisoning: A nested case-control analysis of a follow-up study in Japan. BMJ Open 2017, 7, e015694. [Google Scholar] [CrossRef] [PubMed]
  13. Badr, N.B.E.; El-Fiky, A.A.; Mostafa, A.R.; Al-Mur, B.A. Metal pollution records in core sediments of some Red Sea coastal areas, Kingdom of Saudi Arabia. Environ. Monit. Assess. 2009, 155, 509–526. [Google Scholar] [CrossRef]
  14. Pan, K.; Lee, O.O.; Qian, P.-Y.; Wang, W.-X. Sponges and sediments as monitoring tools of metal contamination in the eastern coast of the Red Sea, Saudi Arabia. Mar. Pollut. Bull. 2011, 62, 1140–1146. [Google Scholar] [CrossRef] [PubMed]
  15. Al-Sofyani, A.A.; Marimuthu, N.; Wilson, J.J. A rapid assessment of Scleractinian and non-Scleractinian coral growth forms along the Saudi Arabian coast, Red Sea. J. Ocean Univ. China 2014, 13, 243–248. [Google Scholar] [CrossRef]
  16. Ghandour, I.M.; Basaham, S.; Al-Washmi, A.; Masuda, H. Natural and anthropogenic controls on sediment composition of an arid coastal environment: Sharm Obhur, Red Sea, Saudi Arabia. Environ. Monit. Assess. 2014, 186, 1465–1484. [Google Scholar] [CrossRef] [PubMed]
  17. Kahal, A.Y.; El-Sorogy, A.S.; Qaysi, S.I.; Al-Hashim, M.H.; Al-Dossari, A. Environmental Risk Assessment and Sources of Potentially Toxic Elements in Seawater of Jazan Coastal Area, Saudi Arabia. Water 2023, 15, 3174. [Google Scholar] [CrossRef]
  18. Al-Mur, B.A.; Quicksall, A.N.; Al-Ansari, A.M. Spatial and temporal distribution of heavy metals in coastal core sediments from the Red Sea, Saudi Arabia. Oceanologia 2017, 59, 262–270. [Google Scholar] [CrossRef]
  19. Karuppasamy, M.; Qurban, M.A.B.; Krishnakumar, P.K. Metal Contamination Assessment in the Sediments of the Red Sea Coast of Saudi Arabia. In Oceanographic and Biological Aspects of the Red Sea; Springer: Cham, Switzerland, 2019; pp. 147–170. [Google Scholar] [CrossRef]
  20. Youssef, M.; El-Sorogy, A.; Al-Kahtany, K.; Madkour, H. Status of trace metals in surface seawater of Sharm Al-Kharrar lagoon, Saudi Arabia. Arab. J. Geosci. 2021, 14, 748. [Google Scholar] [CrossRef]
  21. El-Sorogy, A.S.; Youssef, M. Pollution assessment of the Red Sea-Gulf of Aqaba seawater, northwest Saudi Arabia. Environ. Monit. Assess. 2021, 193, 141. [Google Scholar] [CrossRef] [PubMed]
  22. El-Sorogy, A.S.; Youssef, M.; Al-Hashim, M.H. Water Quality Assessment and Environmental Impact of Heavy Metals in the Red Sea Coastal Seawater of Yanbu, Saudi Arabia. Water 2023, 15, 201. [Google Scholar] [CrossRef]
  23. Amin, A.A.; Mesaed, A.A. The Role of the Geologic and the Geomorphologic Factors in the Formation of Some Geotourism Sites of Saudi Arabia. In Geotourism in the Middle East; Springer International Publishing: Cham, Switzerland, 2023; pp. 193–234. [Google Scholar]
  24. Shanti, G. Geology of the Arabian Shield; Ministry of Agriculture, and Water: Jeddah, Saudi Arabia, 1993.
  25. Hussein, M.T.; Lashin, A.; Al Bassam, A.; Al Arifi, N.; Al Zahrani, I. Geothermal power potential at the western coastal part of Saudi Arabia. Renew. Sustain. Energy Rev. 2013, 26, 668–684. [Google Scholar] [CrossRef]
  26. Vogel, H. Guidelines for Groundwater Sampling. 2005. Available online: http://www.limpopo.riverawarenesskit.org/limpoporak_com/index.htm (accessed on 25 April 2019).
  27. Yidana, S.M.; Ophori, D.; Banoeng-Yakubo, B. Groundwater quality evaluation for productive uses—The Afram Plains area, Ghana. J. Irrig. Drain Eng. 2008, 134, 222–227. [Google Scholar] [CrossRef]
  28. Khan, M.Y.A.; ElKashouty, M.; Bob, M. Impact of rapid urbanization and tourism on the groundwater quality in Al Madinah city, Saudi Arabia: A monitoring and modeling approach. Arab. J. Geosci. 2020, 13, 922. [Google Scholar] [CrossRef]
  29. Ghani, S.A.; Hamdona, S.; Shakweer, L.; El Saharty, A. Spatial distribution and pollution assessment of heavy metals in surface and bottom water along the eastern part of the Egyptian Mediterranean coast. Mar. Pollut. Bull. 2023, 197, 115713. [Google Scholar] [CrossRef]
  30. Simou, A.; Mrabet, A.; Abdelfattah, B.; Bougrine, O.; Khaddor, M.; Allali, N. Distribution, ecological, and health risk assessment of trace elements in the surface seawater along the littoral of Tangier Bay (Southwestern Mediterranean Sea). Mar. Pollut. Bull. 2024, 202, 116362. [Google Scholar] [CrossRef] [PubMed]
  31. Håkanson, L. An ecological risk index for aquatic pollution control. A sedimentological approach. Water Res. 1980, 14, 975–1001. [Google Scholar] [CrossRef]
  32. Abrahim, G.M.S.; Parker, R.J. Assessment of heavy metal enrichment factors and the degree of contamination in marine sediments from Tamaki Estuary, Auckland, New Zealand. Environ. Monit. Assess. 2007, 136, 227–238. [Google Scholar] [CrossRef] [PubMed]
  33. Prasanna, M.V.; Praveena, S.M.; Chidambaram, S.; Nagarajan, R.; Elayaraja, A. Evaluation of water quality pollution indices for heavy metal contamination monitoring: A case study from Curtin Lake, Miri City, East Malaysia. Environ. Earth Sci. 2012, 67, 1987–2001. [Google Scholar] [CrossRef]
  34. Al-Kahtany, K.; El-Sorogy, A.S. Heavy metal contamination of surface seawaters in Abu Ali Island, Saudi Arabia. Arab. J. Geosci. 2022, 15, 1662. [Google Scholar] [CrossRef]
  35. World Health Organization (WHO). Guidelines for Drinking-Water Quality, 4th ed.; WHO: Geneva, Switzerland, 2011.
  36. Al-Hashim, M.H.; El-Sorogy, A.S.; Alshehri, F.; Qaisi, S. Environmental Assessment of Surface Seawater in Al-Uqair Coastline, Eastern Saudi Arabia. Water 2022, 14, 3423. [Google Scholar] [CrossRef]
  37. Al-Taani, A.A.; Batayneh, A.; Nazzal, Y.; Ghrefat, H.; Elawadi, E.; Zaman, H. Status of trace metals in surface seawater of the Gulf of Aqaba, Saudi Arabia. Mar. Pollut. Bull. 2014, 86, 582–590. [Google Scholar] [CrossRef] [PubMed]
  38. Alharbi, T.; Alfaifi, H.; El-Sorogy, A. Metal pollution in Al-Khobar seawater, Arabian Gulf, Saudi Arabia. Mar. Pollut. Bull. 2017, 119, 407–415. [Google Scholar] [CrossRef] [PubMed]
  39. Shriadah, M.A.; Okbah, M.A.; El-Deek, M.S. Trace metals in the water columns of the Red Sea and the Gulf of Aqaba, Egypt. Water Air Soil Pollut. 2004, 153, 115–124. [Google Scholar] [CrossRef]
  40. Alharbi, T.; El-Sorogy, A.S. Assessment of seawater pollution of the Al-Khafji coastal area, Arabian Gulf, Saudi Arabia. Environ. Monit. Assess. 2019, 191, 383. [Google Scholar] [CrossRef]
  41. Carr, G.M.; Neary, J.P. Water quality for ecosystem and human health. In United Nations Environment Programme Global Environment Monitoring System/Water Programme; GEMS Burlington: Burlington, ON, Canada, 2006. [Google Scholar]
  42. Gad, M.; El-Safa, M.M.A.; Farouk, M.; Hussein, H.; Alnemari, A.M.; Elsayed, S.; Khalifa, M.M.; Moghanm, F.S.; Eid, E.M.; Saleh, A.H. Integration of Water Quality Indices and Multivariate Modeling for Assessing Surface Water Quality in Qaroun Lake, Egypt. Water 2021, 13, 2258. [Google Scholar] [CrossRef]
  43. Alqarawy, A.; El Osta, M.; Masoud, M.; Elsayed, S.; Gad, M. Use of Hyperspectral Reflectance and Water Quality Indices to Assess Groundwater Quality for Drinking in Arid Regions, Saudi Arabia. Water 2022, 14, 2311. [Google Scholar] [CrossRef]
  44. Lü, D.; Zheng, B.; Fang, Y.; Shen, G.; Liu, H. Distribution and pollution assessment of trace metals in seawater and sediment in Laizhou Bay. Chin. J. Oceanol. Limnol. 2015, 33, 1053–1061. [Google Scholar] [CrossRef]
  45. Backman, B.; Bodis, D.; Lahermo, P.; Rapant, S.; Tarvainen, T. Application of a groundwater contamination index in Finlandand Slovakia. Environ. Geol. 1997, 36, 55–64. [Google Scholar] [CrossRef]
  46. Lateef, K.H. Evaluation of Groundwater Quality for Drinking Purpose for Tikrit and Samarra Cities using Water Quality Index. Eur. J. Sci. Res. 2011, 58, 472–481. [Google Scholar]
  47. Alghamdi, A.G.; Aly, A.A.; Aldhumri, S.A.; Al-Barakaha, F.N. Hydrochemical and Quality Assessment of Groundwater Resources in Al-Madinah City, Western Saudi Arabia. Sustainability 2020, 12, 3106. [Google Scholar] [CrossRef]
  48. Prasad, B.; Kumari, S. Heavy metal pollution index of ground water of an abandoned open cast mine filled with fly ash: A case study. Mine Water Environ. 2008, 27, 265–267. [Google Scholar] [CrossRef]
  49. Khan, R.; Saxena, A.; Shukla, S.; Sekar, S.; Senapathi, V.; Wu, J. Environmental contamination by heavy metals and associated human health risk assessment: A case study of surface water in Gomti River Basin, India. Environ. Sci. Pollut. Res. 2021, 28, 56105–56116. [Google Scholar] [CrossRef]
  50. De Bartolomeo, A.; Poletti, L.; Sanchini, G.; Sebastiani, B.; Morozzi, G. Relationship among parameters of lake polluted sediments evaluated by multivariate statistical analysis. Chemosphere 2004, 55, 1323–1329. [Google Scholar] [CrossRef] [PubMed]
  51. Saleh, A.H.; Gad, M.; Khalifa, M.M.; Elsayed, S.; Moghanm, F.S.; Ghoneim, A.M.; Danish, S.; Datta, R.; Moustapha, M.E.; El-Safa, M.M.A. Environmental Pollution Indices and Multivariate Modeling Approaches for Assessing the Potentially Harmful Elements in Bottom Sediments of Qaroun Lake, Egypt. J. Mar. Sci. Eng. 2021, 9, 1443. [Google Scholar] [CrossRef]
  52. Tariq, R.S.; Shah, M.H.; Shaheen, N.; Khalique, A.; Manzoor, S.; Jaffar, M. Multivariate analysis of selected metals in tanneryeffluents and related soil. J. Hazard. Mater. 2005, 122, 17–22. [Google Scholar] [CrossRef] [PubMed]
  53. Li, Y.; Duan, Z.; Liu, G.; Kalla, P.; Scheidt, D.; Cai, Y. Evaluation of the Possible Sources and Controlling Factors of Toxic Metals/Metalloids in the Florida Everglades and Their Potential Risk of Exposure. Environ. Sci. Technol. 2015, 49, 9714–9723. [Google Scholar] [CrossRef] [PubMed]
  54. Yin, Z.; Luo, Q.; Wu, J.; Xu, S.; Wu, J. Identification of the long-term variations of groundwater and their governing factors based on hydrochemical and isotopic data in a river basin. J. Hydrol. 2021, 592, 125604. [Google Scholar] [CrossRef]
  55. Kabata-Pendias, A. Trace Elements of Soils and Plants, 4th ed.; CRC Press: Boca Raton, FL, USA; Taylor & Francis Group, LLC: Abingdon, UK, 2011; p. 505. [Google Scholar]
  56. Gupta, A.; Rai, D.K.; Pandey, R.S.; Sharma, B. Analysis of some heavy metals in the riverine water, sediments and fish from river Ganges at Allahabad. Environ. Monit. Assess. 2009, 157, 449–458. [Google Scholar] [CrossRef] [PubMed]
  57. Valdés, J.; Vargas, G.; Sifeddine, A.; Ortlieb, L.; Guiñez, M. Distribution and enrichment evaluation of heavy metals in Mejillones Bay (23_S), Northern Chile: Geochemical and statistical approach. Mar. Pollut. Bull. 2005, 50, 1558–1568. [Google Scholar] [CrossRef] [PubMed]
  58. Kumar, S.B.; Padhi, R.K.; Mohanty, A.K.; Satpathy, K.K. Distribution and ecological- and health-risk assessment of heavy metals in the seawater of the southeast coast of India. Mar. Pollut. Bull. 2020, 161, 111712. [Google Scholar] [CrossRef]
  59. Arab, L.H.; Boutaleb, A.; Berdous, D. Environmental assessment of heavy metal pollution in the polymetallic district of Kef Oum Teboul (El Kala, Northeast Algeria). Environ. Earth Sci. 2021, 80, 277. [Google Scholar] [CrossRef]
  60. Javed, T.; Ahmad, N.; Mashiatullah, A. Heavy metals contamination and ecological risk assessment in surface sediments of Namal Lake, Pakistan. Pol. J. Environ. Stud. 2018, 27, 675–688. [Google Scholar] [CrossRef]
  61. Zhang, Y.; Cai, Q. The application of electrochemical technologies in water and wastewater treatment. Sep. Purif. Technol. 2016, 176, 130–139. [Google Scholar]
  62. Lofrano, G.; Brown, J. Wastewater management through the ages: A history of mankind. Sci. Total Environ. 2010, 408, 5254–5264. [Google Scholar] [CrossRef] [PubMed]
Figure 1. Location map and sampling sites of Al Lith seawater (a,b).
Water 16 01923 g001
Figure 2. Distribution of heavy metals per sample locations in Al Lith seawater.
Water 16 01923 g002aWater 16 01923 g002b
Figure 3. Distribution of Cd and mCd per sample locations in Al Lith seawater.
Water 16 01923 g003
Figure 4. Distribution of HPI per sample locations in Al Lith seawater.
Water 16 01923 g004
Table 1. Classification of the contamination indices applied in this study [31,32,33].
IndexValueContamination Level
CFCF < 1Low contamination factor
1 ≤ CF <3Moderate contamination factor
3 ≤ CF < 6Considerable contamination factor
CF ≥ 6Very high contamination factor
CdCd < 4Low contamination degree
Cd = 4–8Moderate contamination degree
Cd > 8Very high contamination degree
mCd<1.5Uncontaminated
1.5 ≤ mCd < 2Slightly contaminated
2 ≤ mCd < 4Moderately contaminated
4 ≤ mCd < 8Moderately to heavily contaminated
8 ≤ mCd < 16Heavily contaminated
16 ≤ mCd < 32Severely contaminated
mCd ≥ 32Extremely contaminated
HPIHPI < 5Low pollution
HPI = 5–10Medium pollution
HPI > 10High pollution
Table 2. Average concentration of HMs (μg/L) in Al Lith seawaters as compared to worldwide and maximum admissible concentrations.
ReferencesCrFeZnPbCd
Present study0.2680.1976.6160.2840.59
Jazan coastline, Saudi Arabia [17]1.28-1.042.270.06
Sharm Al-Kharrar lagoon, Saudi Arabia [20]0.26-4.190.280.06
Red Sea-Gulf of Aqaba, Saudi Arabia [21]0.261.815.511.310.05
Yanbu coastline, Red Sea, Saudi Arabia [22]0.720.9831.670.280.31
Maximum admissible concentration [35]50.020040.010.03.00
Al-Uqair coastline, Saudi Arabia [36]9.646.136.720.260.05
Gulf of Aqaba, Saudi Arabia [37]0.9615.2553.320.200.03
Al-Khobar, Arabian Gulf, Saudi Arabia [38]1.383.5416.210.040.11
Gulf of Aqaba [39]-1.780.240.320.57
Al-Khafji, Arabian Gulf, Saudi Arabia [40]0.700.991.530.280.07
Table 3. The contamination factor for heavy metal(loid)s in seawater of Al Lith area.
S.N.CF Values
CdCrFePbZn
13.0000.0580.00031.0531.540
23.4000.0590.00010.6120.305
31.0000.0590.00060.6560.340
40.3300.0550.00020.6040.495
54.0300.0660.00010.2860.360
62.2000.0620.00030.1490.295
71.7700.0670.00070.4090.405
82.3700.0740.00030.1320.105
91.0000.0670.00050.3260.310
101.1300.0750.00120.1850.095
111.0300.0760.00080.1640.220
120.7000.0750.00050.0860.110
133.0300.0740.00120.2260.300
143.6700.0740.00120.5030.085
152.1000.0820.00110.1200.210
161.7700.0040.00130.1700.195
172.5000.0040.00160.0880.265
180.8700.0850.00190.0210.490
191.8300.0040.00110.0520.060
202.7000.0850.00170.0810.050
213.3700.0040.00180.0320.150
220.3700.0040.00170.0230.200
230.7300.0440.00210.0540.095
Min.0.3300.0040.00010.0210.050
Max.4.0300.0850.00211.0531.540
Aver.1.9700.0540.00100.2840.331
Table 4. Correlation matrix of the investigated HMs.
CrCdFeZnPb
Cr1
Cd−0.1751
Fe−0.3260.2281
Zn0.099−0.019−0.3471
Pb0.214−0.176−0.596 **0.738 **1
Note(s): ** Correlation is significant at the 0.01 level (2-tailed).
Table 5. Principal component loadings and variance percentage for the extracted two components.
Component
PC1PC2
Cr0.445−0.568
Cd−0.3290.681
Fe−0.7820.159
Zn0.7570.497
Pb0.9030.250
% of Variance46.1022.41
Cumulative %46.1068.51
Disclaimer/Publisher’s Note: The statements, opinions and data contained in all publications are solely those of the individual author(s) and contributor(s) and not of MDPI and/or the editor(s). MDPI and/or the editor(s) disclaim responsibility for any injury to people or property resulting from any ideas, methods, instructions or products referred to in the content.

