Article

Green Infrastructure Microbial Community Response to Simulated Pulse Precipitation Events in the Semi-Arid Western United States

by
Yvette D. Hastings
1,*,†,
Rose M. Smith
2,
Kyra A. Mann
1,
Simon Brewer
1,
Ramesh Goel
3,
Sarah Jack Hinners
4 and
Jennifer Follstad Shah
1,*
1
School of Environment, Society & Sustainability, University of Utah, Salt Lake City, UT 84112, USA
2
Sageland Collaborative, Salt Lake City, UT 84101, USA
3
Department of Civil & Environmental Engineering, University of Utah, Salt Lake City, UT 84112, USA
4
Red Butte Garden, University of Utah, Salt Lake City, UT 84108, USA
*
Authors to whom correspondence should be addressed.
Current Adress: Gianforte School of Computing, Montana State University, Bozeman, MT 59717, USA.
Water 2024, 16(13), 1931; https://doi.org/10.3390/w16131931
Submission received: 30 May 2024 / Revised: 28 June 2024 / Accepted: 3 July 2024 / Published: 7 July 2024

Abstract

:
Processes driving nutrient retention in stormwater green infrastructure (SGI) are not well quantified in water-limited biomes. We examined the role of plant diversity and physiochemistry as drivers of microbial community physiology and soil N dynamics post precipitation pulses in a semi-arid region experiencing drought. We conducted our study in bioswales receiving experimental water additions and a montane meadow intercepting natural rainfall. Pulses of water generally elevated soil moisture and pH, stimulated ecoenzyme activity (EEA), and increased the concentration of organic matter, proteins, and N pools in both bioswale and meadow soils. Microbial community growth was static, and N assimilation into biomass was limited across pulse events. Unvegetated plots had greater soil moisture than vegetated plots at the bioswale site, yet we detected no clear effect of plant diversity on microbial C:N ratios, EEAs, organic matter content, and N pools. Differences in soil N concentrations in bioswales and the meadow were most directly correlated to changes in organic matter content mediated by ecoenzyme expression and the balance of C, N, and P resources available to microbial communities. Our results add to growing evidence that SGI ecological function is largely comparable to neighboring natural vegetated systems, particularly when soil media and water availability are similar.

1. Introduction

Construction of stormwater green infrastructure (SGI) facilities has become a popular approach for controlling stormwater surges and reducing pollutant loads to surface and ground waters in urban areas [1,2,3], factors which lead to impairment of freshwater resources when abated [4,5]. SGI includes development designs incorporating natural and vegetated landscapes (e.g., green roofs, bioswales, parks) that collect and filter stormwater. Studies of SGI performance have primarily been conducted in mesic environments or laboratory-controlled microcosms, whereas field-based studies of SGI from semi-arid to arid environments are much more limited [2]. An urgency to mitigate the impairment of freshwater resources encourages practitioners to construct systems designed for conditions found in other regions and rely on intuition-based decisions in systems management, leading to controversies regarding best management practices [3].
Retention of nitrogen is a common functional design objective of SGI [1,6]. Globally, bioavailable nitrogen (N) has doubled due to human activities [7], resulting in eutrophication of urban waterways [4,5]. N inputs to surface and ground waters are often sourced from point (e.g., storm drain) and non-point (e.g., fertilized lawns, riparian areas) run-off [4].Many urban areas around the globe also experience wet and dry inorganic N deposition in quantities greater than rural areas in close proximity [8]. Hence, efforts to divert runoff to SGI prior to discharge to receiving surface and ground waters is an appropriate goal.
Microbial communities strongly influence N cycling through their metabolism and growth [9,10], so understanding their dynamics is critical to understanding SGI performance with regard to nutrient processing and retention. Reviews of SGI studies conducted primarily in mesic environments have found that soil characteristics (e.g., soil type, organic matter content), plant selection, and moisture regimes determine which processes of the N cycle dominate [6,11,12,13], yet microbial growth and N uptake responses to environmental variation and plant choice within SGI is less clear [13]. While these studies inform SGI design practices in mesic systems, important differences in climate, hydrologic regimes, and soil characteristics exist between mesic and arid environments that could affect SGI performance [14]. For example, studies from arid environments show wide variability in the rates of internal N cycling processes with respect to SGI soil type and plant species or community of vegetation [15,16]. Yet, studies of natural systems in arid to semi-arid environments also report wide variation in N dynamics, as well as microbial community responses, to differences in soil characteristics (e.g., pH, organic matter content) and shifting moisture regimes, resulting from precipitation events that punctuate periods of drought [17]. Unfortunately, the few studies of SGI conducted in arid to semi-arid environments are limited with respect to the number of parameters measured, precluding generalization. In a review of 219 SGI studies, 28 were conducted in semi-arid to arid environments [2]. Of these 28 studies, just 7 included information about water quality, including but not limited to N retention. Thus, additional studies of these responses in semi-arid to arid SGI can fill this data gap.
The climate crisis is complicating urban water management, as many urban areas are experiencing increased intensity of precipitation events [18,19]. In semi-arid to arid regions of the southwestern U.S., precipitation events punctuate increasingly prolonged periods of drought [18]. These trends are significant for SGI for a number of reasons. Pollutants in terrestrial habitats can accumulate during drought before being transported in high quantities to surface waters in subsequent spates [20]. Furthermore, drought stresses plants in SGI, particularly if they do not receive supplemental irrigation. Drought also can induce microbial communities to allocate energy towards the protection of cells from desiccation and lysis rather than growth [21]. Therefore, the long-term sustenance of SGI in semi-arid to arid environments relies upon facility design that can withstand periods of inundation and drought. In particular, a greater understanding is needed regarding responses of microbes to pulses of precipitation after drought conditions in SGI composed of vegetation with variation in drought-adapted traits.
Incorporation of Biodiversity–Ecosystem Function (BEF) and Ecological Stoichiometry (ES) theoretical frameworks with in the study of SGI can provide a mechanistic, broadly applicable foundation for assessing the dominant controls on nutrient cycling in response to precipitation pulses. Ecologists have developed BEF theory by studying biodiversity loss and its effect on specific functions within various ecosystems [22,23,24,25,26], such as the role plant and microbial communities play in mitigating air, water, and soil pollutants. Plants used in SGI designed for semi-arid and arid environments are selected based on site characteristics (i.e., frequency of precipitation events, average soil moisture, and surface temperatures) and the ability for carbon (C) and nutrient cycling processes to occur after precipitation events [12,27]. SGI systems containing vegetation have greater N cycling potential and increased soil permeability than non-vegetated systems [6,12,13]. Shrubs and bunchgrasses are often employed in aridland SGI because of their tolerance to drought conditions, affinities to assimilate key nutrients, and augmentation of soil permeability [12,27]. Therefore, plant selection can be an important factor for promoting desired ecological and biogeochemical responses to site-specific variation in soil moisture to best manage N loading within urban aquatic environments [27]. Consequently, BEF serves as one theory to assess the ideal vegetation composition in SGI to promote the desired ecosystem functions during precipitation events.
ES is a mass balance approach used to monitor nutrient pools and fluxes to determine organism dynamics through the constraints of energy and matter within an ecosystem [28]. ES has been utilized to infer which resources limit plant and microbial growth. For microbial communities, ES theory has been extended to include ‘ecoenzyme’ activities that have been found to catalyze the breakdown of environmental carbon (C), phosphorus (P), and N pools [10,29]. Ecoenzymes are enzymes in the environment expressed by living microbes or lysed from the cells of microbes. Rates of ecoenzyme expression are linked to soil characteristics (i.e., soil moisture, pH, and N pools) and have been found to influence changes in microbial biomass production [17,29,30,31,32]. Ecoenzymatic activity ratios and ecoenzymatic vector analysis quantify the relative degree that microbes are limited by energy or nutrient resources [29,32]. Therefore, ecoenzymatic stoichiometric theory provides a framework for understanding how microbes influence biogeochemical changes in the environment.
This study aimed to elucidate the relative role of plant diversity vs. ecological stoichiometry for controlling microbial community and soil N responses to pulsed water events in SGI of a semi-arid region experiencing a period of extended drought. Specifically, we ask:
  • Do pulses of water, equal in magnitude to moderate- to high-intensity storm events, stimulate SGI microbial community growth and resource acquisition?
  • Do pulsed water additions within SGI induce changes to soil N pools and fluxes?
  • To what extent are microbial physiology and soil N dynamics controlled by plant diversity vs. ecological stoichiometry?
We hypothesized that pulsed precipitation events would release biophysical constraints on resource acquisition in dry soils, in accordance with classic pulse dynamics in arid-region ecosystems [9,17,33]. Specifically, we predicted that increased soil moisture would stimulate growth in microbial biomass, supported by greater microbial ecoenzyme activity targeting resources bound within soil organic matter. Microbial communities in arid ecosystems are typically limited by C [34] or co-limited by C and N [9]. However, we expected microbial communities to invest more in the production of ecoenzymes associated with C or P, relative to N, given the potential for subsidies of N from atmospheric deposition at both the bioswale and meadow sites. Alternatively, if N indeed limits microbial community growth, we expected to find elevated microbial biomass N content supported by faster rates of proteolysis and a greater production of ecoenzyme activity, related to N acquisition or greater access to available NO3 and NH4 transported through soil porewater. Furthermore, we expected N cycling (i.e., proteolytic rate, protein turnover rate and changes to inorganic N pools) to be greater in vegetated plots relative to unvegetated plots due to greater soil organic matter content, deeper infiltration of water through soils, and acquisition of N by both plants and microbes. However, we recognized that competition for soil nutrients in vegetated plots could limit the ability of microbes to assimilate N, particularly in more species-rich plots with a more diverse suite of adaptations related to N acquisition and allocation (e.g., differences in rooting depth and leaf N content). Finally, we expected soil organic matter content and microbial community size to be greater at the older montane grassland relative to the younger bioswale plots, leading to greater limitation of microbial growth by nutrients relative to C in the meadow.

2. Materials and Methods

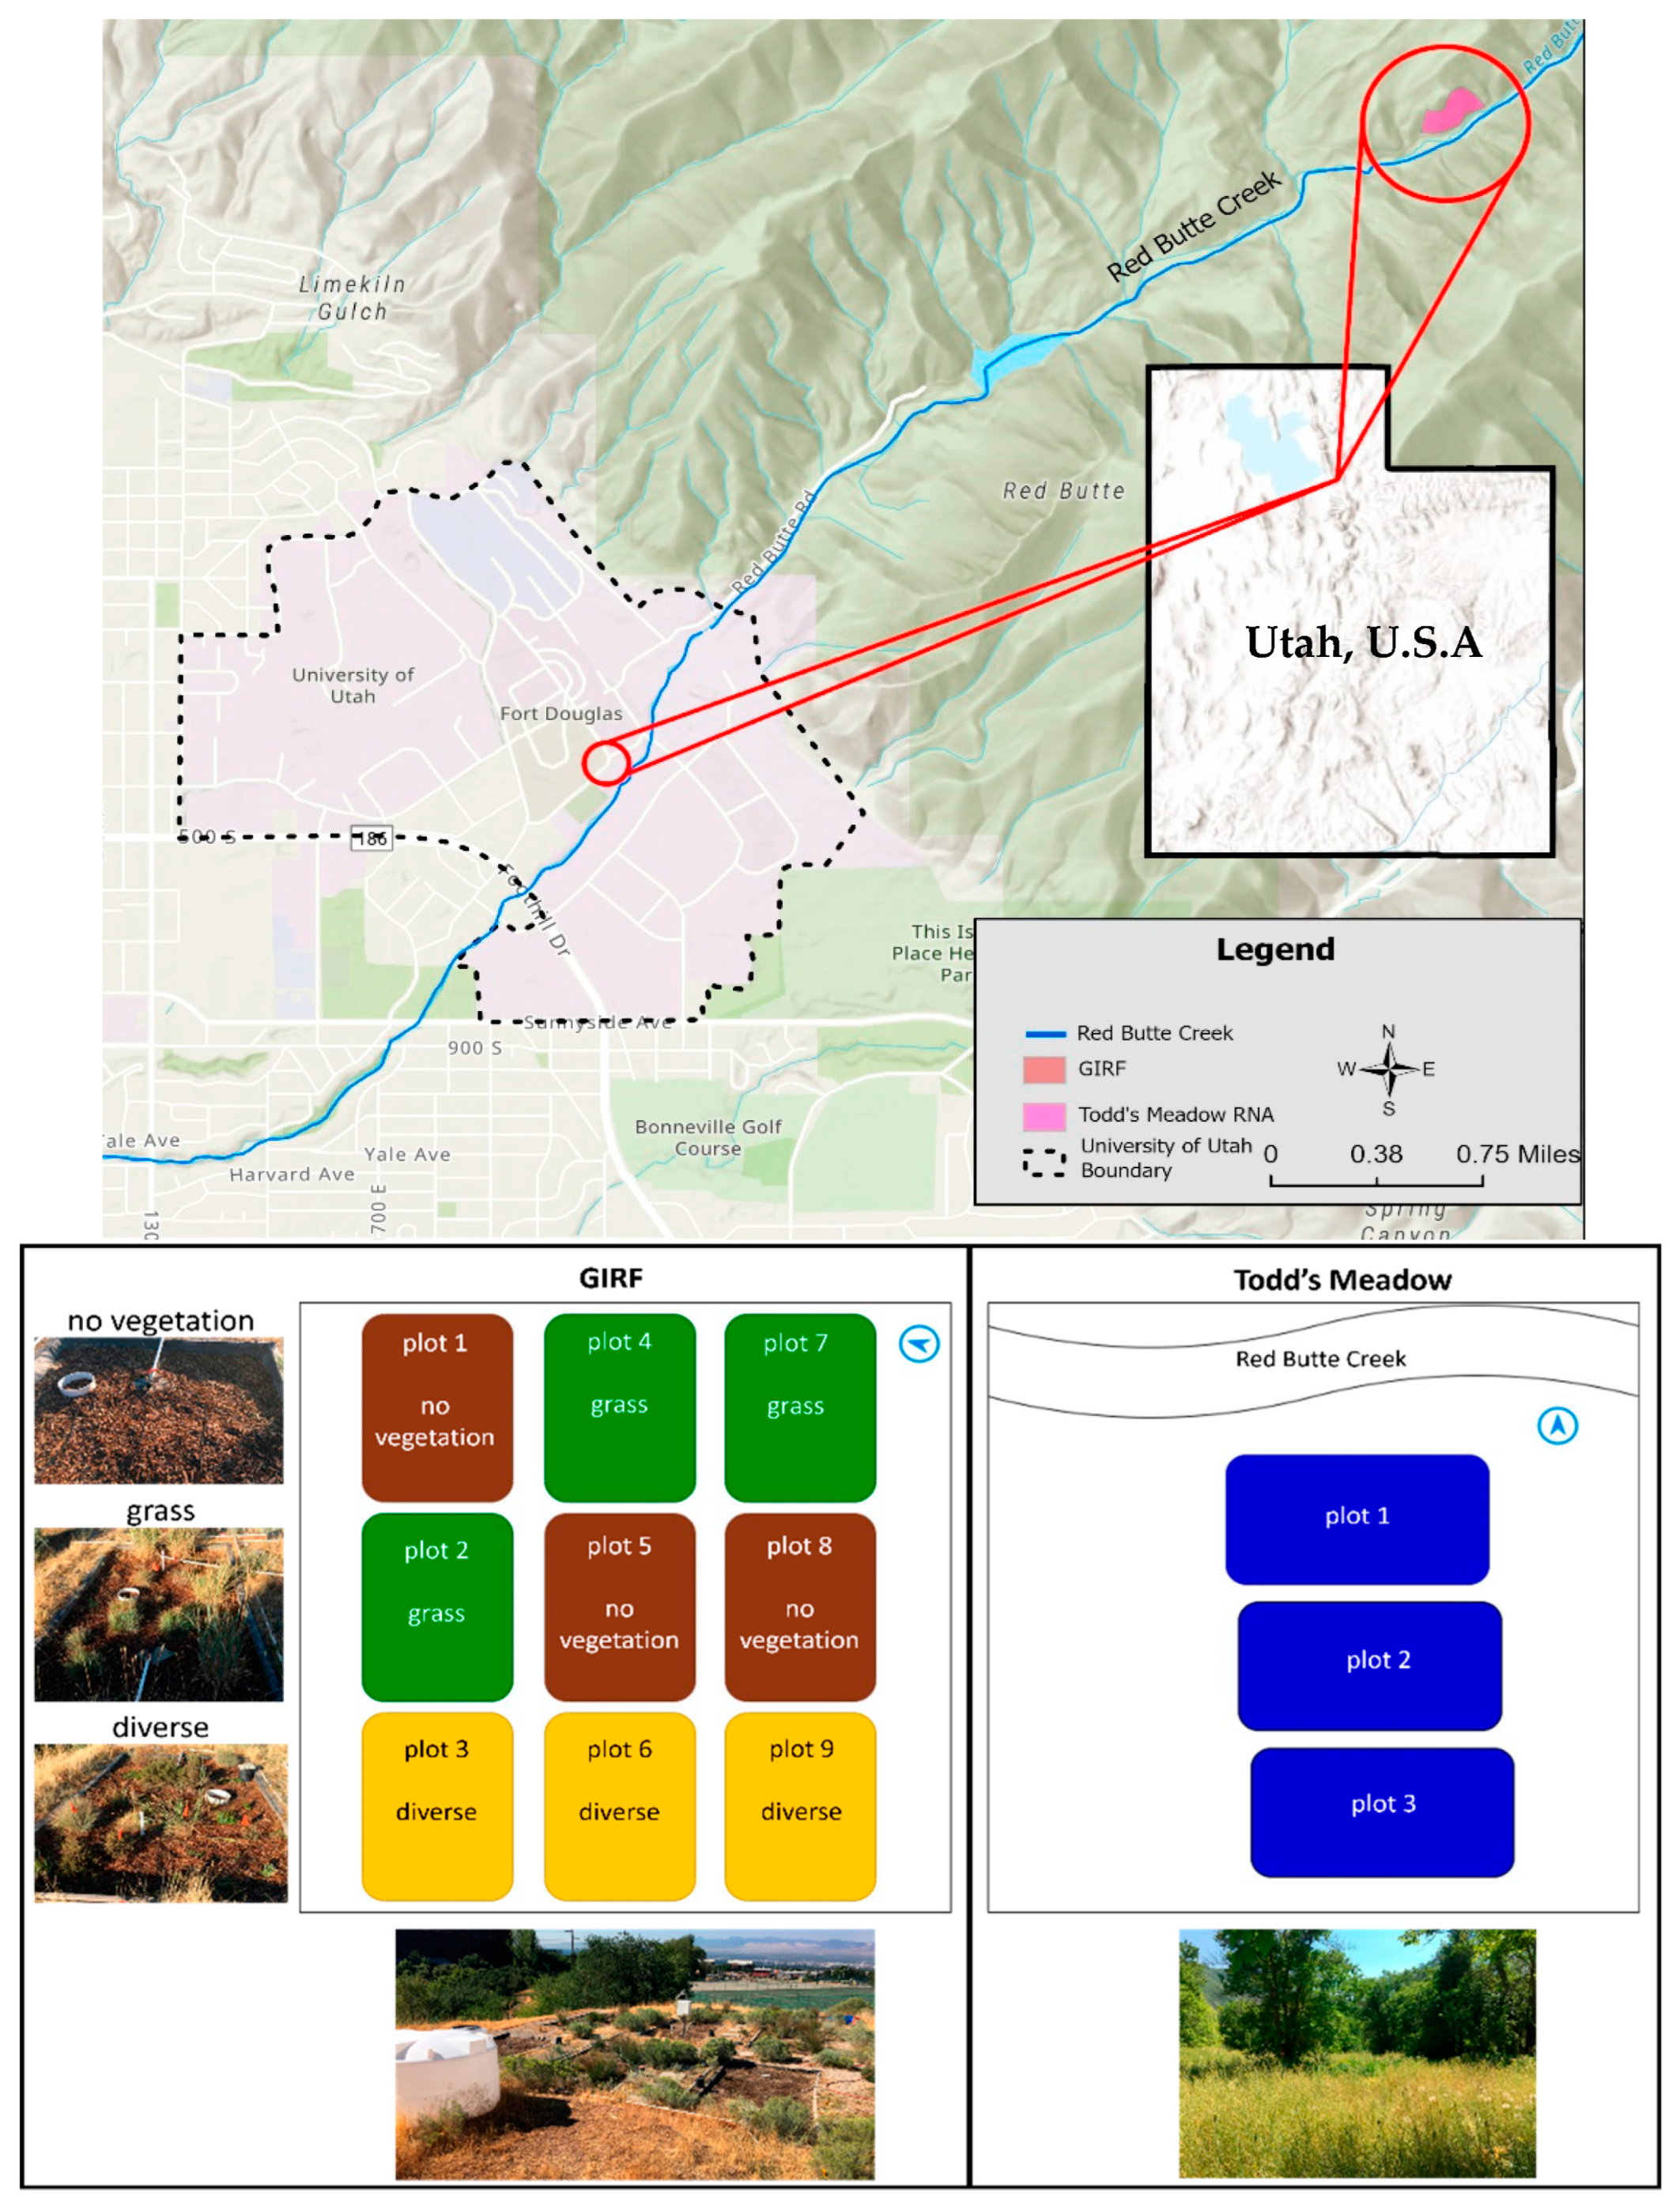
2.1. Site Descriptions

We utilized the University of Utah’s Green Infrastructure Research Facility (GIRF) with replicated experimental plots, consisting of three vegetation treatments (described further in Section 2.1.1), to assess both plant diversity and ecological stoichiometry effects on microbial community and soil nutrient responses to pulsed water inputs. Todd’s Meadow (TM), a montane grassland area in the Red Butte Canyon Research Natural Area, served as a comparative non-SGI reference site used to ascertain if the responses observed within SGI are apparent in an established natural ecosystem, with similar plant species and species richness as one of the GIRF plant treatments. We used data collected over two experimental precipitation events (from here on, referred to as ‘pulse’ events) at GIRF and one natural precipitation event at TM, punctuating a period of prolonged drought.

2.1.1. Green Infrastructure Research Facility (GIRF)

GIRF is located on the University of Utah campus in Salt Lake City, UT (−111.83 longitude, 40.76 latitude, ~1486 m elevation; Figure 1). The site is situated adjacent to Red Butte Creek, a second-order tributary within the 2085 km2 Jordan River Basin of central Utah, USA (HUC: 16020204), and consists of nine lined bioswale plots with dimensions of 2.4 × 4.1 m (9.84 m2) spaced approximately 1 m apart (Figure 1). Bioswale soil media was 1 m deep and comprised of 0.5 m of topsoil overlaying 0.5 m density fill, as recommended for SGI in arid climates [27]. In 2016, topsoil was classified as having a sandy clay texture, a pH of 8.0, a bulk density of 1.3 g/cm3, and 1.4% organic matter content (Utah State University Analytical Lab soil report; available on GitHub repo [see Data Availability statement]). In 2018, these 9 plots were planted with 3 replicates of 3 experimental biodiversity treatments: (1) unvegetated plots, (2) grass-only plots, and (3) diverse plots with a mix of grass and shrub species (Figure 1). Grass treatments contained little bluestem (Schizachyrium scoparium), blue grama (Bouteloua gracilis), and Great Basin wild rye (Elymus cinereus) grass species. Diverse treatments contained little bluestem (Schizachyrium scoparium), blue grama (Bouteloua gracilis), Great Basin wild rye (Elymus cinereus), blanket flower (Gaillardia), bee balm (Monarda), Rocky Mountain beardtongue (Penstemon strictus), cinquefoil (Potentilla), golden currant (Ribes Aureum), coneflower (Echinacea purpurea), alpine currant (Ribes alpinum), and pineleaf beardtongue (Penstemon pinifolius). Common and scientific names for all plants are based on listings found within the U.S. Department of Agriculture PLANTS database [35]. Diverse treatments contained 11 species with a total of 34 plants per plot, and grass treatments contained 3 species with a total of 24–25 plants per plot (Table S1). The number of plants in these plots varied due to differences in aboveground biomass between grasses and shrubs. Plantings aimed to achieve a similar percentage of aboveground cover (~50% of plot area). The surfaces of all plots were covered by woody mulch to retain soil moisture. The site includes an irrigation system comprising large water tanks connected to PVC piping and drip irrigation lines. This system was used to apply roughly 150 L of supplemental water to the plots over several hours every 1–2 weeks, during each growing season since 2018, to keep plants alive.

2.1.2. Research Natural Area (RNA)—Todd’s Meadow

Todd’s Meadow is located in the Red Butte Canyon Research Natural Area (RNA), adjacent to Salt Lake City, UT (−111.79 longitude, 40.79 latitude, ~1800 m elevation; Figure 1). The RNA was established in 1971 and encompasses 2173 hectares. It is managed by the U.S. Department of Agriculture Forest Service as part of a network of ~400 sites dedicated to the study of forest ecology, largely in the absence of human activities. Todd’s Meadow is a permanently protected area that serves as a natural landscape for education, scientific study, and baseline monitoring. There is minimal impact from human management and maintenance, and it is allowed to flourish in its natural condition [36]. Thus, this site provides the opportunity for comparing the processes observed at both GIRF and a natural setting in close proximity.
Todd’s Meadow is a riparian shrubland comprised of a mixed forb-grassland vegetation, and riffle-pool streams [36]. Soils at Todd’s Meadow have been classified as well-drained, loam soils [37] with an average pH of 7.8 and 10.2% organic matter content. We established three study plots with dimensions 3 m × 4 m (12 m2) within a 48 m2 (12 m long, 4 m wide) area of Todd’s Meadow dominated by blue wildrye (Elymus glaucus), Kentucky bluegrass (Poa pratensis), and cheatgrass (Bromus tectorum; Figure 1) [38]. This species composition was similar to grass plots at GIRF. Forb species within these plots were rare (i.e., 1 or 2 per plot). Unlike GIRF, plant cover was close to 100% in all plots.

2.2. Local Climate during Study Period

The Wasatch Environmental Observatory (WEO) has established air temperature, precipitation, and soil moisture sensors within GIRF and Todd’s Meadow (Table S2) [39]. WEO climate and soil moisture data are recorded at 15 min intervals. Data are uploaded daily to the HydroShare data repository after following quality control procedures [39].
Air temperature and soil moisture fluctuated during the experimental and natural pulse events (Table S3), as well as throughout the 2020 and 2021 growing seasons (1 May to 1 October) at GIRF and Todd’s Meadow (Table S4) [40,41,42]. The study area experienced abnormally dry to extreme drought conditions during the 2020 growing season, and extreme drought conditions persisted throughout the 2021 growing season [43]. Prior to these experiment pulse events, there was at least one month of no precipitation falling on the study sites. A natural precipitation event occurred on 24 June 2021, which added a small amount of moisture (~3 mm) during the June 2021 pulse event.

2.3. Conceptual Model

A conceptual model (Figure S1) illustrates key relationships between the ecological parameters measured in this study and how they influence N cycling processes. In each experimental bioswale and the montane meadow, we monitored soil moisture, organic matter content, and pH to determine if these factors controlled shifts in microbial community physiology (i.e., growth and ecoenzyme expression), as well as N pools and fluxes. Specifically, we measured microbial biomass C and N content to determine if microbial communities were growing in size and utilizing available N resources. Additionally, we quantified activity rates for ecoenzymes associated with the acquisition of C, N, and phosphorus (P) resources, which are sensitive to shifts in pH, to determine which of these resources were most targeted by microbial communities [44]. Finally, we measured soil N concentrations (i.e., protein, organic N, and inorganic N), and N fluxes (i.e., proteolytic rate and protein turnover) to determine if moisture induced changes to the N cycle within bioswales.

2.4. Field Sampling and Processing

2.4.1. Stormwater Experimental and Natural Pulses

GIRF plots did not receive manual water additions at least one week prior to experimental pulse events. Mean soil moisture prior to water addition at GIRF was 9.74 ± 0.004% in 2020 and 12.60 ± 0.002% in 2021. We added 420.2 L of water to each plot at GIRF on 6 September 2020, and on 21 June 2021, to mimic a high-intensity storm event of ~42 mm of precipitation occurring within a 24 h period (Table S5). In September 2020, we employed the existing irrigation system at GIRF to add water to the study plots during the first pulse experiment. The desired magnitude of water addition was achieved, but at a rate slower than the duration of a typical local rainfall event. Thus, we used a hose affixed with a flow meter to add water during our second pulse experiment in June 2021. A natural pulse event at RNA Todd’s Meadow occurred on 24 June 2021, with a rain accumulation of 3.05 mm (~146 L; Table S5). Prior to this natural event, soil moisture at the site was 13.10 ± 0.01%.

2.4.2. Soil Sampling Technique and Frequency

Soil cores were collected 1 day before and up to 16 days after manual stormwater pulse inputs at GIRF, at intervals of ~2–3 days, until soil moisture returned to (pre-pulse) baseline conditions (Table S5). Soil cores were collected at Todd’s Meadow 1 week before and 24 and 72 h after the 24 June 2021 rain event (Table S5). Stainless steel soil corers, 5 cm in diameter, were used to extract soil samples to a depth of 10 cm from all plots. Five cores were collected to create a homogenous, composite sample for each plot. Soil corers were cleaned with ethanol between plot extractions.
Volumetric soil moisture was measured using hand-held probes (ML3 ThetaProbe Soil Moisture Sensor, Dynamax, Houston, TX, USA) in the soil profile 5 cm in depth. These probes were used alongside gravimetric soil moisture measurements to determine how long soil moisture was retained during the pulse experiments. On-site in situ probes (TEROS 11, METER Group, Pullman, WA, USA), positioned at 20 and 50 cm depths in the soil profile, were also used to monitor volumetric soil moisture and soil temperature before, during, and after wetting events.

2.4.3. Lab Processing

Immediately after sampling, soil samples were sieved using a 2mm mesh sieve to remove large debris. Sieved samples were split into 3 subsets for determination of (1) gravimetric soil moisture, pH, % organic matter, and N concentrations, (2) microbial biomass, and (3) ecoenzyme activity (EEA) rates and proteolytic capacity. Processing of soils to quantify gravimetric soil moisture, pH, organic matter content, and soil N occurred within 1 day of sampling. Soil samples used to quantify microbial biomass C and N content from the June 2021 pulse event at GIRF and the natural pulse event at Todd’s Meadow were refrigerated and processed within 5 days of sampling. Samples from the September 2020 pulse event were frozen at 0 °C and extracted for quantification of microbial biomass in August 2021, due to COVID-19 pandemic restrictions for laboratory access. EEA subsets were stored in the freezer at 0 °C until assays were performed from November 2021 to February 2022.

2.5. Analytical Assays

2.5.1. Gravimetric Soil Moisture, pH, Organic Matter Content, and N Pools and Fluxes

Gravimetric soil moisture was determined by drying approximately 10 g of soil for at least 24 h in a 60 °C drying oven. Gravimetric soil moisture measurements were used for our statistical analyses, as these measurements were determined from subsets of samples used to quantify microbial biomass C and N content, N pools and fluxes, and ecoenzyme activity rates. pH was determined using a slurry consisting of 5 g of dry soil and 5 mL of DI water (1:1 ratio), and analyzed using a 2-point calibrated pH probe (Orion Star A121 Portable pH Meter, ThermoFisher Scientific, Waltham, MA, USA).
Soil total N concentration was determined at the University of Utah (U of U) Stable Isotope Ratios for Ecological Research (SIRFER) laboratory using an isotope-ratio mass spectrometer (Finnigan Mat Delta + Isotope-Ratio Mass Spectrometer, Thermo Electron Corporation, San Jose, CA, USA). Soil inorganic N pools were determined using potassium chloride (KCl) extractions for NH4+ (ammonium) and NO3 (nitrate) concentrations. A 1:4 ratio slurry, comprised of 10 g of soil and 40 mL of 2 M KCl, was allowed to incubate at room temperature for 24 h. Extracts were gravity filtered through Whatman No. 1 filter paper and frozen. Analysis of NH4+ concentration was determined using a colorimetric method by Brigham Young University Environmental Analytical Lab (BYU EAL) [45]. Analysis of NO3 concentration was determined using a colorimetric cadmium reduction method at BYU EAL [45]. Reporting and method detection limits were 0.1 mg/L and 0.075 mg/L for NH4+ and 0.02 mg/L and 0.003 mg/L for NO3, respectively. Inorganic N was used for data analysis in lieu of NH4+ and NO3 individually, because NH4+ concentrations within many soil samples were indistinguishable from laboratory blanks. Therefore, inorganic N was determined by adding NH4+ and NO3 concentrations. Organic N was determined by subtracting inorganic N from total N.

2.5.2. Biomass Quantification

Quantification of microbial biomass C pools was used to assess microbial community growth, while changes in microbial biomass N pools indicated microbial N assimilation within each landscape. Microbial biomass C and N concentrations were estimated as dissolved organic C (DOC) and total dissolved N (TDN) extracted through a chloroform fumigation technique (sCFE) [46,47]. Soil samples were divided into subsets of unfumigated and fumigated slurries consisting of 8 g of soil and 40 mL of 0.5 M K2SO4 (1:5 ratio). Fumigated subsets received 0.5 mL of chloroform. Soil slurries were allowed to shake for 4 h at 130 revolutions per minute, and then gravity filtered through pre-wetted Whatman No. 1 filter paper. Filtered extracts, including blanks and unfumigated samples, were purged with house air for 30 min to remove excess chloroform. Extracts were frozen prior to analysis with a TOC Analyzer (Shimadzu, Columbia, MD, USA) at the BYU EAL, which had reporting and method detection limits of 1.5 mg/L and 0.31 mg/L for DOC and 0.8 mg/L and 0.15 mg/L for TDN, respectively. Microbial biomass C and N concentrations were determined from the difference between fumigated and unfumigated DOC and TDN concentrations corrected for soil dry mass.
In May 2021, soil samples collected at GIRF were divided into two subsets. One subset was frozen, and the other subset was processed immediately in order to quantify the effect of freezing on microbial biomass C and N content. Microbial biomass C and N content did not differ between frozen vs. fresh samples collected in May 2021, with respect to unfumigated (control) and chloroform-fumigated subsamples (Welch two sample t-test; C unfumigated t = −1.44, p = 0.17; C fumigated t = −2.05, p = 0.06; N unfumigated t = −1.05, p = 0.31; N fumigated t = −1.39, p = 0.19). These results justify the comparison of microbial biomass collected during the September 2020 and June 2021 experimental pulse events.

2.5.3. Ecoenzyme Activity

Measurement of ecoenzyme activity rates were used to determine which resources were limiting microbial growth and N-rich substrate turnover. A microplate reader (BioTek Synergy H1 Hybrid Multi-Mode, Agilent, Santa Clara, CA, USA) was used to measure the activities of hydrolytic and oxidative ecoenzymes. The hydrolase assay measures the activities of ecoenzymes used for C, N, and P acquisition (Table 1) [44,48]. Soil slurries were made using 1 g of soil homogenized in 125 mL of 50 mM sodium bicarbonate buffer. Soil slurries and standards were analyzed with an excitation wavelength of 365 nm and an emission wavelength of 450 nm. Sample fluorescence was measured at 1 h intervals for a total of 4 h, corresponding to a plateau in activity rates. Final hydrolytic activity (nmol g−1 h−1) was determined as the difference between the fluorescence of sample and control, adjusted for the emission coefficient of standards, and corrected for quenching and mass of dry soil.
The phenol oxidase assay (POX), using L-3,4-dihydroxyphenylalanine, measures enzyme activities during the oxidation of phenolic compounds, specifically related to the breakdown of lignin or other phenolic compounds during C acquisition [49,50]. Soil slurries of 1 g of soil to 125 mL of 50 mM sodium bicarbonate buffer were measured on a microplate with an absorption of 460 nm. Measurements were acquired every hour for 3 h until activity rates were observed to plateau. Final phenol oxidase activity (nmol g−1 h−1) was determined from the difference of sample and control absorption converted after 3 h per g of organic matter.

2.5.4. Proteolytic Rate

Proteolytic rate, used to measure the rate of protein breakdown from organic matter to essential amino acids, was determined using a microplate reader (BioTek Synergy H1 Hybrid Multi-Mode, Agilent, Santa Clara, CA, USA) following a modification of the method outlined by [51]. Soil samples were divided into subsets of spiked and unspiked slurries. Spiked slurries consisted of 1 g of soil, 5.98 mL of 8 mM sodium bicarbonate buffer (1:6 ratio), and 20 µL of 0.5% bovine albumin serum (BAS) solution. Unspiked slurries consisted only of 1 g of soil and 6 mL of 8 mM sodium bicarbonate buffer. Addition of toluene was omitted to account for both liberated and synthesized proteins during incubation, which could occur in field settings. Toluene is known to inhibit microbial uptake of proteins [51]. Soil slurries were vortexed, followed by centrifugation to separate sediment and supernatant. A subset of sample was retained as an unincubated (T0) aliquot, and another subset was reserved for incubation (T1). T0 aliquots and controls were frozen until analysis. T1 aliquots and controls were shaken at 250 revolutions per minute for 1 h. Controls, T0, and T1 samples were analyzed using a BioTek Synergy H1 Hybrid Multimode microplate reader (Agilent, Santa Clara, CA, USA) with an absorption of 595 nm. Protein concentrations (µg protein g−1 soil) were determined as the concentration at T0 in soils not spiked with BSA. Proteolytic rate (µg protein h−1 g−1 soil) was determined by taking the difference between T0 and T1 in samples spiked with BSA and dividing by the incubation time and dry mass of soil. Potential protein turnover was calculated as the protein concentration generated over the 1 h incubation (T1–T0) in non-spiked samples plus the measured proteolytic rate observed in spiked samples, divided by the protein concentration measured in non-spiked samples at T0.

2.6. Mathematical and Statistical Analyses

R v. 4.0.1 was used to perform all statistical analyses and produce graphical results [52]. R packages utilized for mathematical and statistical analyses are listed in their respective sections.

2.6.1. Two-Way Repeated Measures Analysis of Variance

R ‘rstatix’ package v. 0.7.0 was used for all two-way repeated measures analysis of variance (RMANOVA) and pairwise t-test analyses. RMANOVA with post hoc comparisons, using pairwise Tukey t-tests with Bonferroni p-adjustment methods, were used to compare the effects of treatments, experiment date, and the interaction of treatment and experiment date on gravimetric soil moisture, pH, microbial biomass C and N content, C:N ratios, ecoenzyme activity rates, soil organic matter content, and concentrations of soil proteins, organic N and inorganic N. We report p-values for all post hoc comparisons. However, t-values are reported only when sample sizes were of sufficient size to generate a t-test statistic.
One outlier, determined from box plot visualization, was detected for microbial biomass C and biomass C:N ratio for Todd’s Meadow at the pre-pulse time point and was removed before performing RMANOVA. This outlier had a value of microbial biomass C 6 times greater than any other data point, resulting in a biomass C:N ratio 40 to 90% greater than other observations.

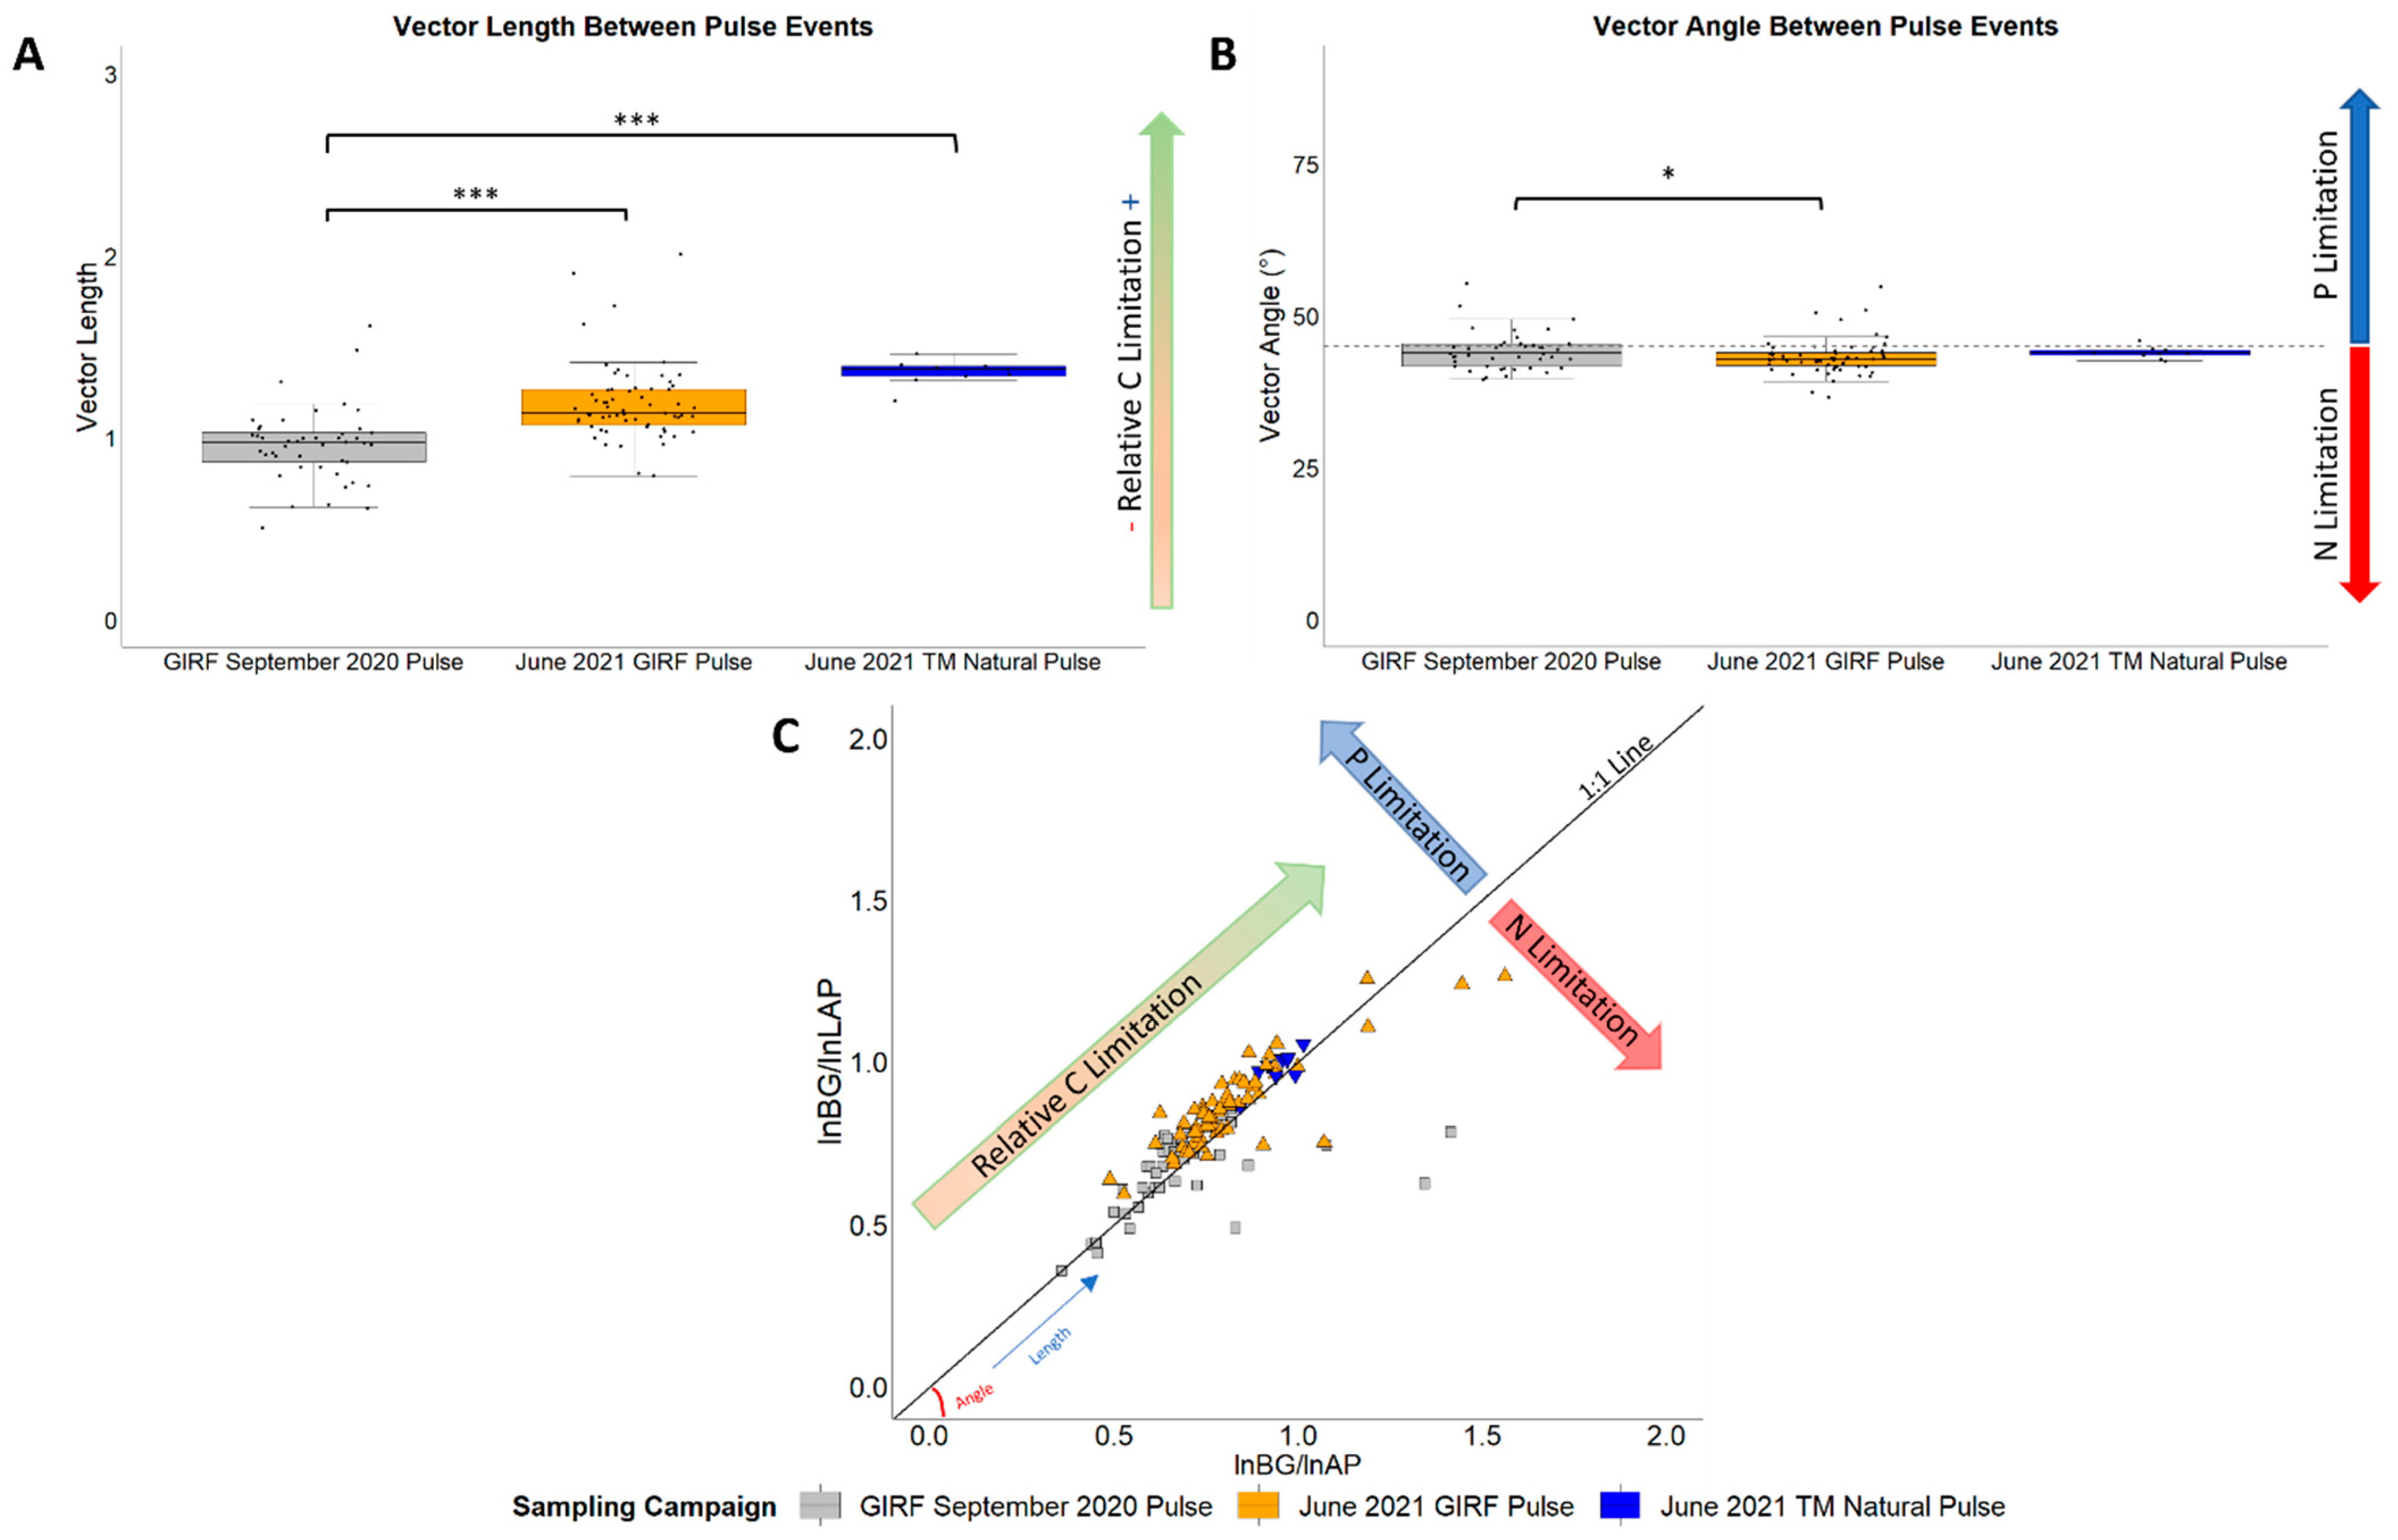
2.6.2. Vector Analysis

Vector analysis was used to determine which treatment and pulse event had the greatest C, N, or P limitation. Vector lengths and angles were calculated in R from the ratios of log-transformed ecoenzyme activities, lnBG/lnAP and lnBG/lnLAP ratios using the following equations [32]:
L e n g t h = l n B G l n A P 2 + l n B G l n L A P 2
A n g l e   ° = r a d 2 d e g a t a n 2 l n B G l n A P , l n B G l n L A P
R ‘pracma’ package v. 2.3.8 was used for the angle calculations. Ratios with the highest vector length suggest greater relative C limitation vs. N or P limitation, while the lowest vector length suggests low C limitation. Ratios with the highest vector angle (>45°) suggest stronger P limitation relative to N, while a lower vector angle (<45°) suggests stronger N limitation relative to P [32]. Lastly, RMANOVA was used to determine if vector lengths and angles differed between plot treatments and pulse events.

2.6.3. Pearson Correlation

R ‘stats’ package v. 4.0.1 was used to determine Pearson correlations. These were performed for each pulse event to determine significant correlations (p-values < 0.05) between gravimetric soil moisture, pH, microbial biomass C and N content, ecoenzyme activities, soil organic matter content, organic N, and inorganic N. Coefficients of determination (r2 values) were used to determine the strength of these correlations. Rows of missing values in the datasets were removed prior to performing this analysis. Pearson correlations were conducted to inform the development of the conceptual model, tested using piecewise structural equation modeling (described in Section 2.6.4).

2.6.4. Piecewise Structural Equation Modeling

R ‘piecewiseSEM’ package v. 2.1.2 was used for all piecewise structural equation models (PSEM). Structural equation modeling, or path analysis, is a multivariate method that unites multiple variables in a single causal network, thereby enabling simultaneous tests of multiple hypotheses for describing the phenomena of complex systems [53]. Inferences about changes in the parameters or path coefficients rest on relationships between nested, or stacked, linear models. Because variables can be both predictors and responses, SEM is also a useful tool for quantifying both direct and indirect (cascading) effects. Direct effects do not involve another variable acting as a mediator, whereas indirect effects involve mediators. PSEMs are based on a linear approximation of nested linear models and estimate the relationship of each variable independently before stringing together the inferences, hence the term ‘piecewise’ [53]. They are thus more flexible relative to standard SEMs, where variables are estimated with one overall variance–covariance matrix [53].
PSEMs were constructed for each precipitation event to describe the direction and estimate the strength of relationships between variables, and determine if soil moisture drives responses in microbial biomass C and N, ecoenzyme activity rates, and N pools and fluxes. Individual PSEMs were built for each pulse event using linear equations to create a matrix and path diagram showing path coefficients and significance. D-separation test statistics were used to assess the linear models for any significant variables that should be included in each model; significant missing variables were added to the linear models after evaluation of the d-separation test, and PSEM was rerun. Global goodness-of-fit was assessed with Fisher’s C statistic and p-value, where a high p-value is desired and signifies a good fit. If there was a limitation in the degrees of freedom to run individual PSEMs with multiple variables, the d-separation table, Fisher’s C statistic, and associated p-value were evaluated to determine which variables in the model were parsimonious. Coefficient results determined via the PSEM were used to assess significant paths in the model, where high p-values (>0.05) justify the exclusion of the standardized coefficient on the diagrams [53]. Once fit, estimates of the standardized effects (i.e., total, direct, indirect, and mediator effects) between the covariates were calculated using a bootstrap method to reveal partial correlations using the R ‘semEff’ package v. 0.6.1.9000. We report p-values for path coefficients (i.e., total effects), but not for direct, indirect, and mediator effects, because they are not calculated by the ‘semEff’ package. Unless noted otherwise, the reported coefficients reflect total effects.

3. Results

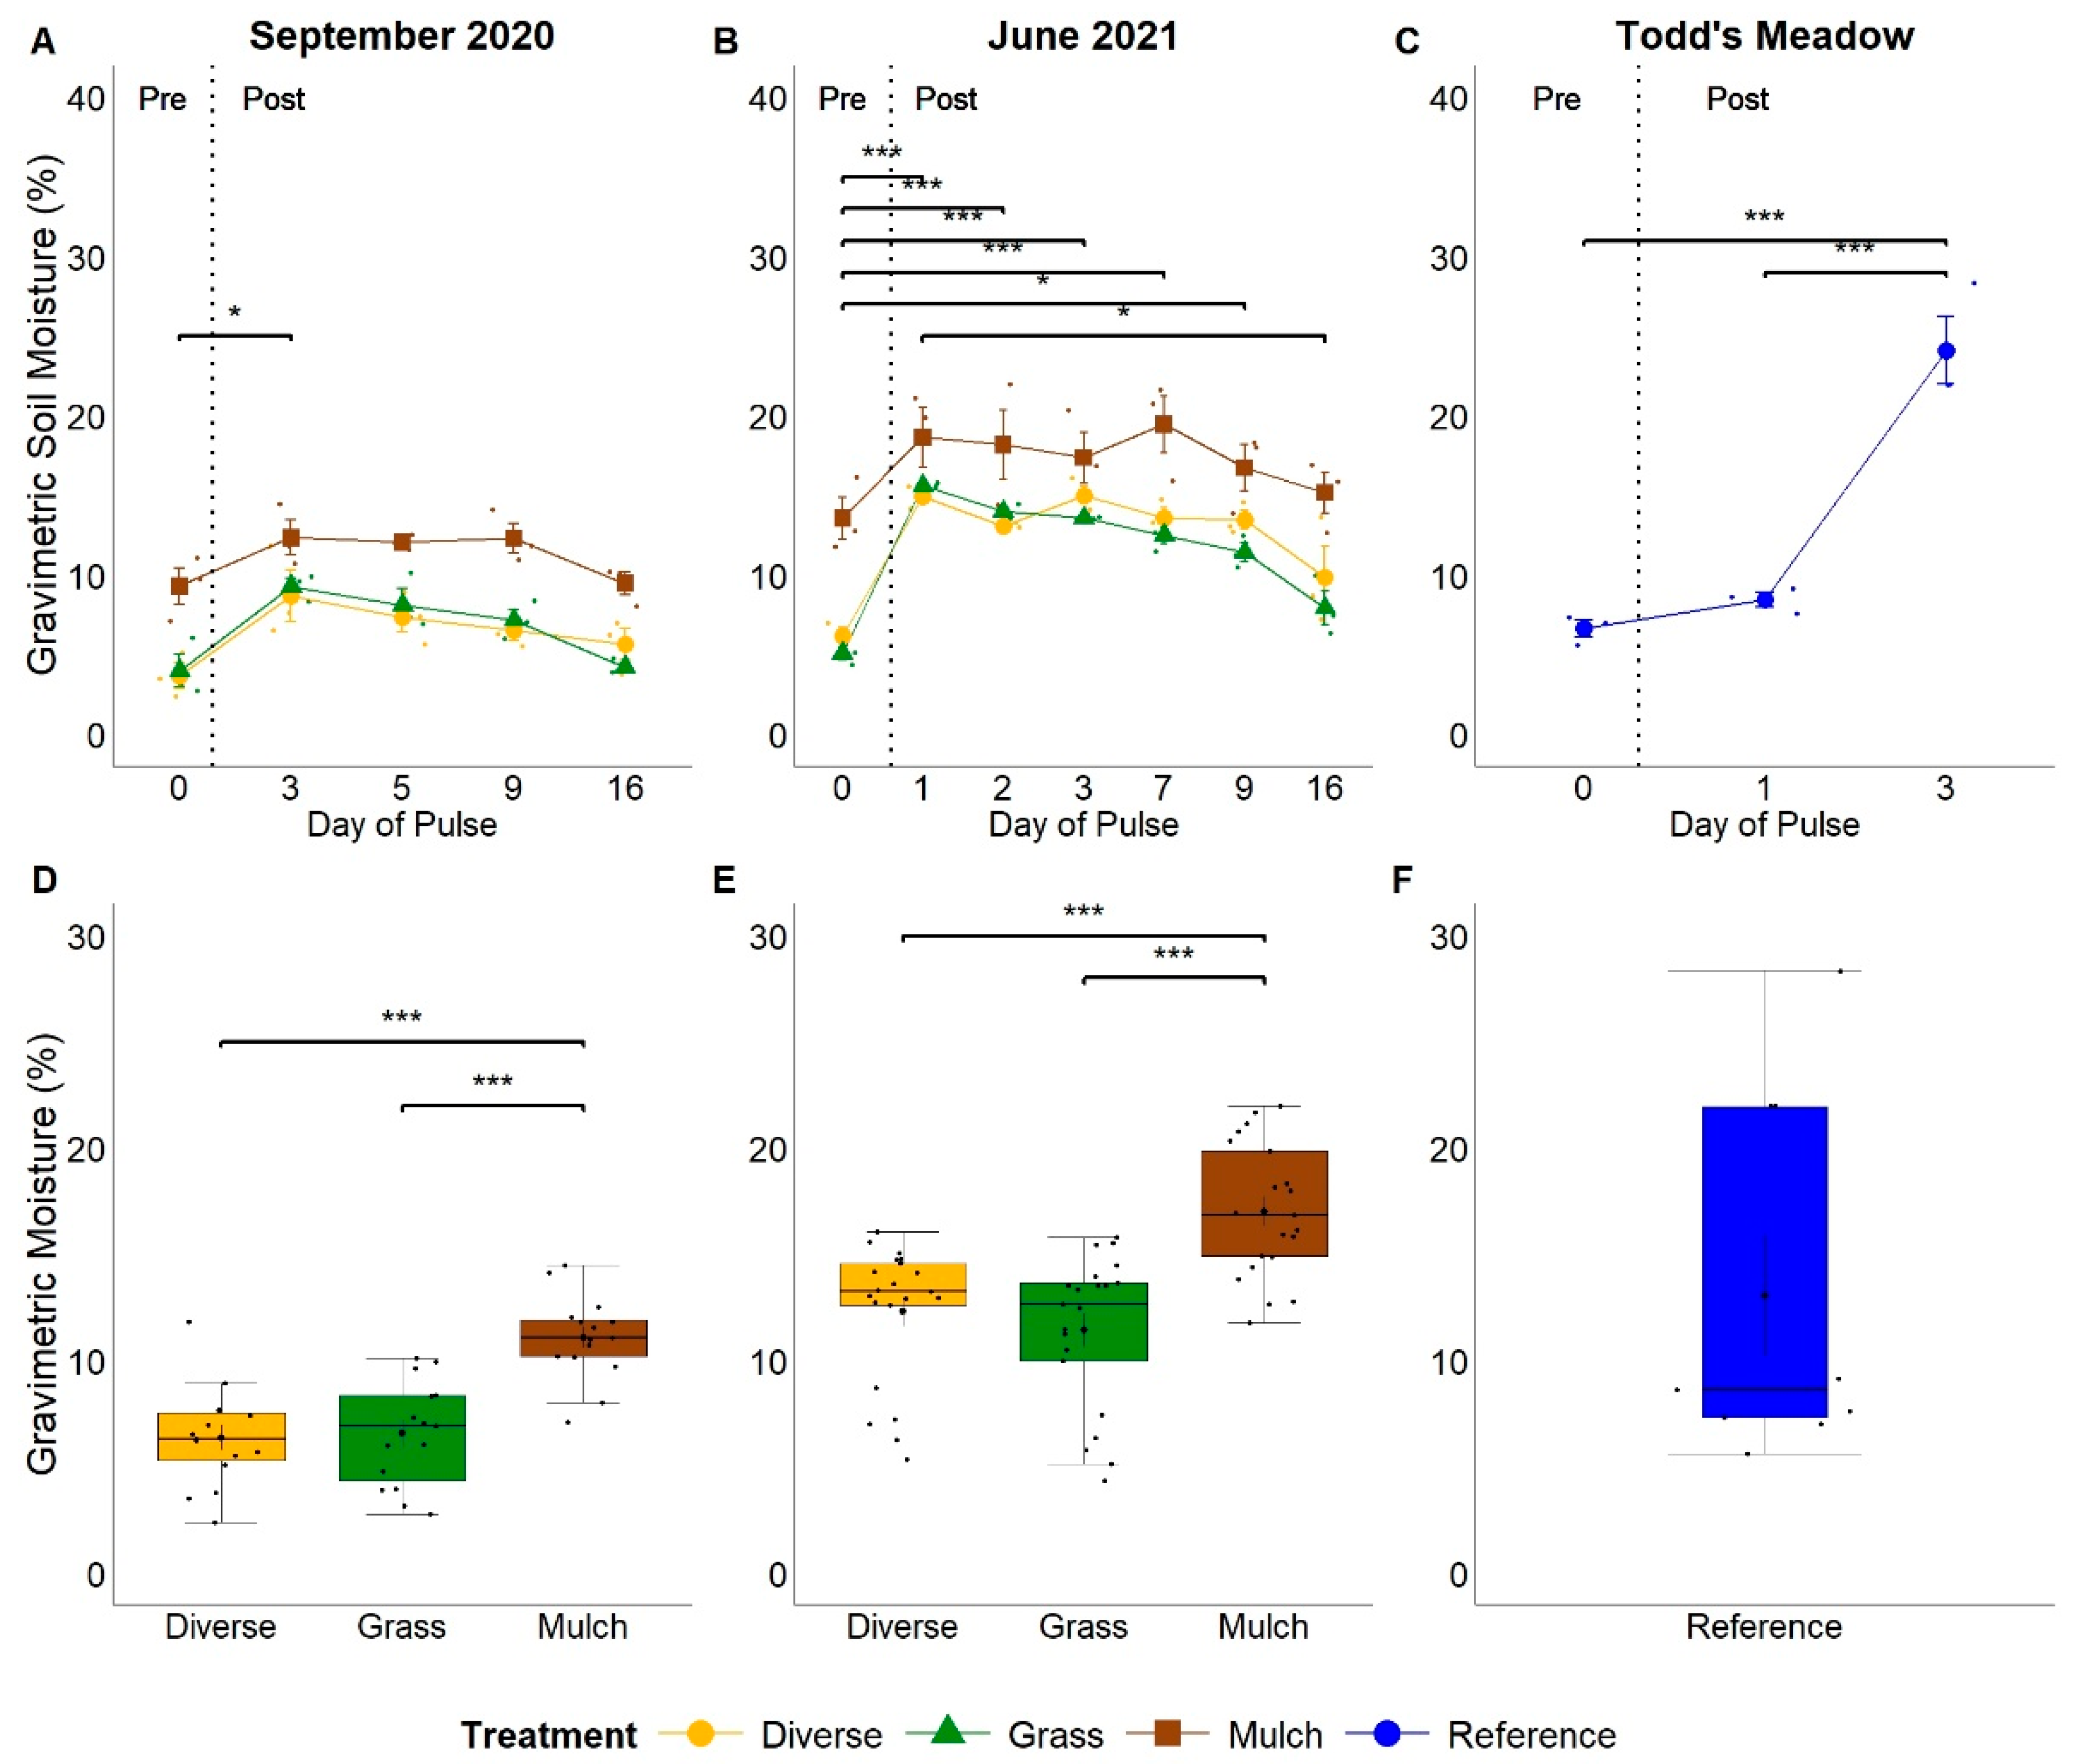
3.1. Gravimetric Soil Moisture and pH

Gravimetric soil moisture increased in response to experimental and natural pulse events (September 2020 F = 12.83, p < 0.001; June 2021 F = 19.81, p < 0.001; Todd’s Meadow F = 55.07, p < 0.001). Soil moisture at GIRF was less than 10% prior to water addition in both experimental pulse events (September 2020 mean soil moisture 5.68 ± 1.04%; June 2021 mean soil moisture 8.31 ± 1.40%) and reached a mean of 10.1 ± 0.81% in September 2020 and 16.4 ± 0.80% in June 2021. This resulted in increased soil moisture of 78% in September 2020 and 97% in June 2021 relative to pre-pulse conditions, before declining to near baseline level 16 days after water was applied to the plots (Figure 2A,B). Soil moisture was 140–142% higher on pre-pulse sampling dates in non-vegetated plots relative to other plot treatments, increased with the addition of water, and remained higher than other plot treatments during both pulse experiments (September 2020 F = 43.28, p < 0.001; June 2021 F = 49.34, p < 0.001; Figure 2A,B). No difference in soil moisture was observed between vegetated plots at GIRF during either experimental pulse event (p > 0.05). The Todd’s Meadow natural pulse event had the greatest variation in gravimetric soil moisture compared to the two experimental pulse events (Figure 2C). Prior to the natural pulse event, Todd’s Meadow had an average soil moisture of 6.66 ± 0.52%, and reached a mean of 24.1 ± 2.13% on day three post-pulse. This resulted in an increased soil moisture of 262%. In contrast, soil moisture never exceeded 20% moisture in plots at GIRF.
Gravimetric soil moisture differed between the experimental and natural pulse events (F = 23.42, p < 0.001; Figure S2A). Average soil moisture at GIRF during the September 2020 experimental event (8.02 ± 0.47%) was lower than the Todd’s Meadow natural pulse event (13.1 ± 2.84%) and the June 2021 experimental pulse event (13.6 ± 0.52) by 5.1–5.6%, respectively (p < 0.005).
Soil pH varied from the start to the end of the experimental and natural pulse events, ranging from 7.6–9.9 (mean of 7.99 ± 0.02) amongst plot treatments at GIRF and Todd’s Meadow (Figure S3A–C). Soil pH increased as of 3 days post pulse at GIRF in September 2020 (Figure S3A) and Todd’s Meadow (Figure S3C). However, soil pH at GIRF was similar to pre-pulse conditions by day 16 post pulse in September 2020 and throughout the June 2021 sampling campaign (Figure S3A,B). In contrast to soil moisture, the plot treatment at GIRF did not affect pH changes (p > 0.05). However, soil pH during the experimental pulse at GIRF in June 2021 was significantly higher than September 2020 (mean of 8.10 ± 0.04 and 7.87 ± 0.02, respectively; p < 0.001) and during the natural pulse event at Todd’s Meadow in 2021 (mean of 7.78 ± 0.04; p-value < 0.001; Figure S2B).

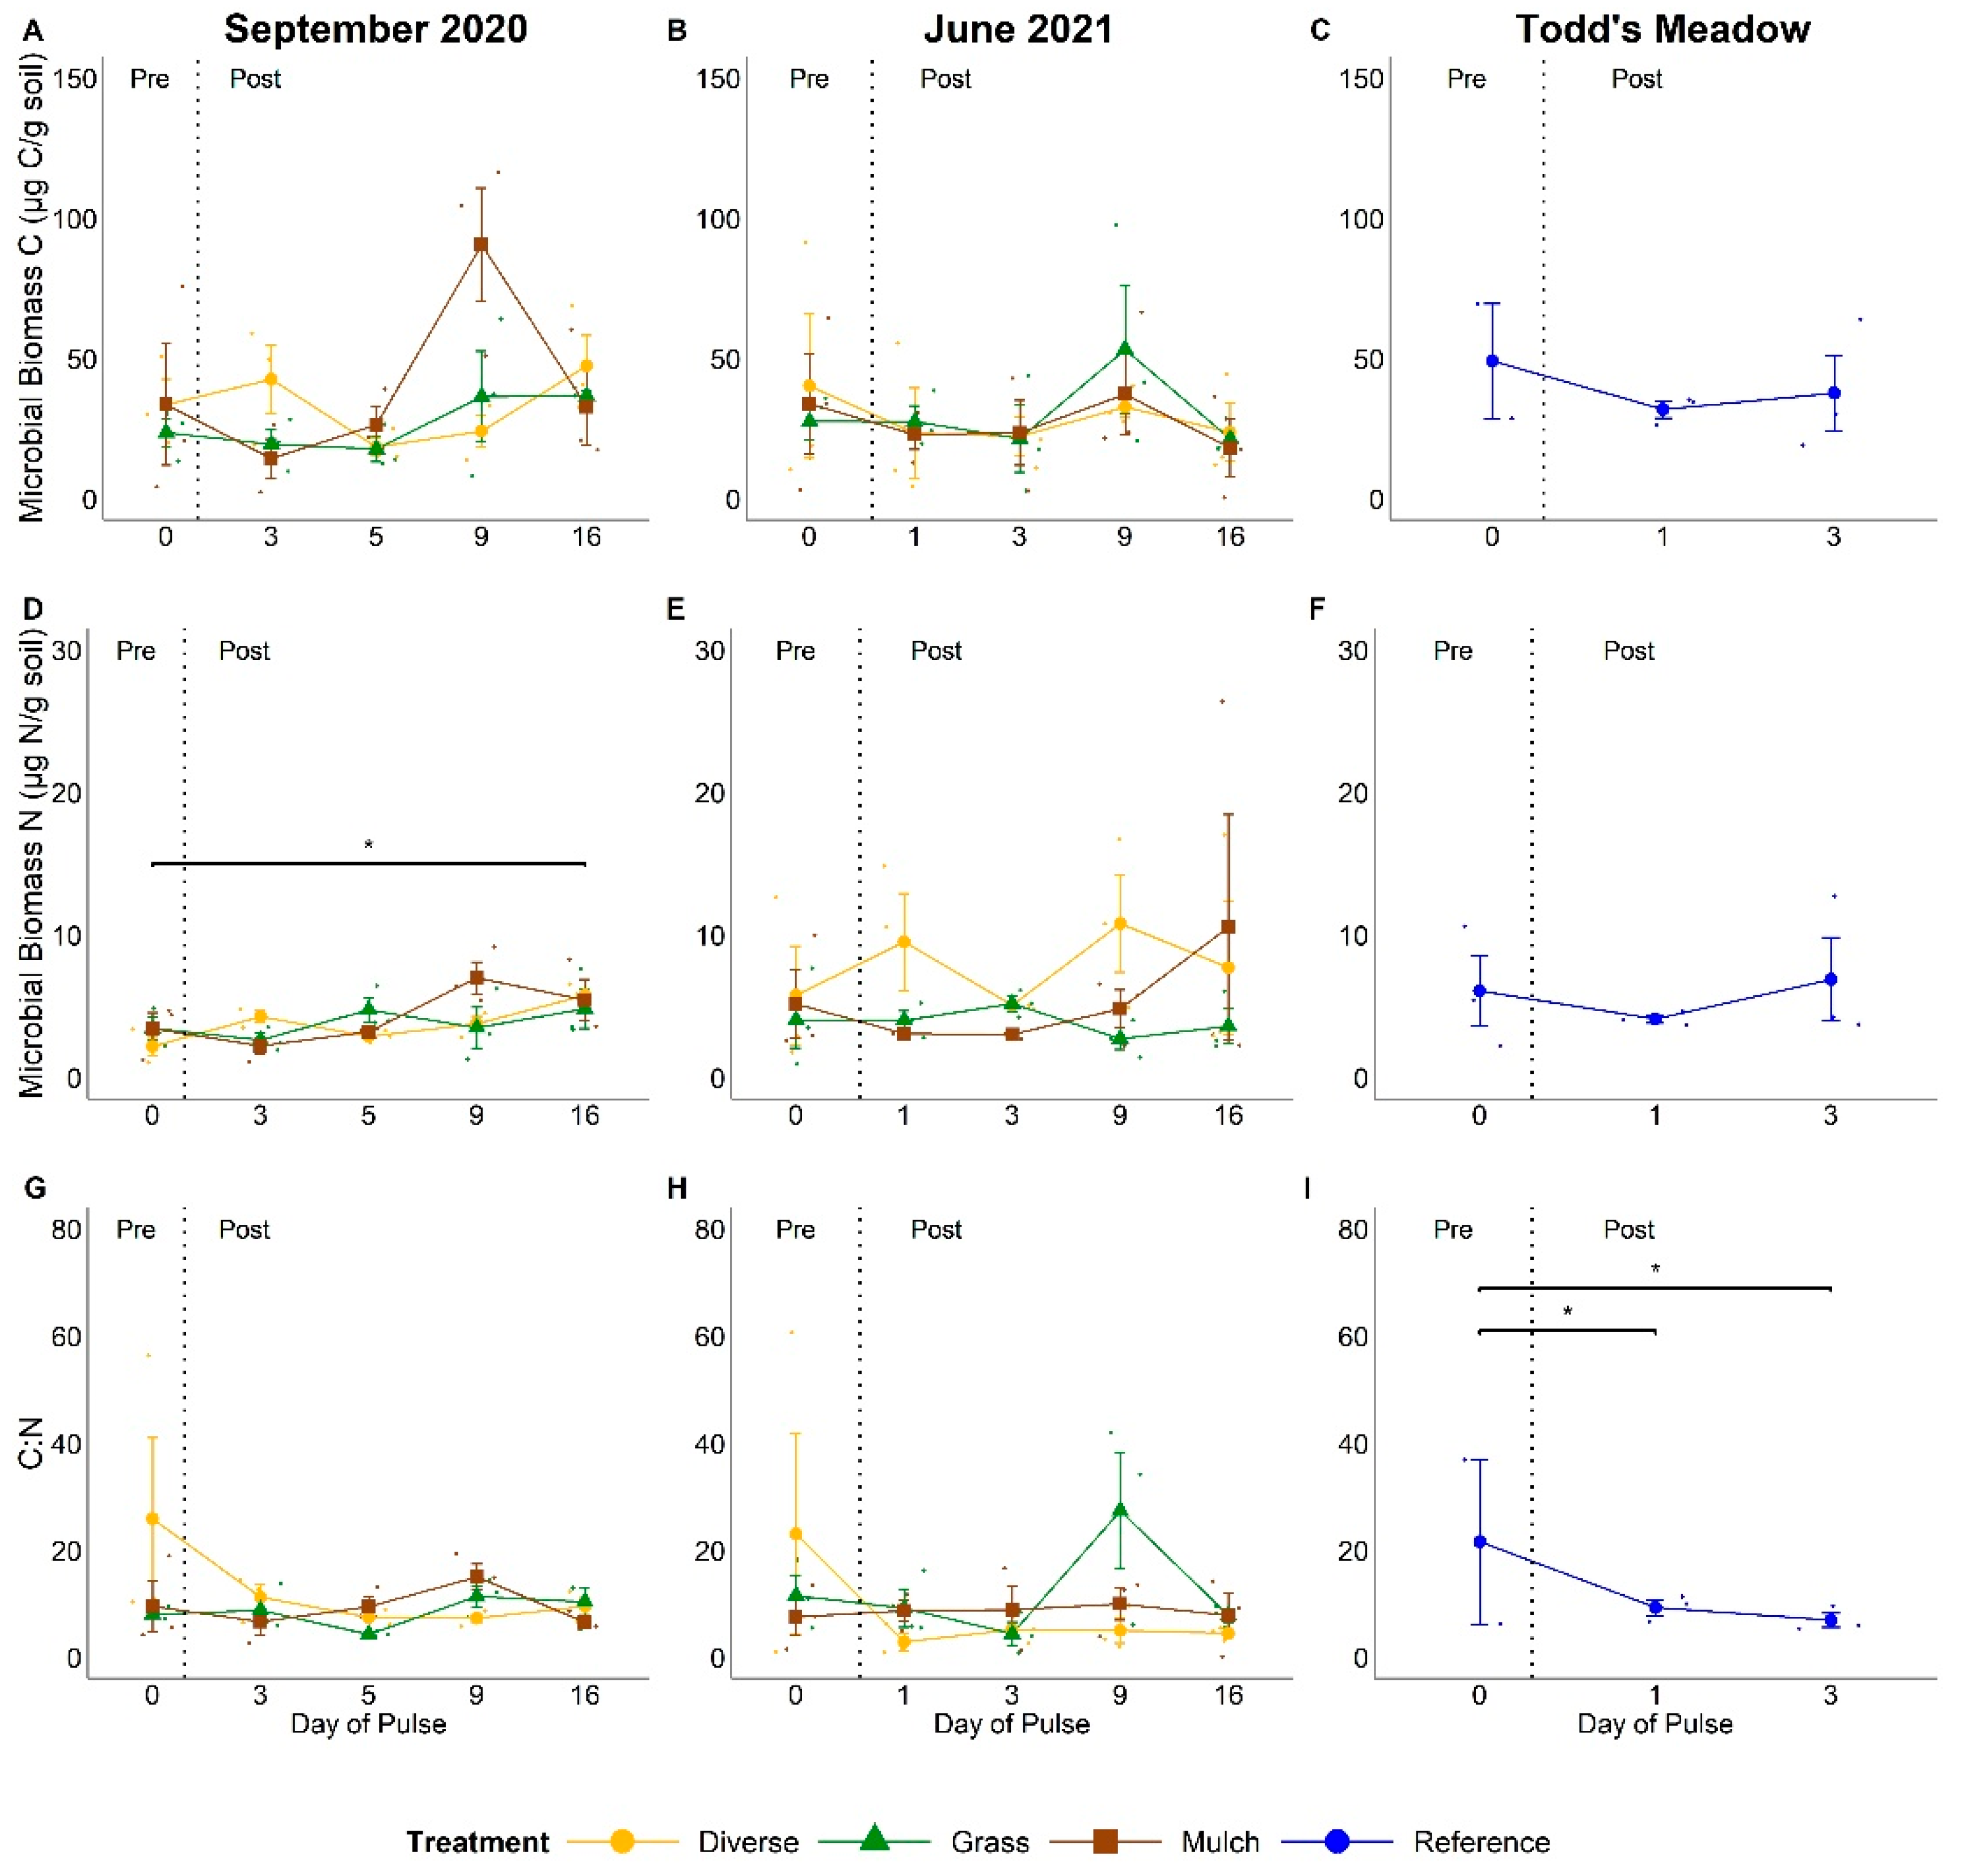
3.2. Microbial Biomass C and N Content

Microbial biomass ranged from 0.46–116 µg C/g soil across sampling sites, with the exclusion of one outlier at Todd’s Meadow with a value of 621 µg C/g soil (Figure 3A–C). We observed no consistent increase in microbial biomass C content across the experimental pulse events at GIRF (Figure 3A,B). However, microbial biomass C content was marginally elevated on day 9 post-pulse in September 2020 relative to day 5 post-pulse (p = 0.09), due to an increase in microbial biomass in non-vegetated plots relative to vegetated plots (t = −7.59, p = 0.05). Microbial biomass C content was elevated in all treatment plots on day 9 post-pulse during the June 2021 experimental pulse event. Still, this shift was not significantly different than the microbial biomass C content observed on other sampling dates during this campaign (F = 0.23, p > 0.05). Upon removal of the one outlier at Todd’s Meadow, no significant changes were observed in microbial biomass C from pre-pulse to 3 days post-pulse (F = 0.457, p > 0.05; Figure 3C). Lastly, mean microbial biomass C content was of similar magnitude at GIRF and Todd’s Meadow (mean of 33.2 ± 3.60 in September 2020, 28.6 ± 3.14 in June 2021, and 38.3 ± 6.44 µg C/g soil at Todd’s Meadow; F = 0.874, p > 0.05; Figure S4A).
Microbial biomass N content in September 2020 at GIRF significantly increased across the pulse event (mean values ranging from 1.05 to 9.16 µg N/g soil, overall mean = 3.95 ± 0.28 mg N/g soil; p = 0.05; Figure 3D). The most marked change occurred between day 3 post-pulse to day 16 post-pulse (values ranging from 4.42 to 7.28 µg N/g soil, respectively; p = 0.05). Additionally, microbial biomass N was significantly elevated in non-vegetated plots relative to grass plots on day 9 post-pulse (t = −9.69, p = 0.03). In contrast, we observed no significant change in microbial biomass N during the June 2021 experimental pulse event at GIRF (F = 0.41, p > 0.05; Figure 3E) or at Todd’s Meadow (F = 0.42, p > 0.05; Figure 3F). Mean microbial biomass N content was of similar magnitude at GIRF over both pulse events and at Todd’s Meadow (mean of 3.95 ± 0.28 in September 2020, 5.66 ± 0.75 in June 2021, and 5.68 ± 1.18 µg N/g soil at Todd’s Meadow; F = 0.53, p = 0.08; post hoc p > 0.05; Figure S4B).
Average microbial biomass C:N ratio for the two experimental pulse events at GIRF remained low (10.1 ± 1.2 in September 2020 and 9.5 ± 1.7 in June 2021), with no significant difference in mean values across either pulse experiment (p > 0.05; Figure 3G–H; Figure S4C). In contrast, microbial biomass C:N ratio (without the one outlier) declined from a pre-pulse mean of 21.5 ± 15.4 to a mean of 6.9 ± 2.3 on day 3 during the Todd’s Meadow natural pulse event (t = 6.31, p = 0.04; Figure 3I). However, average microbial biomass C:N ratios between GIRF experimental and Todd’s Meadow natural pulse (11.4 ± 3.7) events were of similar magnitude (F = 0.133, p > 0.05; Figure S4C).
Plant diversity effects were evident at GIRF with respect to pre-pulse microbial biomass C:N ratios and temporal shifts in C:N ratios within plot treatments. Pre-pulse values of microbial biomass C:N ratios in diverse plots at GIRF ranged from 7.23 to 25.9, with a mean of 25.85 ± 15.22 in September 2020, and 2.85 to 23.1, with a mean of 23.06 ± 18.85 in June 2021. Biomass C:N ratios in diverse plots were greater than other plot treatments in September 2020 (grass: values ranging from 4.26 to 11.3 with a mean of 7.95 ± 0.76, t = 1.14, p < 0.001; non-vegetated: values ranging from 6.53 to 15.0 with a mean of 9.52 ± 4.72, t = 0.89, p < 0.001; Figure 3G) and June 2021 (grass: values ranging from 4.36 to 11.5 with a mean of 11.49 ± 3.69, t = 0.60, p = 0.002; non-vegetated: values ranging from 7.48 to 9.96 with a mean of 7.48 ± 3.47, t = 0.715, p < 0.001; Figure 3H). However, post-pulse microbial biomass C:N ratios in diverse plots were not significantly greater overall than microbial biomass C:N ratios in grass and non-vegetated plots in either year. In September 2020, microbial biomass C:N ratios significantly decreased, by 57–72%, in diverse plots on days 3, 5, 9, and 16 post-pulse relative to pre-pulse conditions (all p ≤ 0.001). In June 2021, microbial biomass C:N ratios in diverse plots significantly decreased, by 78-88%, on days 1, 3, 9, and 16 post-pulse relative to pre-pulse conditions (all p ≤ 0.01). Additionally, C:N ratios in grass plots were 138-528% greater on day 9 post-pulse in June 2021, relative to the pre-pulse sampling date (t = −3.52; p = 0.02) and day 3 post-pulse (t = −3.30; p = 0.03). Elevated microbial biomass C:N ratio in grass plots on day 9 of the June 2021 pulse event resulted in comparatively lower microbial biomass C:N ratios in non-vegetated (t = 2.17, p > 0.05) and diverse plots (t = −2.23, p > 0.05) on this date.

3.3. Ecoenzyme Activity Rates, Ratios, and Vector Analyses

Pulse events generally stimulated ecoenzyme activity rates, with variation in the magnitude and timing of activity rate responses. LAP activity rates were roughly 136–150% greater post-pulse relative to pre-pulse rates throughout the September 2020 experimental event (Figure 4A; all p < 0.05), while the activity rates of AP, BG, and POX were elevated on only a few days post-pulse relative to pre-pulse rates (Figure 4D and Figure 5A,D). During the June 2021 experimental pulse event, LAP activity rates were elevated on days 1 and 2 post-pulse relative to pre-pulse rates (Figure 4B). Still, these differences were not significant (p = 0.06 on day 1 and p = 0.08 on day 2).
AP activity rates showed the greatest change from pre-pulse to 1 day post-pulse during the June 2021 experimental pulse event, with a rate increase of 186% (mean rates 17.2 ± 3.03 to 32.0 ± 4.69, respectively; p = 0.009; Figure 4E). Only a marginal increase in AP activity rates occurred between the pre-pulse date to 5 days post-pulse for the September 2020 experimental event (mean rates 12.1 ± 1.41 to 22.1 ± 2.30, respectively; p = 0.05 Figure 4D). Although AP activity rates appeared elevated from pre-pulse to 3 days post-pulse at Todd’s Meadow, this trend was not significant (mean rates 29.5 ± 5.31 to 48.7 ± 2.23, respectively; p = 0.08; Figure 4F).
BG activity rates were marginally greater on days 3, 5, and 9 post-pulse relative to pre-pulse rates in September 2020 (p = 0.04–0.05 for each day; Figure 5A). BG rates were consistent throughout the pulse experiment in June 2021 (p > 0.05; Figure 5B). Conversely, BG rates increased by 218% from the start to the end of the natural pulse event at Todd’s Meadow in 2021 (p = 0.05; Figure 5C).
Lastly, POX rates showed little change during the September 2020 experimental pulse event at GIRF and the natural pulse event at Todd’s Meadow (September 2020 F = 1.66, p > 0.05; Todd’s Meadow F = 1.51, p > 0.05), yet were consistently elevated by 174–252% on days 1–7 post-pulse during the June 2021 experimental pulse at GIRF (Figure 5D–F). The strongest differences were most apparent on days 2, where it increased by 5618 nmol g−1 h−1 (p = 0.003), and 7, where it increased by 7984 nmol g−1 h−1 (p < 0.001), of the June 2021 experimental pulse event (Figure 5E).
Comparisons of the experimental and natural pulse events indicated that soils at Todd’s Meadow had the greatest LAP, AP, and BG activity rates and the lowest POX activity rate relative to soils at GIRF throughout both pulse events (Figure S5; Table 2). Indeed, LAP and AP activity rates were approximately 200% greater, BG was 260–500% greater, and POX was approximately 200% lower at Todd’s Meadow than at the GIRF plots. However, ecoenzyme activity rates were greater during the June 2021 experimental pulse event relative to the event in September 2020 (Figure S5; Table 2). AP activity rates were the most elevated of the hydrolytic ecoenzymes across experimental and natural pulse events (Figure S5; Table 2). POX activity rates were 3–3.5 orders of magnitude greater than the rates of hydrolytic ecoenzymes (Figure S5; Table 2).
In contrast to the temporal differences in ecoenzyme activity rates within and among pulse events, RMANOVA showed no effect of plant diversity on ecoenzyme activity rates during either experimental pulse event at GIRF (p > 0.05).
Vector analysis indicated that vector lengths and angles were comparable amongst soils collected from different vegetation treatments during the experimental pulse events at GIRF (mean vector length values ranging from 0.94 to 1.25; mean vector angle values ranging from 42.50° to 46.30°; p > 0.05). Soils from Todd’s Meadow had the greatest vector length (values ranging from 1.20 to 1.46, mean of 1.36 ± 0.02), indicating greater labile C limitation relative to soils from GIRF in September 2020 (0.96 ± 0.03; p < 0.001) and June 2021 (1.19 ± 0.03; p = 0.06; Figure 6A,C; Table S6). Soils from GIRF in June 2021 also had greater labile C limitation relative to soils from GIRF in September 2020 (p < 0.001). Mean vector angles were greater at GIRF in September 2020 (values ranging from 39.5° to 65°, mean of 45.3° ± 0.81) relative to June 2021 (values ranging from 36.6° to 54.9°, mean of 43.3° ± 0.36; p = 0.029; Figure 6B,C; Table S6), indicating greater P limitation. However, vector angles were similar for soils collected from both GIRF pulse events and soils collected from Todd’s Meadow in 2021 (values ranging from 42.6° to 46.0°, mean of 44.0° ± 0.33; Figure 6B,C; Table S6).

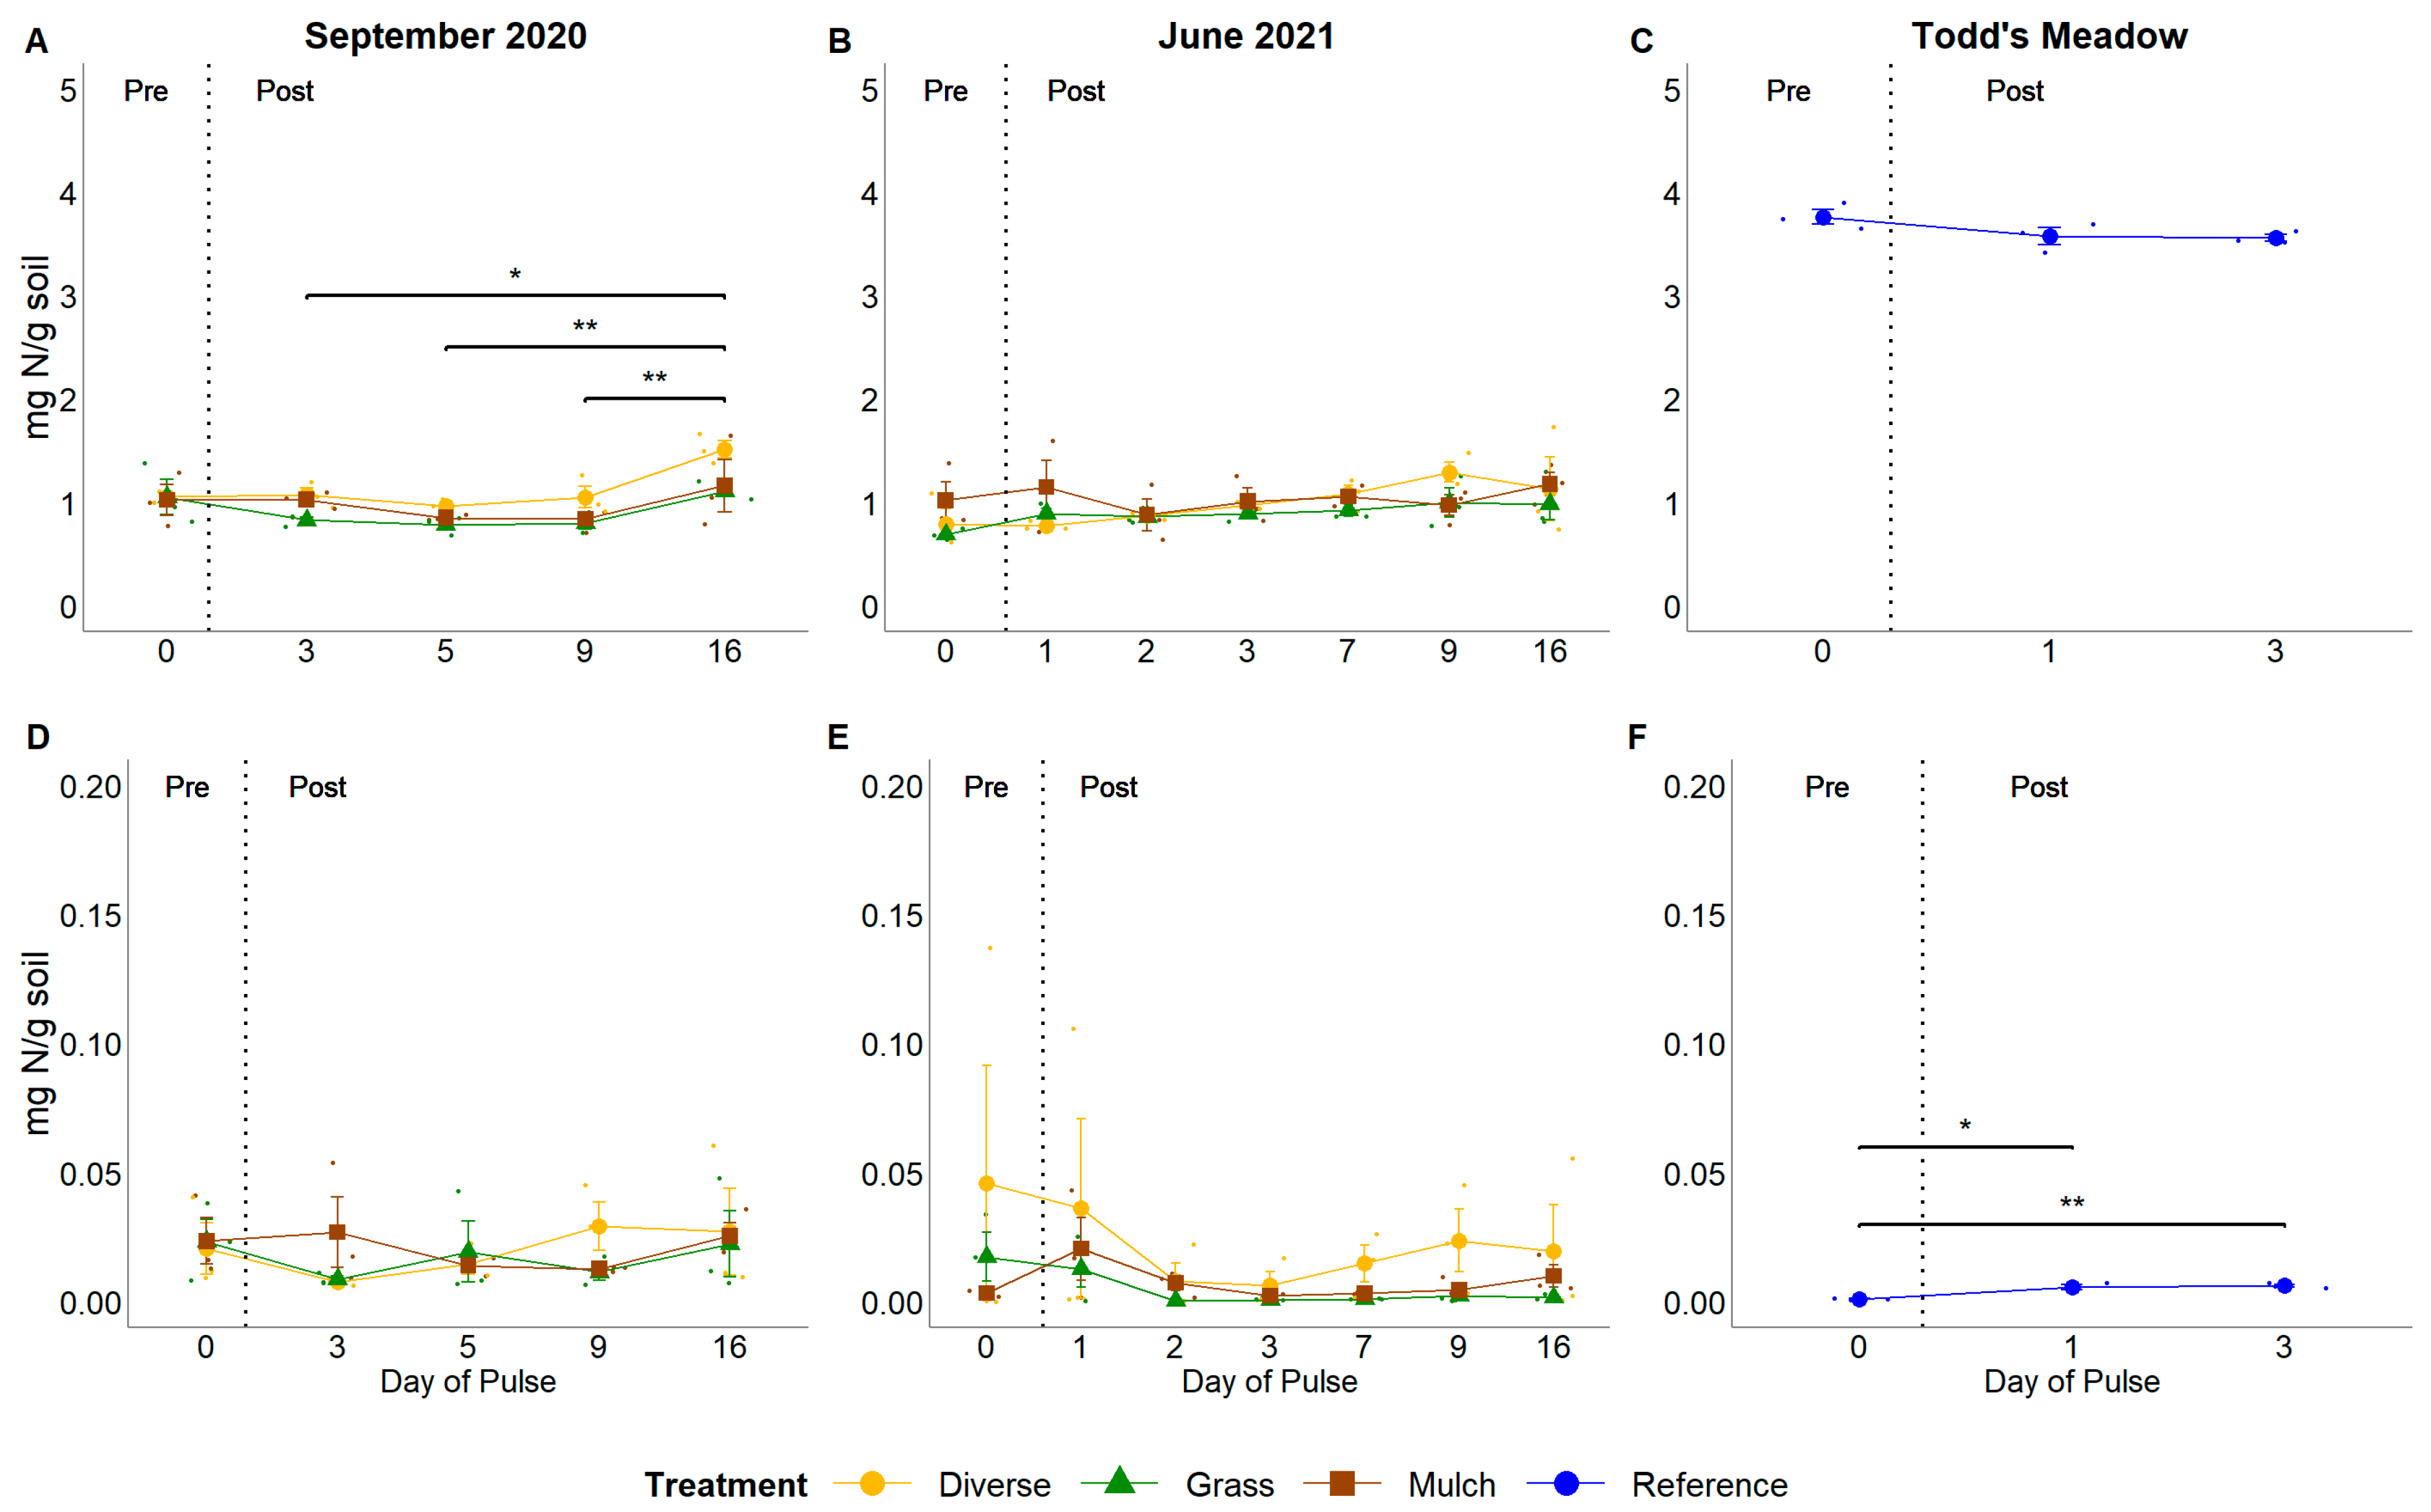
3.4. Soil Organic Matter Content and Pools and Fluxes of Soil N

Soil organic matter content and the pools and fluxes of soil N showed varied responses throughout the pulse experiments, yet lagged changes in soil moisture. Percent organic matter significantly increased by 1.38% from post-pulse day 5 to post-pulse day 16 in September 2020 (p = 0.03; Figure S6A). Similarly, protein concentrations increased from post-pulse day 3 to post-pulse day 16 during the September 2020 experimental pulse event (change of 4.8 µg protein/g soil; p = 0.006; Figure S6D). Organic N concentrations rose during the September 2020 experimental pulse, peaking on post-pulse day 16 (F = 7.02, p < 0.001; Figure 7A), but no change in pools of inorganic N was observed (F = 0.74, p > 0.05; Figure 7D). In contrast, none of these factors significantly changed during the June 2021 experimental pulse event (p > 0.05; Figure S6B,E; Figure 7B,E). During the natural pulse at Todd’s Meadow, concentrations of soil proteins increased by 14.6 µg protein/g soil from pre-pulse to 3 days post-pulse (p = 0.017; Figure S6F) with concomitant increases in inorganic N by 0.005 mg N/g soil from the pre-pulse date to 1 (p = 0.011) and 3 (p = 0.006) days post-pulse (Figure 7F). However, percent organic matter and concentrations of organic N remained stable throughout the natural pulse at Todd’s Meadow (F = 0.31 and 2.87, respectively; p > 0.05; Figure S6C and Figure 7C).
Organic matter content significantly decreased by 0.91–0.94 mg N/g soil from diverse to grass and diverse to non-vegetated plots in September 2020 (p = 0.03 in both cases; Figure S7A). Additionally, diverse plots at GIRF generally had higher pools of soil N relative to other plant treatments during the September 2020 experimental pulse, but not the June 2021 experimental pulse. Soils from diverse plots had, on average, 4 µg/g soil more proteins, 0.22 mg N/g more organic N, and 0.003 mg N/g more inorganic N as compared to grass plots (p = 0.03, 0.04, and 0.03, respectively; Figure S7D; Figure S7A,D). Non-vegetated plots in June 2021 had 6.3 µg/g soil (p = 0.07) and 3.4 µg/g soil (p < 0.001) more protein than diverse and grass plots, respectively (Figure S7E).
Pools of organic matter and N varied amongst sites. Soils from Todd’s Meadow had 4.91–5.47% more organic matter content (p < 0.001), 10.3–11.5 µg protein/g soil more proteins (p < 0.001), and 2.62–2.66 mg N/g soil more organic N (p < 0.001) relative to GIRF (Figures S7C,F and S8C). Soils from Todd’s Meadow also had 0.008–0.015 mg N/g soil less inorganic N than soils from GIRF (p > 0.05; Figure S8F).
Potential proteolytic rates at GIRF (based on samples that received a spike of BSA) ranged from 8.27 to 54.18 µg g−1 soil h−1 but were unaffected by vegetation treatments (p > 0.05; Figure S9). Potential proteolytic rates were marginally greater by 3.5 µg g−1 soil h−1 in June 2021 relative to September 2020 (p = 0.05), but no significant differences in rates were observed between GIRF and Todd’s Meadow (p > 0.05; Figure S9F).
Potential protein turnover rates ranged from 0.09 to 0.82 h but were unaffected by experimental and natural pulse events (p > 0.05; Figure S10A–C). Additionally, there were no differences observed between vegetation treatments at GIRF (p > 0.05). Potential protein turnover rates were approximately two times longer during the June 2021 experimental pulse event at GIRF because average protein concentrations were 1.2–11.5 µg protein/g soil lower relative to the pulse events at GIRF in September 2020 and at Todd’s Meadow (p = 0.009; Figure S10F).

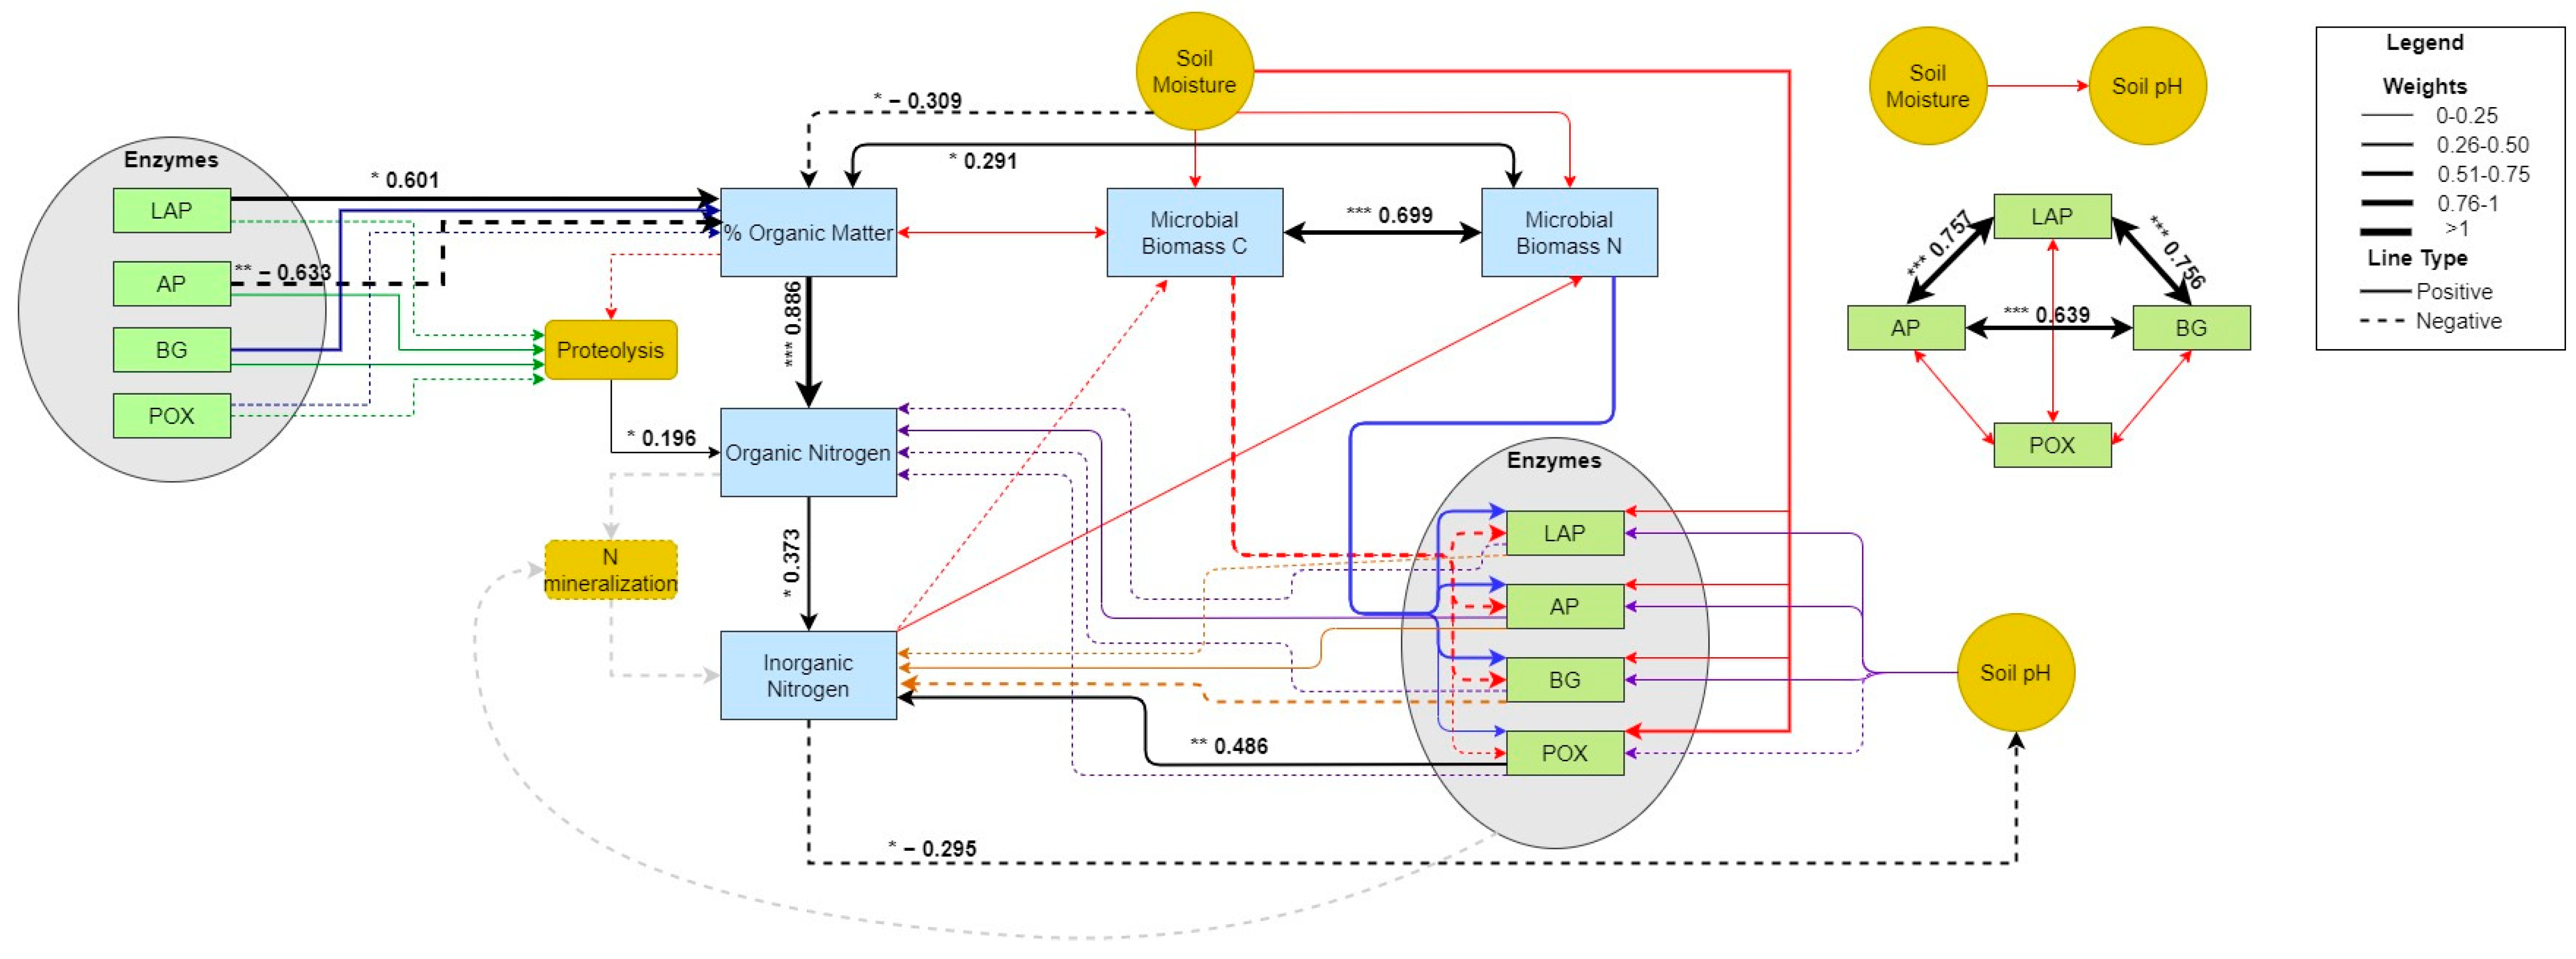
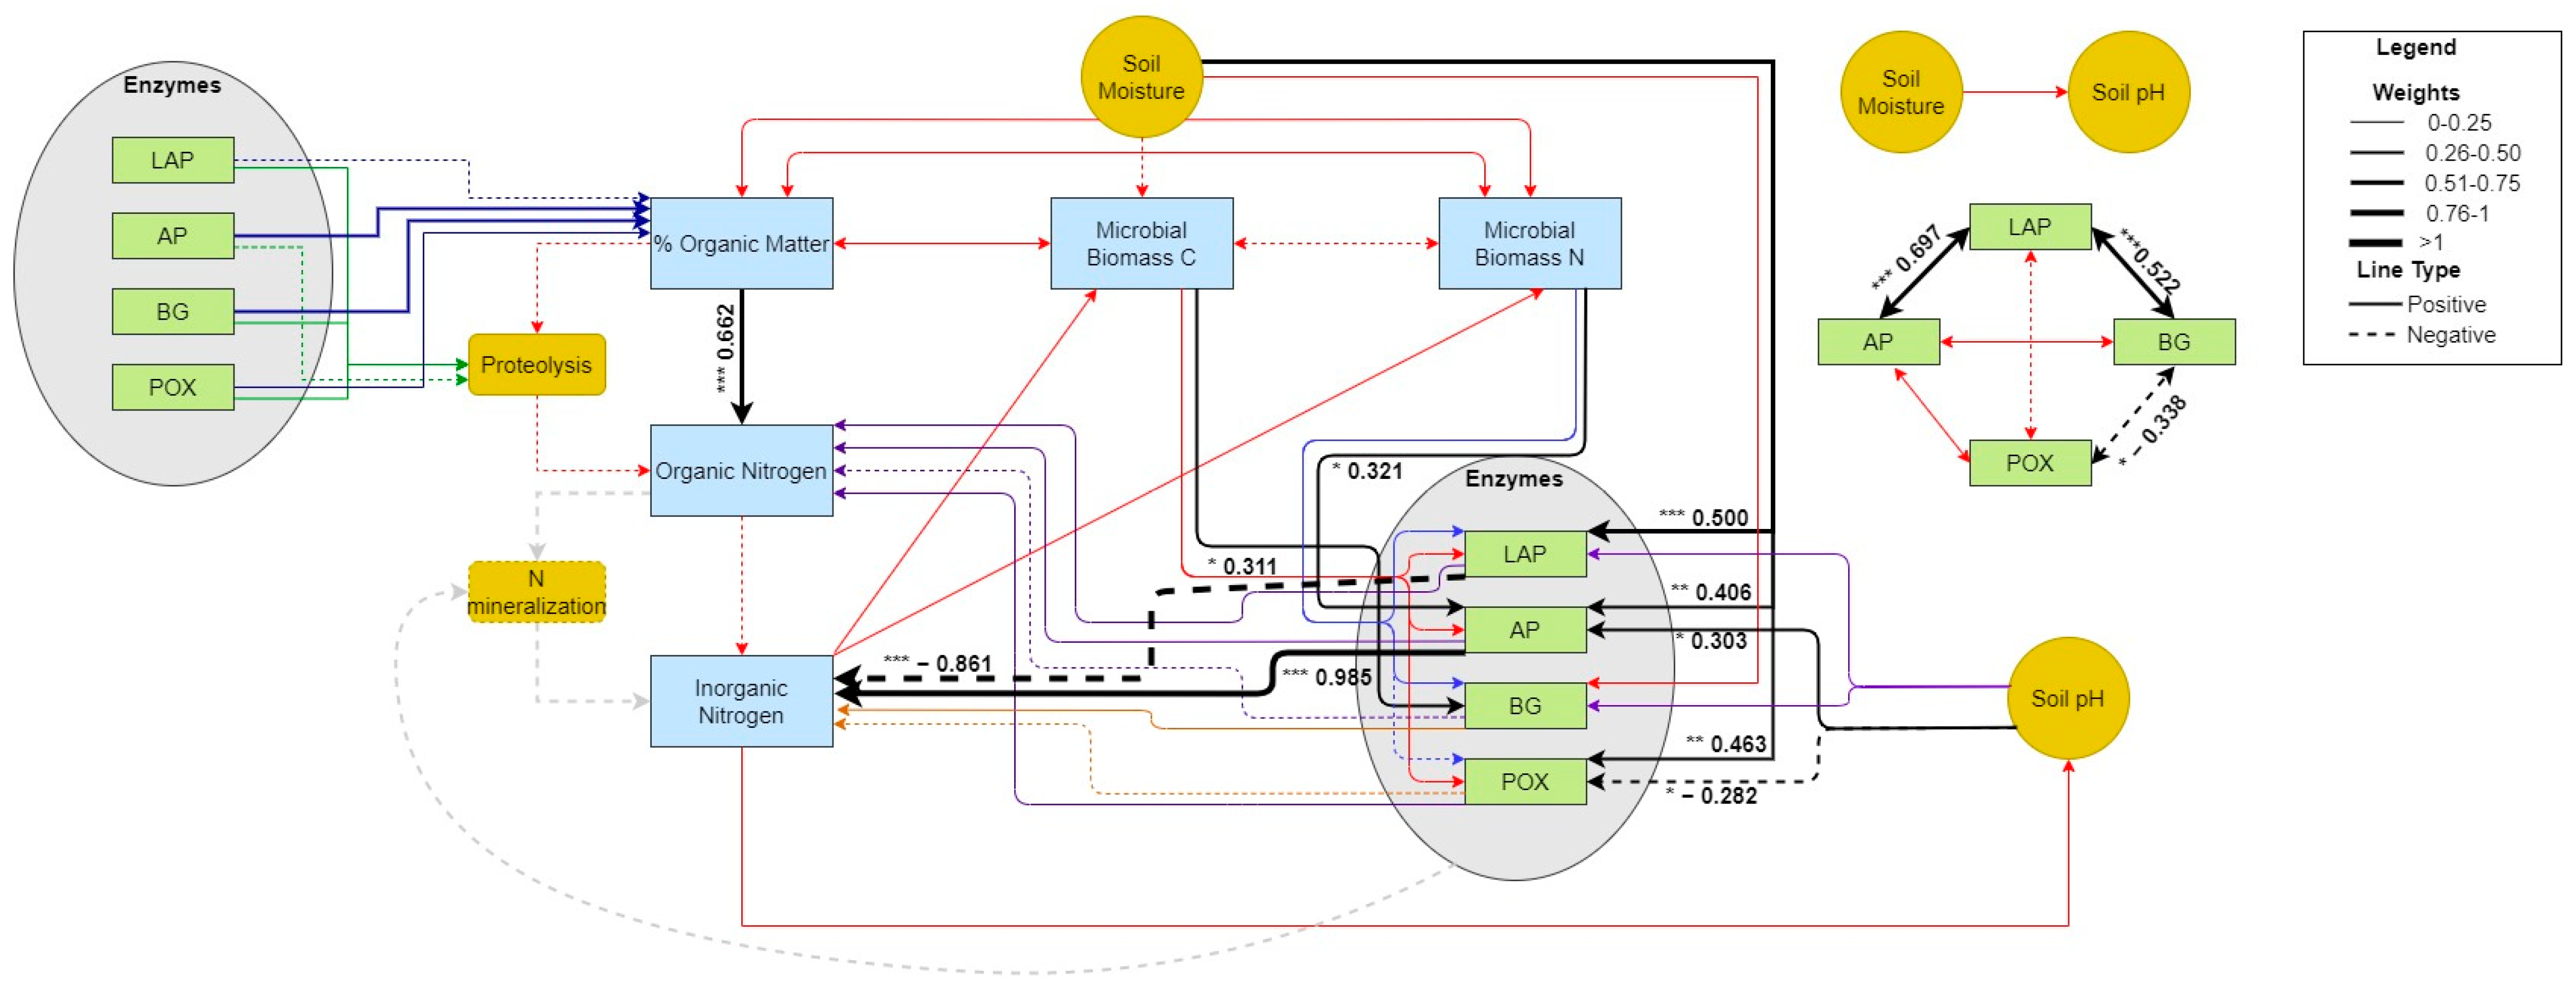
3.5. Pearson Correlation and Piecewise Structural Equation Modeling

Several variables were significantly correlated within events, with variation in the direction and magnitude of the correlations (Figure S11–S13). Furthermore, few variables were correlated in a consistent manner amongst precipitation events (see Supplementary Materials). Consequently, we observed differences in the strengths and directions of standardized effects between variables across pulse events, as calculated by PSEM analysis. These differences precluded clear generalizations regarding how precipitation events affect the physiology of microbial communities or the pools and fluxes of soil N. Similarities between events could only be seen in the strong relationships between ecoenzyme activity rates, which influenced at least one pool or flux of N. Still, the relationships between ecoenzymes varied amongst precipitation events.
In September 2020 at GIRF, soil moisture did not have strong influence on microbial biomass C and N or ecoenzyme activity rates (all p > 0.05; Figure 8; Table S7). However, microbial C and N were strongly coupled (0.699, p < 0.001, Table S7). Hydrolytic ecoenzyme activities also were strongly intra-coupled (ranging from 0.639 to 0.757; all p < 0.001). Declining soil moisture led to an increase in soil organic matter content (−0.309, p = 0.037), and thus indirectly influenced organic N concentration (−0.277) with changes in soil organic matter as the mediator (−0.235). The increase in organic matter content was positively and significantly influenced by the activity of LAP (0.601, p = 0.031), despite a strong concurrent negative effect of AP activity (−0.633, p = 0.007). Although neither POX activity nor inorganic N concentrations significantly fluctuated with soil wetting and drying, PSEM showed POX had a strong, positive effect on soil inorganic N (0.486, p = 0.001). Components of N cycling were related to each other in an expected manner. Both soil organic matter content and rates of proteolysis positively and significantly influenced pools of soil organic N (0.886, p < 0.001 and 0.196, p = 0.023, respectively), which increased over time. In turn, elevated soil organic N concentration positively affected pools of inorganic N (0.373, p = 0.011), although we observed no significant change in soil inorganic N concentrations over the pulse experiment. Nonetheless, fluctuations in soil inorganic N concentrations were correlated to declines in soil pH (−0.295, p = 0.05; Figure 8; Figure S11), due to an indirect, weak effect of soil moisture (0.078).
In June 2021 at GIRF, soil moisture had relatively strong effects on some variables, and only weak indirect effects on other responses. Soil moisture positively stimulated LAP, AP, and POX activities (0.500, 0.406, and 0.463, and p = 0.001, 0.002, and 0.002, respectively; Figure 9; Table S7). Yet, it had weak and opposing indirect effects on organic (0.141) and inorganic (−0.138) N concentrations, with POX acting as the strongest mediator in both cases (0.101 and −0.114, respectively). Soil moisture had an additional indirect effect on soil organic N pools (0.288), with organic matter content as the mediator (0.169). Similar to the September experimental event, hydrolytic ecoenzyme activity rates were coupled. However, significant positive effects were observed between LAP and AP or BG (0.697, p < 0.001 and 0.522, p < 0.001, respectively, Table S7), while the correlation between AP and BG was not significant (p > 0.05, Figure S9). Unlike the previous event, BG and POX were negatively and significantly correlated (−0.388, p = 0.012, Figure S9). Also, in contrast to the previous event, ecoenzyme activity rates were significantly influenced by a number of other factors. Microbial C and N positively affected the activities of BG (0.311, p = 0.047) and AP (0.321, p = 0.014), respectively, while declining pH had opposing effects on the activities of AP (0.303, p = 0.02) and POX (−0.282, p = 0.05). In turn, the activities of AP and LAP had significant, yet opposing strong effects on soil inorganic N pools (0.985, p < 0.001 and −0.861, p < 0.001, respectively, Table S7), but no effect on soil organic matter, as observed in September 2020. Like the previous experimental event, soil organic matter content was positively and significantly correlated to pools of soil organic N (0.662, p < 0.001, Figure S9). However, no significant relationships were observed between other soil N pools or fluxes.
Many causal path coefficients amongst the variables measured during the natural precipitation event in June 2021 at Todd’s Meadow had higher values than the causal path coefficients observed for either experimental event at GIRF, but fewer of these paths were associated with strong or significant correlations (Figure 10; Table S7). However, all hydrolytic enzymes were strongly and significantly coupled (total effects ranging from 0.919–0.970, all p < 0.001, Table S7), and negatively, yet insignificantly correlated to POX activity rate. However, the activity of POX negatively influenced soil organic matter content (−0.788, p = 0.047), although neither parameter significantly fluctuated over the period of observation. Additionally, gravimetric soil moisture was found to significantly influence pH (0.462, p < 0.001).

4. Discussion

4.1. Do Pulses of Water Equal in Magnitude to Moderate- to High-Intensity Storm Events Stimulate SGI Microbial Community Growth and Resource Acquisition?

Changes in microbial community biomass C and N content are indicators of microbial community growth and N assimilation, which facilitate N retention within soils. We observed no significant change in microbial community biomass C content throughout any of the pulse events we studied, contrary to our prediction. Our results are consistent with microbial community responses to experimental water addition in soils from semi-arid shrublands [54] and shortgrass steppe [55], as well as curb cut rain gardens in the arid southwestern U.S., intercepting monsoonal precipitation [56].
Soil organic matter is often low in arid ecosystems [9,17,57], including SGI [15,56]. Microbial biomass within SGI can be constrained by soil organic matter content [11,58]. Although soil organic matter availability often increases immediately post precipitation in drought-prone natural systems [17], it remained largely constant at GIRF and Todd’s Meadow. Accumulation of soil organic matter in arid ecosystems can be limited by high oxidative enzyme potential, favored in alkaline soils over a range of soil moisture conditions [59,60]. High rates of oxidative enzymes, as observed at our study sites before and after soil wetting (with POX activities exceeding rates of hydrolytic enzymes by 2–3 orders of magnitude), promote the breakdown of recalcitrant organic matter, even when microbes compete for more labile C substrates via the expression of cellulolytic enzymes [9].
Biomass production under limited substrate availability is disadvantageous, as it increases microbial competition and decreases rates of decomposition [57]. Microbial biomass C accrual may have been constrained not only by organic matter availability but also augmented respiration rate, which is a common response of soil microbes in arid ecosystems to precipitation pulses [9,17] and can lead to reduced carbon use efficiency [30,61]. Although we did not measure rates of soil respiration, elevated ecoenzymatic activity indicated that microbial metabolism was stimulated. Ecoenzyme production is energetically expensive, potentially limiting microbial growth over the short-term [10]. Increased investment in C and N acquisition via ecoenzymes may reflect microbial resistance against cell lysis, resulting from pulsed water availability post drought [61]. Microbes utilize labile C substrates to manufacture a layer of polysaccharide-rich mucilage to avoid desiccation, and N-rich substrates (e.g., amino acids) to protect against negative osmotic potential in soil [21]. Evidence supporting these mechanisms was apparent from our results in September 2020 at GIRF, when both BG and LAP activities were significantly elevated for several days post-wetting and a significant increase in microbial biomass N content was observed by day 16 after water addition. Nonetheless, uptake of N by soil microbes was limited at both GIRF and Todd’s Meadow, suggesting a low capacity for N retention within biomass in the absence of increased production.

4.2. Do Pulsed Water Additions Induce Changes to Soil N Pools and Fluxes?

Soil moisture is a key driver of microbial processes in semi-arid to arid ecosystems, [9] and proves to be an important factor governing rates of N cycling and removal from SGI in both field [16,62] and mesocosm studies [14,63,64]. Yet, SGI systems also display a wide range of variability with respect to rates of N cycling, because factors other than moisture availability also regulate N pools and fluxes in SGI soils [65]. Such variability was apparent in the present study, where we observed modest increases in pools of soil proteins at both GIRF in September 2020 and at Todd’s Meadow, as well as elevated organic N at GIRF in September 2020, and elevated inorganic N at Todd’s Meadow in response to pulse events. In contrast, pools and fluxes of soil N were largely unresponsive to wetting at GIRF in June 2021. Furthermore, proteolytic rate was invariant amongst all pulse events.
Studies of SGI in in both mesic and xeric environments indicate soil organic matter or organic carbon content explains a large fraction of variation in N cycling parameters [11,15,66]. In addition, the activities of hydrolytic and oxidative enzymes generally increase when moisture constraints are alleviated in arid ecosystems [30,54,61,67,68], facilitating faster rates of decomposition and N mineralization by microbes relative to an antecedent period of dryness [17]. Similarly, we show that the production of both hydrolytic and oxidative ecoenzymes by microbial communities were catalyzed by elevated soil moisture, at rates on par with natural systems [30,54,61,67]. However, subsequent change to soil N pools was limited.
PSEM analyses generally indicated that organic matter content and soil organic N were positively correlated in our study. At GIRF, soil organic matter content had the strongest direct influence on soil organic N concentration, while rates of ecoenzyme activities were more closely associated with the availability of inorganic N. However, the influence of each ecoenzyme on inorganic N pools varied amongst pulse events at GIRF. POX had a moderately strong influence on inorganic N concentration in September 2020, indicative of microbial communities mining N from more recalcitrant humic substances [10,50] rather than labile soil proteins, despite elevated rates of LAP stimulated by soil wetting. No change in pools of soil N at GIRF in June 2021 may be an emergent property of POX activity being unrelated to soil N concentrations at this time, little upregulation of LAP activity, and inverse effects of LAP and AP rates on soil inorganic N pools. No factor we measured had a direct influence on soil N pools at Todd’s Meadow, but POX activity was a strong driver of soil organic matter content. Cascading effects on soil organic matter and N content were likely more evident at GIRF than Todd’s Meadow, because reservoirs of organic matter and soil N relative to fluxes were larger at Todd’s Meadow versus GIRF.

4.3. To What Extent Are Microbial Physiology and Soil N Dynamics Controlled by Plant Diversity vs. Ecological Stoichiometry?

Many studies have demonstrated disparate effects of different plant species on microbial ecoenzyme expression [69] and nutrient dynamics in SGI microcosms [14,63,69,70]. Fewer studies have specifically examined the effect of mixed plant communities on SGI soil nutrient pools and fluxes in SGI field sites with controlled plant diversity treatments, and our study is the first field-based examination of ecoenzyme activity in replicated plant diversity SGI treatments. Houdeschel et al. (2015) [16] assessed phosphate, nitrate and total N (TN) retention in unvegetated experimental SGI plots and plots comprised of an upland or wetland plant community over an annual cycle. All treatments retained a significant fraction of phosphate, while only vegetated plots retained TN. Nitrate retention occurred only in the wetland treatment, which received supplemental water via irrigation throughout the period of study, plus the simulated stormwater addition applied to all treatments. Other SGI mesocosm studies show that the differences in species-specific effects on soil N dynamics become more varied with shifts in moisture regime from relatively wet to dry conditions [14,63].
In our study, pulsed water additions led to significant departures from pre-pulse values of microbial C:N ratios and the content of soil organic matter, proteins, and N pools. However, differences in these metrics were inconsistent amongst plant treatments and between pulse events. In the case of soil moisture, differences were related to the presence of plants, rather than plant diversity. Roots in vegetated plots may have facilitated the transport of water from the soil surface to deeper in the soil profile, and subsequently transpired by plants [71]. Microbial C:N ratios were also elevated within diverse plots prior to water addition in both September 2020 and June 2021 relative to the grass and unvegetated plots, potentially due to greater competition for N by the more diverse plant community [72]. However, C:N ratios became indistinguishable amongst plant treatments shortly after soil wetting, demonstrating that soil N availability in diverse plots was sufficient for supporting microbial assimilation of N once the constraint of water limitation was lifted. Finally, plant diversity treatments at GIRF had no effect on the activity rates of ecoenzymes, despite differences in organic matter (September 2020) and protein (June 2021) pools between plant treatments after experimental wetting. Our results thus provide weak evidence that differences in plant diversity control microbial physiology and N dynamics in SGI soils. Yet, more field studies assessing the role of plant diversity while controlling other features of SGI design and moisture regime are needed to better distinguish the effects of plant diversity relative to other drivers of N cycling in situ.
Stoichiometric analyses provide insights about the balance of resources within the environment and how it in turn affects the elemental content of microbial communities. Specifically, ecoenzyme activities link microbial energy and nutrient requirements to environmental resource supply [10,73]. Our study is the first to utilize vector analyses and PSEM to interpret energy and nutrient limitation of microbial communities in SGI, and the elements most targeted when precipitation alleviates soil moisture constraints. Vector lengths indicated that labile C was least limiting at GIRF in 2020, and most limiting at Todd’s Meadow. Mean microbial biomass C content at GIRF and Todd’s Meadow was comparable to global averages from grassland and shrubland soils (43.4 and 28.5 µg C g−1 soil, respectively) [34], an order of magnitude greater than vegetated curb cuts in Tuscon, AZ [56], but 1–2 orders of magnitude lower than SGI microbial communities in more mesic biomes [11,58,66]. Vector angles suggested instances of N limitation at GIRF during both pulse events, coincident with microbial upregulation of LAP (September 2020) or POX (June 2021) to acquire N from available substrates. Mean microbial biomass N content at GIRF and Todd’s Meadow was similar to the global average from desert and grassland soils (2.4 and 5.5 µg N g−1 soil, respectively) [34], but 2.5–13 times lower than SGI microbes in more mesic biomes [11,58]. P acquisition was in greatest demand at GIRF in June 2021, as evidenced by upregulated AP activities. However, vector analysis did not identify P as limiting. Rather, the supply of C, N, and P appeared low, yet in equilibrium amongst study sites. Most datapoints fell near the 1:1 line for the relationship between ecoenzymatic activity ratios (BG/LAP vs. BG/AP), and vector angles close to 45° suggest a relatively balanced investment in the acquisition of substrates rich in N and P. Furthermore, PSEM analyses showed that all hydrolytic enzymes were tightly correlated at GIRF in September 2020 and Todd’s Meadow. The activities of hydrolytic enzymes were consistently greater at Todd’s Meadow relative to both pulse events at GIRF, supported by greater pools of soil organic matter, proteins, and organic N from which to hydrolyze assimilable forms of labile C, N, and P. Organic matter at Todd’s Meadow also may have been relatively rich in cellulose, supporting high rates of BG activity; whereas microbial communities at GIRF had to rely on more humic sources of C acquired through the expression of POX, particularly in June 2021. Elevated substrate pools at Todd’s Meadow are the result of soil formation processes over a much longer duration of time relative to GIRF and a product of greater plant cover. Nonetheless, larger pools of more labile organic matter and higher hydrolytic enzyme activity at Todd’s Meadow were insufficient for overcoming general C limitation constraining microbial biomass production.
Classic interpretation of control over ecosystem processes by ecological stoichiometry examines the ratios of C and nutrients in microbial biomass and assimilable substrates. Global means for microbial biomass C:N ratios are estimated to be between 7.6 and 8.6, and reflect values expected under resource equilibrium [34,74]. Microbial biomass C:N ratio is a strong control on microbial N use efficiency, with greater N use efficiency at higher biomass C:N ratio [57]. Mean microbial biomass C:N ratio amongst our pulse events were similar to the global average, suggesting C and N elemental content were generally balanced. Mean microbial C:N ratios also were lower than or on par with C:N values from microbial communities in more mesic SGI [11,58]. Elevated C:N ratios observed pre-pulse indicated some N limitation in diverse plots at GIRF and at Todd’s Meadow. These ratios declined post-wetting to approximate mean values for each pulse event, presumably through greater short-term N use efficiency facilitated by ecoenzyme activity, despite limited direct evidence of N uptake through change in microbial biomass N content. Balanced microbial C:N ratio should induce community growth [75], yet microbial community biomass stayed relatively constant in our study. The chronic low supply of organic matter rich in labile C, declining soil moisture, and rapid degradation of expressed ecoenzymes, combined with the microbial community’s need to protect itself from osmotic stress, may have precluded an apparent change in microbial biomass during any pulse event.

4.4. Study Limitations

We did not assess all pathways by which N is retained or lost from bioswales, such as plant uptake or denitrification potential. N uptake capacity by vegetation is affected by plant biomass and other plant traits (e.g., root depth, N-fixation capacity, N use efficiency) [76]. Plot diversity treatments may therefore have induced a varied intensity of competition for N between plants and microbes [77]. Yet, vegetation in semi-arid to arid ecosystems are not always activated by small wetting events [17], so microbial and plant processes may be decoupled [78]. In contrast, larger events drive both microbial and plant processes simultaneously [79], and plants can continue to be active for a longer period due to retained moisture in the subsurface after surface soils have dried out [17]. GIRF soil moisture sensors at 20 cm and 50 cm depth recorded data inconsistently for all plots over the course of pulse events. However, operational sensors showed that water addition wetted soils at both depths for GIRF pulse events and soil moisture declined to baseline levels within two weeks [42], similar to surface soils. Thus, it is unlikely that plants remained active at GIRF for an extended period.
SGI can have highly variable denitrification potential, depending on type, season, soil moisture and antecedent conditions [65]. Rates can also be comparable or higher than nearby urban reference grassland or riparian areas [15,58,62,65,80]. We tried to quantify gaseous losses of N via denitrification during the September 2020 pulse event, but most samples were near or below the analytical detection limit, likely due to chronically low soil moisture [62].

5. Conclusions

Our study is one of the first to evaluate ecosystem responses to pulsed water addition in SGI, although similar experiments are numerous in natural aridland sites. Our experimental pulse events were successful in elevating soil moisture in SGI plots, similar to the natural pulse event at Todd’s Meadow. In general, pulse events elevated pH, stimulated the activities of ecoenzymes produced by microbes, and increased the concentration of organic matter, proteins, and inorganic and organic N in bioswale and soils of the relatively undisturbed montane meadow. Yet, these responses did not occur consistently across all pulse events, and the magnitude of changes observed often differed between pulse events. Variation in responses may have been induced by differences in the intensity of water application during experimental and natural precipitation events, shifts in season during which pulse events occurred, or antecedent conditions prior to pulse events; all of which are factors that cannot be assessed due to limited replication. Nonetheless, pulsed precipitation appears to be the catalyst inducing the activation of ecosystem processes within the system, but not a proximate driver of nutrient dynamics. Rather, shifts in soil organic and inorganic N concentrations were most directly correlated to changes in organic matter availability, mediated by the upregulation of ecoenzymes produced by microbes responding to short-term alleviation of limited soil moisture. Uptake of N by microbes was limited, and growth was negligible, due to ongoing C limitation and potential use of C and N substrates to protect against cell lysis from drought. Furthermore, we did not find evidence for the resource pulse reserve hypothesis (sensu [17], given little to no change in soil microbial biomass and reservoirs of soil N, plus the rapid decline of ecoenzyme activity rates with soil drying.
We utilized biodiversity–ecosystem function (BEF) and ecological stoichiometry (ES) theories as frameworks to assess the dominant mechanisms controlling microbial community responses to precipitation pulses, and the subsequent effects on nutrient retention and cycling in bioswales planted with three vegetation treatments and a montane grassland meadow within a semi-arid environment. We found greater support for the ecological stoichiometry of microbial biomass and resource supply (as inferred from ecoenzymatic activity) vs. plant diversity for controlling N dynamics in SGI post experimental wetting. However, biodiversity effects may have been masked by similarities in plant cover at GIRF, and ostensibly by biomass production, resulting in inconsistencies between plant treatments with regard to organic matter availability that was more directly linked to N response variables. Indeed, the two theoretical frameworks are not mutually exclusive. There is a growing recognition that ecological stoichiometry represents a mechanistic link between biodiversity and ecosystem function across levels of biological organization [81]. SGI systems represent laboratories within human landscapes in which this linkage can be further tested.
Nutrient dynamics of SGI are comparable to local natural systems [80], even if they have been constructed relatively recently (<10 years) [58], as is the case at GIRF in comparison to Todd’s Meadow. We conclude that microbial community N acquisition and soil N dynamics in SGI of semi-arid to arid ecosystems behave similarly to regional vegetated communities, despite differences in ecoenzyme activity rates mediating N availability and utilization, when soil media composition is comparable to neighboring natural areas (i.e., low in organic matter and nutrient content, basic pH) and SGI infiltrate water infrequently and dry rapidly..

Supplementary Materials

The following supporting information can be downloaded at: https://www.mdpi.com/article/10.3390/w16131931/s1, Figure S1: Conceptual model of microbial community and N cycling processes; Figure S2: Comparison of (A) gravimetric soil moisture and (B) pH between experimental and natural pulse events; Figure S3: pH responses during experimental and natural pulse events; Figure S4: Comparison of microbial biomass C and N content and C:N ratios between pulse events; Figure S5: Comparison of ecoenzyme activity rates between the experimental and natural pulse events; Figure S6: Percent organic matter and protein concentrations during the pulse events; Figure S7: Comparison of organic matter and protein concentrations; Figure S8: Comparison of organic and inorganic N; Figure S9: Proteolytic rates; Figure S10: Potential protein turnover; Figure S11: September 2020 experimental pulse Pearson correlation matrix; Figure S12: June 2021 experimental pulse Pearson correlation matrix; Figure S13: 2021 Todd’s Meadow natural pulse Pearson correlation matrix; Table S1: List of plant species present in grass and diverse plots at the Green Infrastructure Research Facilities (GIRF); Table S2: Meteorological and soil sensors associated with the Wasatch Environmental Observatory (WEO); Table S3: Climate and soil moisture values recorded at the Green Infrastructure Research Facility (GIRF) and Todd’s Meadow during simulated precipitation pulse events in 2020 and 2021; Table S4: Climate and soil moisture values recorded at the Green Infrastructure Research Facility (GIRF) and Todd’s Meadow in 2020 and 2021 during the growing season for each year (May 1 to October 1); Table S5: List of sampling dates associated with pulsed precipitation events at the Green Infrastructure Research Facility (GIRF) and Todd’s Meadow during 2020 and 2021 field seasons.; Table S7: Experimental and natural pulse event significant paths as determined from PSEM analysis.

Author Contributions

Conceptualization, J.F.S. and R.M.S.; methodology, J.F.S., R.M.S. and Y.D.H.; formal analysis, Y.D.H., J.F.S., S.B. and K.A.M.; investigation, Y.D.H., J.F.S., R.M.S. and K.A.M.; data curation, Y.D.H., J.F.S. and K.A.M.; writing—original draft preparation, Y.D.H. and J.F.S.; writing—review and editing, Y.D.H., J.F.S., R.M.S., S.B., R.G. and S.J.H.; visualization, Y.D.H. and J.F.S.; supervision, J.F.S. and R.M.S.; project administration, J.F.S., R.M.S. and R.G.; funding acquisition, J.F.S., R.M.S. and R.G. All authors have read and agreed to the published version of the manuscript.

Funding

This research was funded by the U.S. National Science Foundation (NSF) Division of Environmental Biology (DEB), grant number 2006308, and the Global Change and Sustainability Center at the University of Utah. Additional support for Y.D.H. was provided by the Department of Geography and the Environmental & Sustainability Studies Program at the University of Utah. Support for the operation of the Wasatch Environmental Observatory (WEO) has been provided through numerous grants from the NSF, University of Utah, and Salt Lake County Public Utilities.

Data Availability Statement

Climate and soil monitoring data from the Wasatch Environmental Observatory (WEO) sensor network is archived in the HydroShare data repository (www.hydroshare.org, accessed on 14 March 2022). Data can be found by searching for “WEO” under “Browse data”. All data and R codes utilized for this study, including data downloaded from HydroShare, can be found at the following publicly available GitHub repository: https://github.com/HastingsY/GIRF-Pulse-Experiment, accessed on 14 March 2022; all code and products are archived and publicly available on Zenodo at https://doi.org/10.5281/zenodo.11406309.

Acknowledgments

The authors would like to thank Diane Pataki for assistance with funding for this study and access to laboratory space to process samples. We also thank Logan Jamison, Madeline Jensen, and Julie Williams for their assistance as field technicians, the U.S. Forest Service and Salt Lake County Public Utilities for granting access to the Red Butte Canyon Research Natural Areas, and anonymous reviewers whose comments improved the quality of this manuscript.

Conflicts of Interest

The authors declare no conflicts of interest. The funders had no role in the design of the study; in the collection, analyses, or interpretation of data; in the writing of the manuscript; or in the decision to publish the results.

References

  1. Gold, A.C.; Thompson, S.P.; Piehler, M.F. Nitrogen Cycling Processes within Stormwater Control Measures: A Review and Call for Research. Water Res. 2019, 149, 578–587. [Google Scholar] [CrossRef] [PubMed]
  2. Meerow, S.; Natarajan, M.; Krantz, D. Green Infrastructure Performance in Arid and Semi-Arid Urban Environments. Urban Water J. 2021, 18, 275–285. [Google Scholar] [CrossRef]
  3. Golden, H.E.; Hoghooghi, N. Green Infrastructure and Its Catchment-scale Effects: An Emerging Science. WIREs Water 2018, 5, e1254. [Google Scholar] [CrossRef]
  4. Walsh, C.J.; Roy, A.H.; Feminella, J.W.; Cottingham, P.D.; Groffman, P.M.; Ii, R.P.M. The Urban Stream Syndrome: Current Knowledge and the Search for a Cure. J. N. Am. Benthol. Soc. 2005, 24, 706–723. [Google Scholar] [CrossRef]
  5. Booth, D.B.; Roy, A.H.; Smith, B.; Capps, K.A. Global Perspectives on the Urban Stream Syndrome. Freshw. Sci. 2016, 35, 412–420. [Google Scholar] [CrossRef]
  6. Osman, M.; Yusof, K.W.; Takaijudin, H.; Goh, H.W.; Malek, M.A.; Azizan, N.A.; Ghani, A.A.; Abdurrasheed, A.S. A Review of Nitrogen Removal for Urban Stormwater Runoff in Bioretention System. Sustainability 2019, 11, 5415. [Google Scholar] [CrossRef]
  7. Galloway, J.N.; Townsend, A.R.; Erisman, J.W.; Bekunda, M.; Cai, Z.; Freney, J.R.; Martinelli, L.A.; Seitzinger, S.P.; Sutton, M.A. Transformation of the Nitrogen Cycle: Recent Trends, Questions, and Potential Solutions. Science 2008, 320, 889–892. [Google Scholar] [CrossRef] [PubMed]
  8. Decina, S.M.; Hutyra, L.R.; Templer, P.H. Hotspots of Nitrogen Deposition in the World’s Urban Areas: A Global Data Synthesis. Front. Ecol. Environ. 2020, 18, 92–100. [Google Scholar] [CrossRef]
  9. Collins, S.L.; Sinsabaugh, R.L.; Crenshaw, C.; Green, L.; Porras-Alfaro, A.; Stursova, M.; Zeglin, L.H. Pulse Dynamics and Microbial Processes in Aridland Ecosystems. J. Ecol. 2008, 96, 413–420. [Google Scholar] [CrossRef]
  10. Sinsabaugh, R.L.; Shah, J.J.F. Ecoenzymatic Stoichiometry and Ecological Theory. Annu. Rev. Ecol. Evol. Syst. 2012, 43, 313–343. [Google Scholar] [CrossRef]
  11. Deeb, M.; Groffman, P.M.; Joyner, J.L.; Lozefski, G.; Paltseva, A.; Lin, B.; Mania, K.; Cao, D.L.; McLaughlin, J.; Muth, T.; et al. Soil and Microbial Properties of Green Infrastructure Stormwater Management Systems. Ecol. Eng. 2018, 125, 68–75. [Google Scholar] [CrossRef]
  12. Ali, W.; Takaijudin, H.; Yusof, K.W.; Osman, M.; Abdurrasheed, A.S. The Common Approaches of Nitrogen Removal in Bioretention System. Sustainability 2021, 13, 2575. [Google Scholar] [CrossRef]
  13. Skorobogatov, A.; He, J.; Chu, A.; Valeo, C.; van Duin, B. The Impact of Media, Plants and Their Interactions on Bioretention Performance: A Review. Sci. Total Environ. 2020, 715, 136918. [Google Scholar] [CrossRef] [PubMed]
  14. Fowdar, H.; Payne, E.; Schang, C.; Zhang, K.F.; Deletic, A.; McCarthy, D. How Well Do Stormwater Green Infrastructure Respond to Changing Climatic Conditions? J. Hydrol. 2021, 603, 126887. [Google Scholar] [CrossRef]
  15. Zhu, W.-X.; Dillard, N.D.; Grimm, N.B. Urban Nitrogen Biogeochemistry: Status and Processes in Green Retention Basins. Biogeochemistry 2004, 71, 177–196. [Google Scholar] [CrossRef]
  16. Houdeshel, C.D.; Hultine, K.R.; Johnson, N.C.; Pomeroy, C.A. Evaluation of Three Vegetation Treatments in Bioretention Gardens in a Semi-Arid Climate. Landsc. Urban Plan. 2015, 135, 62–72. [Google Scholar] [CrossRef]
  17. Collins, S.L.; Belnap, J.; Grimm, N.B.; Rudgers, J.A.; Dahm, C.N.; D’Odorico, P.; Litvak, M.; Natvig, D.O.; Peters, D.C.; Pockman, W.T.; et al. A Multiscale, Hierarchical Model of Pulse Dynamics in Arid-Land Ecosystems. Annu. Rev. Ecol. Evol. Syst. 2014, 45, 397–419. [Google Scholar] [CrossRef]
  18. USGCRP. Impacts, Risks, and Adaptation in the United States. In Fourth National Climate Assessment; Reidmiller, D.R., Avery, C.W., Easterling, D.R., Kunkel, K.E., Lewis, K.L.M., Maycock, T.K., Stewart, B.C., Eds.; U.S. Global Change Research Program: Washington, DC, USA, 2018; Volume II, p. 1515. [Google Scholar] [CrossRef]
  19. Georgescu, M.; Broadbent, A.M.; Wang, M.; Krayenhoff, E.S.; Moustaoui, M. Precipitation Response to Climate Change and Urban Development over the Continental United States. Environ. Res. Lett. 2021, 16, 044001. [Google Scholar] [CrossRef]
  20. Wijesiri, B.; Liu, A.; Goonetilleke, A. Impact of Global Warming on Urban Stormwater Quality: From the Perspective of an Alternative Water Resource. J. Clean. Prod. 2020, 262, 121330. [Google Scholar] [CrossRef]
  21. Borken, W.; Matzner, E. Reappraisal of Drying and Wetting Effects on C and N Mineralization and Fluxes in Soils. Glob. Chang. Biol. 2009, 15, 808–824. [Google Scholar] [CrossRef]
  22. Loreau, M.; Naeem, S.; Inchausti, P.; Bengtsson, J.; Grime, J.P.; Hector, A.; Hooper, D.U.; Huston, M.A.; Raffaelli, D.; Schmid, B.; et al. Ecology: Biodiversity and Ecosystem Functioning: Current Knowledge and Future Challenges. Science 2001, 294, 804–808. [Google Scholar] [CrossRef]
  23. Hooper, D.U.; Chapin, F.S.; Ewel, J.J.; Hector, A.; Inchausti, P.; Lavorel, S.; Lawton, J.H.; Lodge, D.M.; Loreau, M.; Naeem, S.; et al. Effects of Biodiversity on Ecosystem Functioning: A Consensus of Current Knowledge. Ecol. Monogr. 2005, 75, 3–35. [Google Scholar] [CrossRef]
  24. de Bello, F.; Lavorel, S.; Díaz, S.; Harrington, R.; Cornelissen, J.H.C.; Bardgett, R.D.; Berg, M.P.; Cipriotti, P.; Feld, C.K.; Hering, D.; et al. Towards an Assessment of Multiple Ecosystem Processes and Services via Functional Traits. Biodivers. Conserv. 2010, 19, 2873–2893. [Google Scholar] [CrossRef]
  25. Cardinale, B.J.; Duffy, J.E.; Gonzalez, A.; Hooper, D.U.; Perrings, C.; Venail, P.; Narwani, A.; MacE, G.M.; Tilman, D.; Wardle, D.A.; et al. Biodiversity Loss and Its Impact on Humanity. Nature 2012, 486, 59–67. [Google Scholar] [CrossRef]
  26. Oliver, T.H.; Heard, M.S.; Isaac, N.J.B.; Roy, D.B.; Procter, D.; Eigenbrod, F.; Freckleton, R.; Hector, A.; Orme, C.D.L.; Petchey, O.L.; et al. Biodiversity and Resilience of Ecosystem Functions. Trends Ecol. Evol. 2015, 30, 673–684. [Google Scholar] [CrossRef] [PubMed]
  27. Houdeshel, C.D.; Pomeroy, C.A.; Hultine, K.R. Bioretention Design for Xeric Climates Based on Ecological Principles. J. Am. Water Resour. Assoc. 2012, 48, 1178–1190. [Google Scholar] [CrossRef]
  28. Sterner, R.W.; Elser, J.J. Ecological Stoichiometry: The Biology of Elements from Molecules to the Biosphere; Princeton University Press: Princeton, NJ, USA, 2002; p. 439. ISBN 9780691074917. [Google Scholar]
  29. Sinsabaugh, R.L.; Hill, B.H.; Follstad Shah, J.J. Ecoenzymatic Stoichiometry of Microbial Organic Nutrient Acquisition in Soil and Sediment. Nature 2009, 462, 795–798. [Google Scholar] [CrossRef] [PubMed]
  30. Zeglin, L.H.; Bottomley, P.J.; Jumpponen, A.; Rice, C.W.; Arango, M.; Lindsley, A.; McGowan, A.; Mfombep, P.; Myrold, D.D. Altered Precipitation Regime Affects the Function and Composition of Soil Microbial Communities on Multiple Time Scales. Ecology 2013, 94, 2334–2345. [Google Scholar] [CrossRef]
  31. Graham, E.B.; Knelman, J.E.; Schindlbacher, A.; Siciliano, S.; Breulmann, M.; Yannarell, A.; Beman, J.M.; Abell, G.; Philippot, L.; Prosser, J.; et al. Microbes as Engines of Ecosystem Function: When Does Community Structure Enhance Predictions of Ecosystem Processes? Front. Microbiol. 2016, 7, 214. [Google Scholar] [CrossRef] [PubMed]
  32. Moorhead, D.L.; Sinsabaugh, R.L.; Hill, B.H.; Weintraub, M.N. Vector Analysis of Ecoenzyme Activities Reveal Constraints on Coupled C, N and P Dynamics. Soil Biol. Biochem. 2016, 93, 1–7. [Google Scholar] [CrossRef]
  33. Noy-Meir, I. Desert Ecosystems: Environment and Producers. Annu. Rev. Ecol. Evol. Syst. 1973, 4, 25–51. [Google Scholar] [CrossRef]
  34. Xu, X.; Thornton, P.E.; Post, W.M. A Global Analysis of Soil Microbial Biomass Carbon, Nitrogen and Phosphorus in Terrestrial Ecosystems. Glob. Ecol. Biogeogr. 2013, 22, 737–749. [Google Scholar] [CrossRef]
  35. United States Department of Agriculture Natural Resources Conservation Service. USDA Plants Database. Available online: https://plants.sc.egov.usda.gov/home (accessed on 14 May 2020).
  36. Evenden, A.G.; Moeur, M.; Shelly, J.S.; Kimball, S.F.; Wellner, C.A. Research Natural Areas on National Forest System Lands in Idaho, Montana, Nevada, Utah, and Western Wyoming: A Guidebook for Scientists, Managers, and Educators; General Technical Report RMRS-STR-69; US Department of Agriculture, Forest Service, Rocky Mountain Research Station: Ogden, UT, USA, 2001; p. 21.
  37. Woodward, L.; Harvey, J.L.; Donaldson, K.M.; Shiozaki, J.J.; Leishman, G.W.; Broderick, J.H. Soil Survey of Salt Lake Area, Utah; US Department of Agriculture, Soil Conservation Service: Salt Lake County, UT, USA, 1974; pp. 55–56.
  38. Red Butte Canyon Research Natural Area. Available online: https://redbuttecanyon.net/ (accessed on 14 March 2022).
  39. Follstad Shah, J.J.; Bares, R.; Bowen, B.B.; Bowen, G.J.; Bowling, D.R.; Eiriksson, D.P.; Fasoli, B.; Fiorella, R.P.; Hallar, A.G.; Hinners, S.J.; et al. The Wasatch Environmental Observatory: A Mountain to Urban Research Network in the Semi-Arid Western US. Hydrol. Process. 2021, 35, e14352. [Google Scholar] [CrossRef]
  40. University of Utah—Wasatch Environmental Observatory Wasatch Environmental Observatory Red Butte Network: Todds Meadow Climate (RB_TM_C) Quality Controlled Data. Available online: http://www.hydroshare.org/resource/79ae0f0efe2447fe9a5ab5c15427b2d8 (accessed on 14 March 2022).
  41. University of Utah—Wasatch Environmental Observatory Wasatch Environmental Observatory Red Butte Network: Green Infrastructure Climate (RM_GIRF_C) Quality Controlled Data. Available online: http://www.hydroshare.org/resource/e5935762e9054fc49570f02d1a28ed8a (accessed on 14 March 2022).
  42. University of Utah—Wasatch Environmental Observatory Green Infrastructure Research Facility (GIRF) Sensor Data. Available online: http://www.hydroshare.org/resource/331588a2bfe44206a5290d660d9097b6 (accessed on 14 March 2022).
  43. National Drought Mitigation Center. U.S. Drought Monitor. Available online: https://droughtmonitor.unl.edu/ (accessed on 8 March 2023).
  44. Sinsabaugh, R.L.; Lauber, C.L.; Weintraub, M.N.; Ahmed, B.; Allison, S.D.; Crenshaw, C.; Contosta, A.R.; Cusack, D.; Frey, S.; Gallo, M.E.; et al. Stoichiometry of Soil Enzyme Activity at Global Scale. Ecol. Lett. 2008, 11, 1252–1264. [Google Scholar] [CrossRef] [PubMed]
  45. Weintraub, S. NEON User Guide to Soil Inorganic Nitrogen Pools and Transformations (NEON.DP1.10086); US National Science Foundation, National Ecological Observatory Network, Terrestrial Observation System: Alexandria, VI, USA, 2020; p. 18.
  46. Brookes, P.; Landman, A.; Pruden, G.; Jenkinson, D. Chloroform Fumigation and the Release of Soil Nitrogen: A Rapid Direct Extraction Method to Measure Microbial Biomass Nitrogen in Soil. Soil Biol. Biochem. 1985, 17, 837–842. [Google Scholar] [CrossRef]
  47. Weintraub, S.R.; Brooks, P.D.; Bowen, G.J. Interactive Effects of Vegetation Type and Topographic Position on Nitrogen Availability and Loss in a Temperate Montane Ecosystem. Ecosystems 2017, 20, 1073–1088. [Google Scholar] [CrossRef]
  48. Hill, B.H.; Elonen, C.M.; Seifert, L.R.; May, A.A.; Tarquinio, E. Microbial Enzyme Stoichiometry and Nutrient Limitation in US Streams and Rivers. Ecol. Indic. 2012, 18, 540–551. [Google Scholar] [CrossRef]
  49. Bach, C.E.; Warnock, D.D.; Van Horn, D.J.; Weintraub, M.N.; Sinsabaugh, R.L.; Allison, S.D.; German, D.P. Measuring Phenol Oxidase and Peroxidase Activities with Pyrogallol, l-DOPA, and ABTS: Effect of Assay Conditions and Soil Type. Soil Biol. Biochem. 2013, 67, 183–191. [Google Scholar] [CrossRef]
  50. Sinsabaugh, R.L. Phenol Oxidase, Peroxidase and Organic Matter Dynamics of Soil. Soil Biol. Biochem. 2010, 42, 391–404. [Google Scholar] [CrossRef]
  51. Weintraub, M.N.; Schimel, J.P. Seasonal Protein Dynamics in Alaskan Arctic Tundra Soils. Soil Biol. Biochem. 2005, 37, 1469–1475. [Google Scholar] [CrossRef]
  52. R Core Team. R: A Language and Environment for Statistical Computing; R Foundation for Statistical Computing: Vienna, Austria, 2020; Available online: https://www.R-project.org/ (accessed on 1 May 2020).
  53. Lefcheck, J.S. PiecewiseSEM: Piecewise Structural Equation Modelling in r for Ecology, Evolution, and Systematics. Methods Ecol. Evol. 2016, 7, 573–579. [Google Scholar] [CrossRef]
  54. Esch, E.H.; Lipson, D.; Cleland, E.E. Direct and Indirect Effects of Shifting Rainfall on Soil Microbial Respiration and Enzyme Activity in a Semi-Arid System. Plant Soil 2017, 411, 333–346. [Google Scholar] [CrossRef]
  55. Bi, J.; Zhang, N.; Liang, Y.; Yang, H.; Ma, K. Interactive Effects of Water and Nitrogen Addition on Soil Microbial Communities in a Semiarid Steppe. J. Plant Ecol. 2012, 5, 320–329. [Google Scholar] [CrossRef]
  56. Pavao-Zuckerman, M.A.; Sookhdeo, C. Nematode Community Response to Green Infrastructure Design in a Semiarid City. J. Environ. Qual. 2017, 46, 687–694. [Google Scholar] [CrossRef] [PubMed]
  57. Li, Z.; Zeng, Z.; Tian, D.; Wang, J.; Fu, Z.; Zhang, F.; Zhang, R.; Chen, W.; Luo, Y.; Niu, S. Global Patterns and Controlling Factors of Soil Nitrification Rate. Glob. Change Biol. 2020, 26, 4147–4157. [Google Scholar] [CrossRef] [PubMed]
  58. Bettez, N.D.; Groffman, P.M. Denitrification Potential in Stormwater Control Structures and Natural Riparian Zones in an Urban Landscape. Environ. Sci. Technol. 2012, 46, 10909–10917. [Google Scholar] [CrossRef] [PubMed]
  59. Stursova, M.; Crenshaw, C.L.; Sinsabaugh, R.L. Microbial Responses to Long-Term N Deposition in a Semiarid Grassland. Microb. Ecol. 2006, 51, 90–98. [Google Scholar] [CrossRef] [PubMed]
  60. Stursova, M.; Sinsabaugh, R.L. Stabilization of Oxidative Enzymes in Desert Soil May Limit Organic Matter Accumulation. Soil Biol. Biochem. 2008, 40, 550–553. [Google Scholar] [CrossRef]
  61. Tiemann, L.K.; Billings, S.A. Changes in Variability of Soil Moisture Alter Microbial Community C and N Resource Use. Soil Biol. Biochem. 2011, 43, 1837–1847. [Google Scholar] [CrossRef]
  62. McPhillips, L.; Walter, M.T. Hydrologic Conditions Drive Denitrification and Greenhouse Gas Emissions in Stormwater Detention Basins. Ecol. Eng. 2015, 85, 67–75. [Google Scholar] [CrossRef]
  63. Payne, E.G.I.; Fletcher, T.D.; Russell, D.G.; Grace, M.R.; Cavagnaro, T.R.; Evrard, V.; Deletic, A.; Hatt, B.E.; Cook, P.L.M. Temporary Storage or Permanent Removal? The Division of Nitrogen between Biotic Assimilation and Denitrification in Stormwater Biofiltration Systems. PLoS ONE 2014, 9, e0090890. [Google Scholar] [CrossRef]
  64. Zinger, Y.; Prodanovic, V.; Zhang, K.F.; Fletcher, T.D.; Deletic, A. The Effect of Intermittent Drying and Wetting Stormwater Cycles on the Nutrient Removal Performances of Two Vegetated Biofiltration Designs. Chemosphere 2021, 267, 129294. [Google Scholar] [CrossRef] [PubMed]
  65. Rivers, E.N.; Morse, J.L. Variability of Potential Soil Nitrogen Cycling Rates in Stormwater Bioretention Facilities. Sustainability 2022, 14, 2175. [Google Scholar] [CrossRef]
  66. Shrestha, P.; Hurley, S.E.; Adair, E.C. Soil Media CO2 and N2O Fluxes Dynamics from Sand-Based Roadside Bioretention Systems. Water 2018, 10, 185. [Google Scholar] [CrossRef]
  67. Ladwig, L.M.; Sinsabaugh, R.L.; Collins, S.L.; Thomey, M.L. Soil Enzyme Responses to Varying Rainfall Regimes in Chihuahuan Desert Soils. Ecosphere 2015, 6, 1–10. [Google Scholar] [CrossRef]
  68. Wang, R.; Filley, T.R.; Xu, Z.; Wang, X.; Li, M.H.; Zhang, Y.; Luo, W.; Jiang, Y. Coupled Response of Soil Carbon and Nitrogen Pools and Enzyme Activities to Nitrogen and Water Addition in a Semi-Arid Grassland of Inner Mongolia. Plant Soil 2014, 381, 323–336. [Google Scholar] [CrossRef]
  69. Zhang, B.; Chen, L.; Guo, Q.; Lian, J.; Yao, Y. Evaluation of Ammonia and Nitrate Distribution and Reduction within Stormwater Green Infrastructure with Different Woody Plants under Multiple Influencing Factors. J. Environ. Manag. 2022, 302, 114086. [Google Scholar] [CrossRef] [PubMed]
  70. Barron, N.J.; Hatt, B.; Jung, J.; Chen, Y.; Deletic, A. Seasonal Operation of Dual-Mode Biofilters: The Influence of Plant Species on Stormwater and Greywater Treatment. Sci. Total Environ. 2020, 715, 136680. [Google Scholar] [CrossRef]
  71. Ivanov, V.Y.; Fatichi, S.; Jenerette, G.D.; Espeleta, J.F.; Troch, P.A.; Huxman, T.E. Hysteresis of Soil Moisture Spatial Heterogeneity and the “Homogenizing” Effect of Vegetation. Water Resour. Res. 2010, 46, W09521. [Google Scholar] [CrossRef]
  72. Månsson, K.; Bengtson, P.; Falkengren-Grerup, U.; Bengtsson, G. Plant-Microbial Competition for Nitrogen Uncoupled from Soil C:N Ratios. Oikos 2009, 118, 1908–1916. [Google Scholar] [CrossRef]
  73. Cui, Y.; Moorhead, D.L.; Peng, S.; Sinsabaugh, R.L. New Insights into the Patterns of Ecoenzymatic Stoichiometry in Soil and Sediment. Soil Biol. Biochem. 2023, 177, 108910. [Google Scholar] [CrossRef]
  74. Cleveland, C.C.; Liptzin, D. C:N:P Stoichiometry in Soil: Is There a “Redfield Ratio” for the Microbial Biomass? Biogeochemistry 2007, 85, 235–252. [Google Scholar] [CrossRef]
  75. Sinsabaugh, R.L.; Shah, J.J.F.; Findlay, S.G.; Kuehn, K.A.; Moorhead, D.L. Scaling Microbial Biomass, Metabolism and Resource Supply. Biogeochemistry 2015, 122, 175–190. [Google Scholar] [CrossRef]
  76. Díaz, S.; Kattge, J.; Cornelissen, J.H.C.; Wright, I.J.; Lavorel, S.; Dray, S.; Reu, B.; Kleyer, M.; Wirth, C.; Colin Prentice, I.; et al. The Global Spectrum of Plant Form and Function. Nature 2016, 529, 167–171. [Google Scholar] [CrossRef]
  77. Moreau, D.; Pivato, B.; Bru, D.; Busset, H.; Deau, F.; Faivre, C.; Matejicek, A.; Strbik, F.; Philippot, L.; Mougel, C. Plant Traits Related to Nitrogen Uptake Influence Plantmicrobe Competition. Ecology 2015, 96, 2300–2310. [Google Scholar] [CrossRef] [PubMed]
  78. Austin, A.T.; Yahdjian, L.; Stark, J.M.; Belnap, J.; Porporato, A.; Norton, U.; Ravetta, D.A.; Schaeffer, S.M. Water Pulses and Biogeochemical Cycles in Arid and Semiarid Ecosystems. Oecologia 2004, 141, 221–235. [Google Scholar] [CrossRef] [PubMed]
  79. Dijkstra, F.A.; Augustine, D.J.; Brewer, P.; von Fischer, J.C. Nitrogen Cycling and Water Pulses in Semiarid Grasslands: Are Microbial and Plant Processes Temporally Asynchronous? Oecologia 2012, 170, 799–808. [Google Scholar] [CrossRef] [PubMed]
  80. Reisinger, A.J.; Groffman, P.M.; Rosi-Marshall, E.J. Nitrogen-Cycling Process Rates across Urban Ecosystems. FEMS Microbiol. Ecol. 2016, 92, fiw198. [Google Scholar] [CrossRef]
  81. Hillebrand, H.; Cowles, J.M.; Lewandowska, A.; Van de Waal, D.B.; Plum, C. Think Ratio! A Stoichiometric View on Biodiversity-Ecosystem Functioning Research. Basic Appl. Ecol. 2014, 15, 465–474. [Google Scholar] [CrossRef]
Figure 1. Green Infrastructure Research Facility (GIRF) and Todd’s Meadow (TM) field site locations, plot layouts, and site photos. Both study site locations are situated along Red Butte Creek within Salt Lake City, UT, USA. Plantings at GIRF were based on a randomization process, explaining the variation in the distribution of plant treatments within plots. The photos below the plot diagrams provide landscape views of each site, while the photos to the left of the GIRF plot layout diagram show examples of the three plant treatments.
Water 16 01931 g001
Figure 2. Temporal response of gravimetric soil moisture to experimental (A,B) and natural (C) pulse events and comparisons of soil moisture distributions between plant treatments at GIRF (D,E) and at Todd’s Meadow (F). Small dots indicate values for individual samples associated with planting treatment and sampling dates. Significance levels ‘***’ ≤ 0.001, ‘*’ ≤ 0.05.
Water 16 01931 g002
Figure 3. Microbial biomass C (AC), biomass N (DF), and biomass C:N ratios (GI) for experimental and natural pulse events. Headers above columns identify pulse events. ‘September 2020’ and ‘June 2021’ denote experimental pulse events at GIRF, while ‘Todd’s Meadow’ denotes the natural pulse event at the reference meadow in June 2021. Small dots indicate values for individual samples associated with planting treatment and sampling dates. Significance levels ‘*’ ≤ 0.05.
Water 16 01931 g003
Figure 4. Temporal responses of ecoenzymes leucyl aminopeptidase (LAP; AC) and alkaline phosphatase (AP; DF) activity rates across experimental and natural pulse events. Headers above columns identify pulse events. ‘September 2020’ and ‘June 2021’ denote experimental pulse events at GIRF, while ‘Todd’s Meadow’ denotes the natural pulse event at the reference meadow in June 2021. Small dots indicate values for individual samples associated with planting treatment and sampling dates. Significance levels ‘***’ ≤ 0.001, ‘**’ ≤ 0.01, ‘*’ ≤ 0.05.
Water 16 01931 g004
Figure 5. Temporal responses of ecoenzymes β-1,4-glucosidase (BG; AC) and phenol oxidase (POX; DF) activity rates across experimental and natural pulse events. Headers above columns identify pulse events. ‘September 2020’ and ‘June 2021’ denote experimental pulse events at GIRF, while ‘Todd’s Meadow’ denotes the natural pulse event at the reference meadow in June 2021. Small dots indicate values for individual samples associated with planting treatment and sampling dates. Significance levels ‘***’ ≤ 0.001, ‘**’ ≤ 0.01, ‘*’ ≤ 0.05.
Water 16 01931 g005
Figure 6. Vector analysis of ecoenzyme activity over experimental and natural pulse events. (A) Vector lengths, which denote relative C limitation during pulse events; (B) Vector angles, which denote relative N or P limitation during pulse events; (C) Vector plot illustrating relative C, N, and P limitation amongst study observations. Small dots in (A,B) indicate values for individual samples associated with each pulse event. Significance levels ‘***’ ≤ 0.001, ‘*’ ≤ 0.05.
Water 16 01931 g006
Figure 7. Temporal responses of organic N (AC) and inorganic N (DF) to experimental and natural pulse events. Headers above columns identify pulse events. ‘September 2020’ and ‘June 2021’ denote experimental pulse events at GIRF, while ‘Todd’s Meadow’ denotes the natural pulse event at the reference meadow in June 2021. Small dots indicate values for individual samples associated with planting treatment and sampling dates. Significance levels ‘**’ ≤ 0.01, ‘*’ ≤ 0.05.
Water 16 01931 g007
Figure 8. PSEM path diagram showing the size and magnitude of effects during the September 2020 experimental pulse at GIRF. Black lines indicate significant paths determined from PSEM analysis. Other colored lines (i.e., red, purple, blue) indicate paths not found to be significant. Significance levels ‘***’ ≤ 0.001, ‘**’ ≤ 0.01, ‘*’ ≤ 0.05.
Water 16 01931 g008
Figure 9. PSEM path diagram showing the size and magnitude of effects during the June 2021 experimental pulse at GIRF. Black lines indicate significant paths determined from PSEM analysis. Other colored lines (i.e., red, purple, blue) indicate paths not found to be significant. Significance levels ‘***’ ≤ 0.001, ‘**’ ≤ 0.01, ‘*’ ≤ 0.05.
Water 16 01931 g009
Figure 10. PSEM path diagram showing the size and magnitude of effects during the natural pulse evet at Todd’s Meadow in June 2021. Black lines indicate significant paths determined from PSEM analysis. Other colored lines (i.e., red, purple, blue) indicate paths not found to be significant. Significance levels ‘***’ ≤ 0.001, ‘*’ ≤ 0.05.
Water 16 01931 g010
Table 1. Ecoenzymes used to measure C, N, and P acquisition by soil microbes from a variety of substrates and environmental sources. EC refers to the enzyme commission classification.
EnzymeECAbbreviationSubstrateExample Source
β-1,4-glucosidaseEC 3.2.1.21BG4-MUB-β-D-glucosideC from simple sugars
Leucyl aminopeptidaseEC 3.4.11.1LAPL-Leucine-7-amido-
4-methylcoumarin
N from amino acid chains
Alkaline phosphataseEC 3.1.3.1AP4-MUB-phosphateP from phospholipids
Phenol oxidaseEC 1.10.3POXL-3,4-dihydroxyphenylalanineC from lignin
Table 2. Average (±standard error) ecoenzyme activity rates observed over experimental and natural pulse events.
EnzymeSept 2020 Experimental Pulse Average Activity Rate (nmol g−1 h−1)June 2021 Experimental Pulse Average Activity Rate (nmol g−1 h−1)2021 Todd’s Meadow Natural Pulse Average Activity Rate
(nmol g−1 h−1)
Acid Phosphatase (AP)17.63 ± 1.1722.87 ± 1.1339.39 ± 3.62
Leucyl Aminopeptidase (LAP)15.49 ± 0.5117.49 ± 0.5235.26 ± 4.12
β-1,4-Glucosidase (BG)6.72 ± 0.3712.82 ± 0.7333.96 ± 4.44
Phenol Oxidase (POX)7010 ± 53610237 ± 5244071 ± 520
Disclaimer/Publisher’s Note: The statements, opinions and data contained in all publications are solely those of the individual author(s) and contributor(s) and not of MDPI and/or the editor(s). MDPI and/or the editor(s) disclaim responsibility for any injury to people or property resulting from any ideas, methods, instructions or products referred to in the content.

