Article

Probability-Based Propagation Characteristics from Meteorological to Hydrological Drought and Their Dynamics in the Wei River Basin, China

1
Yinshanbeilu Grassland Eco-Hydrology National Observation and Research Station, China Institute of Water Resources and Hydropower Research, Beijing 100038, China
2
State Key Laboratory of Eco-Hydraulics in Northwest Arid Region of China, Xi’an University of Technology, Xi’an 710048, China
3
Shenzhen DongShen Intelligent Water Company Limited, Shenzhen 518057, China
*
Author to whom correspondence should be addressed.
Water 2024, 16(14), 1999; https://doi.org/10.3390/w16141999
Submission received: 16 May 2024 / Revised: 4 July 2024 / Accepted: 10 July 2024 / Published: 15 July 2024

Abstract

:
Understanding the propagation characteristics and driving factors from meteorological drought to hydrological drought is essential for alleviating drought and for early warning systems regarding drought. This study focused on the Weihe River basin (WRB) and its two subregions (the Jinghe River (JRB) and the middle reaches of the Weihe River (MWRB)), utilizing the Standardized Precipitation Index (SPI) and Standardized Runoff Index (SRI) to characterize meteorological and hydrological drought, respectively. Based on Copula theory and conditional probability, a quantification model for the propagation time (PT) of meteorological–hydrological drought was constructed. The dynamic characteristics of PT on annual and seasonal scales were explored. Additionally, the influences of different seasonal meteorological factors and underlying surface factors on the dynamic changes in PT were analyzed. The main conclusions were as follows: (1) The PT of meteorological–hydrological drought was characterized by faster propagation during the hot months (June–September) and slower propagation during the cold months (December to March of the following year); (2) Under the same level of hydrological drought, as the level of meteorological drought increases, the PT of the drought shortens. The propagation thresholds of meteorological to hydrological drought in the WRB, the JRB, and the MWRB are −0.69, −0.81, and −0.78, respectively. (3) In the dynamic changes in PT, the WRB showed a non-significant decrease; however, both the JRB and the MWRB exhibited a significant increase in PT across different drought levels. (4) The influence of the water and heat status during spring, summer, and winter on PT was more pronounced, while in autumn, the impact of the basin’s water storage and discharge status was more significant in the JRB and the MWRB.

1. Introduction

Drought is a complex natural disaster characterized by its high frequency, long duration, and wide-ranging impact on ecology, socioeconomics, and agriculture [1,2,3,4,5]. Globally, droughts cause staggering economic losses, averaging USD 8 billion annually [6,7,8]. Against the backdrop of climate change, climate models indicate an exacerbation in the frequency of drought occurrence worldwide [9,10]. Economic losses have surged from USD 17.33 billion (1980–2009) to USD 23.125 billion (2010–2017) annually, outpacing other meteorological disasters [11,12]. Developing countries, particularly, feel the brunt of prolonged droughts, with China ranking among the world’s most severely affected nations [13,14,15,16]. The serious threat caused by drought endangers various aspects of safety; therefore, drought research has become a focus of attention for people [17,18,19]. The Wei River basin, a key national economic development zone and vital agricultural production area, faces particularly acute drought challenges [20,21]. Understanding the patterns of drought evolution and revealing their mechanisms helps in the development of drought resistance and early warning efforts.
Broadly speaking, drought refers to a phenomenon where water availability remains consistently below a certain threshold over a defined period, failing to meet human production and livelihood needs [22,23]. Based on components of the water cycle, drought can be categorized into meteorological drought, agricultural drought, hydrological drought, and socioeconomic drought [22,24]. These categories represent imbalances in water supply and demand in meteorology, crops, runoff, and socioeconomic sectors, resulting in water scarcity [25,26]. Typically, meteorological drought, caused by insufficient precipitation, serves as the initial trigger for various types of droughts. It develops rapidly and ends relatively quickly [15,26,27,28]. As the meteorological drought began, the runoff could no longer be replenished, exacerbating the water scarcity in the basin. This outcome led to persistent water demand, which further evolved into soil moisture depletion and groundwater shortages. Ultimately, it resulted in social unrest and constrained human production and livelihoods [29,30,31]. Therefore, understanding meteorological drought serves as the foundation for elucidating the mechanisms behind various types of droughts. Hydrological drought is considered the most severe, characterized by insufficient runoff. This exacerbates soil moisture deficiency, affects social water use, and intensifies other forms of drought [32,33,34]. Hence, investigating the formation process of hydrological drought holds significant importance.
Generally speaking, meteorological drought is the cause of all drought occurrences. The propagation from meteorological drought occurrence to its impact on hydrological drought is not instantaneous. It is a phased process known as the meteorological–hydrological drought propagation process [28,35,36,37]. In recent years, research on drought propagation has become a focal point in the field of drought studies, with scholars in China and globally gradually enriching the understanding of drought propagation [38,39,40,41,42]. Research had shown that the process of drought propagation has characteristics such as attenuation, aggregation, and elongation [43,44]. Currently, most research on drought propagation focuses on PT. It reflects the duration of the transmission of water scarcity signals between different types of droughts [45,46,47,48]. The calculation of PT is generally based on the multi-time-scale features of the Standardized Precipitation Index (SPI). By analyzing the statistical relationship between multi-time-scale SPI and other types of drought indices, the PT is determined. This statistical relationship is mainly established through correlation analysis, cross-wavelet analysis, and other techniques [49,50,51,52]. Currently, the widely adopted method for determining the PT is based on the relationships within a sequence of drought indices. The sequences include not only information about drought conditions but also non-drought and wet conditions. The results obtained from this method predominantly characterize drought propagation in terms of water volume transfer. Building upon this, Dai [53] and Li et al. [48] proposed a framework for identifying drought PTs under different drought states based on Copula theory and conditional probability, which was used to identify the PT of meteorological–agricultural drought. This method, through the recognition of occurrence probabilities, can focus the calculation process of drought PT on drought states, offering higher reliability compared to correlation methods. At the same time, Li et al. [48] confirmed the accuracy of the results by comparing them with the PTs of some actual drought events. Therefore, this study adopted this more novel and credible method to identify the propagation time of meteorological–hydrological droughts.
Climate change, coupled with human activities, has significantly altered the water cycle in river basins, leading to frequent droughts. This has consequently impacted the water supply for irrigation, flood control, and ecological conservation [54,55,56]. In order to explore the complex mechanisms of drought propagation changes, domestic and foreign scholars have studied and analyzed different factors that affect drought propagation [50,57,58,59]. Exploring the propagation process from meteorological drought to hydrological drought, determining the drought propagation time (PT), and clarifying the driving factors of changes in drought PT were conducive to an in-depth understanding of the formation process and mechanisms of hydrological drought. To sum up, to investigate the propagation characteristics of meteorological–hydrological drought and its driving forces in the WRB, this study used the SPI and SRI to represent meteorological and hydrological droughts. Based on Copula theory and conditional probability, the PT from meteorological drought to hydrological drought under different scenarios was quantified. A probabilistic assessment model for the propagation threshold from meteorological drought to hydrological drought was constructed. On this foundation, the study separately investigated the dynamic characteristics of drought PT on an annual scale and in different seasons. Furthermore, a random forest model was used to analyze the impact of meteorological factors (precipitation, Vapor Pressure Deficit (VPD)) and underlying surface factors (soil moisture (0–2 m), base flow) on the dynamic changes in PT. The results of the study are conducive to establishing an effective drought monitoring and early warning system, thereby improving the forecasting accuracy of hydrological drought. The technical roadmap of this study is shown in Figure 1.

2. Study Area and Data
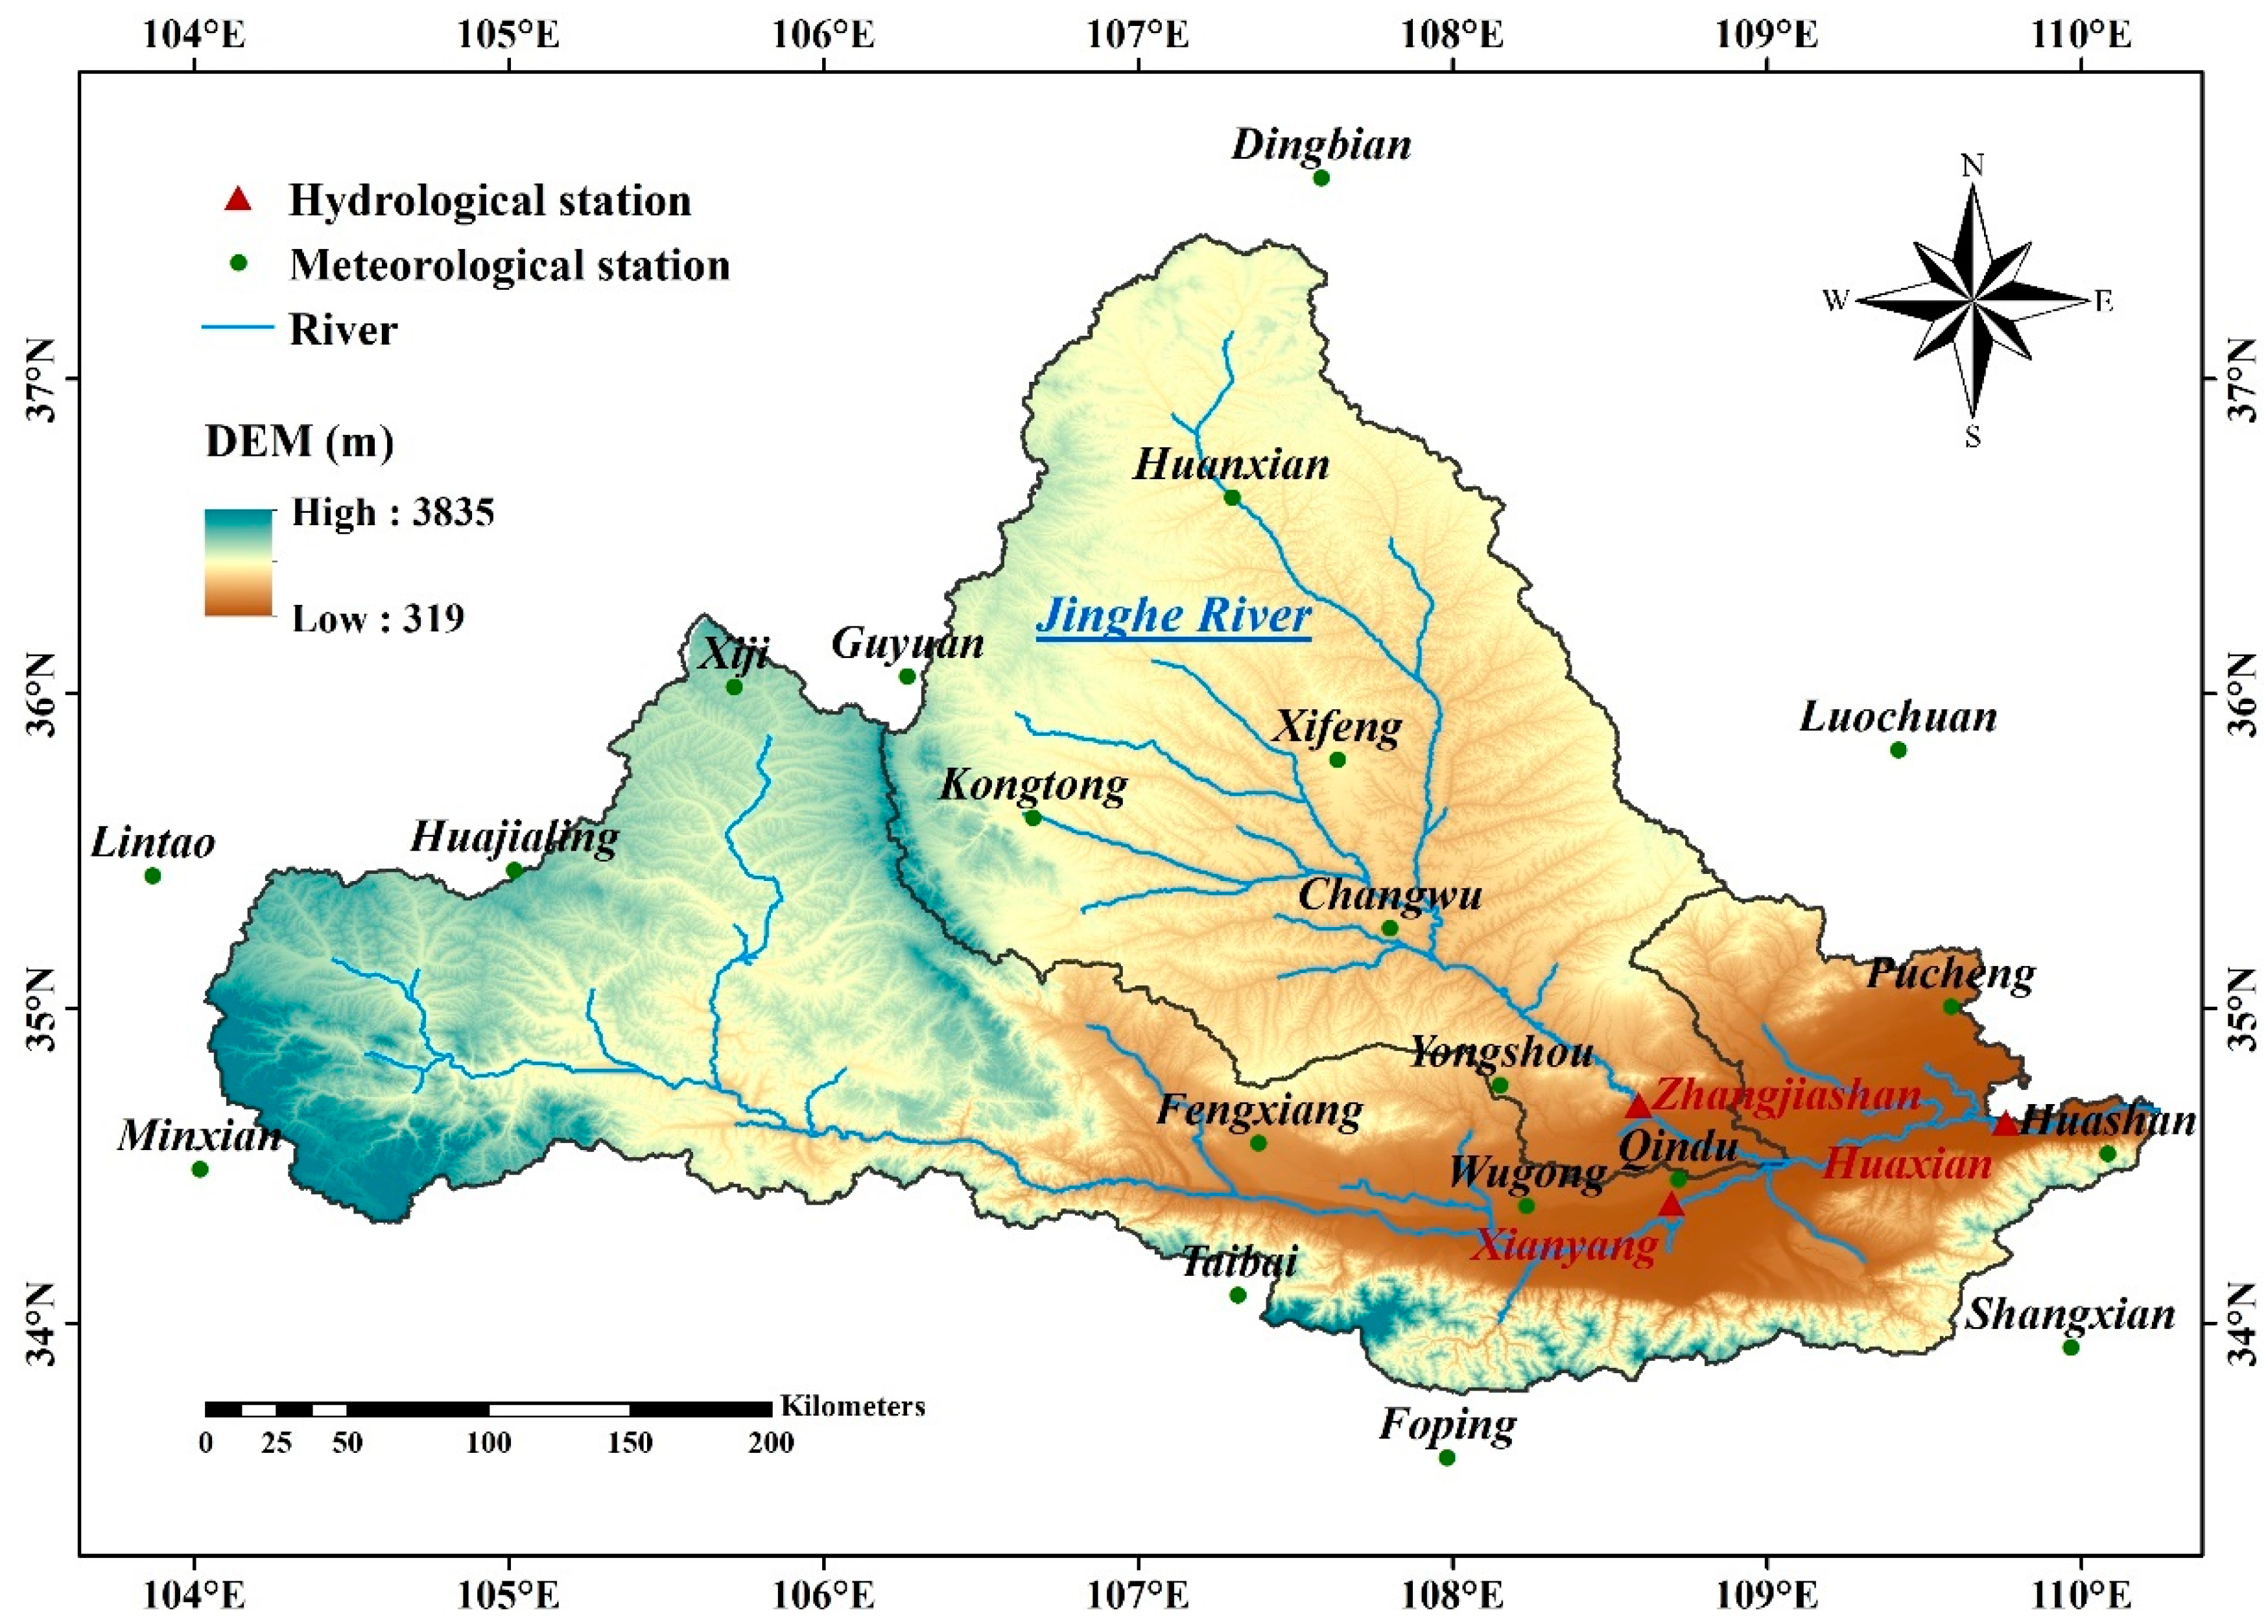
2.1. Study Area

The Weihe River basin (WRB) was one of the areas that was most severely affected by soil erosion in the Yellow River Basin, which severely constrained the development of agriculture and economy in the Yellow River Basin. The WRB is located between 104° and 110.5° east longitude and 33.5° and 37.5° north latitude, with a main river length of 818 km and a total area of 135,000 km2, making it the largest first-level tributary of the Yellow River. The basin belongs to a continental monsoon climate, with an average annual temperature of about 13.3 °C and an average annual precipitation of 500–800 mm. Precipitation is relatively abundant, and temperatures are higher in the summer, while the winter is dry with lower temperatures. The terrain is high in the west and low in the east, with a vertical drop of more than 3 km. The main terrains in the west are loess gullies, with the Qinling Mountains in the south and the Liupan Mountains in the north.
The distribution of the Weihe River water system was fan-shaped, with numerous tributaries. Among them, the Jinghe River Basin (JRB) was the largest, accounting for 34% of the total area of the WRB, with a river length of 455 km and an average gradient of 2.47‰, belonging to a temperate semi-humid continental monsoon climate. The basin’s terrain is mainly composed of hills, plains, plateaus, and mountainous areas, with an open upper reach and a meandering river, and the development history of water resources in the basin is long, with water conservancy projects dating back to the Tang Dynasty.
In recent years, due to the impact of human activities and climate change on runoff, severe soil erosion and a decrease in water volume have posed significant challenges to sustainable development. Given the importance of the WRB, studying the propagation of drought, exploring the impact of climate change and human activities on the basin, and establishing a drought early warning system were of great significance. Therefore, based on the topography and geomorphology of the basin, this research will focus on three aspects of the WRB to explore the propagation of drought and related phenomena: the entire basin (excluding the Beiluohe River Basin), the middle reaches of the Wei River (MWRB), and the Jinghe River Basin (JRB). The distribution of meteorological and hydrological stations in the WRB is shown in Figure 2.

2.2. Data

The data involved in this study mainly include meteorological data, hydrological data, soil moisture data, base flow data, DEM data, etc., within the WRB. Meteorological data consist of daily precipitation, temperature, relative humidity, and other variables collected from 20 national standard meteorological stations within the WRB from 1960 to 2016. These data were sourced from the China Meteorological Science Data Sharing Service Network, which was accessed on 29 December 2018 (https://data.cma.cn/). Hydrological data include daily runoff data from three hydrological stations in the WRB, spanning from 1960 to 2016: Zhangjiashan, Linjiacun, and Huaxian. The data were obtained from the Yellow River Basin Hydrological Yearbook of the People’s Republic of China. Soil moisture data represent soil moisture content at depths of 0–2 m within the WRB. These data were sourced from the Global Land Data Assimilation System (GLDAS) data center, which was accessed on 16 May 2020 (https://search.earthdata.nasa.gov/search?q=GLDAS). Base flow data were calculated using the Lyne–Hollick filtering method (referenced formula available in [60]). The Digital Elevation Model (DEM) data for the WRB were provided by “National Cryosphere Desert Data Center/National Service Center for Specialty Environmental Observation Stations”, which was accessed on 24 September 2021 (http://www.ncdc.ac.cn/), with a spatial resolution of 90 m.

3. Methods

3.1. Standardized Precipitation Index (SPI) and Standardized Runoff Index (SRI)

McKee et al. first proposed the Standardized Precipitation Index (SPI) in 1993 to assess drought conditions [61]. SPI was a meteorological drought assessment indicator that was typically applicable for monitoring and evaluating drought on a time scale of a month or longer [62]. However, some studies had conducted research on short-term drought monitoring using daily scale indices, comparing the results with monthly scale indices and daily data, which proved the reliability of daily data in monitoring short-term droughts [63]. Short-term droughts were relatively short but severe and may have multiple peaks, which could have a certain impact during the calculation process. Therefore, this study selected a ten-day time scale to explore the propagation of drought. SPI has the characteristic of describing multiple time scales and can represent water surplus or deficit on a long-time scale. The index had the advantages of simple calculation and low data type requirements (only precipitation data are used) [64,65]. In summary, based on the daily precipitation data from 1960 to 2016, this study derived the ten-day precipitation data and calculated the SPI (1–36 ten-day periods).
Shukla et al. first introduced the Standardized Runoff Index (SRI) in 2008 to represent hydrological drought [66]. The calculation method was roughly the same as that of SPI, and based on the runoff data from 1960 to 2016, one ten-day-scale SRI was obtained. SPI and SRI can be divided into four levels, and the levels and corresponding boundary values are shown in Table 1.

3.2. A Quantification Model for Meteorological–Hydrological Drought Propagation Time

3.2.1. Copula Functions

Copula functions are multivariate joint distribution functions defined on the domain [0, 1] that can connect arbitrary distribution types. In the context of multivariate drought probability analysis, Copula functions were utilized to construct joint distributions of drought events, serving as a powerful tool extensively employed in hydrological research [67]. According to Sklar’s theorem [68,69], if H represented the joint distribution function, and F and G were the marginal distribution functions for single variables, then there existed a unique Copula function, denoted as C, such that the following applies:
x , y R ¯ ,   H x , y = C ( F ( x ) , G ( y ) )
If F and G were continuous, then there existed a unique C; conversely, the statement remained valid. A multivariate distribution F could be expressed using a Copula function as follows:
F ( x 1 , x 2 , x n ) = C [ F X 1 ( x 1 ) , F X 2 ( x 2 ) , , F X n ( x n ) ] = C ( u 1 , u 2 , , u n )
where F X i ( x i ) = u i represented the cumulative distribution of the random variable.
To summarize, the Copula function first required the determination of marginal distributions. Since SPI and SRI were standardized exponential transforms, a normal distribution was employed to fit the marginal distributions. The second step involved fitting the joint distribution function. Various Copula functions such as Clayton, Frank, Gumbel, Gaussian, t-Copula, etc., were commonly used in research. Hence, it was necessary to carefully select the Copula function to ensure the accuracy of the results.

3.2.2. Optimization of Joint Distribution Functions

For the optimal selection of the joint distribution function, the Kolmogorov–Smirnov (KS) test and root mean square error (RMSE) were used. The KS test is a non-parametric hypothesis test that calculates the maximum absolute difference. RMSE can measure the deviation between the theoretical distribution function and the empirical distribution function [69]. The methods used in this study include conducting KS testing first. After passing the KS test, a further calculation of RMSE is carried out. Then, we select the joint distribution function with the minimum RMSE as the optimal distribution function. The five joint distribution functions within the study area all passed the KS test. In addition, among the three study basins, the RMSE of the Frank Copula function was the smallest, indicating its superior performance. Therefore, the Frank Copula function was chosen to fit the joint distribution of the sequence.

3.2.3. Estimation of PT and Propagation Threshold

In simple terms, the Bayesian framework is a form of conditional probability. Generally, meteorological drought serves as the cause of all drought occurrences. Therefore, meteorological drought was considered as a condition in the Bayesian framework to compute the probability of hydrological drought occurrence when meteorological drought occurred. By incorporating the results of Copula function joint distribution fitting and considering the SPI and SRI drought severity classification criteria, the following formula was obtained:
P S R I s r i S P I s p i = P S R I s r i , S P I s p i P S P I s p i = C F S P I s p i , F S R I s r i F S P I s p i
where P represented the probability of event SRI ≤ sri occurring under the given condition of SPI ≤ spi; C represented the joint distribution function; F represented the marginal distribution function; and spi and sri represented the given SPI and SRI drought level classification.
The drought severity classification categorized drought into various levels, distinguishing different drought states such as mild, moderate, severe, etc. By substituting corresponding levels, the propagation probability from meteorological drought to hydrological drought under different states could be obtained. For example, the probability of moderate meteorological drought propagating to mild hydrological drought was as follows:
P S R I 0.5 1.5 S P I 1 = P S R I 0.5 , 1.5 S P I 1 P 1.5 S P I 1 = C F S P I 1 , F S R I 0.5 C F S P I 1.5 , F S R I 0.5 F S P I 1 F S P I 1.5
This process can be extended to derive propagation probabilities for different states. Taking advantage of SPI’s ability to calculate multiple time scales, the probability of meteorological drought triggering hydrological drought at different time scales can be determined. By selecting the time scale with the highest probability, the PT of meteorological–hydrological drought under the corresponding state can be obtained.
Through this method, the probability of meteorological drought triggering hydrological drought can be calculated. If the probability of meteorological drought triggering hydrological drought reached a certain predefined threshold, it was considered a definite occurrence time. Therefore, in the scenario where the threshold probability was known given the hydrological drought boundary (−0.5), the unique SPI value corresponding to this predefined probability can be determined. This value represented the threshold for meteorological drought triggering hydrological drought. The calculation formula was as follows:
P S R I 0.5 S P I s p i = C F S P I s p i , F S R I 0.5 F S P I s p i = p
where p denoted the predefined probability, typically set to 0.7.

3.3. Random Forest (RF)

The Random Forest (RF) method, proposed by Breiman [70], involved randomly sampling subsets with replacement from the original dataset multiple times to construct decision trees for each sample. The predictions from multiple decision trees were then combined using averaging or voting methods to determine the final prediction. During the prediction process of decision trees, each tree contributed to the decision through voting, with the result determined by majority voting. Among all algorithms, the Random Forest method exhibited high accuracy, can effectively handle large datasets, and was less prone to overfitting issues. In regression tasks, Random Forest can assess the importance of each feature in classification.
The Random Forest method extracted training sets through repeated sampling, with each set being approximately two-thirds the size of the original data, and the out-of-bag set being about one-third. Each decision tree was constructed using a corresponding training set, thereby building a decision tree regression model to increase model diversity and improve prediction accuracy. In the Random Forest method, two important parameters were ntree, representing the number of decision trees, and mtry, representing the number of candidate variables at each node. In general, mtry = sqrt (variable count). This study employed two evaluation metrics, NSE and R2, to validate the constructed Random Forest regression model. Due to the continuity of the propagation threshold from meteorological drought to hydrological drought, the Variable Importance Measure (VIM) in Random Forest regression was measured using the percent increase in mean squared error (%IncMSE).

4. Results and Discussion

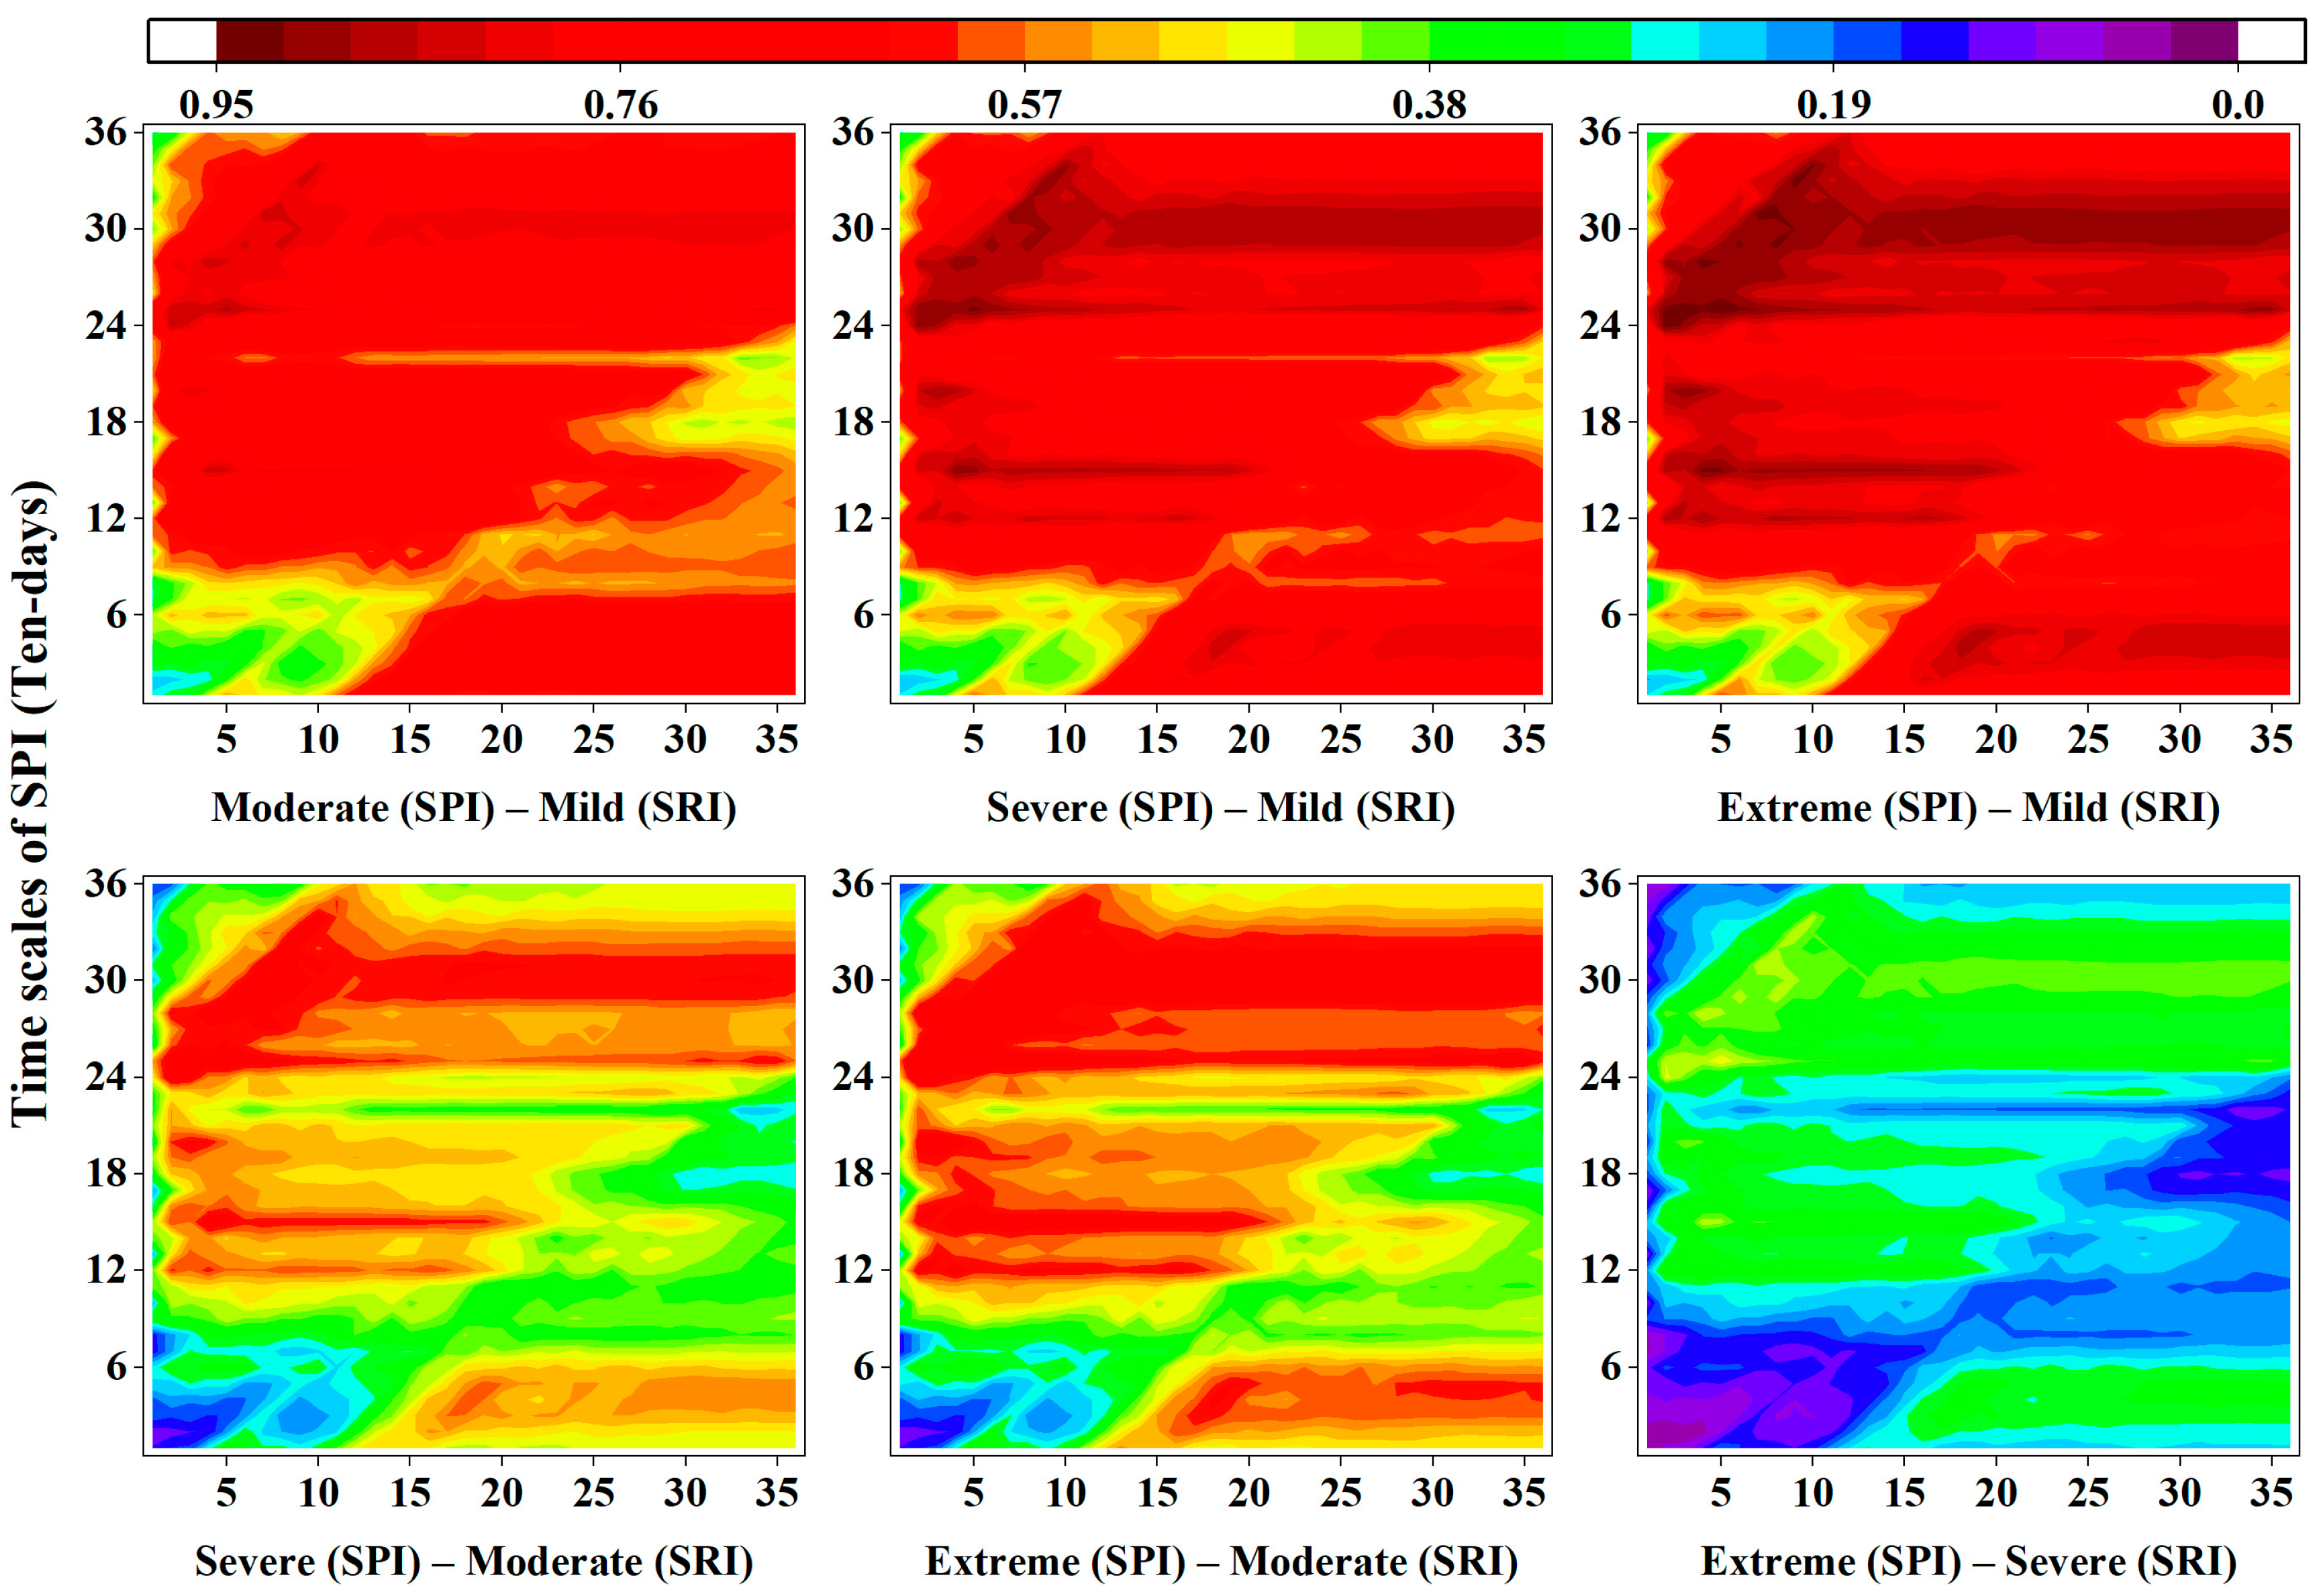
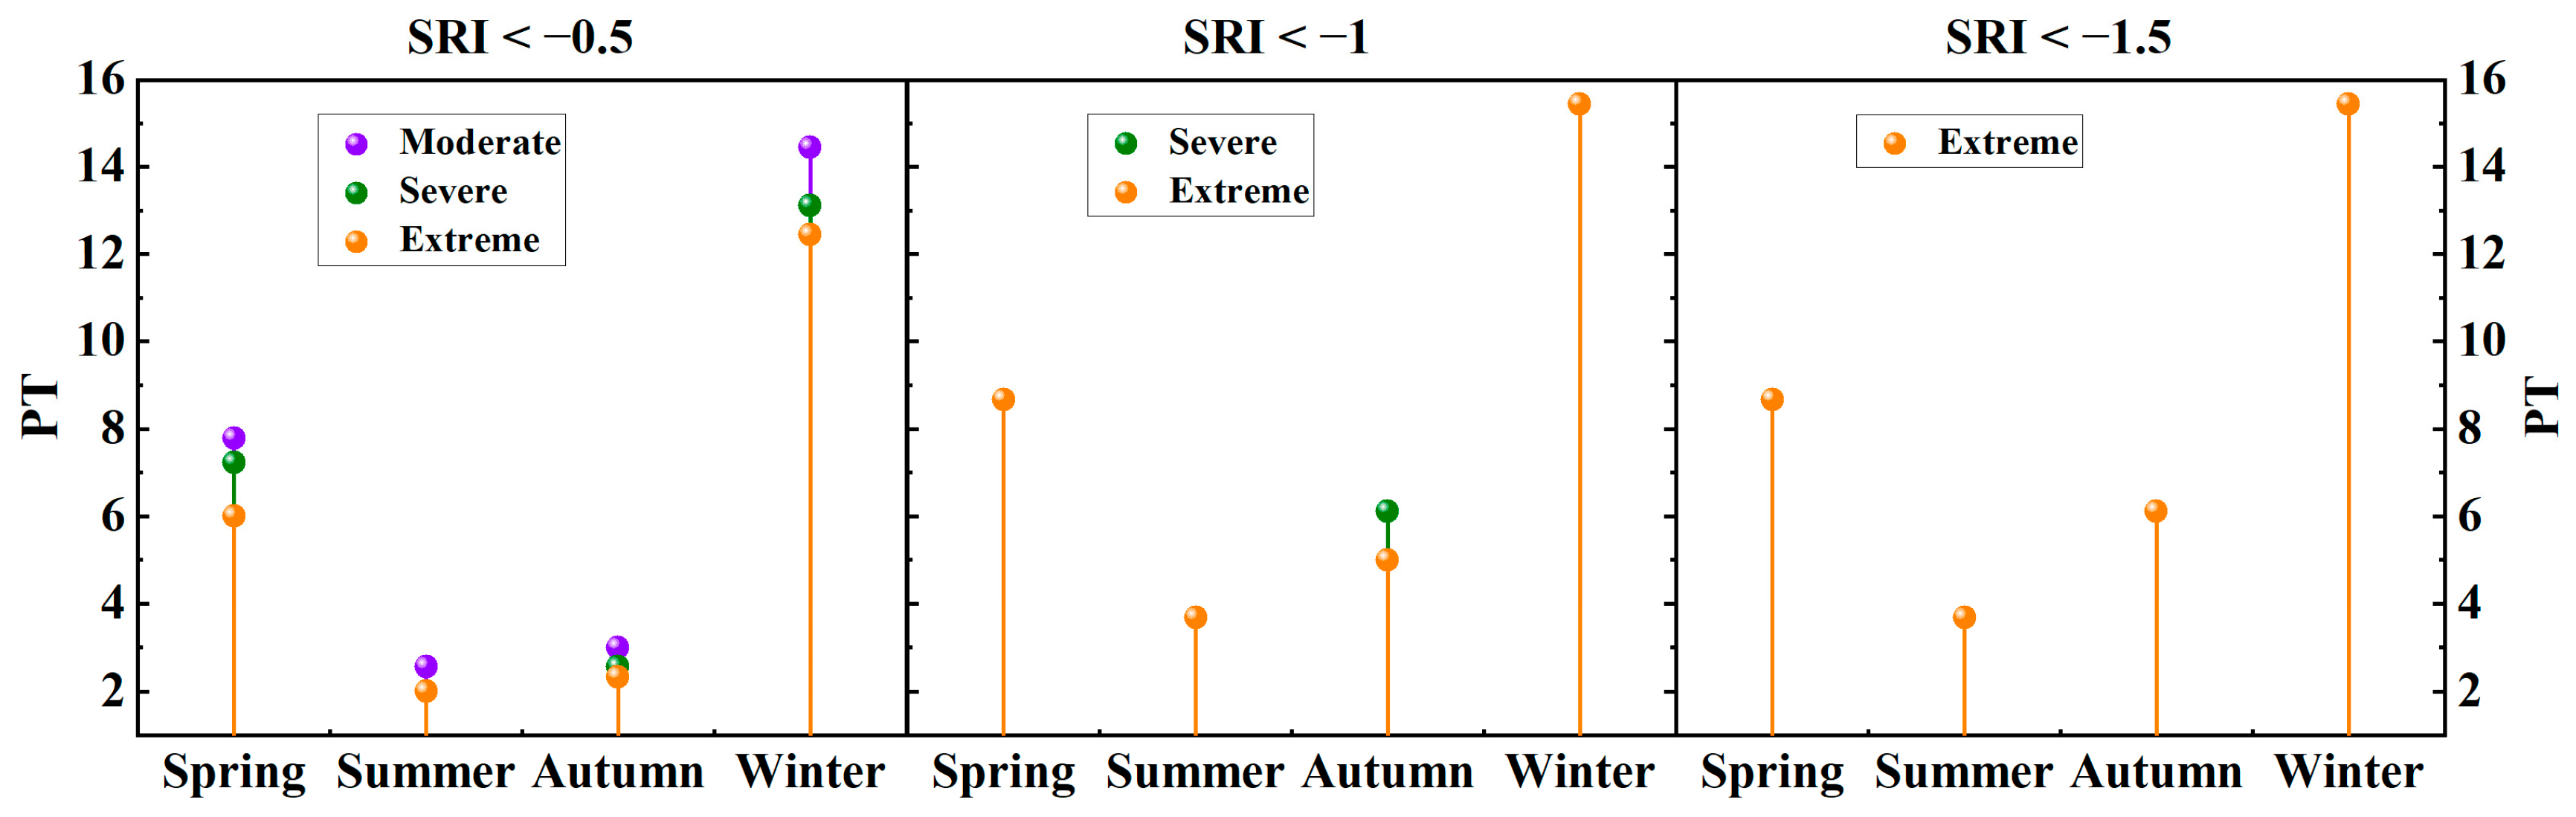
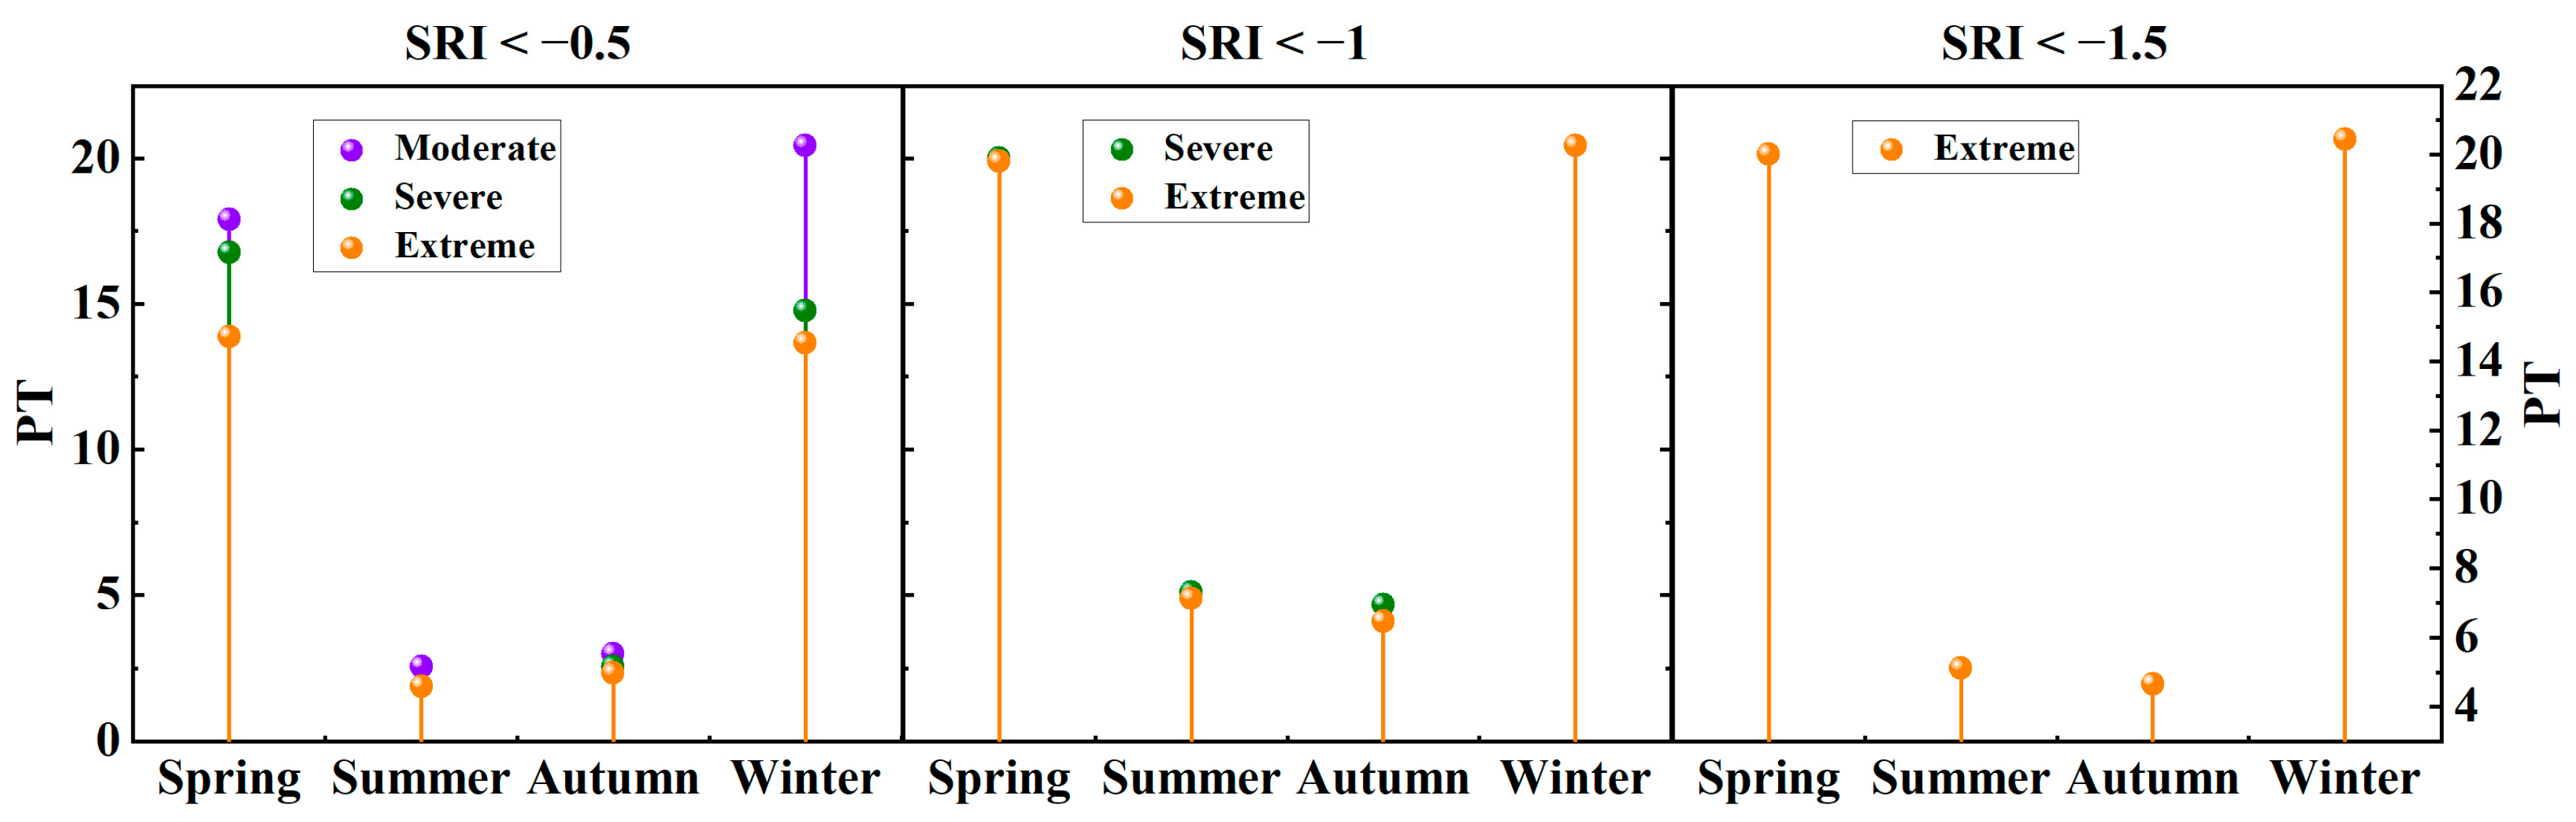
4.1. PT from Meteorological Drought to Hydrological Drought under Different Scenarios

The drought grading consists of four levels, and according to the permutation and combination, there were a total of 16 corresponding situations. This study mainly explored the PT from high-level meteorological drought to low-level hydrological drought, selecting the following six scenarios: moderate, severe, extreme meteorological drought to mild or higher hydrological drought; severe, extreme meteorological drought to moderate or higher hydrological drought; and extreme meteorological drought to severe or higher hydrological drought. The time scale of SPI was from 1 to 36 ten-day periods.
According to the six scenarios selected, the occurrence probability of meteorological to hydrological drought was calculated, as shown in Figure 3, Figure 4 and Figure 5. The color bars in the figures represent the levels of occurrence probability, with red indicating a high occurrence probability and purple–blue indicating a low occurrence probability. Overall, the six figures showed similar trends, with the main difference being the distinction in occurrence probabilities. Under the same meteorological drought conditions, as the level of hydrological drought increased (became more severe), the probability of hydrological drought occurring correspondingly decreased. Under the same hydrological drought conditions, as the level of meteorological drought increased, the probability of hydrological drought occurring correspondingly increased. The highest occurrence probability reached 0.95 in the WRB, which was close to the possibility of a certain occurrence. This indicated that low-level meteorological droughts were generally less likely to trigger high-level hydrological droughts, while high-level meteorological droughts had a higher probability of triggering low-level hydrological droughts, which aligned with common sense and general understanding.
Additionally, the figures showed that the probability of the same level of meteorological drought triggering hydrological drought decreased with an increase in level, indicating that as the level of hydrological drought increased, the triggering conditions become more stringent. When it comes to extreme meteorological drought leading to severe or higher hydrological drought, the occurrence probability had already fallen below 0.5. Furthermore, the occurrence probability of meteorological drought leading to hydrological drought in the study basin exhibited a certain degree of seasonality, with the occurrence probability in spring and winter being generally lower than in summer and autumn. This conclusion was consistent with the research findings of Zhang et al. [57]. Low-probability events first appeared in spring and winter. The high-probability corresponding times in spring and winter were later than in summer and autumn, indicating that during summer and autumn, there was a higher likelihood of short-duration meteorological droughts propagating to hydrological droughts. Moreover, at the same time, the probability of meteorological drought propagating to hydrological drought under different time scales accumulated in a regular pattern, showing a certain periodicity.
According to the method of determining the PT, we calculated the PT and corresponding probability in different states of the basin. Figure 6, Figure 7 and Figure 8 depict the PT of meteorological to hydrological drought across different seasons under six scenarios (the average PT over nine ten-day periods within the same season). The three figures represent mild, moderate, and severe or higher levels of hydrological drought, respectively, with different colors in the figures indicating different levels of meteorological drought. In the WRB, the PTs for spring, summer, autumn, and winter were within 9, 4, 7, and 16 ten-day periods, respectively; in the JRB, they were within 16, 3, 7, and 23 ten-day periods; and in the MWRB, they were within 20, 6, 5, and 21 ten-day periods. Overall, it showed the characteristic that drought propagation was faster in hot seasons and slower in cold seasons. The differences in PT represented by different colors in the left figure indicate that for the same level of hydrological drought, the PT accelerated with an increase in the level of meteorological drought. The orange in all three figures represented the PT of extreme meteorological drought, indicating that for the same level of meteorological drought, the PT increased with a higher level of hydrological drought. Among different basins, the PT of the WRB was lower than that of the MWRB and also lower than that of the JRB.
In Figure 6, Figure 7 and Figure 8, the PT differences for moderate and severe or above hydrological droughts are not significant, which is related to their occurrence probabilities. Figure 9 displays the propagation probabilities corresponding to the drought PT in various scenarios. In scenarios where the severity levels of meteorological and hydrological droughts were similar, the propagation probability was generally not high, meaning that a higher level of meteorological drought was required to trigger a hydrological drought. Under the criterion of 0.7 as the occurrence probability, the results of the PT from different levels of meteorological drought to mild or above hydrological drought were more reliable. Therefore, subsequent analysis mainly explored the propagation process from different levels of meteorological drought to mild or above hydrological drought.

4.2. Determination of Propagation Threshold

This study analyzed the PT of meteorological–hydrological droughts under six different scenarios. According to the grading division and research results, it was known that the probability of propagation from meteorological drought to hydrological drought varied under different scenarios. Therefore, when determining the propagation probability, deducing the propagation threshold of meteorological drought will also yield different results. However, the results in Section 4.1 showed that although the occurrence probabilities corresponding to different states varied, they all exhibited regular changes, and the PT results were also similar. The main aim of this chapter was to explore the threshold of meteorological drought triggering hydrological drought, and only the threshold results of meteorological drought causing the occurrence of hydrological drought (SRI ≤ −0.5) were analyzed.
To determine the propagation threshold, it was necessary to calculate the propagation probability based on the sequence corresponding to the PT. The above research indicated that the PT was different for different time scales, and the corresponding propagation thresholds are also different. Therefore, each basin needed to be fitted 36 times. Here, only one set of the 36 groups of data from three basins was shown (Figure 10), and the other more than a hundred groups of calculation processes were not elaborated. The left figure of Figure 10 shows the Frank Copula joint distribution function of SPI and SRI, and the right figure shows the conditional probability curve calculated based on the formula after fitting the function. The position of the triangle in the figure was the one sought.
Based on the above calculation process, the thresholds for meteorological drought triggering hydrological drought in the study basin for different months were obtained (Figure 11). Figure 11 showed that in the propagation probabilities corresponding to the drought propagation times, the absolute value of the propagation threshold was smaller for the months with high probabilities. According to the trend of the curves in Figure 10, it is known that the propagation threshold decreased as the propagation probability increased, and the absolute value became larger. This indicated that the meteorological drought was transitioning towards a more severe state. In summary, at a propagation probability of 0.7, the threshold ranges for meteorological drought to trigger hydrological drought were as follows: for the WRB, it was [−0.69, −∞); for the JRB, it was [−0.81, −∞); and for the MWRB, it was [−0.78, −∞).

4.3. Dynamic Changes in Propagation Time

Amidst the climate change driven by global warming and the intensification of human activities, meteorological and hydrological elements were gradually eroded and continuously changing. By employing a 21-year sliding window, an analysis of the sequence of drought propagation processes was conducted to explore the dynamic patterns of meteorological to hydrological drought propagation on both annual and seasonal scales. When applying a 21-year sliding window to the sequence from 1960 to 2016, the first subsequence was from 1960 to 1980, the second subsequence was from 1961 to 1981, and so on, yielding a total of 38 subsequences. For each sub-sequence, the drought propagation time on an annual scale and seasonal scale was calculated, and the dynamic change patterns were explored through the Mann–Kendall (M-K) trend test [71,72].
This study primarily analyzed the dynamic change patterns of the PT of moderate, severe, and extreme meteorological droughts to mild hydrological drought across years and different seasons. The sequence of drought PT on an annual timescale was depicted in Figure 12. Although the PT of meteorological droughts of different levels within the same basin fluctuated within different ranges, the trends were similar, with differences lying in the extent of the variations. The trends and calculated M-K trend values of the sequences in the figure are summarized in Table 2. The trend in drought PT in the WRB showed a non-significant decreasing change. In contrast, both the JRB and the MWRB exhibited significant increases in the PT across different levels of meteorological drought. Specifically, in scenarios of moderate and severe meteorological drought, the trend changes in PT passed the test with a 99% confidence level. In the scenario of extreme meteorological drought, the trend changes in PT passed the test with a 95% confidence level.
To gain a clearer understanding of the dynamic changes in drought PT, a summary analysis was conducted on the PT sequences of different seasons to explore the information obscured by the averaging effect on an annual timescale. The tendencies of the fitted sequences and the results of the M-K trend tests are summarized in Table 3. In the PT changes from moderate-level meteorological drought to hydrological drought, the WRB showed a non-significant decreasing trend in spring, autumn, and winter, which was consistent with the changes on an annual timescale, but a significant increasing trend in summer, which passed the 95% confidence level test. Therefore, when balanced across the four seasons, the change on an annual timescale was non-significant; the JRB showed an upward trend in all four seasons, but the change in spring did not pass the confidence level test, with a value of only 1.07; the MWRB also showed an upward trend in all four seasons, but the change in summer did not pass the confidence level test. In general, the WRB exhibited a larger discrepancy between seasonal and annual scale changes, mainly reflected in the changes during summer, while the JRB and the MWRB showed the same trend on both timescales. In the PT changes in severe-level droughts, the WRB showed a significant decrease in spring and autumn and a significant increase in summer; the JRB showed a significant increase in summer and winter; and the MWRB showed a significant increase in winter. For the severe-level sequences, the three basins showed some differences in the seasonal trends compared to the annual timescale, with the WRB reflected in summer, the JRB in autumn, and the MWRB in spring and autumn. In the PT changes from extreme-level meteorological drought to hydrological drought, the changes in the WRB were the same as those in the severe level; the JRB showed a significant decreasing trend in autumn, which changed from non-significant in the severe level to significant, and the changes in other seasons were also the same as those in the severe level; the MWRB, except for a significant decreasing trend in spring, which changed from non-significant in the severe level to significant, showed the same trends as the severe level in other respects.

4.4. Analysis of Driving Forces for the PT from Meteorological Drought to Hydrological Drought

4.4.1. Simulation Results of the PT Based on Random Forest Model

The hydrological and thermal states (such as precipitation, saturation vapor pressure deficit (VPD), etc.) and the storage-discharge states (such as soil moisture, base flow, etc.) of a basin were closely related to the drought propagation process, and the changing environment affected these key factors, which in turn influenced the drought propagation process. Precipitation was the source of water for most domains in the ecosystem. The saturation vapor pressure deficit affected the closure of plant stomata, which then impacted the transpiration process in forest systems, as well as the efficiency of water use. These two factors, to a certain extent, characterized water and heat, and could directly or indirectly affect runoff, disrupting the drought propagation process. After precipitation fell to the ground, in addition to entering the runoff, most of it entered the underlying surface. The driving conditions of the underlying surface could reflect the impact of the basin’s storage-discharge relationship on the drought propagation. At the same time, under a changing environment, the trends in seasonal factor changes varied. There was more precipitation and higher temperatures in summer, while in winter, there was a scarcity of precipitation. The impact of these different conditions on the drought propagation process also differed. Therefore, this study analyzed the impact of different factors on the drought PT from aspects of meteorological factors and underlying surface factors.
This study employed the Random Forest model to investigate the importance scores of meteorological and underlying surface factors (precipitation, VPD, soil moisture, base flow) on the PT from meteorological drought to hydrological drought from various perspectives in order to analyze the factors that hold significant positions in the driving forces of drought PT. Initially, the results of the Random Forest model were subjected to a verification analysis. The simulated values from the model were evaluated against actual measured values, and the evaluation results were compiled in Table 4. The study conducted a driving force analysis on the PT of drought under conditions of moderate, severe, and extreme meteorological drought. Based on the simulation results from the Random Forest model, the Nash–Sutcliffe Efficiency (NSE) was above 0.73, and the coefficient of determination (R2) was above 0.90. This indicated that the Random Forest regression model constructed for the study area achieved a satisfactory level of simulation accuracy and had strong generalization capabilities, making it suitable for the quantitative assessment of drought PT.

4.4.2. Driving Force Analysis

The PTs from different levels of meteorological drought to hydrological drought varied, and there were differences in their dynamic changes, with corresponding driving forces also varying. Random Forest simulations were conducted separately for the PTs from moderate, severe, and extreme meteorological droughts to hydrological drought, and the results of the importance scores of the driving factors were compiled in Table 5, Table 6 and Table 7.
In spring, within the WRB, under moderate and severe meteorological drought conditions, the variation in precipitation had a more significant impact on the dynamic changes in PT; under extreme conditions, the variation in VPD had a more significant impact. In the JRB, under moderate and severe conditions, the variation in VPD was more sensitive to its influence, while under extreme conditions, the variation in precipitation was more sensitive. In the MWRB, changes in VPD were more sensitive across all levels. Overall, in spring, the meteorological factors had a greater impact on drought PT than the underlying surface, but there were differences in the types of factors.
In summer, within the WRB, under moderate conditions, the variation in base flow was more sensitive to its influence, while under severe and extreme conditions, the variation in VPD was more sensitive. In the JRB, changes in VPD were more sensitive across all levels. In the MWRB, under moderate and extreme conditions, the variation in baseflow was more sensitive to its influence, while under severe conditions, the variation in precipitation was more sensitive. Generally speaking, during summer, due to the meteorological factors in the WRB, the JRB had a higher impact on PT, while in the MWRB, both precipitation and base flow had a higher impact on PT. Summer was a season with abundant precipitation, which was a crucial factor directly affecting runoff changes. Thus, the precipitation factor was one of the main driving forces influencing the variation in PT from meteorological drought to hydrological drought, with a more pronounced impact during summer. Zhao et al.’s research [73] results indicated that meteorological factors had the most direct impact on the drought propagation time. Precipitation had a greater influence on the drought propagation time at shorter time scales. This was corroborative of our research findings.
In autumn, within the WRB, under moderate conditions, the variation in base flow was more sensitive to its influence; under severe conditions, the variation in precipitation was more sensitive; and under extreme conditions, the variation in VPD was more sensitive. In the JRB, under moderate conditions, the variation in baseflow was more sensitive to its influence; under severe conditions, the variation in soil moisture was more sensitive; and under extreme conditions, the variation in VPD was more sensitive. In the MWRB, under moderate and severe conditions, the variation in baseflow was more sensitive to its influence, and under extreme conditions, the variation in soil moisture was more sensitive. Overall, during autumn, the meteorological factors had a higher impact on the PT of higher-level droughts in the WRB. In the JRB, the underlying surface conditions had a higher impact on the propagation of moderate and severe droughts, and in the MWRB, changes in underlying surface conditions had a higher impact on drought PT.
In winter, within the WRB, under moderate conditions, the variation in VPD was more sensitive to its influence, while under severe and extreme conditions, the variation in precipitation was more sensitive. In the JRB, changes in VPD were more sensitive across all levels. Similarly, in the MWRB, changes in VPD were more sensitive across all levels. In summary, during winter, the impact of meteorological factors was higher than that of the underlying surface, with VPD generally having a greater impact than the precipitation factor. There was a significant upward trend in VPD during winter, and an increase in VPD could potentially lead to an extension in the PT from meteorological drought to hydrological drought. Correspondingly, the PTs of different levels of drought in the JRB and the MWRB also showed a significant upward trend.
From the above, it was known that meteorological factors had the most direct impact on the PT of drought. The probability of meteorological drought in the study basin leading to hydrological drought showed a certain seasonality, with the occurrence probabilities in spring and winter generally being lower than in summer and autumn. The flood season in the WRB was from June to November (summer and autumn), meaning that the occurrence probability of hydrological drought was lower during the non-flood season. Research by Zhang et al. [57] suggested that the severity of hydrological drought in the WRB was alleviated during the non-flood season. This coincided with our research findings. Clearly, the variation in precipitation distribution had a significant impact on the PT of meteorological–hydrological drought in different seasons. Underlying surface factors were closely related to human activities and indirectly affect the propagation of drought. In Zhang et al.’s research [57], it was mentioned that human activities reduced the risk of hydrological drought in spring and winter. In the analysis of the driving forces for the PT from meteorological to hydrological drought, during spring, summer, and winter, it was primarily the meteorological factors that had a more significant impact on the PT in the study basin, with the water-heat state affecting the PT more than the basin’s storage and discharge relationship. In autumn, for the JRB and the MWRB, the underlying surface conditions had a greater impact on the PT, with the basin’s storage and discharge state affecting the PT more than the water-heat state. The reasons for the different driving factors in different sub-regions were also closely related to the significant differences in topography and geomorphology when dividing the regions.

4.5. Limitations and Prospects

Drought-related research has always been a hot scientific issue, and due to the complexity of hydrological systems, the study of drought propagation is full of challenges. This study explored the characteristics of the propagation from meteorological drought to hydrological drought and its dynamics, as well as the driving factors that affect the dynamics of the propagation time. However, there are still some shortcomings that need further discussion:
(1)
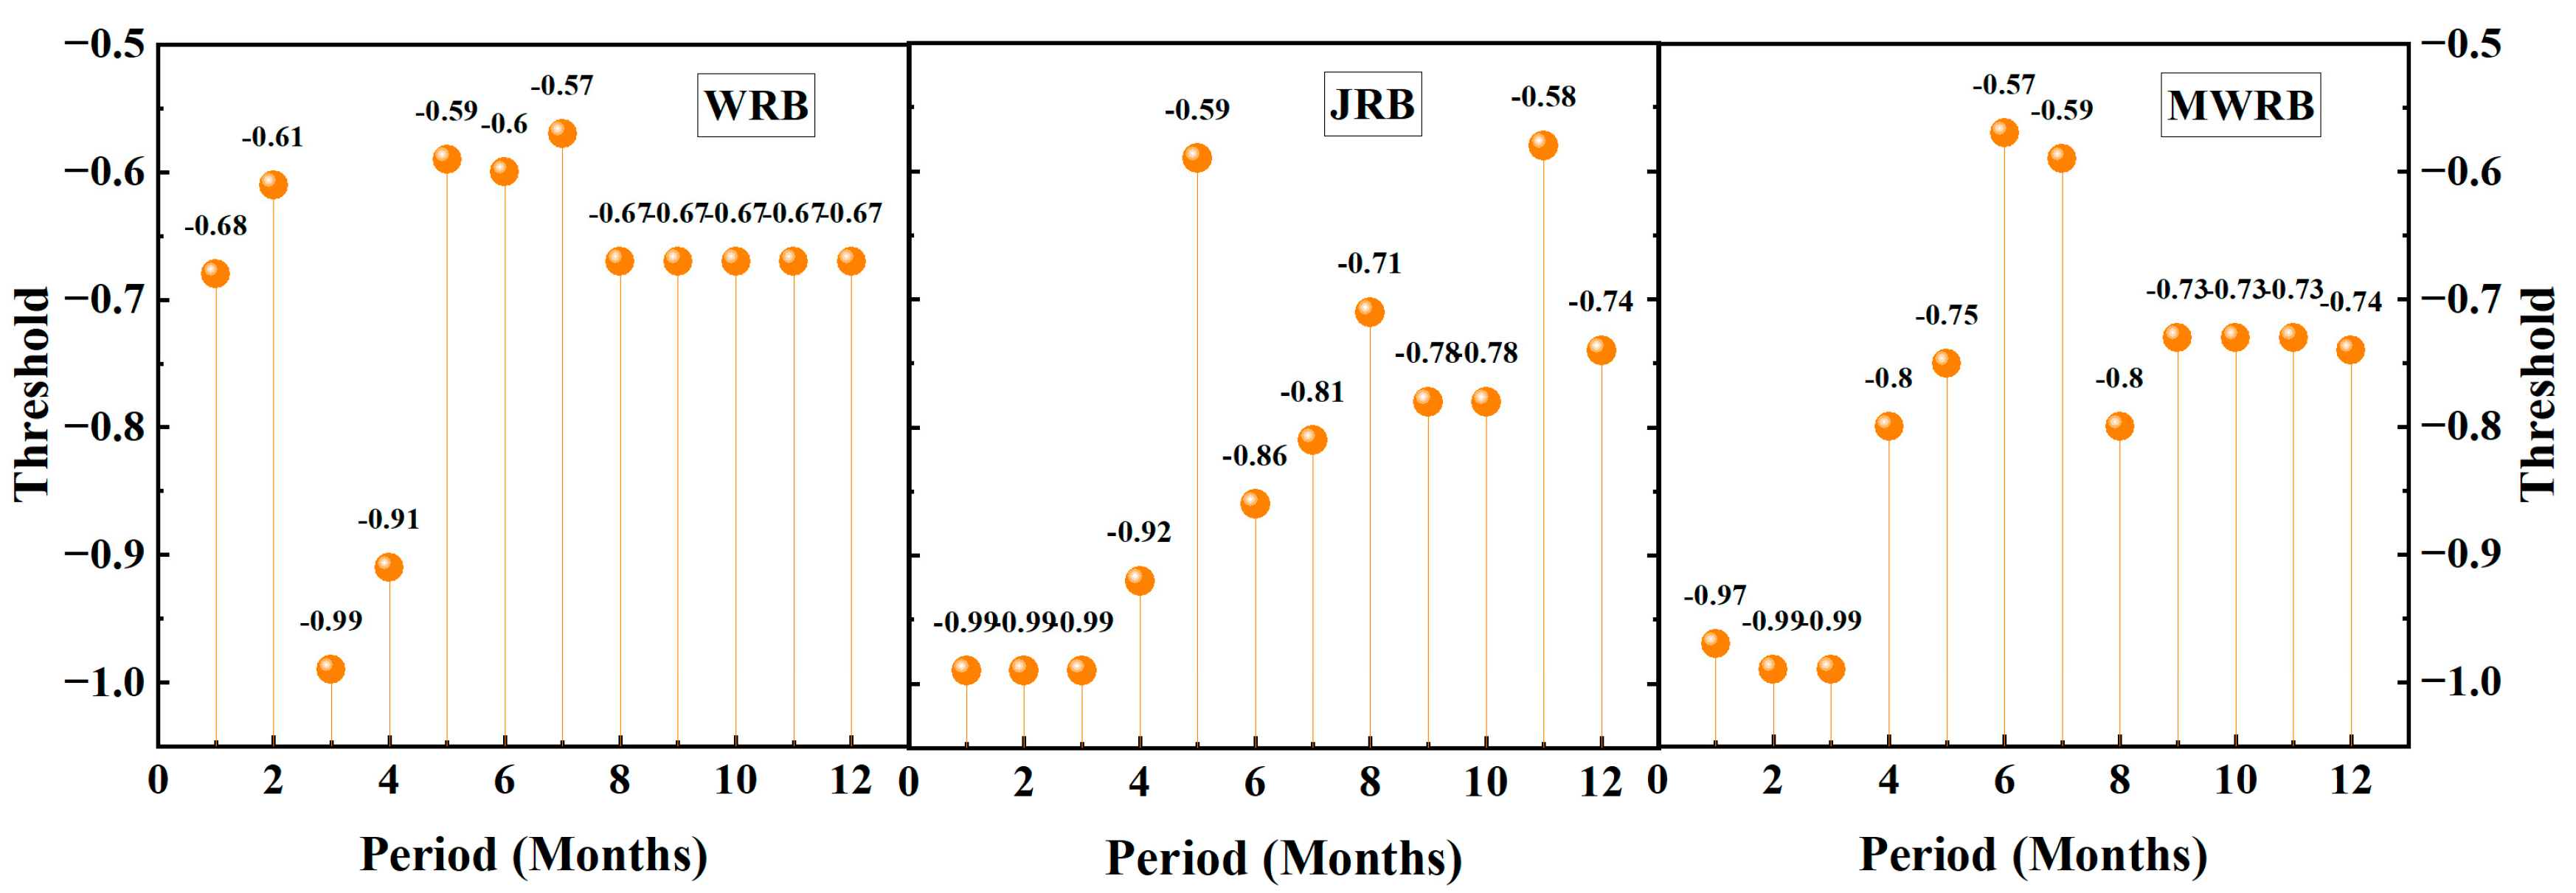
When calculating the propagation threshold of drought, this paper chose 0.7 as the boundary of the propagation probability. Although for sequences with a length of thousands, 0.7 is already a high probability of occurrence, there is still a lack of theoretical support for the choice of data. In future research, some discussion can be carried out in this direction to determine a more convincing boundary.
(2)
In the attribution analysis, the selected driving factors may not be comprehensive enough, and some interactions between driving factors may be overlooked. Subsequent research can further expand the data to make the driving force analysis results more comprehensive and objective.

5. Conclusions

This study focused on WRB, JRB, and MWRB as research subjects. Based on Copula theory and conditional probability, a probabilistic assessment model was constructed for the propagation characteristics from meteorological drought to hydrological drought. Based on this foundation, the dynamic characteristics of drought PT at annual and seasonal scales were discussed. Additionally, the study analyzed the impact of meteorological factors and underlying surface factors on the dynamic changes in PT. The findings of the research were conducive to establishing an effective drought monitoring and early warning system, enhancing the accuracy of hydrological drought forecasts. The main research conclusions were as follows:
(1)
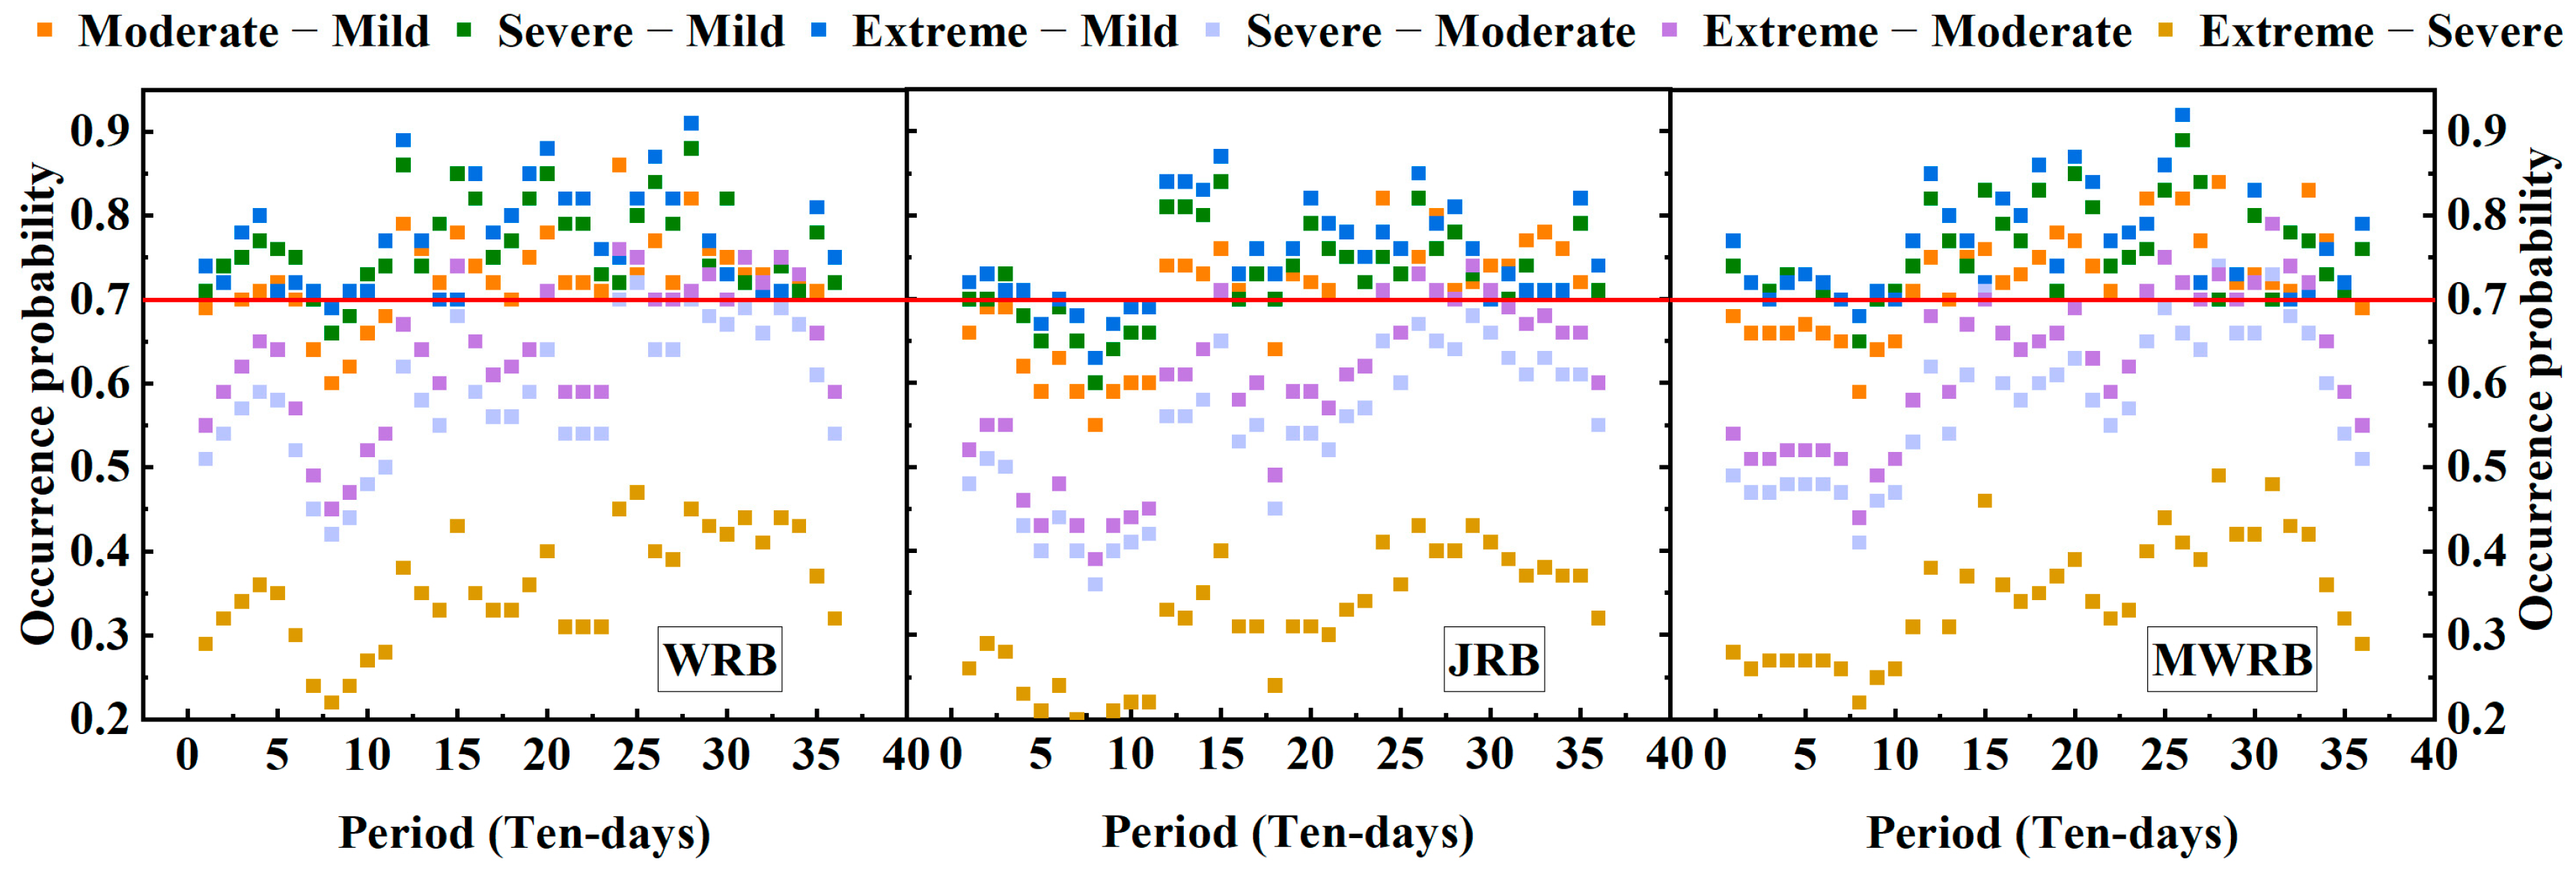
Under the same level, as the level of hydrological drought increased, the occurrence probability of hydrological drought correspondingly decreased; within the same level of hydrological drought, as the level of meteorological drought increased, the occurrence probability of hydrological drought correspondingly increased. The PT showed a distribution of being faster during the hot months (June–September) and slower during the cold months (December to March of the following year).
(2)
In the WRB, the PTs for spring, summer, autumn, and winter were within 9, 4, 7, and 16 ten-day periods, respectively; in the JRB, they were within 16, 3, 7, and 23 ten-day periods; and in the MWRB, they were within 20, 6, 5, and 21 ten-day periods. At the same time, under the same level of hydrological drought, as the level of meteorological drought increased, the PT shortened. The propagation thresholds from meteorological to hydrological drought for the WRB, JRB, and MWRB were −0.69, −0.81, and −0.78, respectively.
(3)
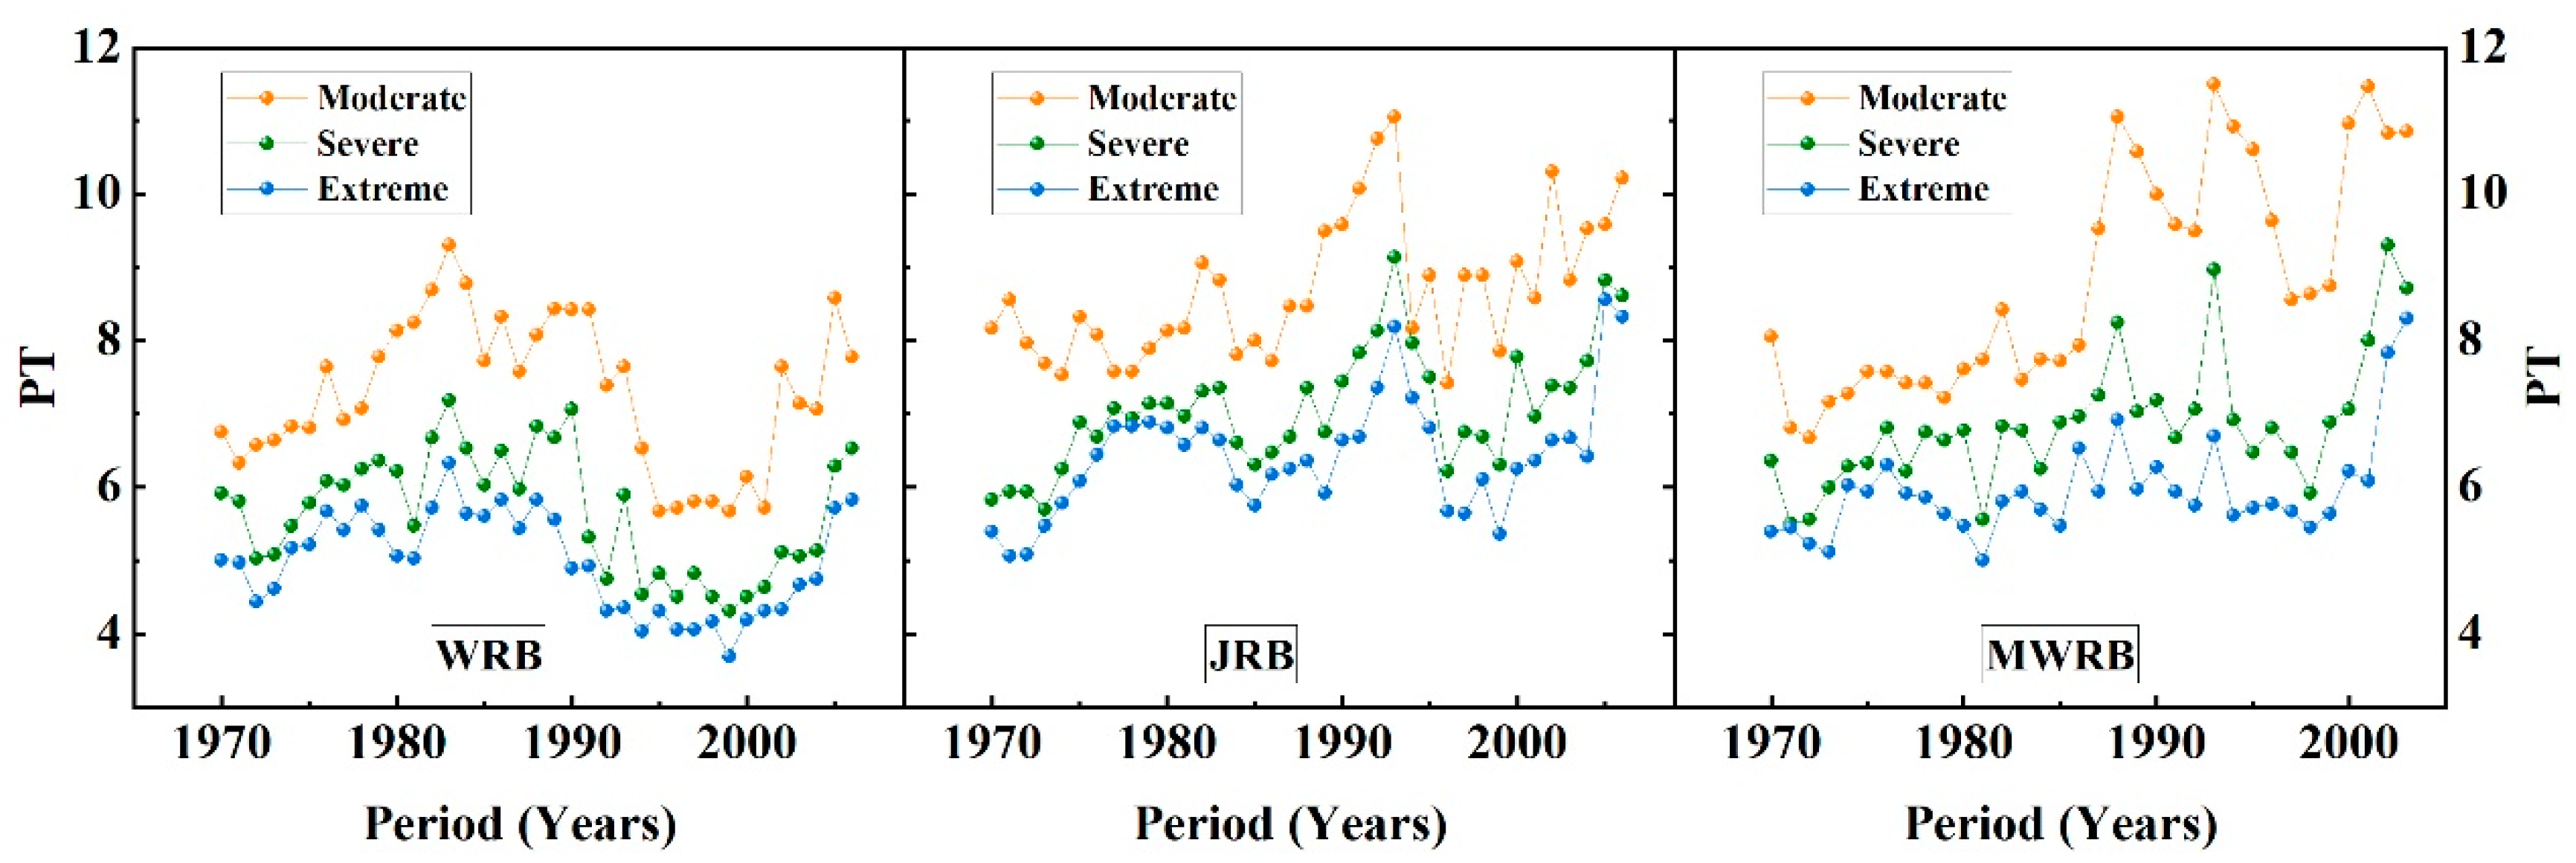
In the dynamic changes in PT, the WRB showed a non-significant decreasing trend; the PTs of different levels of drought in the JRB and the MWRB both significantly increased, passing the 95% confidence level test.
(4)
In the analysis of driving forces for the PT from meteorological to hydrological drought, during spring, summer, and winter, it was primarily the meteorological factors that had a more significant impact on the PT in the study basin. In autumn, for the Jing River Basin and the middle reaches of the Wei River, the underlying surface conditions had a greater impact on the PT.

Author Contributions

Conceptualization, S.H.; Methodology, Y.L.; Software, Y.L.; Validation, M.D.; Resources, S.H.; Data curation, H.Z.; Writing—original draft, M.D. and Y.L.; Writing—review & editing, M.D. and S.H.; Supervision, Q.H. All authors have read and agreed to the published version of the manuscript.

Funding

This research was jointly funded by the Open Research Foundation of Yinshanbeilu Grassland Eco-Hydrology National Observation and Research Station (Grant number YSS202101) and the National Natural Science Foundation of China (Grant number 52279026).

Data Availability Statement

The data in this study are derived from the following resources available in the public domain: Meteorological data were sourced from the China Meteorological Science Data Sharing Service Network (https://data.cma.cn/). Hydrological data were obtained from the Yellow River Basin Hydrological Yearbook of the People’s Republic of China. Soil moisture data were sourced from the Global Land Data Assimilation System (GLDAS) data center (https://search.earthdata.nasa.gov/search?q=GLDAS). The Digital Elevation Model (DEM) data were provided by “National Cryosphere Desert Data Center/National Service Center for Specialty Environmental Observa-tion Stations” (http://www.ncdc.ac.cn/).

Conflicts of Interest

Author Yongjia Liu was employed by the company Shenzhen DongShen Intelligent Water Company Limited. The remaining authors declare that the research was conducted in the absence of any commercial or financial relationships that could be construed as a potential conflict of interest.

References

  1. Keyantash, J.; Dracup, J.A. The Quantification of Drought: An Evaluation of Drought Indices. Bull. Am. Meteorol. Soc. 2002, 83, 1167–1180. [Google Scholar] [CrossRef]
  2. Zhang, D.-D.; Yan, D.; Lu, F.; Wang, Y.; Feng, J. Copula-based risk assessment of drought in Yunnan province, China. Nat. Hazards 2015, 75, 2199–2220. [Google Scholar] [CrossRef]
  3. Fang, W.; Huang, S.; Huang, Q.; Huang, G.; Wang, H.; Leng, G.; Wang, L.; Guo, Y. Probabilistic assessment of remote sensing-based terrestrial vegetation vulnerability to drought stress of the Loess Plateau in China. Remote Sens. Environ. 2019, 232, 111290. [Google Scholar] [CrossRef]
  4. Zhang, Q.; Yao, Y.; Li, Y.; Huang, J.; Ma, Z.; Wang, Z.; Wang, S.; Wang, Y.; Zhang, Y. Causes and Changes of Drought in China: Research Progress and Prospects. J. Meteorol. Res. 2020, 34, 460–481. [Google Scholar] [CrossRef]
  5. Xu, Y.; Zhu, X.; Cheng, X.; Gun, Z.; Lin, J.; Zhao, J.; Yao, L.; Zhou, C. Drought assessment of China in 2002–2017 based on a comprehensive drought index. Agric. For. Meteorol. 2022, 319, 108922. [Google Scholar] [CrossRef]
  6. Kiem, A.S.; Johnson, F.; Westra, S.; van Dijk, A.; Evans, J.P.; O’Donnell, A.; Rouillard, A.; Barr, C.; Tyler, J.; Thyer, M.; et al. Natural hazards in Australia: Droughts. Clim. Chang. 2016, 139, 37–54. [Google Scholar] [CrossRef]
  7. Sun, P.; Ma, Z.; Zhang, Q.; Singh, V.P.; Xu, C.-Y. Modified drought severity index: Model improvement and its application in drought monitoring in China. J. Hydrol. 2022, 612, 128097. [Google Scholar] [CrossRef]
  8. Wang, T.; Tu, X.; Singh, V.P.; Chen, X.; Lin, K. Global data assessment and analysis of drought characteristics based on CMIP6. J. Hydrol. 2021, 596, 126091. [Google Scholar] [CrossRef]
  9. Schwalm, C.R.; Anderegg, W.R.L.; Michalak, A.M.; Fisher, J.B.; Biondi, F.; Koch, G.; Litvak, M.; Ogle, K.; Shaw, J.D.; Wolf, A.; et al. Global patterns of drought recovery. Nature 2017, 548, 202–205. [Google Scholar] [CrossRef]
  10. Touma, D.; Ashfaq, M.; Nayak, M.A.; Kao, S.-C.; Diffenbaugh, N.S. A multi-model and multi-index evaluation of drought characteristics in the 21st century. J. Hydrol. 2015, 526, 196–207. [Google Scholar] [CrossRef]
  11. Wilhite, D. Drought as a Natural Hazard: Concepts and Definitions. In Drought: A Global Assessment; Routledge: London, UK, 2000; Volume 1, pp. 3–18. [Google Scholar]
  12. Su, B.; Huang, J.; Fischer, T.; Wang, Y.; Kundzewicz, Z.W.; Zhai, J.; Sun, H.; Wang, A.; Zeng, X.; Wang, G.; et al. Drought losses in China might double between the 1.5 °C and 2.0 °C warming. Proc. Natl. Acad. Sci. USA 2018, 115, 10600–10605. [Google Scholar] [CrossRef] [PubMed]
  13. Lesk, C.; Rowhani, P.; Ramankutty, N. Influence of extreme weather disasters on global crop production. Nature 2016, 529, 84–87. [Google Scholar] [CrossRef]
  14. Zhou, K.; Wang, Y.; Chang, J.; Zhou, S.; Guo, A. Spatial and temporal evolution of drought characteristics across the Yellow River basin. Ecol. Indic. 2021, 131, 108207. [Google Scholar] [CrossRef]
  15. Wang, F.; Wang, Z.; Yang, H.; Di, D.; Zhao, Y.; Liang, Q.; Hussain, Z. Comprehensive evaluation of hydrological drought and its relationships with meteorological drought in the Yellow River basin, China. J. Hydrol. 2020, 584, 124751. [Google Scholar] [CrossRef]
  16. Deng, H.; Yin, Y.; Zong, X.; Yin, M. Future drought risks in the Yellow River Basin and suggestions for targeted response. Int. J. Disaster Risk Reduct. 2023, 93, 103764. [Google Scholar] [CrossRef]
  17. Zhao, J.; Zhang, Q.; Zhu, X.; Shen, Z.; Yu, H. Drought risk assessment in China: Evaluation framework and influencing factors. Geogr. Sustain. 2020, 1, 220–228. [Google Scholar] [CrossRef]
  18. Sun, H.; Di, Z.; Qin, P.; Zhang, S.; Lang, Y. Spatio-temporal variation and dynamic risk assessment of drought and flood disaster (DFD) in China. Int. J. Disaster Risk Reduct. 2024, 100, 104140. [Google Scholar] [CrossRef]
  19. Wang, Z.; Huang, S.; Mu, Z.; Leng, G.; Duan, W.; Ling, H.; Xu, J.; Zheng, X.; Li, P.; Li, Z.; et al. Relative humidity and solar radiation exacerbate snow drought risk in the headstreams of the Tarim River. Atmos. Res. 2024, 297, 107091. [Google Scholar] [CrossRef]
  20. Chang, J.; Li, Y.; Ren, Y.; Wang, Y. Assessment of precipitation and drought variability in the Weihe River Basin, China. Arab. J. Geosci. 2016, 9, 633. [Google Scholar] [CrossRef]
  21. Fan, J.; Xu, F.; Sun, X.; Dong, W.; Ma, X.; Liu, G.; Cheng, Y.; Wang, H. Construction and Application of Hydrometeorological Comprehensive Drought Index in Weihe River. Atmosphere 2022, 13, 610. [Google Scholar] [CrossRef]
  22. Mishra, A.K.; Singh, V.P. A review of drought concepts. J. Hydrol. 2010, 391, 202–216. [Google Scholar] [CrossRef]
  23. Hao, Z.; Singh, V.P. Drought characterization from a multivariate perspective: A review. J. Hydrol. 2015, 527, 668–678. [Google Scholar] [CrossRef]
  24. Wilhite, D.; Glantz, M. Understanding: The Drought Phenomenon: The Role of Definitions. Water Int. 1985, 10, 111–120. [Google Scholar] [CrossRef]
  25. Hao, C.; Zhang, J.; Yao, F. Combination of multi-sensor remote sensing data for drought monitoring over Southwest China. Int. J. Appl. Earth Obs. Geoinf. 2015, 35, 270–283. [Google Scholar] [CrossRef]
  26. Zhang, Y.; Hao, Z.; Feng, S.; Zhang, X.; Xu, Y.; Hao, F. Agricultural drought prediction in China based on drought propagation and large-scale drivers. Agric. Water Manag. 2021, 255, 107028. [Google Scholar] [CrossRef]
  27. Yuan, X.; Zhang, M.; Wang, L.; Zhou, T. Understanding and seasonal forecasting of hydrological drought in the Anthropocene. Hydrol. Earth Syst. Sci. 2017, 21, 5477–5492. [Google Scholar] [CrossRef]
  28. Ding, Y.; Xu, J.; Wang, X.; Cai, H.; Zhou, Z.; Sun, Y.; Shi, H. Propagation of meteorological to hydrological drought for different climate regions in China. J. Environ. Manag. 2021, 283, 111980. [Google Scholar] [CrossRef] [PubMed]
  29. Wang, W.; Ertsen, M.W.; Svoboda, M.D.; Hafeez, M. Propagation of Drought: From Meteorological Drought to Agricultural and Hydrological Drought. Adv. Meteorol. 2016, 2016, 6547209. [Google Scholar] [CrossRef]
  30. Wang, F.; Lai, H.; Li, Y.; Feng, K.; Tian, Q.; Guo, W.; Zhang, W.; Di, D.; Yang, H. Dynamic variations of terrestrial ecological drought and propagation analysis with meteorological drought across the mainland China. Sci. Total Environ. 2023, 896, 165314. [Google Scholar] [CrossRef]
  31. Wei, X.; Huang, S.; Li, J.; Huang, Q.; Leng, G.; Liu, D.; Guo, W.; Zheng, X.; Bai, Q. The negative-positive feedback transition thresholds of meteorological drought in response to agricultural drought and their dynamics. Sci. Total Environ. 2024, 906, 167817. [Google Scholar] [CrossRef] [PubMed]
  32. Mehran, A.; Mazdiyasni, O.; Aghakouchak, A. A hybrid framework for assessing socioeconomic drought: Linking climate variability, local resilience, and demand. J. Geophys. Res. Atmos. 2015, 120, 7520–7533. [Google Scholar] [CrossRef]
  33. Hasan, H.H.; Mohd Razali, S.F.; Muhammad, N.S.; Ahmad, A. Research Trends of Hydrological Drought: A Systematic Review. Water 2019, 11, 2252. [Google Scholar] [CrossRef]
  34. Wanders, N.; Wada, Y. Human and climate impacts on the 21st century hydrological drought. J. Hydrol. 2015, 526, 208–220. [Google Scholar] [CrossRef]
  35. Huang, S.; Li, P.; Huang, Q.; Leng, G.; Hou, B.; Ma, L. The propagation from meteorological to hydrological drought and its potential influence factors. J. Hydrol. 2017, 547, 184–195. [Google Scholar] [CrossRef]
  36. Xu, Y.; Zhang, X.; Wang, X.; Hao, Z.; Singh, V.P.; Hao, F. Propagation from meteorological drought to hydrological drought under the impact of human activities: A case study in northern China. J. Hydrol. 2019, 579, 124147. [Google Scholar] [CrossRef]
  37. Shi, H.; Zhou, Z.; Liu, L.; Liu, S. A global perspective on propagation from meteorological drought to hydrological drought during 1902–2014. Atmos. Res. 2022, 280, 106441. [Google Scholar] [CrossRef]
  38. Apurv, T.; Sivapalan, M.; Cai, X. Understanding the Role of Climate Characteristics in Drought Propagation. Water Resour. Res. 2017, 53, 9304–9329. [Google Scholar] [CrossRef]
  39. Liu, S.; Huang, S.; Xie, Y.; Huang, Q.; Wang, H.; Leng, G. Assessing the non-stationarity of low flows and their scale-dependent relationships with climate and human forcing. Sci. Total Environ. 2019, 687, 244–256. [Google Scholar] [CrossRef]
  40. Li, R.; Chen, N.; Zhang, X.; Zeng, L.; Wang, X.; Tang, S.; Li, D.; Niyogi, D. Quantitative analysis of agricultural drought propagation process in the Yangtze River Basin by using cross wavelet analysis and spatial autocorrelation. Agric. For. Meteorol. 2020, 280, 107809. [Google Scholar] [CrossRef]
  41. Herrera-Estrada, J.E.; Satoh, Y.; Sheffield, J. Spatiotemporal dynamics of global drought. Geophys. Res. Lett. 2017, 44, 2254–2263. [Google Scholar] [CrossRef]
  42. Nie, M.; Huang, S.; Duan, W.; Leng, G.; Bai, G.; Wang, Z.; Huang, Q.; Fang, W.; Peng, J. Meteorological drought migration characteristics based on an improved spatiotemporal structure approach in the Loess Plateau of China. Sci. Total Environ. 2024, 912, 168813. [Google Scholar] [CrossRef]
  43. Van Lanen, H. Drought propagation through the hydrological cycle. In Water Resource Variability: Processes, Analyses and Impacts, Proceedings of the 5th FRIEND World Conference, Havana, Cuba, 27 November–1 December 2006; IAHS Press: Wallingford, UK, 2006; Volume 308, pp. 122–127. [Google Scholar]
  44. Wu, J.; Chen, X.; Yao, H.; Liu, Z.; Zhang, D. Hydrological Drought Instantaneous Propagation Speed Based on the Variable Motion Relationship of Speed-Time Process. Water Resour. Res. 2018, 54, 9549–9565. [Google Scholar] [CrossRef]
  45. Bevacqua, A.G.; Chaffe, P.L.B.; Chagas, V.B.P.; AghaKouchak, A. Spatial and temporal patterns of propagation from meteorological to hydrological droughts in Brazil. J. Hydrol. 2021, 603, 126902. [Google Scholar] [CrossRef]
  46. Ho, S.; Tian, L.; Disse, M.; Tuo, Y. A new approach to quantify propagation time from meteorological to hydrological drought. J. Hydrol. 2021, 603, 127056. [Google Scholar] [CrossRef]
  47. Geng, G.; Zhang, B.; Gu, Q.; He, Z.; Zheng, R. Drought propagation characteristics across China: Time, probability, and threshold. J. Hydrol. 2024, 631, 130805. [Google Scholar] [CrossRef]
  48. Li, Y.; Huang, S.; Wang, H.; Zheng, X.; Huang, Q.; Deng, M.; Peng, J. High-resolution propagation time from meteorological to agricultural drought at multiple levels and spatiotemporal scales. Agric. Water Manag. 2022, 262, 107428. [Google Scholar] [CrossRef]
  49. Abbas, A.; Waseem, M.; Ullah, W.; Zhao, C.; Zhu, J. Spatiotemporal Analysis of Meteorological and Hydrological Droughts and Their Propagations. Water 2021, 13, 2237. [Google Scholar] [CrossRef]
  50. Ma, L.; Huang, Q.; Huang, S.; Liu, D.; Leng, G.; Wang, L.; Li, P. Propagation dynamics and causes of hydrological drought in response to meteorological drought at seasonal timescales. Hydrol. Res. 2021, 53, 193–205. [Google Scholar] [CrossRef]
  51. Wang, L.; Zhang, J.; Elmahdi, A.; Shu, Z.; Wu, Y.; Wang, G. Evolution characteristics and relationship of meteorological and hydrological droughts from 1961 to 2018 in Hanjiang River Basin, China. J. Water Clim. Chang. 2021, 13, 224–246. [Google Scholar] [CrossRef]
  52. Zhu, N.; Xu, J.; Zeng, G.; Cao, X. Spatiotemporal Response of Hydrological Drought to Meteorological Drought on Multi-Time Scales Concerning Endorheic Basin. Int. J. Environ. Res. Public Health 2021, 18, 9074. [Google Scholar] [CrossRef] [PubMed]
  53. Dai, M. Study on the Propagation Characteristics and Laws of Drought in Meteorology-Agriculture-Disaster Loss. Master’s Thesis, Xi’an University of Technology, Xi’an, China, 2021. [Google Scholar]
  54. Huang, S.; Liu, D.; Huang, Q.; Chen, Y. Contributions of climate variability and human activities to the variation of runoff in the Wei River Basin, China. Hydrol. Sci. J. 2016, 61, 1026–1039. [Google Scholar] [CrossRef]
  55. Zhao, P.; Lü, H.; Yang, H.; Wang, W.; Fu, G. Impacts of climate change on hydrological droughts at basin scale: A case study of the Weihe River Basin, China. Quat. Int. 2019, 513, 37–46. [Google Scholar] [CrossRef]
  56. Omer, A.; Ma, Z.; Zheng, Z.; Saleem, F. Natural and anthropogenic influences on the recent droughts in Yellow River Basin, China. Sci. Total Environ. 2020, 704, 135428. [Google Scholar] [CrossRef] [PubMed]
  57. Zhang, T.; Su, X.; Zhang, G.; Wu, H.; Wang, G.; Chu, J. Evaluation of the impacts of human activities on propagation from meteorological drought to hydrological drought in the Weihe River Basin, China. Sci. Total Environ. 2022, 819, 153030. [Google Scholar] [CrossRef] [PubMed]
  58. Wang, J.; Wang, W.; Cheng, H.; Wang, H.; Zhu, Y. Propagation from Meteorological to Hydrological Drought and Its Influencing Factors in the Huaihe River Basin. Water 2021, 13, 1985. [Google Scholar] [CrossRef]
  59. Zhou, Z.; Shi, H.; Fu, Q.; Ding, Y.; Li, T.; Wang, Y.; Liu, S. Characteristics of Propagation From Meteorological Drought to Hydrological Drought in the Pearl River Basin. J. Geophys. Res. Atmos. 2021, 126, e2020JD033959. [Google Scholar] [CrossRef]
  60. Eckhardt, K. Technical Note: Analytical sensitivity analysis of a two parameter recursive digital baseflow separation filter. Hydrol. Earth Syst. Sci. 2012, 16, 451–455. [Google Scholar] [CrossRef]
  61. McKee, T.B.; Doesken, N.J.; Kliest, J. The Relationship of Drought Frequency and Duration to Time Scales. In Proceedings of the 8th Conference on Applied Climatology, Anaheim, CA, USA, 17–22 January 1993; pp. 179–184. [Google Scholar]
  62. Wang, Y.; Chen, X.; Chen, Y.; Liu, M.; Gao, L. Flood/drought event identification using an effective indicator based on the correlations between multiple time scales of the Standardized Precipitation Index and river discharge. Theor. Appl. Clim. 2017, 128, 159–168. [Google Scholar] [CrossRef]
  63. Li, J.; Wang, Z.; Wu, X.; Xu, C.-Y.; Guo, S.; Chen, X. Toward Monitoring Short-Term Droughts Using a Novel Daily-Scale, Standardized Antecedent Precipitation Evapotranspiration Index. J. Hydrometeorol. 2020, 21, 891–908. [Google Scholar] [CrossRef]
  64. Sadeghi, S.H.; Hazbavi, Z. Spatiotemporal variation of watershed health propensity through reliability-resilience-vulnerability based drought index (case study: Shazand Watershed in Iran). Sci. Total Environ. 2017, 587–588, 168–176. [Google Scholar] [CrossRef]
  65. Jiao, W.; Wang, L.; Novick, K.A.; Chang, Q. A new station-enabled multi-sensor integrated index for drought monitoring. J. Hydrol. 2019, 574, 169–180. [Google Scholar] [CrossRef]
  66. Shukla, S.; Wood, A.W. Use of a standardized runoff index for characterizing hydrologic drought. Geophys. Res. Lett. 2008, 35. [Google Scholar] [CrossRef]
  67. Guo, Y.; Huang, S.; Huang, Q.; Leng, G.; Fang, W.; Wang, L.; Wang, H. Propagation thresholds of meteorological drought for triggering hydrological drought at various levels. Sci. Total Environ. 2020, 712, 136502. [Google Scholar] [CrossRef] [PubMed]
  68. Sklar, M. Fonctions de Répartition à n Dimensions et Leurs Marges; l’Institut Statistique de l’Université de Paris: Paris, France, 1959; Volume 8, pp. 229–231. [Google Scholar]
  69. Salvadori, G.; Michele, C.D. Frequency analysis via copulas: Theoretical aspects and applications to hydrological events. Water Resour. Res. 2004, 40. [Google Scholar] [CrossRef]
  70. Breiman, L. Random Forests. Mach. Learn. 2001, 45, 5–32. [Google Scholar] [CrossRef]
  71. Burn, D.H.; Hag Elnur, M.A. Detection of hydrologic trends and variability. J. Hydrol. 2002, 255, 107–122. [Google Scholar] [CrossRef]
  72. Umar, D.u.A.; Ramli, M.F.; Aris, A.Z.; Jamil, N.R.; Aderemi, A.A. Evidence of climate variability from rainfall and temperature fluctuations in semi-arid region of the tropics. Atmos. Res. 2019, 224, 52–64. [Google Scholar] [CrossRef]
  73. Zhao, P.; Xie, B.; Huang, X.; Qu, B. The dynamic change of propagation from meteorological drought to hydrological drought at the basin scale: A case study from the Weihe River Basin, China. Front. Environ. Sci. 2022, 10, 1054975. [Google Scholar] [CrossRef]
Figure 1. Technology roadmap.
Water 16 01999 g001
Figure 2. Geographical location of meteorological stations and hydrological stations in the WRB.
Water 16 01999 g002
Figure 3. The occurrence probability of SPI and SRI at 1–36 ten-day periods in the WRB.
Water 16 01999 g003
Figure 4. The occurrence probability of SPI and SRI at 1–36 ten-day periods in the JRB.
Water 16 01999 g004
Figure 5. The occurrence probability of SPI and SRI at 1–36 ten-day periods in the MWRB.
Water 16 01999 g005
Figure 6. PT from meteorological to hydrological drought in different scenarios in the WRB.
Water 16 01999 g006
Figure 7. PT from meteorological to hydrological drought in different scenarios in the JRB.
Water 16 01999 g007
Figure 8. PT from meteorological to hydrological drought in different scenarios in the MWRB.
Water 16 01999 g008
Figure 9. Probability of occurrence from meteorological drought to hydrological drought at PT.
Water 16 01999 g009
Figure 10. SPI and SRI function fitting and conditional probability curve.
Water 16 01999 g010
Figure 11. The threshold of hydrological drought triggered by meteorological drought at probability 0.7.
Water 16 01999 g011
Figure 12. Dynamic change in PT from meteorological to hydrological drought.
Water 16 01999 g012
Table 1. Drought classification of SPI and SRI.
LevelClassificationSPI ValueSRI Value
1Mild drought−1 < SPI ≤ −0.5−1 < SRI ≤ −0.5
2Moderate drought−1.5 < SPI ≤ −1.0−1.5 < SRI ≤ −1.0
3Severe drought−2.0 < SPI ≤ −1.5−2.0 < SRI ≤ −1.5
4Extreme droughtSPI ≤ −2.0SRI ≤ −2.0
Table 2. Trends in the annual drought PT.
Meteorological Drought LevelPropensity RateM-K ValueTrend
WRBModerate−0.01−0.18
Severe−0.03−1.46
Extreme−0.02−1.78
JRBModerate0.053.58↑ **
Severe0.053.90↑ **
Extreme0.032.01↑ *
MWRBModerate0.125.26↑ **
Severe0.053.99↑ **
Extreme0.032.06↑ *
Note: One or two stars represent significance at 95% and 99% confidence level, respectively.
Table 3. Trends in drought propagation time in different seasons.
Meteorological
Drought Level
SpringSummerAutumnWinter
WRBJRBMWRBWRBJRBMWRBWRBJRBMWRBWRBJRBMWRB
ModeratePropensity−0.080.030.190.040.040.000.000.030.03−0.010.090.03
M-K value−0.811.072.591.991.960.28−1.072.512.21−0.032.804.85
Trend↑ **↑ *↑ *↑ *↑ *↑ **↑ **
SeverePropensity−0.100.070.060.030.010.01−0.020.000.00−0.020.100.15
M-K value−2.641.46−0.073.952.351.08−5.21−1.15−1.41−1.313.354.43
Trend↓ **↑ **↑ *↓ **↑ **↑ **
ExtremePropensity−0.100.060.000.030.010.01−0.02−0.010.00−0.010.070.13
M-K value−3.510.99−2.214.032.331.23−3.77−3.01−1.68−1.123.434.37
Trend↓ **↓ *↑ **↑ *↓ **↓ **↓ *↑ **↑ **
Note: One or two stars represent significance at 95% and 99% confidence level, respectively.
Table 4. Simulation and evaluation of PT from meteorological drought to hydrological drought in Random Forest model.
Meteorological
Drought Level
SpringSummerAutumnWinter
NSER2NSER2NSER2NSER2
ModerateWRB0.890.960.780.940.830.950.820.95
JRB0.860.950.820.930.850.950.780.90
MWRB0.870.960.780.940.830.940.910.96
SevereWRB0.890.960.780.910.820.940.810.94
JRB0.880.960.820.940.740.950.810.92
MWRB0.870.960.800.950.730.900.880.95
ExtremeWRB0.920.960.750.910.770.950.810.93
JRB0.910.970.840.950.770.930.780.91
MWRB0.840.950.800.970.770.920.910.96
Table 5. Importance score of driving factors on transmission time of moderate drought.
SeasonsBasinPrecipitationVPDSoil MoistureBase Flow
SpringWRB7.265.613.246.94
JRB2.986.332.062.79
MWRB4.677.813.551.43
SummerWRB0.113.840.416.29
JRB0.738.222.062.84
MWRB3.753.310.777.02
AutumnWRB3.194.332.675.16
JRB2.955.241.835.85
MWRB2.444.190.714.78
WinterWRB6.756.990.330.09
JRB2.267.041.080.14
MWRB4.1914.640.992.63
Table 6. Importance score of driving factors on transmission time of severe drought.
SeasonsBasinPrecipitationVPDSoil MoistureBase Flow
SpringWRB7.045.240.793.87
JRB7.6710.370.122.59
MWRB3.886.860.791.43
SummerWRB3.527.102.171.59
JRB1.137.730.120.60
MWRB4.251.760.052.83
AutumnWRB6.165.601.091.05
JRB1.190.905.080.64
MWRB0.261.720.702.44
WinterWRB7.335.950.150.29
JRB3.4110.430.740.52
MWRB4.1914.640.992.63
Table 7. Importance score of driving factors on transmission time of extreme drought.
SeasonsBasinPrecipitationVPDSoil MoistureBase Flow
SpringWRB7.5312.240.271.06
JRB9.258.421.952.42
MWRB3.584.830.320.45
SummerWRB1.847.010.662.21
JRB0.448.920.740.69
MWRB3.352.310.513.79
AutumnWRB3.074.601.430.30
JRB2.123.250.070.09
MWRB2.070.453.111.42
WinterWRB6.334.851.570.00
JRB0.027.890.090.46
MWRB3.7113.240.882.42
Disclaimer/Publisher’s Note: The statements, opinions and data contained in all publications are solely those of the individual author(s) and contributor(s) and not of MDPI and/or the editor(s). MDPI and/or the editor(s) disclaim responsibility for any injury to people or property resulting from any ideas, methods, instructions or products referred to in the content.

