Article

New Frontiers in Water Distribution System Management and Monitoring: First Development of a Water Safety Plan Based on Heritage Building Information Modeling (HBIM) in Neptune Fountain, Bologna, Italy

by
Maria Rosaria Pascale
1,2,
Domenico Simone Roggio
3,
Ester Barbieri
3,
Federica Marino
1,
Carlo Derelitto
1,
Luna Girolamini
1,
Cristiana Bragalli
2,3,
Gabriele Bitelli
2,3 and
Sandra Cristino
1,*
1
Department of Biological, Geological, and Environmental Sciences, University of Bologna, via San Giacomo 12, 40126 Bologna, Italy
2
Department of Civil, Chemical, Environmental and Materials Engineering, University of Bologna, Viale del Risorgimento 2, 40136 Bologna, Italy
3
Interdepartmental Centre for Industrial Research in Building and Construction, University of Bologna, Via del Lazzaretto 15/5, 40131 Bologna, Italy
*
Author to whom correspondence should be addressed.
Water 2024, 16(15), 2075; https://doi.org/10.3390/w16152075
Submission received: 25 June 2024 / Revised: 18 July 2024 / Accepted: 21 July 2024 / Published: 23 July 2024

Abstract

:
The World Health Organization (WHO) recommends the introduction of a water safety plan (WSP) approach on drinking water, in all types of settings. This study represents the first WSP developed on the Neptune Fountain, in Bologna (Italy), based on an interdisciplinary approach, integrating hydraulic and microbiological features, in a Building Information Modeling (BIM). The aim was to develop a dynamic and digital platform to update and share the maintenance program, promoting collaboration among microbiologists, engineers, and municipal staff. Water samples were collected along fountain water distribution systems (WDS) from 2016 to 2021 to monitor water quality through the heterotrophic bacteria at 22 °C and 37 °C, as well as to conduct an Enterococci, Coliform bacteria, Escherichia coli, Pseudomonas aeruginosa, Clostridium perfringens, and Staphylococcus aureus assessment. Simultaneously, hydraulic measures were performed, and advanced geomatics techniques were used to detect the WDS structural components, with a focus on the water treatment system (WTS). The WTS consisted of 10 modules corresponding to specific treatments: descaling, carbon–sand filtration, reverse osmosis, and ultraviolet disinfection. Fecal indicators, heterotrophic bacteria, and P. aeruginosa exceeded the reference limits in most of the modules. Several disinfections and washing treatments, other than changing the maintenance procedure scheduling, were performed, improving the WTS and controlling the contamination. The developed microbiological results, hydraulic measurements, and maintenance procedures were integrated in the BIM model to optimize the data storage, updating procedures and the real-time data sharing. This approach improved the fountain management, operation, and material conservation, ultimately preserving the health of daily visitors.

1. Introduction

The evaluation of water quality intended for human consumption is a critical issue in public health. Physical, chemical, and microbiological characteristics are the parameters used to define a good water quality that does not pose a risk to human health [1,2,3]. Both natural and human processes frequently impact water quality [4]. Considering the dangerous effects of waterborne diseases and their prevalence, the role of its quality assumes a high global significance [5,6,7,8].
Water supplies provided to consumers need to be in compliance with the quality standards established by national and international directives. Legislative Decree No. 18 February 23 currently represents the Italian reference directive, which implements the European Directive (EU) 2020/2184. The Water Safety Plan (WSP) approach was introduced for the first time by the World Health Organization (WHO) in 2008 and represents the directive focus. It is a model of risk assessment and management applied from surface and groundwater caption to consumer outlets along the whole water distribution system (WDS) [9,10]. This approach ensures water quality in terms of organoleptic, physical, chemical, and microbiological characteristics, as well as assessing risk reduction methods. One advantage of the WSP approach is the promotion of monitoring strategies to assess and maintain water quality continuously. WDSs can thus be viewed as more than just a hydraulic infrastructure, but also as a complex and dynamic environment influenced by a variety of hydraulic or biological factors. The integrity and proper management and maintenance of the WDS are fundamental for ensuring high water quality available at the supply points, but the latter is often overlooked. Moreover, there is usually a shortage of accurate documentation (e.g., operation and maintenance plans) compliant with the current state, especially for older WDSs.
Public fountains represent one of the main key attractions of parks and squares with water games and splashes since they provide a creative space for people and animals that can be two of the biggest contributors to water pollution [11].
Unlike water intended for human consumption and water in bathing places, there are no definite references for water-quality standards in the context of ornamental fountains.
Patently, the water present in ornamental fountains must not be drunk, but its quality is essential for human health due to the potential contact with people. At the same time, the impact of the water quality on the materials used to build the fountains must be considered for the conservation of the monumental heritage.
Regarding the WDS, when the circulating water flow rate assumes significant values, closed water systems can be introduced to avoid excessive use of water resources. However, it can potentially increase the possibility of the WDS becoming an ideal environment for microorganism growth [11,12]. Legionella spp., Giardia, Staphylococcus aureus, Salmonella spp., and E. coli have been found in fountain water [12,13,14,15,16,17,18]. Furthermore, low water flow, dead branches, or old pipelines, as well as WDS layout and pipe materials, often contribute to biofilm formation becoming a risk for pathogenic microorganisms’ proliferation and dissemination [19,20,21,22].
For the ornamental fountain, this risk is intensified by the climate change impact. High humidity, temperature variations, wind, and rain, as well as animals and their interaction with the different materials and components present in the fountains, can damage the water quality [16,23].
Starting from this state-of-the-art study, this work focused on the artistic heritage context of the ornamental fountains, which can be found in public locations or in important private residences. Throughout the centuries, numerous monumental fountains have been built, and they are considered architectural, as well as artistic and hydraulic engineering masterpieces. Monumental fountains are composed of statues made of a variety of materials, as well as spectacular water features that recreate magnificent scenes.
Moreover, in the Renaissance period, the presence of water in urban fountains had both an aesthetic and a sanitary purpose, providing high-quality water in areas where rivers or canals could be degraded [24,25]. These reasons have favored the historic fountain function as an identification element and emblem in many cities.
Appropriate monitoring and maintenance measures should be applied and implemented to safeguard and maintain fountains with high historical and cultural significance. Conservation strategies include actions such as adding or replacing protective coatings, cleaning the fountain structure, and monitoring water quality [26].
Monumental fountain magnificence is the result of a combination of good hydraulic functionality and high water quality, but this goal is not easy to achieve. The microorganism presence in a WDS is linked to hydraulic parameter failures, a lack of understanding of its layout, and the absence of treatment plans. These issues become critical during environmental surveillance and risk-assessment programs due to the lack of precise and up-to-date layouts, resulting in limited knowledge about their structure and operation. This feature pertains specifically to aged systems that change over time without accurate documentation of their current status. Furthermore, to the best of our knowledge, there are no guidelines or legislative references for monitoring fountains. Therefore, they are generally assimilated to water intended for human consumption. To address these challenges, integrating structural data and management information into a 3D model represents a solution to the limited plant engineering knowledge. This approach combines qualitative and quantitative assessments at both system and component levels, resulting in a dynamic model able to develop through the incorporation of engineering and microbiological insights.
It is well known that with Building Information Modeling (BIM), it is possible to create a 3D-integrated model to generate and manage all information on construction processes for structures, infrastructures, and industrial installations. BIM is a methodology designed to optimize the construction by facilitating the processing and communication of information regarding the model to all the professionals and tools involved in the project study, understanding, and management. This methodology enables the elaboration of a digital model containing information on the whole life cycle of the project, which is not a simple 3D representation but a dynamic, interdisciplinary, and shared informational model [27,28].
The focus of this study was the application of Heritage Building Information Modeling (HBIM) to elaborate an appropriate WSP to the WDS of Neptune Fountain, the identity symbol of the Bologna city.
HBIM methodology is widely applied to existing heritage and permits the optimization of the management and maintenance, as well as the conservation, of previously built work [29,30].
More specifically, a scan-to-BIM approach was used for this study. This approach is based on 3D data acquisition to produce accurate dense point clouds, which are later processed to generate a high-precision BIM model, and the two widely used techniques in the 3D acquisition process are photogrammetry and 3D scanning, based on laser equipment or other technologies [31,32].
The suggested approach integrates the study of hydraulic and microbiological water parameters, preserving the system functionality, and it represents the first application of a WSP to a fountain with high historical and symbolic value in line with the requirement of the new European directive 2020/2184 on water for human consumption indications [3].
The approach provided in this study allowed better WDS management and maintenance, supporting the Fountain conservation and operation over time, other than to preserve human health.

2. Materials and Methods

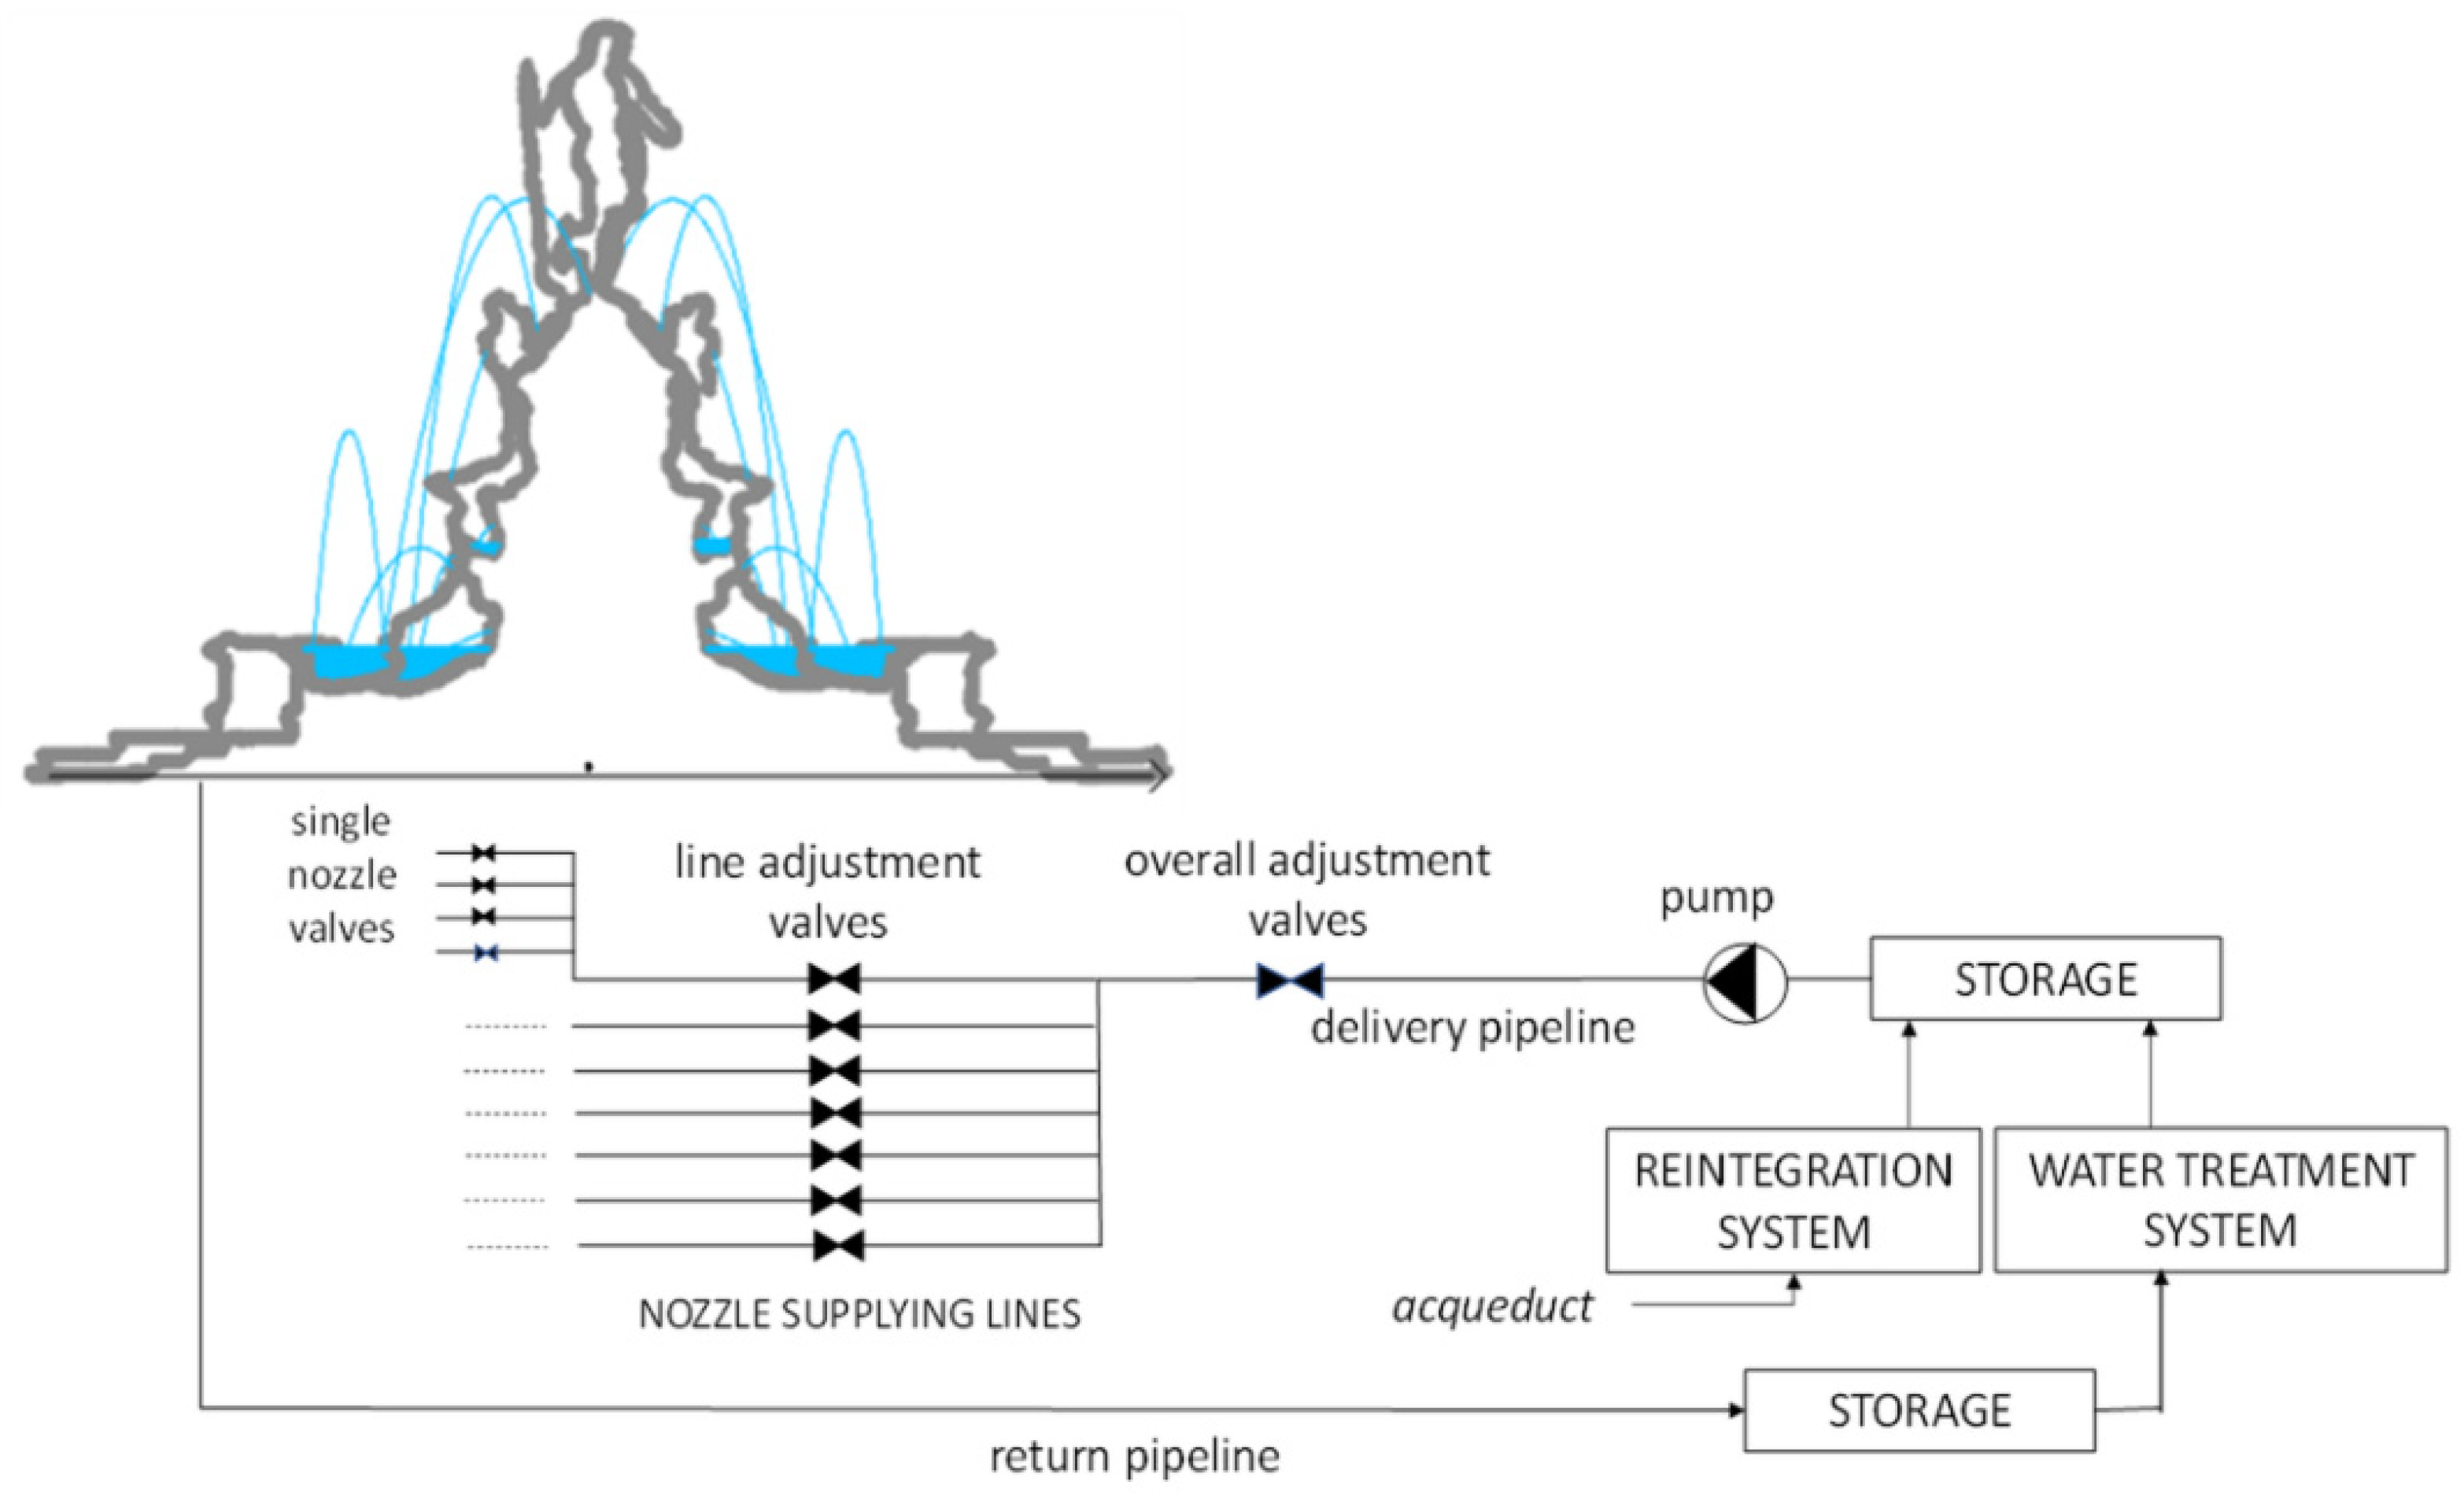
2.1. The Case Study: The Neptune Fountain

The Neptune Fountain, located in the heart of Bologna (Italy), is one of the city’s most iconic symbols, beloved by both residents and visitors (Figure 1). The fountain is a stunning Renaissance work commissioned by Pope Pius IV, a result of the collaboration between the architect Tommaso Laureti and the sculptor Giambologna, who built the fountain to symbolize the generosity of Pius IV’s good papal government [33,34,35]. The fountain presents a square symmetrical structure and sits on three steps, above which is the main marble basin. The monument rises from the basin center, with several groups of bronze figures (dolphins, sirens, heraldic coats of arms, cherubs) and decorations with papal emblems at the base, and the majestic and imposing Neptune figure, approximately 320 cm high, placed on the top of the castellum. The fountain is characterized by the presence of 38 nozzles that emerge from the bronze sculptures, creating a unique water play that adds to the monument’s splendor [33].
The water is the vital and dynamic component of the fountain, and, at the same time, it is the primary deterioration cause along the time of stone and bronze, together with environmental factors. Furthermore, water provides an ideal environment for bacterial and algae growth, which are linked with biofilm formation on the fountain’s surface. These issues have affected the Neptune Fountain over time, leading to several restorations. The most recent was completed in 2017 and supported by the Municipality of Bologna, some companies, and citizens. The restoration was coupled with a very accurate 3D survey of the fountain, which also served to document the restoration activities in a very innovative way [36]. During this restoration, in addition to the activity on the marbles and bronzes, the Fountain WDS and the associated Water Treatment System (WTS), located in an underground area of the adjacent d’Accursio Palace, were completely replaced.

2.2. Neptune Fountain Water Treatment System

Before the last restoration, which started in July 2016 and finished in December 2017, the WTS was based on a simple reintegration and recirculation water system. In brief, there was a water entry point from the municipal aqueduct to replace the volume lost during the Fountain operation, mainly due to evaporation and the main basin’s lack of water tightness. The water passed via a water softener directly into a storage tank and then pumped directly to the fountain. The water returning from the fountain through a pipeline was treated by a sand filter system before entering the storage tank. Chlorination was performed manually in the plastic storage tank, as well as directly in fountain’s basin. At the time of the restoration, the water recirculation system was completely degraded. Therefore, it was impossible to obtain information about Fountain WDS layout and operation, and only through site surveys was it possible to trace back, more or less, the initial scheme and its operation.
The restoration, for the first time, focused on the replacement of the looped WDS and the development of a new WTS.
The current operation overall scheme of the Neptune Fountain is presented in Figure 2. The WTS and reintegration systems (RS) supply water to the water tank, which is then fed into the Fountain’s pipeline via two pumps. The main pipeline is then divided into seven nozzle supply lines, each of which produces four symmetrical nozzles on the fountain’s four sides, with the exception of the highest and most scenic nozzle, which is located at the foot of the Neptune statue. Regulation valve, line adjustment, and single nozzle valves allow for the regulation of the trajectories of the 38 jets so as to reproduce the overall design of the water conceived by Laureti in 1563 [33]. For this aim, the overall design flow rate assessed for the fountain during the restoration is equal to 2.35 L/s.
The contribution and interaction of WTS and RS allow the water to recirculate within the fountain (Figure 2).
Inside the WDS Fountain, the separation between WTS and RS clearly permit the distinguishment of the treatments that the water receives. The water circulating through the WTS comes directly from the fountain, and it is filtered and treated to reduce bacterial contamination before being returned to the fountain. RS reintegrates the lost volumes of water, receiving water from the municipal aqueduct, which is treated to reduce the salt concentration through filtering systems and a reverse osmosis treatment, thus reducing the residual chlorine initially present.
The current WTS and RS layout with the indication of the components are reported in Figure 3.
More specifically, incoming water from Neptune’s Fountain (A) is coarsely filtered by a rotary screener (B) before being routed in two storage tanks (C1–C2) for the decantation step. The rotary screener B has a maximum flow rate of 18 m3/h, while the two storage tanks (C1–C2) are connected in parallel and are made of polyethylene with a capacity of 1600 L each.
The two pumps (D) pressurize the system by drawing water from the storage tanks (C1–C2) and passing it through self-cleaning filters (E) of 100 µm porosity with a flow rate at ΔP = 0.2 bar of 25 m3/h and at ΔP = 0.5 bar of 30 m3/h. Filters (E) minimize water turbidity by retaining the solid components of the water in the cartridge, while the heavier parts fall in the filter storage vessel. The two pumps (D) must also provide the flow rate and pressure required for the operation and cleaning of the three in series sand filters (F1–F2–F3). The operation of the parallel pumps (D) is conditioned by the level in the storage tanks (C1–C2) and the pressure setting at the outlet.
The nominal operational flow rate of filters (F1–F2–F3) is 5 m3/h, and they provide filtration and minimize turbidity and suspended substances in general by means of multiple mineral layers of granular anthracite and silica sand.
The water is then moved into three polyethylene storage tanks (G1–G2–G3), each having a capacity of 2000 L and connected in parallel. Floats are used in both storage tanks (C1–C2) and (G1–G2–G3) to monitor the minimum required level for pump operation and protection. From the storage tanks (G1–G2–G3), two pumps (H) drive water to a UV lamp treatment (I) at 254 nm and 400 J/m2, which is the maximum bactericidal capacity. Water is then directed across the main pipelines to the fountain (L).
RS integrates water loss through evaporation, filter washing, and possible leakages. A float in the storage tanks (G1–G2–G3) monitors the activation of the water reintegration system when the float signals a water level below the set for the pump’s operation. This fills the storage tanks (G1–G2–G3) with pure, osmotic water, restoring the water to a sufficient volume to ensure the operation of the fountain. Moreover, this process allows for the recirculation of water replacement times to be kept under control.
The water that comes from the municipal aqueduct (M) is dechlorinated using two parallel mixed media filters (N1–N2) composed of silica sand and mineral granular-activated carbon layers. They have an operational flow rate of 3.5 m3/h. Water is then filtered with a series of cartridge filters (O) installed in parallel with a porosity of 5 µm with a maximum flow rate of 4.8 m3/h and purified using the reverse osmosis process (P). The presence of a reverse osmosis system in RS deprives the water of salts and traces of organic chemicals to prevent the deterioration of bronze and marbles. Furthermore, osmotic membranes reduce the microbial presence, preventing contamination of the produced osmotic water [37]. At this level, there is also a by-pass valve (v) that permits water reintegration with only osmosis-treated water or with a mixture of osmosis-treated and dechlorinated water. The osmotic water is then collected in storage tanks (G1–G2–G3), where it is mixed with water that has been filtered through the three sand filters (F1–F2–F3) and then treated with a UV lamp (I) to be sent to the fountain.
Moreover, to clean the sand filters (F1–F2–F3), twice a week, an automatic and programmed backwash is scheduled using the water taken from storage tanks (G1–G2–G3). The latter is a mix of osmotized water from RS and water filtered by the same sand filters (F1–F2–F3). When the backwashing phase is finished, wastewater is discharged into the sewer (S) (purple pipelines in Figure 3). The washing cycle lasts 15 min, while the needed flow rate is 6.8 m3/h. Thus, the required amount of water is 1.7 m3. The required flow rate for each sand filter’s scheduled backwashing is provided by the two pumps (H). As a result, these pumps play an important role also in the hydraulic operation of the UV lamp in regulating the trajectory of the water that comes out of the 38 nozzles in the fountain and in washing the individual sand filters (F1–F2–F3).

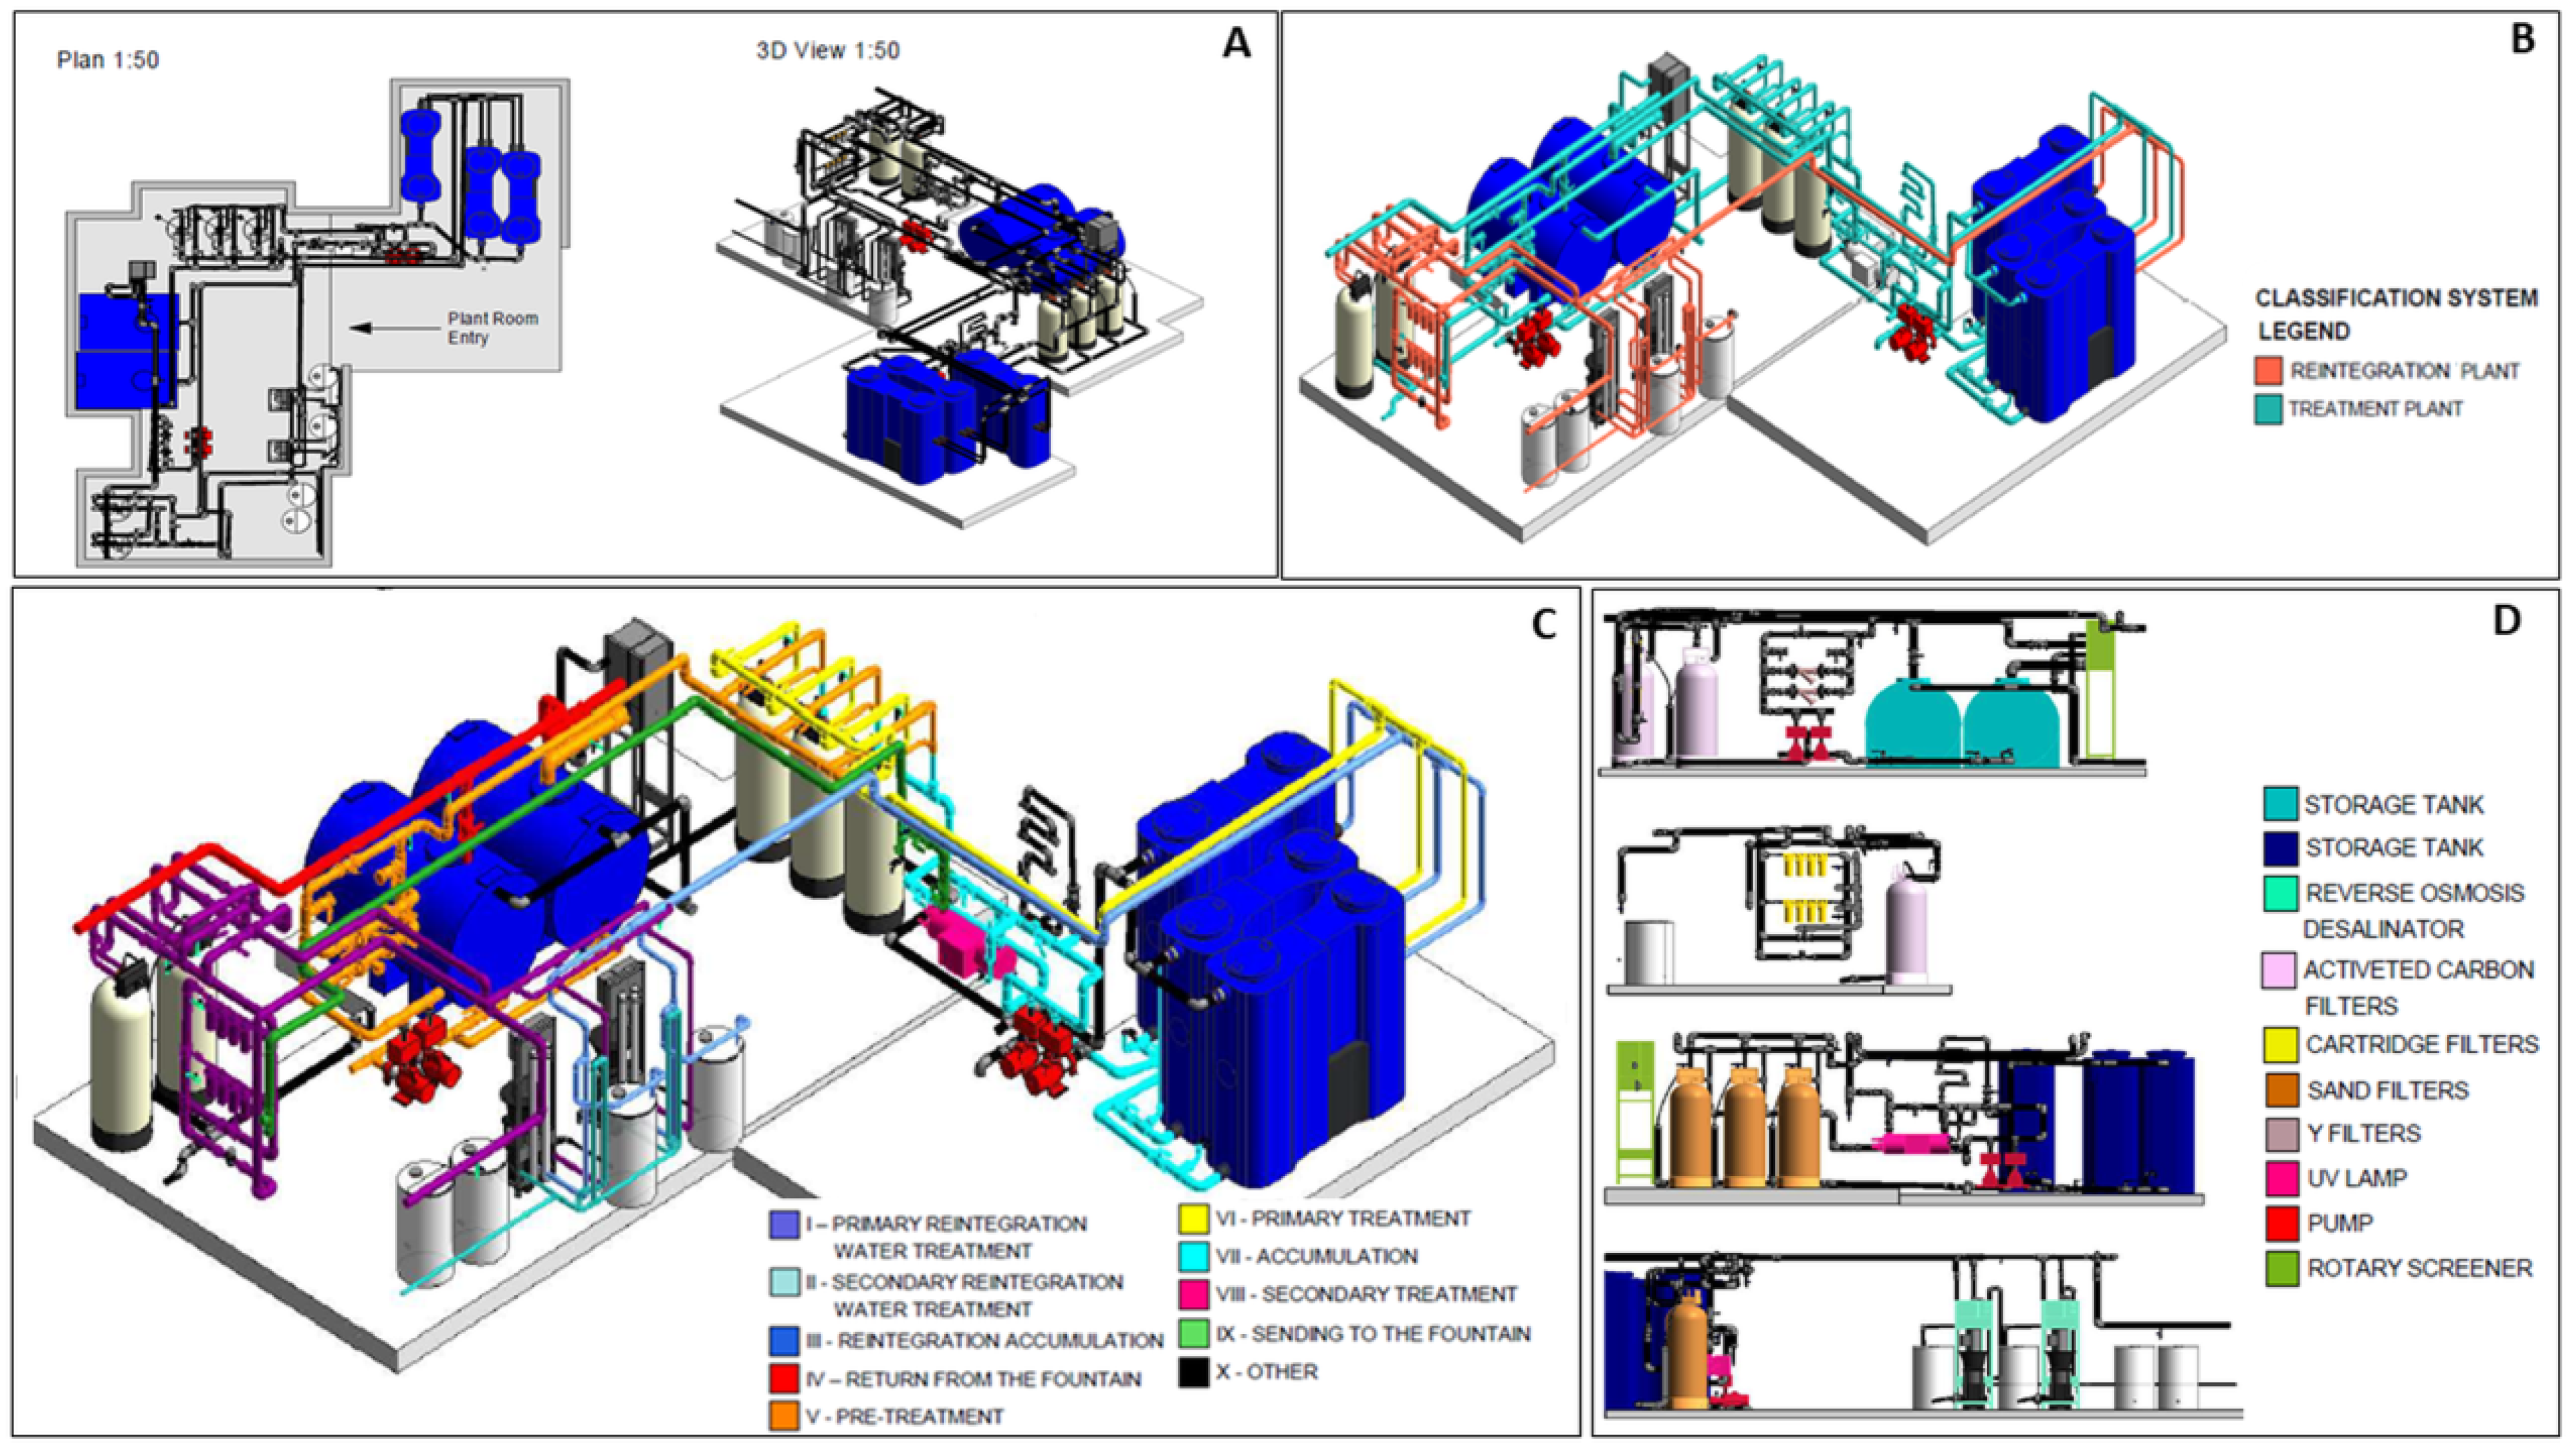
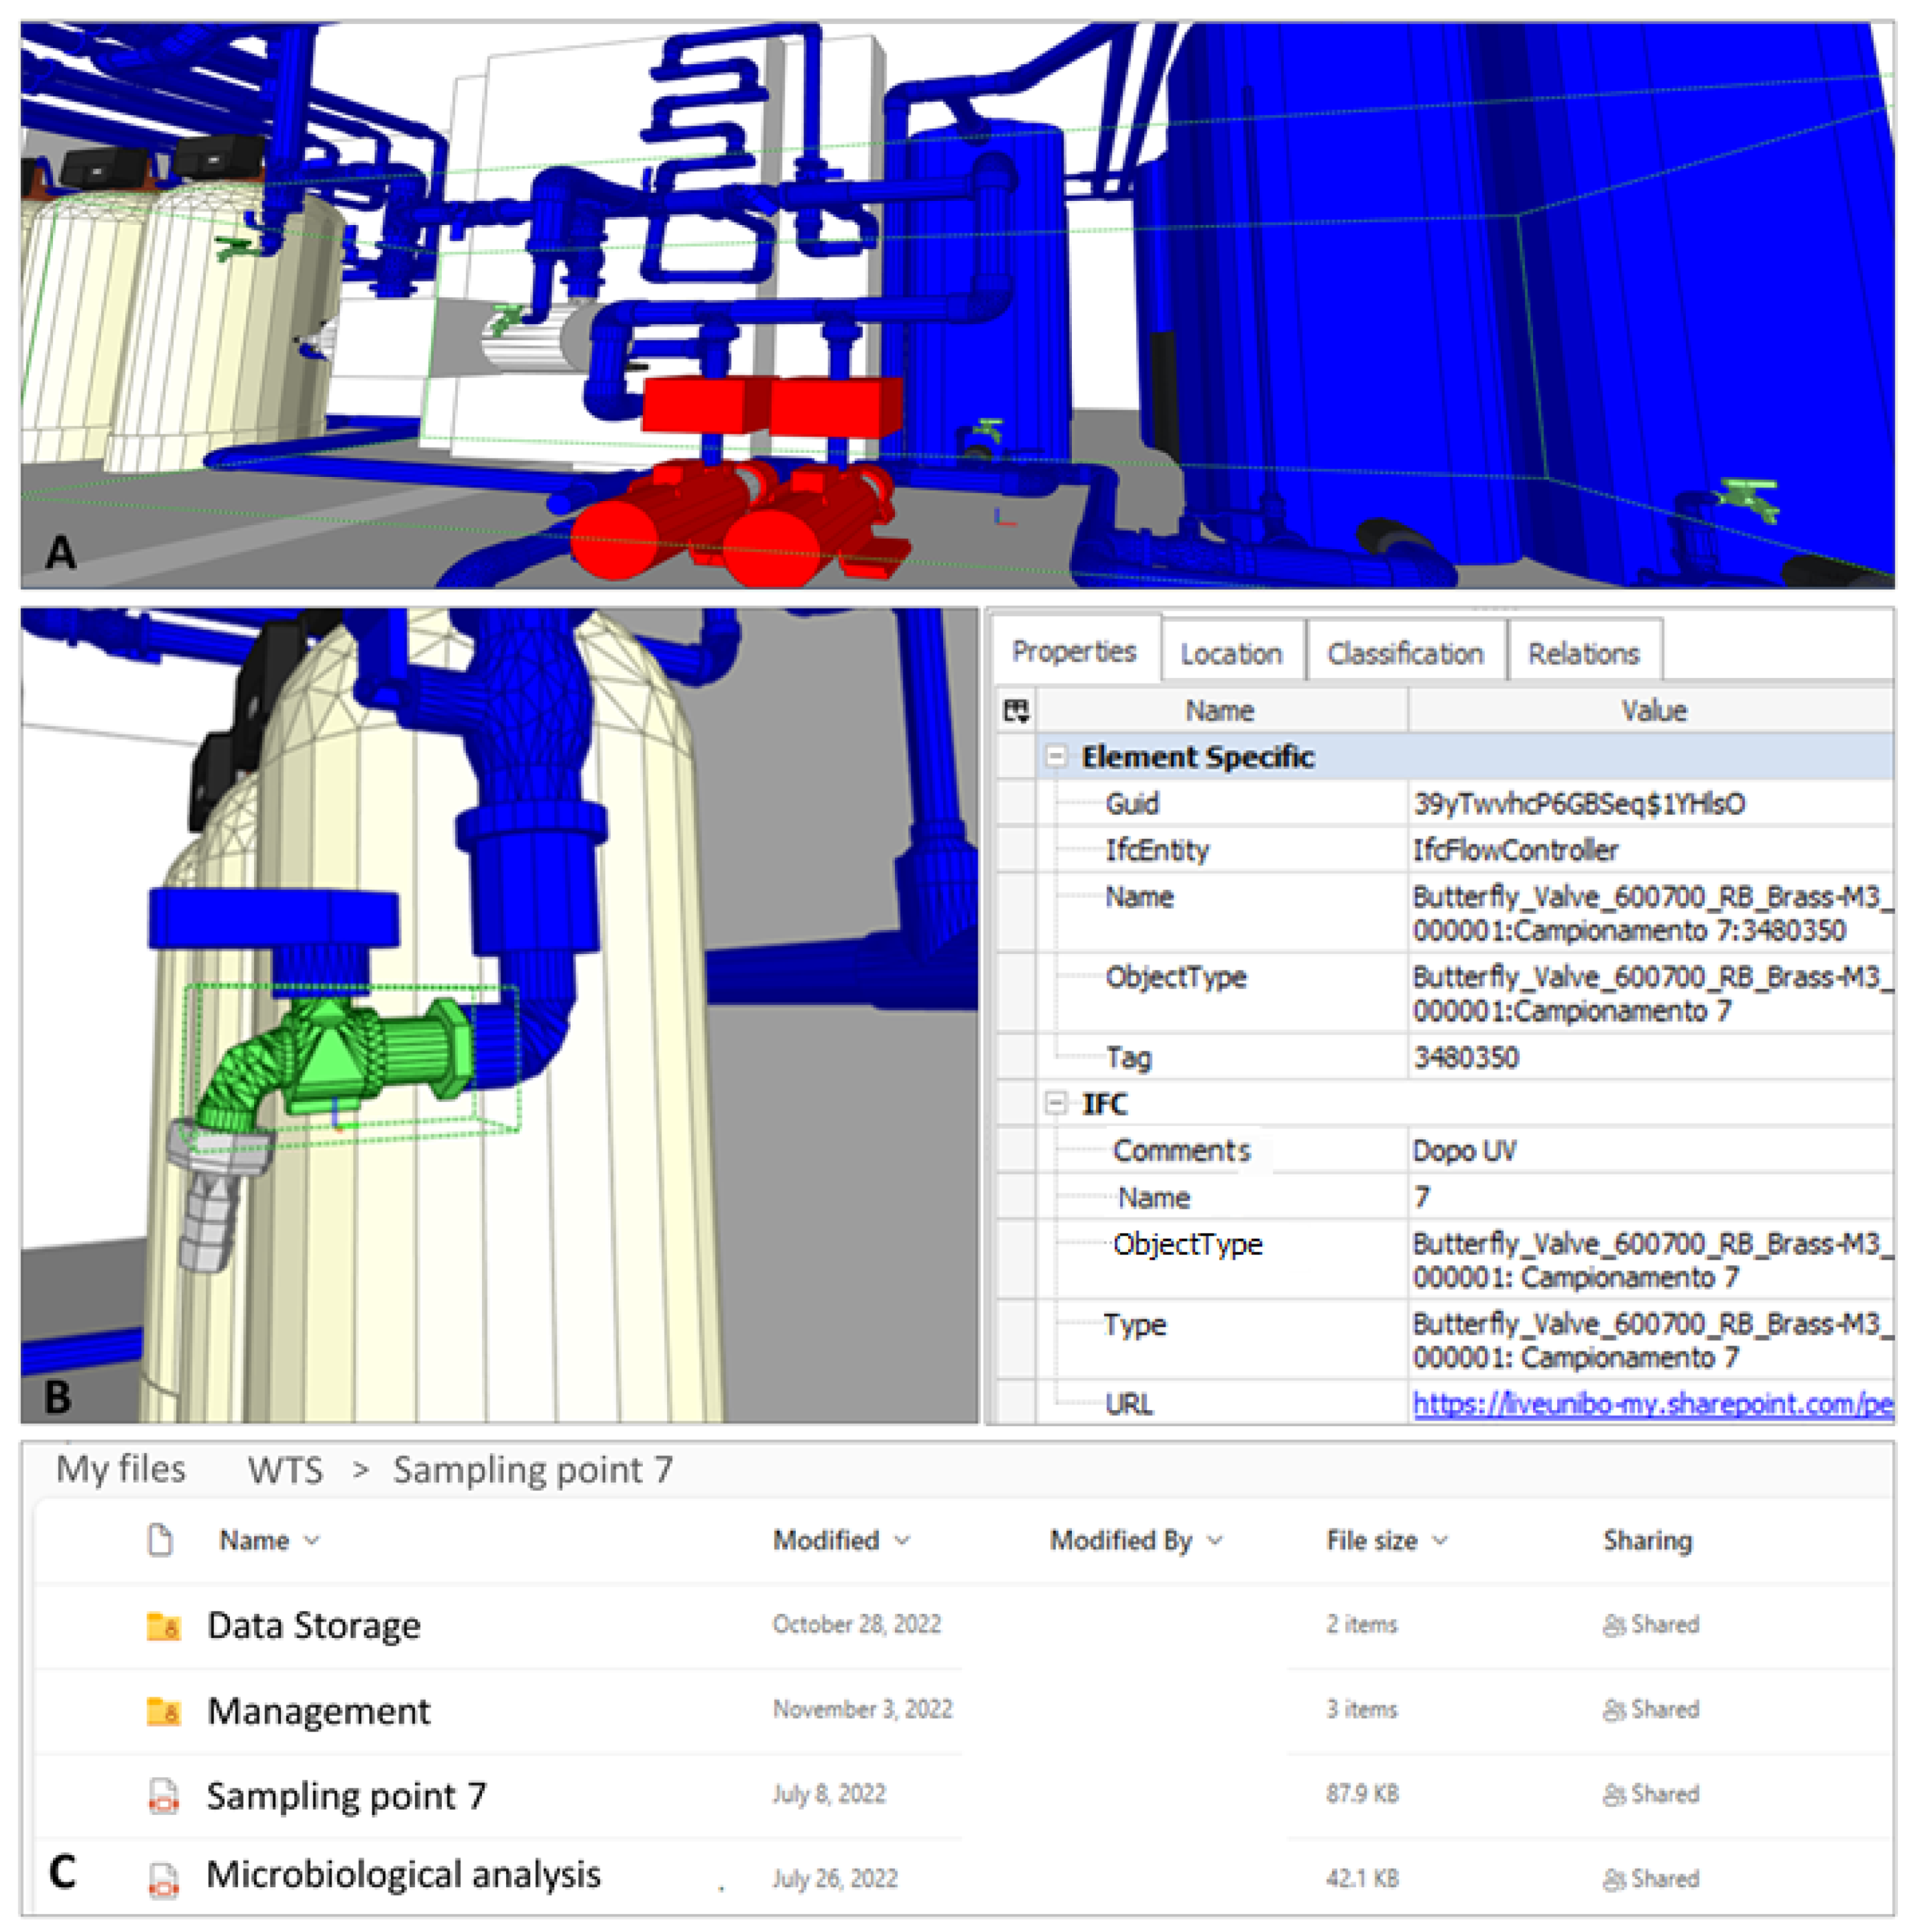
2.3. Water Treatment System 3D Model Acquisition

The WST and RS layout displayed in Figure 3 do not really represent a dynamic environment able to contain the overall multidisciplinary information useful for monitoring the operation of WDS Fountain but represents only a schematic representation of the system.
For a methodological advancement, scan-to-BIM approach was used to develop an “as-built” model starting from a 3D data survey of the WST and RS that covers about 35 m2. The survey was performed using a structured light-projection volumetric scanner to detect the geometry, while the RGB data were derived from a digital photogrammetry survey. The Mantis Vision’s F6 Smart is a hand-held scanner that works in near-infrared wavelength (NIR), and it can acquire approximately eight frames per second (60,000 points per frame). The scanner was used to generate five-point clouds from about 5500 frames. The RGB data were obtained using a Sony DSC-RX100M7 digital compact camera (Tokyo, Japan), with which 224 images were captured with nadiral and convergent schemes. Thirty-six targets were distributed around the plant room to support the photogrammetric process, conducted with a multi-view structure-from-motion method, and to permit the data fusion with the scanner-derived dataset.
The post-processing allowed for an accurate geometric model coupled with RGB information to be obtained (Figure 4). The output model was a textured mesh that accurately represents the WST and RS with a point cloud data resampled by setting the average point spacing to 2.5 mm.
For the integration of the information related to each component of WST and RS and to be able to produce useful documentation for its management, it was decided to use the obtained model as the basis for subsequent BIM modeling. For the application of the scan-to-BIM approach and better management during BIM geometric restitution, the textured mesh was converted into a point cloud data resampled by setting the average point spacing to 2.5 mm.
Subsequently, the point cloud was linked to Revit Hotfix (Autodesk Ink., version 2021.1.1) through ReCap Pro 2021.1 Hotfix software(.rcs format) (Figure 4A). For more efficient modeling, in terms of accuracy and timing, a dedicated plug-in FARO as-Built for Autodesk Revit was used to model the components. The plug-in, for example, through semi-automatic element recognition algorithms, suggested the corresponding BIM object with the best fit by clicking it directly on the point cloud overlaying the BIM object with its corresponding one in the point cloud model (Figure 4B). The result of geometric modeling from the 3D point cloud model was a highly accurate HBIM model with an average tolerance of a few millimeters (Figure 4C).

2.4. Identification of Microbiological and Hydraulic Sample Points on Water Treatment System

Sampling points were chosen to analyze the efficacy of each treatment stage (e.g., filters, osmosis, and UV lamp) related to the microbiological contamination and degradation of the materials. Moreover, samples were taken from the Fountain’s basin to control the level of contaminants that could be aerosolized or come in contact with people.
At the same time, hydraulic measures on WTS, such as water flow and pressure, were monitored to control its functionality, with a particular focus on pump operation and the water sent to the fountain.
The microbiological (n = 19) and hydraulic (n = 6) sampling points identified on WTS and their description are listed in Table 1 and reported in Figure 5, coherently with WTS description shown in Figure 3.

2.5. Water Sample Collection and Microbiological Analysis

Samples for the microbiological analysis were collected according to Italian National Unification and European Committee (UNI EN) International Standard Organization (ISO) 19458:2006 [38] for a total volume of 500 mL into sterile polytetrafluoroethylene (PTFE) bottles.
In addition, the chlorine residues for each sample were determined to control the disinfectant level conducted from municipal water. Total and free chlorine levels were measured using a chlorometer (OrbecoHellige, Inc., 6456 Parkland Drive, Sarasota, FL, USA, Mini Analyst, Series 942, Model 942-001) and expressed in mg/L. Water temperature (°C) was measured for all samples using a digital thermometer coupled with a liquid thermistor probe (XS Temp 7 Vio PT 100 Thermometer from −200 to +999 °C; Eutech Instruments Pte Ltd., Singapore).
Other chemical parameters (e.g., pH, electrical conductivity, major anions) were not analyzed as they were not required for the self-control monitoring conducted on the fountain.
Before the restoration (2016), there were no data about water quality due to the missing WDS-monitoring program. As a consequence, the first sampling program started in 2018.
Starting from the restoration, a monitoring program with one sampling per year was implemented for the first time. In December 2018, the first set of analyses was performed to test the new WTS and RS. Unfortunately, due to the extraordinary maintenance program on marbles and bronzes, other than the overdue pandemic SARS-CoV-2 event, the sampling program between 2019 and 2020 was skipped. Three different samplings (S) were performed in 2021: in spring (S1), in autumn (S2), and in the presence of non-compliance results, the sampling was repeated to evaluate the effectiveness of measures (ordinary and extraordinary) undertaken (S3).
On the other side, microbiological parameters were assessed according to Italian Legislative Decree 31/2001 [1], and the subsequent implementation, Directive (EU) 2015/1787 transposed with the Italian Decree dated 14 June 2017 [39], was put into effect during the study. Both of them required testing water for the presence and enumeration of the following parameters: heterotrophic plate count bacteria (HPC) were able to grow at a temperature of 22 °C and 37 °C, as well as pathogenic bacteria such as Enterococci, Pseudomonas aeruginosa (P. aeruginosa), fecal coliform bacteria, Escherichia coli (E. coli), Clostridium perfringens (C. perfringens), and Staphylococcus aureus (S. aureus). HPC at 22 °C and 37 °C were expressed as colony-forming units (cfu)/mL, while all the other pathogenic bacteria were expressed in cfu/100 mL.
The HPC at 22 °C and 37 °C, Enterococci, P. aeruginosa, E. coli, and C. perfringens are mandatory parameters, while S. aureus contamination is considered an accessory indicator parameter that was added considering the high exposure of visitors to water [40].
Regarding the analytical methods, HPC at 22 °C and 37 °C were performed using the standard plate method on tryptic glucose yeast agar (Plate Count Agar, PCA; Biolife, Milan, Italy) [41]. The other microorganisms were determined using the standard membrane filter technique, using cellulose nitrate membrane with 0.45 µm pore size (Sartorius Italy S.r.l., Firenze, Italy), according to the standard techniques UNI EN ISO for each parameter. Slanetz Bartley Medium (Enterococcus Agar) (Thermo Fisher Scientific, Diagnostics, Ltd., Basingstoke, UK) was used for Enterococci [42]; Pseudomonas C-N Selective Agar (Cetrimide Agar) (Thermo Fisher Scientific, Diagnostics, Ltd., Basingstoke, UK) was used for P. aeruginosa [43]; Chromogenic Coliform Agar (CCA) (Thermo Fisher Scientific, Diagnostics, Ltd., Basingstoke, UK) was used for E. coli and coliform bacteria, [44]; m-CP Selective Agar (Thermo Fisher Scientific, Diagnostics, Ltd., Basingstoke, UK) was used to perform the C. perfringens analysis [45]. In absence of reference method to test S. aureus, the chromogenic medium BrillianceTM Staph 24 Agar was used.
The results were referred to respective legislative limits: 100 and 20 cfu per 1 mL for HPCs at 22 °C and 37 °C, respectively. The reference limit for other parameters was 0/100 mL. Negative samples were considered those in compliance with the regulatory limits.
All the suspected colonies were sub-cultured on Tryptic Soy Agar (TSA) (Biolife, Milan, Italy) and biochemically typed by the Remel RapID NF Plus system, RapID SS/u System, and Rapid ANA II (Thermo Fisher Scientific, Diagnostics, Ltd., Basingstoke, UK), according to the manufacturer’s instructions. Moreover, the identification was confirmed by MALDI Biotyper system (Bruker Daltonik GmbH, Bremen, Germany), following the manufacturer’s instructions.
According to the WSP approach, Legionella spp. was included in analysis. The detection and enumeration of Legionella spp. were performed following the standard culture technique ISO 11731:2017 [46]. In brief, aliquots of the sample (100 and 200 µL) from untreated water, filtered, heat-treated, and acid-treated water were seeded on selective Glycine-PolymyxinB-Vancomycin-Cyckiheximide (GVPC) agar (Thermo Fisher Scientific, Diagnostic, Ltd., Basingstoke, UK) and incubated at 35 ± 2 °C with 2.5% CO2. Culture time ranged between 10 and 15 days. The plates were examined every 2 days, and presumptive colonies were sub-cultured on Buffered Charcoal Yeast Extract (BCYE) agar with L-cysteine (cys+) and without L-cysteine (cys-) (Thermo Fisher Scientific, Diagnostic, Ltd., Basingstoke, UK). Only Legionella spp. colonies grown on BCYE cys+ were ascribable to Legionella spp., and they were identified using the Legionella latex agglutination test kit (Thermo Fisher Scientific, Ltd. Basingstoke, UK) that can differentiate between Legionella pneumophila serogroup 1 (Lp1), Lp serogroups 2-14 (Lp2-14), and seven non-Lp species, according to the manufacturer’s instructions. MALDI Biotyper system was performed to identify the presumptive Legionella spp. colonies as previously described [47].

2.6. Hydraulic Parameters Measured

During the 2017 restoration, the hydraulic system of the Neptune Fountain was completely replaced. The trajectories and thicknesses of the water jets were designed on those depicted in the engraving by Marco Antonio Chiarini made in 1763: water jets conceived as thin, laminar, limpid, and crystalline.
The redesign of the hydraulic systems was required to study and simulate the activation of the jets of water in the historical Fountain, test their trajectories, and formulate a proposal. Other difficulties included temporal superimposition with other studies and interventions and the need to avoid accidental deterioration of the original materials.
The design of the water jets then led to an overall definition of the necessary flow rate and, therefore, constituted the fundamental input for the design of the entire non-visible part of the WDS inside the Neptune Fountain, the WTS, and RS.
Pressure and flow rate values were monitored during ordinary operation and filter washing to evaluate the correctness of the required values and the Fountain WDS’s overall operation. For pressure measurements, two pressure transducers with FS 10 bar and an accuracy of 0.5% FS were installed. The transducers were connected to existing sockets by means of ¼″-diameter silicone tubing; specifically, biochemical sampling taps and drain taps were used. The analog signal of the transducer in mA was acquired at the frequency of 10 Hz. The analog signal was averaged every second and converted to pressure signal.
Flow measurement was obtained using an ultrasonic instrument (transmitter and receiver) of the clamp-on type, i.e., mounted on the pipe.

3. Results

3.1. Water Treatment System and Reintegration System 3D Model

Using geomatics techniques, it was possible to map the WTS and RS at the level of individual components. After the 3D modeling in the HBIM environment, it was possible to archive the information relating to the single component and prepare a dynamic structure for data updating and maintenance plans. Thanks to the digital model, it was possible to further classify WDS components by identifying subsystems called “Modules” for both WTS and RS, distinguishable by different colors, as shown in Figure 6. The details of the different modules are shown in Table 2. A dynamo visual programming tool was used to implement material and color information to objects, allowing for module and component identification constituting WST and RS.
Particularly, it was possible to process and obtain a detailed plan of the WTS and RS, which thus allowed for solving the problem of the lack of floor plans (Figure 6A). Moreover, the 3D model allowed for the distinguishment of the two main treatment systems (Figure 6B). Figure 6C, on the other hand, shows, with different colors indicated in the legend, the individual modules were labeled thanks to the 3D model processing. Finally, the individual components of the WTS and RS are easily distinguished in Figure 6D.
More specifically, the modules were regrouped based on the different functions. The component of the system that first dechlorinates and filters the water from the municipal aqueduct is referred to as “Module I—Primary reintegration water treatment”. The “Module II—Secondary reintegration water treatment”, on the other hand, corresponds to the Reverse Osmosis System, which reduces the salt concentrations in the newly dechlorinated water to prevent corrosion on the Fountain’s marbles and bronzes. “Module III—Reintegration accumulation” directs water to the specific storage tanks. “Module IV—Return from the Fountain” is the section of the WTS where unclean water is returned from the Fountain. In “Module V—Pre-treatment”, water is coarsely cleaned of macroscopic residues before being stored and pumped through self-cleaning filters to the sand filters to minimize the water turbidity and remove suspended contaminants. “Module VI—Pre-treatment” gathers the three sand filters assigned to filter the water before it is stored in the same tanks considered in Module III. “Module VII—Accumulation” is the WTS component where water is directed to either the UV lamp or the backwash filters. “Module VIII—Secondary Treatment” includes the UV Lamp inlet and outlet, while “Module IX—Sending to the Fountain” returns the water to the fountain. Finally, “Module X—Other”, collects all the WTS components that are switched off when the entire system is in normal operation.
The 3D modeling of the WTS using Revit software (Autodesk, Ink., version 2021.1.1) allowed for the model to be exported in a .ifc format, a type of format that is accessible to all and easy to view using free viewers. In our study, BIM Vision® 2.26.2 software was used to move virtually through the project by interacting and sharing information about each component of the project (Figure 7A).
To facilitate online access to the HBIM application and update the database with the results of the analyses periodically conducted, each sampling point was linked to a URL address containing the corresponding documents. To update the data obtained from periodic sampling by sampling points (water taps) and subsequent microbiological analysis, the URL type parameter to BIM object “sampling points” was implemented (Figure 7B).
The exported IFC file then presented the URL parameter through which the database containing this information can be accessed, according to an external server-based data structure (e.g., One Drive) as shown in Figure 7C. This made it possible to access the same folders associated with individual sampling points and, consequently, to view the contained file, which was updated to the last tap operation performed. Thus, all information was maintained in a single database that can be shared and accessible by all experts participating in the WDS management.

3.2. Microbiological Results

The microbiological analyses performed for each sampling points developed during the study for the first time allowed for the monitoring of water quality and support of the WDS management.
Before the restoration (2016), the empiric chlorination system used had led to the absence of all microbiological parameters, producing high corrosion on bronzes and marbles. Moreover, no water-quality assessments were reported until the beginning of this study.
High chlorine values were found with peaks until 2.88 mg/L for free chlorine and 5.88 mg/L for combined chlorine, while the measured temperature in all samples was below 20 °C.
With the current advancement due to the 3D model acquisition of WTS and RS, the sampling points were also regrouped in “Modules” (Table 2) to optimize the model and better describe the system. Each module was linked to a specific treatment and sampling points along the WTS and RS: Modules I, II, and III comprise the RS, while Modules IV up to X comprise the WTS.
Table 3 contains details of the microbiological contamination found in each module. A contamination range (minimum and maximum) for each sampling point in the modules was displayed.
The first sampling campaign in December 2018, after the restoration, showed values of HPC at 22 °C and 37 °C, while P. aeruginosa and C. perfringens exceeded the directive’s limit for some modules. In particular, no contamination was detected in the reintegration water coming from the aqueduct, while contamination became more evident in Module I at the level of Activated Carbon Filters (Sampling Points 2A and 2B), while in Module III, high HPC values at 22 °C and 37 °C, other than the high presence of P. aeruginosa, C. perfringens, and Fecal coliforms, were found. Module III was highly contaminated by HPC and P. aeruginosa, as well as fecal coliform. In Module VII, a contamination decrease was observed, even though the presence of HPC and P. aeruginosa remained. Microbial contamination was also found in the water returning from the fountain. In particular, a high value of HPC and a contamination of P. aeruginosa were found in Modules V and VI, but any type of contamination disappeared in Module VIII where the UV lamp treatment was able to supply “clean” water to the fountain. The chlorine levels satisfied directive indications, and the mean water temperature of all the sampling points was 16.8 °C.
Due to the extraordinary maintenance program and SARS-CoV-2 pandemic, subsequent sampling was conducted in 2021 during different seasons to assess the impact on the water quality of atmospheric factors under various climatic scenarios. In particular, three different sampling campaigns (S) were conducted: S1 in spring, S2 in autumn, and S3 after the fountain’s extraordinary maintenance activities.
In March 2021 (S1), no contamination was detected in the reintegration water, whereas the other sampling points in Module I had HPC values at 22 °C and 37 °C above the regulatory limits, and 1 cfu/100 mL of S. aureus was detected. The sampling point 4B in Module III, which collected “mixed” water coming from the osmosis system and water from the aqueduct dechlorinated and filtered, had only HPC values at 37 °C above the regulatory limits. Contamination of C. perfringens, E. coli, Enterococci, and S. aureus on the other hand remained in Module VII before turning on the UV lamp (Module VIII). The UV lamp again removed all types of contamination.
The Module IV analysis allowed us to study the water quality that came back directly from the fountain without any kind of treatment. In this module, C. perfringens, E. coli, Enterococci, and S. aureus, as well as a large number of HPC at 22 °C, were detected. C. perfringens, E. coli, Enterococci, and S. aureus remained in Modules V and VI. After the UV lamp treatment, contamination is no longer detected at any of the places examined, along with the water supply directed to the fountain.
The water in the Neptune outside basin was also analyzed with samples collected on the north and south sides of the fountain. C. perfringens, E. coli, Enterococci, and S. aureus were reported, while the south side of the basin revealed a high contamination of HPC values at 22 °C with C. perfringens, E. coli, Enterococci, and S. aureus. In the south side of the basin, the water temperature was 9.7 °C. At the fountain basin’s level, no Legionella species were found. The chlorine concentration was found to be within the permitted limits at all points in the WTS, demonstrating the efficiency of the RS treatment. The mean water temperature measured was also in line with the regulations (12.2 °C).
During the fountain monitoring in October 2021 (S2), the basin underwent extensive maintenance activity and cleaning, making it impossible to sample specific locations (such as the water returning from Neptune and the water leaving the rotary screen). With the exception of E. coli, the results showed that all points related to storage tanks, sand filter outlets, activated carbon filters, osmosis water outlets, and UV pre-lamp had positive outcomes for microorganisms. The contamination was once again controlled by the UV lamp (Module VIII), before the water was sent into the fountain. The chlorine concentration measured was within the normal range and the mean temperature of the water collected from the different sampling points along the WDS was 18.5 °C. As a result of these findings, the WTS was submitted to a shock treatment based on hyperchlorination with stabilized chlorine dioxide at 20 mg/L. The fountain was excluded by treatment using a by-pass system on WDS to avoid contact of marbles and bronzes with chlorine. After the treatment, several rinses were applied along the WTS to eliminate chlorination residues.
Subsequent sampling was performed to confirm the efficacy of the treatment (S3). The contamination was reduced in line with regulatory levels in most of the points. The only remaining non-compliant sites were those included in Module I at the level of carbon filters with fecal coliforms and HPC values at 22 °C and 37 °C significantly above the reference level. However, the chlorine concentration was above the maximum limit (0.2 mg/L) at Points 4B (0.386 mg/L), 11 (0.544 mg/L), and 12 (1.410 mg/L), showing a decrease in efficiency at the level of activated carbon filters, which were, therefore, replaced. The mean water temperature observed in all the samples was 19.7 °C.
The water-quality monitoring is still ongoing, with two samplings per years, according to the WSP developed. The data, as well as all types of maintenance activity, were stored and recorded in the BIM model, as previously described. The results are in line with directive limits.

3.3. Hydraulic Parameter Monitoring Results

The closed-circuit hydraulic system of Neptune Fountain (Figure 2) is a pressurized system from the storage (C1–C2) of the return water line up to the nozzles, including WST and RS (Figure 3). Instead, the return pipeline from the fountain works by gravity.
The hydraulic monitoring provided quantitative information on the overall hydraulic operation of the Neptune Fountain, in particular, on the imposed pressure and flow values by the two groups of variable speed pumps (D) and (H) (Figure 3).
The pumps (D) determine the operation of the self-cleaning filters (E) and the sand filters (F1–F2–F3) in terms of pressure and flow rate. The results of the monitoring PM1 (Figure 5) indicated operating conditions lower than what was indicated in the technical specifications of the filters (F1–F2–F3) with a flow rate measured in FM1 that determined a flow equal to 4.8 m3/h for each filter, lower than the required 5.0 m3/h. Furthermore, the variable speed pump’s pressure (p < 2.5 bar) is equal to the minimum required value for cleaning the filters (F1-F2-F3), potentially compromising the quality of the circulating water.
Furthermore, the pumps (H) determine the operation of the Neptune Fountain and, therefore, the correctness of the trajectories of the jets of water. Finally, the pumps (H) condition the operation of the UV lamp (I). The correct setting of the pumps (H) and the nozzle supplying line regulation valves (Figure 2) is essential for maintaining a good state of conservation of the fountain. Indeed, in addition to the aesthetic aspect, correct trajectories of the jets do not create intersections of the water jets with the marble or bronze surfaces in the central parts of the Castellum, thus avoiding the proliferation of algae in these areas and the run-off of external surfaces, potentially contaminated by bacteria due to the effect of environmental and anthropic external factors.
FM3 flow rate measurement (Figure 5) quantitatively confirmed what seemed to emerge observing the Fountain’s water trajectories, i.e., a lower value of the overall operating flow rate equal to approximately 1.50 L/s (5.395 m3/h) compared to the value design equal to 2.35 L/s (8.46 m3/h). This confirmed the importance of monitoring-based management of the WDS. The results of the hydraulic monitoring are summarized in Table 4.

4. Discussion

The Neptune Fountain represents one of the main emblems of Renaissance fountains. The most recent restoration was innovative in terms of survey methodologies, conservation actions, implemented models, and process management. The collaboration of a multidisciplinary team of physicists, chemists, biologists, engineers, restorers, architects, and art historians resulted in the development of a complex project based on a modern and highly integrated approach able to consider the characteristics and peculiarities of the historical fountain [48]. The 2017 restoration supported the idea that marble and bronze preservation is linked to the chemical, physical, and microbiological water properties, maybe for the first time, considering the Neptune Fountain as an artistic complex in which water plays the central role.
Fountains frequently use closed-circulation WDSs with no microbiological contamination control systems. As a result, the water, by releasing several inorganic and organic components into pipelines, promotes microorganism growth, posing a risk to both public health and the deterioration of the fountain’s monumental historical heritage. Therefore, a monitoring activity combined with an adequate maintenance plan is required for the structure maintenance and effective preservation. Fountain water monitoring is also important for preserving the people’s health that inevitably come into contact with water. There are no guidelines or suggestions regarding the biological parameters to test on decorative fountains. General indications are related to the type of supplied water; for example, for fountains supplied by drinking water. Only in rare cases of legionellosis outbreaks, as occurred in Italy in 2018, the water fountain is monitored for Legionella presence, even if the role of the fountain’s aerosol pathogens dispersion is recognized [49,50,51,52].
The significance of the most recent restoration of Neptune Fountain relies on two main aspects: water-related risks and the implementation of an efficient WSP, considering that proper and safe WDS component operations reinforce the fountain’s magnificence. Moreover, water filtration systems and osmosis pre-treatment, when combined with physical UV lamp activity, can prevent microbiological contamination. Newly, due to the value of developing a highly accurate 3D model for monument restoration [35,36,48,53], the development of the 3D model described in this manuscript was evaluated for the WDS as well.
The approach presented in this study proposed for the first time an original approach to document and monitor the operation and maintenance of the fountain. This ensures a long-term conservation of the monumental historical heritage. Water management helped in understanding and improving water quality by identifying potential risks and defining the water system using information that is not routinely available to building managers or that may be routinely collected [54]. Indeed, the microbiological results from water analysis revealed high levels of potentially pathogenic bacteria at some critical points along the WDS, compromising its performance. As a result, having a WSP to help in maintaining good water quality at the fountain level should be considered and researched further.
Moreover, the WDS 3D model, characterized by easy documentation sharing and data management, was able to compensate for some gaps in plant knowledge by incorporating qualitative and quantitative microbiological evaluations of the plant up to the hydraulic components. The simple and trivial association of URLs to sampling points, which link back to cloud storage, facilitated communication among different professional skills and, as a result, WDS management. The ultimate goal was to return a functional model that could be updated as engineering and microbiological evaluation progress. A model that accurately represented the WDS allowed the various professionals involved in the WDS management to access more specific guidance and information. This enabled the development of effective monitoring plans and the integration of decisions that consider the correlation between the hydraulic operation and the prevention of risks related to microbiological water quality. Moreover, the value of having a digital model that is easily shareable and accessible lies in its ability to overcome one of the main obstacles often characterizing environmental monitoring plans: the difficulty in obtaining the layouts and information related to a WDS. A centralized and accessible digital model allowed for quick consultation of necessary data and information, simplifying the monitoring process and improving overall operational efficiency.
Microbiological analyses performed over the years have revealed WDS malfunctions that would not have been detected otherwise.
Analysis in 2018 showed a reduction in contamination at the level of Module VII. It serves as a storage tank receiving water from osmotic treatment (P) and water filtered by the sand filters (F1–F2–F3). Therefore, the decrease in contamination observed was mainly due to the continuous addition of clean water from the two treatments that contributed to the maintenance of the quality of the water stored in Module VII.
Even more significance is assumed in the assessments made by combining the microbiological and hydraulic parameter analysis. Indeed, as a result of this integrated study, it was discovered that a potentially critical aspect of the water system lied in the fact that pumps (H) (Figure 3), which normally supply the fountain, also feed the washing phase of sand filters (F1–F2–F3). As a result, during sand filter backwashing, the pumps must provide sufficient flow and pressure to feed the fountain and wash the filter. According to the results of the 2021 sampling, the water pressure used to backwash the filters, as well as the duration of washing, was insufficient to ensure their washing. Microbiological results confirmed filter contamination and the need to improve their cleaning. Furthermore, another critical aspect that emerged from the fountain functionality and maintenance was linked to the storage tanks (G1–G2–G3) (Figure 3). In these storage tanks, the water returned from the Neptune Fountain and filtered by sand filters (F1–F2–F3) was mixed with reverse osmosis-purified water that comes from RS. Moreover, the water used for sand filter backwashing was drawn from the same storage tank. The microbiological contaminants present in the storage tanks were transferred in the two pipelines: one directed through the UV lamp (I), where the contamination was eliminated, and the second one (black pipelines in Figure 3) was used for filter backwashing that, in this case, came in contact with contaminants. As a result, continuous cross-contamination between filters and storage tanks occurred. These results obtained have been useful as an important input for the responsible staff supporting them in the development of the new protocol.
The results obtained were uploaded on the WTS 3D model and shared with hydraulic engineers, the restorers, and the municipality, to improve the Fountain WSP and fountain water quality.
Starting from the extraordinary maintenance program, a new maintenance plan was developed based on the following points: (i) at the level of Module VII, the pressure pumps (H) were reset with new values; (ii) the frequency of filter backwashing was increased from two to three times per week, and the amount of time spent washing was increased from 15 to 30 min; (iii) the carbon (N1, N2) and cartridge filters (O) were replaced with new one set; (iv) the storage tanks (C1, C2) of Modules V and VII (G1, G2, G3) were completely emptied and mechanically sanitized with chlorine; and (v) the by-pass valve on the osmosis system (P) was closed to avoid the mixture with the municipal water. In this case, the whole WDS was supplied only with osmotic water.
Moreover, in recent years, abundant algae formation and cyanobacteria development on the fountain exterior surfaces have been observed. This was the primary cause of extraordinary maintenance interventions, such as draining the water from the fountain and a thorough cleaning of the marble surfaces and bronze statues. One of the main significant solutions for preventing and reducing algae formation and cyanobacteria development was the proper adjustment of the nozzles. Algae mostly form when the water jets from the nozzles follow an incorrect trajectory. The latter was dependent on the WDS’s proper hydraulic operation in terms of the total water flow rate sent to the fountain. Moreover, the algae patina growth could be supported by the presence of a waterproof plastic coating on the external fountain basin. This hypothesis could be, in the future, more investigated in collaboration with restorers. Therefore, the proposed approach represents the first version of WSP, which could be extended to other microbial, chemical, and physical parameters that, as part of self-control monitoring, could support fountain maintenance and functionality.
The approach proposed in this research focused on the importance of a WSP implementation following an innovative and multidisciplinary way. It could permit, at the same time, the reduction of public health issues, e.g., reducing the risk of infection while protecting public health, as well as maintenance costs for WTS components. The possibility of monitoring the hydraulic functionality and its components in a continuous real-time modality could support an appropriate and scheduled maintenance activity, preventing breakages, damage, and lack of fountain activity over time.

5. Conclusions

The restoration of the Neptune Fountain can be seen as an efficient starting point for the development of a platform based on a 3D model. This platform can serve as a tool for the documentation of restoration, as well as the management of ordinary and extraordinary maintenance across the entire WDS. In this way, interventions become simpler and more effective, and their identification can start from a multidisciplinary knowledge shared between the different professionals required to collaborate in the context of the Neptune Fountain. The proposed approach offers several significant benefits. Firstly, it addresses the challenge of outdated or incomplete architectural and hydraulic building layouts, crucial for effective water-quality monitoring. Access to accurate digital models enhances management processes, which became easy and fast. The approach streamlines data sharing and availability, establishing efficient data flows that ensure clear and constant communication channels among stakeholders. It promotes collaboration among professionals involved in premise plumbing management and monitoring. This collaboration facilitates comprehensive evaluations of premise plumbing systems, leading to improvements in functionality and efficiency. It allows for the practical visualization of pipelines and sampling points, facilitating the specific tracking of microbiological populations. Lastly, the approach supports the long-term operation and functionality of premise plumbing systems. By reducing reliance on fragmented data and paper reports, it ensures sustained performance and safety over time.
Based on the experience of Neptune Fountain, it is intended to demonstrate how an integrated approach between the microbiological and hydraulic components could be extended to all types of WDS and represents the appropriate method to prevent and control microbiological risk, at the same time ensuring the correct and functional activity of the whole system.

Author Contributions

S.C., M.R.P. and C.B. conceived, designed the experiments, and wrote the paper. F.M., L.G. and C.D. performed the sample collection and the experiments. D.S.R., E.B. and G.B. performed the HBIM acquisition and modeling. All authors have read and agreed to the published version of the manuscript.

Funding

This research received no external funding.

Data Availability Statement

The raw data supporting the conclusions of this article will be made available by the authors on request.

Acknowledgments

The authors would like to thank Roberto Cioni from the Municipality of Bologna for his support during sampling campaigns.

Conflicts of Interest

The authors declare no conflict of interest.

References

  1. Legislative Decree Feb 2 Legislative Decree n.31 02.02.2001 Implementation of the Water Quality Directive 98/83/EC Relative to Water Quality Intended for Human Consumption; Gazzetta Ufficiale n.52 of March 3rd 2001, Supplemento Ordinario n.414. 2001, pp. 1–21. Available online: https://www.gazzettaufficiale.it/eli/id/2001/03/03/001G0074/sg (accessed on 10 May 2024).
  2. Legislative Decree Feb 23 Legislative Decree No. 18. Implementation of Directive (EU) 2020/2184 of the Parliament European Parliament and of the Council of 16 December 2020 on the Quality of Water Intended for Human Consumption. Gazzetta Ufficiale—Serie Generale n. 55. 2023. Available online: https://www.gazzettaufficiale.it/eli/id/2023/03/06/23G00025/sg (accessed on 10 May 2024).
  3. Directive (EU) 2020/2184 of the European Parliament and of the Council of 16 December 2020 on the Quality of Water Intended for Human Consumption, 431/1. Gazzetta Ufficiale Dell’Unione Europea Del 23 December 2020. 2020. Available online: https://eur-lex.europa.eu/legal-content/IT/TXT/?uri=CELEX%3A32020L2184 (accessed on 10 May 2024).
  4. Khatri, N.; Tyagi, S. Influences of Natural and Anthropogenic Factors on Surface and Groundwater Quality in Rural and Urban Areas. Front. Life Sci. 2015, 8, 23–39. [Google Scholar] [CrossRef]
  5. Ramírez-Castillo, F.Y.; Loera-Muro, A.; Jacques, M.; Garneau, P.; Avelar-González, F.J.; Harel, J.; Guerrero-Barrera, A.L. Waterborne Pathogens: Detection Methods and Challenges. Pathogens 2015, 4, 307–334. [Google Scholar] [CrossRef]
  6. Manetu, W.M.; Karanja, A.M. Waterborne Disease Risk Factors and Intervention Practices: A Review. Open Access Libr. J. 2021, 8, e7401. [Google Scholar] [CrossRef]
  7. Pouey, J.; Galey, C.; Chesneau, J.; Jones, G.; Franques, N.; Beaudeau, P.; Mouly, D. Implementation of a National Waterborne Disease Outbreak Surveillance System: Overview and Preliminary Results, France, 2010 to 2019. Eurosurveillance 2021, 26, 2001466. [Google Scholar] [CrossRef]
  8. Kumar, P.; Srivastava, S.; Banerjee, A.; Banerjee, S. Prevalence and Predictors of Water - Borne Diseases among Elderly People in India: Evidence from Longitudinal Ageing Study in India, 2017–18. BMC Public Health 2022, 22, 993. [Google Scholar] [CrossRef]
  9. World Health Organization Guidelines for Drinking-Water Quality [electronic Resource]: Incorporating 1st and 2nd Addenda, 3rd ed.; Recommendations; WHO: Geneva, Switzerland, 2008; Volume 1.
  10. World Health Organization Water Safety Plan Manual: Step-by-Step Risk Management for Drinking-Water Suppliers, 2nd ed.; WHO: Geneva, Switzerland, 2023.
  11. Modrzewska, B.D.; Bartnicka, M.; Blaszkowska, J. Microbially Contaminated Water in Urban Fountains as a Hidden Source of Infections. Clean Soil Air Water 2019, 47, 1800322. [Google Scholar] [CrossRef]
  12. Burkowska-But, A.; Swiontek Brzezinska, M.; Walczak, M. Microbiological Contamination of Water in Fountains Located in the City of Toruń, Poland. Ann. Agric. Environ. Med. 2013, 20, 645–648. [Google Scholar]
  13. Chatziprodromidou, I.P.; Savoglidou, I.; Stavrou, V.; Vantarakis, G.; Vantarakis, A. Surveillance of Legionella Spp. in Open Fountains: Does It Pose a Risk? Microorganisms 2022, 10, 2458. [Google Scholar] [CrossRef]
  14. Zhang, C.M.; Xu, P.C.; Du, W.W.; Wang, X.C. Exposure Parameters and Health Risk of Cryptosporidium and Giardia in the Recreational Water Activities for Urban Residents in China. Environ. Sci. Pollut. Res. 2022, 29, 1573–1583. [Google Scholar] [CrossRef] [PubMed]
  15. Santos, G.A.C.; Dropa, M.; Rocha, S.M.; Peternella, F.A.S.; Razzolini, M.T.P. Staphylococcus Aureus and Methicillin-Resistant Staphylococcus Aureus (MRSA) in Drinking Water Fountains in Urban Parks. J. Water Health 2020, 18, 654–664. [Google Scholar] [CrossRef] [PubMed]
  16. Pompeu Martins, M.; Junio Borges Araujo, A.; Parreira de Souza, L.; De Araújo Ribeiro, Y.; Clemente Olmos Hernandes, L.; Nascimento Zanatto, L.; Araújo Vilela, D.; Galisa de Oliveira, R.; Clara Monte Teixeira, A.; Queiroz Messias, D.; et al. Microbial Contamination in Drinking Water Fountains and the Potential Risk Associated with Location and Cleanliness. Interfaces Científicas-Saúde E Ambiente 2021, 8, 399–408. [Google Scholar] [CrossRef]
  17. Stec, J.; Kosikowska, U.; Mendrycka, M.; Stępień-Pyśniak, D.; Niedźwiedzka-Rystwej, P.; Bębnowska, D.; Hrynkiewicz, R.; Ziętara-Wysocka, J.; Grywalska, E. Opportunistic Pathogens of Recreational Waters with Emphasis on Antimicrobial Resistance—A Possible Subject of Human Health Concern. Int. J. Environ. Res. Public Health 2022, 19, 7308. [Google Scholar] [CrossRef] [PubMed]
  18. LeChevallier, M.W.; Prosser, T.; Stevens, M. Opportunistic Pathogens in Drinking Water Distribution Systems—A Review. Microorganisms 2024, 12, 916. [Google Scholar] [CrossRef] [PubMed]
  19. Lee, D.; Calendo, G.; Kopec, K.; Henry, R.; Coutts, S.; McCarthy, D.; Murphy, H.M. The Impact of Pipe Material on the Diversity of Microbial Communities in Drinking Water Distribution Systems. Front. Microbiol. 2021, 12, 779016. [Google Scholar] [CrossRef] [PubMed]
  20. Ji, P.; Parks, J.; Edwards, M.A.; Pruden, A. Impact of Water Chemistry, Pipe Material and Stagnation on the Building Plumbing Microbiome. PLoS ONE 2015, 10, e0141087. [Google Scholar] [CrossRef] [PubMed]
  21. Viñas, V.; Malm, A.; Pettersson, T.J.R. Overview of Microbial Risks in Water Distribution Networks and Their Health Consequences: Quantification, Modelling, Trends, and Future Implications. Can. J. Civ. Eng. 2019, 46, 149–159. [Google Scholar] [CrossRef]
  22. Boers, S.A.; Prest, E.I.; Maja, T.; Kne, A. Monitoring of Microbial Dynamics in a Drinking Water Distribution System Using the Culture-Free, User- Friendly, MYcrobiota Platform. Sci. Rep. 2018, 8, 14727. [Google Scholar] [CrossRef] [PubMed]
  23. Mei, X.; Gao, S.; Liu, Y.; Hu, J.; Razlustkij, V.; Rudstam, L.G.; Jeppesen, E.; Liu, Z.; Zhang, X. Effects of Elevated Temperature on Resources Competition of Nutrient and Light Between Benthic and Planktonic Algae. Front. Environ. Sci. 2022, 10, 908088. [Google Scholar] [CrossRef]
  24. Bulut, Y.; Atabeyoǧlu, Ö. Fountains as Urban Furniture in Historical Urban Structure and Usage Culture: Erzurum City Case. Build. Environ. 2007, 42, 2432–2438. [Google Scholar] [CrossRef]
  25. Rugani, B.; Pulselli, R.M.; Niccolucci, V.; Bastianoni, S. Environmental Performance of a XIV Century Water Management System: An Emergy Evaluation of Cultural Heritage. Resour. Conserv. Recycl. 2011, 56, 117–125. [Google Scholar] [CrossRef]
  26. Bolivar-Galiano, F.; Cuzman, O.A.; Abad-Ruiz, C.; Sánchez-Castillo, P. Facing Phototrophic Microorganisms That Colonize Artistic Fountains and Other Wet Stone Surfaces: Identification Keys. Appl. Sci. 2021, 11, 8787. [Google Scholar] [CrossRef]
  27. Azhar, S. Building Information Modeling (BIM): Trends, Benefits, Risks, and Challenges for the AEC Industry. Leadersh. Manag. Eng. 2011, 11, 241–252. [Google Scholar] [CrossRef]
  28. Dervishaj, A. From Sustainability to Regeneration: A digital framework with BIM and computational design methods. Arch. Struct. Constr. 2023, 3, 315–336. [Google Scholar] [CrossRef]
  29. Mora, R.; Sánchez-Aparicio, L.J.; Maté-González, M.Á.; García-Álvarez, J.; Sánchez-Aparicio, M.; González-Aguilera, D. An Historical Building Information Modelling Approach for the Preventive Conservation of Historical Constructions: Application to the Historical Library of Salamanca. Autom. Constr. 2021, 121, 103449. [Google Scholar] [CrossRef]
  30. Lovell, L.J.; Davies, R.J.; Hunt, D.V.L. The Application of Historic Building Information Modelling (HBIM) to Cultural Heritage: A Review. Heritage 2023, 6, 6691–6717. [Google Scholar] [CrossRef]
  31. Rocha, G.; Mateus, L.; Fernández, J.; Ferreira, V. A Scan-to-Bim Methodology Applied to Heritage Buildings. Heritage 2020, 3, 47–65. [Google Scholar] [CrossRef]
  32. Rocha, G.; Mateus, L. A survey of scan-to-bim practices in the aec industry—A quantitative analysis. ISPRS Int. J. Geo-Information 2021, 10, 564. [Google Scholar] [CrossRef]
  33. Bragalli, C.; Cristino, S.; Mancini, B.; Mancini, M.; Naldi, G.; Pietrini, A.; Ricci, S. Il Sistema Idraulico e Delle Acque. In NETTUNO: La Fontana: Studio, Progetto, Restauro; Gaiani, M., Ed.; Bononia University Press: Bologna, Italy, 2017; pp. 101–122. [Google Scholar]
  34. Gaiani, M. Nettuno. La Fontana: Studio, Progetto, Restauro; Bononia University Press: Bologna, Italy, 2017. [Google Scholar]
  35. Girelli, V.A.; Tini, M.A.; Apuzzo, M.G.D.; Bitelli, G. 3D Digitisation in Cultural Heritage Knowledge and Preservation: The Case of the Neptune Statue in Bologna and Its Archetype. Int. Arch. Photogramm. Remote Sens. Spat. Inf. Sci. 2020, 43, 1403–1408. [Google Scholar] [CrossRef]
  36. Girelli, V.A.; Tini, M.A.; Dellapasqua, M.; Bitelli, G. High Resolution 3D Acquisition and Modelling in Cultural Heritage Knowledge and Restoration Projects: The Survey of the Fountain of Neptune in Bologna. ISPRS Ann. Photogramm. Remote Sens. Spat. Inf. Sci. 2019, 42, 573–578. [Google Scholar] [CrossRef]
  37. Fujioka, T.; Hoang, A.T.; Ueyama, T.; Nghiem, L.D. Integrity of reverse osmosis membrane for removing bacteria: New insight into bacterial passage. Environ. Sci. Water Res. Technol. 2019, 5, 239–245. [Google Scholar] [CrossRef]
  38. UNI EN ISO 19458:2006; Water Quality—Sampling for Microbiological Analysis. ISO: Geneva, Switzerland, 2006. Available online: http://store.uni.com/catalogo/en-iso-19458-2006 (accessed on 2 October 2023).
  39. Ministerial Decree 14.06.2017 Implementation of Directive (EU) 2015/1787 Amending Annexes II and III of Directive 98/83/EC on the Quality of Water Intended for Human Consumption. Amendments to Annexes II and III of Legislative Decree 2 February 2001, n. 31. Off. J. Ital. Repub. 2017, 14–19.
  40. Istituto Superiore di Sanità. Reference Analytical Methods for Water Intended for Human Consumption according to the Italian Legislative Decree 31/2001. Microbiological Methods. 2007. Available online: https://www.salute.gov.it/imgs/C_17_pubblicazioni_2277_allegato.pdf (accessed on 2 October 2023).
  41. UNI EN ISO 6222:2001; Water Quality—Enumeration of Culturable Micro-Organisms—Colony Count by Inoculation in a Nutrient Agar Culture Medium. ISO: Geneva, Switzerland, 2001. Available online: https://store.uni.com/uni-en-iso-6222-2001 (accessed on 2 October 2023).
  42. EN ISO 7899-2:2000; Water Quality—Detection and Enumeration of Intestinal Enterococci—Part 2: Membrane Filtration Method (ISO 7899-2:2000). ISO: Geneva, Switzerland, 2000. Available online: https://store.uni.com/en-iso-7899-2-2000 (accessed on 2 October 2023).
  43. UNI EN ISO 16266:2008; Water Quality—Detection and Enumeration of Pseudomonas Aeruginosa—Method by Membrane Filtration. ISO: Geneva, Switzerland, 2008. Available online: https://store.uni.com/uni-en-iso-16266-2008 (accessed on 2 October 2023).
  44. UNI EN ISO 9308-1:2017; Water Quality—Enumeration of Escherichia Coli and Coliform Bacteria—Part 1: Membrane Filtration Method for Waters with Low Bacterial Background Flora 2017. ISO: Geneva, Switzerland, 2017. Available online: https://store.uni.com/uni-en-iso-9308-1-2017 (accessed on 2 October 2023).
  45. UNI EN ISO 14189:2016; Water Quality—Enumeration of Clostridium Perfringens—Method Using Membrane Filtration. ISO: Geneva, Switzerland, 2016. Available online: https://store.uni.com/en/uni-en-iso-14189-2016 (accessed on 2 October 2023).
  46. ISO 11731:2017; Water Quality—Enumeration of Legionella (2017). ISO: Geneva, Switzerland, 2017. Available online: https://conto.uni.com/uni-en-iso-11731-2017 (accessed on 2 October 2023).
  47. Pascale, M.R.; Mazzotta, M.; Salaris, S.; Girolamini, L.; Grottola, A.; Simone, M.L.; Cordovana, M.; Bisognin, F.; Dal Monte, P.; Bucci Sabattini, M.A.; et al. Evaluation of MALDI–TOF Mass Spectrometry in Diagnostic and Environmental Surveillance of Legionella Species: A Comparison with Culture and Mip-Gene Sequencing Technique. Front. Microbiol. 2020, 11, 589369. [Google Scholar] [CrossRef] [PubMed]
  48. Apollonio, F.I.; Ballabeni, M.; Bertacchi, S.; Fallavollita, F.; Foschi, R.; Gaiani, M. From Documentation Images to Restauration Support Tools: A Path Following the Neptune Fountain in Bologna Design Process. Int. Arch. Photogramm. Remote Sens. Spat. Inf. Sci. 2017, 42, 329–336. [Google Scholar] [CrossRef]
  49. Italian National Institute of Health. Italian Guidelines for Prevention and Control of Legionellosis; Italian National Institute of Health: Roma, Italy, 2015; pp. 1–144. Available online: https://www.salute.gov.it/imgs/C_17_pubblicazioni_2362_allegato.pdf (accessed on 10 May 2023).
  50. Mazzotta, M.; Salaris, S.; Pascale, M.R.; Girolamini, L.; Cristino, S. Occurrence of Legionella spp. in Man-Made Water Sources: Isolates Distribution and Phylogenetic Characterization in the Emilia-Romagna Region. Pathogens 2021, 10, 552. [Google Scholar] [CrossRef] [PubMed]
  51. Nascimento, M.; Rodrigues, J.C.; Reis, L.; Nogueira, I.; Carvalho, P.A.; Brandão, J.; Duarte, A.; Jordao, L. Pathogens in ornamental waters: A pilot study. Int. J. Environ. Res. Public Health 2016, 13, 216. [Google Scholar] [CrossRef] [PubMed]
  52. Girolamini, L.; Brattich, E.; Marino, F.; Pascale, M.R.; Mazzotta, M.; Spiteri, S.; Derelitto, C.; Tositti, L.; Cristino, S. Cooling towers influence in an urban environment: A predictive model to control and prevent Legionella risk and Legionellosis events. Build. Environ. 2023, 228, 109891. [Google Scholar] [CrossRef]
  53. Apollonio, F.I.; Basilissi, V.; Callieri, M.; Dellepiane, M.; Gaiani, M.; Ponchio, F.; Rizzo, F.; Rubino, A.R.; Scopigno, R.; Sobra, G. A 3D-Centered Information System for the Documentation of a Complex Restoration Intervention. J. Cult. Herit. 2018, 29, 89–99. [Google Scholar] [CrossRef]
  54. Proctor, C.; Garner, E.; Hamilton, K.A.; Ashbolt, N.J.; Caverly, L.J.; Falkinham, J.O.; Haas, C.N.; Prevost, M.; Prevots, D.R.; Pruden, A.; et al. Tenets of a Holistic Approach to Drinking Water-Associated Pathogen Research, Management, and Communication. Water Res. 2022, 211, 117997. [Google Scholar] [CrossRef]
Figure 1. Neptune Fountain in Bologna with a detail of the water games.
Water 16 02075 g001
Figure 2. The overall scheme of the current operation of the Neptune Fountain (the light blue lines represent the water game trajectories).
Water 16 02075 g002
Figure 3. Neptune Fountain WDS layout: Water treatment system (WTS) in green lines and reintegration system (RS) in blue lines.
Water 16 02075 g003
Figure 4. Post-processing steps for a section of the Neptune Fountain’s RS from the point cloud to the HBIM model: (A) 3D point cloud model; (B) 3D point cloud model vs HBIM model; (C) final HBIM model.
Water 16 02075 g004
Figure 5. WTS layout of Neptune Fountain with sampling points for microbiological (indicated in black) and hydraulic analysis (indicated in pink). The WTS and RS are indicated with green and blue lines, respectively.
Water 16 02075 g005
Figure 6. Neptune Fountain WTS 3D model: (A) WTS plan; (B) the two main treatment systems; (C) the subsystems called modules; (D) single WTS hydraulics and treatments components.
Water 16 02075 g006
Figure 7. (A) Section of WTS 3D visualization on BIM Vision® software; (B) selection of a sampling point along the WTS and IFC tree structure that displays how the model works. In detail, when a specific point is clicked (green colour), all relevant information is reported (e.g., pipeline material, type of pumps, volume of storage tank, etc.), and a URL link led to the storage folders; (C) example of storage folder associated with the individual sampling points containing the files related to the microbiological water assessment files.
Water 16 02075 g007
Table 1. List of sampling points for microbiological and hydraulic analysis on Neptune Fountain WTS.
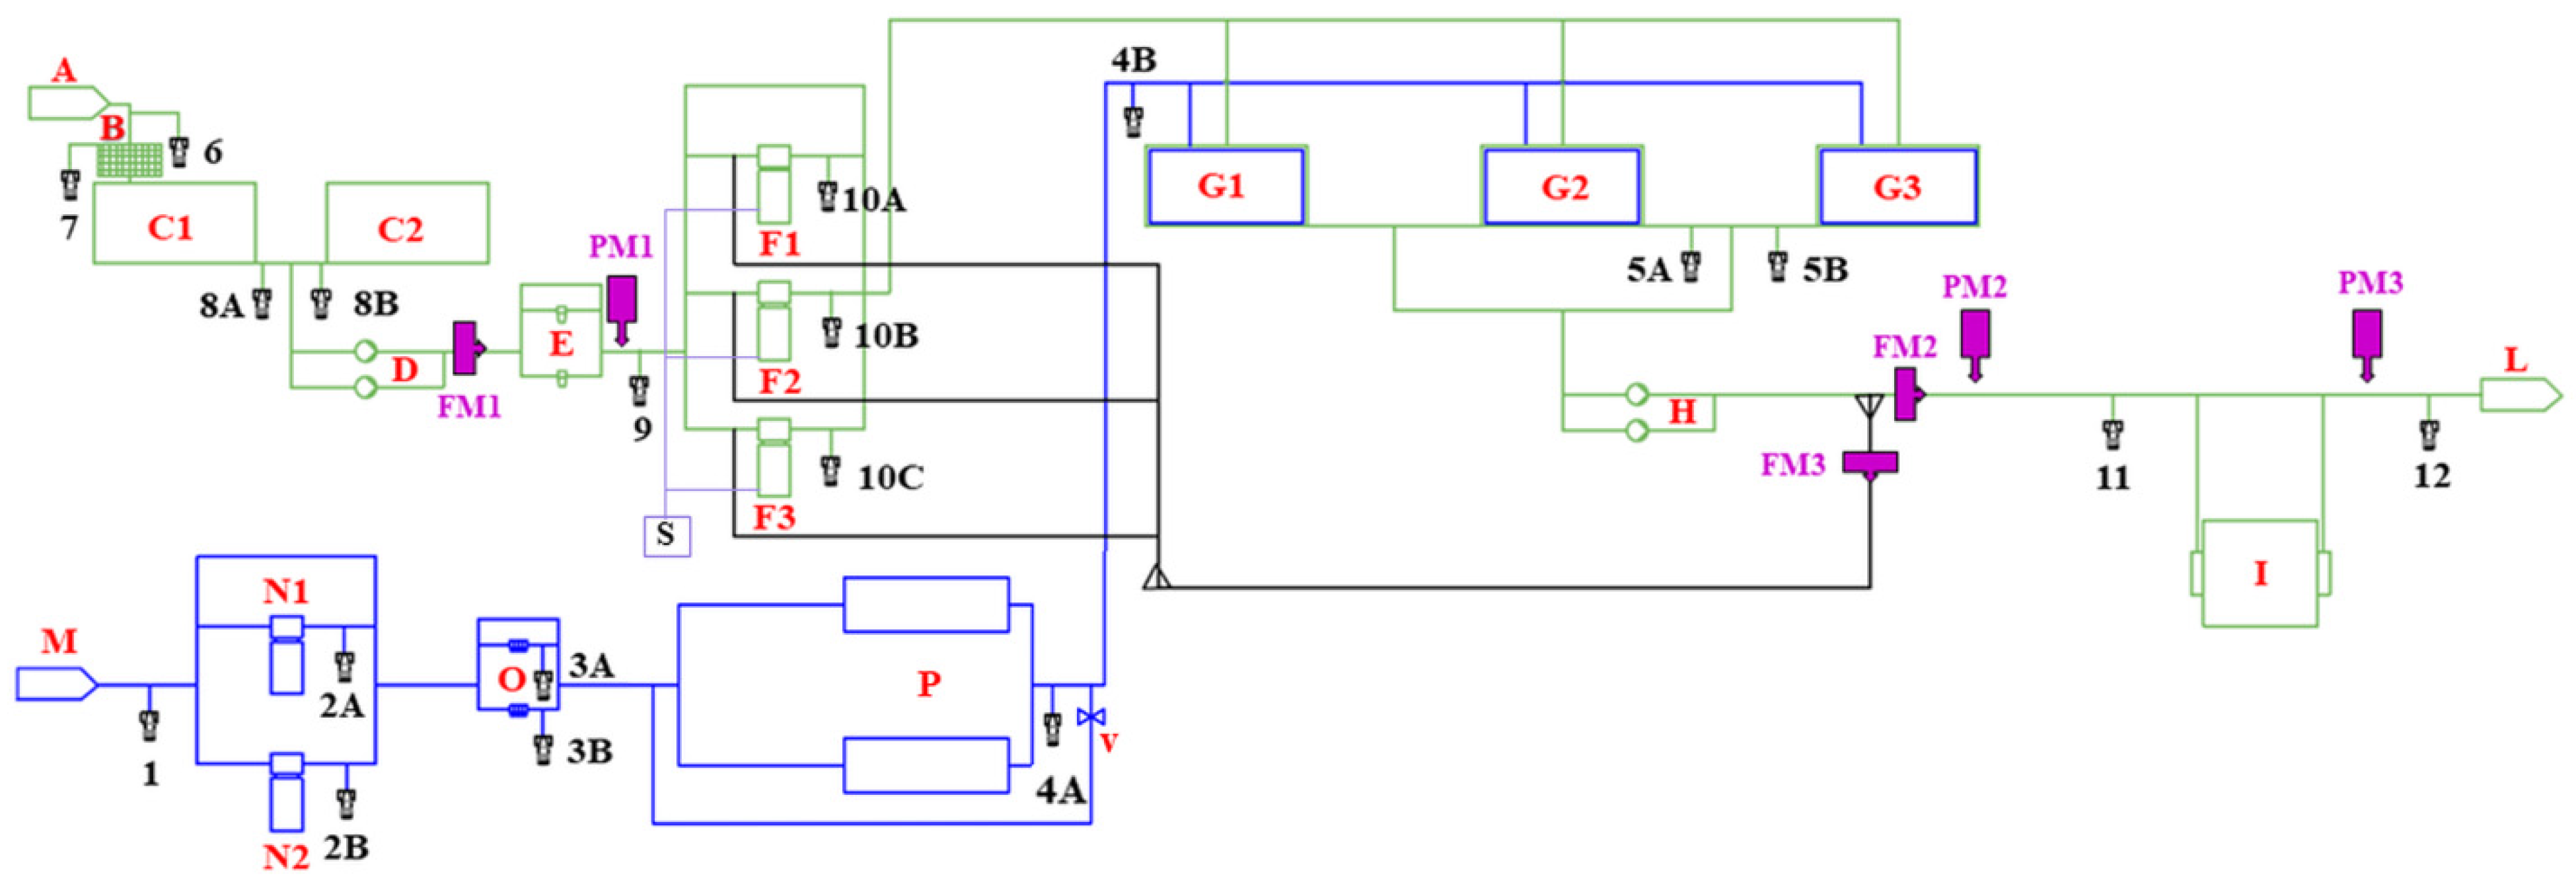
Sampling Points Description
Microbiological sampling points ID1Water supply by municipal aqueduct (M)
2AActivated carbon filters (N1) outlet
2BActivated carbon filters (N2) outlet
3ACartridge filters (O) outlet—Point A
3BCartridge filters (O) outlet—Point B
4AOsmotized reintegrated water in reverse osmosis process (P) outlet section
4BDechlorinated, filtered, and osmotized reintegrated water in reverse osmosis process (P) outlet section
5AStorage tank (G2) outlet
5BStorage tank (G3) outlet
6Return from the Fountain
7Water outflow gouge from the rotary screener (B) in storage tank (C1–C2)
8AStorage tank (C1), post-scouring (bottom discharge)
8BStorage tank (C2), post-scouring (bottom discharge)
9Self-cleaning filter (E) outlet
10ASand filters (F1) outlet
10BSand filters (F2) outlet
10CSand filters (F3) outlet
11UV lamp (I) inlet
12UV lamp (I) outlet
Hydraulic
sampling point ID
PM1Pressure monitoring downstream pumps (D)
PM2Pressure monitoring before the UV Lamp (I)
PM3Pressure monitoring sent to the Fountain
FM1Flow monitoring downstream pumps (D)
FM2Flow monitoring sent to the Fountain
FM3Flow monitoring for sand filters (F1–F2–F3) backwashing
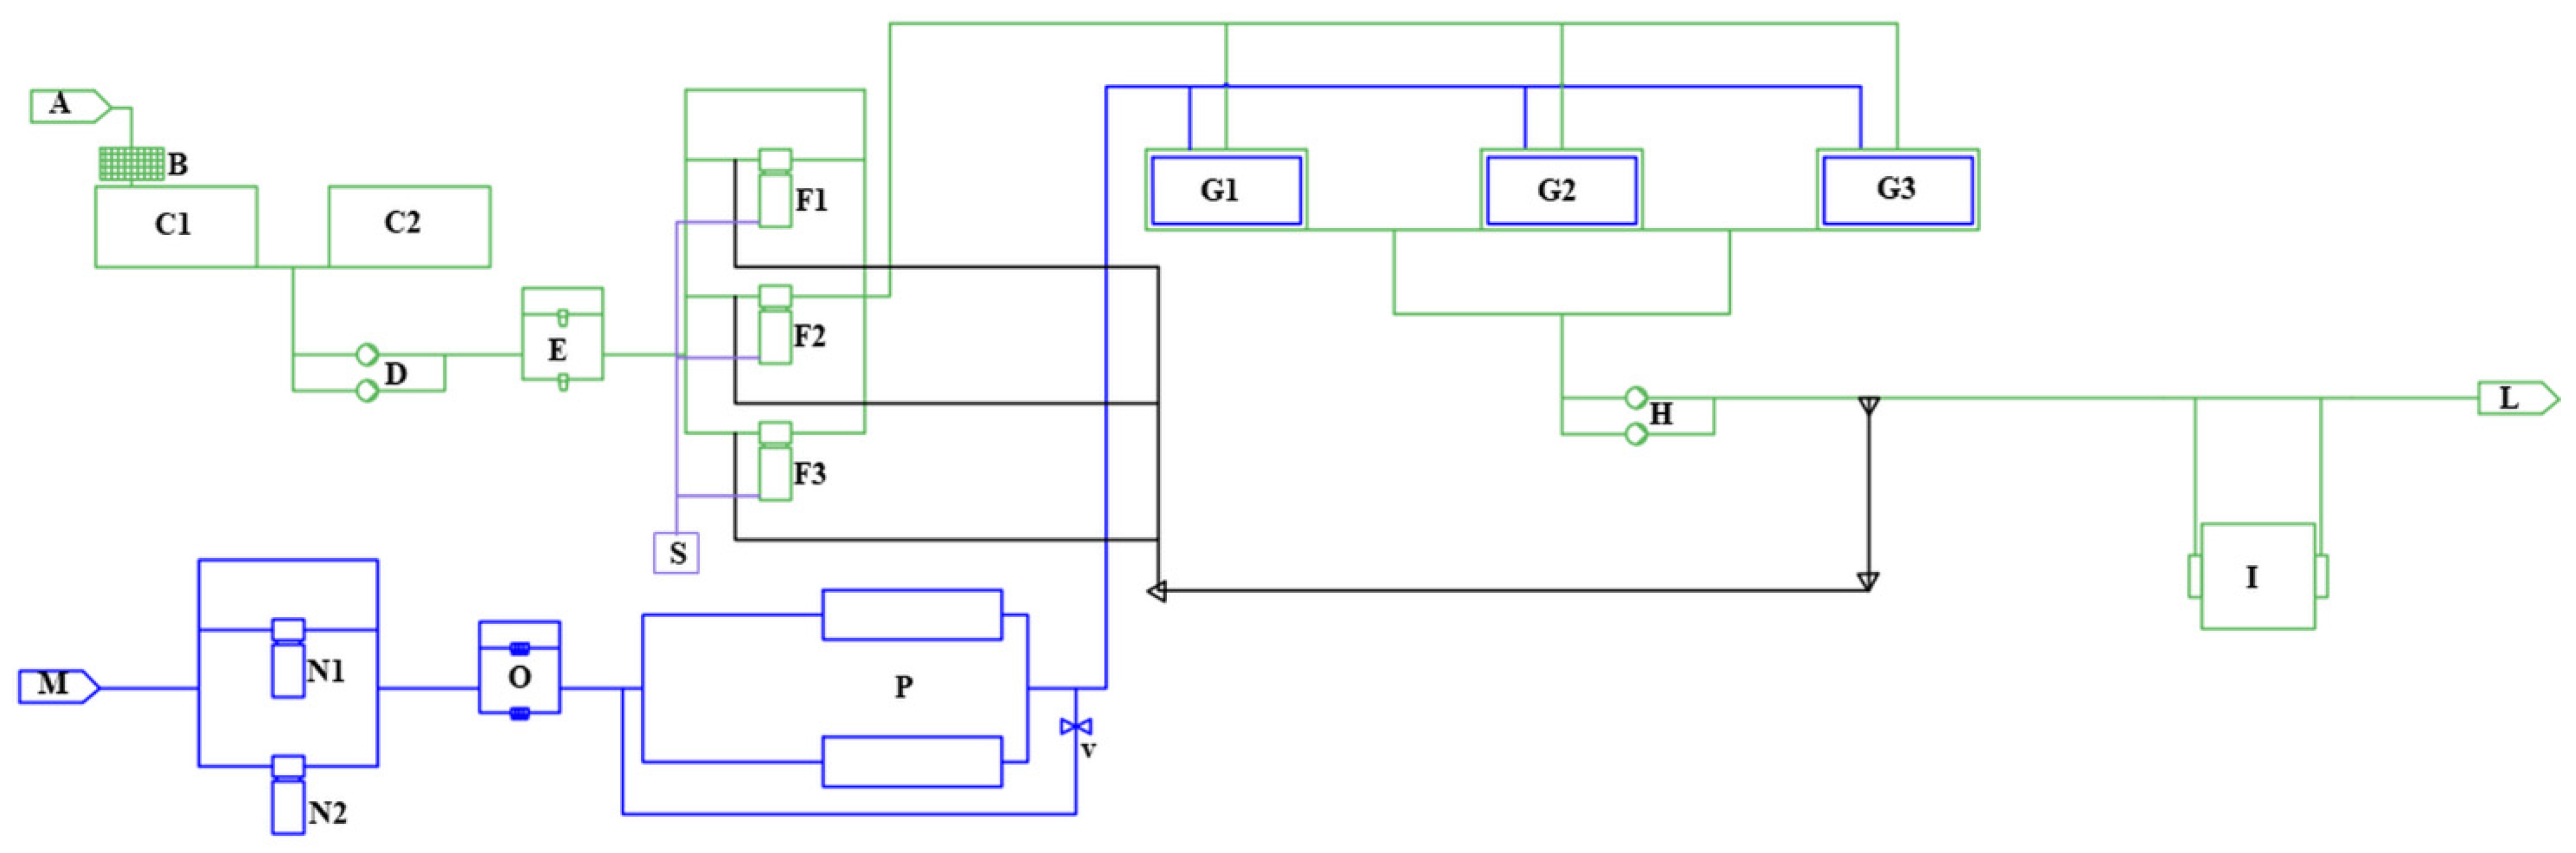
Table 2. Details of RS and WTS modules. The colors used for different modules are the same reported in the Figure 6.
RSMODULE I—PRIMARY REINTEGRATION WATER TREATMENT
From municipal aqueduct (M), two in parallel activated carbon filters (N1–N2), eight 5-micron cartridge filters (O), and it ends at reverse osmosis process (P) inlet section. Sampling points: 1, 2A, 2B, 3A, 3B.
MODULE II—SECONDARY REINTEGRATION WATER TREATMENT
From reverse osmosis process (P) inlet section and it ends at reverse osmosis process (P) outlet section.
MODULE III—REINTEGRATION ACCUMULATION
From reverse osmosis process (P) outlet section, and it ends at storage (G1–G2–G3) inlet section. Sampling points: 4A, 4B.
WTSMODULE IV—RETURN FROM THE FOUNTAIN
From Neptune Fountain basin (A), and it ends at rotary screener (B) inlet section. Sampling points: 6
MODULE V—PRE-TREATMENT
From rotary screener (B) outlet section, storage tanks (C1–C2), through self-cleaning filters (E) and it ends at sand filters (F1–F2–F3) inlet section. Sampling points: 7, 8A, 8B, 9.
MODULE VI—PRIMARY TREATMENT
From sand filters (F1–F2–F3) inlet section and it ends at storage (G1–G2–G3) inlet section. Sampling points: 10A, 10B, 10C.
MODULE VII—ACCUMULATION
From storage (G1–G2–G3) inlet section, two pumps in parallel (H) and it ends in two directions: at UV lamp inlet section and the line used to wash the sand filters (F1–F2–F3). Sampling points: 5A, 5B.
MODULE VIII—SECONDARY TREATMENT
From UV lamp (I) inlet section, and it ends at UV lamp (I) outlet section. Sampling points: 11, 12.
MODULE IX—SENDING TO THE FOUNTAIN
From UV lamp outlet section, and it ends at the beginning section of the transport pipe to the Fountain.
MODULE X—OTHER
All parts that should be turned off at steady state in WST and RS.
Table 3. The microbiological results in the WTS Neptune Fountain during the monitoring period 2018–2021. S1 and S2 represent the ordinary monitoring; S3 represents the sampling after extraordinary maintenance activity.
Sampling PointsYearsMicrobiological Parameters
Range of Contamination: Min–Max (ufc/mL)
HPC at 37 °C cfu/mLHPC at 22 °C cfu/mLP. aeruginosa cfu/100 mLC. perfringens cfu/100 mLFecal coliforms cfu/100 mLE. coli cfu/100 mLS. aureus cfu/100 mLEnterococci cfu/100 mL
Module I—Primary reintegration water treatment
(sampling points: 1, 2A, 2B, 3A, and 3B)
20181–6121–2210–70–1AbsentAbsentAbsentAbsent
2021 (S1)4–6681–332AbsentAbsentAbsentAbsent0–1Absent
2021 (S2)1–641–8731–61Absent0–57AbsentAbsentAbsent
2021 (S3)1–32802–52000–1Absent105–140AbsentAbsentAbsent
Module III—Reintegration accumulation
(sampling points: 4A and 4B)
2018810–1204712–98088–125Absent6–15AbsentAbsentAbsent
2021 (S1)163–22558–79AbsentAbsentAbsentAbsentAbsentAbsent
2021 (S2)23–30328–3747–125Absent100–300Absent0–10Absent
2021 (S3)1–12–4AbsentAbsentAbsentAbsentAbsentAbsent
Module VII—Accumulation
(sampling points: 5A and 5B)
201815–7924–371–3AbsentAbsentAbsentAbsentAbsent
2021 (S1)11–1296–97Absent9–19Absent2–31–82–7
2021 (S2)79–34650–35613–135Absent1–310Absent0–10Absent
2021 (S3)1–11–2AbsentAbsentAbsentAbsentAbsentAbsent
Module IV—Return from the fountain
(sampling point: 6)
2018n.d.n.d.n.d.n.d.n.d.n.d.n.d.n.d.
2021 (S1)35–69750–1100Absent5–14Absent3–66–150–1
2021 (S2)n.d.n.d.n.d.n.d.n.d.n.d.n.d.n.d.
2021 (S3)n.d.n.d.n.d.n.d.n.d.n.d.n.d.n.d.
Module V—Pre-treatment
(sampling points: 7, 8A, 8B and 9)
20182–3279–34010–20AbsentAbsentAbsentAbsentAbsent
2021 (S1)4–768258–436Absent10–210–93–274–360–4
2021 (S2)121–162221–89010–420–15–150Absent0–2Absent
2021 (S3)1–42–3AbsentAbsentAbsentAbsentAbsentAbsent
Module VI—Primary treatment
(sampling points: 10A, 10B and 10C)
201879–155156–34010–12AbsentAbsentAbsentAbsentAbsent
2021 (S1)29–40125–175Absent6–9Absent2–76–150–7
2021 (S2)6240–280006720–6080022–13615–44100–125Absent0–11023–156
2021 (S3)0–12–5AbsentAbsentAbsentAbsentAbsentAbsent
Module VIII—Secondary treatment
(sampling points: 11 and 12)
20181–384–620–1AbsentAbsentAbsentAbsentAbsent
2021 (S1)1–71–131Absent0–15Absent0–20–60–6
2021 (S2)2–1361–1360–115Absent0–120AbsentAbsentAbsent
2021 (S3)1–11–1AbsentAbsentAbsentAbsentAbsent0–17
Note: n.d.: not determined.
Table 4. Average hydraulic parameters resulting in the Neptune Fountain WTS during the monitoring.
Sampling Points Hydraulic Parameters
Range of Operation: Min–Max
Flow
(m3/h)
Pressure
(bar)
Module V—Pre-treatmentFMI6.700
PM1 1.68
Module VII—AccumulationFM25.395
PM2 2.05
Module IX—Sending to the fountainPM3 1.97
Module X—OtherFM34.800
Disclaimer/Publisher’s Note: The statements, opinions and data contained in all publications are solely those of the individual author(s) and contributor(s) and not of MDPI and/or the editor(s). MDPI and/or the editor(s) disclaim responsibility for any injury to people or property resulting from any ideas, methods, instructions or products referred to in the content.

