Article

Reconstructing 273 Years of Potential Groundwater Recharge Dynamics in a Near-Humid Monsoon Loess Unsaturated Zone Using Chloride Profiling

1
Department of Hydraulic Engineering, Yangling Vocational & Technical College, Xianyang 712100, China
2
Key Laboratory of Agricultural Soil and Water Engineering in Arid and Semiarid Areas of Ministry of Education, Northwest A&F University, Xianyang 712100, China
3
College of Economics & Management, Northwest A&F University, Xianyang 712100, China
4
Hunan Xiangyi Laboratory Instrument Development Co., Ltd., Changsha 410200, China
*
Authors to whom correspondence should be addressed.
Water 2024, 16(15), 2147; https://doi.org/10.3390/w16152147 (registering DOI)
Submission received: 14 June 2024 / Revised: 22 July 2024 / Accepted: 27 July 2024 / Published: 30 July 2024
(This article belongs to the Special Issue New Application of Isotopes in Hydrology and Hydrogeology)

Abstract

:
Understanding the historical groundwater recharge process and its influencing factors is crucial for effectively managing regional groundwater resources amidst future climate change. However, the availability of high-resolution hydroclimate archives remains severely limited. In this study, we used a 59 m chloride profile within the unsaturated loess zone to reconstruct the potential groundwater recharge (PGR) records spanning 273 years in a near-humid area on the Loess Plateau. Spectral analysis was employed to identify the principal influencing factors on PGR across various time scales. The reconstructed hydrological records revealed three wet periods and four dry periods from 1745 to 2007 AD, with PGR rates ranging from 66.7 to 222.4 mm yr−1 during wet periods and 20.0 to 66.7 mm yr−1 during dry periods. In addition, spectral analysis indicated multiple cycles, ranging from 2.1 to 50.0 years, within the PGR history. Temperature, precipitation, and sunspot activity emerged as the key factors governing the rate of PGR over the 3-year, 7-year, and 11-year time scales, respectively, highlighting the combined influence of solar activity and climate on the PGR process. These findings enhance our understanding of groundwater recharge and environmental climate dynamics in the near-humid loess unsaturated zone and other regions exhibiting similar hydroclimatic conditions.

1. Introduction

Groundwater plays a crucial role in the terrestrial water cycle, offering vital resources for human development and ecological functions in natural systems [1,2]. Potential groundwater recharge (PGR), defined as net-infiltration below the extinction depth [3], in the unsaturated zone (USZ), serves as a critical link between surface climate elements (e.g., precipitation, evapotranspiration, runoff) and groundwater [4]. Therefore, studying the history of PGR and its controlling factors is crucial for understanding the evolution of PGR and predicting groundwater recharge under future climate change [5]. However, due to limited meteorological observation periods and technological constraints, long-term instrumental climate records in most regions are notably brief, so identifying enduring climate or hydrological patterns is challenging. Consequently, attention has shifted towards exploring and utilizing paleoclimate data to enhance global and regional climate archives and advance comprehension of complex climate systems. The reconstruction of long-term climate histories using various proxy indicators, such as ice cores, tree rings, speleothems, and chloride in the USZ [6,7,8,9], has emerged as a crucial pursuit.
Among these indicators, chloride concentration in USZ pore-water has made significant strides in recording groundwater recharge fluctuations and identifying ancient climate events, benefiting from its cost-effective, practical, versatile, and eco-friendly characteristics. Chloride tracing technology has been widely used to reconstruct PGR history [10]. Initially, the chloride mass balance (CMB) method was used for estimating net recharge [11], and it gained widespread acceptance and application. Edmunds and Tyler [12] successfully estimated the vertical infiltration recharge rates of groundwater in the Minqin Basin using the CMB method. Ma [13] delineated dry/wet periods over the past 1185 years using vadose zone soil columns in the Badain Jaran Desert. The Cl tracer technique has been further developed in subsequent studies to accurately determine the age of soil-water [14,15,16]. However, the studies primarily focus on arid regions due to the well-preserved Cl proxy in dry soil profiles [17]. Nevertheless, the sluggish movement of water causes an accumulation of chloride in the superficial soil layers, often resulting in reduced resolution in the retrospective assessment of PGR. To date, there have been few studies on reconstruction recharge records in humid regions utilizing chloride from deep USZ [18]. On the other hand, these studies predominantly categorized climates into “dry and wet” distinctions. Yet, the exploration of deeper climatic insights from historical groundwater recharge records remains limited, particularly in investigating the climate drivers behind PGR variations and their associated response mechanisms.
Temporal and spatial variations in groundwater recharge serve as valuable records for documenting long-term climatic and hydrological changes [19]. PGR records within the USZ encapsulate a wealth of historical climate data because they establish a crucial link between fluctuations in climate patterns on the earth’s surface (e.g., precipitation, temperature, and evapotranspiration) and the groundwater [20,21]. In addition, there is evidence that solar activity exerts a significant influence on hydrological cycles and water availability through intricate, multi-scale feedback mechanisms [22]. Solar energy propels climate change by modulating regional weather patterns and local precipitation or air temperatures, thereby inducing modifications in precipitation characteristics and the hydrological process in the USZ. Nonetheless, scant attention has been paid to these inquiries about PGR and its responsiveness to the influence of climate variability and solar activity.
Therefore, this study, utilizing chloride tracing technology, aims to: (1) reconstruct the historical record of PGR in a near-humid region using USZ Cl; and (2) investigate the climatic drivers impacting recharge variations in the region. The findings may contribute to comprehending the PGR and environmental climate dynamics in humid areas.

2. Materials and Methods
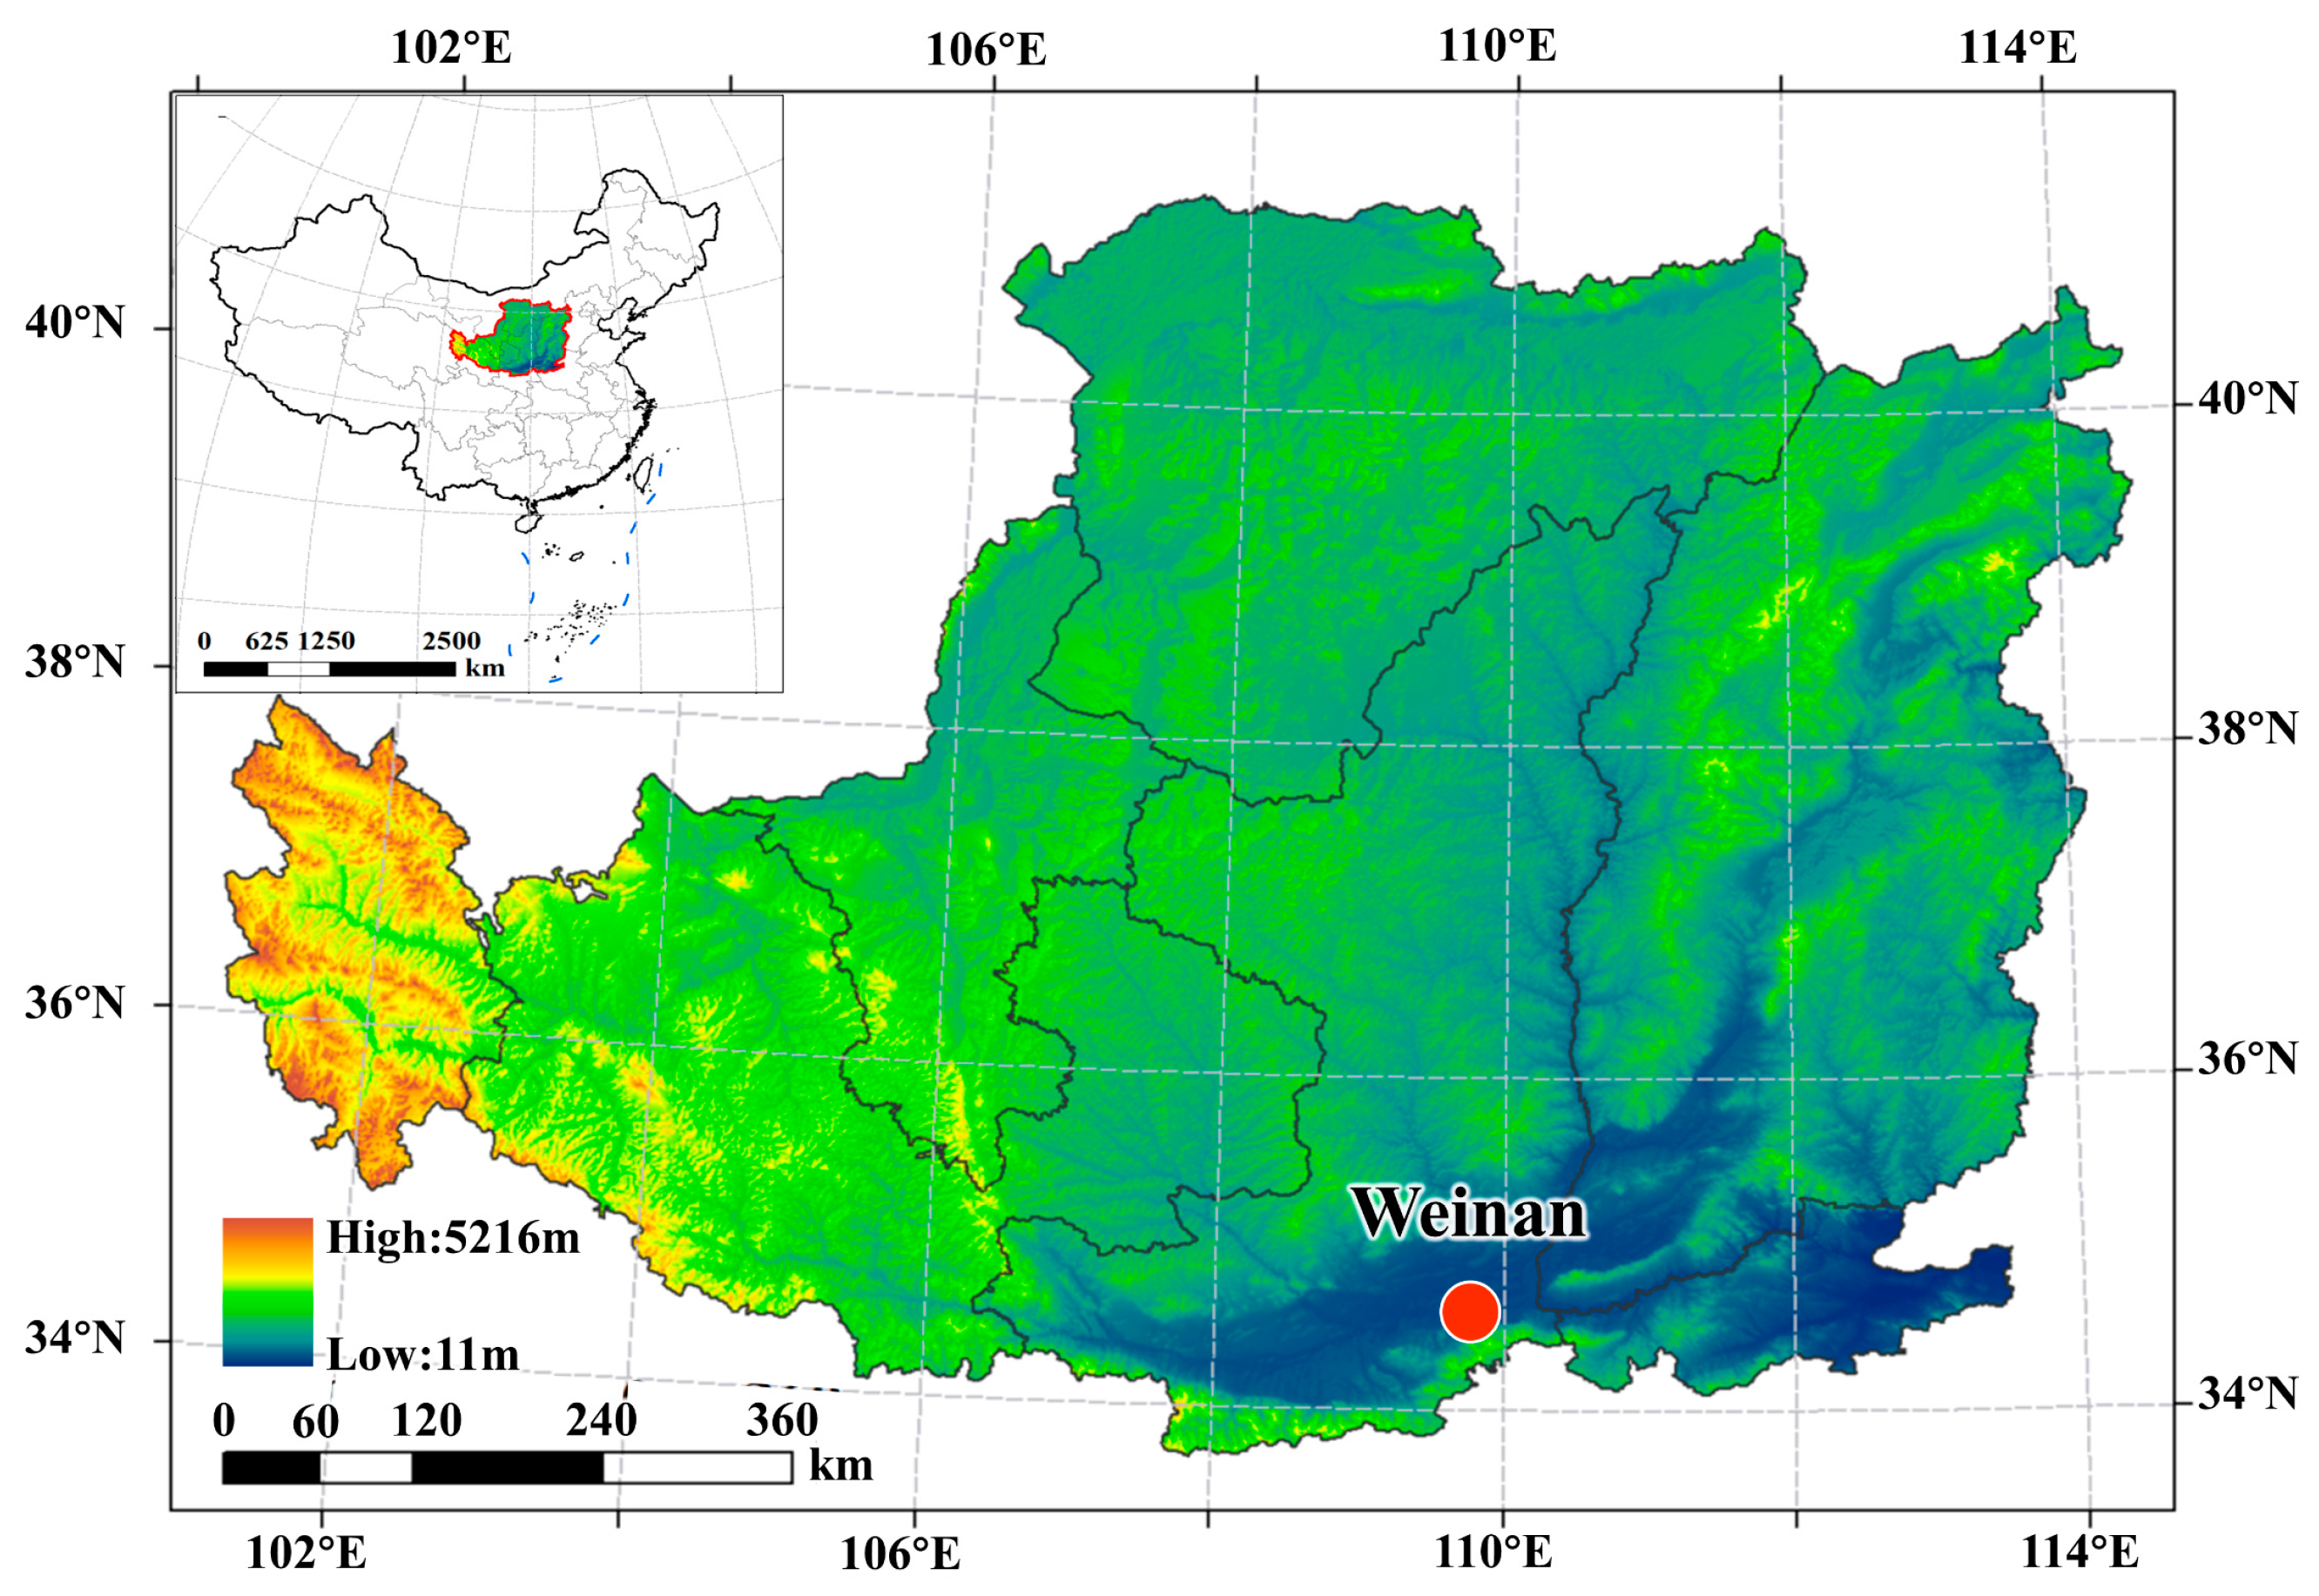
2.1. Study Area

Our fieldwork was conducted on the Changshou loess-tableland, located in Weinan, on the southwestern Loess Plateau, China (34°22′ N,109°34′ E; Figure 1). The site has an elevation of 600–700 m above sea level and experiences a warm temperate continental monsoon climate. Precipitation is unevenly distributed throughout the year, around 600 mm annually, with the highest levels in July and August, placing the study site close to a humid region. The average annual temperature stands at 14 °C, while reference evaporation ranges between 500 and 600 mm. The predominant land use type is rain-fed winter wheat and summer maize, without irrigation. Geographically, the Changshou Plateau is an isolated expanse of loess, intersected by the Chishui River, Taki River, and Zero River. Its geomorphology resembles an encompassing dome, preventing lateral recharge; thereby, the plateau functions as a self-contained hydrogeological unit. Additionally, the soil layers exhibit horizontal homogeneity on the loess-tableland [23].

2.2. Soil Sampling and Measurement

The sample site was selected in newly cultivated farmland to minimize the effect of fertilizer on chloride input. A soil core was drilled on the Changshou tableland in 2019, reaching the groundwater table at a depth of 64 m. A high-power pressure device (DPP 100, BJTK Company, Beijing, China) was used to obtain soil core samples by applying pressure to a metal cylinder with a diameter of 12 cm and a length of 50 cm. Five soil samples were collected at 20 cm intervals for measuring mass water content (θm), bulk density (ρ), magnetic susceptibility (MS), soil water Cl concentration, and tritium activity (3H), respectively. Details of sampling and measurement can be found in [18]. Furthermore, precipitation and temperature data (1961–2018) were sourced from the China Meteorological Data Network (https://data.cma.cn/), and sunspot numbers (1700–2020) were acquired from the SILSO website (WDC-SILSO, Royal Observatory of Belgium, Brussels. https://www.sidc.be/silso/datafiles, accessed on 5 November 2023).

2.3. Potential Groundwater Recharge Reconstruction

Chlorine within the USZ shows significant inertness, as it resists chemical reactions and maintains high solubility [10]. The concentration of Cl in the soil profile is primarily influenced by evapotranspiration and precipitation, assuming that precipitation is the only source of Cl. Therefore, Cl concentration could serve as an indicator of weather and environmental dynamics in the topsoil. The Cl signatures formed in the topsoil layer can be conserved and transported through vertical downward piston flow, ultimately reaching the groundwater [17]. Based on the principle of mass conservation, the potential groundwater recharge of the USZ can be calculated using (the chloride mass balance method, CMB):
R = P C P C S W = D C S W
where R stands for the PGR rate, precipitation input to the USZ that has not yet entered the groundwater, mm yr−1; D is the Cl input flux, mg m−2 yr−1, calculated based on the long-term annual precipitation (P); CP represents the Cl concentration of precipitation; and CSW is the Cl concentration in the soil pore water in the USZ, mg L−1 [24].
In addition, the residence time of both water and Cl within the USZ could be estimated by the Chloride Age Accumulation method (CAA), transforming the spatial Cl signal along the soil profile into a potential recharge history over time [16]. This method assumes that the influx of Cl remains constant and unchanging over time. Consequently, the accumulation time (Tz) of total Cl within the soil profile, spanning from the surface to a specified depth (Z), can be extrapolated:
T Z = 0 Z θ V C S W d z D
where θv is the volumetric water content of each soil layer (0 – Z m); Z is the depth, m; other symbols have the same meaning as in Equation (1).

2.4. Uncertainty Analysis

Uncertainties in estimating recharge rate and Cl cumulative time mainly come from the uncertainty of Cl input and output for the USZ. The degree of uncertainty depends on the spatial and temporal variability of properties and errors in measurement. By extrapolating standard errors linked to chloride inputs and outputs, we can infer the uncertainties associated with potential groundwater recharge and soil water residence time [25]:
σ R = f D 2 σ D 2 + f C S W 2 σ C S W 2
σ R / R ¯ = σ D D ¯ 2 + σ C S W C S W ¯ 2 × 100 %
σ T Z = f D 2 σ D 2
σ T Z / T = σ D D ¯ × 100 %
where σ(∙) is the standard deviation of a determinant variable at time scale n, which can be calculated by S D / n ; SD stands for the standard deviation; f / f · represents the partial derivative of f with respect to a variable; f is the function of a determinant variable.

2.5. Spectral Analysis

Spectral analysis, based on the principle that a time series can be depicted as a linear combination of cosine and sine waves, aids in identifying potential cycles within the series. This method involves plotting the spectral density of variance, where identifiable harmonics (represented by prominent peaks) appear as periodic components, with the inverse of their frequencies defining their cycles [26]:
r k = t = 1 n k x t + k x ¯ x t x ¯ t = 1 n x t x ¯ 2
S ^ f j = 2 1 + 2 k = 1 m D k r k cos 2 π f j k
D k = 0.54 + 0.46 cos π k m
where rk is the sample autocorrelation coefficient, n is the number of samples; when n > 50, m < n/4; when n > 50, m = n/4 or m = n − 10; S f is the variance spectral density function; k is the lag time; k = 1, 2, …, m; Dk is a spectra window (weight factor or window function), which is a gentle treatment to obtain an effective and unbiased variance spectral density during calculation.
Through traditional spectral analysis, the characteristic cycles embedded in long time series can be extracted. Analyzing the “similarity” and “difference” between the recharge cycles and their influencing factors can help reveal the groundwater recharge evolution.

3. Results

3.1. Soil Characteristic and Hydrological Information in the USZ

The soil magnetic susceptibility (MS) along the 64 m profile exhibits a distinct layered distribution. The distinct peaks and valleys correspond to sediments from interglacial and glacial periods, respectively (Figure 2a). The volumetric water content (θv) exhibits significant fluctuations throughout the USZ, with an average value of 0.30 ± 0.05 cm3 cm−3. This pattern closely corresponds to the trend of MS, suggesting a higher volumetric water content in the paleosol layer (Figure 2b). The correlation coefficient between MS and θv was 0.32 (p < 0.01), showing a weak positive correlation.
Average Cl concentrations throughout the USZ are 16.0 ± 7.6 mg L−1, with different degrees of fluctuation along depth. In general, Cl concentrations in the upper soil layer (0–2 m, 31.7± 10.4 mg L−1) were significantly higher than at deeper depths (>2 m, 15.4 ± 6.9 mg L−1) (Figure 2c). This may be a result of the chemical fertilizer application on farmland since 1978 [27]. The tritium isotope (3H) content at different depths is presented, and the data were fitted by the Lorenz curve (Figure 2d). The tritium has a well-defined bell-shaped distribution. The tritium peak appeared at around the depth of 14.1 m, indicating that the tritium-bearing precipitation from 1963 has migrated to 14.1 m in the USZ.

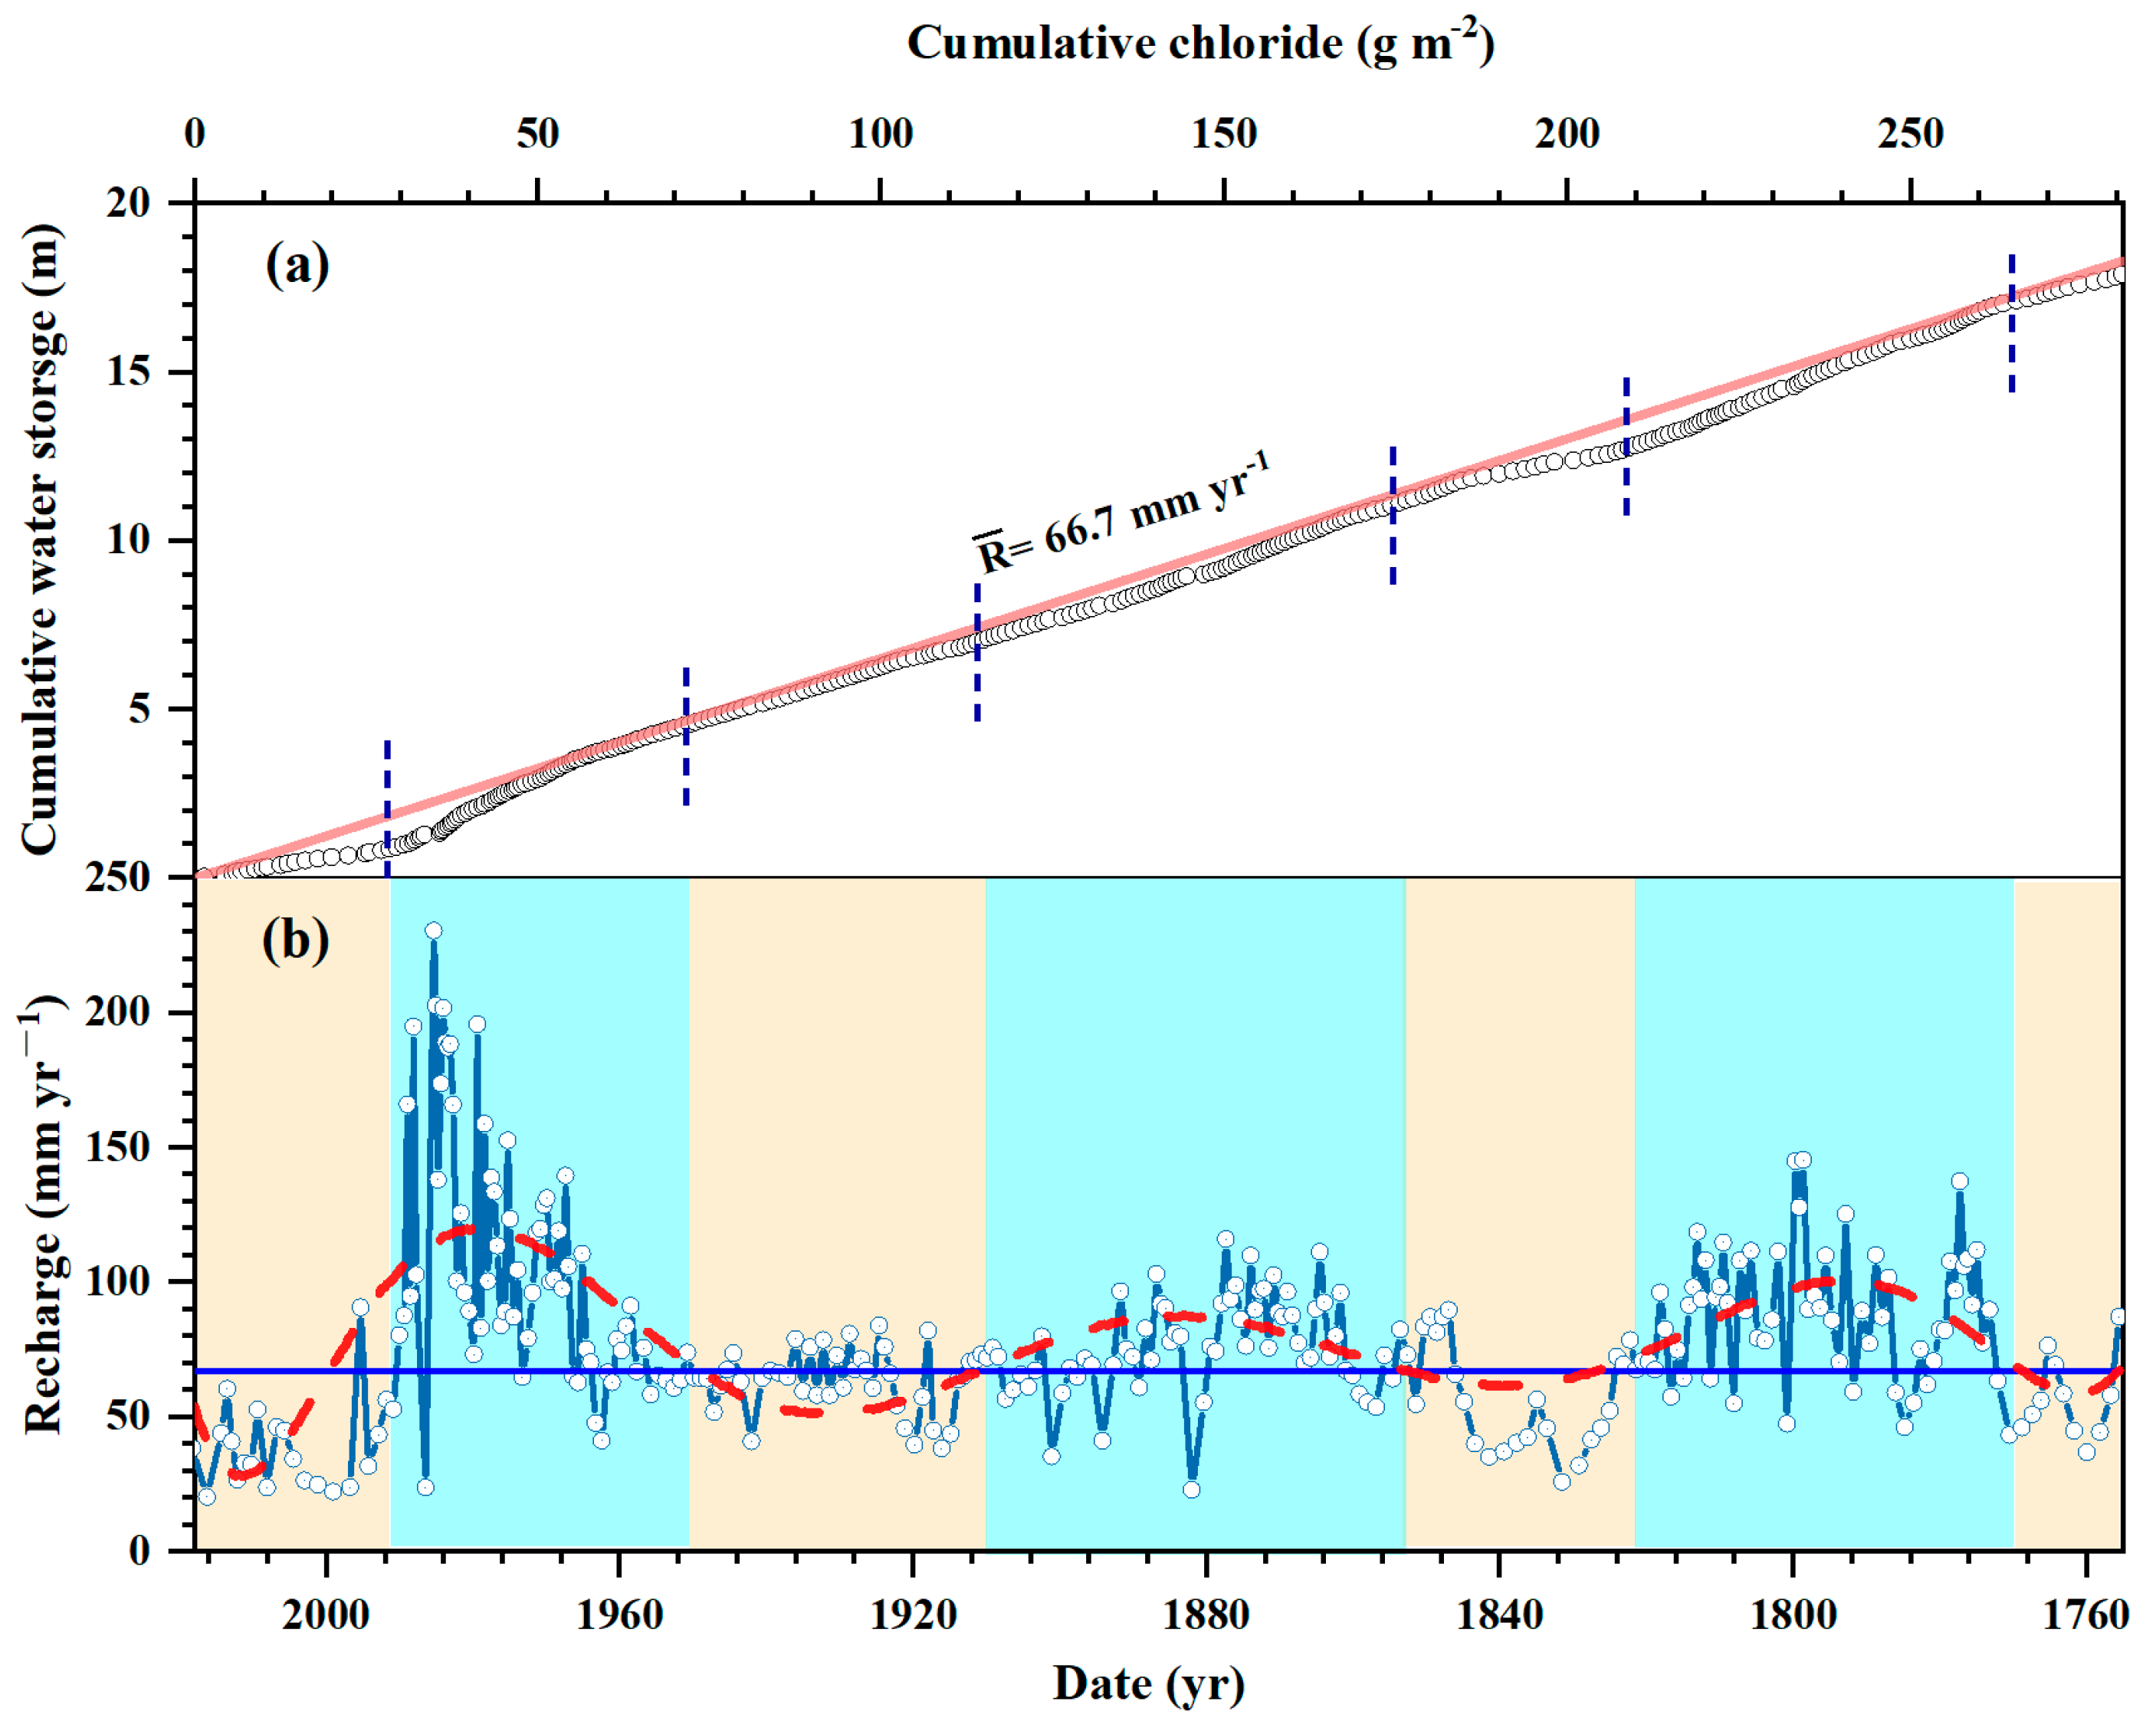
3.2. Potential Groundwater Recharge History and Its Uncertainty

Precipitation samples were collected at our study site during 2015–2018. The average Cl concentration of precipitation and annual precipitation amount were 1.77 mg L−1 and 581 mm, respectively. Therefore, annual Cl deposition was 1027.2 ± 87.9 mg m−2 yr −1 in the study area, which is consistent with Lu’s results [10]. Additionally, the depth between 2.0 and 59.0 m was selected as the steady migration zone (Figure 2) because the Cl signatures could be influenced by non-uniform flow and seasonal kinetic fractionation in the 0–2 m surface soil and groundwater might affect the Cl concertation within the 5 m soil layer above the water table [18].
Given that the long-term Cl input flux was 1027.2 mg m−2 yr−1, the soil profile in the USZ (2.0–59.0 m) preserves approximately a recharge history of 273 years, covering from 1745 to 2007 AD (Figure 3a). Based on the atmospheric Cl input flux and the weighted average Cl concentration (15.4 mg L−1) of the USZ (2.0–59.0 m), the average recharge rate was calculated to be 66.7 mm yr−1, which is about 11.5% of the annual precipitation amount. If the average recharge rate serves as a reference line, the period with a slope > 67 mm yr−1 can be classified as a wet period, while the period with a slope of <67 mm yr−1 is a dry period (Figure 3a). As depicted in Figure 3b, the relatively wet climate periods are distributed across AD 1772–1822, 1846–1881, and 1962–1988, with recharge rates between 66.7 mm yr−1 and 222.4 mm yr−1. While the periods of relative dryness are predominantly found within AD 1756–1772, 1822–1846, 1881–1942, and 1988–2007, with recharge rates ranging from 20.0 to 66.7 mm yr−1. The groundwater recharge variations over the past three centuries indicate a pattern of three alternating periods of relative wetness and four periods of relative dryness.
Uncertainty in recharge ( σ R / R ¯ ) was calculated by Equations (3)–(6), and the magnitude of σ R / R ¯ is mainly affected by Cl input flux and soil water Cl concentration. The value of σ R / R ¯ is a function of time and varies from 17% to 44% on the 2-year, 150-year and 273-year time scales. Furthermore, σ R / R ¯ increases positively with time scale due to the rise in σ C S W and decrease in σ D . Consequently, a 2-year resolution is identified as optimal for the recharge history because it shows the lowest uncertainty of approximately 17%, with 34% from σ D and 66% from σ C S W .

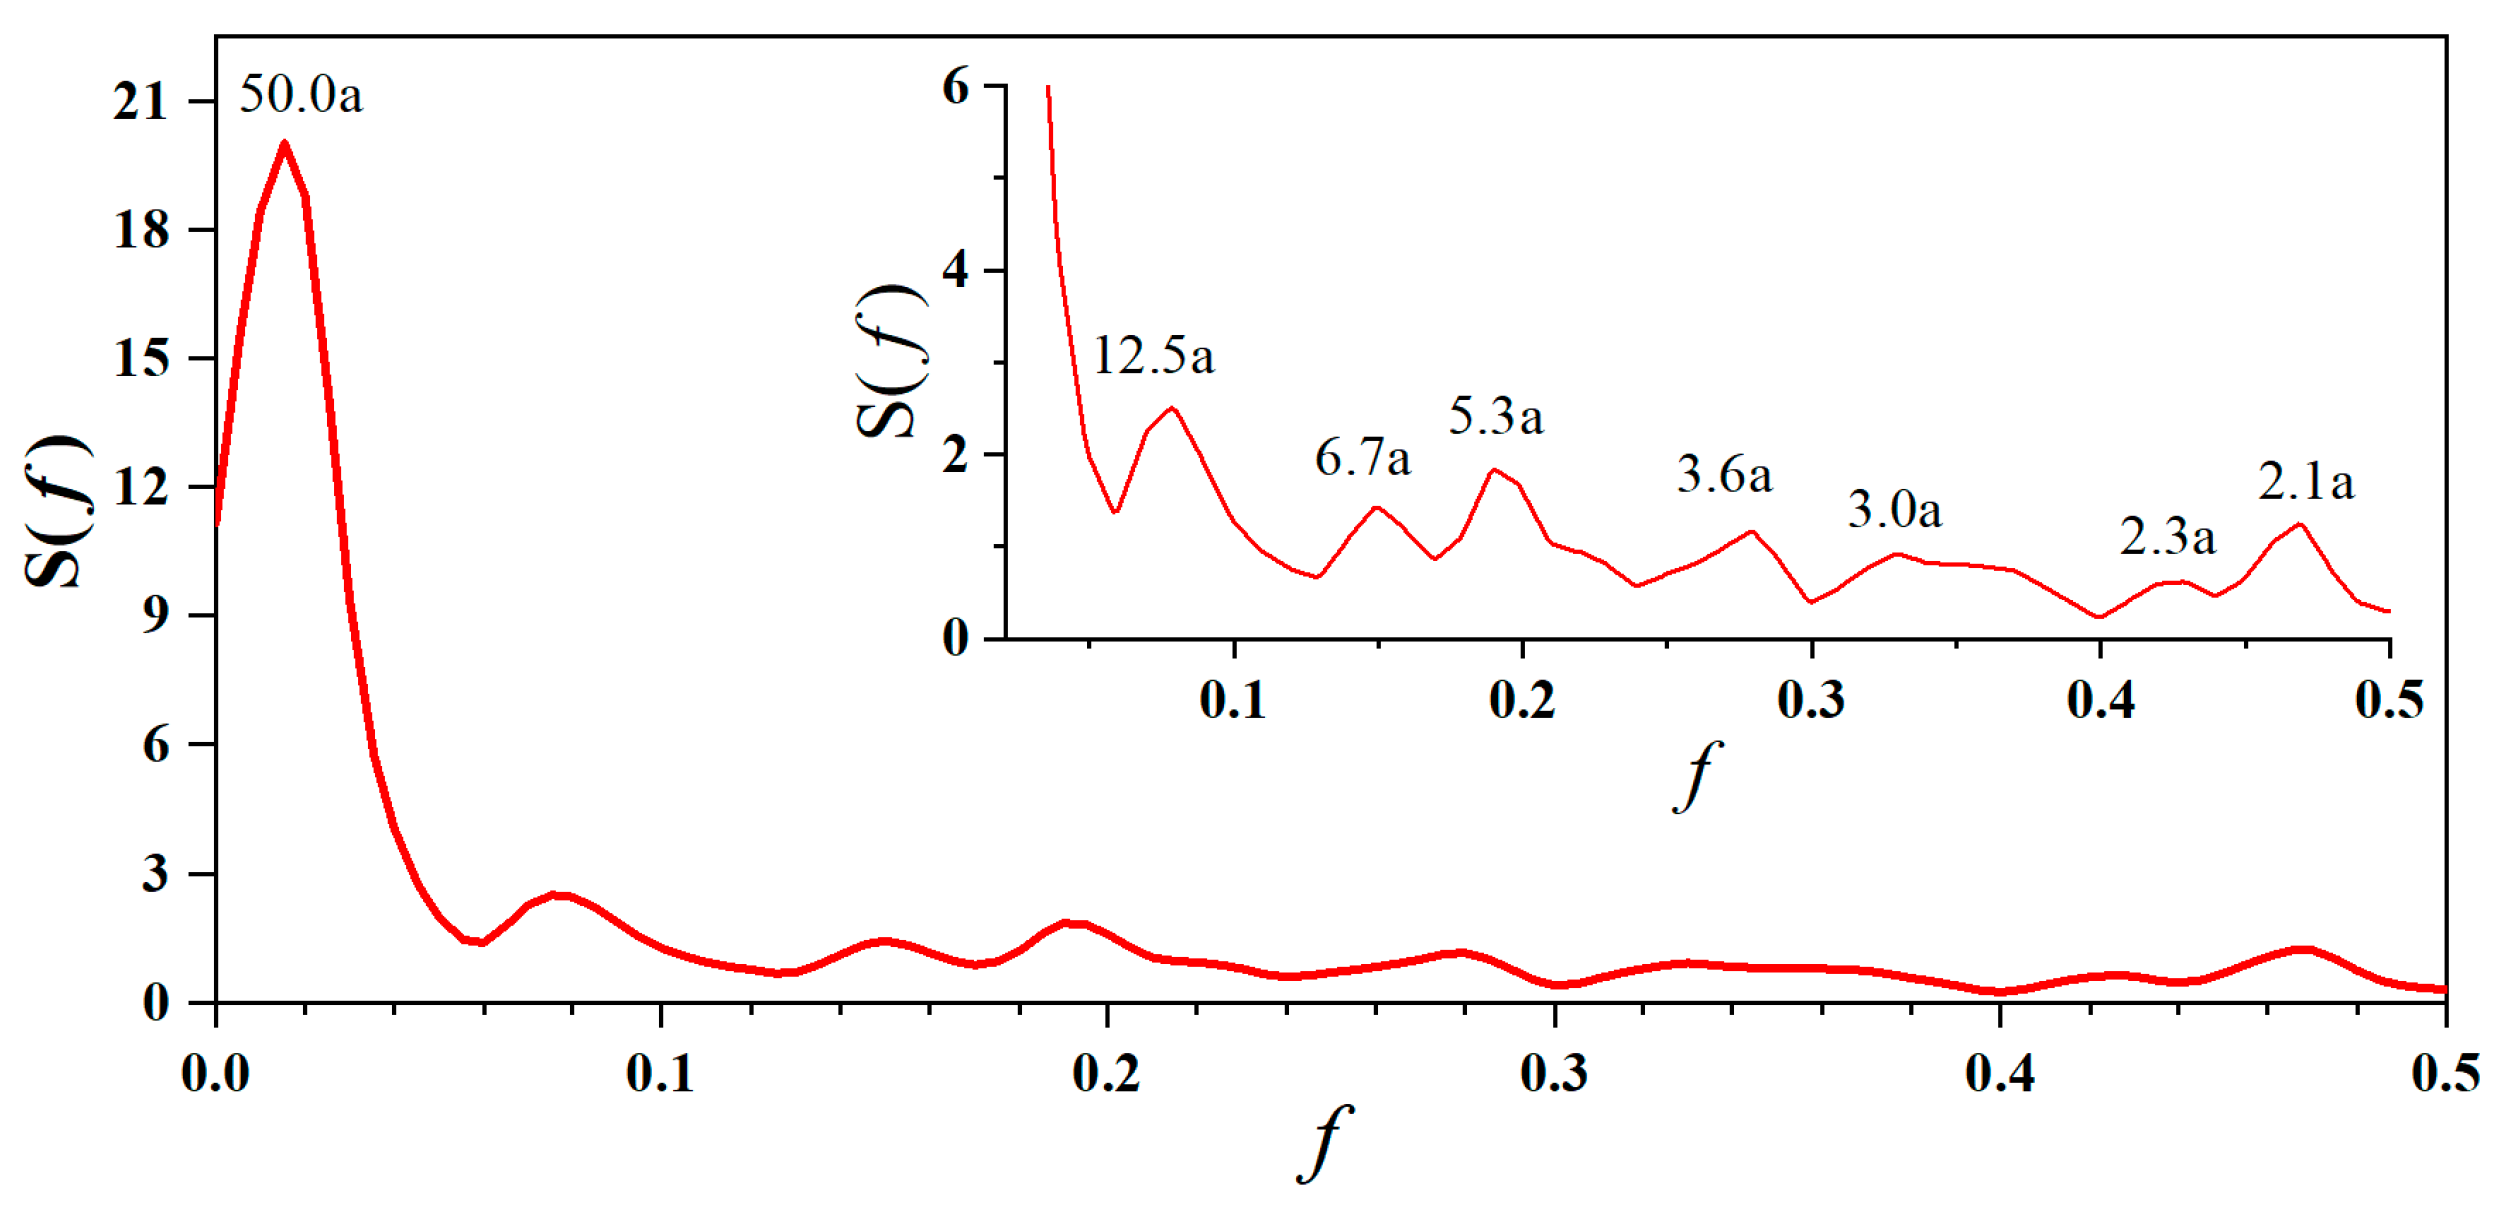
3.3. Characteristic Cycle of the Recharge History and Its Potential Factors

The potential groundwater recharge history exhibits multiple significant frequencies of 0.02, 0.08, 0.15, 0.19, 0.28, 0.33, 0.43, and 0.47 (Figure 4), suggesting the presence of eight significant characteristic cycles. These cycles include 50.0-year and 12.5-year cycles on the interdecadal scale, as well as 6.7, 5.3, 3.6, 3.0, 2.3, and 2.1-year cycles on the interannual scale.
Spectral analysis further indicates that precipitation in the study area exhibits four significant frequencies, corresponding to cycles of 2.2, 3.5, 7.0, and 28.0 years. Temperature, on the other hand, has two significant frequencies, corresponding to 2.3-year and 4.0-year cycles. Due to the proximity of these two temperature cycles, the 3-year cycle is used as the resonance cycle for the relationship between temperature and recharge in this study. Additionally, the global sunspot number and recharge in the region both display two significant resonance cycles of 5.6 years and 11.1 years, with the 11-year cycle being the recognized cycle of significance for sunspot number (Table 1).

4. Discussion

4.1. Comparison of PGR History and Other Climate Proxies

The reconstruction of PGR using Cl profiles is commonly applied in arid desert regions [17], as Cl exhibits good conservative behavior in low moisture soils [16], and arid areas are more sensitive to climate change [28]. Our study was pioneering in establishing a 273-year groundwater recharge history with a 2-year resolution using USZ Cl profiles in a near-humid region. To validate the reliability of the Cl proxy-based hydroclimatic reconstruction in the near-humid region, we collected precipitation and temperature data series from Weinan, spanning nearly 50 years (1962–2007), and conducted a comparative analysis. We found a significant positive correlation between precipitation and groundwater recharge at both 3-year and 7-year time scales (r = 0.40, p < 0.05; r = 0.62, p < 0.01; Figure 5a,b). Conversely, there was a significant negative correlation between temperature and groundwater recharge at the 3-year scale (r = −0.72, p < 0.01; Figure 5c). These relationships are logical because precipitation serves as the main source of groundwater recharge, and higher temperatures typically enhance evapotranspiration, consequently reducing rainwater [18] infiltration into the deep soil. Therefore, the comparison of different climate proxy sequences indicates that the groundwater recharge history we established aligns well with the regional climate records to a considerable extent.
Furthermore, the reconstructed recharge sequences from the near-humid region (Weinan) and the sub-humid region (Changwu), situated approximately 200 km apart, exhibit strikingly similar temporal trends [18]. Correlation analysis indicates that the records from both locations are significantly correlated (r = 0.62, p < 0.01). Both show relatively wet periods with a higher potential recharge rate during AD 1750–1800 and 1950–1995, and a relatively dry period with a lower recharge rate during AD 1800–1840. The difference is that the recharge record from Changwu spans a longer historical period, whereas the Weinan profile offers a higher resolution of recharge history with the same Cl profile depth. This suggests that the vadose zone chloride proxy in both near-humid and semi-arid regions can clearly record the fluctuations of the climate. Although the higher soil moisture content in the near-humid area is not conducive to inhibiting the diffusion and mixing of the chloride signal, the higher recharge flux makes the advection of solutes in the vadose zone often stronger than the diffusion and dispersion processes. This would separate “climate events” with a high resolution [29]. Overall, the USZ Cl can be a reliable proxy for reconstructing potential groundwater recharge history in near-humid regions.

4.2. Potential Effects on Groundwater Recharge

Precipitation effect: Our results demonstrated a positive correlation between precipitation and recharge rate over a 3-year cycle (r = 0.40, p < 0.05) and an even more significant correlation over a 7-year cycle (r = 0.62, p < 0.01). This suggests that 3-year and 7-year cycles are critical for groundwater recharge processes, and the influence of precipitation on recharge becomes more apparent over longer time scales. The multi-cycle characteristics of precipitation identified in previous studies, particularly in northwest China, align with the periodic patterns observed in this study [30,31]. While few researchers have reported common cycles of precipitation and groundwater recharge, Cao and Zheng [32] noted a similar 2–7 year cycle between groundwater levels and precipitation in the North China Plain. It is plausible to conjecture that the oscillatory cycle associated with precipitation-driven potential groundwater recharge is conceivably linked to underlying physical mechanisms.
Temperature effect: Table 2 illustrates a negative correlation between air temperature and potential groundwater recharge rate over a 3-year cycle, displaying substantial responsiveness (r = −0.72, p < 0.01). This finding is consistent with prior investigations [33,34], which identified similar temperature cycles. Notably, temperatures exhibited a phase of persistent fluctuation and minimal variance within 1962–1985, averaging at 13.6 °C, with a peak of 14.1 °C and a nadir of 13.3 °C. During the same span, the groundwater recharge rate experienced a gradual ascent, ranging from a low of 73.6 mm yr−1 in 1962 to a high of 190.2 mm yr−1 in 1983. While this does not overtly reflect temperature-recharge correspondence, local observations unveil contradictory trends. For instance, the high peaks of potential groundwater recharge around 1968, 1977, and 1983 align with the corresponding troughs in air temperature for the same period. Meanwhile, the collective trend of air temperature and potential groundwater recharge from 1985 to 2007 demonstrates an inverse pattern. In particular, after the 1990s, temperatures entered the highest period of the last 50 years, while recharge rates were at their lowest. In summary, temperature emerges as a pivotal influencer of potential groundwater recharge variations.
Solar activity effect: The sunspot number serves as a pivotal gauge of solar activity. Numerous investigations have revealed the sunspot number’s influence on hydrological elements like precipitation, runoff, and groundwater levels [35,36,37]. Notably, the sunspot number’s periodicity is not a static constant but typically encompasses a significant resonance interval of 7.3–16.1 years [38,39]. In this study, the prominent 11-year solar activity cycle was designated as the resonance period for analyzing its interplay with potential groundwater recharge alterations. This investigation uncovered a positive association (r = 0.27, p < 0.01) between sunspot number and potential groundwater recharge over the 11-year time frame. Essentially, an escalation in sunspot number corresponds to increased recharge. This correlation is visually evident in Figure 5c, manifesting a consistent and synchronous trajectory spanning nearly three centuries. Specifically, the triad of sunspot number peaks and dual troughs parallels the peaks and troughs in potential groundwater recharge shifts. This observation implies that solar activity could yield a non-negligible impact on groundwater recharge and the environmental dynamics of the Weinan Loess Plateau.
Globally, hydrological factors often exhibit a lagged effect in response to variations in solar and climatic activity [40]. This study identified varying lags between PGR records and solar or meteorological phenomena (Table 2). For instance, within a 3-year cycle, the initial peak of the recharge rate between 1975 and 1990 experienced a time delay compared to both precipitation and temperature. Considering lag time and the correlation coefficient between recharge rate and precipitation, temperature could rise to 0.42 (lag of 4 years) and −0.73 (lag of 1 year), respectively. The 21-year lag between recharge and sunspot number is consistent with findings by [41], who observed an 18-year lag between inland land temperature and sunspot activity within an 11-year cycle. Several factors may contribute to the observed lag. One factor is the physical correlation between solar activity and potential groundwater recharge, which does not act immediately but accumulates over time before its effects become apparent. Alternatively, this delay could stem from the collective impact of other climate indicators on historical groundwater recharge [42]. While our research focuses on a limited range of climate indicators, such as precipitation and temperature, both of which display some lag in relation to groundwater recharge, it hints at the potential influence of other climate indicators that collectively shape the historical groundwater recharge patterns, leading to a lag in the data record. These effects and their lags on groundwater recharge will be of great significance to predicting the future change of groundwater recharge, allowing ample time for human utilization and regulation of groundwater resources.

5. Conclusions

In this study, we utilized a deep loess USZ Cl proxy to reconstruct the potential groundwater recharge in the southwestern Chinese Loess Plateau, marking the first such attempt in a near-humid region. We examined the characteristic cycles of recharge and other climate indicators to explore their interconnections using spectral analysis. The main conclusions are as follows:
(1) Hydroclimate record reconstruction: a 273-year long PGR history with 2-year optimal resolution was successfully reconstructed with a 59 m USZ Cl profile in the near-humid monsoon region. The reconstructed PGR record aligns with other proxy records and relevant indicators of monsoon variability.
(2) Recharge rates: the mean PGR rate was 66.7 mm yr−1 during 1745 to 2007 AD, constituting approximately 11.5% of the annual precipitation amount. The PGR record revealed three relatively warm and wet periods with recharge rates varying from 66.7 to 222.4 mm yr−1, as well as four relatively cold and dry periods ranging from 20.0 to 66.7 mm yr−1.
(3) Multi-cyclic nature of recharge: the groundwater recharge history exhibits a multi-cyclic nature corresponding to precipitation, temperature, and solar activity. Precipitation shows clear 3-year cycles, and temperature displays 7-year cycles, highlighting temperature’s primary role in influencing recharge patterns over interannual cycles and precipitation’s impact on recharge over longer periods. Importantly, there is a notable delay in recharge response to climate variations, with delays of 3–4 years for precipitation and 1 year for temperature, respectively. As for the interdecadal scale, a significant 11-year cycle links groundwater recharge and sunspot numbers, emphasizing the crucial influence of solar activity on historical shifts in recharge patterns. Additionally, changes in groundwater recharge exhibit a distinct 21-year delay in response to variations in sunspot numbers.
These findings underscore the potential of using USZ Cl proxies to reconstruct historical groundwater recharge and improve our understanding of the groundwater recharge evolution in near-humid regions. Additionally, chloride in USZ, other hydrochemical indicators, such as water-stable isotopes sensitive to climate change, may also be valuable tools for reconstructing climate history and need further study.

Author Contributions

Conceptualization, L.F., J.W. and M.L.; methodology, L.F., J.W. and X.W.; formal analysis, L.F. and J.W.; investigation, L.F., J.W. and Y.Z.; resources, L.F. and M.L.; data curation, J.W., Y.Z., X.W. and K.M.; writing—original draft preparation, L.F., J.W. and X.W.; writing—review and editing, K.M. and M.L.; visualization, L.F. and J.W.; supervision, L.F., Y.Z. and M.L.; funding acquisition, L.F. and M.L. All authors have read and agreed to the published version of the manuscript.

Funding

This study was funded by the Yangling V&T College Science and Technology Innovation Project [ZK22-12], the China Postdoctoral Science Foundation grant number [2021M692744, 2023M732890].

Institutional Review Board Statement

Not applicable.

Informed Consent Statement

Not applicable.

Data Availability Statement

Data are contained within the article.

Acknowledgments

Authors thank the technical help from Jingjing Jin and Min Wang, Institute of Water-saving Agriculture in Arid Areas of China, Northwest A&F University.

Conflicts of Interest

Author Kaijing Mo was employed by the company Hunan Xiangyi Laboratory Instrument Development Co., Ltd. The remaining authors declare that the research was conducted in the absence of any commercial or financial relationships that could be construed as a potential conflict of interest.

References

  1. Dalin, C.; Wada, Y.; Kastner, T.; Puma, M.J. Groundwater depletion embedded in international food trade. Nature 2017, 543, 700–704. [Google Scholar] [CrossRef] [PubMed]
  2. Tashie, A.M.; Mirus, B.B.; Pavelsky, T.M. Identifying long-term empirical relationships between storm characteristics and episodic groundwater recharge. Water Resour. Res. 2016, 52, 21–35. [Google Scholar] [CrossRef]
  3. Gong, C.; Cook, P.G.; Therrien, R.; Wang, W.; Brunner, P. On Groundwater Recharge in Variably Saturated Subsurface Flow Models. Water Resour. Res. 2023, 59, e2023WR034920. [Google Scholar] [CrossRef]
  4. Cuthbert, M.O.; Gleeson, T.; Moosdorf, N.; Befus, K.M.; Schneider, A.; Hartmann, J.; Lehner, B. Global patterns and dynamics of climate–groundwater interactions. Nat. Clim. Change 2019, 9, 137–141. [Google Scholar] [CrossRef]
  5. Scanlon, B.R.; Keese, K.E.; Flint, A.L.; Flint, L.E.; Gaye, C.B.; Edmunds, W.M.; Simmers, I. Global synthesis of groundwater recharge in semiarid and arid regions. Hydrol. Process. 2006, 20, 3335–3370. [Google Scholar] [CrossRef]
  6. White, P.J.; Broadley, M.R. Chloride in Soils and its Uptake and Movement within the Plant: A Review. Ann Bot 2001, 88, 967–988. [Google Scholar] [CrossRef]
  7. Zhang, Z. Tree-rings, a key ecological indicator of environment and climate change. Ecol. Indic. 2015, 51, 107–116. [Google Scholar] [CrossRef]
  8. Wong, C.I.; Breecker, D.O. Advancements in the use of speleothems as climate archives. Quat. Sci. Rev. 2015, 127, 1–18. [Google Scholar] [CrossRef]
  9. Brook, E.J.; Buizert, C. Antarctic and global climate history viewed from ice cores. Nature 2018, 558, 200–208. [Google Scholar] [CrossRef]
  10. Lu, Y.; Li, P.; Li, M.; Wei, H.; Wen, M.; Ming, Y.; Si, B. Feasibility of reconstructing atmospheric chloride deposition rates based on tritium tracer in the unsaturated zone. J. Hydrol. 2024, 632, 130917. [Google Scholar] [CrossRef]
  11. Allison, G.; Hughes, M. The use of environmental chloride and tritium to estimate total recharge to an unconfined aquifer. Soil Res. 1978, 16, 181–195. [Google Scholar] [CrossRef]
  12. Edmunds, W.; Tyler, S. Unsaturated zones as archives of past climates: Toward a new proxy for continental regions. Hydrogeol. J. 2002, 10, 216–228. [Google Scholar] [CrossRef]
  13. Ma, J.; Edmunds, W.M.; He, J.; Jia, B. A 2000 year geochemical record of palaeoclimate and hydrology derived from dune sand moisture. Palaeogeogr. Palaeoclimatol. Palaeoecol. 2009, 276, 38–46. [Google Scholar] [CrossRef]
  14. Frey, S.K.; Rudolph, D.L.; Conant, B. Bromide and chloride tracer movement in macroporous tile-drained agricultural soil during an annual climatic cycle. J. Hydrol. 2012, 460–461, 77–89. [Google Scholar] [CrossRef]
  15. Huang, T.; Pang, Z. Groundwater Recharge and Dynamics in Northern China: Implications for Sustainable Utilization of Groundwater. Procedia Earth Planet. Sci. 2013, 7, 369–372. [Google Scholar] [CrossRef]
  16. Tyler, S.W.; Chapman, J.B.; Conrad, S.H.; Hammermeister, D.P.; Blout, D.O.; Miller, J.J.; Sully, M.J.; Ginanni, J.M. Soil-water flux in the Southern Great Basin, United States: Temporal and spatial variations over the last 120,000 years. Water Resour. Res. 1996, 32, 1481–1499. [Google Scholar] [CrossRef]
  17. Stone, A.E.C.; Edmunds, W.M. Unsaturated zone hydrostratigraphies: A novel archive of past climates in dryland continental regions. Earth-Sci. Rev. 2016, 157, 121–144. [Google Scholar] [CrossRef]
  18. Lu, Y.; Li, H.; Si, B.; Li, M. Chloride tracer of the loess unsaturated zone under sub-humid region: A potential proxy recording high-resolution hydroclimate. Sci. Total Environ. 2020, 700, 134465. [Google Scholar] [CrossRef] [PubMed]
  19. Edmunds, W.M.; Dodo, A.; Djoret, D.; Gaye, C.H.; Goni, I.B.; Travi, Y.; Zouari, K.; Zuppi, G.-M.; Gasse, F. Groundwater as an archive of climatic and environmental change: Europe to Africa. In Past Climate Variability through Europe and Africa; Battarbee, R.W., Gasse, F., Stickley, C.E., Eds.; Springer: Dordrecht, The Netherlands, 2004; pp. 279–306. [Google Scholar] [CrossRef]
  20. Taylor, R.G.; Scanlon, B.; Döll, P.; Rodell, M.; van Beek, R.; Wada, Y.; Longuevergne, L.; Leblanc, M.; Famiglietti, J.S.; Edmunds, M.; et al. Ground water and climate change. Nat. Clim. Chang. 2013, 3, 322–329. [Google Scholar] [CrossRef]
  21. Green, T.R.; Taniguchi, M.; Kooi, H.; Gurdak, J.J.; Allen, D.M.; Hiscock, K.M.; Treidel, H.; Aureli, A. Beneath the surface of global change: Impacts of climate change on groundwater. J. Hydrol. 2011, 405, 532–560. [Google Scholar] [CrossRef]
  22. Tomasino, M.; Zanchettin, D.; Traverso, P. Long-range forecasts of River Po discharges based on predictable solar activity and a fuzzy neural network model/Prévisions à long terme des débits du Fleuve Pô basées sur l’activité solaire prévisible et sur un modèle de réseau de neurones flou. Hydrol. Sci. J. 2004, 49, 684. [Google Scholar] [CrossRef]
  23. Lu, Y.; Si, B.; Li, H.; Biswas, A. Elucidating controls of the variability of deep soil bulk density. Geoderma 2019, 348, 146–157. [Google Scholar] [CrossRef]
  24. Gates, J.B.; Edmunds, W.M.; Darling, W.G.; Ma, J.; Pang, Z.; Young, A.A. Conceptual model of recharge to southeastern Badain Jaran Desert groundwater and lakes from environmental tracers. Appl. Geochem. 2008, 23, 3519–3534. [Google Scholar] [CrossRef]
  25. Scanlon, B.R. Uncertainties in estimating water fluxes and residence times using environmental tracers in an arid unsaturated zone. Water Resour. Res. 2000, 36, 395–409. [Google Scholar] [CrossRef]
  26. Rao, K.D.; Swamy, M.N.S. Spectral Analysis of Signals. In Digital Signal Processing: Theory and Practice; Rao, K.D., Swamy, M.N.S., Eds.; Springer: Singapore, 2018; pp. 721–751. [Google Scholar] [CrossRef]
  27. Zhang, W.L.; Tian, Z.X.; Zhang, N.; Li, X.Q. Nitrate pollution of groundwater in northern China. Agric. Ecosyst. Environ. 1996, 59, 223–231. [Google Scholar] [CrossRef]
  28. Chen, Y.; Li, Z.; Fan, Y.; Wang, H.; Deng, H. Progress and prospects of climate change impacts on hydrology in the arid region of northwest China. Environ. Res. 2015, 139, 11–19. [Google Scholar] [CrossRef] [PubMed]
  29. Huang, T.; Pang, Z. Estimating groundwater recharge following land-use change using chloride mass balance of soil profiles: A case study at Guyuan and Xifeng in the Loess Plateau of China. Hydrogeol. J. 2011, 19, 177–186. [Google Scholar] [CrossRef]
  30. Han, H.; Hou, J.; Jiang, R.; Gong, J.; Bai, G.; Kang, Y.; Qi, W.; Li, Y.; Li, B. Spatial and temporal variation of precipitation characteristics in the semiarid region of Xi’an, northwest China. J. Water Clim. Chang. 2021, 12, 2697–2715. [Google Scholar] [CrossRef]
  31. Hartmann, H.; Becker, S.; King, L. Quasi-periodicities in Chinese precipitation time series. Theor. Appl. Climatol. 2008, 92, 155–163. [Google Scholar] [CrossRef]
  32. Cao, G.; Zheng, C. Signals of short-term climatic periodicities detected in the groundwater of North China Plain. Hydrol. Process. 2016, 30, 515–533. [Google Scholar] [CrossRef]
  33. Zhang, L.; Liu, Y.; Jin, M.; Liang, X. Spatiotemporal Variability in Extreme Temperature Events in an Arid-Semiarid Region of China and Their Teleconnections with Large-Scale Atmospheric Circulation. J. Earth Sci. 2023, 34, 1201–1217. [Google Scholar] [CrossRef]
  34. Xu, J.; Wang, C.; Li, W.; Zuo, J. Multi-temporal scale modeling on climatic-hydrological processes in data-scarce mountain basins of Northwest China. Arab. J. Geosci. 2018, 11, 423. [Google Scholar] [CrossRef]
  35. Dong, L.; Fu, C.; Liu, J.; Zhang, P. Combined Effects of Solar Activity and El Niño on Hydrologic Patterns in the Yoshino River Basin, Japan. Water Resour. Manag. 2018, 32, 2421–2435. [Google Scholar] [CrossRef]
  36. Tiwari, R.K.; Rajesh, R. Imprint of long-term solar signal in groundwater recharge fluctuation rates from Northwest China. Geophys. Res. Lett. 2014, 41, 3103–3109. [Google Scholar] [CrossRef]
  37. Ma, L.H.; Han, Y.B.; Yin, Z.Q. Possible Influence of the 11-year Solar Cycle on Precipitation in Huashan Mountain of China over the Last 300 Years. Earth Moon Planets 2010, 107, 219–224. [Google Scholar] [CrossRef]
  38. Weng, H. Impacts of multi-scale solar activity on climate. Part I: Atmospheric circulation patterns and climate extremes. Adv. Atmos. Sci. 2012, 29, 867–886. [Google Scholar] [CrossRef]
  39. Ochadlick, A.R., Jr.; Kritikos, H.N.; Giegengack, R. Variations in the period of the sunspot cycle. Geophys. Res. Lett. 1993, 20, 1471–1474. [Google Scholar] [CrossRef]
  40. Li, M.; Liu, T.; Duan, L.; Ma, L.; Wang, Y.; Wang, G.; Lei, H.; Singh, V. Spatiotemporal hysteresis distribution and decomposition of solar activities and climatic oscillation during 1900–2020. Environ. Res. 2022, 212, 113435. [Google Scholar] [CrossRef] [PubMed]
  41. Zhao, X.; Feng, X. Periodicities of solar activity and the surface temperature variation of the Earth and their correlations. Chin. Sci. Bull. 2014, 59, 1284–1292. [Google Scholar] [CrossRef]
  42. Tan, L.; Cai, Y.; An, Z.; Yi, L.; Zhang, H.; Qin, S. Climate patterns in north central China during the last 1800 yr and their possible driving force. Clim. Past 2011, 7, 685–692. [Google Scholar] [CrossRef]
Figure 1. Location of the study area and soil sampling site.
Water 16 02147 g001
Figure 2. Hydrostratigraphic distribution in USZ of the Changshou loess-tableland. (a) magnetic susceptibility (MS); (b) volumetric water content (θv); (c) chloride ion concentration in soil pore water (Cl); and (d) tritium content in soil pore water (3H). The groundwater level was observed at 64 m in depth.
Water 16 02147 g002
Figure 3. Soil pore water residence time and potential recharge rate. (a) Relationship between cumulative water storage and cumulative chloride in the profile; the slope represents variation in recharge rate at different times. (b) Nearly three hundred years of the potential recharge history were reconstructed. The mean recharge rate R ¯ was 66.7 mm yr−1 during AD 1745–2007, and drier periods and wetter periods are separated by the reference line (blue solid line). The blue line with dots represents the recharge rate, the red dashed line is the recharge trend, the orange zone is the relatively dry period, and the blue zone is the relatively wet period.
Water 16 02147 g003
Figure 4. Variance spectral densities (characteristic cycle) of potential groundwater recharge rate.
Water 16 02147 g004
Figure 5. Potential groundwater recharge and other record trends on multiple cycles: 3-year cycle (a), 7-year cycle (b) and 11-year cycle (c).
Water 16 02147 g005
Table 1. Characteristic cycles of climate indicators.
SeriesFrequency
(Hz)
Characteristic Cycle
(Year)
Recharge0.02, 0.08, 0.15, 0.19, 0.28, 0.33, 0.43, 0.4750.0, 12.5, 6.7, 5.3, 3.6, 3.0, 2.3, 2.1
Precipitation0.04, 0.14, 0.29, 0.4628.0, 7.0, 3.5, 2.2
Temperature0.25, 0.434.0, 2.3
Sunspot Number0.01, 0.09, 0.18100.0, 11.1, 5.6
Table 2. Correlation coefficient between recharge rater and its factors.
CycleRecharge Rate
3a7a11a
Temperaturer = −0.72, p < 0.01
(Lag time = 1 year, r = −0.73, p < 0.01)
Precipitationr = 0.40, p < 0.01
(Lag time = 4 year, r = 0.42, p < 0.01)
r = 0.62, p < 0.01
(Lag time = 3 year, r = 0.66, p < 0.01)
Sunspot Numberr = 0.27, p < 0.01
(Lag time = 21 year, r = 0.57, p < 0.01)
Disclaimer/Publisher’s Note: The statements, opinions and data contained in all publications are solely those of the individual author(s) and contributor(s) and not of MDPI and/or the editor(s). MDPI and/or the editor(s) disclaim responsibility for any injury to people or property resulting from any ideas, methods, instructions or products referred to in the content.

