Article

The Influence of Groundwater Migration on Organic Matter Degradation and Biological Gas Production in the Central Depression of Qaidam Basin, China

1
Research Institute of Petroleum Exploration and Development, Beijing 100082, China
2
Chongqing Key Laboratory of Karst Environment, School of Geographical Sciences, Southwest University, Chongqing 400700, China
3
Exploration and Development Research Institute of PetroChina Qinghai Oilfield Company, Dunhuang 736200, China
*
Author to whom correspondence should be addressed.
Water 2024, 16(15), 2163; https://doi.org/10.3390/w16152163
Submission received: 19 June 2024 / Revised: 17 July 2024 / Accepted: 22 July 2024 / Published: 31 July 2024
(This article belongs to the Special Issue Isotope Geochemistry of Groundwater: Latest Advances and Prospects)

Abstract

:
For insight into the productive and storage mechanisms of biogas in the Qaidam Basin, efforts were made to investigate the groundwater recharge and the processes of hydrocarbon generation by CDOM-EEM (fluorescence excitation-emission matrix of Chromophoric dissolved organic matter) spectrum, hydrogen and oxygen isotopes, and geochemical characters in the central depression of the Qaidam Basin, China. The samples contain formation water from three gas fields (TN, SB, and YH) and surrounding surface water (fresh river and brine lake). The results indicate that modern precipitation significantly controls the salinity distribution and organic matter leaching in the groundwater system of the central depression of the Qaidam Basin. Higher salinity levels inhibit microbial activity, which leads to organic matter degradation and to gas generation efficiency being limited in the groundwater. The inhabitation effect is demonstrated by the notable negative correlation between the extent of organic matter degradation and its concentration with hydrogen and oxygen isotopes. The conclusion of this study indicated that modern precipitation emerges as a crucial factor affecting the biogas production and storage in the Qaidam Basin by influencing the ultimate salinity and organic matter concentration in the formation, which provides theoretical insight for the maintenance of modern gas production wells and the assessment of gas production potential.

1. Introduction

Biogas is a natural gas produced by the degradation of organic matter by microorganisms. The biogas reservoir in the Qaidam Basin currently represents the largest known biogas field in China, with reserves of approximately 3500 × 108 m3, and the abundance of in the Sebei (SB)-Tainan (TN) gas field is approximately 25 × 108 m3/km2 [1,2,3]. However, the composition of source rocks and groundwater, as well as the hydrocarbon accumulation characteristics, are significantly different in the Qaidam Basin compared to other bio-gas fields worldwide [1,2]. Methane, the primary component of biogas, is mainly generated through the collaborative action of methanogenic and syntrophic bacteria, which degrade the active organic matter in source rocks, ultimately producing methane [3,4]. The gas generation process is closely related to the distribution of microorganisms, the organic matter and salinity content within the strata, and gas storage and accumulation are influenced by groundwater recharge and migration [5]. However, the biogas generation and storage theories are currently insufficient to guide exploration, reserve assessment, and sustainable production in the Qaidam Basin. A clear understanding of the mechanisms including biogas generation, migration, and storage will provide invaluable guidance for production and exploration activities.
The precipitation of the Qaidam Basin is primarily influenced by the transportation of moisture from the westerlies, and the southern margin of the basin is affected by moisture from the Qinghai-Tibet Plateau [6,7]. From the basin’s edge to the center depression, groundwater movement gradually slows down, leading to stable isotope enrichment in the migration process, while the northern part shows a relatively stable isotope composition for local topographic effects [8]. The immense Quaternary sediment in the three lake depressions at the center of the Qaidam Basin originates from the ancient lake within the basin which was disintegrated due to tectonic processes and eastward movement [9]. During the groundwater recharge and migration from the basin’s edge to the center, highly saline brine is formatted because of the influence of water–rock interaction or leaching processes [10]. In the Sebei gas field, formation water recharges to Qarhan Salt Lake along bedding planes were impeded by the northern anticline structure [11]. The organic carbon content of dark mudstone in the Sebei gas field ranges from 0.3% to 0.4%, predominantly comprising Type III organic matter with a low degradation degree, favorable for biogas formation [1,12]. However, biogas formation in the Qaidam Basin is primarily controlled by the existence of methanogens which compete with sulfate-reducing bacteria (SRB) in the organic nutrient utilization within the strata [13]. Groundwater movement regulates groundwater mineralization and hydrochemical properties variation, as well as the migration of soluble and easily degradable organic matter in formation water, thereby affecting the methane-producing activity of methanogens from both environmental and substrate standpoints. Analyzing the source and geochemical characteristics of the formation water in gas fields is beneficial for understanding the processes and controlling factors of biogas production in the Qaidam Basin.
In this study, 16 formation water samples were collected from the Tainan (TN), Sebei, and Yanhu (YH) gas fields within the central sag region of the Qaidam Basin, along with four nearby surface water samples, to analyze the isotopic composition of hydrogen and oxygen in the water samples, as well as their geochemical characteristics. To investigate the sources of groundwater recharge and the environmental attributes of biogas production, the organic matter content and composition were measured using CDOM-EEM (fluorescence excitation-emission matrix of Chromophoric dissolved organic matter) spectrum data along with hydrochemical parameters. We try to explain the biogas formation and production mechanism from the groundwater and nutrition migration process in the Quaternary strata. The study will provide valuable data for understanding the mechanisms of biogas generation and storage in the Qaidam Basin, and offer theoretical support for the maintenance and assessment of gas production potential in gas wells.

2. Study Area and Methods
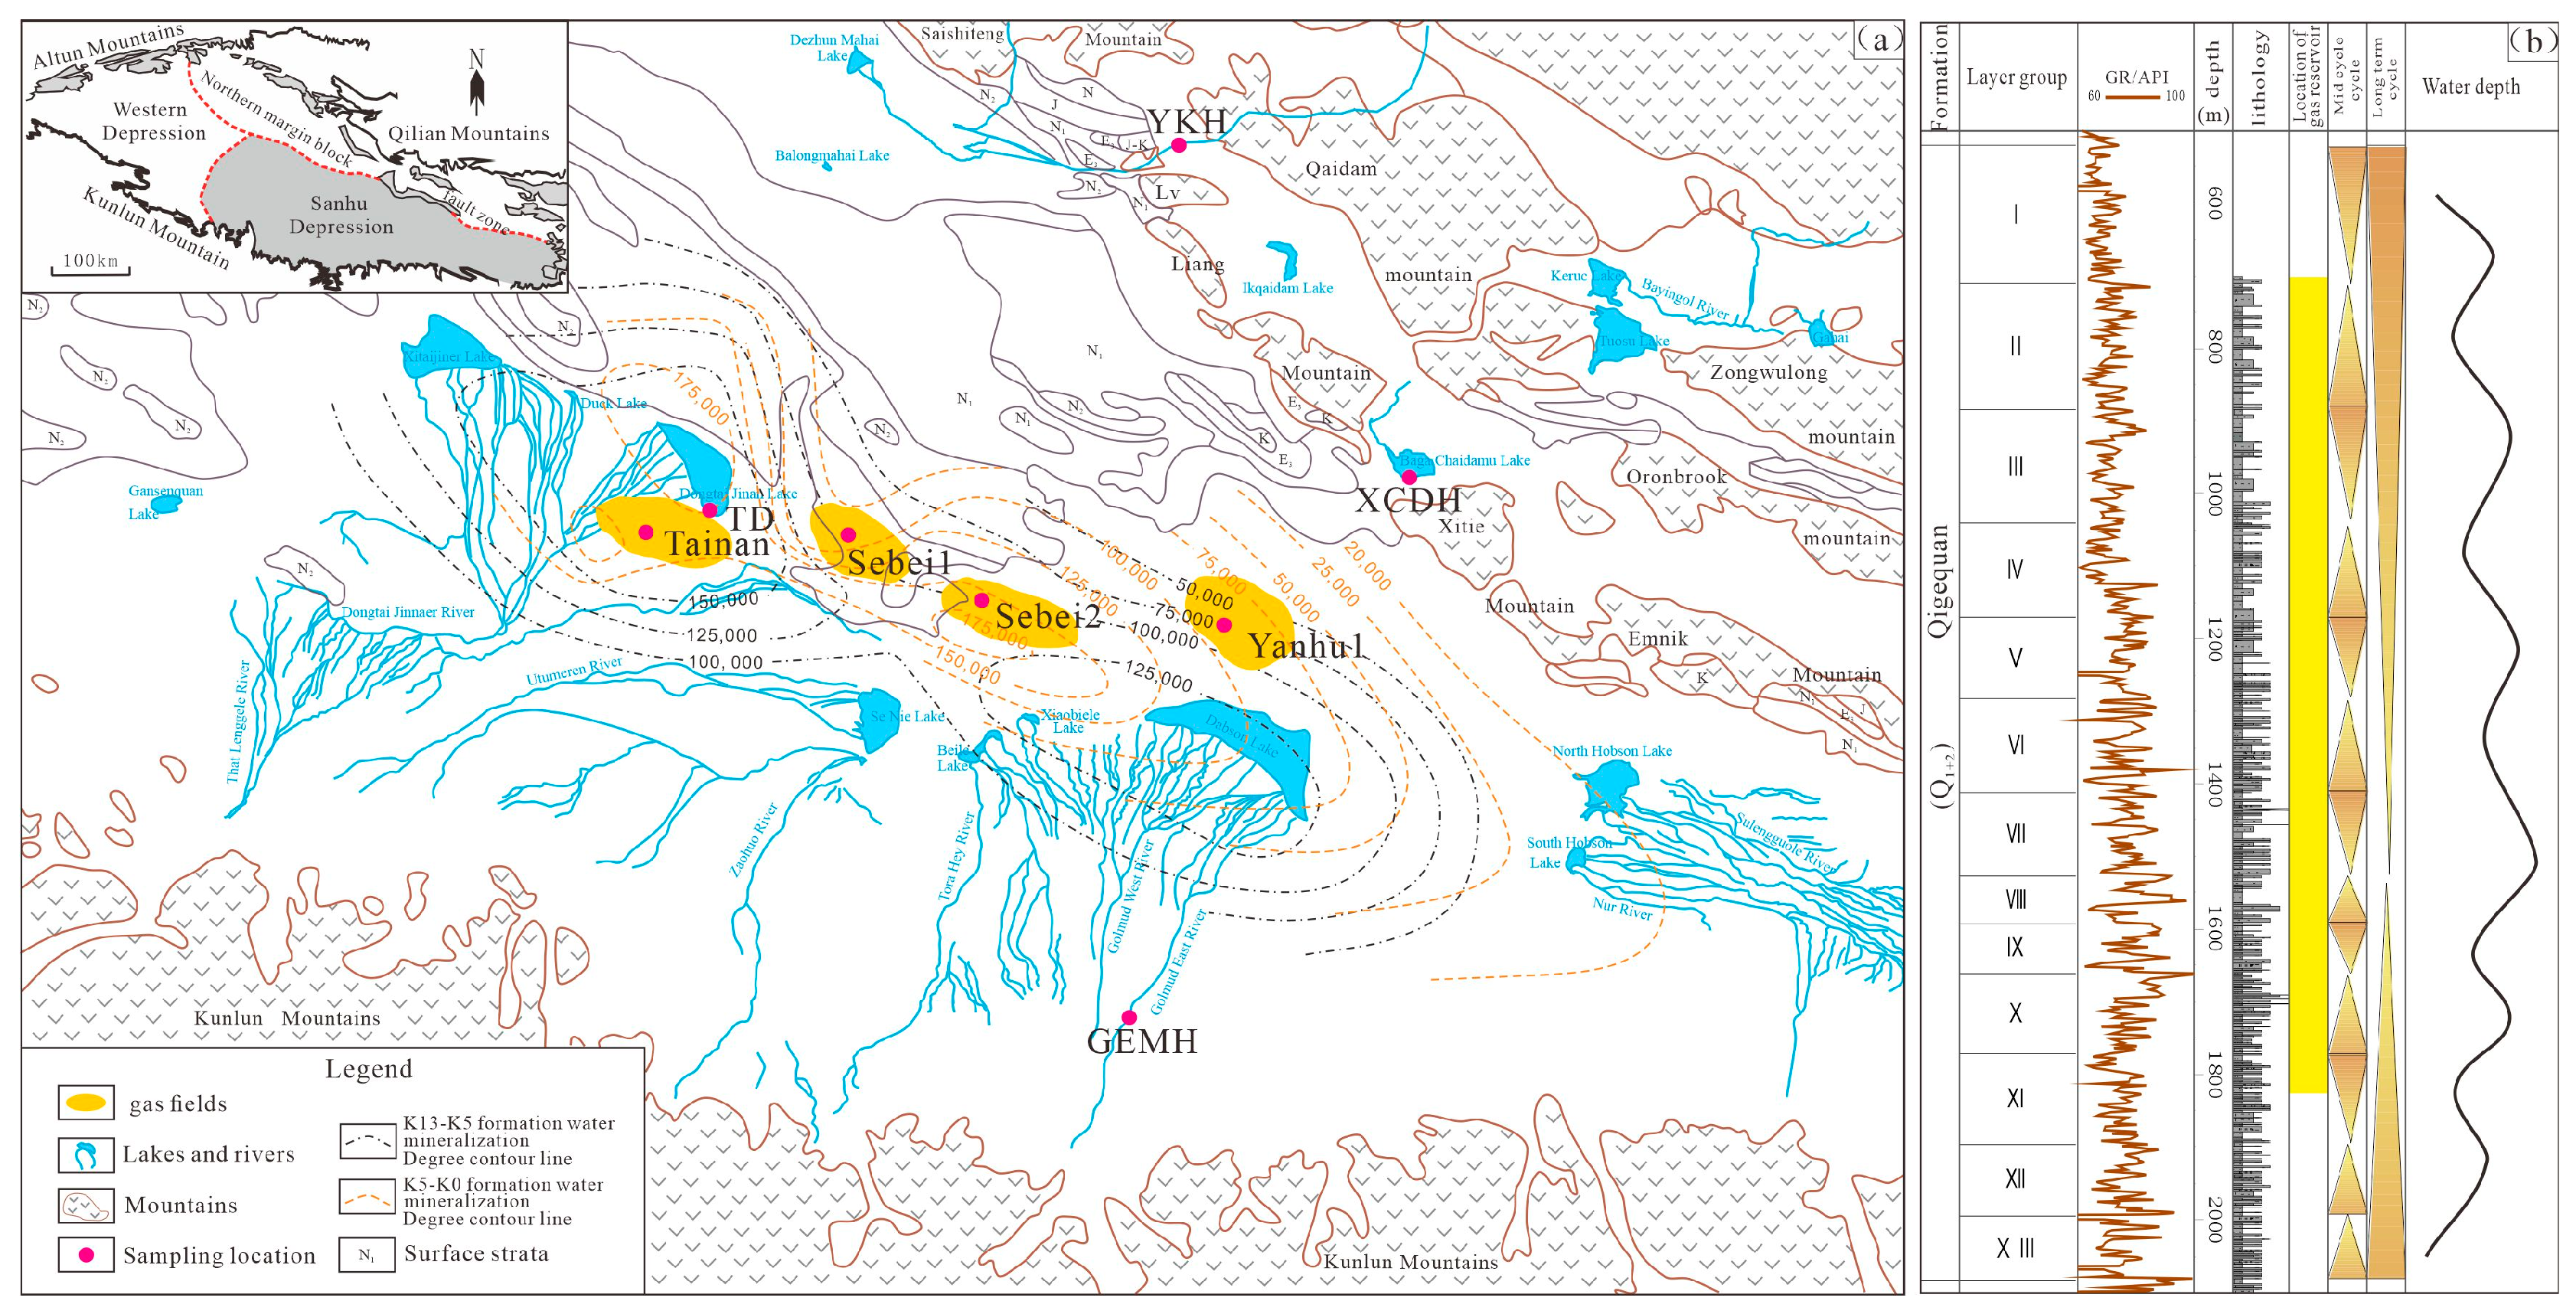
2.1. Study Area

The Qaidam Basin is located at 36°00′ N–39°20′ N and 90°16′ E–99°16′ E, in the western part of Qinghai Province, China, with altitude spans from 2652 to 6619 m, exhibiting an irregular rhombic distribution in a northwest-southeast orientation. It is a typical closed inland sedimentary basin influenced by the development of Mesozoic rifts and Cenozoic-Neogene compressional and fold-thrust structures (Figure 1a). The basin comprises three primary structural units: the Chaixi depression, the northern fault block belt, and the central Sanhu depressions. The central depression area is located in the eastern part of the basin, in which several biogas fields were explored, including Sebei-1, Sebei-2, and Tainan, where the thickness of gas source rock exceeds 2 km in the central formation.
The central depression area is the center of Quaternary sedimentary mainly composed of lacustrine sediments from the Qigequan Formation (Figure 1b), where the thicknesses of lacustrine sediment exceed 2000 m. The lithology predominantly consists of gray and light gray mudstones, sandy mudstones, mudstone sandstones, sandy mudstones interbedded with sandstones, and carbonaceous mudstones, with the uppermost part of carbonate and halite [1]. During the historical sedimentation process, 13 layer groups were formed due to changes in the lake basin water depth. Several rivers originate from the Kunlun and Qilian Mountains along the flanks of the Qaidam Basin, and receive precipitation and snowmelt in the mountainous regions before flowing towards the central basin, serving as the primary source of groundwater recharge in the central depression area [4]. Groundwater flows rapidly on the basin’s flanks but slows down significantly in the central region [4]. The southern part of the basin reveals high water levels and rapid flow, while the northern part has relatively lower water levels and slower flow characteristics, forming an intra-layer water circulation system [14,15].
In the Sanhu depression region, Quaternary sediments have weak diagenesis and interbedded sandstone–mudstone structures, in which 13 gas-bearing strata have been formed [12]. These gas-bearing strata range at depths from 700 to 1828 m, comprising multiple aquifers. The multi gas and aquifer structure serves as the fundamental conditions for the large-scale enrichment of Quaternary biogas reserves [1]. The Sanhu depression gas-bearing strata are characterized by moderate carbonate contents (15–35%), medium to extremely high organic carbon contents, Type III organic matter, and very low hydrocarbon conversion rates, and these sediments provide the ideal conditions for substantial biogas accumulation in the Qaidam Basin [1].

2.2. Sampling

Sixteen samples of formation water were collected from gas fields in the central depression area of the Qaidam Basin in April 2023, covering depths ranging from 190 m to 1740 m. These samples included 3 from the Yanhu gas field (YH), 6 from the Tainan gas field (TN), and 7 from the Sebei gas field (SB) (including Sebei gas fields 1 and 2). Additionally, 4 surface water samples were collected for comparative studies, of which there were 2 brine samples from the Dongtaijinair Salt Lake (DT) and Xiaochaidan Lake (XCDH) and 2 surface river water samples from the Gemu River (GEMH) and Yuka River (YKH).
Each sample was collected in 500 mL burned glass bottles, filtered and sealed on the same day, and then sent for analysis. Two mL of each sample was filtered using a 0.2 μm microporous filter membrane and stored in glass chromatography vials for hydrogen and oxygen isotope analysis. Fifty mL of each sample was filtered using a 0.45 μm microporous filter membrane, stored in polyvinyl chloride bottles, and used for analysis of anions and cations. To prevent cation adsorption, 2 drops of 1:1 nitric acid were added to the cation samples. One hundred mL of each sample was filtered using a 0.7 μm glass fiber membrane burned at 300 °C for 3 h, stored in burned brown glass bottles, and used for organic carbon content and CDOM spectrum.

2.3. Laboratory Analysis

Hydrogen and oxygen isotopes were analyzed using the Piccaro 2140 ultra-high-precision water isotope analyzer (L2140, Piccaro, Santa Clara, CA, USA) with a testing precision of D < 0.1‰ and δ18O < 0.025‰. The isotopic ratios of δ2H and δ18O were expressed as a permil (‰) deviation from Vienna Standard Mean Ocean Water (VSMOW).
Anions and cations were analyzed using an ion chromatograph (ICS 1100, Thermo Fisher, Waltham, MA, USA) and an inductively coupled plasma emission spectrometer (iCAP 7400, Thermo Fisher, USA), respectively. Total organic carbon (TOC) and dissolved organic carbon (DOC) were detected using a total organic carbon/nitrogen analyzer (Multi C/N 3100, Analytik Jena, Jena, Germany).
The three-dimensional fluorescence spectra of CDOM were analyzed using a fluorescence spectrophotometer (RF-5301PC, Shimadzu, Kyoto, Japan) with a 150-W xenon lamp, 700-PMT voltage, and signal-to-noise ratio (SNR) greater than 110. A 10 mm four-sided transparent quartz cuvette was filled with ultrapure water as a blank (Mill-Q, USA). The excitation wavelength range scanned was 220–500 nm with a 5 nm interval, while the emission wavelength range was 220–600 nm with a 1 nm interval, and the scanning speed was set to Fast. The UV-visible absorption spectra of the CDOM were measured using a UV-visible spectrophotometer (UV-2450, Shimadzu, Japan) in a 10 mm two-sided transparent quartz cuvette. The scanning wavelength range was 190–800 nm with a 1 nm interval, and the ultrapure water served as a blank (Mill-Q, USA).
The UV-visible absorption spectra were blank-corrected using the ultrapure water, and the absorption coefficient calculations followed the method described by Bricaud et al. [16], while the spectral slope (S) of CDOM absorption curves was calculated according to Twardowski et al. [17].
The testing of the water isotopes was conducted at the Karst Dynamics Laboratory, Institute of Karst Geology, Chinese Academy of Geological Sciences, while all the other analyses were carried out at the Key Laboratory of Karst Dynamics, School of Geographical Sciences, Southwest University, Chongqing, China.

2.4. Data Processing

The fluorescent spectral parameters of CDOM can reflect the degree of humification and the contribution of autochthonous sources, while the ultraviolet absorbance coefficient can indicate the molecular weight, aromaticity, and functional group composition of the CDOM. The definitions and indicative meanings of the CDOM fluorescence and ultraviolet absorbance coefficients used in this study are presented in Table 1.

3. Results

3.1. Hydrochemical Parameters

In the central depression, the formation water in gas fields is Na/Ca-Cl type brines, whereas surface river water is moderately saline with a Na/Ca-Cl/HCO3 type. The water from Lake TD reveals higher salinity levels than Lake XCDH. The total dissolved solids (TDS) content in formation water ranges from 84.4 to 206.3 mg/L (Table 2), significantly higher than that of surface river water at 4.9 and 5.2 mg/L, yet lower than the brines and paleobrines [11]. Generally, the salinity and ion concentrations in formation water increase with depth. However, the formation water salinity at depths of 980 m and 1500 m in the TN gas field and 1100 m in the SB gas field are higher than those in the upper and lower strata. In the YH and SB formation water, the calcium (Ca) and bicarbonate (HCO3) concentrations increase with depth, except for the slight elevation at the depth of 1000 m in SB. Conversely, in the YN formation water, the Ca and HCO3 concentration remains relatively stable (Table 2).

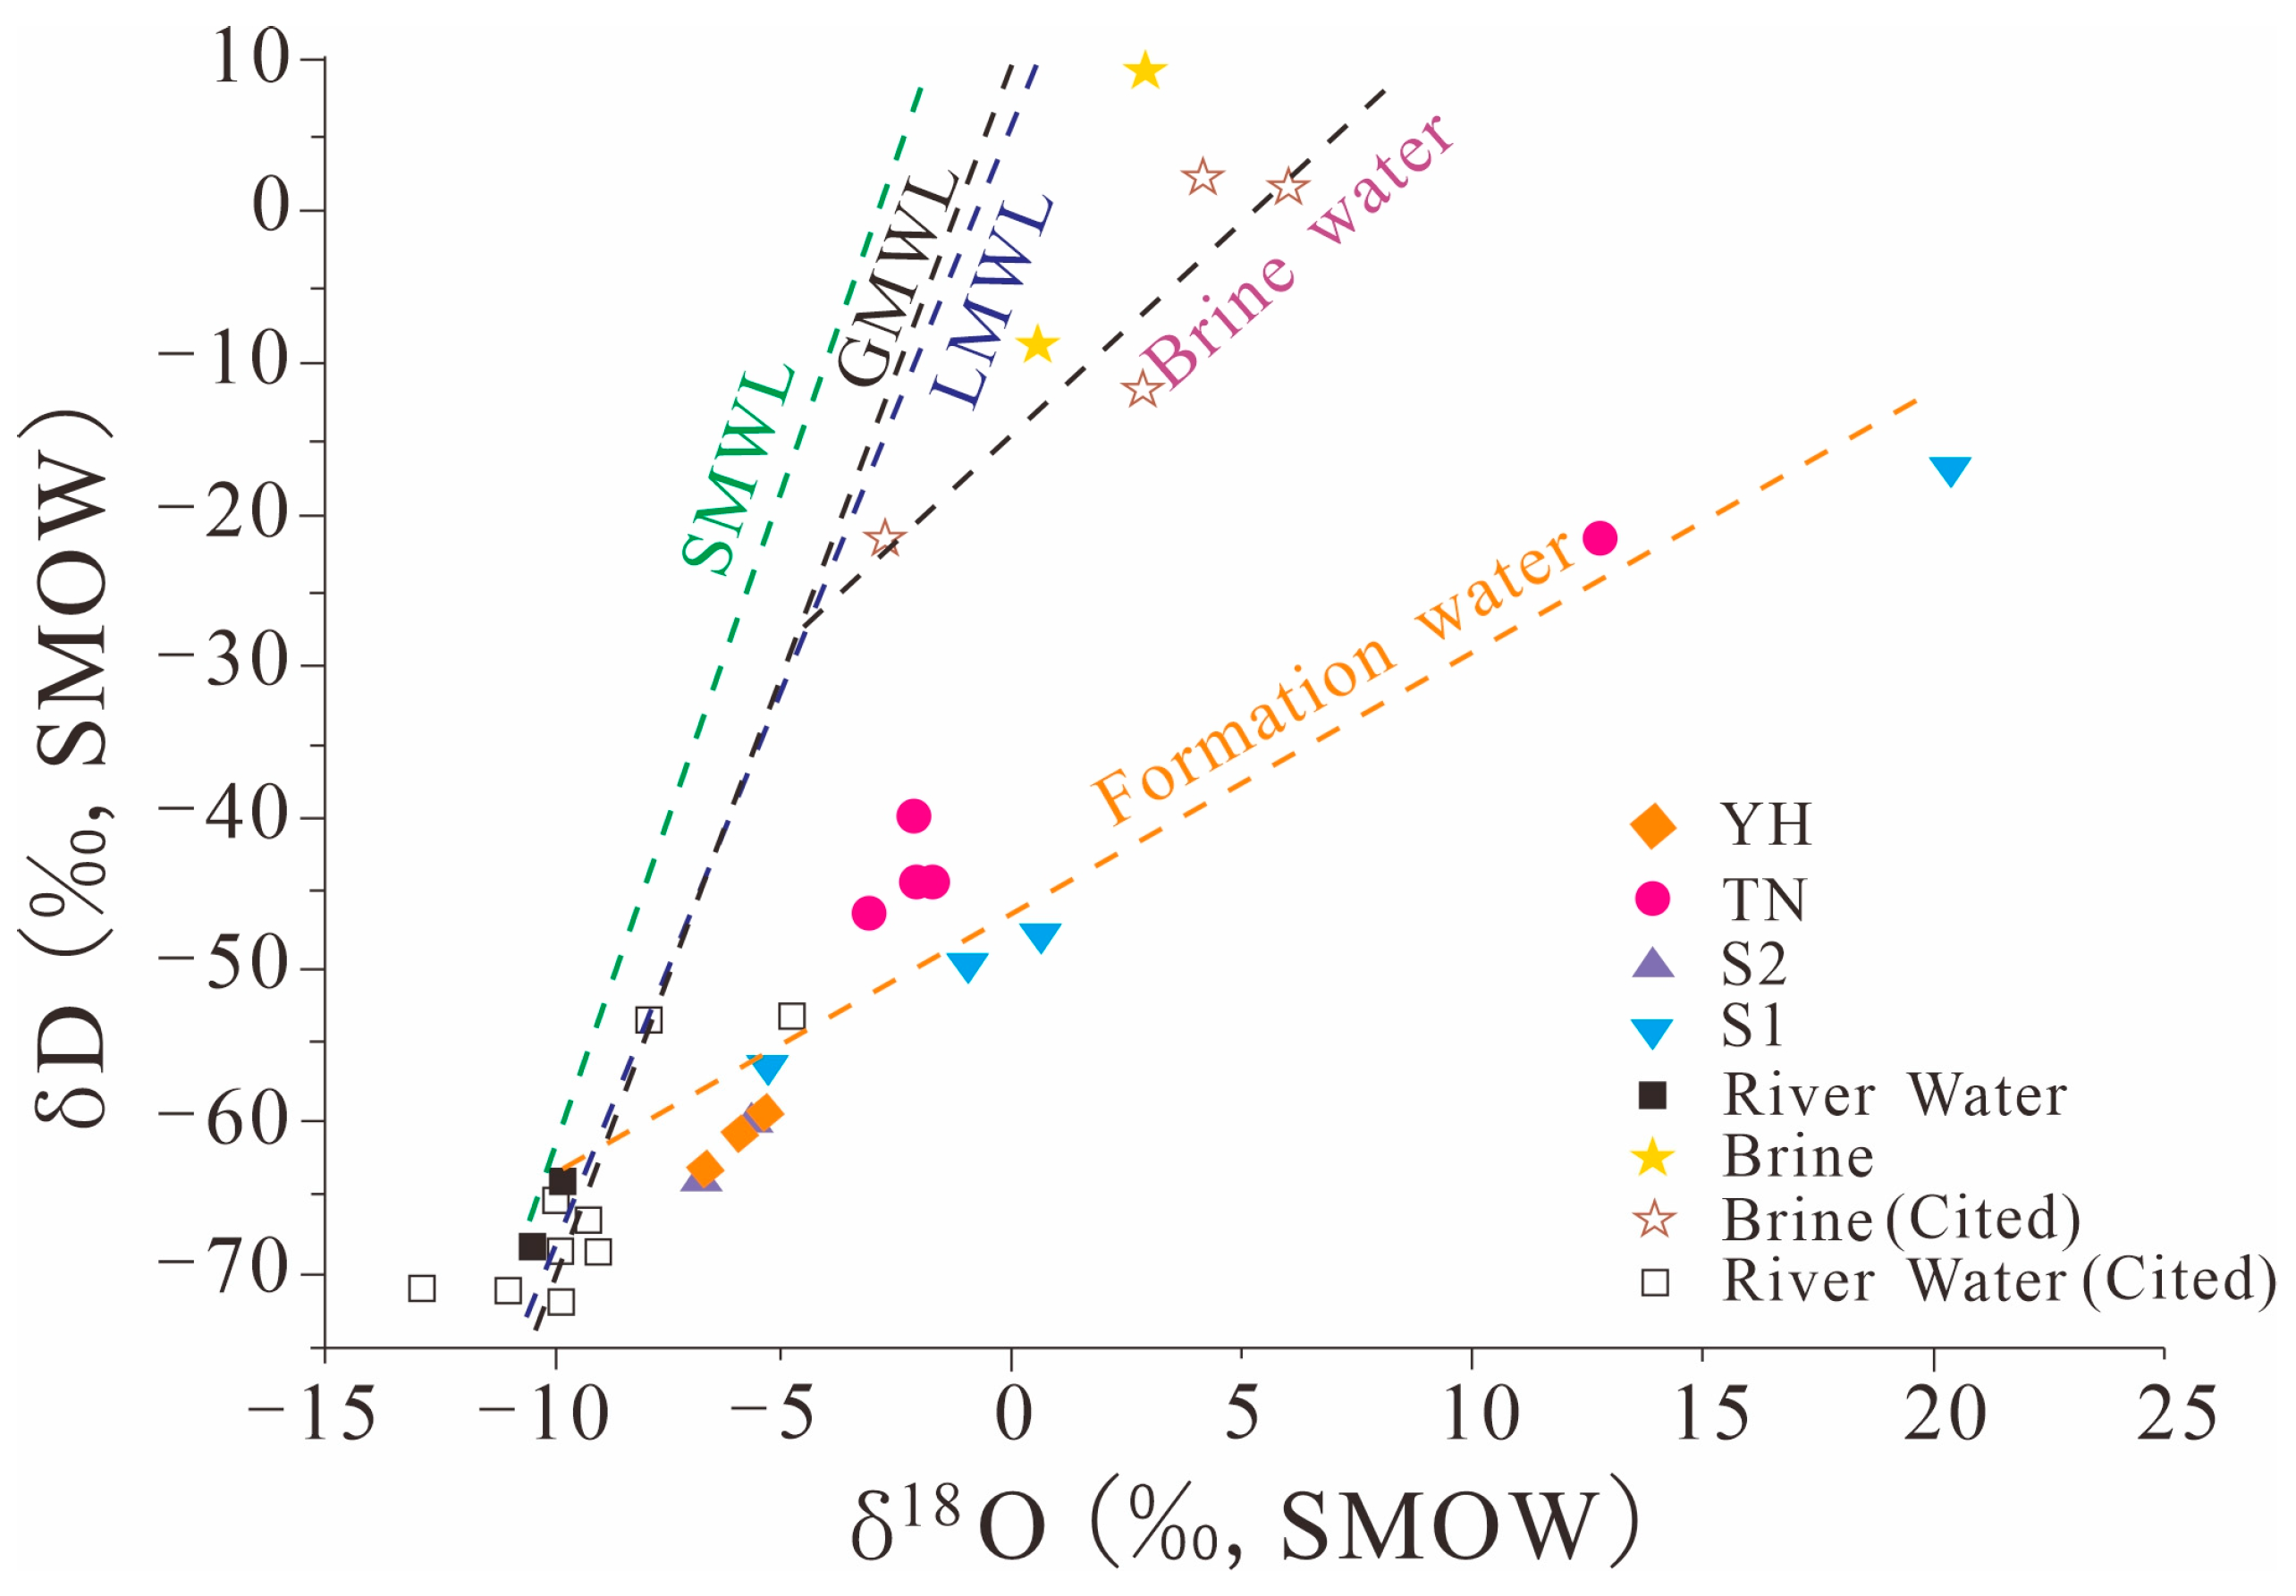
3.2. Stable Isotopes Distribution of Hydrogen and Oxygen

The heavier isotopes of hydrogen and oxygen will be enriched in the water because of evaporation fractionation effects, whereas the lighter isotopes will diminish. Thus, the stable isotopes in salt lakes (SMWL) in the Qaidam Basin reveal high values for the significant influence of evaporation fractionation caused by the extreme dry climate (Figure 2). However, the hydrogen and oxygen isotopes of the two river water samples align closely with global and local precipitation lines (GMWL & LMWL), consistent with previous studies of river water isotopic values [11]. The formation water isotopes in the gas fields are distributed along the evolution trend of the formation water, exhibiting a wide distribution range (Figure 2). The δD values range from −68.5‰ to −18.9‰ with an average of −48.0‰, while the δ18O values range from −0.6‰ to 20.3‰ with an average of −1.0‰ (Table 2).
Formation water samples from three gas fields reveal different stable isotope values. The YH samples were collected from shallower depths and showed the most negative values, which closely resemble those of surface river water (Figure 2). The TN samples were collected from deeper depths and showed the heaviest values, of which the sample from 1425 m depth showed the highest isotopic value. The stable isotopic values in the SB samples displayed a wide range, which at 1100 m depth revealed light isotopic values as well as the YH samples, but the δ18O values at 600 m depth were revealed to be even higher than those of salt lakes and brines (Table 2).

3.3. Organic Carbon Content Distribution and the CDOM Spectrum Characteristics

The total organic carbon (TOC) contents in the formation water show significant variations, ranging from 11.7 mg/L to 724.0 mg/L, with a mean value of 115.9 mg/L. Dissolved organic carbon (DOC) contents range from 9.5 mg/L to 723.4 mg/L, with a mean value of 111.3 mg/L. These values are substantially higher than those observed in surface water, where TOC concentrations range from 3.3 mg/L to 7.6 mg/L and DOC concentrations range from 1.9 mg/L to 5.6 mg/L (Figure 3). The organic carbon contents suggest that the organic carbon in the formation water primarily originates from the leaching of organic compounds from hydrocarbon source rocks. The organic carbon content in the formation water generally increases with depth. However, several layers reveal a considerable increase, e.g., the TOC concentrations are significantly higher at depths of 600 m and 1425 m in the SB gas field than the average value, which is 724.0 mg/L and 299.5 mg/L, respectively, and that at a depth of 1500 m in the TN gas field is 421.6 mg/L (Figure 3).
The fluorescence and UV-absorption indices of chromophoric dissolved organic matter (CDOM) serve as the indicators of organic matter degradation characteristics in the formation water. The humification index (HIX) primarily reflects the CDO humification degree, and higher HIX values indicate a greater humification degree of organic matter and increased resistance to degradation [18]. HIX values below 4 suggest that the CDOM primarily consists of autochthonous substances. Values between 4 and 6 indicate weaker humification and stronger autochthonous characteristics, while values between 6 and 10 suggest stronger humification and weaker autochthonous characteristics [20]. In the central depression of the Qaidam Basin, the HIX values in all samples are below 6, indicating a relatively low degree of humification and a higher autochthonous contribution, likely influenced by microbial activity. The humification degree of the surface water is below 4, even lower than that of the formation water. The HIX values in the YH samples range from 5.2 to 6.7, higher than those in the TN and SB samples (0.7 to 4.1) (Figure 3). The HIX values at 600 m in the SB gas field and 1500 m in the TN gas field are relatively high, measuring 3.1 and 4.1, respectively, indicating a higher degree of humification and relative resistance to degradation. However, the HIX value at 1425 m in the SB gas field is only 0.7, significantly lower than other depths in the same field (Figure 3).
SUV254 refers to the ratio of ultraviolet absorbance at 254 nm to DOC concentration, which characterizes the aromaticity of organic matter [19]. A higher SUVA254 value indicates greater aromaticity and strong correlation with aromatic and unsaturated organic compounds [19]. The variation trend of SUV254 is similar to that of HIX, suggesting higher humification and relatively difficult degradation of organic matter in the TN samples.
The E253/E203 index reflects the degree of substitution and types of substituents on the aromatic rings. The low E253/E203 value indicates a high content of fatty chain substituents on the aromatic ring, while the high E253/E203 value indicates an increase in carbonyl, carboxyl, hydroxyl, and ester substituents on the aromatic ring [19]. The substituent content increase is beneficial for heterotrophic bacteria to decompose the substituents into small organic molecules and then provide carbon and nutrient sources for methanogens. The E253/E203 values range from 0.07 to 0.10 in the YH samples, from 0.13 to 0.17 in the TN samples, and from 0.22 to 0.36 in the SB samples (Figure 3). The E253/E203 values in the SB samples reveal the highest number of utilizable substituents by heterotrophic bacteria and methanogens a, while the YH samples exhibit the fewest substituent structures available for utilization. The highest E253/E203 values are shown at depths of 1425 and 1500 m (Figure 3).
This section may be divided by subheadings. It should provide a concise and precise description of the experimental results, their interpretation, and the experimental conclusions that can be drawn.

4. Discussion

4.1. Groundwater Migration and Hydrochemical Evolution Characteristics in the Central Depression Area of Qaidam Basin

In the Qaidam Basin, multiple surface rivers, including the Narin Gol River, the Golmud River, the Nomhong River, and the Yuka River, receive recharge from the meltwater from the Kunlun and Qilian Mountains from the southern and northern margins. These surface rivers leach into the basin from the foothills, and become unified groundwater structures [20,21,22,23]. When the groundwater moves towards the central part of the basin, the groundwater gradually evolves into a multilayered structure of unconfined to confined water because of influence from the sedimentary structure of the Quaternary [14]. Simultaneously, the formation water dissolves the amount of salt substances and migrates to the central depression area [11]. Consequently, TDS in the formation water quickly transitions from freshwater to salty water and even brine, and the water chemistry type changes from Na/Ca-Cl/HCO3 freshwater to Na-Cl brackish water. In this study, hydrogen and oxygen isotopes indicate that formation water primarily originates from atmospheric precipitation but is influenced by interstitial brackish water and evaporation, deviating below the global meteoric water line (GMWL) and local meteoric water line (LMWL) (Figure 2). Most samples show that isotope values, mineralization levels, and salinity increase with depth, except for samples at depths of 600 m, 980 m, 1425 m, and 1500 m, which indicate that groundwater recharge should become slower in deep structures where more saline substances are dissolved (Table 2). The change in isotopic values and TDS in deep groundwater highlights that the geochemical character in formation water is primarily controlled by groundwater movement and the recharge process (Figure 2).
Groundwater migration, recharge, and renewal rates vary at different depths due to multilayer structures in Quaternary formations existing in the central depression of the Qaidam Basin. Consequently, the groundwater transportation variation in different depths caused the fluctuations in salinity and water isotopes in the Sebei (SB) and Tainan (TN) gas fields [15]. This study identifies several layers with increased TDS and salinity levels at 600 m, 980 m, and 1100 m in the SB samples, and 1425 m in the TN samples (Table 2). Hence, the varying modern precipitation supply processes at different depths demonstrate that geochemical environments and nutrient contents will be influenced within the formation, which potentially leads to the inhibition of gas production efficiency and potential within the gas field [15]. However, the significant influence of isotopes and salinity correlation remains elusive, as the formation water salinity would be impacted by the salt content of the formation hydrocarbon source rock, and further information is needed concerning the geochemical characteristics of rock samples.

4.2. Organic Matter Degradation Caused by Groundwater Migration in the Central Depression Area of Qaidam Basin

In the central depression of the Qaidam Basin, over 85% of the biogas reserves are concentrated in the organic-rich lower layers of Qigequan Formation (K5–K13), where mineral deposits with high organic matter content and labile organic matter serve as effective biogas source rocks [20]. In the gas-bearing strata of the central depression area, acetate fermentation is the primary pathway for methane production [23,24], where the complex organic molecules are gradually degraded into small organic ones and then converted into methane through the synergistic metabolism of heterotrophic bacteria and methanogens. The methane dissolves in the formation water, and migrates with the formation water until separating and reserved where the groundwater moves slowly and salinity is high [6,25]. Thus, the groundwater movement controls the dissolving and migration of organic matter and consequently impacts the decomposition and methane generation in the Qaidam Basin.
As shown in Figure 2, the stable isotopes indicated that formation water has a relatively long retention time in the gas fields of the central depression. As described in Section 4.1, high values of δD and δ18O indicated long-time retention (Figure 2), and the long-time retention caused the significant substance interaction between water and bedrock which generated the increase in water salinity and mineralization levels (Table 2, Figure 3). Meanwhile, long-time substance interaction also caused organic matter dissolving and migration. As a result, the organic carbon content in the formation water rapidly increases, far exceeding the organic carbon content in the surface water (Figure 3). Microbial degradation is the main factor of organic matter decomposition and biogas formation [19,20], but microbial activities would be inhibited by extremely high salinity [8,26]. Thus, organic matter degradation is accomplished in an environment that is suitable for heterotrophic bacteria and methanogens to survive, which means lower salinity and δD and δ18O values. Conversely, a formation environment with high salinity and δD and δ18O values would inhibit microbial activity and organic matter decomposition, and would remain high organic matter concentrations. Therefore, a significant linear correlation is observed between the organic matter content and hydrogen and oxygen isotopes in the gas field formation water (R2 = 0.624 & 0.899, Figure 4a).
The CDOM spectral index in the formation water also reflects the influence of microbial activity on the degradation of organic matter. As shown in Figure 4b, the HIX and SUV254 of CDOM in formation water showed an exponential decrease with increasing organic carbon concentrations (R2 = 0.999 & 0.64). This implies that lower organic matter content corresponds to higher resistance to degradation because the degradable portion has been fully utilized in the formation water and only the recalcitrant fraction is left. Conversely, higher organic matter content indicates a higher degradable component preserved, and HIX and SUV254 remain at low values. The vertical variations in organic matter content and CDOM spectral index among the three gas fields indicate interlayer differences in subsurface biogas activities (Figure 3). High E253/E203 values in the formation water indicate higher organic matter content and lower HIX and SUV254 values (Figure 3). The E253/E203 values reflect the content of functional groups in organic matter components on the aromatic rings, such as carbonyl, carboxyl, hydroxyl, and ester groups. Methanogens can utilize organic matter consisting of acetic acid, ethanol, carboxyl, and hydroxyl groups. Samples with higher E253/E203 values contain more substrates directly usable by methanogens. In the YH samples, the majority of direct substrates for methane production have been consumed, with very low total organic matter content and minimal biogas potential present in the formation water (Figure 3). Conversely, in the SB and TN gas fields, especially at depths with the highest E253/E203 values such as 1425 m and 1500 m, the formation water contains high levels of biogas organic matter substrates, which indicates significant future biogas potential. However, past gas production may not have been correspondingly high.

5. Conclusions

To understand the production and accumulation mechanisms of biogas in the Qaidam Basin, interdisciplinary studies should be carried out integrating geological structures, hydrological cycles, distribution of organic matter, and microbial activities based on the principles of Earth System Science and considering the past, present, and future condition of gas fields. This study analyzed the formation and surface water samples from three gas fields in the central depression area of the Qaidam Basin and combined with previous research findings, it was observed that modern precipitation controls the recharge and migration processes of groundwater in the central depression area. The precipitation recharge process influences the distribution of salinity and organic matter leaching in groundwater and further affects the processes of organic matter degradation and gas production during groundwater movement. This study inferred the gas production features and potential of microbes during groundwater movement, revealing that modern precipitation plays a pivotal role in governing the organic matter degradation in hydrocarbon source rocks and the biogas generation in the Qaidam Basin significantly.

Author Contributions

Data curation and writing—original draft preparation, J.T.; Funding acquisition, J.T. and Q.H.; Investigation, Z.S.; Data curation, F.Z. All authors have read and agreed to the published version of the manuscript.

Funding

This study was funded by the Prospective and Basic Major Technology Project of PetroChina Company Limited (2021DJ0605) and the Technical Service Project of the Langfang Branch of the Research Institute of Exploration and Development of PetroChina Company Limited (RIPED-2022-JS-2389).

Data Availability Statement

Data are contained within the article.

Acknowledgments

We would like to thank PetroChina Qinghai Oilfield for its assistance during field sampling.

Conflicts of Interest

Author Zeyu Shao and Fei Zhou are employed by Exploration and Development Research Institute of PetroChina Qinghai Oilfield Company. The remaining authors declare that the research was conducted in the absence of any commercial or financial relationships that could be construed as a potential conflict of interest.

References

  1. Bricaud, A.; Morel, A.; Prieur, L. Absorption by dissolved organic matter of the sea (yellow substance) in the UV and visible domains. Limnol. Oceanogr. 1981, 26, 43–53. [Google Scholar] [CrossRef]
  2. Zhao, D.; Wang, G.; Liao, F.; Yang, N.; Jiang, W.; Guo, L.; Liu, C.; Shi, Z. Groundwater-surface water interactions derived by hydrochemical and isotopic (222Rn, deuterium, oxygen-18) tracers in the Nomhon area, Qaidam Basin, NW China. J. Hydro. 2018, 565, 650–661. [Google Scholar] [CrossRef]
  3. Gao, L.; Brassell, S.C.; Mastalerz, M.; Schimmelmann, A. Microbial degradation of sedimentary organic matter associated with shale gas and coalbed methane in eastern Illinois Basin (Indiana), USA. Int. J. Coal Geol. 2013, 107, 152–164. [Google Scholar] [CrossRef]
  4. Guo, P. Saline Environment Evolution of the Cenozoic Qaidam Palaeolake and the Characterization of Its Hydrocarbon Source Rocks. Ph.D. Thesis, Northwest University, Xi’an, China, 2018. [Google Scholar]
  5. Huguet, A.; Vacher, L.; Relexans, S.; Saubusse, S.; Froidefond, J.M.; Parlanti, E. Properties of fluorescent dissolved organic matter in the Gironde Estuary. Org. Geochem. 2009, 40, 706–719. [Google Scholar] [CrossRef]
  6. Yang, H.; Wei, J.; Ren, Q. Interaction between surface water and groundwater and hydrochemical characteristics in the typical watersheds of the Qaidam Basin. Ganhanqu Yanjiu. 2022, 39, 1543–1554. [Google Scholar]
  7. Li, J. Enrichment and Metallogenic Mechanism of the Brine-Type K, B, Li Resources in the Qaidam Basin, W. China. Ph.D. Thesis, University of Science and Technology of China, Hefei, China, 2022. [Google Scholar]
  8. Shan, J.; Ju, J.; Zhang, W.; Han, H.; Zhou, T.; Wang, Y.; Yang, S.; Cao, Y. Hydrocarbon accumulation patterns of salt crust covered biogenic gas reservoirs in the Sanhu Depression, Qaidam Basin. Nat. Gas. Ind. B 2020, 7, 120–126. [Google Scholar] [CrossRef]
  9. Zheng, J.F.; Shen, A.J.; Liu, Y.F.; Chen, Y.Q. Genesis and Distribution of the Cambro-Ordovician Dolomite in Tarim Basin. Xinjiang Pet. Geo. 2011, 32, 598–600. [Google Scholar]
  10. Li, B.; Wang, M.; Ran, Q. Effect of the salinity of formation water on biogas migration, accumulation and reservoir formation. Nat. Gas Ind. 2003, 23, 16–20. [Google Scholar]
  11. Twardowski, M.S.; Boss, E.; Sullivan, J.M.; Donaghay, P.L. Modeling the spectral shape of absorption by chromophoric dissolved organic matter. Mar. Chem. 2004, 89, 69–88. [Google Scholar] [CrossRef]
  12. Yang, M. Paleoenvironmental Evolution in the Neogene-Quaternary Period of the Sanhu Depression. Ph.D. Thesis, Lanzhou University, Lanzhou, China, 2018. [Google Scholar]
  13. Yin, M.; Huang, H. Quaternary exhumation history of the NE Tibetan Plateau revealed by peculiar distributions of polycyclic aromatic hydrocarbons in core extracts from the Sanhu depression, eastern Qaidam basin. J. Quat. Sci. 2020, 35, 869–880. [Google Scholar] [CrossRef]
  14. Yang, N. Characteristics of Groundwater Stable Isotopic Compositions in Eastern Qaidam Basin: Implications for Moisture Sources and Climate Change. Ph.D. Thesis, China University of Geosciences (Beijing), Beijing, China, 2021. [Google Scholar]
  15. Yang, N.; Zhou, P.; Wang, G.; Zhang, B.; Shi, Z.; Liao, F.; Li, B.; Chen, X.; Guo, L.; Dang, X.; et al. Hydrochemical and isotopic interpretation of interactions between surface water and groundwater in Delingha, Northwest China. J. Hydrol. 2021, 598, 126243. [Google Scholar] [CrossRef]
  16. He, P.J.; Xue, J.F.; Shao, L.M.; Li, G.J.; Lee, D.J. Dissolved organic matter (DOM) in recycled leachate of bioreactor landfill. Water Res. 2006, 40, 1465–1473. [Google Scholar] [CrossRef] [PubMed]
  17. Lin, P. Influence Factors and Formation of Quaternary Biogenic Gas of Nuobei Area in Sanhu Depression, Qaidam Basin. Master’s Thesis, Nanjing University, Nanjing, China, 2018. [Google Scholar]
  18. Albrecht, R.; Joffre, R.; Gros, R.; Le Petit, J.; Terrom, G.; Périssol, C. Efficiency of near-infrared reflectance spectroscopy to assess and predict the stage of transformation of organic matter in the composting process. Bioresour. Technol. 2008, 99, 448–455. [Google Scholar] [CrossRef] [PubMed]
  19. Cheng, Y.Y.; Wang, S.L.; HU, S.B.; Zhou, C.Y.; Shi, Z.; Li, Q.; Huang, X.P. The Fluorescence characteristics of dissolved organic matter (DOM)in the Seagrass ecosystem from Hainan by Fluorescence Excitation-Emission Matric Spectruscopy. Spectrosc. Spectr. Anal. 2015, 35, 141–145. [Google Scholar]
  20. Shuai, Y.; Zhang, S.; Chen, J.; Su, A. Source of nutrient substrates for microbes in deep biosphere and characteristics of biogenic gas source rock. Sci. China Earth Sci. 2010, 53, 1163–1168. [Google Scholar] [CrossRef]
  21. Shuai, Y.; Zhang, S.; Zhao, W.; Su, A.; Wang, H. Longitudinal distributions of two formation pathways of biogenic gases in continental deposits: A case study from Sebei 1 gas field in the Qaidam Basin, western China. Sci. China Ser. D-Earth Sci. 2007, 50, 221–227. [Google Scholar] [CrossRef]
  22. Xiao, Y. Groundwater Circulation Patterns and Its Change Trend in Southern Qaidam Basin, Northwest China. Ph.D. Thesis, China University of Geosciences (Beijing), Beijing, China, 2018. [Google Scholar]
  23. Xiao, Y.; Shao, J.; Frape, S.K.; Cui, Y.; Dang, X.; Wang, S.; Ji, Y. Groundwater origin, flow regime and geochemical evolution in arid endorheic watersheds: A case study from the Qaidam Basin, northwest China. Hydro. Earth Syst. Sci. 2018, 22, 4381–4400. [Google Scholar] [CrossRef]
  24. Zhang, Y.; Miao, M.; Xu, J.; Jia, Z.; Li, Q.; Lin, Y.; Wang, M.; Wang, R. Distribution of Biogenic Gas Reservoirs and Optimization of Favorable Zones in the Sanhu Area, Qaidam Basin, China. Sustainability 2023, 15, 9920. [Google Scholar] [CrossRef]
  25. Ju, Y.P.; Lv, R.S.; Yang, J. Three-dimensional excitation emission matrix fluorescence spectroscopic characterization of dissolved organic matter in coal mine water. Meitan Xuebao 2012, 37, 1396–1400. [Google Scholar]
  26. Shao, Z.; He, S.; Hou, L.; Wang, Y.; Tian, C.; Liu, X.; Zhou, Y.; Hao, M.; Lin, C. Dynamic Accumulation of the Quaternary Shale Biogas in Sanhu Area of the Qaidam Basin, China. Energies 2022, 15, 4593. [Google Scholar] [CrossRef]
Figure 1. The schematic hydrogeology (a) and Quaternary Stratigraphic Column map (b) of Qaidam Basin.
Water 16 02163 g001
Figure 2. Stable isotope distribution of hydrogen and oxygen in the formation and surface water of central depression in Qaidam Basin (The data of brine lake and river water are cited from Li et al. [11]).
Water 16 02163 g002
Figure 3. The organic matter contents and CDOM index variation in the surface and formation water of Qaidam Basin.
Water 16 02163 g003
Figure 4. Fitting graphs of organic matter content in formation water, water isotopes, and CDOM spectral index in the central depression area of the Qaidam Basin; (a) Linear fit of total organic carbon (TOC) content with hydrogen (filled blue rhombus) and oxygen isotope (filled purple triangle) content; (b) Fitting of total organic carbon (TOC) content with humification index (HIX, filled green circle) and spectral index of aromaticity (SUV254, filled square).
Water 16 02163 g004
Table 1. Indicators of the ultraviolet-visible absorption spectrum and 3D fluorescence EEMs of CDOM.
DefinitionDescription
HIXAt excitation wavelength 254 nm, HIX = i = 435 480 m E m i i = 300 345 m E m i An indicator of humus content or degree of humification in dissolved organic matter [18]
E253/E203Abs 253 nm/Abs 203 nm 1The characteristics of functional groups on benzene ring structure in dissolved organic matter [19]
SUVA254Abs 254 nm/CDOC 2Aromaticity index in dissolved organic matter [19]
Notes: 1 Abs: The absorption at wavelength 253 nm and 203 nm; 2 CDOC: The concentration of dissolved organic carbon in the solution.
Table 2. Hydrochemical characters of groundwater and surface water collected from the central depression in Qaidam Basin.
NoTypeDepthCaKMgNaClSO42−NO3HCO3TDSδ18OδD
(m)g/Lg/Lg/Lg/Lg/Lg/Lg/Lmmol/Lg/L
TDBrine00.550.450.7016.026.92.861.622.154.50.51−8.69
XCDHBrine00.140.100.074.55.92.090.021.914.62.889.66
GEMHRiver00.070.020.020.10.10.100.023.81.8−9.73−64.14
YKHRiver00.100.020.010.10.20.120.023.61.9−10.39−68.55
YH1YH1902.470.152.1931.457.20.760.950.8105.5−6.62−63.32
YH2YH3002.840.142.1836.264.30.820.851.0119.4−5.94−60.91
YH3YH4103.260.131.8044.177.70.680.370.8142.8−5.41−59.41
S1-1SB6000.900.170.8932.651.30.941.092.698.720.28−16.83
S1-2SB6850.860.170.9435.357.10.820.402.4107.3//
S1-3SB9801.760.240.9433.755.40.380.201.8103.9−0.98−49.48
S1-4SB11001.570.240.8337.459.50.780.692.8113.5−5.30−56.44
S1-5SB14251.340.240.8735.161.10.770.446.8111.60.62−47.75
S2-1SB11001.580.210.9135.455.70.880.274.0106.8−5.79−60.09
S2-2SB11601.290.190.6326.944.40.931.045.684.4−6.78−64.03
TN1TN9902.320.401.4570.0108.30.510.082.4206.3−2.14−39.91
TN2TN12152.810.361.2956.186.70.720.113.2166.7−3.09−45.86
TN3TN13652.930.371.2354.992.31.100.282.0171.4−3.13−46.42
TN4TN15003.130.421.3461.496.60.540.093.0183.912.72−21.58
TN5TN15353.010.391.2356.486.60.590.122.4167.2−2.09−44.12
TN6TN17402.780.421.2158.891.60.570.203.0175.2−1.79−44.36
Disclaimer/Publisher’s Note: The statements, opinions and data contained in all publications are solely those of the individual author(s) and contributor(s) and not of MDPI and/or the editor(s). MDPI and/or the editor(s) disclaim responsibility for any injury to people or property resulting from any ideas, methods, instructions or products referred to in the content.

