Article

Construction Stability Analysis and Field Monitoring of Shallowly Buried Large-Section Tunnels in Loess Strata

1
School of Civil Engineering, Xi’an University of Architecture and Technology, Xi’an 710055, China
2
Shaanxi Key Laboratory of Geotechnical and Underground Space Engineering, Xi’an 710055, China
*
Author to whom correspondence should be addressed.
Water 2024, 16(15), 2192; https://doi.org/10.3390/w16152192 (registering DOI)
Submission received: 1 July 2024 / Revised: 28 July 2024 / Accepted: 30 July 2024 / Published: 2 August 2024

Abstract

:
Reasonable excavation step footage and lining support timing are highly important for improving tunnel construction efficiency and ensuring construction safety. Taking the Huanxian No. 1 Tunnel of the Xi-Yin railway as the basis of this study, a 3D numerical model was established using MIDAS GTS NX290 finite element software. This model was used to investigate the deformation and force characteristics of the tunnel-surrounding rock and support structures under three different excavation footages and four different lining construction timings; the numerical results were then compared with the on-site monitoring results. This research aimed to determine reasonable excavation parameters for the three-bench seven-step excavation method used in shallowly buried loess tunnels. The results revealed positive correlations between the excavation step footage and surface subsidence, crown subsidence, and clearance convergence. An excavation footage of 3 m could balance construction efficiency and safety effectively. Keeping the secondary lining construction time unchanged, the early closure of the initial support was beneficial for reducing the force on the secondary lining. Keeping the early closure time of the initial support unchanged, the early construction of the secondary lining would lead to an increase in the force on the secondary lining. The initial support of the tunnel is recommended to be closed as early as possible, and the construction of the secondary lining should be shifted by 21 m behind the upper step palm surface. By comparing the on-site monitoring data with the numerical simulation results, similar trends were observed, providing reference and guidance for the subsequent construction of large-section tunnels in shallowly buried loess formations.

1. Introduction

With the implementation of the national “Belt and Road” strategy, transportation infrastructure in the loess area of Northwest China has developed vigorously, especially the construction of highway and railway loess tunnels in mountainous areas, which has expanded annually [1,2]. The structural and water sensitivity characteristics of loess are significant, and the strength of loess decreases greatly after encountering water, which easily causes instability in the surrounding rock, resulting in difficulty in excavating loess tunnels [3,4,5]. Especially in the construction of ultrashallowly buried large-section tunnels in loess strata, the upper cover soil is thin and cannot form a pressure arch, which easily causes large deformations of the tunnel surface and surrounding rock in the tunnel, collapses, roof collapses, and other engineering defects. The lining time and excavation footage are the key factors that determine the progress and safety of tunnel construction. Therefore, studying the deformation and force characteristics of support structures and the surrounding rock in large-section tunnels with shallowly buried loess formations under different construction parameters is highly important. This study aims to determine the most economical and reasonable construction scheme for tunnel construction.
Scholars at home and abroad have performed much research on the construction of loess tunnels. In terms of theoretical research, Wang et al. successfully established the functional relationship between the water content and the stability of the palm surface on the basis of the instability mechanism of the palm surface of a large cross-section tunnel in loess [6]. To accurately determine the construction stability of loess tunnels, Song et al. successfully established a loess damage constitutive model considering the effects of confining pressure and water content on the basis of the damage mechanics theory [7]. Tong established a calculation method that considered a variety of objective factors affecting the surrounding rock pressure, derived a general surrounding rock pressure calculation formula that was convenient for engineering applications, and verified the reliability and applicability of the formula [8]. Xue et al. collected 30 tunnel loess samples, combined their physical parameters, and established a theoretical evaluation model of loess stability [9]. Wang et al. established an analytical formula for the radius of the plastic zone of the surrounding rock considering the loess structure and discussed the variation in the surrounding rock pressure under different factors [10]. Lee et al. adopted a research method that combines theory and numerical simulation to consider the stability of tunnel palm surface excavation under the premise of seepage in shallowly buried tunnels [11].
In terms of numerical analysis, Song et al. took a small clear distance double-track tunnel in shallow loess as the research object and studied the influence of the first excavation of the right tunnel and the left tunnel on the tunnel stability through numerical simulation [12]. Yuan et al. used ANSYS software to numerically simulate the excavation sequence of the double-sidewall diversion method for shallowly buried loess tunnels and proposed a construction process involving a short construction period and high safety [13]. Hu et al. used PFC to simulate the failure process of the surrounding rock in loess tunnels, and the research results showed that burial depth was the main factor affecting the failure mode of the surrounding rock [14]. Lan et al. used ANSYS to simulate the entire process of excavating a tunnel in loess via the method of constructing an arc-shaped pilot tunnel. They investigated the patterns of deformation and stress changes in the rock surrounding a tunnel and proposed corresponding measures for controlling the surrounding rock deformation [15]. Through a numerical simulation of tunnel excavation, Thomas et al. found that the tunnel burial depth had a significant impact on the surrounding rock pressure [16]. Zhu et al. used MIDAS software to simulate the excavation construction of a large-section tunnel with different step heights, and the results showed that increasing the height of the upper step would increase crown subsidence and peripheral convergence, which was not conducive to ensuring the stability of the tunnel construction [17]. Li et al. used MIDAS software to simulate the whole excavation process of loess tunnels via the three-bench seven-step excavation method. The results showed that after invert construction, the deformation of the tunnel-surrounding rock was only 10–20% of the total deformation, indicating that the closure of the invert was the key factor controlling the deformation of the surrounding rock [18]. Liu et al. proposed a high-prestressed bolt support system based on the active support concept and conducted a numerical analysis of the new support system through FLAC3D software; the results showed that the new support system can effectively improve the stress state of the surrounding rock [19]. Xue et al. used FLAC3D software to simulate a representative sample data set of the total deformation of loess tunnels and input it into the BPNN prediction model. The results showed that the BPNN model could successfully predict the total deformation of typical loess tunnels [20].
In terms of model test research, Yang et al. carried out surrounding rock pressure test research on loess tunnels and proposed the basis for the division of deeply and shallowly buried loess tunnels and the design criteria of the secondary lining thickness [21]. Based on large-scale 3D laboratory model tests, Cui et al. noted that the ground displacement difference in shallowly buried loess tunnels under hard, soft, and plastic flow conditions was greater at the sidewall and smaller at the vault [22]. Tan et al. conducted an experimental study on the anchor rod of a loess tunnel system, and the results showed that the removal of the arch anchor could reduce the construction process and accelerate the early closure of the initial supporting section, effectively controlling the deformation of the surrounding rock and reducing settlement [23]. Based on a 1:10 load model test, Liu et al. explored the influence of four sliding surfaces on the lining cracking of shallowly buried loess tunnels after flooding [24]. Imamura et al. conducted a centrifugal model test of the tunnel shield construction process and pointed out that the relationship between the center settlement of the surface and the buried depth of the tunnel is an exponential function [25]. To analyze the relationship between changes in matric suction and tunnel defects, Xue et al. analyzed field monitoring and model shear test results and noted that when the moisture content of unsaturated loess increased, the matric suction decreased, and the supporting force of the tunnel structure increased [26]. Chen et al. studied the cause of deformation in a loess tunnel through field testing and proposed a corresponding deformation control technology [27]. Through field tests and numerical simulations, Zhang discussed the influence of the pipe roof construction parameters on tunnel stability with loess tunnel advance supports [28].
In terms of construction technology, Luo et al. established mechanical models for different construction stages based on the force characteristics of the tunnel support structures. They explored the evolution pattern of load release during the tunnel construction process [29]. Sun et al. noted that groundwater affects the construction of loess tunnels and summarized the formation mechanism, seepage field characteristics, and stress and deformation characteristics of the surrounding rock of three different types of water-rich loess [30]. Li et al. studied the mechanical action of tunnel bolts during construction, obtained the stress characteristics of the bolt system in the vault and sidewall, and proposed canceling the systematic anchoring of the arch, reducing soil disturbance during excavation, and closing the initial support in advance [31]. Luo et al. studied the influence of surface water seepage on the deformation of large-section loess tunnels and noted that surface water and heavy rainfall had serious impacts on shallowly buried tunnels; moreover, when water infiltrated the soil layer where the tunnel was located, water flooding on the top of the tunnel had the greatest impact on the stability of the tunnel structure [32].
The above studies indicate that there is currently a considerable amount of research on aspects such as construction schemes for loess tunnels, rock stress, and support structure deformation characteristics. However, there is limited research on the excavation footage and lining construction timing for shallowly buried large-section loess tunnels. This paper, focusing on the Yinxian-Xi Railway Zhonghuan County No. 1 Tunnel, utilizes MIDAS numerical simulation to explore the variation patterns of surrounding rock deformation, ground settlement, rock stress, and support structure force under different excavation footages and lining construction timings for ultrashallowly buried large-section loess tunnels. The objective is to reasonably select the optimal parameters for excavation footage and lining construction timing and validate their correctness and rationality through on-site monitoring.

2. Project Overview

The Huanxian No. 1 Tunnel, located in Huanxian County, Gansu Province, was designed as a single-hole double-track high-speed railway tunnel, with a total length of 4331.345 m and starting and ending mileages of DK370 + 386.31 and DK374 + 717.655. The tunnel site is located in a loess tableland, the terrain is undulating, the ground elevation is approximately 1250~1440 m, a surface “V”-type gully is present, the terrain on both sides of the gully is broken, and loess caves and loess bridges of different sizes are distributed in the gully. The surrounding rock of the tunnel body is Grade V soil-surrounding rock, which is weak and difficult to construct in and requires a long construction period.
The tunnel section DK372 + 862~DK372 + 922 is 60 m long and located in the Q2 loess layer. The gully is ultrashallowly buried, and the shallowest burial depth of the tunnel is approximately 5 m. The arch of this section is equipped with a 9 m Φ 159 pipe shed, and the annular spacing is 0.4 m. The tunnel section is a three-centered circle + invert with a span of 14.56 m and a height of 12.01 m, denoting a typical large-section tunnel. In the early stage of tunnel construction, the double-sidewall diversion method was adopted, which could not meet the requirements of the construction period. To shorten the construction period and ensure construction safety and project quality, excavation technology with a short construction period and high efficiency is urgently needed. Therefore, this work includes optimization research on different excavation penetration and lining times under the three-bench seven-step excavation method.

3. Numerical Model and Parameter Determination

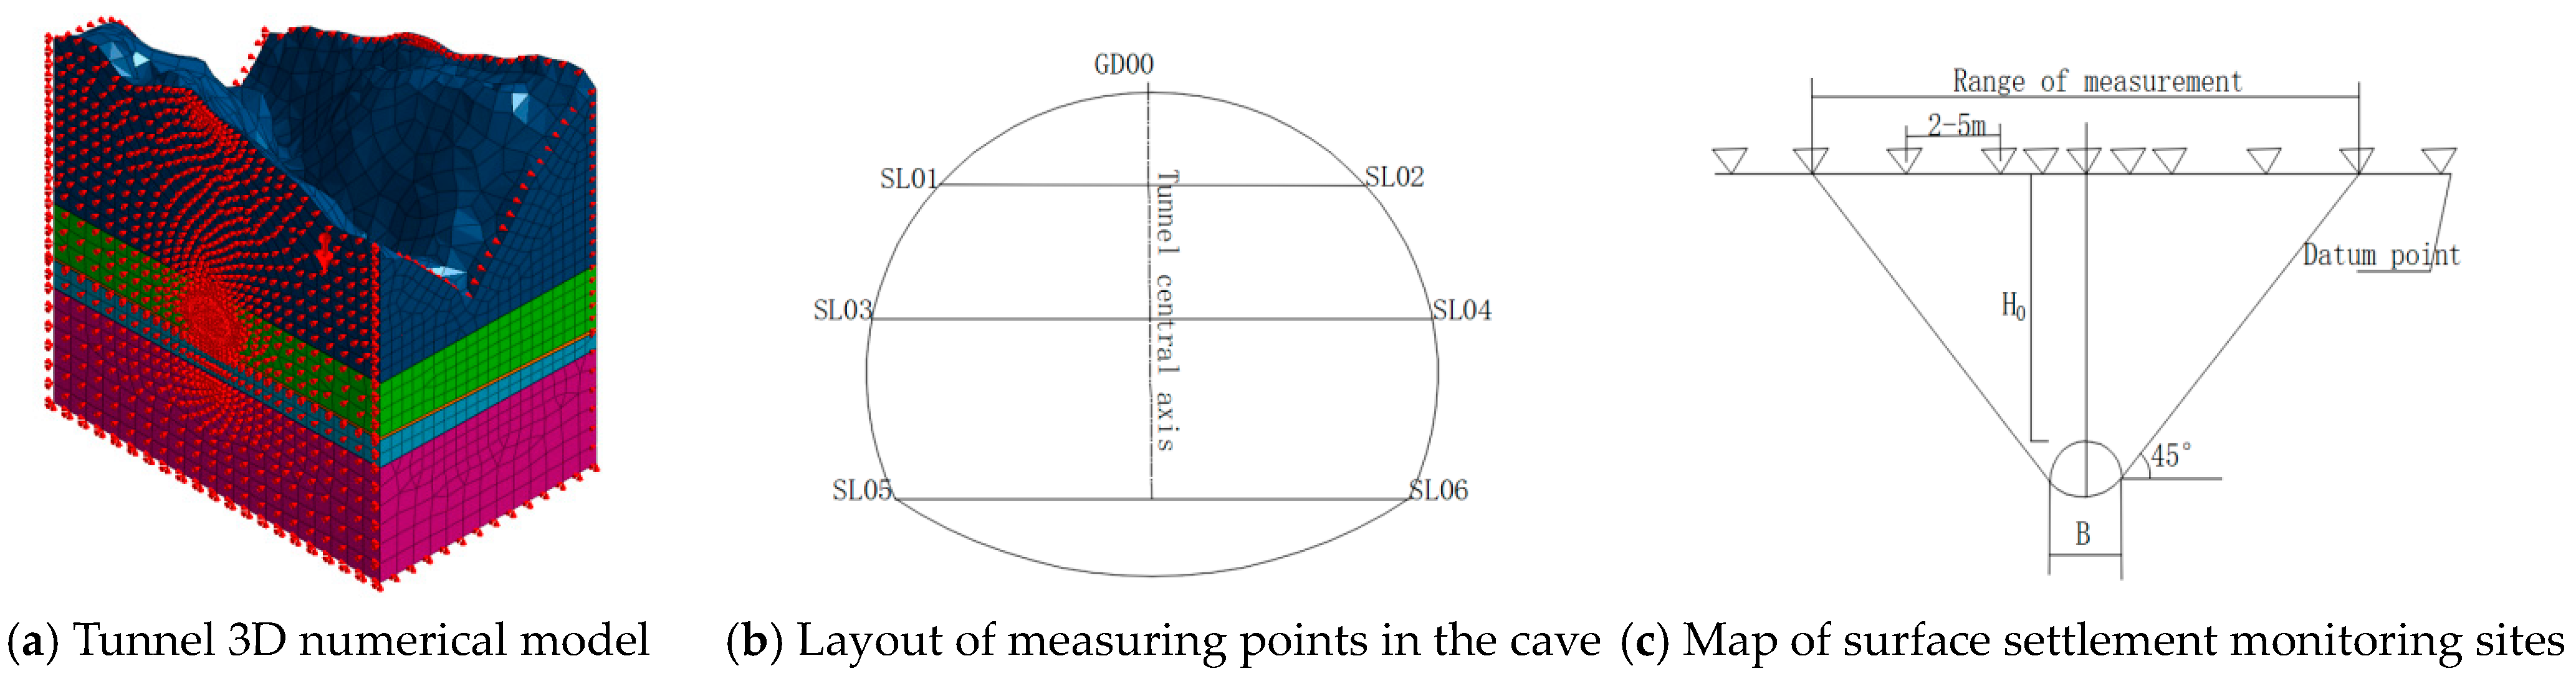
3.1. Numerical Model

The tunnel model diagram and monitoring point layout diagram are shown in Figure 1. According to the engineering conditions of the tunnel DK372 + 862–DK372 + 922 shallowly buried section, this paper selected the DK372 + 900 section as the research section and used MIDAS GTS/NX finite element software to conduct numerical analysis and research on tunnel construction. According to the knowledge of tunnel elasticity, the distance between the left and right arch waist of the model tunnel and the arch bottom of the tunnel and the soil boundary in each direction should be approximately 50 m. The length (vertical tunnel excavation direction) and width (tunnel excavation direction) of the model in this paper were 115 m and 78 m, respectively. The top of the model simulated the actual terrain on site.
The geological body was simulated with the modified Mohr–Coulomb constitutive model, with truss elements implanted for the rock bolts. The advanced small pipes, pipe sheds, initial supports, and temporary supports were all simulated with 2D plate elements. The secondary lining was simulated using 3D solid elements. The physical and mechanical parameters of each material in the model are shown in Table 1. The initial support of the tunnel involved a steel arch combined with an anchor support. To calculate the initial support’s elastic modulus, an equivalent model elastic modulus was used to relate the elastic modulus of the steel supports and steel mesh to that of shotcrete. The specific formula for the elastic modulus of the equivalent model is shown in Equation (1).
E = E c + E s ( A sg + A sw ) A c
where E is the elastic modulus of the equivalent initial support after modification; Ec is the elastic modulus of shotcrete; Es is the elastic modulus of the steel reinforcement; and Asg, Asw, and Ac are the areas of the steel arch, steel mesh, and concrete, respectively.

3.2. Simulation of the Construction Scheme

To study the deformation and stress change characteristics of the surrounding rock and supporting structure under different excavation footages and lining application times with the three-bench seven-step excavation method and to determine reasonable construction parameters, numerical simulation research was carried out through Scheme 1 and Scheme 2.
Scheme 1: To determine a reasonable circular excavation footage, this study adopted the three-bench seven-step excavation method for construction simulation, and the step footage was selected as 1, 3, and 5 m for three circular excavation footage schemes (corresponding to the working conditions K1, K2, and K3). A detailed description is as follows. Between the pilot holes ① and ⑥, the spacing between adjacent pilot holes was set at 1 m, 3 m, and 5 m. When excavating to a distance greater than or equal to 35 m from the bench face of pilot hole ① to pilot hole ⑦, a one-time excavation of 6 m was carried out at pilot hole ⑦, and timely initial support and secondary lining were applied. Figure 2 illustrates the construction process of the three-bench seven-step excavation method, and Figure 3 shows models of the tunnel at different excavation footages.
Scheme 2: To determine a reasonable lining construction time, this study controlled the excavation footage at 1 m and the construction time of four kinds of linings in the following scenarios: the first branch closing and the second lining lagging behind the palm surface of the upper step by 14 m (1D); both the primary branch closure and the secondary lining lagging behind the palm surface of the upper step by 21 m (1.5D); the first branch closing and the second lining lagging behind the palm surface of the upper step by 14 m and 21 m, respectively; and the first branch closing and the second lining lagging behind the palm surface of the upper step by 14 m and 28 m (2D), respectively. These cases correspond to the conditions G1 (14 m × 14 m), G2 (21 m × 21 m), G3 (14 m × 21 m), and G4 (14 m × 28 m).

4. Simulation Study on the Optimization of the Excavation Footage

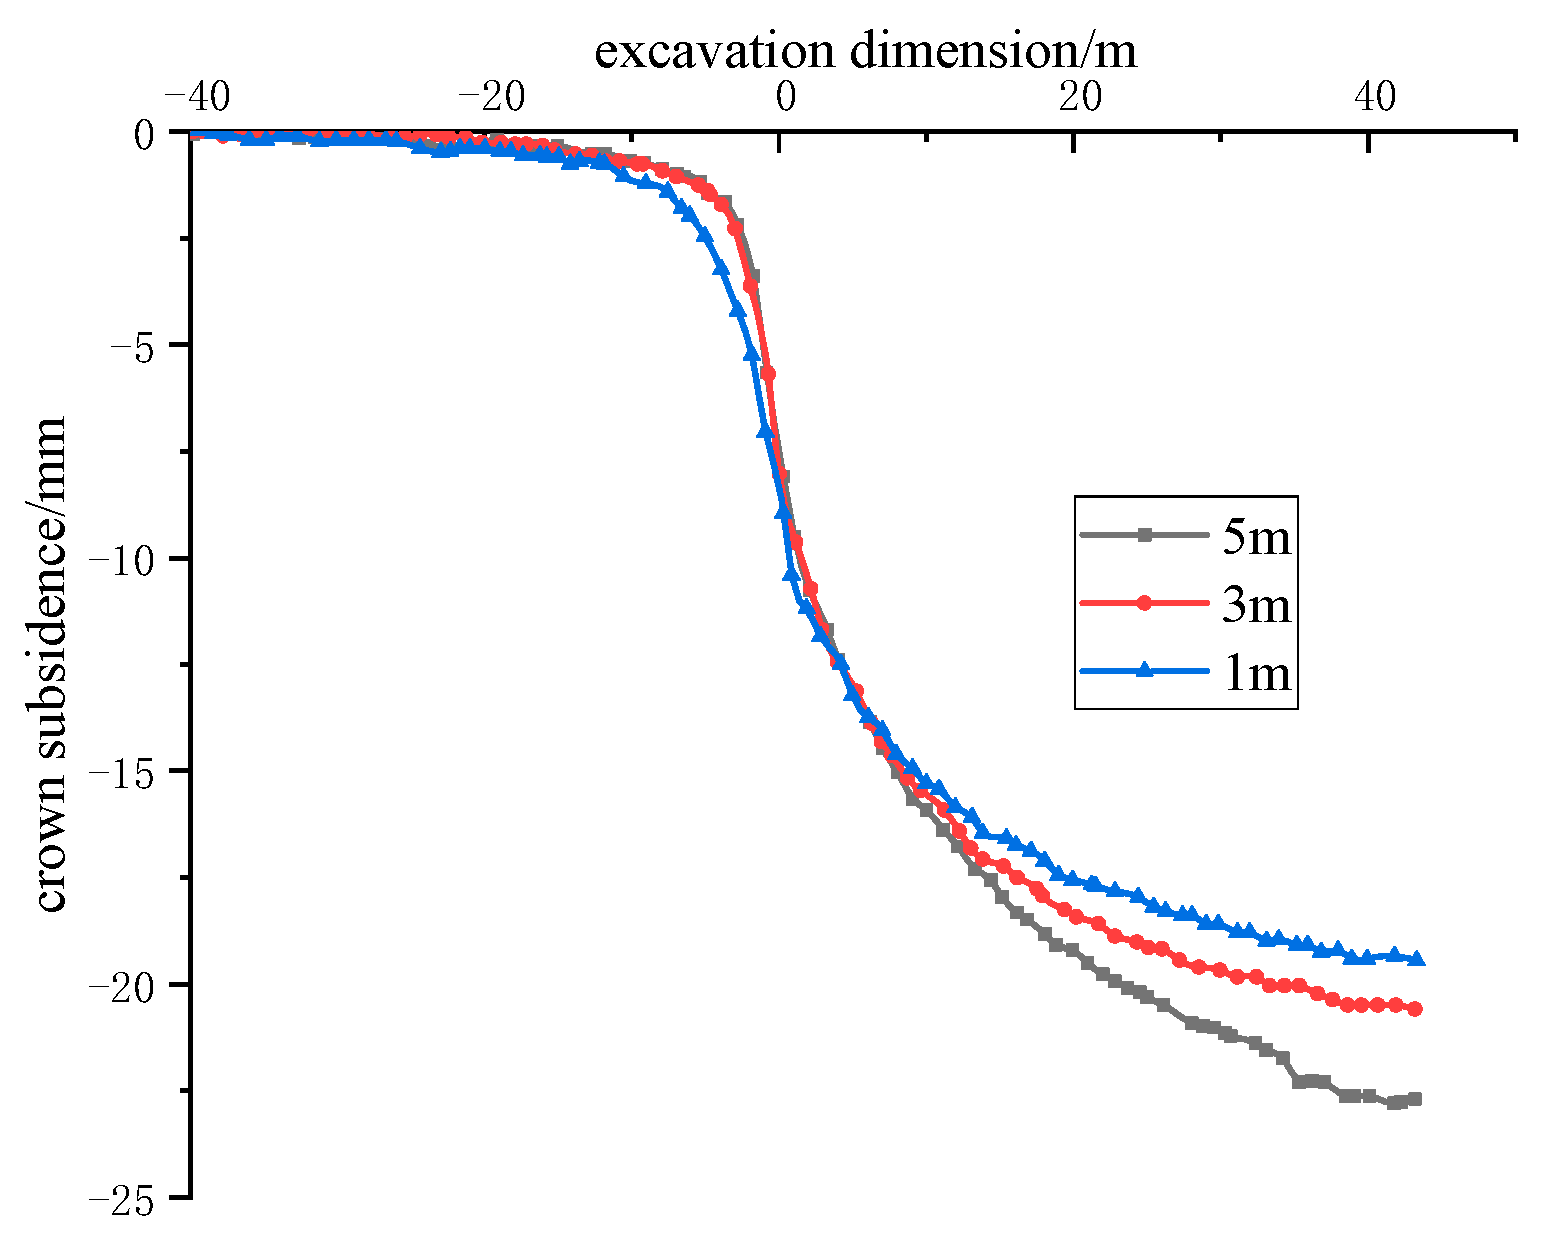
4.1. Deformation Analysis of the Surrounding Rock

Figure 4 shows the settlement change curve of the tunnel vault. As shown in Figure 4, when the three-bench seven-step excavation method is adopted for construction, with continuous tunnel excavation, the crown subsidence shows an “S”-shaped curve growth trend under the three working conditions. When excavating 30 m ahead of the monitoring section, the settlement of the tunnel’s arch begins to increase. As the excavation progresses to 5 m ahead of the monitoring section, the settlement rate of the arch sharply increases. By the time the excavation reaches the monitoring section, the settlement rate of the arch reaches its peak. When the face excavation extends to 40 m, the settlement of the arch tends to stabilize. In terms of total arch settlement, the settlement values are K3 (22.60 mm) > K2 (20.47 mm) > K1 (19.33 mm), with the K3 configuration showing the highest total arch settlement. The total arch settlement increases by 16.92% compared to K1 and by 10.41% compared to K2. The use of different step lengths divides the entire excavation process into multiple stages, and the deformation in each stage is relatively independent. This approach aids in controlling the cumulative settlement of the arch. A smaller step footage implies smaller deformations in each stage, reducing the cumulative settlement effect. As the excavation footage increases, the settlement of the tunnel’s arch also increases. Therefore, the greatest risk of face instability occurs when the excavation footage is 5 m; thus, it is recommended to control the excavation footage within 5 m.
Figure 5 shows the convergence curve of the tunnel arch waist. Figure 5 shows that under the three different working conditions, the deformation of the arch waist follows a “Z” curve. When the palm surface is excavated to 10 m in front of the monitoring fault, normal deformation along the tunnel begins to occur. When the excavation reaches 1 m in front of the monitoring fault, the tunnel normal expansion displacement reaches its peak value. Thus, K3 total normal expansion displacement (3.0 mm) > K2 total normal expansion displacement (2.4 mm) > K1 total normal expansion displacement (1.7 mm). When the tunnel is excavated to the monitoring section, the convergence rate of the arch waist reaches the peak value. Under the K1 condition, the convergence of the arch waist tends to stabilize after the tunnel is excavated through the monitoring section. Under the K2 condition, the convergence of the arch tends to stabilize at 10 m after the tunnel is excavated to the monitored section. Under the K3 condition, the convergence of the arch tends to stabilize when the tunnel is excavated 22 m behind the monitoring section. Thus, at the arch waist, with the gradual excavation of the tunnel, the soil at the arch waist experiences stress concentration, release, redistribution, and other conditions, resulting in the corresponding deformation K3 total convergence (10.34 mm) > K2 total convergence (6.86 mm) > K1 total convergence (4.30 mm). When the step footage is small, the stress release of the soil above is limited to a certain extent, resulting in a certain stress adjustment of the soil at the arch. Therefore, when the step footage is small, the total convergence of the arch waist is relatively small.
Figure 6a shows the variation in surface subsidence after the tunnel excavation. As shown in Figure 6a, the surface subsidence distribution is basically funnel-shaped, and the surface subsidence increases close to the tunnel axis. Under the same working conditions, at the same positions on either side of the tunnel centerline, the final settlement of the ground surface on the left side is slightly greater than that on the right side, and the surface subsidence on the tunnel center axis is the largest. At the same position, the surface settlement on the central axis of the tunnel follows the order of K3 (18.32 mm) > K2 (17.67 mm) > K1 (15.28 mm), which indicates that increasing the excavation footage has little influence on the surface subsidence at the same position. Figure 6b shows a schematic diagram of the surface subsidence force. The force at Point 1 of the tunnel roof is the heavy γh1 of the overlying soil, and the displacement is s1; the force at Point 2 of the tunnel arch waist is Kγh2 (K is the coefficient of lateral pressure of the soil, which is related to the angle of internal friction), and the displacement is s2. Due to the significantly smaller force acting on Point 2 compared to Point 1, the deformation at Point 2 is noticeably smaller than the deformation at Point 1. It is assumed that the stress around the tunnel changes uniformly; then, the stress at Point 4 is obviously greater than that at Point 3; so, the total deformation at Point 4 is greater than that at Point 3. Since the stress at Point 4 is greater than that at Point 3 and the distance L44′ between Point 4 and Point 4′ is obviously greater than the distance L33′ between Point 3 and Point 3′, the stress influence curve of soil mechanics shows that the stress at Point 4 is greater than that at Point 3; so, the total deformation s4′ at Point 4 is greater than the total deformation s3′ at Point 3. Since the angle β between s4′ and the horizontal direction is greater than the angle α between s3′ and the horizontal direction, the vertical displacement component s4′ of Point 4′ is greater than the vertical displacement component s3′ of Point 3′. Therefore, the settlement of the overlying soil surface in the upper part of the tunnel is funnel-shaped.

4.2. Initial Support Force Analysis

Figure 7 shows the distribution of the initial support bending moments under different excavation penetration rates. As shown in Figure 7, the maximum positive bending moments of K2 and K3 are located at the arch foot, and the corresponding maximum negative bending moments are located at the spandrel, which is due to the movement of the soil around the tunnel and the redistribution of soil stress. Because the initial support prevents the movement of the surrounding rock mass in the tunnel, part of the displacement force of the surrounding rock mass is borne by the soil mass with stress redistribution, and the other part is borne by the initial support; so, a large bending moment is generated at the spandrel and at the arch foot. According to the data in Figure 7, under the K3 working condition, the maximum positive and negative bending moments of the initial tunnel support are both the largest among all working conditions tested and are 28.03 kN·m/m and −46.85 kN·m/m, respectively. Under the K2 condition, the maximum positive bending moment is reduced to 19.29 kN·m/m, which is a 31.18% reduction compared with value under the K3 condition, and the maximum negative bending moment is reduced to −44.61 kN·m/m, which is a 4.78% reduction. In the K1 condition, the maximum positive bending moment is reduced to 3.04 kN·m/m, and the maximum negative bending moment is −46.38 kN·m/m, which reductions of 89.15% and 1.00%, respectively, compared with the values in the K3 condition. It can be seen that when the step footage is 1m, its negative bending moment is limited, because the excavation step footage is small, the disturbance to the soil is small, and the surrounding rock deformation is small; so, the bending moment acting on the initial support is small. The analysis showed that the maximum positive bending moment increased significantly when the excavation footage increased and that the maximum negative bending moment was basically unaffected by the excavation footage.
The above analysis revealed that the step footage has a great influence on the stress in the tunnel lining structure, the surrounding rock deformation, and the surrounding rock stress. Increasing the step footage is beneficial for controlling the convergence of the spandrel and the arch foot and can reduce the axial force on the lining structure. However, an increase in step footage leads to an increase in the subsidence of the surface, the subsidence of the crown, the convergence of the arch waist, and the maximum positive bending moment of the lining structure. Considering the above factors, the use of a 3 m step footage is suggested for excavation.

5. Simulation Study on Lining Time Optimization

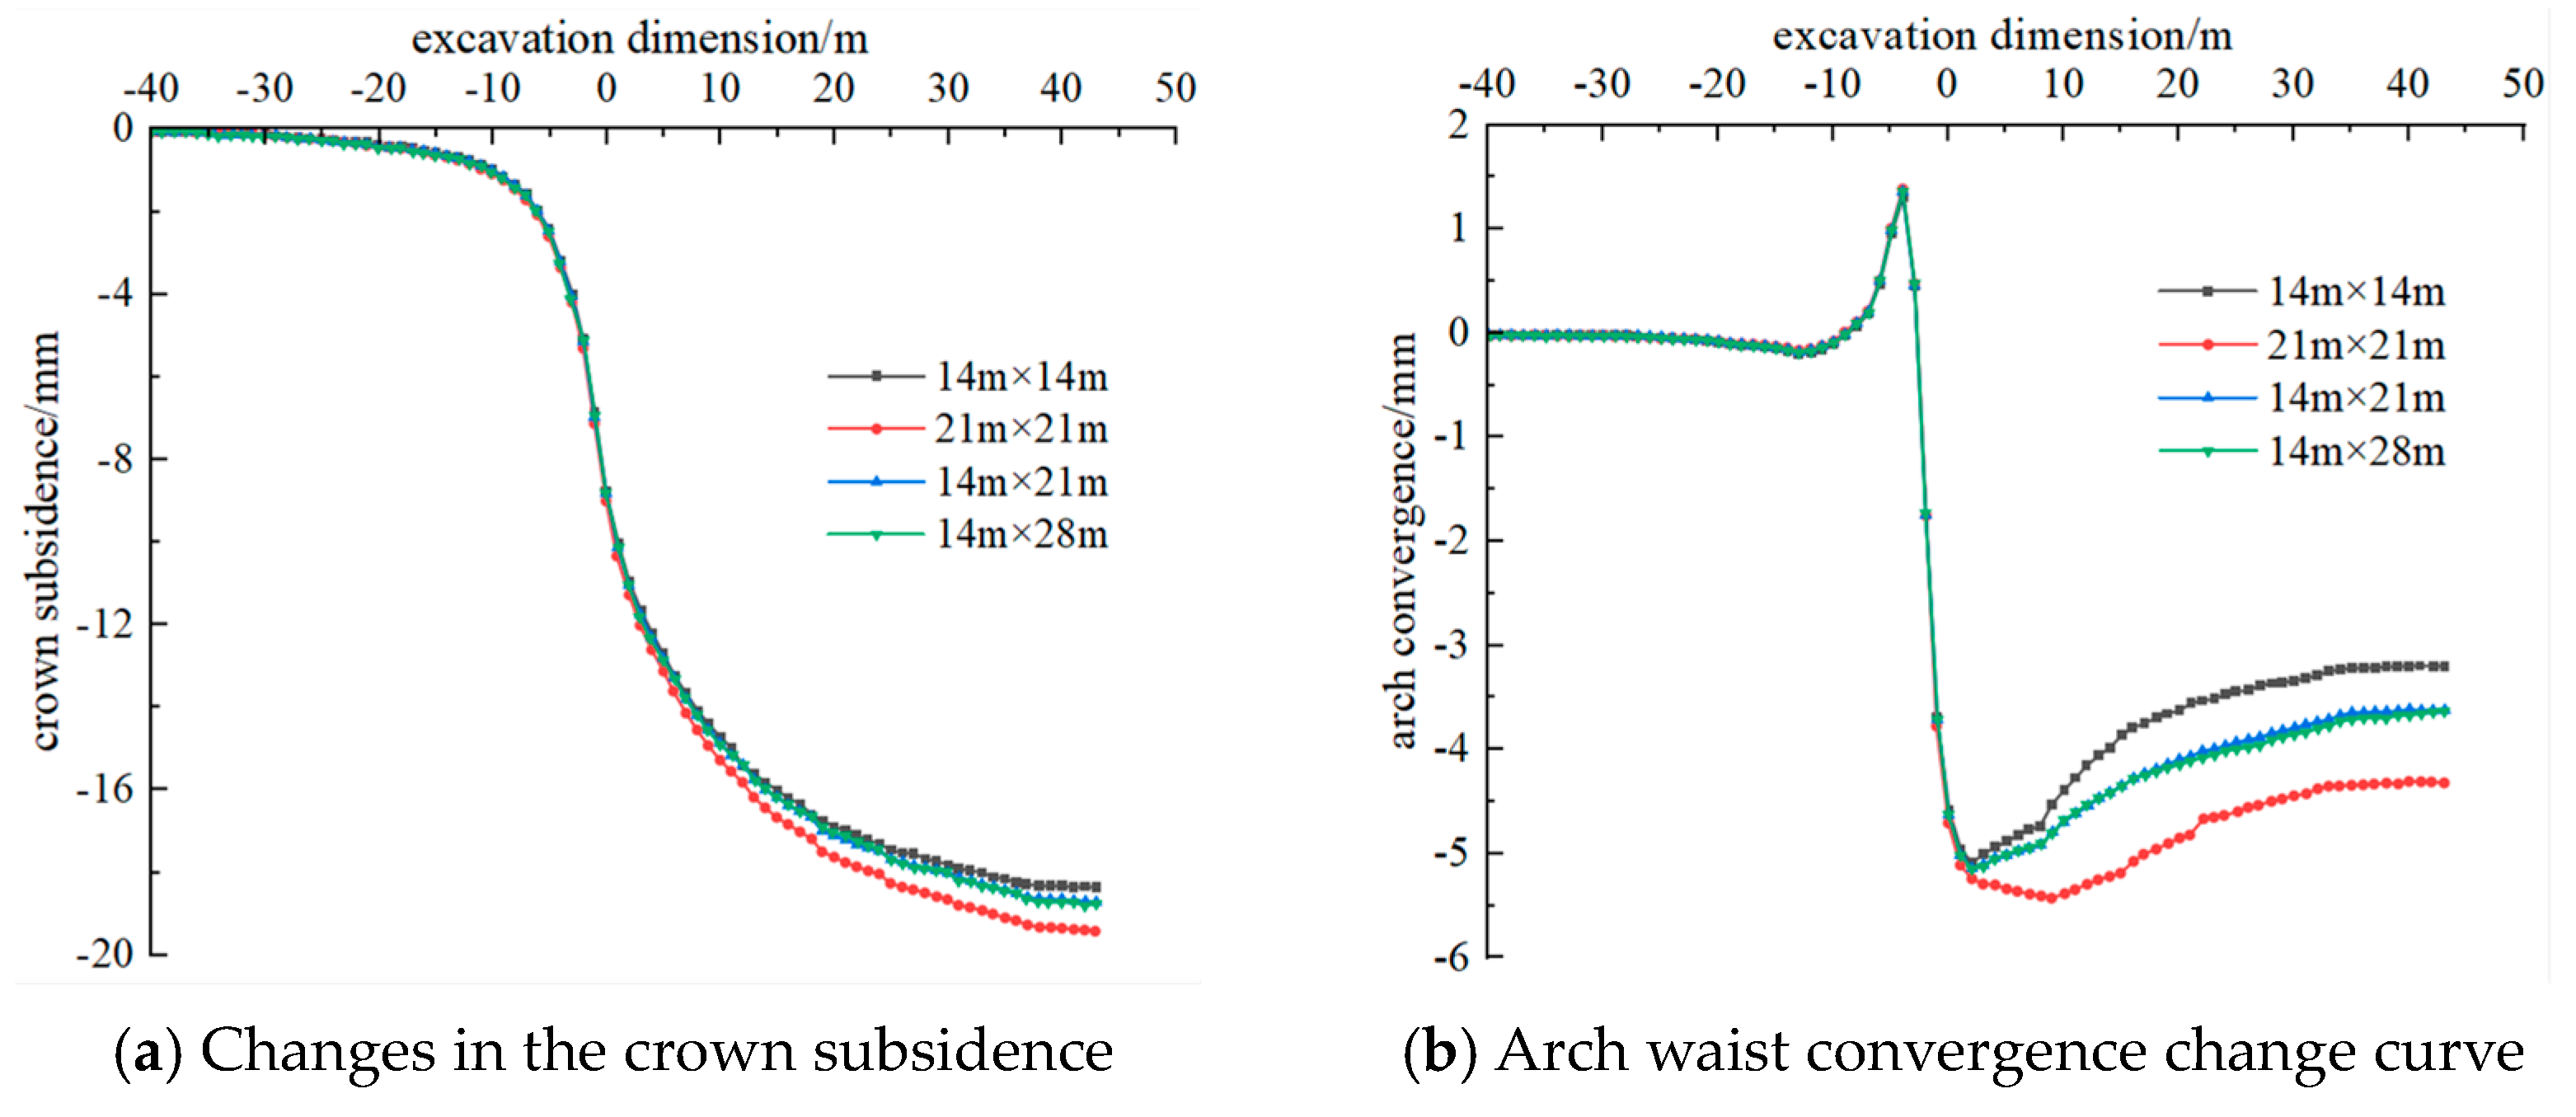
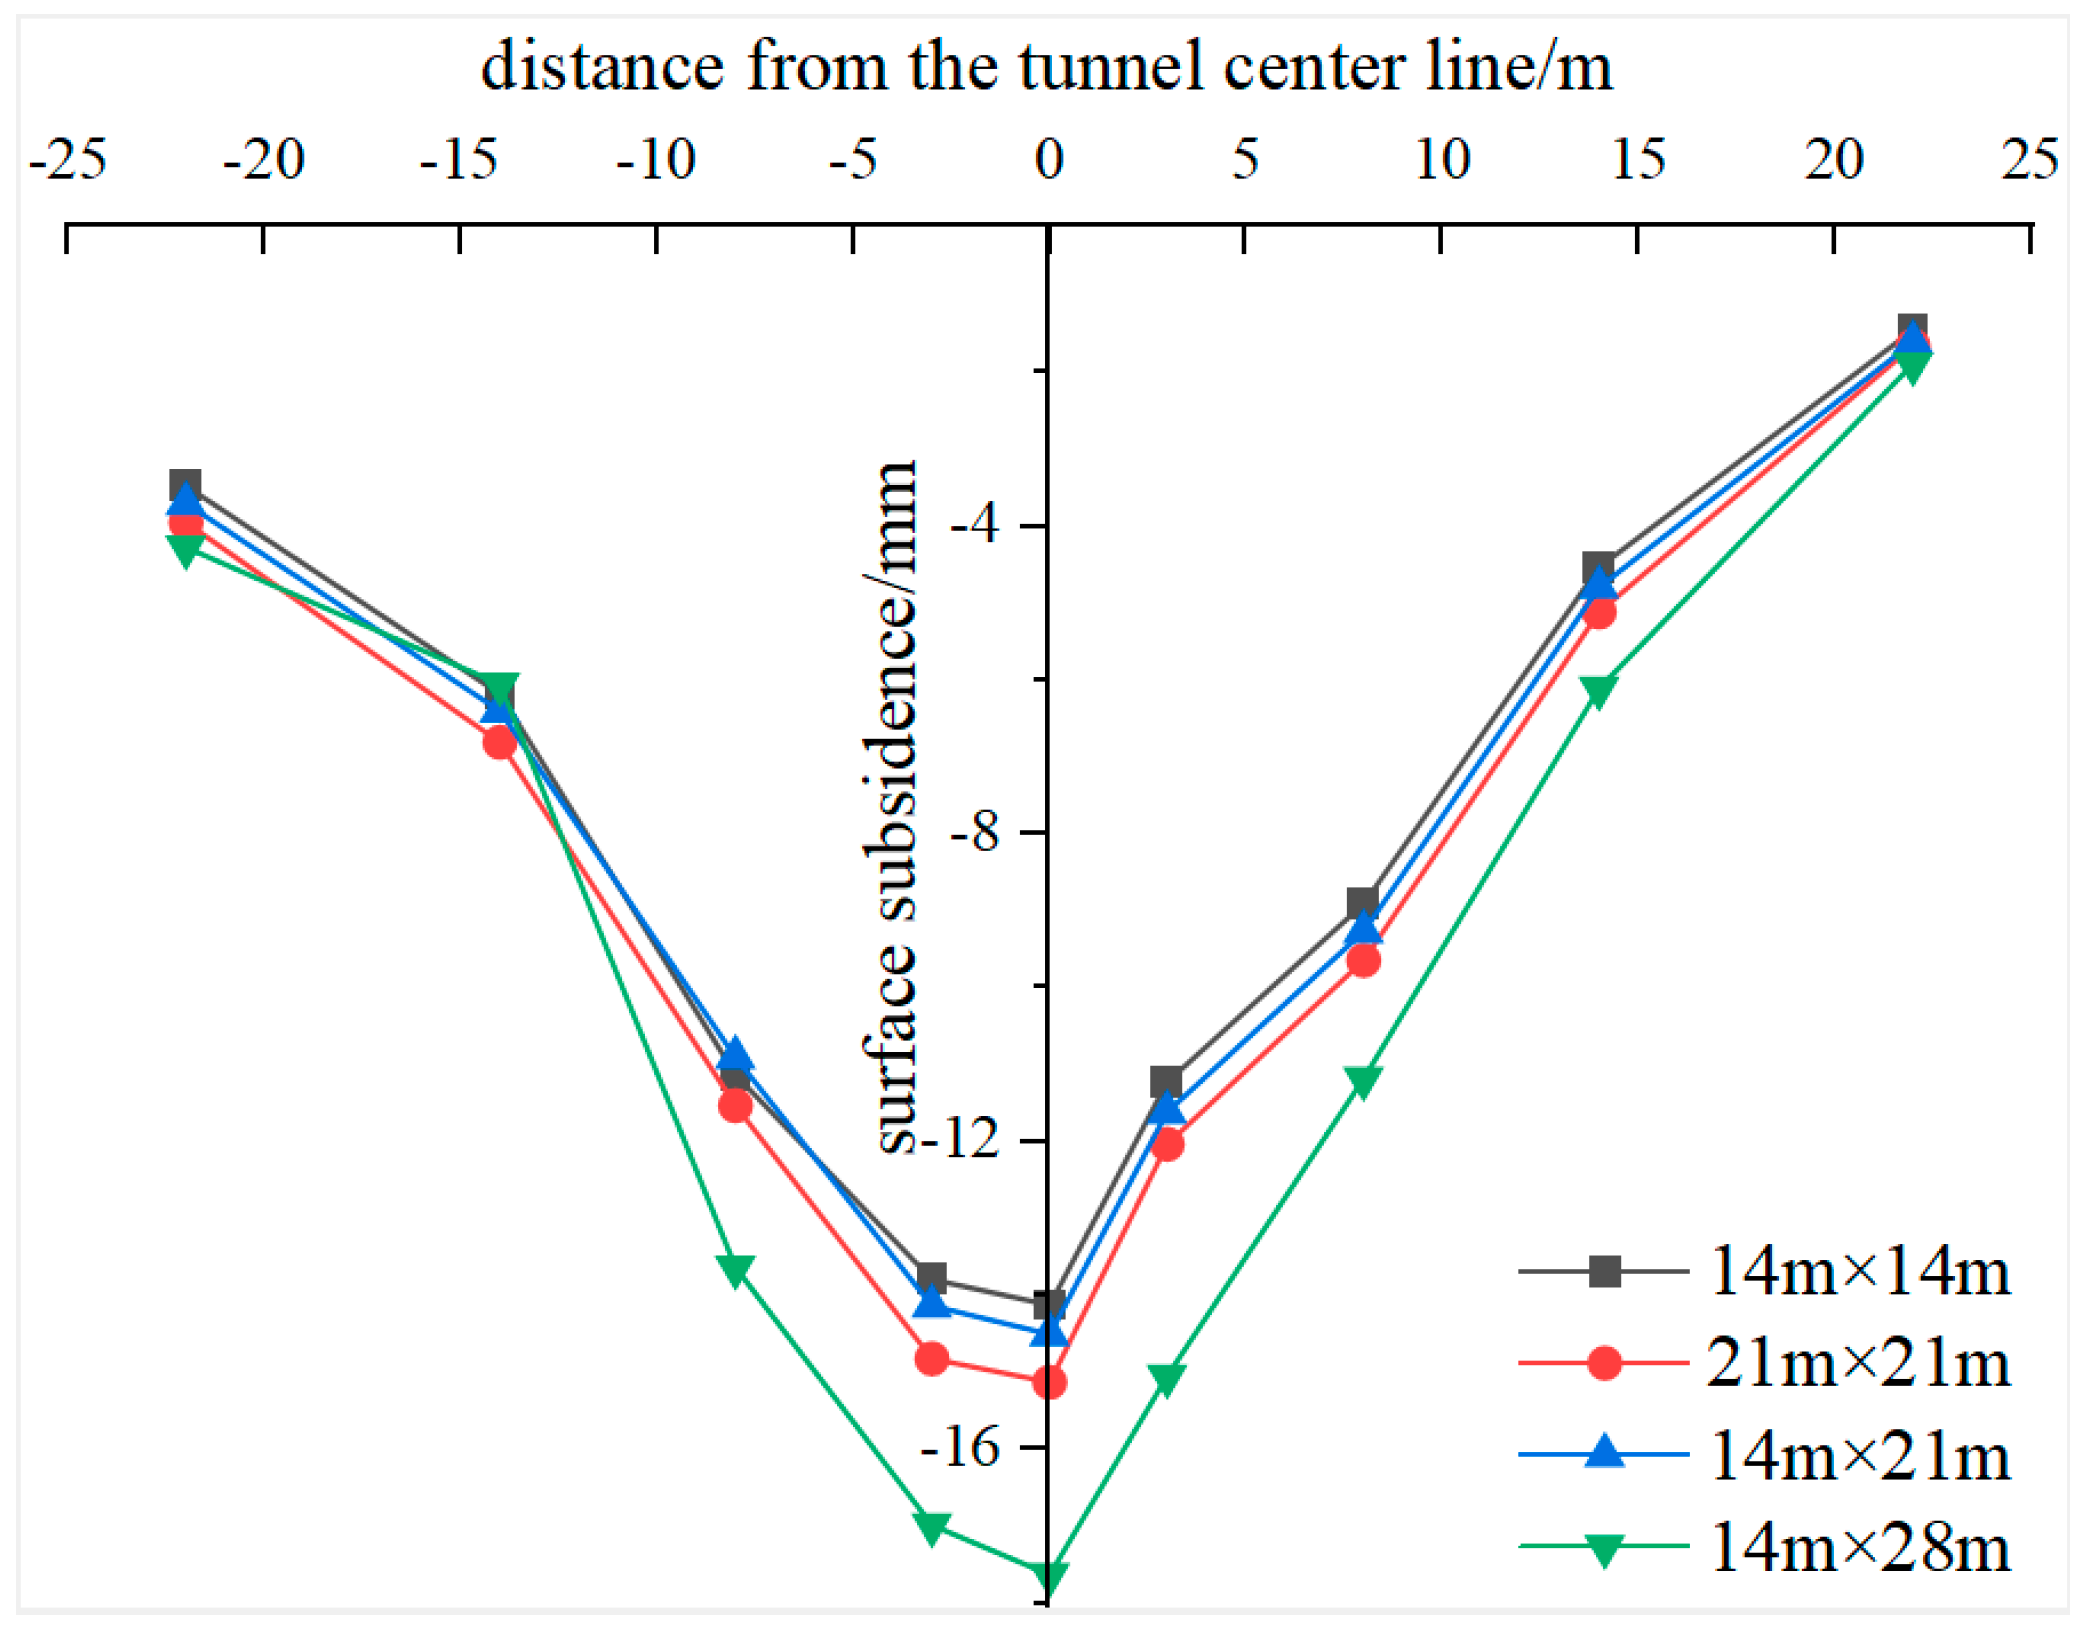
5.1. Deformation Analysis of the Surrounding Rock

As shown in Figure 8, under different lining time conditions, the deformation trend of the rock surrounding the tunnel is the same as above, the crown subsidence of the tunnel shows an “S” curve, and the deformation of the tunnel arch waist shows a “Z” curve. Table 2 gives the final values of arch waist convergence and crown subsidence deformation under different lining time conditions. According to the data in Table 2, under the G2 and G3 working conditions, the second lining lags behind the palm surface of the upper step by 21 m. At this time, the total settlement of the tunnel crown under the G3 working condition is 18.67 mm, while that under the G2 working condition is 19.34 mm, an increase of 3.59% compared with the value under the G3 working condition. Under the G1, G3, and G4 conditions, the initial tunnel support lags behind the upper step palm surface by 14 m, and the total tunnel crown subsidence under the G1 condition is 18.29 mm, while the total values of the tunnel crown subsidence under the G3 condition and the G4 condition are close to 18.67 mm and 18.70 mm, respectively, with increases of 2.08% and 2.24% compared with the value under the G1 condition. Hence, the lining time has little influence on the crown subsidence of the tunnel under the same excavation footage. Under the G2 and G3 conditions, the second lining lags behind the upper step palm surface by 21 m, and the total convergence of the tunnel arch is 3.6 mm under the G3 condition and 4.3 mm under the G2 condition, which is an increase of 18.78% compared with the value in the G3 condition. Under the G1, G3, and G4 conditions, the initial support of the tunnel lags behind the upper step palm surface by 14 m. Under the G1 condition, the total convergence of the tunnel arch waist is 3.19 mm; under the G3 condition and the G4 condition, the total convergence values of the tunnel arch waist are close to 3.62 mm and 3.68 mm, respectively, increasing by 13.48% and 15.36%, respectively, compared with the value under the G1 condition.
Figure 9 shows the surface subsidence trends under different lining application times. According to the data in Figure 9, under the same working conditions, the surface subsidence on the left side of the tunnel at the same distance from the central axis is slightly greater than that on the right side of the tunnel, and the surface subsidence on the central axis of the tunnel is the largest. The G1 settlement value is 14.29 mm, and the G3 settlement value is greater than the G1 settlement value. In the G2 and G3 conditions, both secondary linings lag behind the upper step palm surface by 21 m. With the extension of the initial support construction time, the surface subsidence increases. At this point, the surface subsidence values under the G2 condition are greater than those under the G3 condition. In the G1, G3, and G4 conditions, the initial support of the tunnel lags behind the upper step palm surface by 14 m. As the construction time of the secondary lining increases, there is a faster release of stress in some stages of the surrounding rock. Consequently, the process of surface subsidence accelerates, resulting in an increasing trend for surface subsidence, manifested as G4 settlement > G3 settlement > G1 settlement.

5.2. Analysis of the Initial Support Force

Figure 10 shows the initial support bending moment under different lining application times. According to the data in Figure 10, under the G2 and G3 working conditions, the tunnel secondary lining is constructed 21 m behind the palm surface of the upper step. Under the G2 working condition, the maximum positive and negative bending moments of the initial support are 3.04 kN·m/m and −46.38 kN·m/m, respectively. Under the G3 condition, the maximum positive and negative bending moments of the initial support are 9.86 kN·m/m and −46.63 kN·m/m, respectively. Compared with G3, the maximum positive bending moment in G2 decreases by 69.17%, and the maximum negative bending moment increases by 0.54%. Under the conditions of G1, G3, and G4, the tunnel’s initial support lags behind the upper step palm surface by 14 m. The maximum positive and negative bending moments under the G1, G3, and G4 conditions are 6.30 kN·m/m, 9.86 kN·m/m, and 10.54 kN·m/m and −44.62 kN·m/m, −46.63 kN·m/m, and −46.91 kN·m/m, respectively. Compared with those in the G1 condition, the maximum positive bending moments in the G3 and G4 conditions are 56.51% and 67.30% greater, respectively, and the maximum negative bending moments are 4.50% and 5.13% greater, respectively. The analysis shows that the lining time has a significant influence on the maximum positive bending moment of the initial support but has little influence on the maximum negative bending moment. When the timing of the secondary lining is unchanged, a late closure of the primary support is conducive to bending of the primary support, and when the timing of the primary support is unchanged, an earlier closure of the secondary lining is conducive to bending of the primary support.

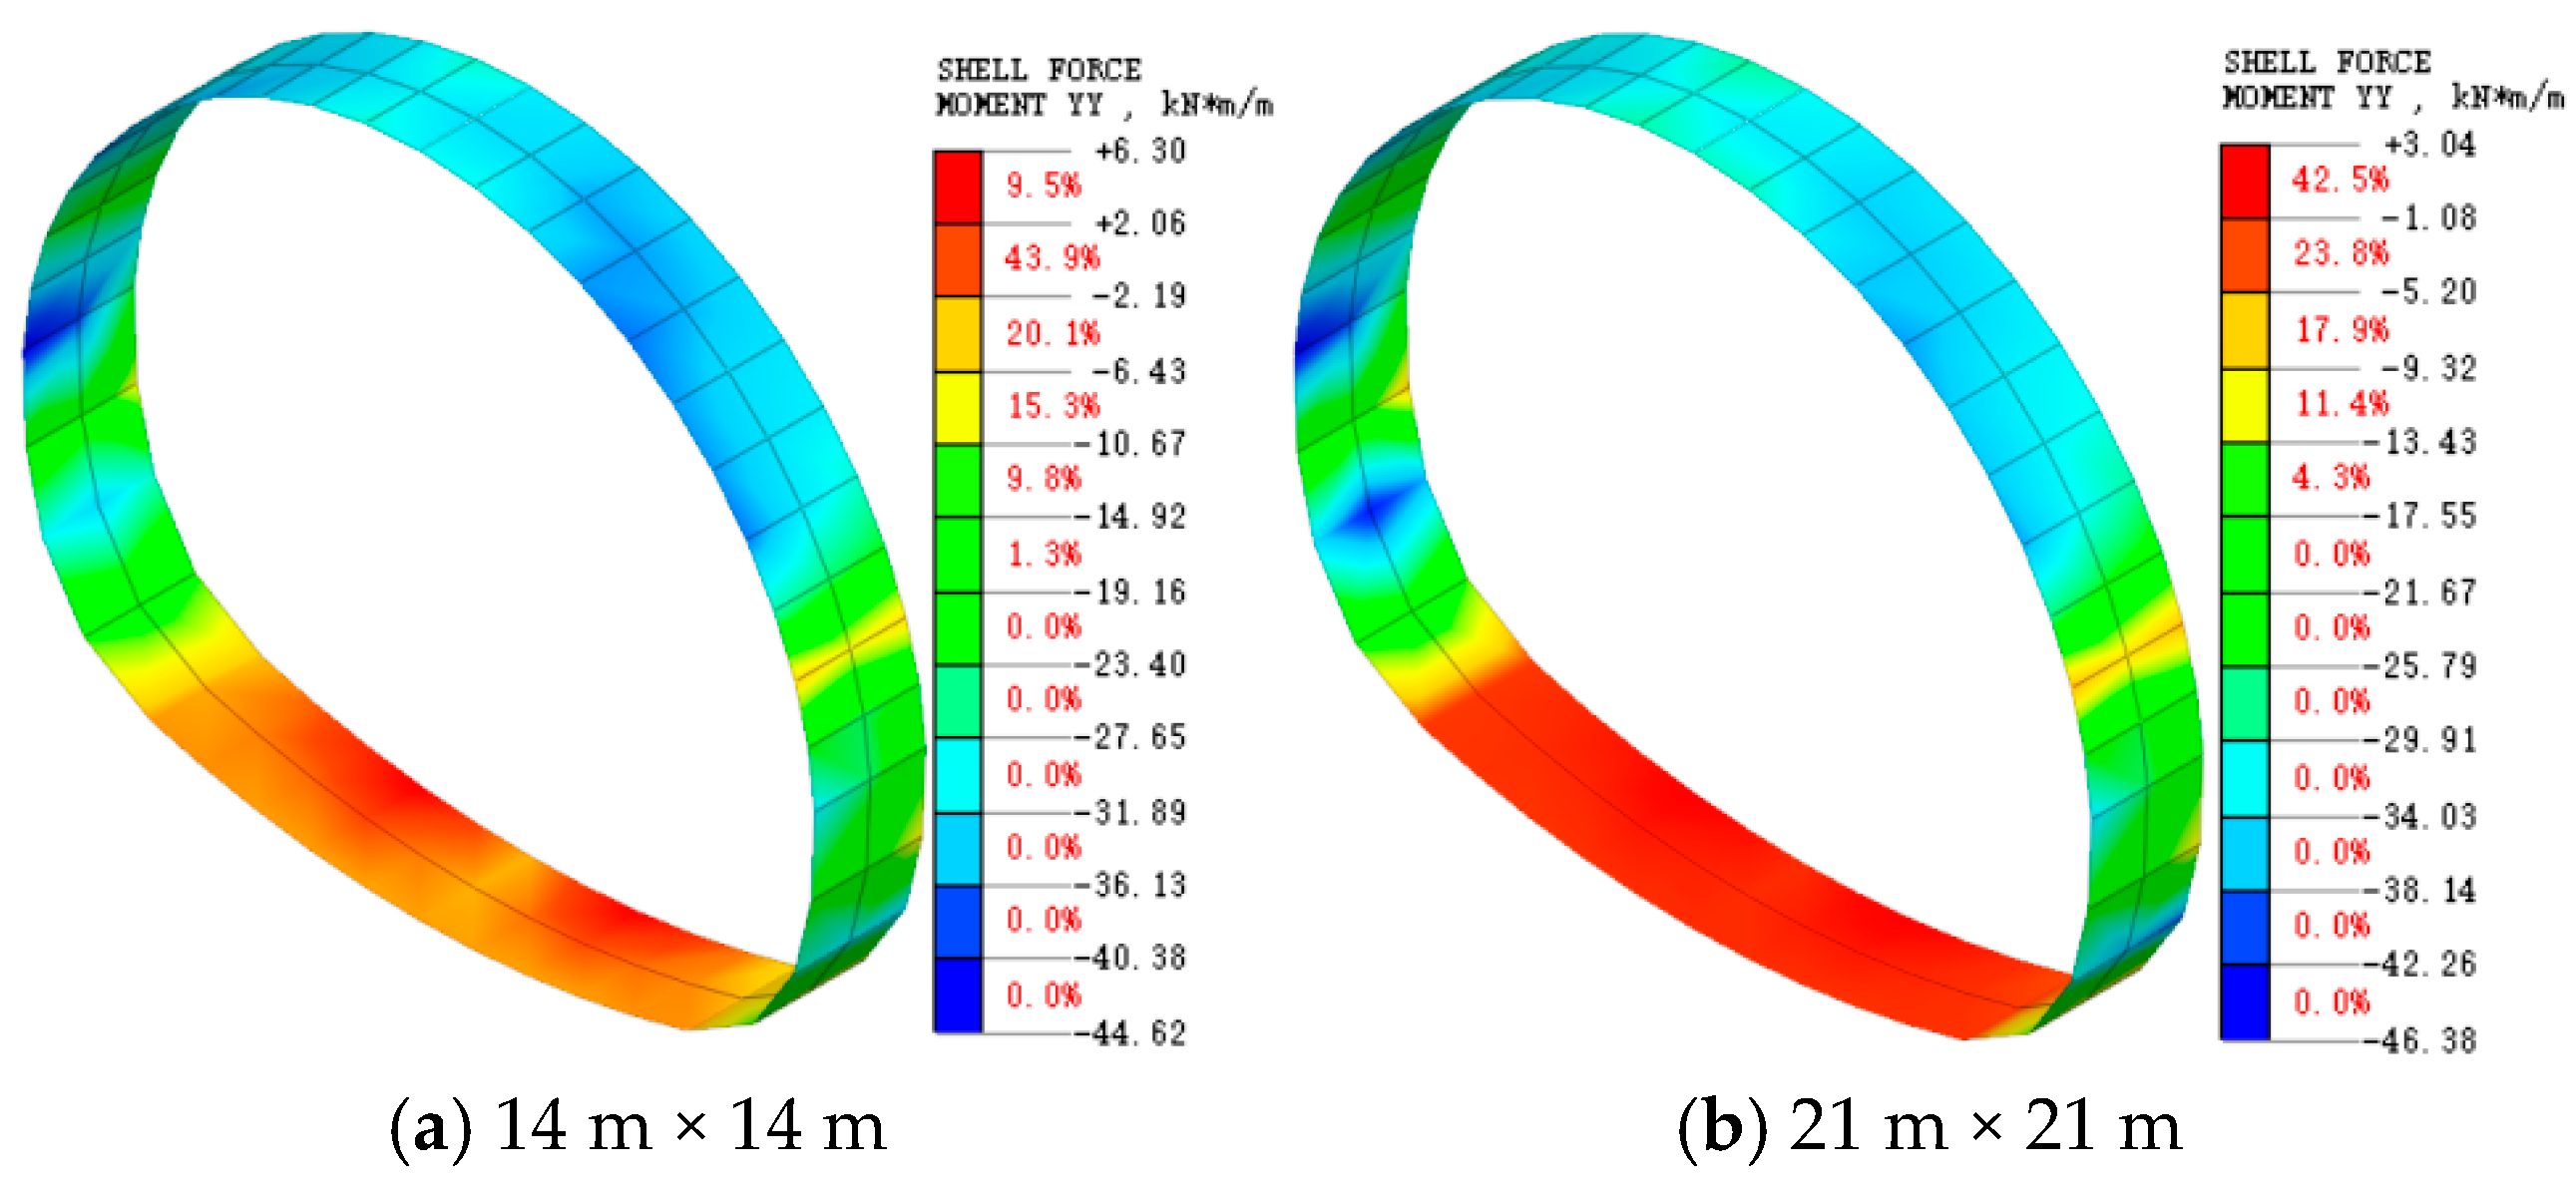
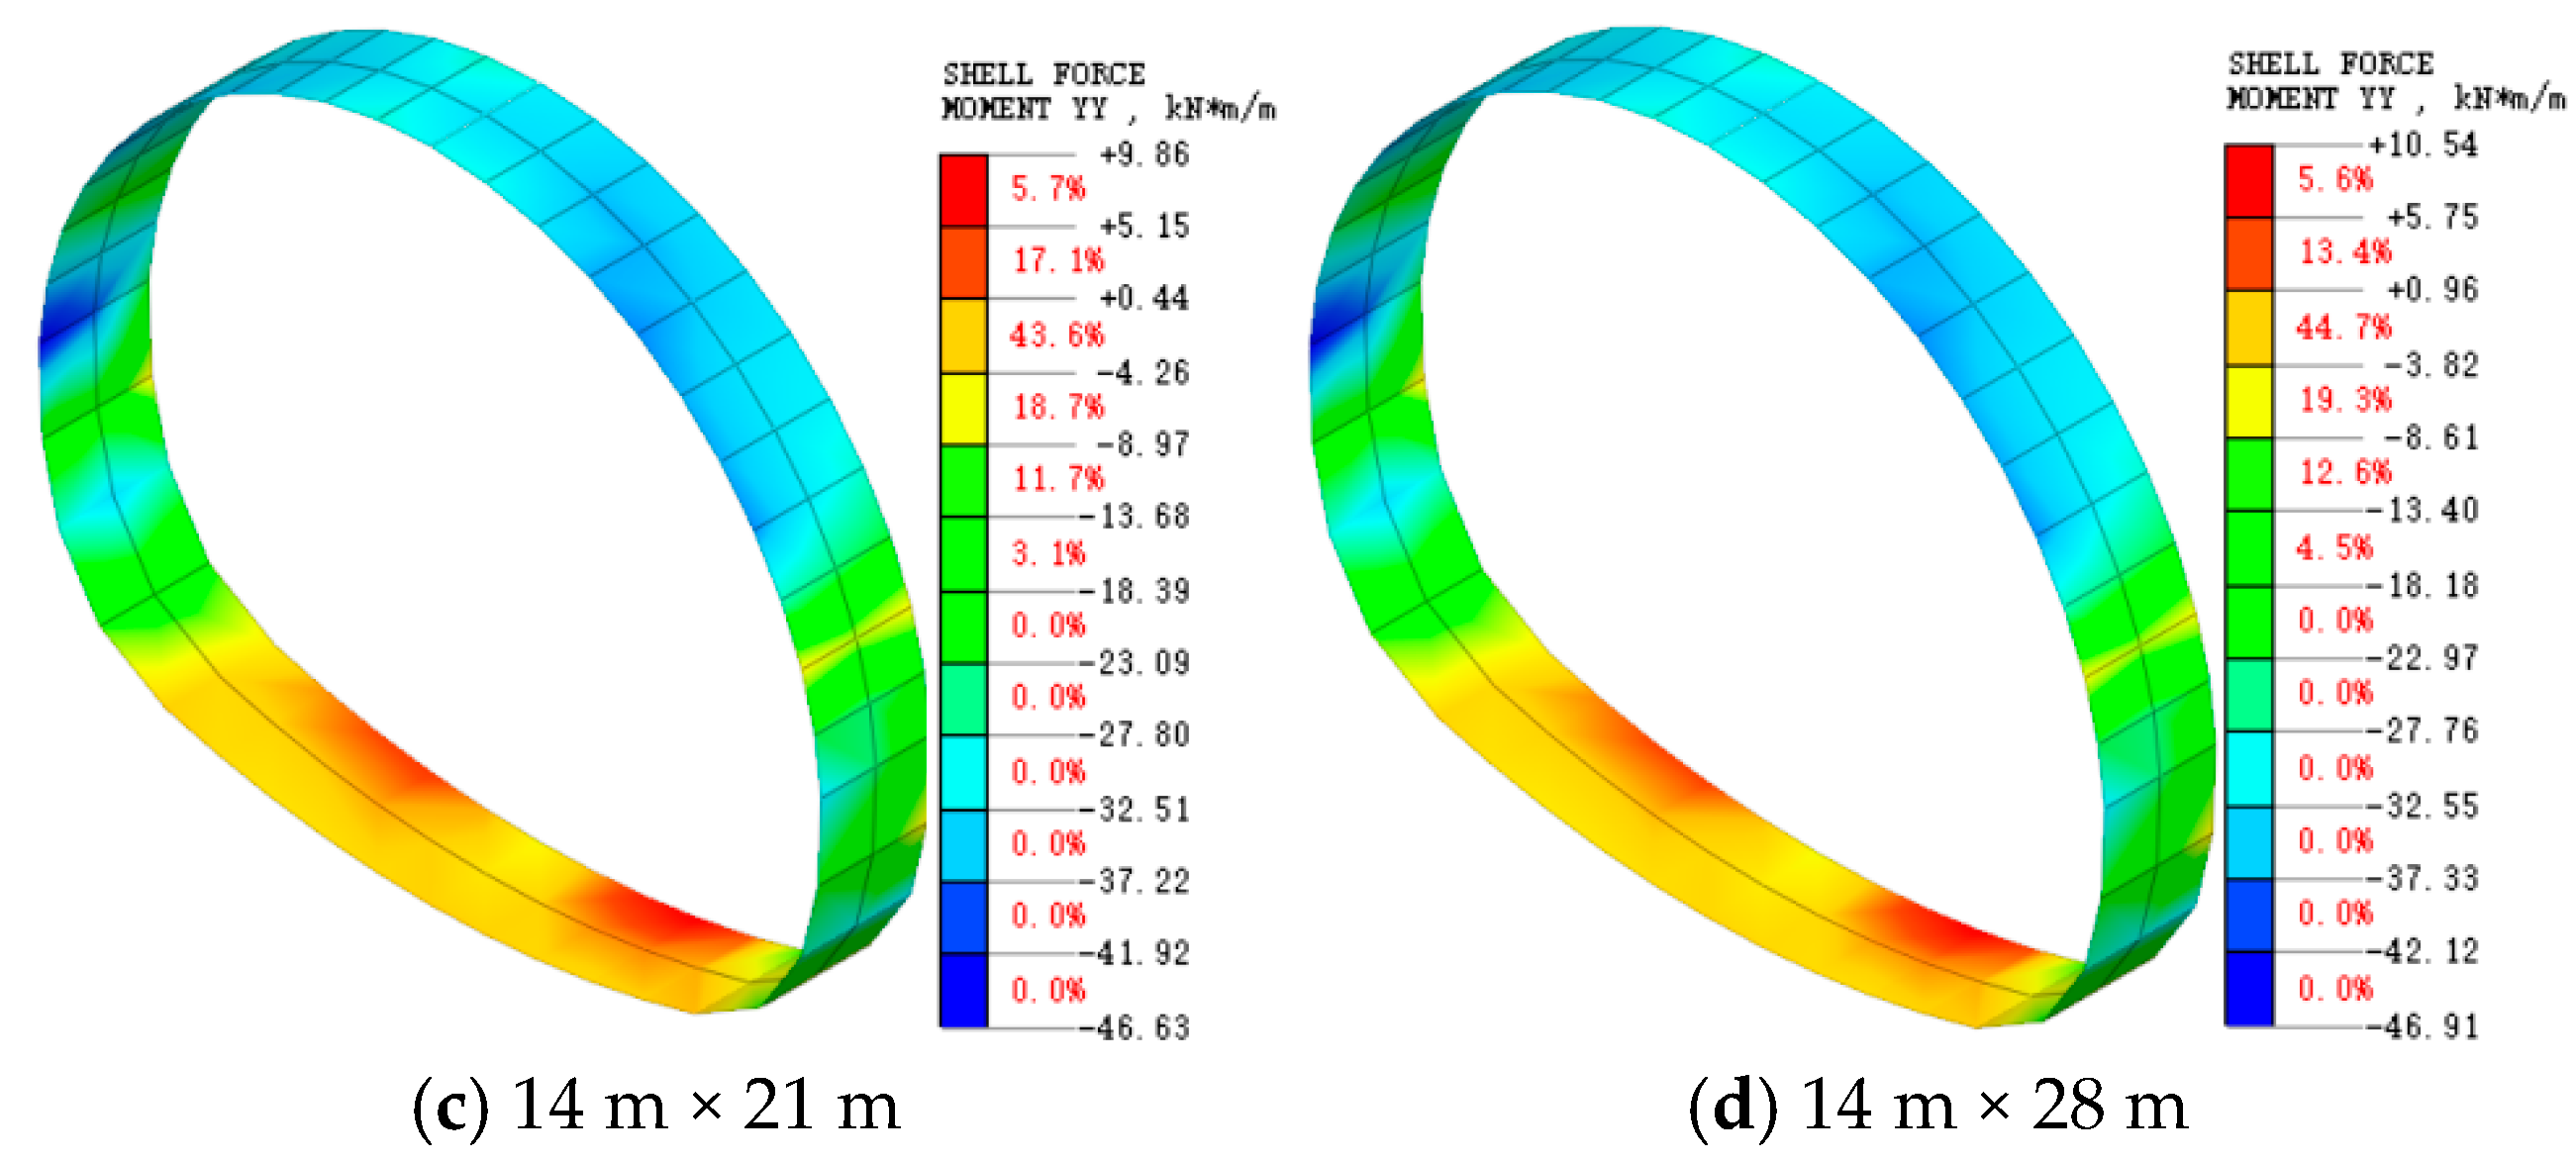
5.3. Secondary Lining Force Analysis

Figure 11 shows the stress contour diagram of the secondary lining under different lining application times. According to the data in Figure 11, under all working conditions, the maximum peak value of the principal stress occurs at the position of the tunnel arch, and the minimum peak value of the principal stress occurs at the position of the tunnel arch waist. Under the G2 and G3 conditions, the secondary lining is constructed 21 m behind the palm face of the upper step, and the maximum tensile stress and compressive stress of the secondary lining under the G3 condition are 1436.64 kPa and −1213.79 kPa, respectively. The maximum tensile stress and compressive stress of the secondary lining under the G2 condition are 1481.61 kPa and −1485.84 kPa, respectively, with increases of 3.13% and 22.41%, respectively, compared with the values under the G3 condition. Under the G1, G3, and G4 conditions, the initial support application time of the tunnel is 14 m behind the palm face of the upper step, and the maximum tensile stresses of the tunnel lining under the G1, G3, and G4 conditions are 2813.35 kPa, 1436.64 kPa, and 693.69 kPa, respectively. The maximum compressive stresses are −2636.98 kPa, −1213.79 kPa, and −660.32 kPa, respectively. Compared with those under the G1 condition, the maximum tensile stress under the G3 and G4 conditions are reduced by 48.94% and 75.34%, respectively, and the maximum compressive stress is reduced by 53.97% and 74.96%, respectively. The maximum tensile stress and compressive stress of the secondary lining increase when the timing of the secondary lining is unchanged. When the initial support time is unchanged, an early closure of the secondary lining will significantly increase the structural force; so, it is suggested that the initial support should be closed as early as possible and that the construction of the secondary lining should lag behind the palm surface of the upper step by 21 m.
From the comprehensive analysis above, it can be concluded that, with the secondary lining construction time unchanged, delaying the closure of the initial support is beneficial for the initial support to bear the bending moment and the surrounding rock stress at the arch bottom position. However, this process leads to a significant increase in the deformation of the tunnel-surrounding rock, and both the maximum tensile stress and the maximum compressive stress of the secondary lining increase significantly. When the closure time of the initial support remains unchanged, the early construction of the secondary lining is advantageous for controlling the deformation of the surrounding rock and the stress in the surrounding rock at the arch bottom position. Simultaneously, this approach helps reduce the stress on the initial support of the tunnel. However, this process leads to a significant increase in the stress of the secondary lining. Considering these factors comprehensively, it is recommended to close the initial support as early as possible, with the construction of the secondary lining delayed by 21 m behind the upper step the palm surface.

6. Site Construction Monitoring

Tunnel construction is a comprehensive process involving geology, structural engineering, and construction technology, especially under complex geological conditions such as those present in loess strata, whose deformation and settlement pose certain challenges to the surrounding environment and engineering structure. To verify the rationality of the optimized excavation footage and lining time in practical engineering applications, tunnel construction was carried out with section DK372 + 900 as the research surface and 3 m as the excavation footage. Seven controlled measuring points in the tunnel and nine surface measuring points were installed on this section (the layout of the monitoring points is shown in Figure 1) to study the deformation trend of the tunnel-surrounding rock.

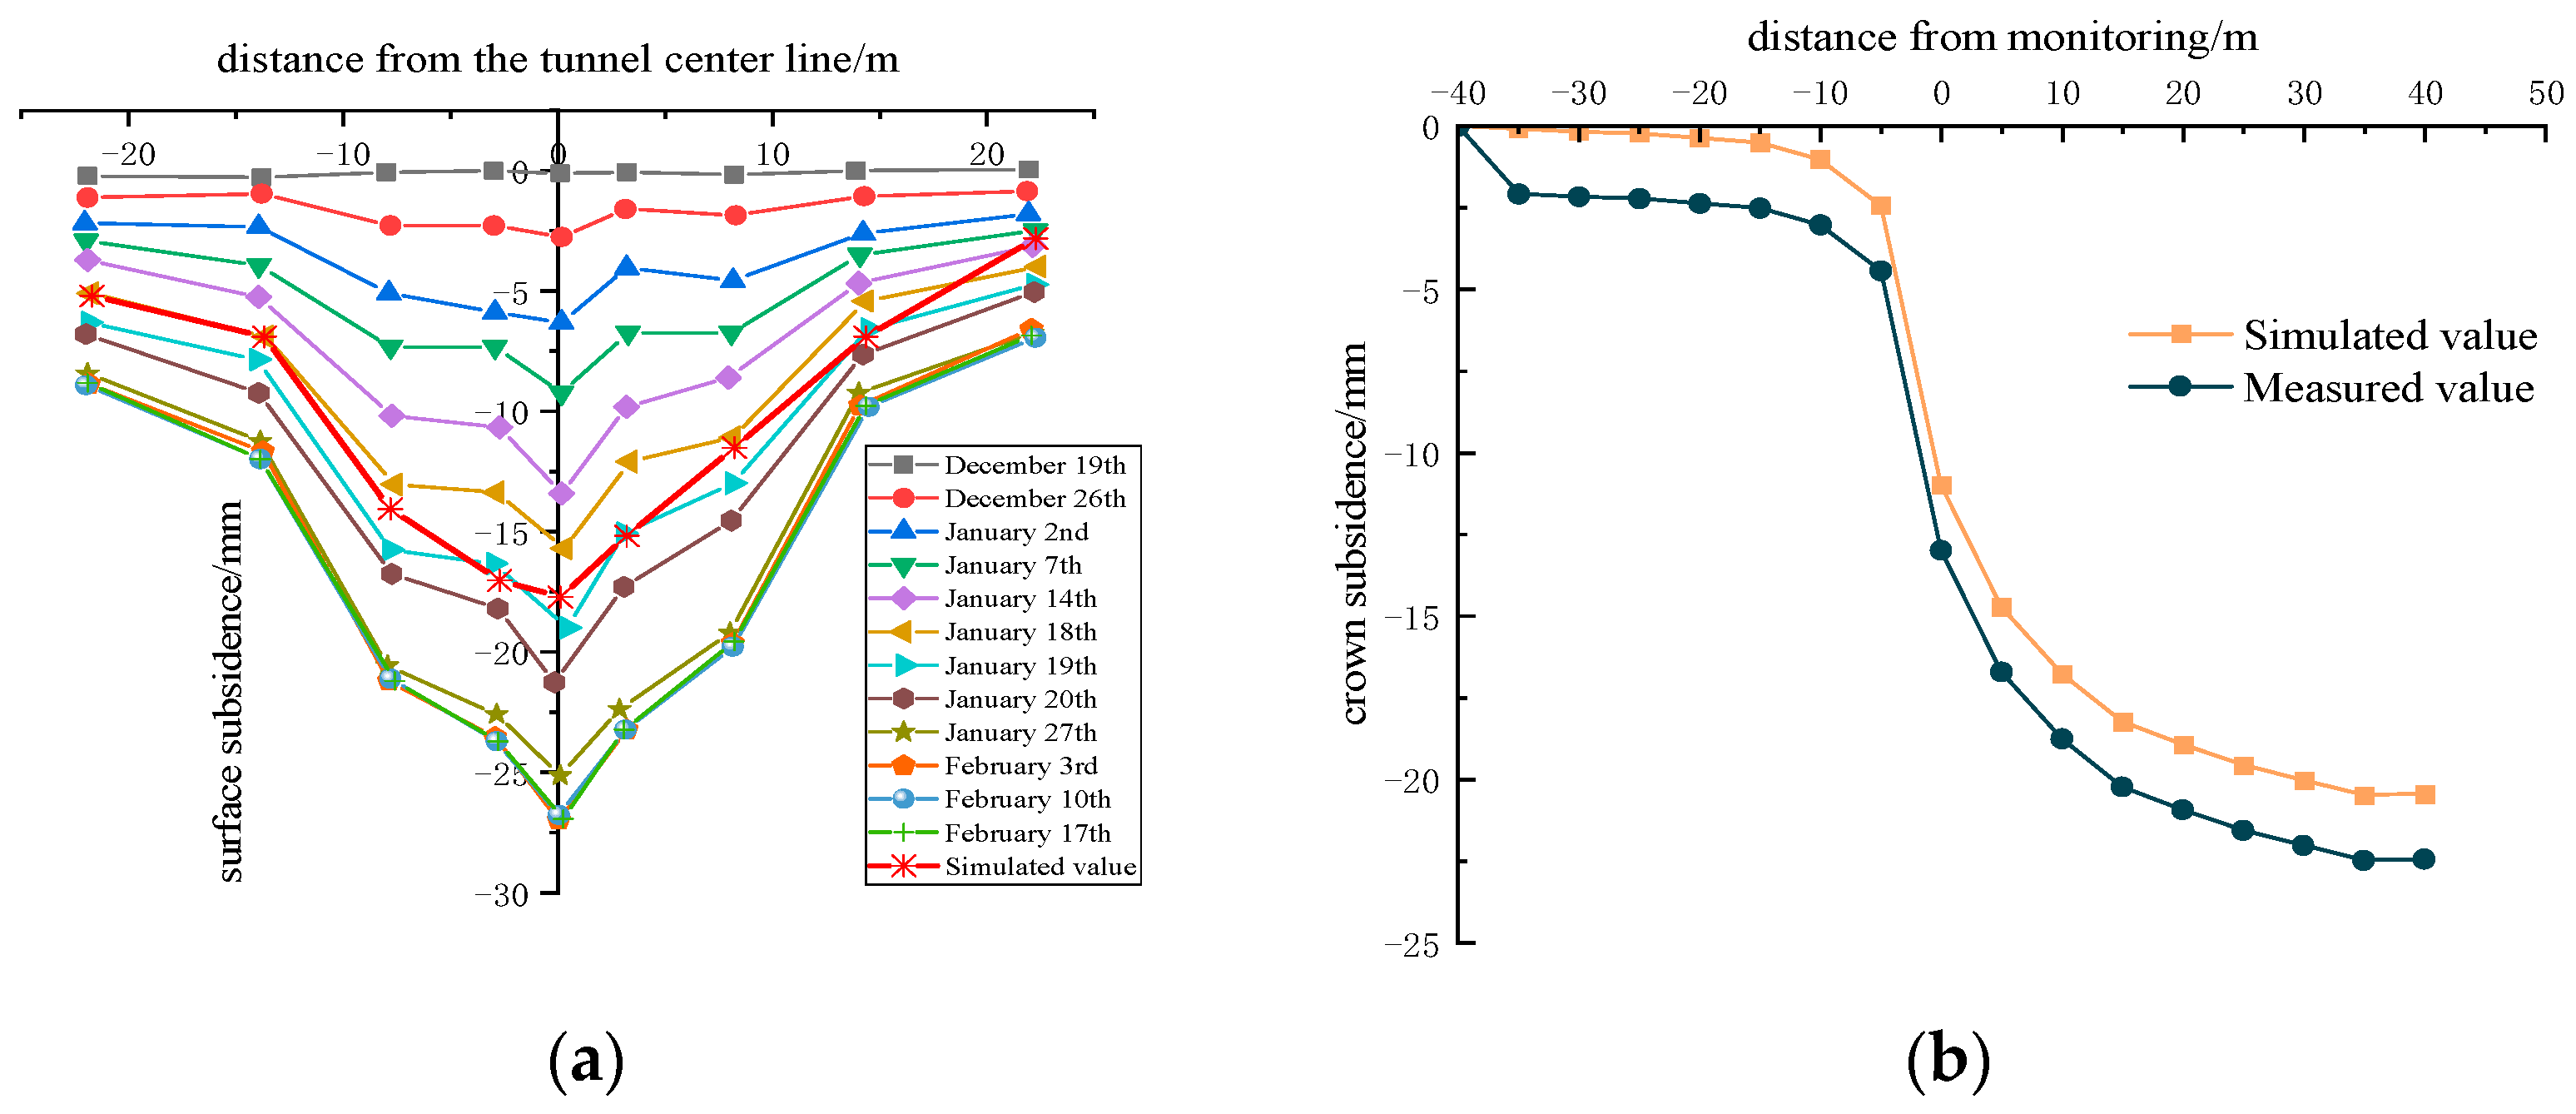
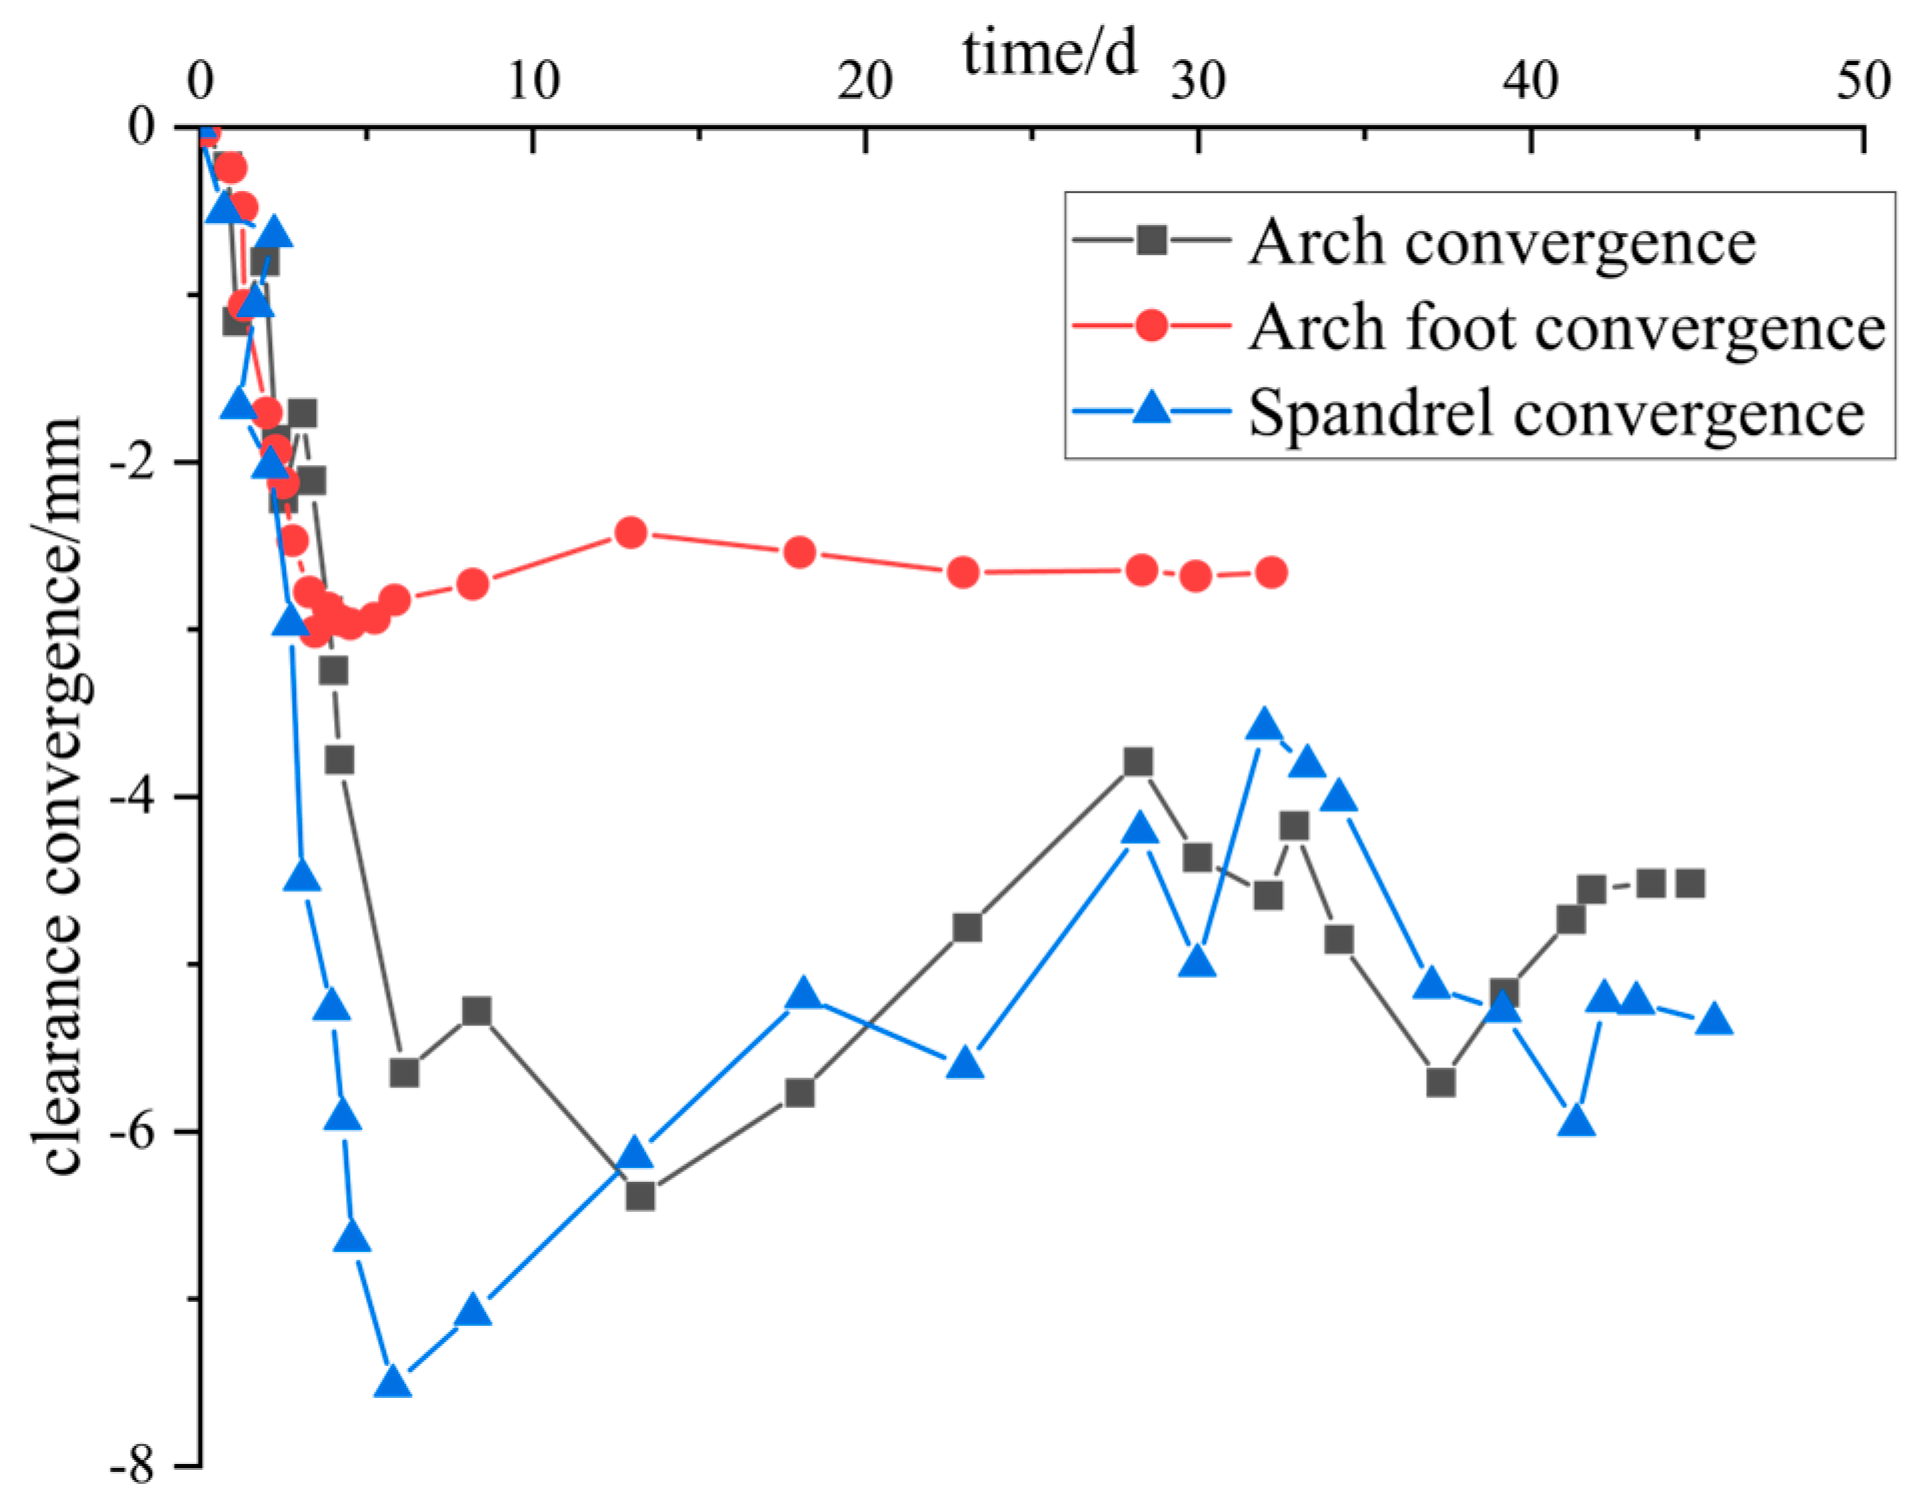
6.1. Analysis of the Monitoring Results of Surrounding Rock Deformation

Figure 12a shows the surface subsidence curves of the DK372 + 900 section at different times. The surface began to sink slowly beginning on December 19, and the settlement basically took the shape of a symmetrical funnel. On January 18, when the tunnel excavation reached the perimeter of the monitoring section, the deformation rate suddenly increased. Then, from January 18 to January 19, the daily surface subsidence was equivalent to the average settlement during the remainder of the week. Subsequently, the rate of land subsidence gradually slowed from January 20 until approximately February 10, when the surface subsidence stabilized. After the settlement of the tunnel stabilized, the left side was slightly greater than the right side, and the maximum settlement directly above the tunnel was 27.02 mm. Figure 12b shows the comparison between the simulated and the measured crown subsidence. The measured crown subsidence first increased and subsequently tended to stabilize, and the growth rate reached a peak when the palm surface was excavated to the study surface, which is consistent with the simulated value. At the initial stage of the excavation, there was a certain difference between the simulated and the measured values of crown subsidence. When the excavation was near the monitored section, the difference between the simulated and the measured values of crown subsidence gradually decreased, and with the continuous excavation of the tunnel, the difference between the simulated and the measured values of crown subsidence gradually increased. In general, the simulated values of surface subsidence and crown subsidence were close to the measured values, which verified the rationality and correctness of the simulation results. In the early and late excavation period, the monitoring point was far away from the excavation point, and the geotechnical body was assumed to be an idealized continuous isotropic medium when numerical analysis was used, which led to the gradual increase in the simulated and measured values of crown subsidence with the increase in the distance. In addition, the porosity and ground stress in the rock and soil mass, as well as the disturbance of the construction machinery to the rock and soil mass during tunnel excavation, were not considered in the numerical calculation, which increased the error of both metrics.
Figure 13 shows the change curve of clearance convergence of the DK372 + 900 section monitored on site. Figure 12 shows that as the tunnel excavation was completed, the clearance convergence of the tunnel monitoring surface increased rapidly, and the growth rates of arch waistband convergence and spandrel convergence were greater than 3 mm/d, while that of the arch foot convergence was relatively small, at only approximately 1.5 mm/d. Then, the deformation rate of the surrounding rock gradually slowed for approximately 10 days, and the deformation rate was basically less than 0.5 mm/d. Finally, 45 days after the target section of the tunnel was excavated, the deformation rate of the surrounding rock was basically zero, and the surrounding rock no longer deformed and thus had reached a stable state. The arch foot convergence of the tunnel first increased and subsequently stabilized. The spandrel convergence and waist convergence first increased and then slightly decreased until a stable state was reached. According to the code in [33], when the deformation rate of the tunnel surrounding rock was less than 5 mm/d and the cumulative deformation was less than one-third of the reserved deformation, the deformation of the surrounding rock was normal. Therefore, using 3 m as the excavation footage for tunnel construction can effectively reduce the deformation rate of the surrounding rock and ensure the safe and stable construction of tunnels.

6.2. Analysis of the Monitoring Results of Surrounding Rock Pressure

As shown in Figure 14a, after tunnel excavation, the surrounding rock pressure at each monitoring point increased sharply. Approximately 5 days after the excavation, the earth pressure at each monitoring point basically stabilized. In the stable state, the earth pressure at Point 4 reached the maximum value of 458.92 kPa. The earth pressure at Point 2 was 321.73 kPa, and that at Point 3 was 213.58 kPa, while the earth pressure at the other monitoring points was lower than 50 kPa. After stabilization, the fluctuation amplitudes of the earth pressure at Points 2 and 3 did not exceed 30 kPa, while the fluctuation amplitudes of the earth pressure at the other monitoring points remained below 10 kPa. Figure 14b shows that after the initial support of the tunnel was applied, all the other measuring points were under pressure, except for the internal force at Point 7, which is the tensile force. In particular, the pressure fluctuation at Point 2 was large, but the amplitude did not exceed ±90 kN. Over time, this fluctuation gradually decreased and became stable. Shortly after the completion of the excavation, the internal force at Point 4 experienced some fluctuations and exhibited an overall upward trend. Twenty days after the completion of the excavation, the internal force tended to stabilize and was 92.39 kN when stable. Due to the damage to the reinforcement at Point 5, there are currently no relevant data available. For Point 1, the internal force was 20 kN, with small changes, remained stable for a long time, and was 15.13 kN after 70 days. In contrast, the internal forces at Points 6 and 3 were relatively small and basically stable at 5 kN. This shows that the construction technology used for tunnel excavation was relatively effective, and the surrounding rock was relatively stable after tunnel construction. As shown in Figure 14c, 70 days after the completion of the excavation, when the tunnel force stabilized, the surrounding rock pressure on the left side of the tunnel was significantly greater than that on the right side. This was because the soil cover thickness on the left side of the overlying soil layer on the DK372 + 900 section was greater than that on the right side, resulting in the tunnel being in a state of biased pressure. Because the tunnel was in a biased pressure state, the force on the left side of the structure was greater than that on the right side.

7. Conclusions

In this paper, the finite element simulation software MIDAS GTS/NX was used to optimize the construction scheme of the three-bench seven-step excavation method, analyze the surrounding rock deformation and the lining structure stress under different construction parameters, and organize and compare the site monitoring data. The following conclusions were drawn:
(1) A reasonable excavation step footage is conducive to controlling surface subsidence, crown subsidence, and arch waist convergence and can reduce the bending moment of the supporting structure. In order to take into account the construction efficiency and safety of the tunnel, a 3 m step footage should be adopted for tunnel excavation.
(2) When the construction time of the secondary lining remains unchanged, an early closure of the initial support is advantageous for controlling the deformation of the tunnel-surrounding rock, and this closure has a relatively small impact on the structural forces. Keeping the closure time of the initial support unchanged, the earlier the construction time of the secondary lining, the more favorable it is for controlling the deformation and forces of the surrounding rock. Although this reduces the force on the initial support, it significantly increases the force on the secondary lining, leading to cracking. Therefore, when using the three-bench seven-step excavation method, it is recommended that the initial support be closed as early as possible; the construction of the secondary lining should be delayed by 21 m behind the upper step palm surface.
(3) According to the site monitoring data and simulation results, the deformation rate of the surrounding rock can be controlled within the specified range by using 3 m as the excavation footage. The field monitoring results were different from the numerical simulation results, but the change trends of the two were the same, and the difference was due to the interference of human and environmental factors during the actual construction process. The monitoring section is in a biased state due to the influence of the overlying soil layer; so, the stress monitoring of the biased position should be strengthened during construction.

Author Contributions

F.Z. conceptualized the study, F.Z., W.L. and J.W. wrote the main manuscript text, Z.S., Y.Z. and N.L. reviewed the manuscript content, Y.W. and K.X. provided the experimental data. All authors have read and agreed to the published version of the manuscript.

Funding

This study was supported by the Shaanxi Innovation Capability Support Plan—Science and Technology Innovation Team (2020TD-005), the General Project of Shaanxi Natural Science Basic Research Program (2023-JC-YB-297), the Youth Innovation Team of Shaanxi Universities (2023-2026) and the Key Laboratory Scientific Research Program Project of Shaanxi Provincial Education Department (23JS034).

Data Availability Statement

All data supporting the findings of this study are presented in this article. Any additional data can be obtained from the corresponding author upon reasonable request.

Conflicts of Interest

The authors declare no conflict of interest.

References

  1. Song, Z.; Liu, Y.; Zhang, Y. Research and prospect of demarcation of deep and shallow buried in loess tunnel. Hazard Comtrol Tunn. Undergr. Eng. 2021, 3, 1–15. [Google Scholar] [CrossRef]
  2. Zhao, Y.; Bai, M.; Ma, X.; Xie, J.; Mi, W. Application research on the surface grouting in shallow buried loess tunnel with large section. J. Railw. Eng. Soc. 2019, 36, 48–51+99. [Google Scholar]
  3. Zhang, Y.; Zhang, Z.; Hu, W.; Zhang, Y.; Shi, G.; Wang, Y. Shear Strength of Loess in the Yili Region and Corresponding Degradation Mechanisms under Different Cycling Modes. Water 2023, 15, 3382. [Google Scholar] [CrossRef]
  4. Ma, J.; Qiu, Y.; Gao, Y.; An, Y.; Duan, Z.; Li, S. Effects of Sample Preparation Methods on Permeability and Microstructure of Remolded Loess. Water 2023, 15, 3469. [Google Scholar] [CrossRef]
  5. Zhang, T.; Zhang, Z.; Xu, C.; Hao, R.; Lv, Q.; Jia, J.; Liang, S.; Zhu, H. Destabilization Mechanism of Rainfall-Induced Loess Landslides in the Kara Haisu Gully, Xinyuan County, Ili River Valley, China: Physical Simulation. Water 2023, 15, 3775. [Google Scholar] [CrossRef]
  6. Wang, B.; Wang, J.; Wang, W.; Mi, W. Research on the instability mechanism of tunnel face of shallow buried and large section tunnel in loess tableland. J. Railw. Eng. Soc. 2020, 37, 67–72. [Google Scholar]
  7. Song, Z.; Wu, Y.; Zhou, G.; Pan, H.; Xiao, K. Statistical constitutive model of loess damage and its application in tunnel stability analysis. Chin. J. Undergr. Space Eng. 2023, 19, 640–649. [Google Scholar]
  8. Tong, J. General formulas for calculating surrounding rock pressure of tunnels and underground spaces. KSCE J. Civ. Eng. 2020, 24, 1348–1356. [Google Scholar] [CrossRef]
  9. Xue, Y.; Zhang, X.; Li, S.; Qiu, D.; Su, M.; Xu, Z.; Zhou, B.; Xia, T. Sensitivity analysis of loess stability to physical and mechanical properties: Assessment model. Int. J. Geomech. 2019, 19, 06019012. [Google Scholar] [CrossRef]
  10. Wang, B.; Ye, F.; Guo, H.; Ji, Y.; Lei, P. Research on the mechanical properties of surrounding rock of deep shield tunnel in structural loess. Chin. J. Undergr. Space Eng. 2022, 18, 751–758. [Google Scholar]
  11. Lee, I.M.; Nam, S.W. The study of seepage forces acting on the tunnel lining and tunnel face in shallow tunnels. Tunn. Undergr. Space Technol. 2001, 16, 31–40. [Google Scholar] [CrossRef]
  12. Song, Z.; Wang, S.; Su, C.; Pan, H.; Wei, S. Optimization of construction scheme for shallow buried tunnel with small spacing asymmetric section in loess stratum. J. Xi’an Univ. Archit. Technol. 2022, 54, 646–656. [Google Scholar] [CrossRef]
  13. Yuan, L.; He, W. Study on the application of double-side heading method in the construction of shallow and large section loess tunnel. Chin. J. Undergr. Space Eng. 2022, 18, 289–295. [Google Scholar]
  14. Hu, S.; Zhang, D. DEM analysis of failure modes of surrounding rock for large-section loess tunnel. J. Beijing Jiaotong Univ. 2013, 37, 13–18. [Google Scholar]
  15. Lan, H.; Gao, Y.; Li, H. Analysis of settlement deformation of complex geological tunnel construction. Highw. Eng. 2021, 46, 142–148. [Google Scholar] [CrossRef]
  16. Thomas, K.; Gunther, M. A numerical study of the effect of soil and grout material properties and cover depth in shield tunneling. Comput. Geotech. 2006, 33, 234–247. [Google Scholar] [CrossRef]
  17. Zhu, T.; Liu, Y. Evaluating construction parameters of HB and CD methods for super large section tunnel: A case study. Sci. Rep. 2023, 13, 15812. [Google Scholar] [CrossRef] [PubMed]
  18. Li, Z.; Ding, C.; Dou, S.; Wu, X.; Shu, J. Analysis on deformation characteristics of surrounding rock in large section shallow loess tunnels. Chin. J. Undergr. Space Eng. 2014, 10, 1623–1628. [Google Scholar]
  19. Liu, Q.; Li, Y.; Li, W.; Zhao, J.; Qin, Z.; Yang, X.; Feng, Q.; Jiang, B.; Wang, K.; Li, Y. Primary support optimization of large-span and shallow buried hard rock tunnels based on the active support concept. Sci. Rep. 2022, 12, 7918. [Google Scholar] [CrossRef]
  20. Xue, Y.; Ma, X.; Yang, W.; Ma, L.; Qiu, D.; Li, Z.; Li, X.; Zhou, B. Total deformation prediction of the typical loess tunnels. Bull. Eng. Geol. Environ. 2020, 79, 3621–3634. [Google Scholar] [CrossRef]
  21. Yang, J.; Yu, Y.; Tan, Z.; Zhao, H. Experimental research on the surrounding rock pressure of large sectional loess tunnel under deep and shallow submersion. J. Railw. Eng. Soc. 2009, 2, 76–79. [Google Scholar] [CrossRef]
  22. Cui, G.; Ma, J.; Wang, D. A large 3D laboratory test on the deformation characteristic of shallow loess tunnel under different plastic states. Bull. Eng. Geol. Environ. 2021, 80, 7577–7590. [Google Scholar] [CrossRef]
  23. Tan, Z.; Yu, Y.; Wang, M.; Yang, J. Experimental study on bolt effect on large section shallow depth loess tunnels. Rock Soil Mech. 2008, 29, 491–495+506. [Google Scholar] [CrossRef]
  24. Liu, Y.; Lai, H. Experimental study on lining cracking of shallow buried loess tunnel under the simulation of effect of slide surface immersion. Appl. Sci. 2020, 10, 6080. [Google Scholar] [CrossRef]
  25. Shinichiro, I.; Toshiyuki, H.; Kenji, M. Settlement trough above a model shield observed in a centrifuge. In Proceedings of the International Conference Centrifuge, Tokyo, Japan, 23–25 September 1998; Volume 9, pp. 23–25. [Google Scholar]
  26. Xue, X.; Su, Z.; Sun, Z.; Song, F. Analysis of the tunnel disease considering the unsaturated loess matric suction effects. Adv. Mater. Res. 2014, 859, 182–185. [Google Scholar] [CrossRef]
  27. Chen, P.; Wang, W.; Wu, Z.; Yuan, Q.; Jiang, H.; Zhai, S. Study on deformation characteristics and control measures of shallow large-span loess tunnels. Mod. Tunn. Technol. 2021, 58, 203–211. [Google Scholar] [CrossRef]
  28. Zhang, Z. Analysis of the influence of different advanced support of shallow railway tunnel with large-section in loess area. Munic. Eng. Technol. 2023, 41, 176–181. [Google Scholar] [CrossRef]
  29. Luo, Y.; Wu, Y.; Chen, J.; Dong, F.; Liu, W.; Chen, L.; Li, Y.; Shi, Z. Back-calculation method of rock mass pressure in a shallow-buried super large-span tunnel using upper-bench CD method. KSCE J. Civ. Eng. 2022, 26, 433–447. [Google Scholar] [CrossRef]
  30. Sun, W.; Liang, Q.; Qin, S.; Yuan, Y.; Zhang, T. Evaluation of groundwater effects on tunnel engineering in loess. Bull. Eng. Geol. Environ. 2021, 80, 1947–1962. [Google Scholar] [CrossRef]
  31. Li, Q.; Su, Z. Analysis of difference in axial force of anchor in shallow-buried loess tunnel with large cross-section. Appl. Mech. Mater. 2012, 204, 1343–1346. [Google Scholar] [CrossRef]
  32. Luo, Y.; Chen, J.; Gao, S.; Deng, X.; Diao, P. Stability analysis of super-large-section tunnel in loess ground considering water infiltration caused by irrigation. Environ. Earth Sci. 2017, 76, 763. [Google Scholar] [CrossRef]
  33. TB 10121-2007; Technical Specification for Monitoring Measurement of Railway Tunnel. China Railway Publishing House: Beijing, China, 2007.
Figure 1. Tunnel model and monitoring point layout.
Water 16 02192 g001
Figure 2. Construction process of three-bench seven-step excavation method.
Water 16 02192 g002
Figure 3. The tunnel at different excavation footages.
Water 16 02192 g003
Figure 4. Changes in crown subsidence.
Water 16 02192 g004
Figure 5. Arch waist convergence change curve.
Water 16 02192 g005
Figure 6. Surface subsidence and stress diagram.
Water 16 02192 g006
Figure 7. Bending moment of the initial support under different excavation footages.
Water 16 02192 g007
Figure 8. Change curve of crown subsidence and arch waist convergence under different lining time conditions.
Water 16 02192 g008
Figure 9. Final surface subsidence results.
Water 16 02192 g009
Figure 10. Initial supporting moments under different lining application times.
Water 16 02192 g010aWater 16 02192 g010b
Figure 11. Stress contour diagrams of the secondary lining.
Water 16 02192 g011aWater 16 02192 g011b
Figure 12. Site surface settlement and crown subsidence monitoring curves. (a) The measured and simulated values of site surface subsidence. (b) The simulated and measured values of crown subsidence.
Water 16 02192 g012
Figure 13. Clearance convergence curves.
Water 16 02192 g013
Figure 14. Earth pressure automatic monitoring results.
Water 16 02192 g014
Table 1. Material physical and mechanical parameters and element types.
Name of the MaterialGravity/(kN/m3)Elastic Modulus/kPaPoisson’s RatioAngle of Internal Friction/°Cohesive Force/kPaUnloading Elastic Modulus/kPa
Clay loess18.403.50 × 1040.4433.1035.301.60 × 105
Silt18.802.00 × 1040.2332.003.001.00 × 105
Silty loess17.503.00 × 1040.3024.0025.002.00 × 105
Sandstone25.401.93 × 1080.2527.8027,200.005.00 × 108
Pipe roof4.151.06 × 1080.30---
Initial support25.943.29 × 1080.21---
Temporary support27.543.70 × 1080.21---
Secondary lining24.833.36 × 1080.21---
Advanced small pipe0.421.06 × 1060.30---
Table 2. Final values of arch waist convergence and crown subsidence deformation under different lining time conditions.
Lining TimeFinal Arch Waist Convergence Deformation
(SL03-04)/mm
Final Crown Subsidence/Convergence Deformation (GD00)/mm
14 m × 14 m−3.19−18.29
21 m × 21 m−4.30−19.34
14 m × 21 m−3.62−18.67
14 m × 28 m−3.62−18.70
Disclaimer/Publisher’s Note: The statements, opinions and data contained in all publications are solely those of the individual author(s) and contributor(s) and not of MDPI and/or the editor(s). MDPI and/or the editor(s) disclaim responsibility for any injury to people or property resulting from any ideas, methods, instructions or products referred to in the content.

