Abstract
This study integrated rule-based control (RBC) and permeable pavements to assess the combined effectiveness in reducing the combined sewer overflow (CSO) and energy consumption of the urban drainage system (UDS). Non-dominated sorting was employed to identify the optimal RBC preset parameters under varying rainfall intensities and permeable pavement installation proportion. Cost-effectiveness was calculated for different RBC parameters and permeable pavement installation scenarios. The contribution of installing permeable pavements in each sub-catchment to the cost-effectiveness was quantified using frequency statistics. The combined effectiveness of the RBC and LID achieved maximum reduction rates of 51.12% to 72.46% in the CSO volume and 14.75% to 33.89% in energy consumption across return periods from 2-year to 20-year. The key findings were as follows: (1) Optimization of the RBC preset parameters can reduce the CSO volume and energy consumption, but the effectiveness is limited by the capacity of the UDS. (2) In the UDS, the permeable pavement installation area and return periods of design rainfall significantly impact the optimization of RBC. (3) The impact of the RBC parameters on the cost-effectiveness of installing permeable pavements in each sub-catchment is minimal. (4) The cost-effectiveness of installing permeable pavement varies across different sub-catchments.
1. Introduction
Climate change and urbanization have increased the challenges faced by urban drainage systems (UDSs) [1,2,3,4,5]. During heavy rainfall events, the stormwater entering the UDS leads to the total quantity surpassing the capacity of the UDS, resulting in CSO occurrence. Untreated wastewater directly discharged into receiving water bodies can cause environmental pollution and public health risks [6,7,8,9,10]. Various strategies have been adopted to address CSO issues. One approach is to expand or reconstruct the UDS. However, this method requires substantial investment and time. Another approach is the implementation of real-time control (RTC). RTC strategies can adaptively manage UDS operations based on the real-time status, effectively reducing the CSO volume [11]. Distinguished from the two aforementioned approaches that emphasize improving the storage and conveyance capacity of the UDS, low-impact development (LID) focuses on reducing stormwater runoff at its source, thereby alleviating pressure on the UDS [12,13,14].
RTC strategies, by dynamically adjusting the actions of pumps and gates based on the real-time dynamics of the UDS, have emerged as an effective method to alleviate the CSO [15,16]. One of the most straightforward and widely used RTC strategies is rule-based control (RBC), which adjusts the actions of pumps and gates based on predefined rules [17,18]. To optimize the effectiveness of an RBC strategy, the control parameters must be carefully determined according to optimization objectives rather than expert experiences. The RBC, depending on the actual operation of the UDS, may be single-objective or multi-objective. Minimizing the CSO volume is one of the most common optimization objectives of RBC. Furthermore, pump stations in the UDS play a crucial role in managing stormwater and wastewater, and their energy consumption significantly increases the overall operating costs [19]. Optimizing pump operations to minimize energy consumption while effectively managing the CSO is necessary.
LID practices, particularly infiltration-type LID, can absorb and infiltrate stormwater runoff, reducing the volume entering the UDS [20]. Permeable pavement is one of the most widely applied infiltration-type LID measures. By capturing and infiltrating stormwater runoff, permeable pavement can significantly reduce the volume entering the UDS, helping alleviate the burden during heavy rainfall and reducing the risk of CSO [21,22,23]. Therefore, the cost of permeable pavements must be balanced against the effectiveness they provide in reducing stormwater runoff and improving the drainage performance. Thus, economic analysis should be conducted to evaluate the cost-effectiveness of implementing permeable pavement in different locations of the UDS [24,25,26]. This analysis can help guide decisions regarding the optimal location and design of permeable pavements, ensuring their implementation in a way that maximizes the benefits while minimizing the costs.
Presented studies focus on the separate application of RTC or LID to enhance the UDS performance [27,28,29]. However, there is insufficient study on the mutual impact between RTC and LID when they are applied integrally in the UDS. RTC can alter the dynamics of the UDS, while LID measures reduce the amount of stormwater entering the UDS, both of which increase the uncertainty of the UDS [15,30]. The energy consumption of RTC is an important component of its cost and is mainly influenced by the operational dynamics of the UDS. Therefore, further research is needed on the variations in RTC energy consumption under the comprehensive implementation of RTC and LID. Additionally, quantitative analytical methods for assessing the contribution of LID installations in different locations to cost-effectiveness are still lacking.
In this study, we focus on the integrated application of RBC and permeable pavements to improve the UDS performance. SWMM was selected for the UDS simulation because it is an open-source rainfall-runoff model that supports secondary development and can incorporate permeable pavement and RBC strategies [31,32,33,34]. The main objectives of this study are as follows: to optimize the RBC parameters to minimize the CSO volume and pump energy consumption in the UDS; to assess the mutual influence between the RBC strategy and the permeable pavement installation; and to evaluate the contribution of installing permeable pavement within different sub-catchments to the cost-effectiveness. Addressing the objectives, we utilized a non-dominated sorting approach to determine the optimal RBC parameters under various proportions of permeable pavement installation, aiming to simultaneously minimize the CSO volume and pump energy consumption. We explored the cost-effectiveness of permeable pavement in reducing the CSO volume and pump energy consumption with RBC with different preset parameters. Additionally, using frequency statistics, we assessed how installing permeable pavement contributes to enhancing the overall cost-effectiveness across various sub-catchments.
2. Materials and Methods
2.1. Study Area
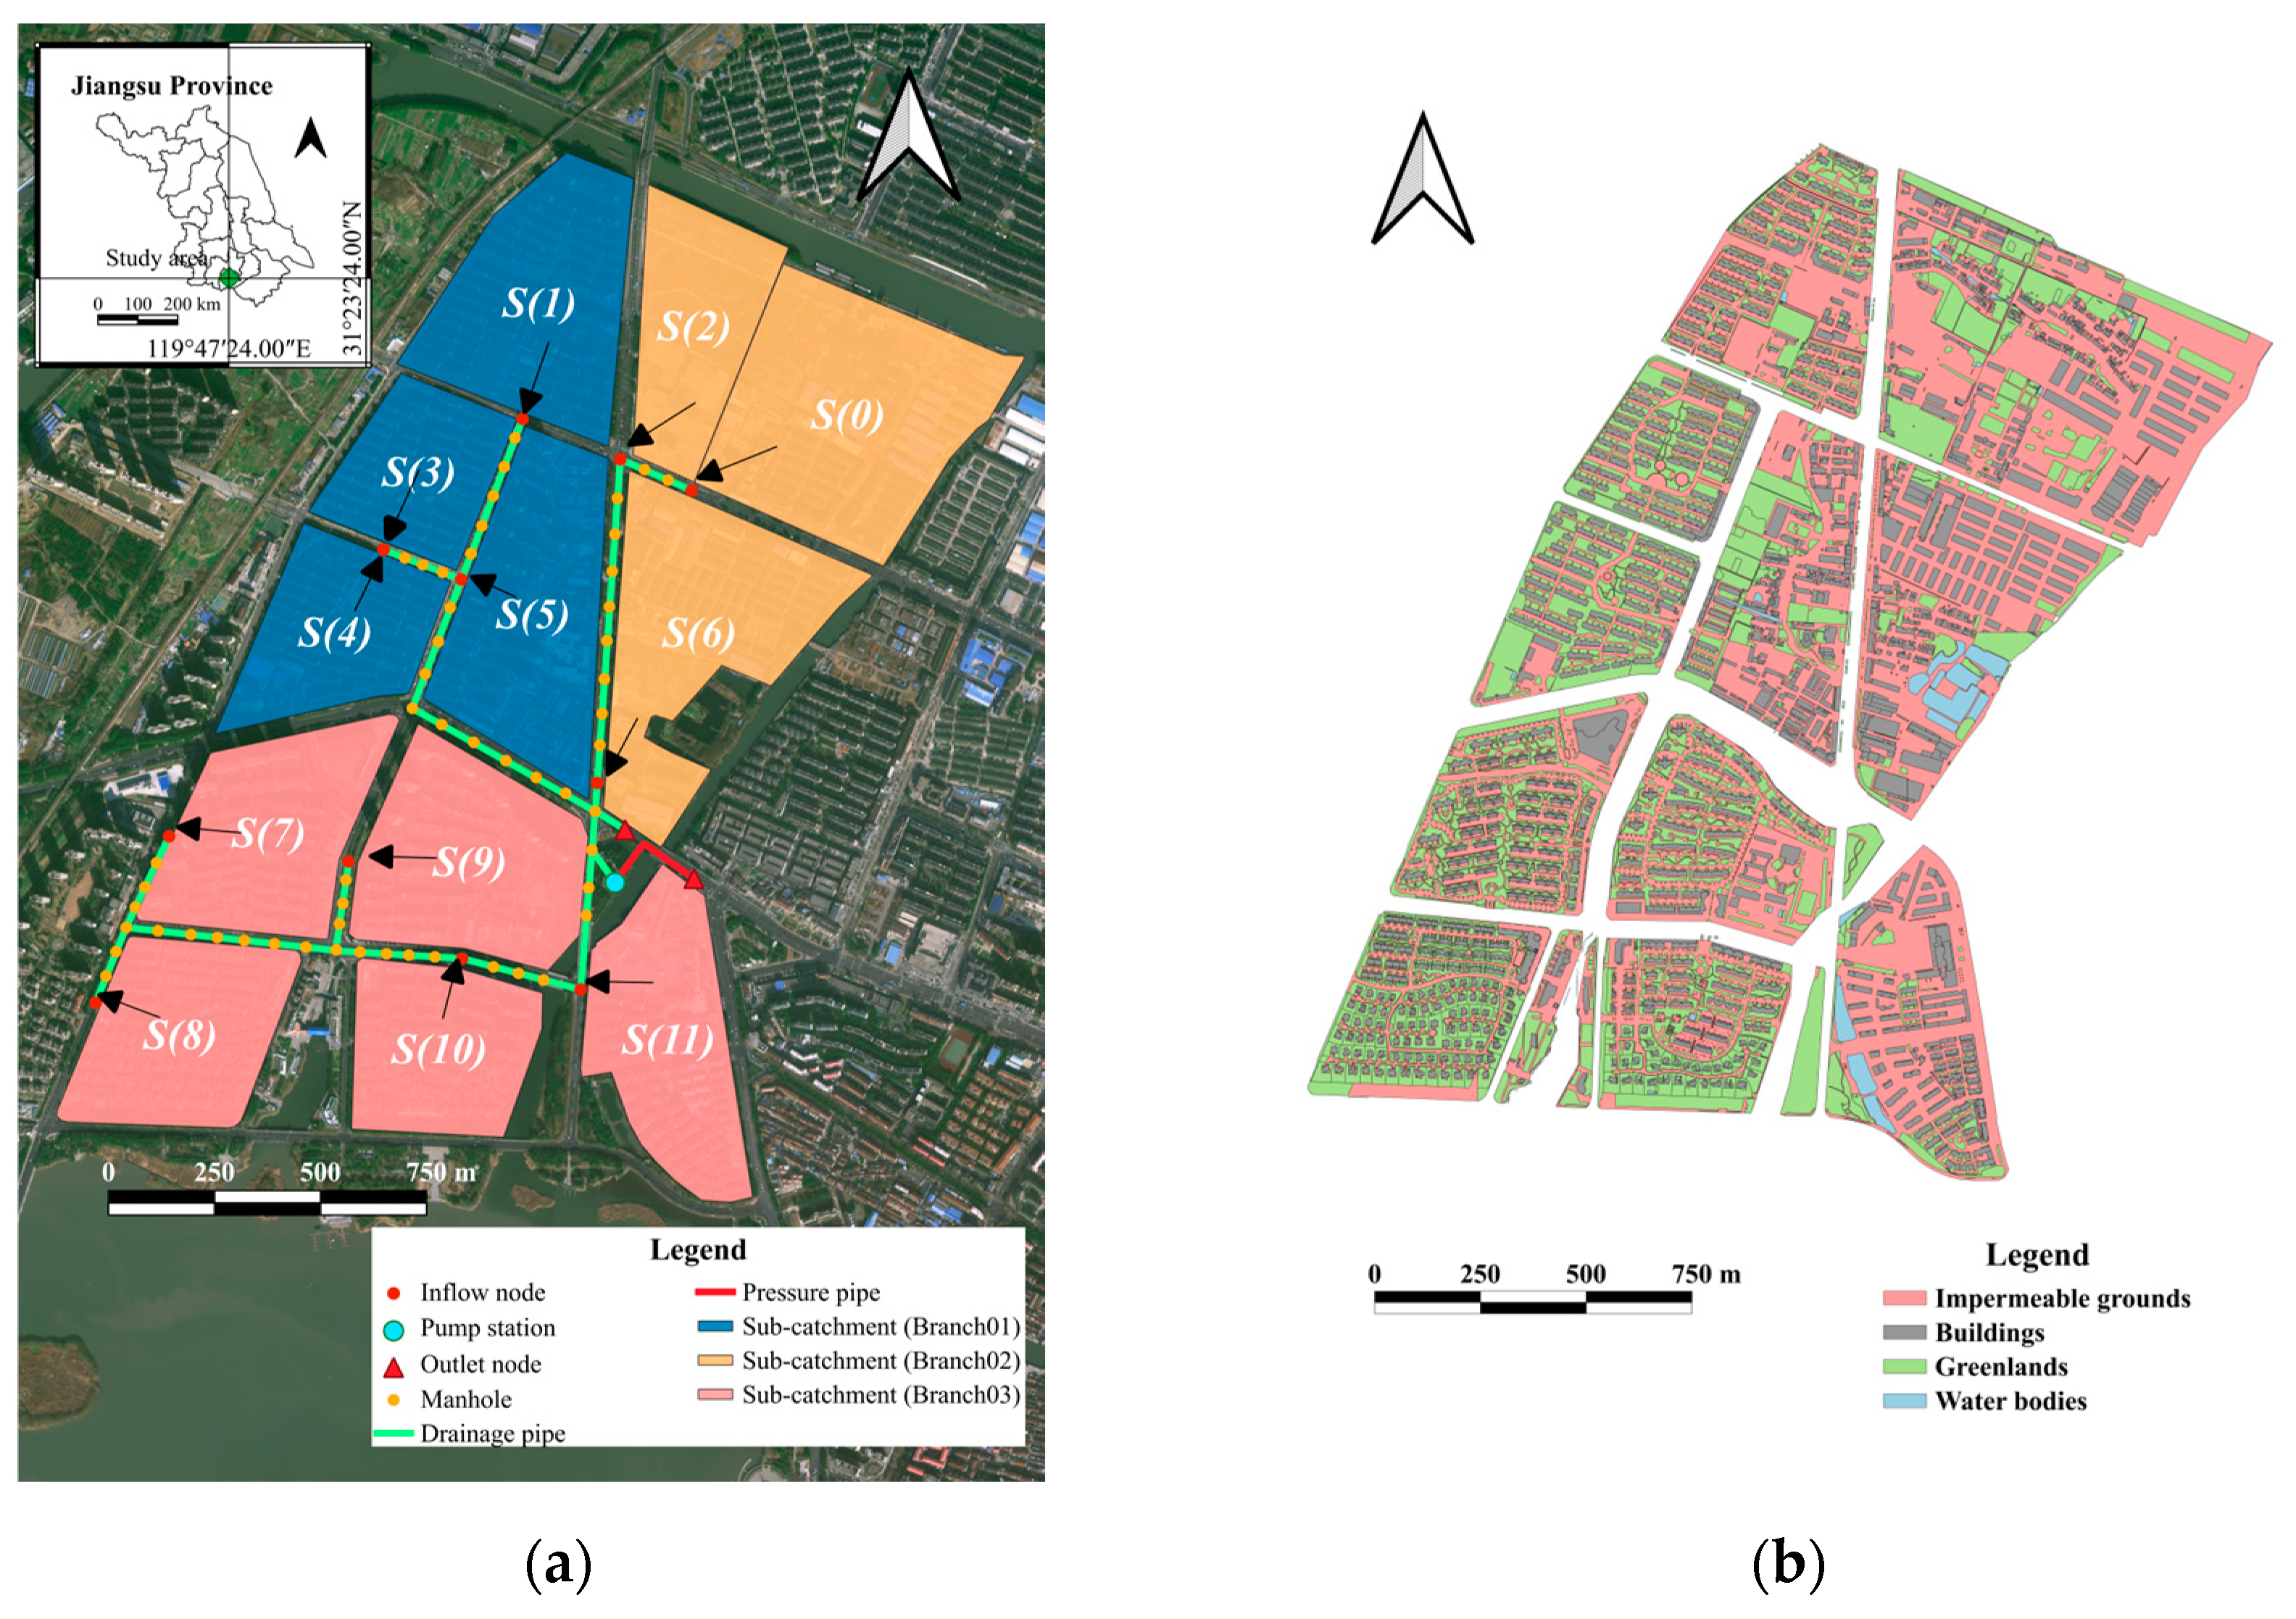
The research area, as illustrated in Figure 1, spans 2.76 km2 in Yixing of Wuxi City, China. This region, strategically positioned in the densely urbanized Yangtze River Delta, is characterized by its significant importance. The study area is located by the side of Taihu Lake. Taihu Lake covers an expansive area of 2425 km2 and averages a depth of 1.90 m. Yixing has a subtropical monsoon climate, with most rainfall occurring during the flooding season. This climatic pattern results in the direct release of various contaminants into the environment via CSO during the flooding season, thereby intensifying eutrophication concerns within Taihu Lake. In efforts to protect the water environment, LID strategies have been implemented to reduce the CSO volume. Moreover, the pump stations within the UDS have been automated to improve the operational efficiency, paving the way for the adoption of RTC systems.

Figure 1.
Study area: (a) the UDS; (b) land use.
The network of the UDS comprises three branch pipes (including Branch01, Branch02, and Branch03), which collect wastewater that ultimately flows into the pump station’s reservoir. From there, the water is pumped into the subsequent network. The study area is predominantly residential, housing approximately 30,000 residents. The UDS in this area is primarily composed of combined sewer systems, with only municipal roads equipped with stormwater drainage systems. As a result, both wastewater and stormwater from residential areas flow into the UDS during rainfall events. To mitigate the risk of flooding due to stormwater exceeding the capacity of the UDS, an overflow pipe was installed at a node close to the pump station in the network. When the water depth within the node exceeds the datum elevation of the overflow pipe, wastewater is discharged directly into the nearest water body through the overflow pipe.
2.2. Modeling
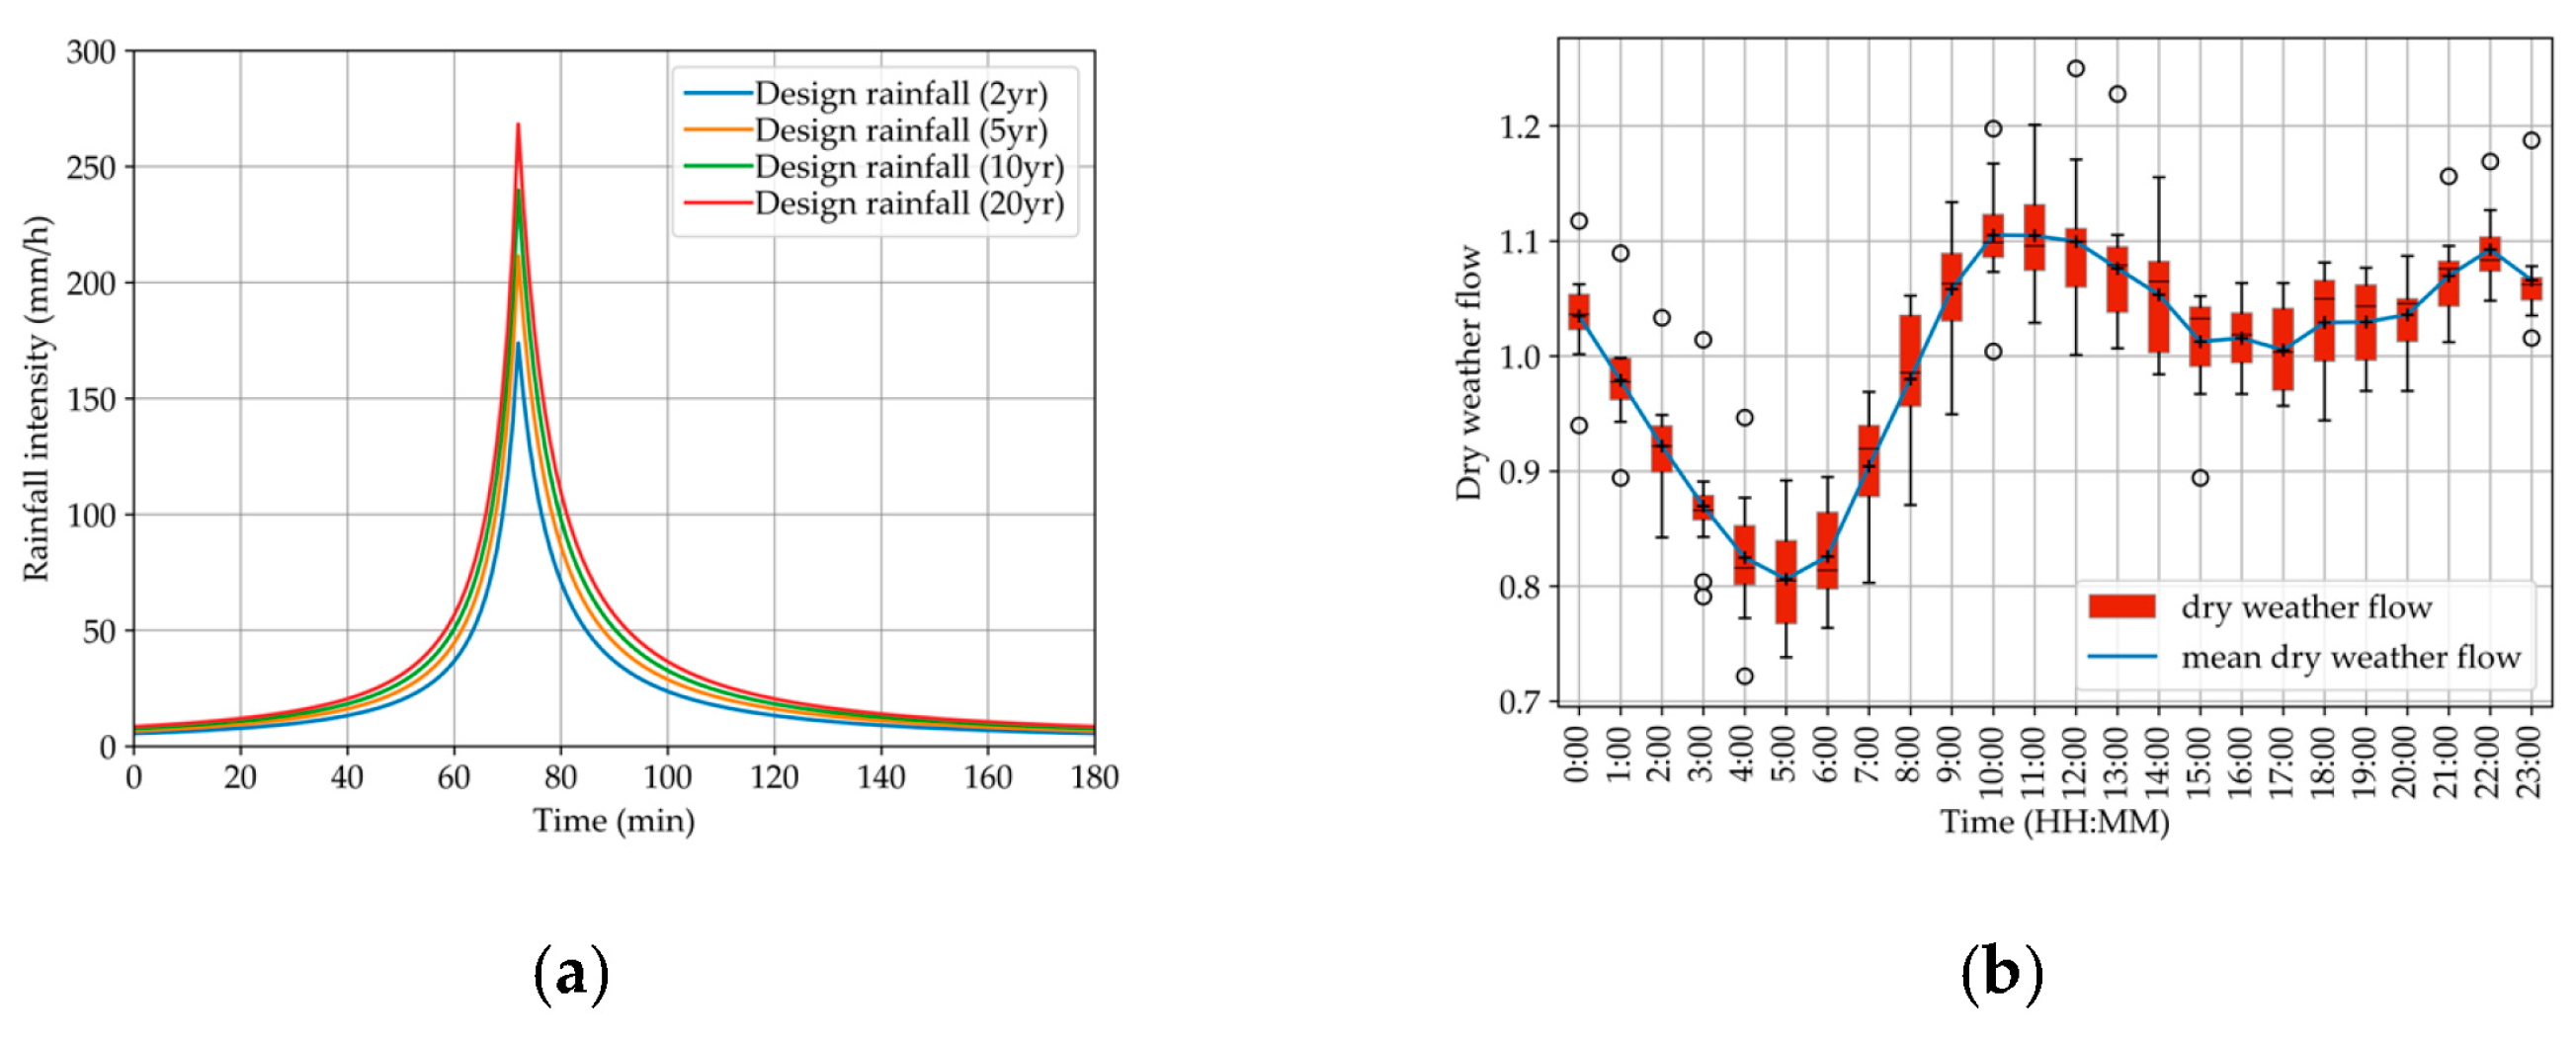
In this study, SWMM was employed for modeling and analyzing the UDS, and the sub-catchments, links, and nodes of the SWMM model are presented in Figure 1a. The analysis focused on 12 sub-catchments, each assigned a numerical identifier ranging from S(0) to S(11). All the sub-catchments were divided based on the drainage network and road distribution within the study area. The subsequent analysis in this study utilized design rainfall, as presented in Figure 2a, and the rainfall intensity was calculated using the following rainstorm intensity formula of Wuxi City:
where q is the rainfall intensity in L/(s·ha), P is the return period, and t is the rainfall duration in min. Return periods for this study were selected as 2-year (2 yr), 5-year (5 yr), 10-year (10 yr), and 20-year (20 yr), with a duration of 180 min. The corresponding rainfall for each return period is, respectively, 70.32 mm, 85.52 mm, 97.01 mm, and 108.51 mm. The design rainfall pattern utilized the Chicago method, which is a short-duration rainfall design method commonly used for designing urban stormwater infrastructure [35,36]. The peak coefficient of the design rainfall pattern is 0.40. Additionally, the total dry weather flow of each sub-catchment was determined based on population density, and the pattern of dry weather flow was established through a statistical analysis of measured dry weather flow data, as shown in Figure 2b.

Figure 2.
The inputs of SWMM model: (a) design rainfalls; (b) dry weather flow.
2.3. Optimization of RBC Strategy
We employed an RBC strategy to regulate the operation of the pump station. Specifically, this strategy involved a series of predetermined control rules to achieve the feedback regulation of the reservoir water depth and the pump station’s flow rate. To facilitate the implementation of the RBC strategy, the pump station’s flow rate was categorized into five settings (L(0), L(1), L(2), L(3), L(4)), corresponding to 0%, 25%, 50%, 75%, and 100% of the pump station’s maximum capacity, respectively. If the pump station’s flow is set at L(0), no further reduction in flow is possible. Conversely, once the pump flow is set at L(4), no additional increase in the pump station’s flow can be made. Table 1 presents the operational rules for the RBC strategy.

Table 1.
The control rules of the RBC strategy.
When the inflow into the reservoir surpasses the pump station’s flow rate (set at L(i)), the water depth in the reservoir will increase. Once the water depth reaches up(i), the pump station’s flow setting is stepped up to L(i + 1), with the integer i varying from 0 to 2. In contrast, when the reservoir’s inflow is lower than the pump station’s flow rate (set at L(i)), the water depth in the reservoir will decrease. Once the water depth drops to down(i − 1), the pump station’s flow setting is then reduced to L(i − 1), where the integer i ranges from 1 to 3.
To ensure the safe implementation of the RBC strategy, the RBC parameters down(i) and up(i) must meet the following limitations and constraints:
- To prevent submersible pumps from overheating due to exposure above the water surface, the RBC parameter down(0) for pump shutdown should be higher than the water depth at which the pumps become exposed;
- To prevent the increased risk of CSO due to excessive water depth, the RBC parameter up(3) required to start up the pump at maximum flow should be lower than the depth of the reservoir when CSO occurs;
- To prevent conflicts between the RBC rules, all RBC parameters must satisfy the following sequential relationship:
down(0) < up(0) < down(1) < up(1) < down(2) < up(2) < down(3) < up(3)
- 4.
- To prevent excessive pump operation frequency, the differences between adjacent RBC parameters should be greater than the minimum allowable interval ∆d. Additionally, we set the differences ∆d between adjacent RBC parameters to be equal.
By setting these conditions, we can ensure the safety and efficiency of the pump station’s operations, reduce unnecessary operation frequency, and extend the service life of the pumps.
In this study, one of the objectives is to minimize the CSO volume in the UDS. Additionally, the pump station’s energy consumption is a key factor. Therefore, minimizing both the CSO volume and energy consumption were taken into consideration when selecting the RBC parameters. The formulas for calculating the CSO volume and pump station’s energy consumption are as follows:
where V is the CSO volume in m3, T is the total analysis duration in min, Q(t) is the CSO flow rate at time t in m3/s, ∆t is the time interval in min, E is the pump station’s energy consumption in kW·h, and P(t) is the pump station’s power at time t in kW. The total analysis duration T was determined by the beginning of rainfall and the time of water depth drop to down(0). The CSO flow rate Q(t) is calculated using the SWMM model to obtain a time series, and the pump station’s power P(t) is calculated using the formula:
where ρ is the density of wastewater in kg/m3, g is the gravity acceleration in m/s2, h(t) is the pump head at time t in m, and η represents the efficiency of the pumps. In this study, the operation efficiency of the pump station is maintained within a stable and efficient range through the combination of different types of pumps and variable frequency technology. Therefore, in subsequent research, the impact of various factors on η can be ignored and it can be considered as a fixed value.
In this study, we set the up(3) to be equal or less than 7.00 m and down(0) to be equal or greater than 3.00 m, the minimal adjusting step for the RBC parameters was 0.10 m, and the ∆d was selected from the set (0.30 m, 0.35 m, 0.40 m, 0.45 m, 0.50 m, 0.55 m). Therefore, there are a total of 129 combinations of the RBC parameters. To search the optimal RBC parameters that can minimize the CSO volume while minimizing the pump station’s energy consumption, we calculated the CSO volume and energy consumption for all the RBC parameters and searched the Pareto solutions through non-dominated sorting.
2.4. Cost-Effectiveness of Permeable Pavement
This study also aimed to assess the cost-effectiveness of an LID measure, with a focus on permeable pavements, in reducing the CSO volume V and pump station’s energy consumption E in the study area. The land use of the study area is depicted in Figure 1b, while the areas and proportions of buildings, green lands, water bodies, and impermeable grounds within each sub-catchment are detailed in Table 2. Permeable pavements are proposed to replace impermeable grounds, as shown in Figure 1b.
Table 2.
The land use of the study area.
To describe the layout of permeable pavements, a binary indicator pp(j) is utilized, where pp(j) = 0 denotes a lack of permeable pavement and pp(j) = 1 signifies its presence in sub-catchment S(j). Using this approach, we generate 212 − 1 = 4095 unique permeable pavement installation scenarios, excluding the baseline scenario without permeable pavement installations. Each scenario is defined by the binary vector D:
D = (pp(0), pp(1), …,pp(j), …,pp(11))
To quantify the cost-effectiveness of each permeable pavement scenario in terms of the CSO volume and energy consumption reduction, we introduce a metric: the reduction rate per unit cost. The reduction rates for both the CSO volume V and energy consumption E are computed using the following equations:
where RV(D) and RE(D) are the reduction rates of the CSO volume and energy consumption of scenarios D in %, and VBS and EBS are the CSO volume and energy consumption of the baseline scenario.
The cost-effectiveness of each scenario for the CSO volume and energy consumption is calculated using the following expressions:
where CEV(D) and CEE(D) are the cost-effectiveness of the CSO volume reduction and energy consumption reduction of scenario D in %/CYN, and C(D) is the construction cost of scenario D in CYN and the unit construction cost per m2 is 300 CYN.
We classified all the permeable pavement installation scenarios D into two categories based on their CEV and CEE. Scenarios with both a CEV and CEE equal or greater than the median cost-effectiveness were categorized as high cost-effectiveness, while those with lower cost-effectiveness than the median cost-effectiveness were categorized as low cost-effectiveness. To evaluate the contributions of each feature pp(j) to the cost-effectiveness, we analyzed the frequency of pp(j) = 1 in sub-catchment S(j) within scenarios that exhibit high cost-effectiveness. Moreover, a higher frequency means a higher contribution of feature pp(j) to high cost-effectiveness.
3. Results
3.1. Calibration and Validation of SWMM Model
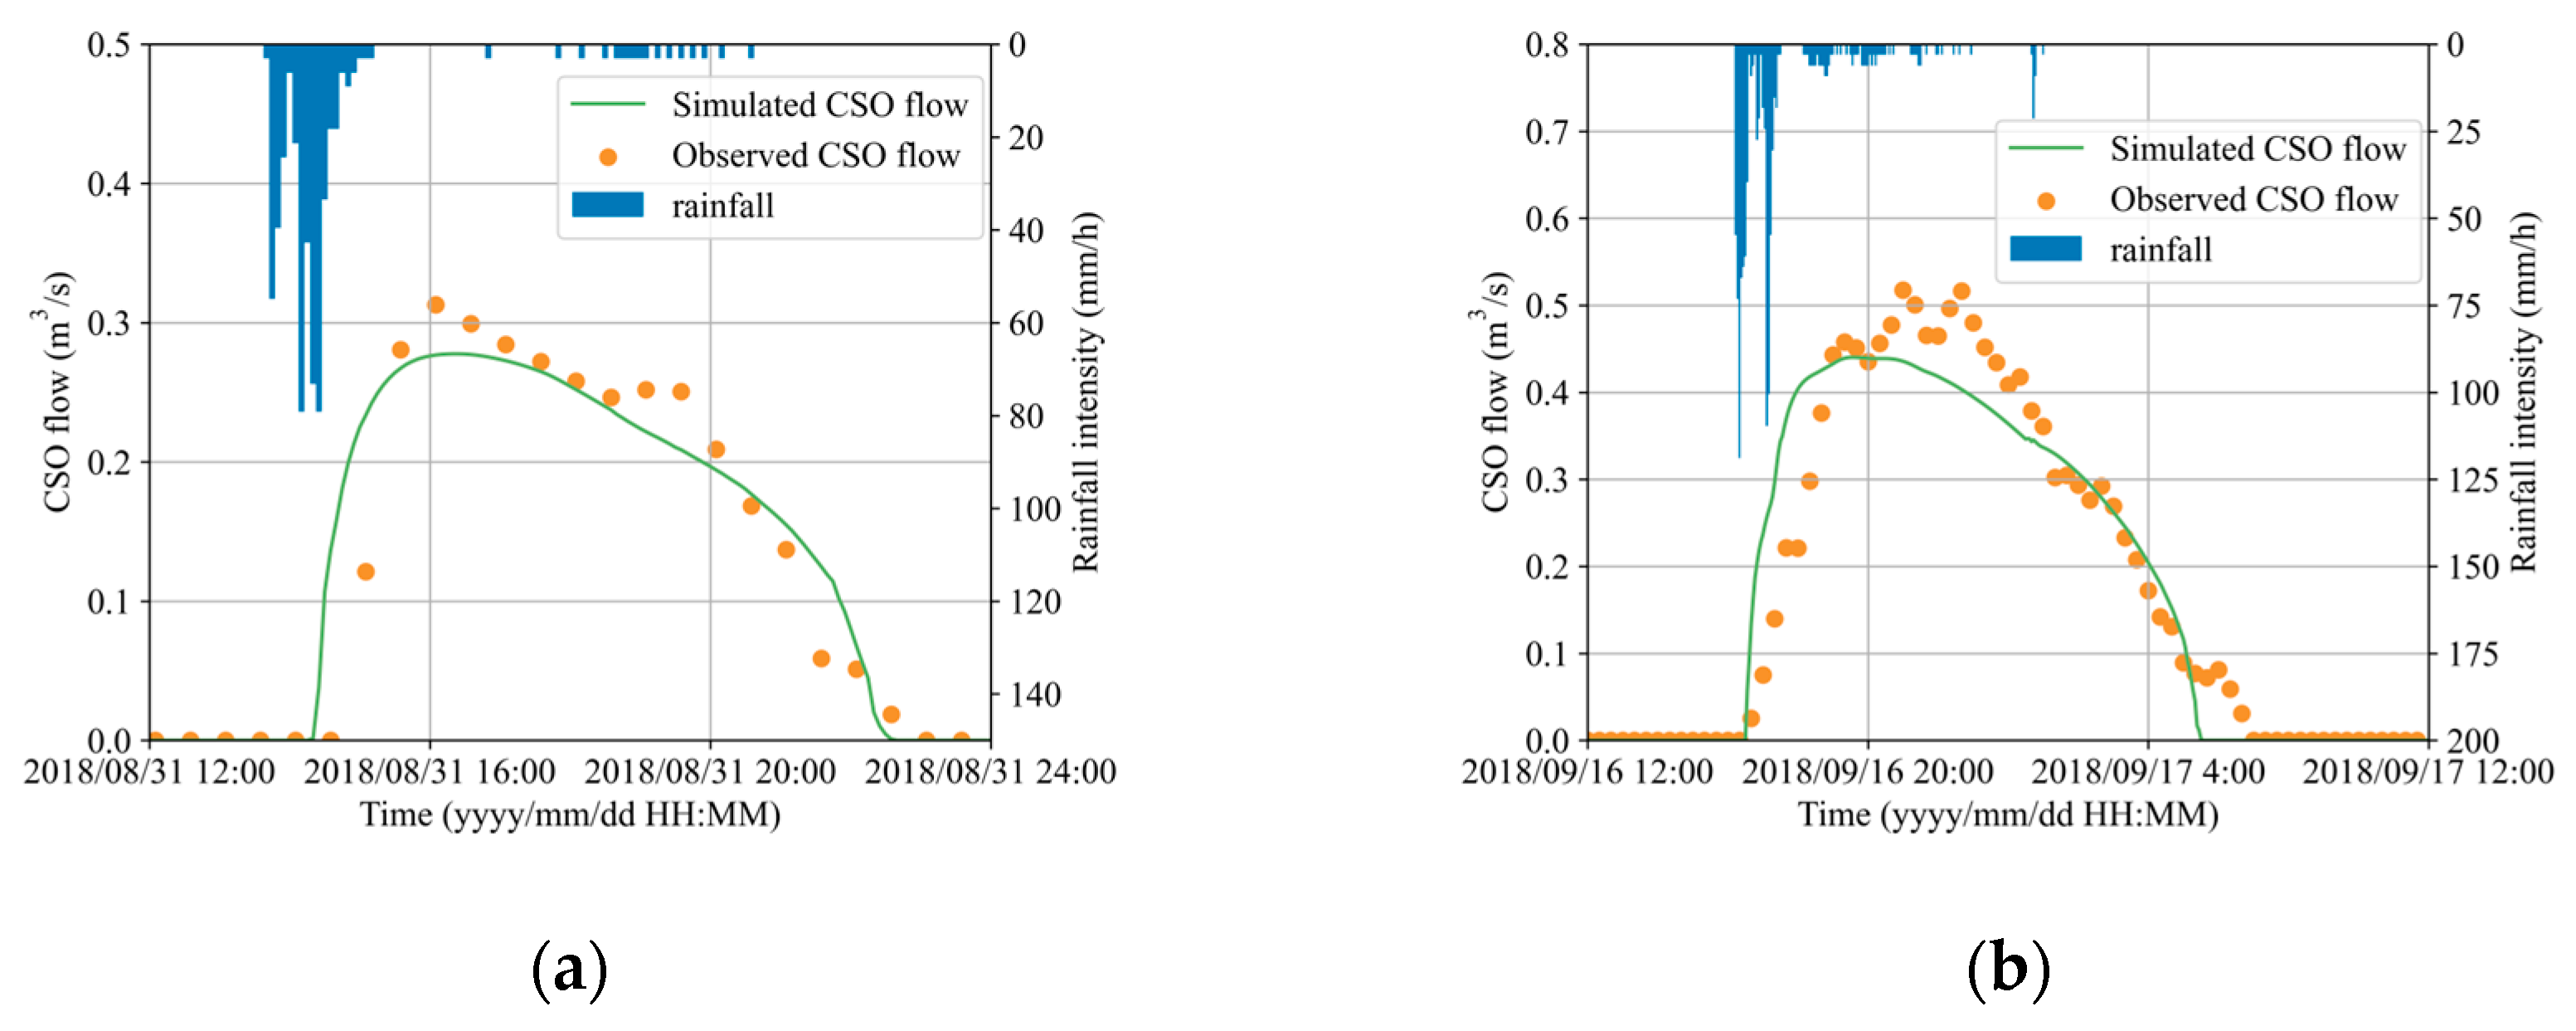
To accurately represent the real-world conditions of the study area, we calibrated and validated the SWMM model utilizing rainfall data obtained from two field measurement campaigns, along with the corresponding CSO flow rate data. The efficacy of the calibration and validation processes was assessed through the Nash–Sutcliffe efficiency coefficient (NSE). The calibration and validation results are presented in Figure 3, with an NSE of 0.79 for calibration and 0.76 for validation, respectively. Both NSEs were above 0.65, indicating that the SWMM model was acceptable [37].

Figure 3.
The calibration and validation results of SWMM model: (a) calibration; (b) validation.
3.2. Pareto Solutions of RBC Parameters
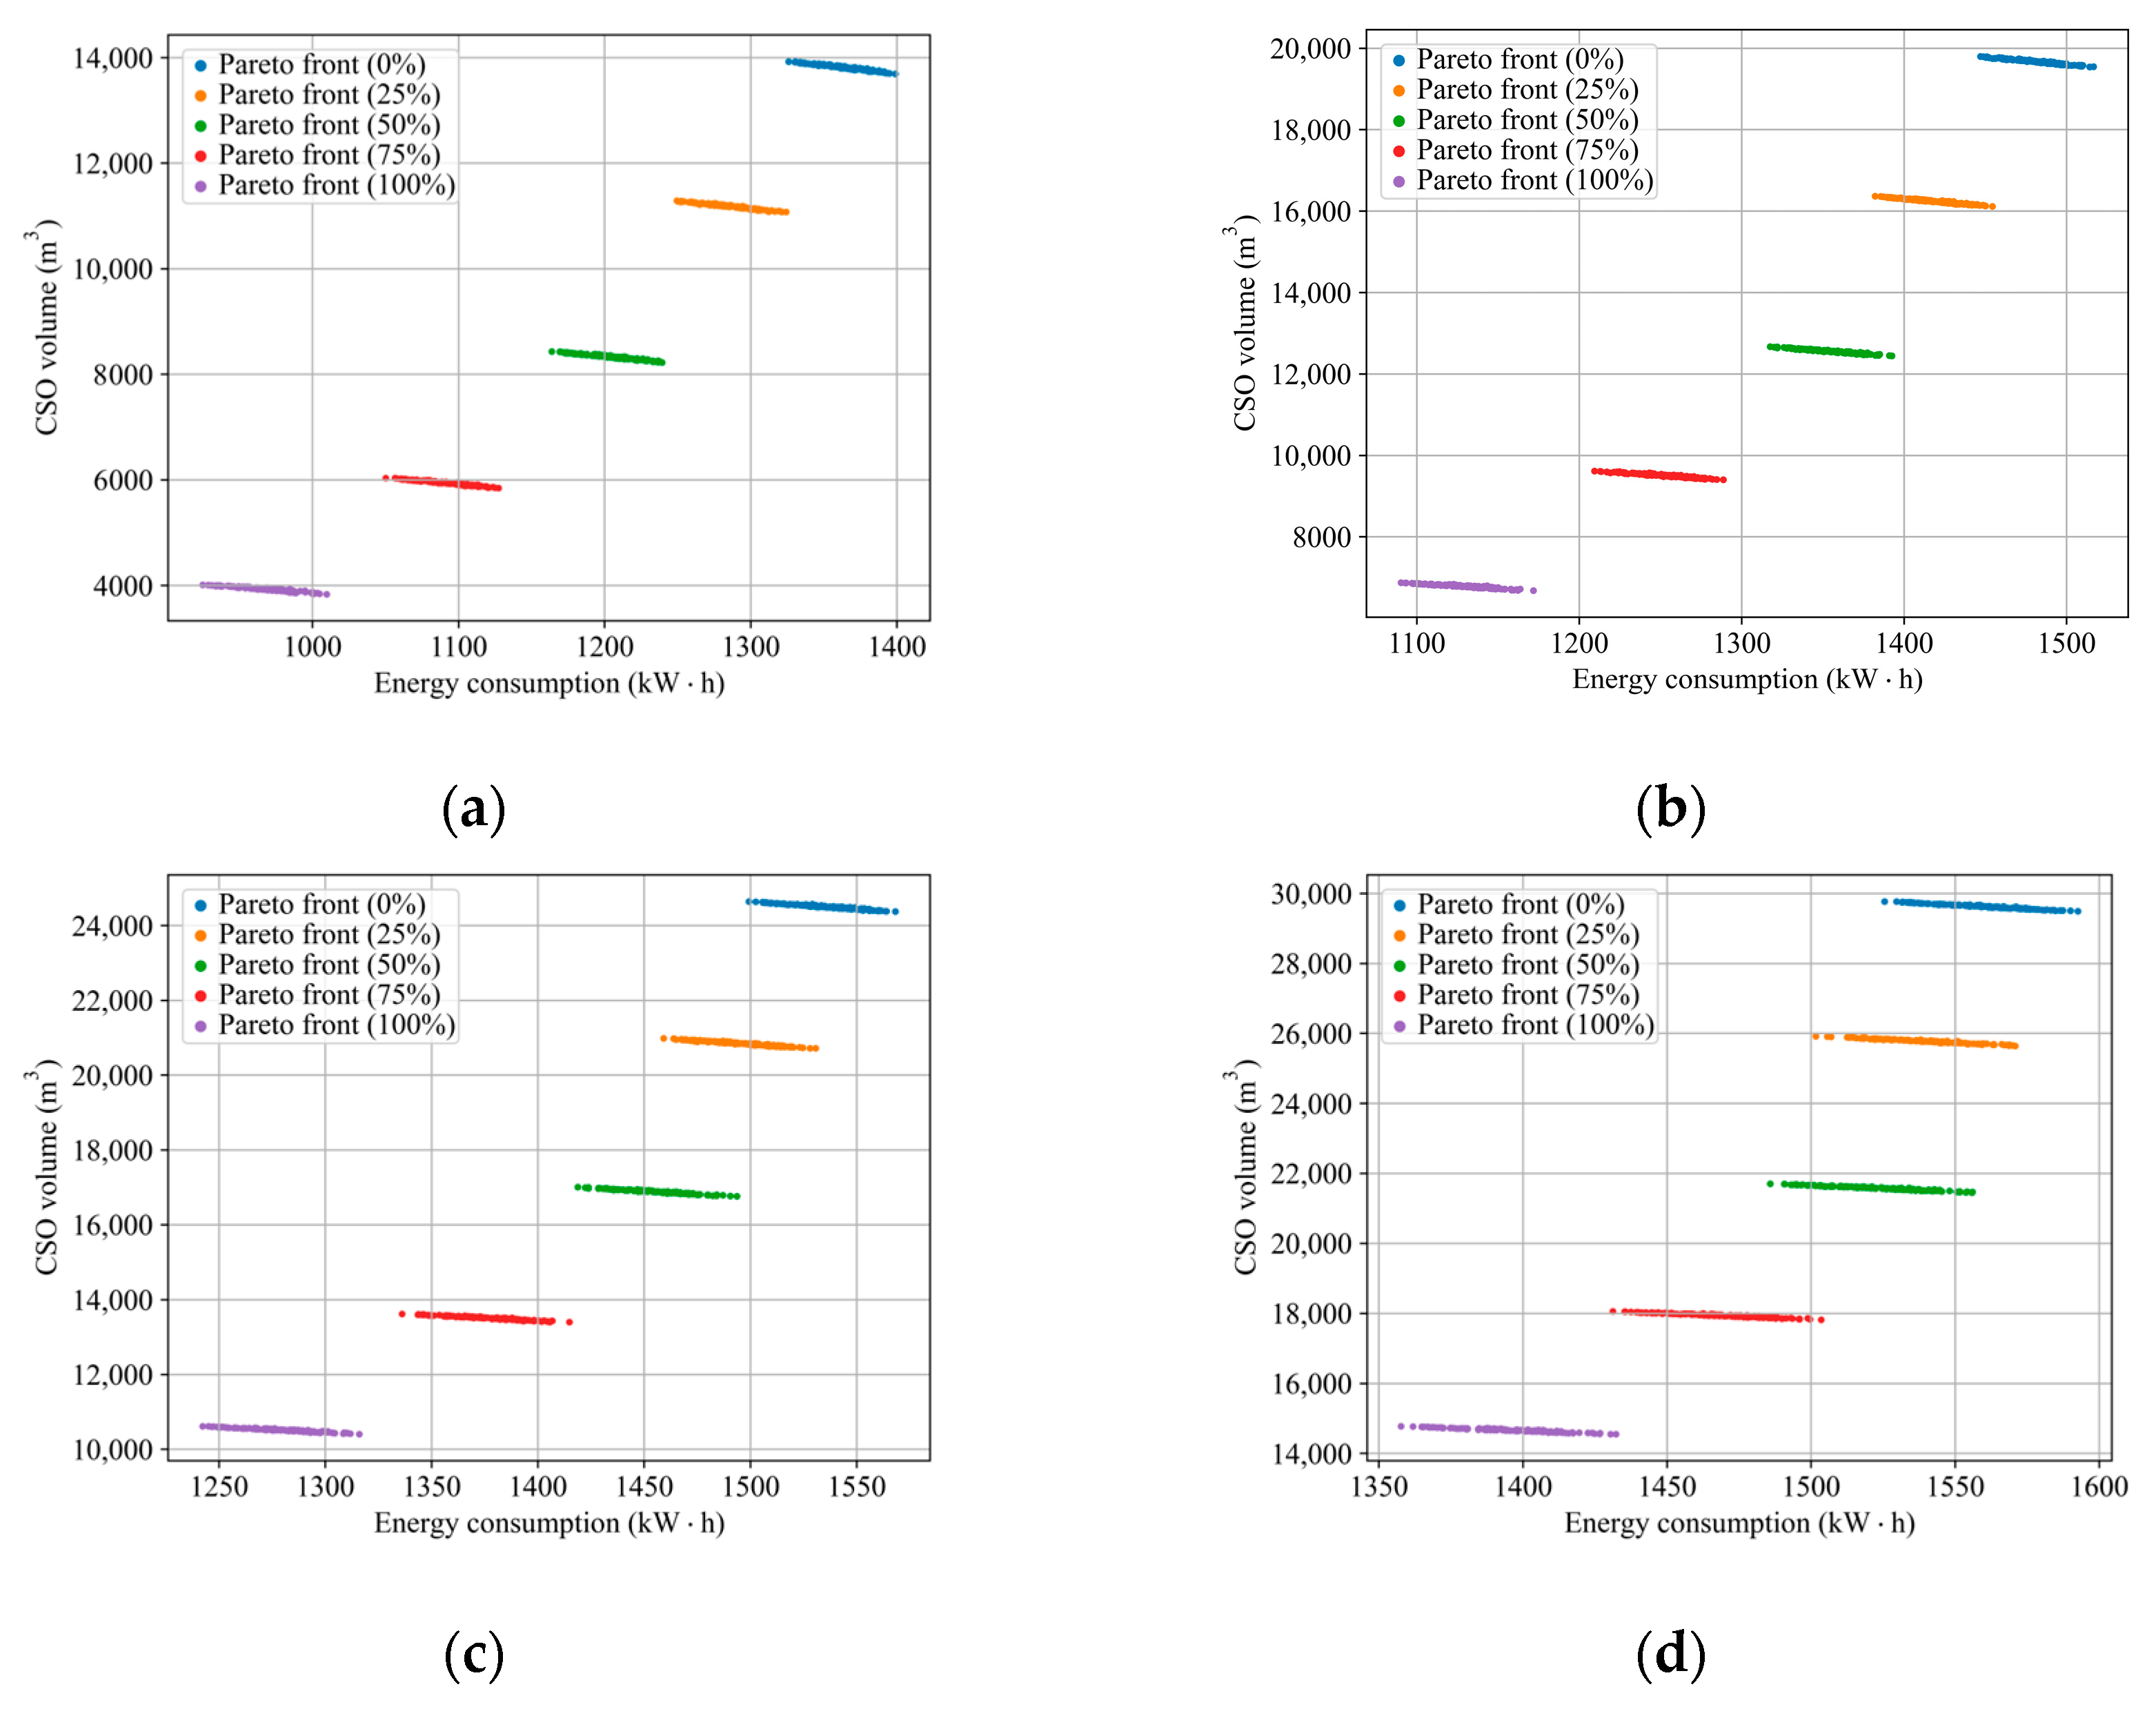
The application of the non-dominated sorting method revealed the Pareto fronts for the CSO volume (V) and pump station’s energy consumption (E) for varying proportions of permeable pavement installations (Figure 4). The Pareto fronts demonstrate a negative correlation between the V and E, with Pearson correlation coefficients ranging from −0.98 to −0.95. Compared to the RBC strategy, the implementation of permeable pavements shows greater effectiveness in reducing both the V and E, especially with lower return periods. As the proportion of permeable pavements increased from 0% to 100%, the mean reduction in the V for various RBC parameters consistently increases with increasing return periods. The corresponding mean V reduction values are 9889.79 m3, 12,897.69 m3, 13,985.92 m3, and 14,961.15 m3, respectively. Simultaneously, the mean values of E reduction exhibit a decreasing trend with increasing return periods, with values of 399.62 kW·h, 354.64 kW·h, 259.85 kW·h, and 169.35 kW·h, respectively. Across return periods from 2 yr to 20 yr, under the combined influence of the RBC and LID, the maximum reduction rates in the V were 72.46%, 66.26%, 57.77%, and 51.12%. Similarly, the maximum reduction rates in the E were 33.89%, 28.10%, 20.78%, and 14.75%. Additionally, the Pareto solutions for different combinations of return periods and permeable pavement installation proportions are quite distinct, and the number of solutions for different combinations range from 25 to 47.
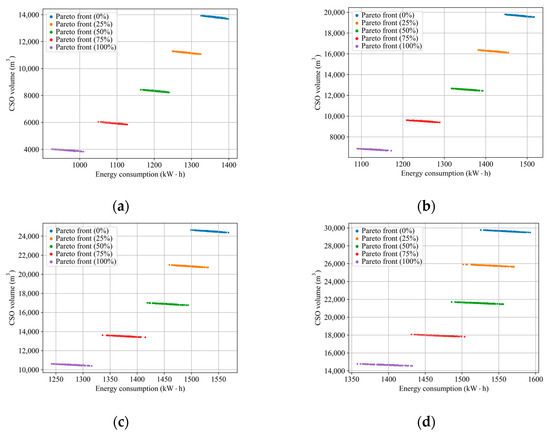
Figure 4.
The Pareto fronts with different installation proportions of permeable pavement: (a) 2 yr; (b) 5 yr; (c) 10 yr; (d) 20 yr.
Furthermore, we analyzed the correlation between the RBC parameters (from down(0) to up(3)) and the objectives of both the V and E using Pearson correlation coefficients. The CSO volume V exhibits a positive correlation with all the RBC parameters, with Pearson correlation coefficients ranging from 0.82 to 0.99. Conversely, the pump station’s energy consumption E demonstrates a negative correlation with the RBC parameters, with Pearson correlation coefficients ranging from −0.98 to −0.76.
3.3. Classification of Different Scenarios
Among these Pareto solutions for different permeable pavement installation proportions under various return periods, the high-frequency (occurring more than 18 times among the 20 Pareto solution sets) solutions with the minimal mean V (sv1) and the minimal mean E (sv2) were selected.
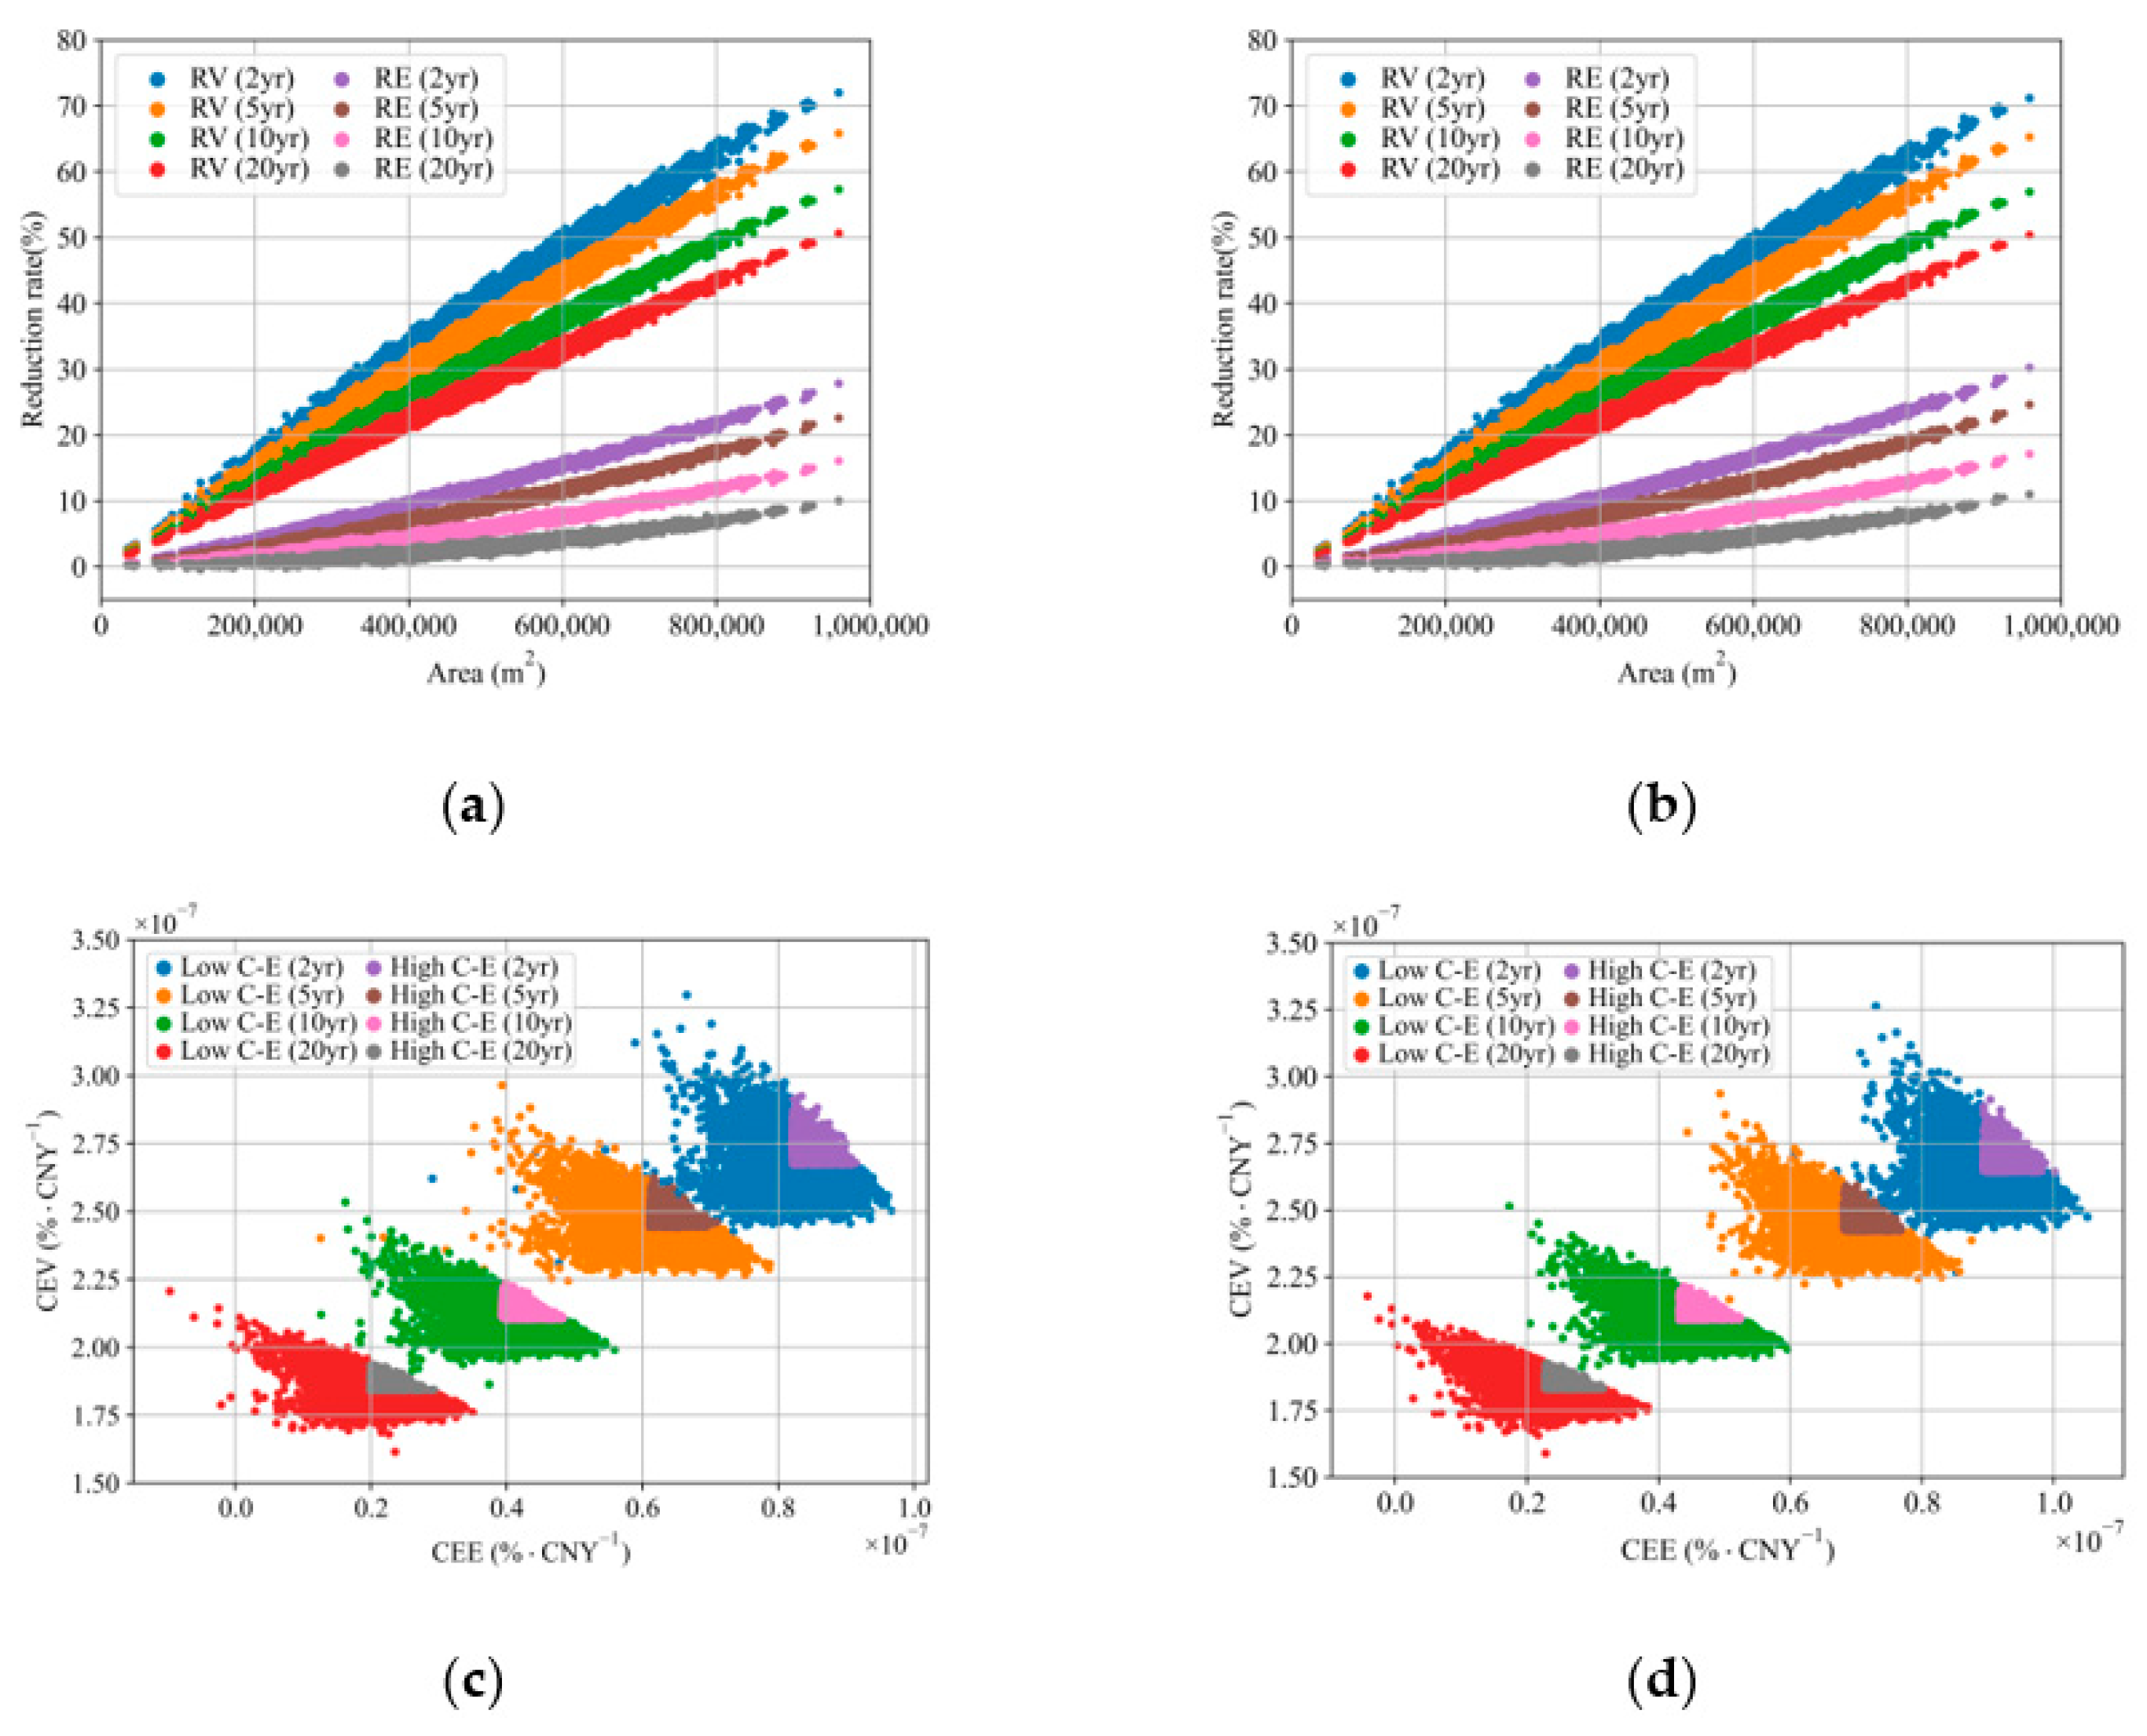
Figure 5a,b display the distributions of the reduction rates (RV and RE) for various permeable pavement installation scenarios with varying RBC parameters across different return periods. When the RBC is set to sv1, the maximum RV range is 50.66% to 71.99% and the maximum RE range is 10.07% to 27.83% under different return periods. With the sv2 setting, the maximum RV range is 50.36% to 71.18% and the max RE range is 11.00% to 30.25%. An approximate linear relationship is observed between the area of the permeable pavement installation and RV, with the reduction rate increasing as the installation area expands. As the return period increases, the RV tends to decrease. The relationship between the RE and the installation area of permeable pavements displays significant nonlinearity. Notably, under a 20 yr return period, some RE values are negative, suggesting that the pump station’s energy consumption exceeds that of the baseline scenario in those instances. Similarly to the RV, the RE also generally exhibits a decreasing trend with increasing return periods.
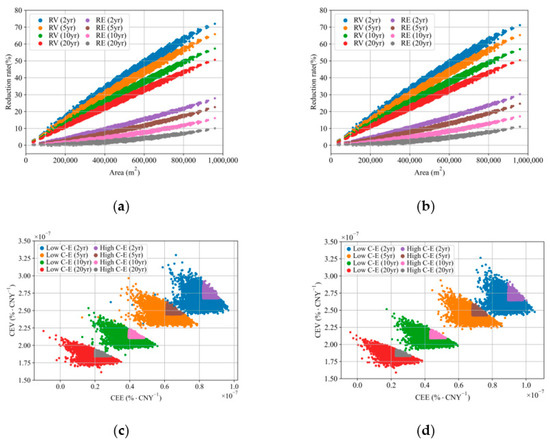
Figure 5.
The reduction rate and cost-effectiveness of (a) RV and RE (sv1); (b) RV and RE (sv2); (c) classification of all the scenarios based on CEV and CEE (sv1); (d) classification of all the scenarios based on CEV and CEE (sv2).
Figure 5c,d illustrate the classification of the high cost-effectiveness (high C-E) and low cost-effectiveness (low C-E) in different permeable pavement installation scenarios under different return periods. With the increase in the return period, the CEV and CEE gradually decreased. The distribution range of the CEE with sv2 under each return period is higher than that of sv1, but the CEV is less affected by the RBC parameters.
3.4. Feature Importance Ranking
Table 3 illustrates the frequency of pp(j) = 1 across features under high cost-effectiveness scenarios. The data indicate that both the return period and RBC parameters have a limited effect on these frequencies. Consequently, the features were able to be ranked by their average frequency across different return periods.
Table 3.
The frequencies of pp(j) = 1 across features under high cost-effectiveness scenarios.
Features pp(0), pp(5), pp(6), and pp(11) exhibit higher frequencies than the means of sv1 and sv2, suggesting that installing permeable pavements in the corresponding sub-catchments could significantly enhance the cost-effectiveness of permeable pavement installation scenarios. Considering the location of each sub-catchment corresponding to features with high frequency, S(5), S(6), and S(11) are the sub-catchments closest to the pump station and CSO node within their branches. Therefore, the distance from the sub-catchment to the pump station and CSO node may be one of the primary factors affecting the contribution of their characteristics to the cost-effectiveness.
4. Discussion
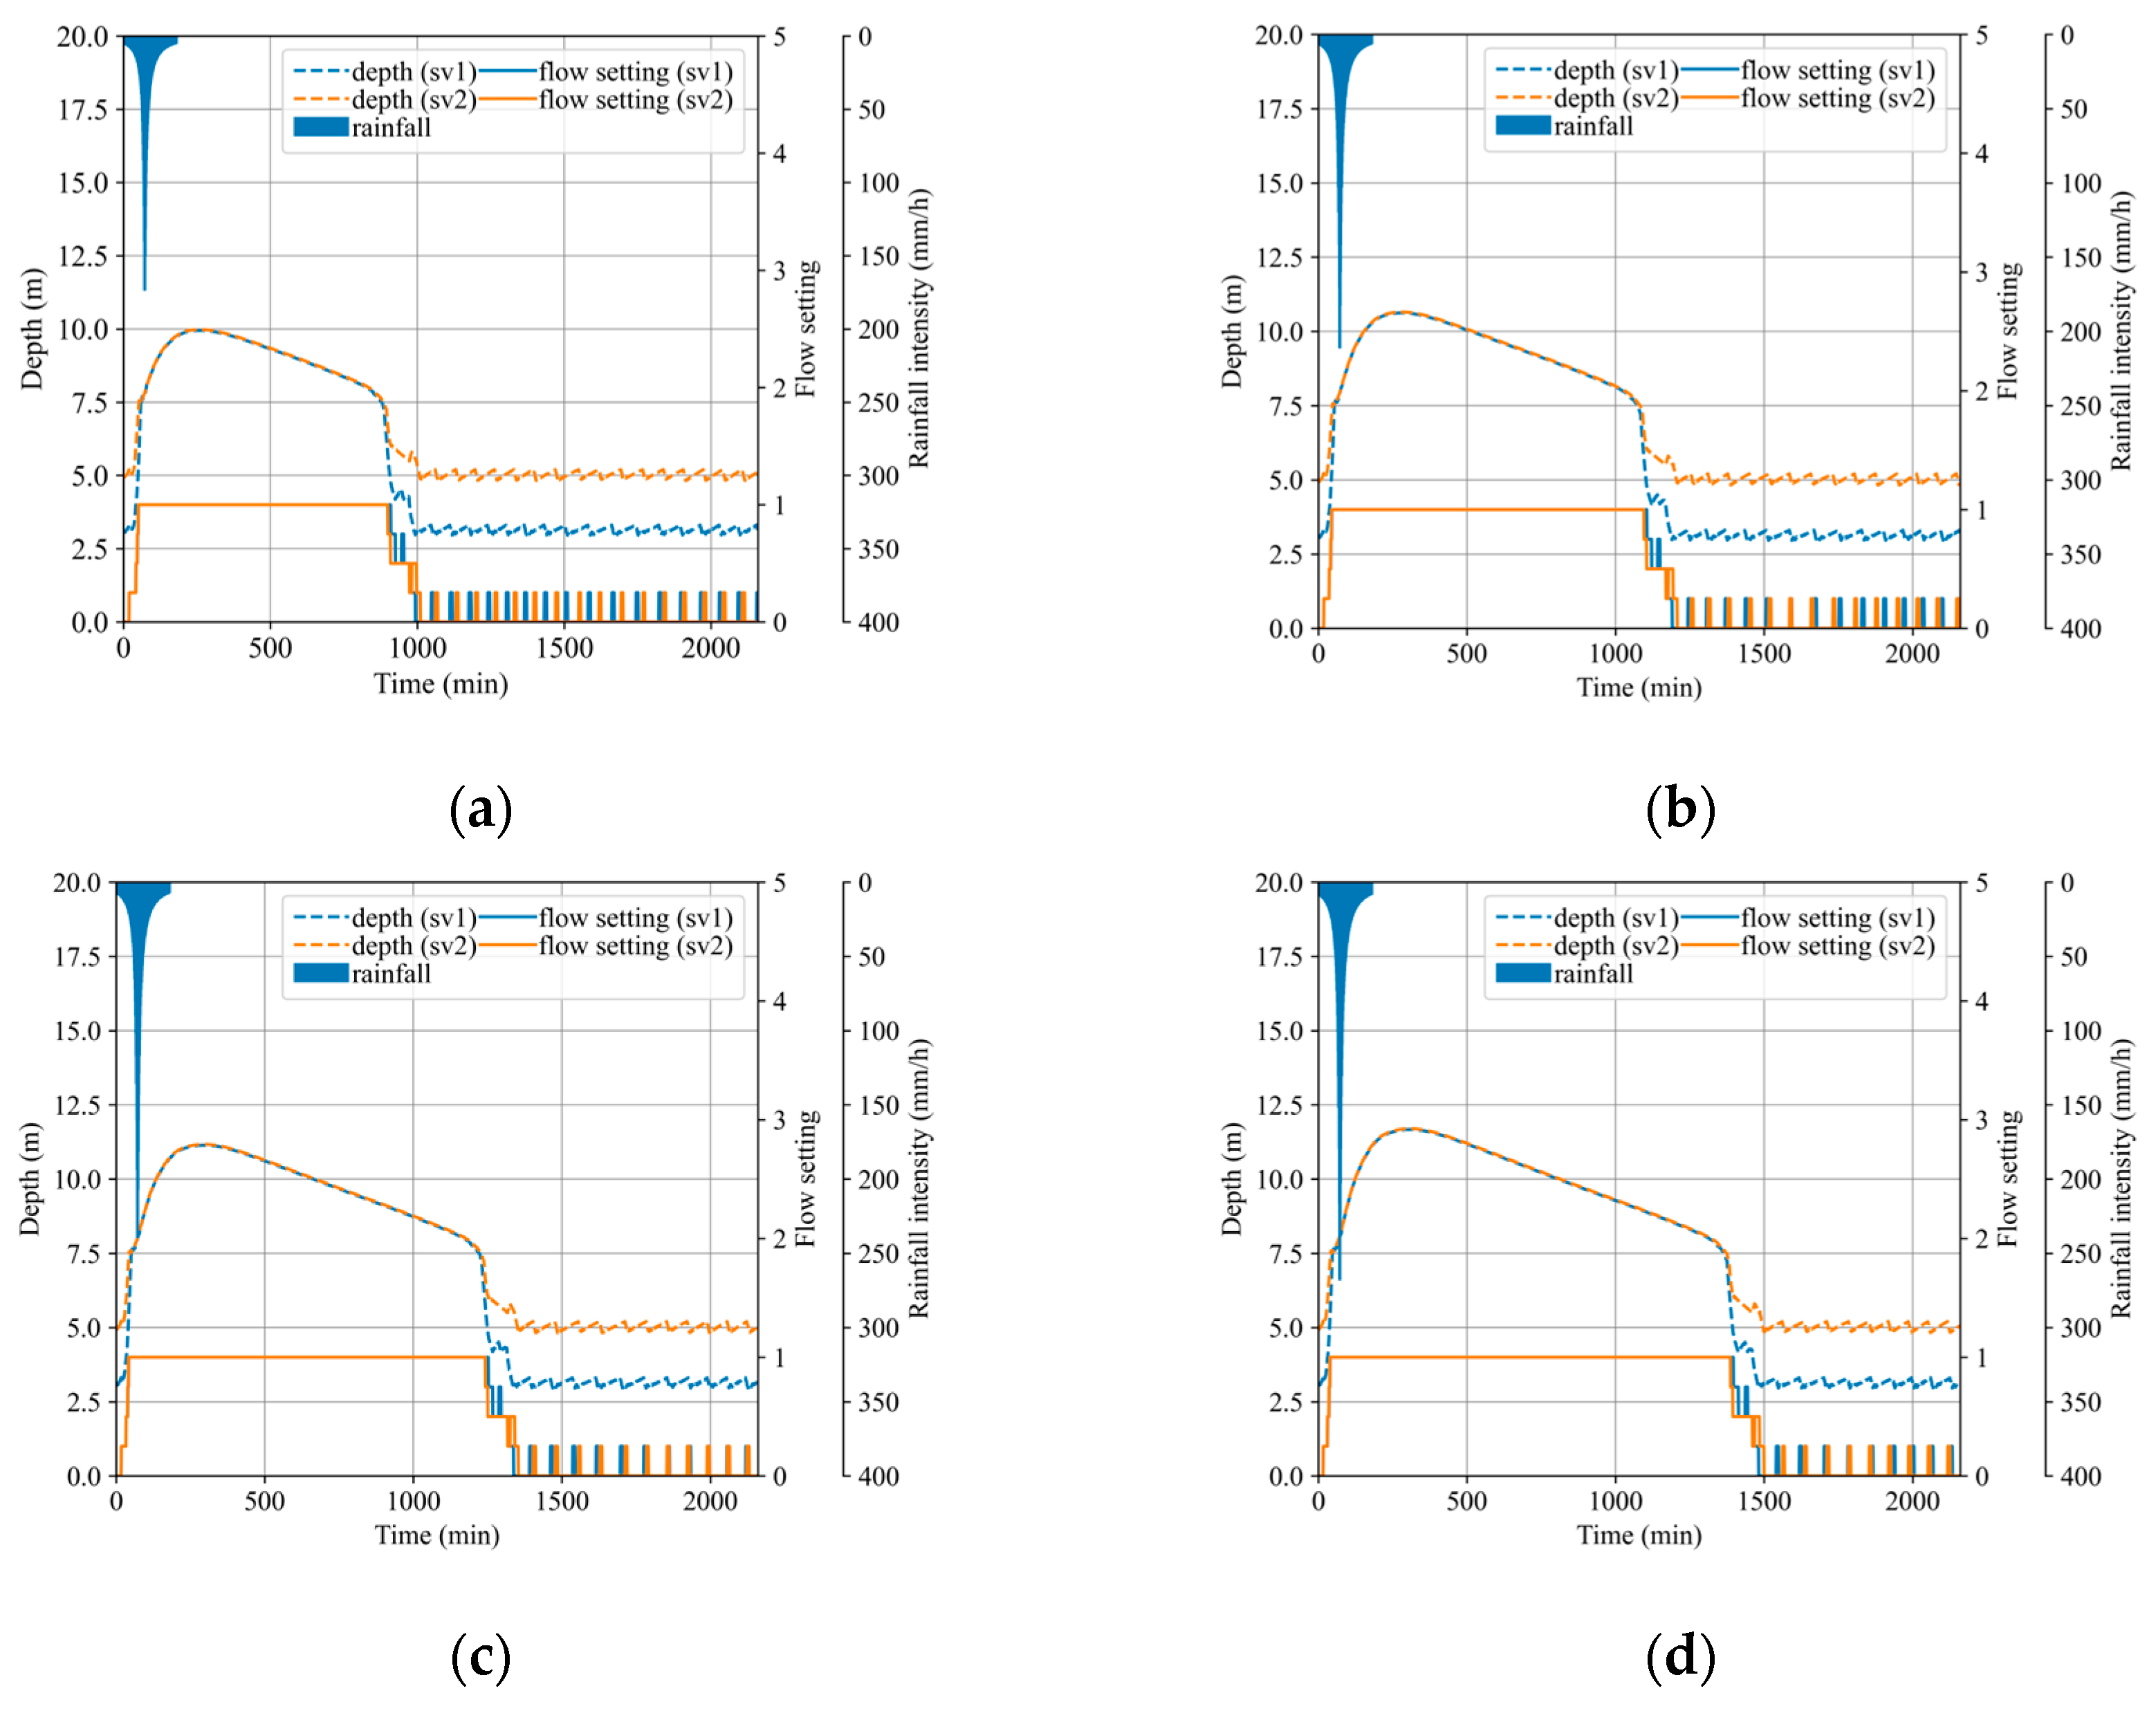
The Pareto fronts encompass non-dominated solutions that optimize the trade-off between minimizing the CSO volume and the pump station’s energy consumption. Figure 6 illustrates the variations in the reservoir water depth and pump flow settings under different return periods, using the RBC parameters associated with sv1 and sv2. Transitioning from sv1 to sv2 within each return period, the operational duration of the pump station decreases, and the lower limit of the operational water depth intervals becomes higher. With increasing return periods, the peak reservoir water depth gradually rises, and the operational duration for the identical RBC parameters extends.
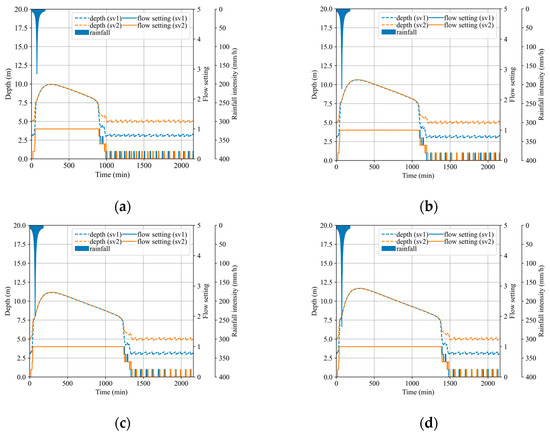
Figure 6.
The pump station’s operational status with different RBC parameters: (a) 2 yr; (b) 5 yr; (c) 10 yr; (d) 20 yr.
Additionally, during the implementation of the RBC strategy, the pump station’s flow rate responds to variations in the reservoir water depth. This phenomenon occurs because the pump station’s flow setting and the reservoir’s water depth are governed by a feedback mechanism in accordance with the RBC strategy. The pump station’s flow setting is adjusted to increase with the elevation in the reservoir’s water depth, and it is reduced as the water depth in the reservoir declines.
In the UDS, the proximity of the pump station to the overflow pipe ensures similar water surface elevations in the reservoir and the node links to the overflow pipe. When the water depth at the CSO node exceeds the overflow pipe’s bottom, gravity-driven CSO discharge occurs, and a higher water depth increases the risk of CSO occurrence and flow rate during events. Moreover, the occurrence of CSO can mitigate the trend of water depth variation in the reservoir. The pump station’s energy consumption is influenced by the interplay of the pump station’s static head and operational duration. While an increase in the reservoir water depths reduces the pump head and thus the station’s power requirements, an extended operational duration can lead to increased energy consumption at a constant power level.
From sv1 to sv2, there is a progressive increase in the RBC parameters with narrowing intervals. This results in a progressive decrease in the remaining storage capacity within the reservoir and the network’s pipes under the same return period, leading to an increase in the CSO volume. However, the lower limit of the pump station’s operating water depth interval becomes higher, and the operational duration at lower water depths is extended, causing a decrease in energy consumption from sv1 to sv2. Moreover, as the return period increases, stormwater inflow into the drainage network increases, elevating the water depths and subsequently increasing the CSO volume. This increase is concurrent with a reduction in the pump station’s static head and an extension of its operational duration. Under these combined influences, there is a slight decrease in the station’s energy consumption as the return period increases.
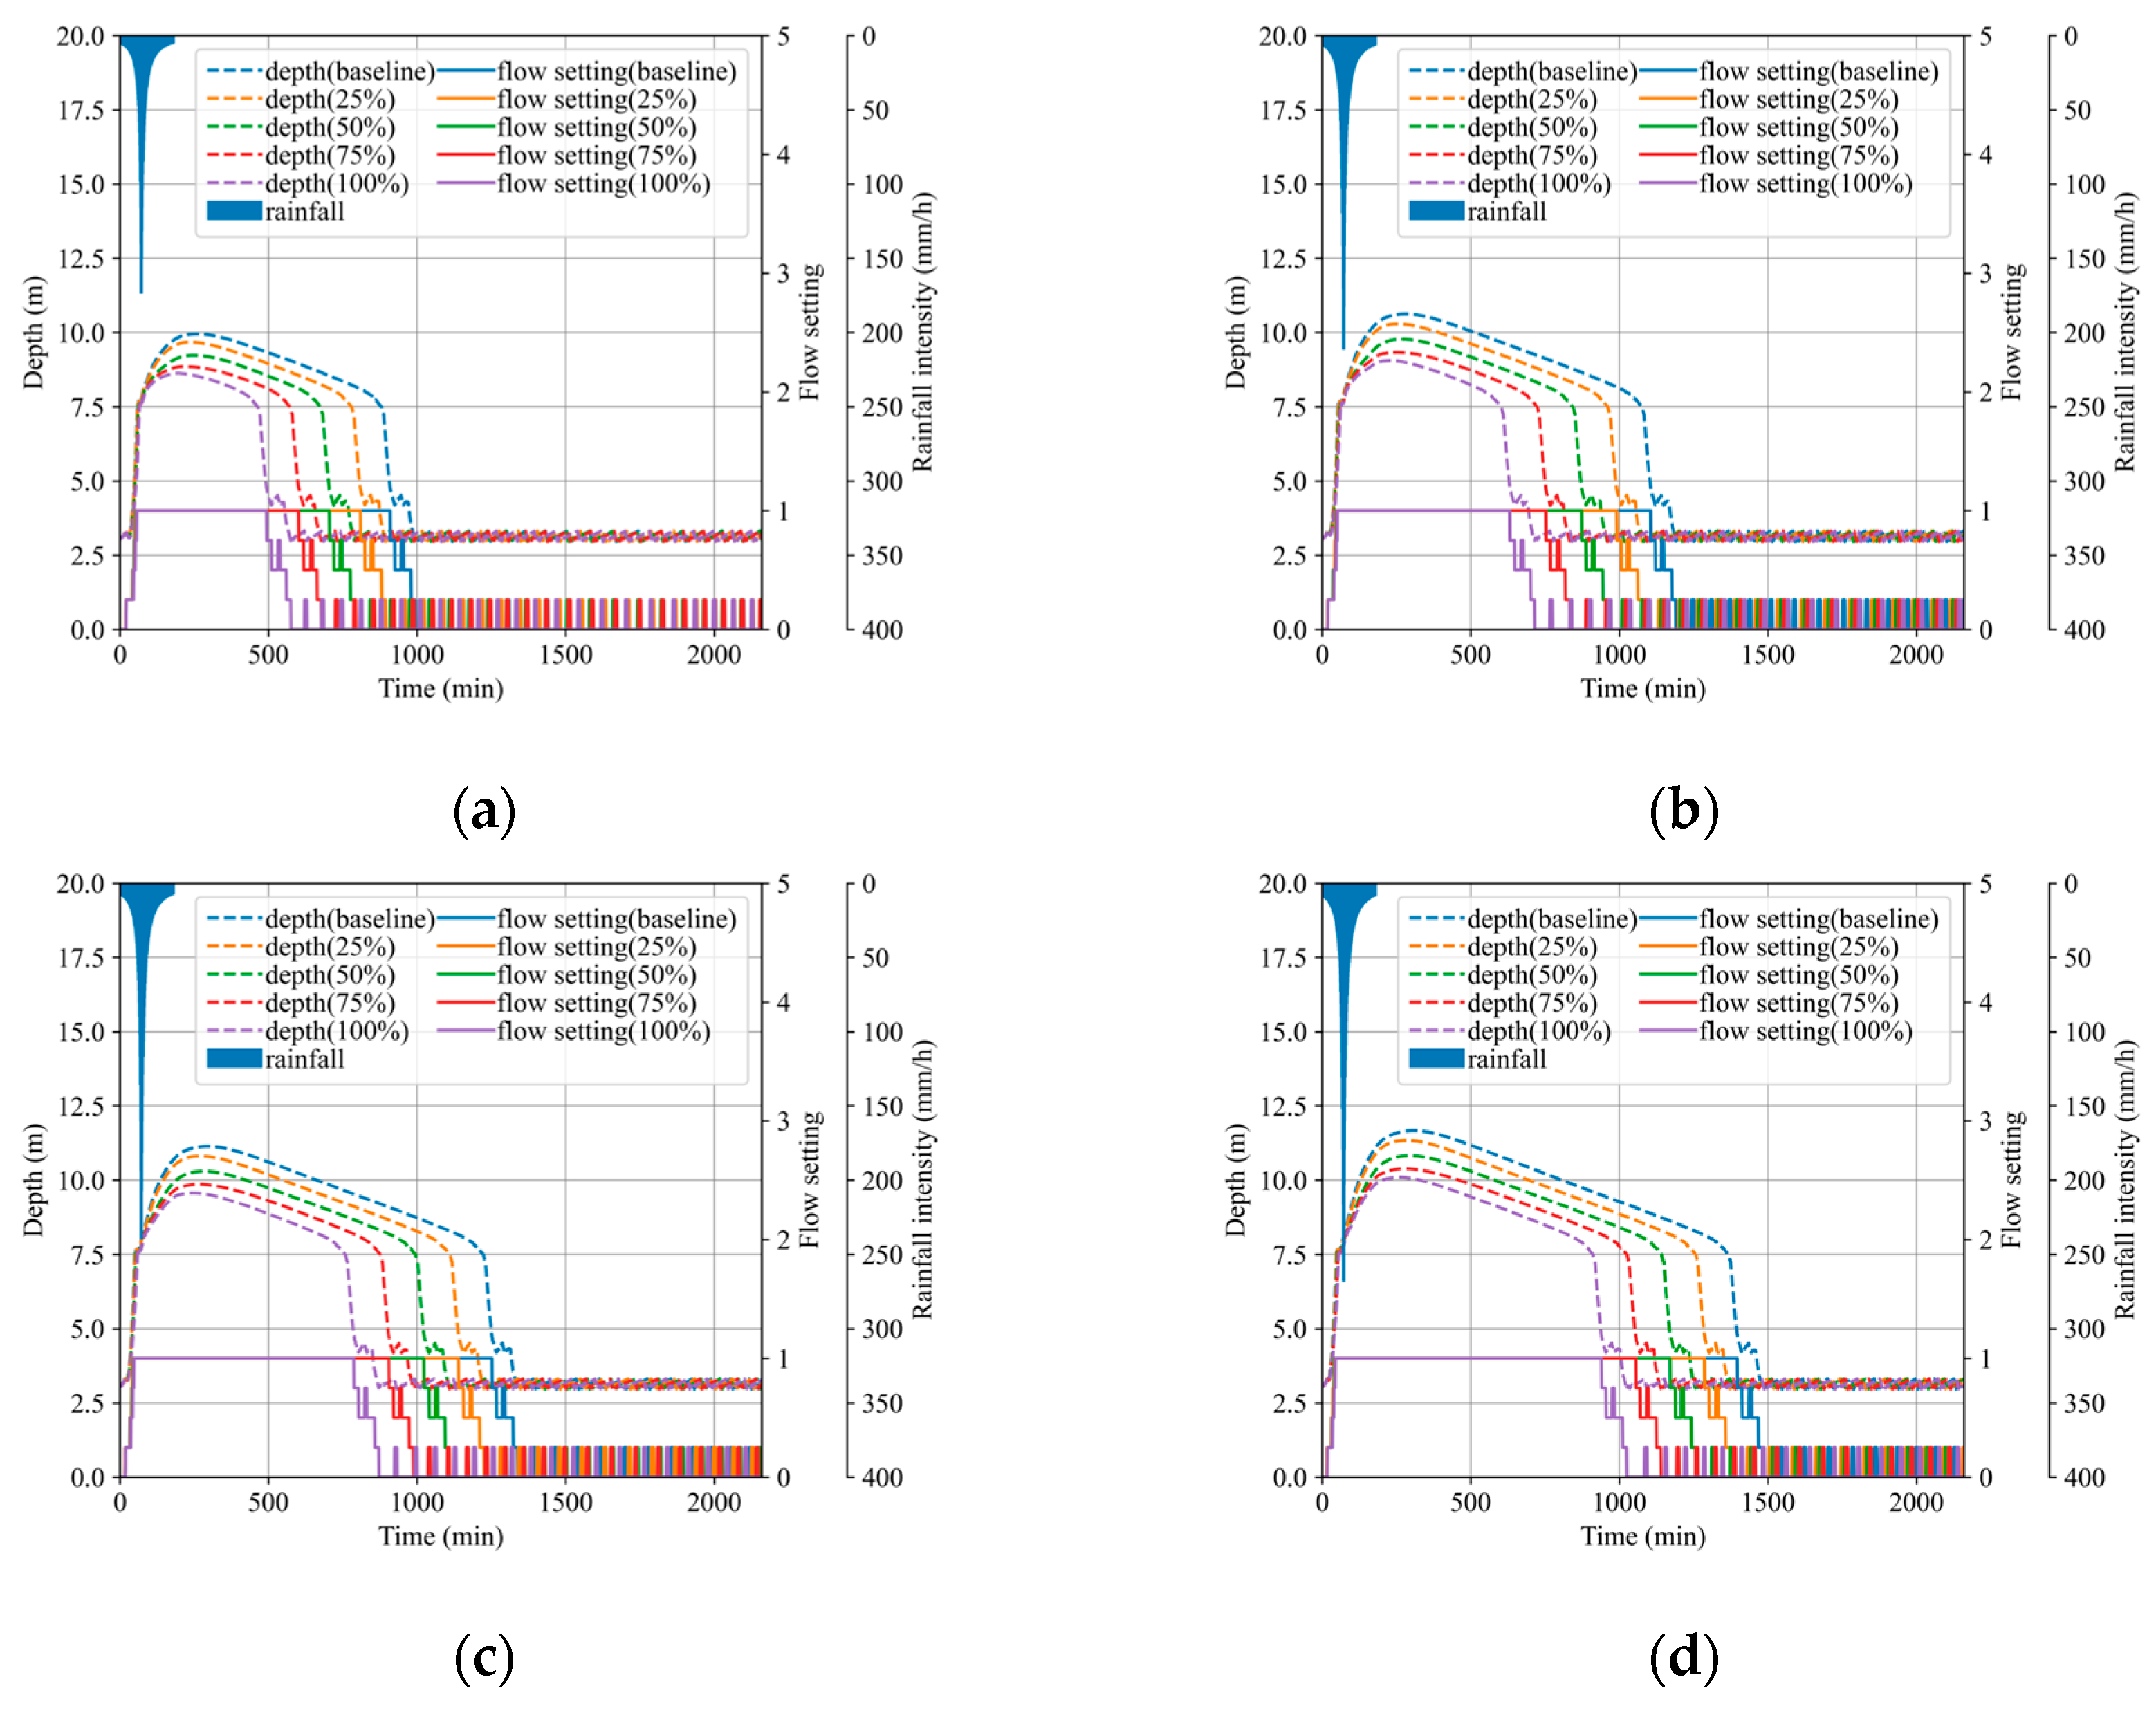
We evaluated the impact of the permeable pavement installation proportion on the CSO volume and pump station’s energy consumption by comparing the baseline scenario (0% permeable pavement) with four additional scenarios (25%, 50%, 75%, and 100% permeable pavement). Figure 7 illustrates the variations in the reservoir water depth and pump flow settings with varying permeable pavement installation proportions across various return periods.
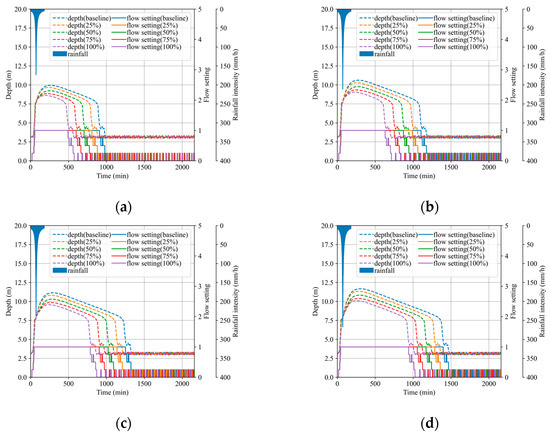
Figure 7.
The pump station’s operational status with different permeable pavement installation proportions: (a) 2 yr; (b) 5 yr; (c) 10 yr; (d) 20 yr.
The expansion of the permeable pavement installation proportion leads to a reduction in stormwater runoff and the volume of water entering the UDS, lowering the water depth in the drainage network. This reduction correlates with a decrease in the CSO volume, in line with the previously established relationship between the CSO volume and reservoir water depth. The interplay of the water depth and operational duration, influenced by the expanding installation proportion, results in a nonlinear relationship between energy consumption and the installation area of the permeable pavement. As the design return period increases, the operational duration becomes the dominant factor, leading to a gradual decrease in the reduction rate of energy consumption.
Additionally, as shown in Figure 4, the number of samples along the Pareto fronts under conditions of diverse permeable pavement installation proportions and design rainfall with various return periods varied from 25 to 47, showing no clear pattern or regularity. This variation is attributable to alterations in water inflow into the UDS resulting from the installation of permeable pavements or variations in rainfall intensity.
We observed that the cost-effectiveness of reducing the CSO volume and energy consumption varies depending on the sub-catchments within the study area where permeable pavement is installed. To examine the impact of installing permeable pavement in different sub-catchments on the CSO volume and energy consumption, we selected three scenarios with identical installation areas but distinct permeable pavement installation locations. We labeled these scenarios as low (l), medium (m), and high (h) based on their CSO volumes, ranging from the largest to the smallest. Figure 8 illustrates the variations in the reservoir water depth and pump flow settings in low to high scenarios across various return periods. Despite the same permeable pavement installation areas in these scenarios, the peak water depth in the reservoir decreases from low to high, indicating the varying impacts of distinct features of each scenario on the pump station’s operation due to the UDS and sub-catchment characteristics. This, in turn, affects the cost-effectiveness of installing permeable pavement in different sub-catchments.
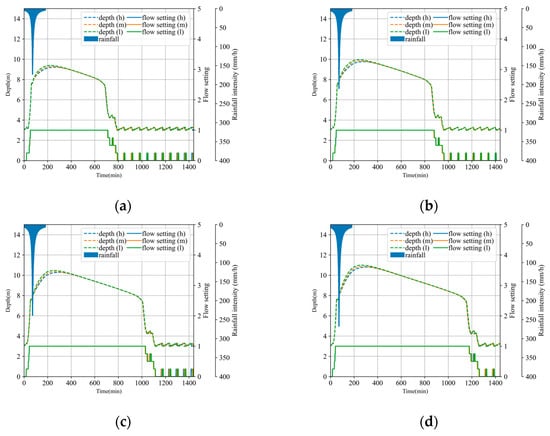
Figure 8.
The pump station’s operational status with different permeable pavement installation scenarios of same area: (a) 2 yr; (b) 5 yr; (c) 10 yr; (d) 20 yr.
This research focused on the cost-effectiveness and mutual impacts of the integration of RBC and permeable pavement, supporting decision making aimed at enhancing the cost-effectiveness of UDS management. However, this study has its limitations. Primarily, it only considered the optimization of the RBC strategy without addressing the optimization of the permeable pavement. Additionally, the impact of varying rainfall intensities on the cost-effectiveness of RBC was not thoroughly explored. The research also did not consider more advanced RTC strategies and other types of LID practices, which could potentially enhance the effectiveness of the UDS.
5. Conclusions
This study focused on enhancing the UDS performance through the integration of RBC and permeable pavement. To achieve the best trade-off in minimizing the CSO volume and pump station’s energy consumption, the non-dominated sorting method can identify the optimal RBC parameters. However, the effectiveness of RBC is ultimately limited by the storage and conveyance capacity of the UDS. Furthermore, there are mutual impacts when implementing RBC and permeable pavement integrally. The permeable pavement installation area can influence the number of Pareto solutions for the RBC parameters under different return periods, whereas variations in the RBC parameters have a relatively minor impact on various permeable pavement installation scenarios. Additionally, the contribution of installing permeable pavement in different sub-catchments to the overall cost-effectiveness varies across various sub-catchments, and it is almost unaffected by the RBC parameters.
This study provides guidance for planning and improving the UDS using RBC and permeable pavement. In future work, we will focus on the comprehensive optimization of RBC and permeable pavement, and we will investigate the effects of varying rainfall patterns on the optimization of RBC and permeable pavement. Furthermore, we will consider more advanced RTC strategies and other types of LID practices.
Author Contributions
Conceptualization, Z.L.; methodology, Z.L.; software, L.S.; writing—original draft preparation, Z.L.; writing—review and editing, H.Z.; visualization, Z.L. and L.S.; supervision, J.L.; project administration, J.L. and H.Z.; funding acquisition, H.Z. All authors have read and agreed to the published version of the manuscript.
Funding
This research was funded by the National Natural Science Foundation of China (grant number: 42301015) and the Natural Science Foundation of Jiangsu Province, China (grant number: BK20230961).
Data Availability Statement
The data presented in this study are available on request from the corresponding author.
Conflicts of Interest
The authors declare no conflicts of interest.
References
- Balistrocchi, M.; Grossi, G. Predicting the Impact of Climate Change on Urban Drainage Systems in Northwestern Italy by a Copula-Based Approach. J. Hydrol. Reg. Stud. 2020, 28, 100670. [Google Scholar] [CrossRef]
- Bibi, T.S.; Kara, K.G.; Bedada, H.J.; Bededa, R.D. Application of PCSWMM for Assessing the Impacts of Urbanization and Climate Changes on the Efficiency of Stormwater Drainage Systems in Managing Urban Flooding in Robe Town, Ethiopia. J. Hydrol. Reg. Stud. 2023, 45, 101291. [Google Scholar] [CrossRef]
- Bibi, T.S.; Kara, K.G. Evaluation of Climate Change, Urbanization, and Low-Impact Development Practices on Urban Flooding. Heliyon 2023, 9, e12955. [Google Scholar] [CrossRef] [PubMed]
- Zhou, H.; Liu, J.; Ou, S.; Gao, C.; Zhou, Y.; Shi, L.; Zhou, K. Impact of Effective Impervious Surface Disconnection on Urban Hydrographs: A Multi-Scenario Modeling Study at the Catchment Scale. J. Hydrol. 2024, 630, 130656. [Google Scholar] [CrossRef]
- Zhou, H.; Liu, J.; Ou, S.; Shi, Y.; Gao, C.; Shi, L.; Jin, C. A Multi-Criteria Analysis Framework for Water Transfers to Improve the Water Environments under Strong Artificial Interventions in Highly Urbanized Areas. Environ. Res. 2023, 220, 115244. [Google Scholar] [CrossRef] [PubMed]
- Bertels, D.; Meester, J.D.; Dirckx, G.; Willems, P. Estimation of the Impact of Combined Sewer Overflows on Surface Water Quality in a Sparsely Monitored Area. Water Res. 2023, 244, 120498. [Google Scholar] [CrossRef] [PubMed]
- Quaranta, E.; Fuchs, S.; Liefting, H.J.; Schellart, A.; Pistocchi, A. A Hydrological Model to Estimate Pollution from Combined Sewer Overflows at the Regional Scale: Application to Europe. J. Hydrol. Reg. Stud. 2022, 41, 101080. [Google Scholar] [CrossRef]
- Hou, X.; Qin, L.; Xue, X.; Xu, S.; Yang, Y.; Liu, X.; Li, M. A City-Scale Fully Controlled System for Stormwater Management: Consideration of Flooding, Non-Point Source Pollution and Sewer Overflow Pollution. J. Hydrol. 2021, 603, 127155. [Google Scholar] [CrossRef]
- Zan, R.; Blackburn, A.; Plaimart, J.; Acharya, K.; Walsh, C.; Stirling, R.; Kilsby, C.G.; Werner, D. Environmental DNA Clarifies Impacts of Combined Sewer Overflows on the Bacteriology of an Urban River and Resulting Risks to Public Health. Sci. Total Environ. 2023, 889, 164282. [Google Scholar] [CrossRef]
- Sojobi, A.O.; Zayed, T. Impact of Sewer Overflow on Public Health: A Comprehensive Scientometric Analysis and Systematic Review. Environ. Res. 2022, 203, 111609. [Google Scholar] [CrossRef]
- Jean, M.-È.; Morin, C.; Duchesne, S.; Pelletier, G.; Pleau, M. Real-Time Model Predictive and Rule-Based Control with Green Infrastructures to Reduce Combined Sewer Overflows. Water Res. 2022, 221, 118753. [Google Scholar] [CrossRef] [PubMed]
- Zeng, C.; Aboagye, E.M.; Li, H.; Che, S. Comments and Recommendations on Sponge City—China’s Solutions to Prevent Flooding Risks. Heliyon 2023, 9, e12745. [Google Scholar] [CrossRef]
- Fei, Y.; Rene, E.R.; Shang, Q.; Singh, R.P. Comprehensive Effect Evaluation of LID Facilities Implemented in Sponge Campuses: A Case Study. Ecol. Indic. 2023, 155, 110912. [Google Scholar] [CrossRef]
- Qiao, X.-J. Maintenance of Low Impact Development Facilities: A Case Study of Pilot Sponge Cities in China. J. Clean. Prod. 2023, 425, 139008. [Google Scholar] [CrossRef]
- van der Werf, J.A.; Kapelan, Z.; Langeveld, J. Real-Time Control of Combined Sewer Systems: Risks Associated with Uncertainties. J. Hydrol. 2023, 617, 128900. [Google Scholar] [CrossRef]
- Luo, H.; Oberg, N.; Landry, B.J.; García, M.H. Assessing the System Performance of an Evolving and Integrated Urban Drainage System to Control Combined Sewer Overflows Using a Multiple-Layer Based Coupled Modeling Approach. J. Hydrol. 2021, 603, 127130. [Google Scholar] [CrossRef]
- Wang, W.; Leitão, J.P.; Wani, O. Is Flow Control in a Space-Constrained Drainage Network Effective? A Performance Assessment for Combined Sewer Overflow Reduction. Environ. Res. 2021, 202, 111688. [Google Scholar] [CrossRef] [PubMed]
- Luo, X.; Liu, P.; Cheng, L.; Liu, W.; Cheng, Q.; Zhou, C. Optimization of In-Pipe Storage Capacity Use in Urban Drainage Systems with Improved DP Considering the Time Lag of Flow Routing. Water Res. 2022, 227, 119350. [Google Scholar] [CrossRef]
- Su, X.; Shao, W.; Liu, J.; Jiang, Y.; Wang, J.; Yang, Z.; Wang, N. How Does Sponge City Construction Affect Carbon Emission from Integrated Urban Drainage System? J. Clean. Prod. 2022, 363, 132595. [Google Scholar] [CrossRef]
- Zhuang, Q.; Li, M.; Lu, Z. Assessing Runoff Control of Low Impact Development in Hong Kong’s Dense Community with Reliable SWMM Setup and Calibration. J. Environ. Manag. 2023, 345, 118599. [Google Scholar] [CrossRef]
- Madrazo-Uribeetxebarria, E.; Antín, M.G.; Eguilegor, G.A.; Andrés-Doménech, I. Analysis of the Hydraulic Performance of Permeable Pavements on a Layer-by-Layer Basis. Constr. Build. Mater. 2023, 387, 131587. [Google Scholar] [CrossRef]
- Zhu, Y.; Xu, C.; Liu, Z.; Yin, D.; Jia, H.; Guan, Y. Spatial Layout Optimization of Green Infrastructure Based on Life-Cycle Multi-Objective Optimization Algorithm and SWMM Model. Resour. Conserv. Recycl. 2023, 191, 106906. [Google Scholar] [CrossRef]
- Li, S.; Wang, Z.; Wu, X.; Zeng, Z.; Shen, P.; Lai, C. A Novel Spatial Optimization Approach for the Cost-Effectiveness Improvement of LID Practices Based on SWMM-FTC. J. Environ. Manag. 2022, 307, 114574. [Google Scholar] [CrossRef] [PubMed]
- Chui, T.F.M.; Liu, X.; Zhan, W. Assessing Cost-Effectiveness of Specific LID Practice Designs in Response to Large Storm Events. J. Hydrol. 2016, 533, 353–364. [Google Scholar] [CrossRef]
- Zhi, X.; Xiao, Y.; Chen, L.; Hou, X.; Yu, Y.; Zhou, X.; Fu, Y.; Chen, B.; Shen, Z. Integrating Cost-Effectiveness Optimization and Robustness Analysis for Low Impact Development Practices Design. Resour. Conserv. Recycl. 2022, 185, 106491. [Google Scholar] [CrossRef]
- Zhang, K.; Chui, T.F.M. A Comprehensive Review of Spatial Allocation of LID-BMP-GI Practices: Strategies and Optimization Tools. Sci. Total Environ. 2018, 621, 915–929. [Google Scholar] [CrossRef] [PubMed]
- Bai, Y.; Li, Y.; Zhang, R.; Zhao, N.; Zeng, X. Comprehensive Performance Evaluation System Based on Environmental and Economic Benefits for Optimal Allocation of LID Facilities. Water 2019, 11, 341. [Google Scholar] [CrossRef]
- Wang, H.; Yan, M.; Gao, Y.; Wang, Y.; Dai, X. An Evaluation System for Assessing the Operational Efficiency of Urban Combined Sewer Systems Using AHP—Fuzzy Comprehensive Evaluation: A Case Study in Shanghai, China. Water 2023, 15, 3434. [Google Scholar] [CrossRef]
- Wang, H.; Zeng, P.; Liu, Z.; Li, W.; Zhou, J. Optimization of LID Strategies for Urban CSO Reduction and Cost Efficiency: A Beijing Case Study. Water 2024, 16, 965. [Google Scholar] [CrossRef]
- Zhang, Z.; Hu, W.; Wang, W.; Zhou, J.; Liu, D.; Qi, X.; Zhao, X. The Hydrological Effect and Uncertainty Assessment by Runoff Indicators Based on SWMM for Various LID Facilities. J. Hydrol. 2022, 613, 128418. [Google Scholar] [CrossRef]
- Sytsma, A.; Bell, C.; Eisenstein, W.; Hogue, T.; Kondolf, G.M. A Geospatial Approach for Estimating Hydrological Connectivity of Impervious Surfaces. J. Hydrol. 2020, 591, 125545. [Google Scholar] [CrossRef]
- Riaño-Briceño, G.; Barreiro-Gomez, J.; Ramirez-Jaime, A.; Quijano, N.; Ocampo-Martinez, C. MatSWMM—An Open-Source Toolbox for Designing Real-Time Control of Urban Drainage Systems. Environ. Model. Softw. 2016, 83, 143–154. [Google Scholar] [CrossRef]
- Yang, B.; Zhang, T.; Li, J.; Feng, P.; Miao, Y. Optimal Designs of LID Based on LID Experiments and SWMM for a Small-Scale Community in Tianjin, North China. J. Environ. Manag. 2023, 334, 117442. [Google Scholar] [CrossRef] [PubMed]
- Lisenbee, W.A.; Hathaway, J.M.; Winston, R.J. Modeling Bioretention Hydrology: Quantifying the Performance of DRAINMOD-Urban and the SWMM LID Module. J. Hydrol. 2022, 612, 128179. [Google Scholar] [CrossRef]
- Yang, J.; Xiang, Y.; Xu, X.; Sun, J. Design Hyetograph for Short-Duration Rainstorm in Jiangsu. Atmosphere 2022, 13, 899. [Google Scholar] [CrossRef]
- Keifer, C.J.; Chu, H.H. Synthetic Storm Pattern for Drainage Design. J. Hydraul. Div. 1957, 83, 1332-1–1332-25. [Google Scholar] [CrossRef]
- Ritter, A.; Muñoz-Carpena, R. Performance Evaluation of Hydrological Models: Statistical Significance for Reducing Subjectivity in Goodness-of-Fit Assessments. J. Hydrol. 2013, 480, 33–45. [Google Scholar] [CrossRef]
Disclaimer/Publisher’s Note: The statements, opinions and data contained in all publications are solely those of the individual author(s) and contributor(s) and not of MDPI and/or the editor(s). MDPI and/or the editor(s) disclaim responsibility for any injury to people or property resulting from any ideas, methods, instructions or products referred to in the content. |
© 2024 by the authors. Licensee MDPI, Basel, Switzerland. This article is an open access article distributed under the terms and conditions of the Creative Commons Attribution (CC BY) license (https://creativecommons.org/licenses/by/4.0/).