Abstract
Water, a fundamental and indispensable resource necessary for the survival of living beings, has become a pressing issue in numerous regions worldwide due to scarcity. Urban areas, where the majority of the global population resides, witness a substantial consumption of blue water, particularly in commercial buildings. This study investigates the potential for enhancing water efficiency within an ongoing high-rise office building construction situated in a tropical climate. The investigation utilizes the green building guidelines of leadership in energy and environmental design (LEED) through a case-study-based research approach. Strategies included using efficient plumbing fixtures (such as high air–water ratio fixtures and dual-flush toilets), the selection of native plants, implementing a suitable irrigation system, introducing a rainwater harvesting system (RWHS) and improving the mechanical ventilation and air conditioning (MVAC) system. The results showed a 55% reduction in water use from efficient fixtures, a 93% reduction in landscaping water needs and a 73% overall water efficiency with a RWHS from the baseline design. Additionally, efficient cooling towers and the redirection of condensed water into the cooling tower make-up water tank improved the overall water efficiency to 38%, accounting for the water requirements of the MVAC system. The findings of this study can contribute to more sustainable and water-efficient urban development, particularly in regions facing water scarcity challenges. The significance of these findings lies in their potential to establish industry standards and inform policymakers in the building sector. They offer valuable insights for implementing effective strategies aimed at reducing blue water consumption across different building types.
1. Introduction
Water scarcity has emerged as a significant impediment to the progress of socio-economic development and has endangered the means of living in expanding regions of the globe [1]. According to [2], around two-thirds of the world’s population (4.0 billion people) reside in areas where there is a significant shortage of water for a minimum of one month per year. Hence, water scarcity is a prevalent concern across much of the world, attributable to a multitude of factors such as population growth, urbanization, climate change and pollution. Therefore, implementing the water circular economy concept proves beneficial, as it conserves water through three approaches: (i) decreasing usage through avoidance, reduction and replacement; (ii) optimizing usage through reuse, recycling and cascading; and (iii) retaining water through storage and recovery [3].
As reported by Ding (2014), the building and construction industry consumes 15% of the total freshwater [4]. Buildings are primarily made of reinforced concrete or steel. Concrete manufacturing accounts for 9% of total industrial water demands and 1.7% of total global water withdrawals (water withdrawal (or water use) describes the total amount of water withdrawn from a surface water or groundwater source, while water consumption is the portion of the withdrawn water permanently lost from its source (e.g., evaporation, people and animal consumption, etc.) [5]) per annum [6]. Apart from the construction phase, buildings significantly contribute to water consumption throughout their post-occupancy period. A study conducted in 2014 examined 77,235 properties in Salt Lake City, Utah, USA, revealing that commercial properties ranked second in annual water consumption during post-occupancy, following apartments and preceding industries and schools in that order [7]. The recorded annual water consumption figures for these categories were 4513, 2142, 1398 and 1220 million gallons, respectively. In addition to the above, there are studies conducted all over the world in different periods. A separate study conducted in Europe revealed that, after the residential, retail and healthcare sectors, the highest water usage occurred in office buildings [8]. A comparable study was carried out in Australia by [9] in office buildings. Different research conducted by [10] examined the post-occupancy performance of 40 green-certified buildings in Beijing (comprising 27 offices, 11 residences and 2 shopping malls). The results show values of 0.3 in Europe, 0.4 to 3 in Australia, and 0.6 in Beijing in m³/year/m2.
In line with the above, a study conducted in a hot climate country; Abu Dhabi affirmed that 92.2% of the total water demand was attributed to buildings [11]. Meanwhile, [12] reported that water resources can be saved by preventing water pollution, implementing water harvesting techniques, finding seawater desalination solutions, recharging aquifers/groundwater and implementing water reuse technologies. As a result, it is vital to enhance water efficiency in buildings while also exploring alternative water sources to freshwater or ground and surface water. Alternatives include rainwater (green water footprint) and polluted water (greywater footprint) as described by [13] in a study conducted on the global water footprint of production from the year 1995 to 2005. They investigated global water footprints across the agricultural, residential and industrial sectors. The findings reveal that the use of green (rainwater), blue (ground and surface water) and grey (polluted water) water constitutes 79%, 11% and 10%, respectively, in agriculture. Meanwhile, in residential areas, the water footprint comprises 0%, 13% and 87%, and in the industrial sector, it is 0%, 10% and 90%. Notably, the findings highlight that green water consumption is negligible in the domestic and industrial sectors, suggesting a substantial potential for enhancing water efficiency in industry through the utilization of green water.
On the other hand, [14] stated that the expenditures of electricity, heating, gas, water and sewage disposal make up the majority of the utility costs in an office building in a case study conducted in Poland, a temperate country. A case study conducted by [15] in Indonesia (a tropical country) confirmed that the annual water consumption of an office building can be reduced from 124,200 m3/year to 19,320 m3/year by implementing a green approach, i.e., an 84% improvement in water consumption. In line with the above, [16] stated that green building construction is being implemented across different countries as a way of reducing the water footprint in addition to the energy consumption of the building. Furthermore, the review study confirmed that the reduction in the water footprint is about 20% in green buildings in comparison to the baseline building [16]. Furthermore, [17] already confirmed the aforementioned statement by conducting a study in Brazil using big data, which revealed the installation of dual-flush toilets, reuse of greywater and use of rainwater helped to reduce potable water consumption by 30%, 53.4% and 60.3%, respectively. Furthermore, the research confirmed that a substantial reduction in electrical energy consumption can be achieved by minimizing water usage.
Conversely, there are currently no established standards for the operation and post-occupancy assessment and mechanisms for users to supervise the actual performance of these green buildings [10]. As such, there is significant value in investigating the potential for water efficiency in a tropical setting through the adoption of sustainable practices to corroborate the findings of [15,17]. This study makes a crucial contribution by establishing the parameters for potential water efficiency during the design phase, enabling effective comparisons during the post-occupancy period. This case study action research addresses the notable lack of assessments on potential improvements from baseline to finalized design, complementing existing studies focusing solely on recorded water efficiency. Additionally, the findings will be applicable in reducing water consumption in hot humid climates during the post-occupancy period, which will subsequently help to lower the building’s total life cycle energy. Considering that 80–90% of the overall energy demand occurs during the operational phase [18], this research is particularly impactful.
The manuscript is organized as follows: First, the literature review covers potential strategies for improving water usage in commercial buildings. Next, the research methodology and approach for the case study are explained. The required data are then discussed and the study results are presented. These results are compared with the literature in the Section 6, followed by conclusions and recommendations based on the study findings.
2. Literature Review
Water consumption or withdrawals are indispensable for sustaining life and promoting progress worldwide [19]. Water consumption measurement involves calculating the quantity of water extracted from surface sources, such as rivers or lakes, and from underground aquifers. It also includes accounting for the water that is subsequently lost to the atmosphere through evaporation [20]. On the other hand, water withdrawal measures the amount of water taken from these sources, of which a portion may be returned to the system through leakage or return flows [1]. Ref. [2] conducted a noteworthy study that vividly depicted the severity of water scarcity. The researchers measured water scarcity by determining the ratio of the blue water footprint in a specific grid cell to the total blue water availability in that cell [21]. A grid cell is a geographic unit on the map where specific water-related metrics are evaluated to understand water scarcity across different regions. The blue water footprint refers to the volume of fresh surface water and groundwater that is withdrawn and not returned due to either evaporation or being incorporated into a product and is commonly referred to as “blue water consumption” or “net water withdrawal” [22]. The definition of blue water encompassed resources from aquifers, lakes, wetlands and impoundments (Xu, 2013, as cited by [23]. As outlined by [2], the global annual monthly blue water scarcity values display a spectrum extending from 0 to over 5, representing the highest values observed on a worldwide scale. Within South Asia, these values vary between 1.5 and over 5. To illustrate this, the tropical country of Sri Lanka has documented scarcity values ranging from 3 to 5 in its northern region, while the southern part has reported values ranging from 0.2 to 0.5 [2]. These values are changing in other tropical countries as well, such as 0.2 to 2 in Malaysia and 0 to 1.5 in Brazil.
In a commercial building, water is used for various purposes, each requiring different levels of quality. Since not all water use demands the same quality, effluent from one process can often be reused directly in another. This approach leads to significant savings in both treatment energy and costs. By considering the principle of the water quality cascade, [24] suggested different water sources for different purposes. The water quality cascade principle suggests a systematic approach to enhance water consumption efficiency in commercial buildings. This involves the reuse and recycling of water, allowing it to flow from one function to another in a strategic manner, optimizing its utility and minimizing wastage.
The literature includes a breakdown of water end-use in commercial buildings, derived from case studies. As per the literature, the primary non-potable water demand stems from cooling and heating systems, with toilet-flushing typically comprising half of the cooling water requirement and irrigation needs equating to half of the water required for flushing toilets [25]. The breakdown of water consumption in commercial buildings, including office buildings, is presented in Table 1, drawing from selected published sources. It is noteworthy that these values may exhibit slight variations based on climatic regions. Nevertheless, the substitution of potable water with rainwater or treated greywater, as proposed by [24], has the potential to fulfill about 50% of the water demand in commercial buildings. However, it should be noted that the feasibility of a rainwater harvesting system (RWHS) depends on several factors, including the capital cost and water price, as pointed out by [26].

Table 1.
Breakdown of water use in commercial/office buildings.
A significant literature review study conducted in Brazil, referencing publications from 2007 to 2017 on RWHSs, highlighted that despite the varying water availability in the country, the maximum water use for potable and non-potable as a percentage of total water use in office buildings was 30.4% and 69.6%, respectively [30]. This suggests significant potential for saving non-potable water use through RWHSs.
Similar to the above, several adaptive strategies have been initiated in the construction industry in order to increase the efficiency in water consumption during post-occupancy [31,32,33]. Figure 1 illustrates such strategies adopted and reported in the literature.

Figure 1.
Methodologies adopted to enhance efficiency in water consumption.
2.1. Rainwater Harvesting System (RWHS)
A review study conducted in a tropical climate by [34] confirmed that the rainwater harvesting system (RWHS) is more profitable when implemented on a large scale such as in commercial buildings compared to small-scale systems in a residential area. Rainwater harvesting (RWH), as defined by [35], refers to the practice of collecting and transferring rainwater from roof surfaces to storage facilities for future utilization. Confirming the results of [34], another investigation assessing the efficacy of rainwater harvesting systems across different scenarios affirmed the financial viability of investing in RWHS, as evidenced by a favorable net present value (NPV) [36]. Similarly, numerous studies within the literature have explored the technical and financial feasibility of RWHS and a few researchers have listed studies conducted in the literature on RWHS and its technical and economic feasibility, for example, [25,35]. Notable recent findings related to commercial buildings including office buildings are summarized in Table S1 in the Supplementary Materials—Literature Review. These findings confirm that the savings of non-potable water are significant, ranging from 12% to 100% across various geographical locations.
In addition to the RWHS, several strategies were implemented in commercial/office buildings scattered or together to enhance the efficiency of water consumption.
2.2. Utilization of Efficient Water Fixtures
Another approach, as presented in Figure 1 and recommended in the literature for enhancing water efficiency in buildings, involves the utilization of efficient water fixtures (low-flow showerheads and taps, low-flow toilets, dual-flush toilets). As outlined, the industry evaluates the efficiency of water products based on metrics such as the Australian National Construction Code (NCC) and the Water Efficiency Labelling and Standards (WELS) system [37]. A study conducted in Australia utilized end-use and stock modelling techniques to project water savings, indicating that adherence to WELS standards could yield savings of 1.6 m3/person/year by 2030, and 3.3 m3/person/year by 2040 [37]. This underscores the significant potential for water conservation through the adoption of efficient plumbing fittings and fixtures. For example, Ref. [31] verified that substituting conventional water fixtures with efficient ones can enhance the water efficiency of commercial buildings and that the payback period for the replacement cost is shorter for larger buildings. Consistent with the above, research conducted in Seattle and Florianópolis recorded the water conservation measures put into effect in these urban areas [38]. Seattle has implemented comprehensive water conservation programs, including incentives for water-efficient appliances, rainwater harvesting systems and public education campaigns on water conservation. In contrast, Florianópolis has some measures like rainwater reuse but lacks comprehensive programs. The city faces challenges in efficient water management, needing better infrastructure and policies. Efforts to promote efficient kitchen and medical equipment are limited and not widely enforced. Common to both cities, the initiatives encompass the utilization of water-efficient appliances like showers, toilets and washing machines, the recycling of water and the incorporation of rainwater usage. The study underscored the successful attainment of a 30% reduction in water consumption through the adoption of green building practices [38]. Further to the above, a study conducted in China in high-rise buildings confirmed that with the use of PRVs (pressure-reducing valves) branch pipes a water saving of about 19% can be achieved [39]. Selective studies confirmed the feasibility of the installation of efficient plumbing fixtures are presented in Table S2 in the Supplementary Materials—Literature Review. As per the results presented in Table S2, the water savings range from 2.7% to 50%.
2.3. Selection of Native Plants and Appropriate Irrigation Systems for Landscaping
Further to the above, enhancing landscaping through the careful selection of native plants and the implementation of suitable irrigation systems can result in water savings compared to conventional landscaping and irrigation methods. This effective landscaping approach is commonly referred to in the literature as waterwise landscaping. The concept of waterwise landscaping has a rich history. Denver introduced the Greek term “xeros” in the 1980s, referring to dryness in landscaping, which led to the establishment of what we now recognize as Xeriscaping, or low-water-use gardens [40]. Within Xeriscaping, Ref. [40] elaborates on seven principles, which involve selecting appropriate plants, designing efficient irrigation systems and implementing mulching to mitigate evaporation. The principles of xeriscaping provide practical insights into water-efficient landscaping practices. For example, efficient irrigation systems ensure that water is delivered directly to the roots of plants, reducing waste. Mulching minimizes evaporation and regulates soil temperature. Selecting appropriate plants significantly reduces the need for supplemental watering. A Xeriscape-type landscape can reduce outdoor water consumption by as much as 50% without sacrificing the quality and beauty of the garden [41]. Additionally, a study conducted in Iran through a questionnaire survey confirmed that all respondents preferred waterwise landscaping designs over those with higher water demands [42]. This underscores the feasibility of promoting waterwise landscapes without compromising aesthetics.
According to multiple studies, the potential water savings from replacing landscape plants with high water needs with those requiring less water can range from 18% to 50% [43]. Additionally, the United States Environmental Protection Agency affirms that substituting a standard clock timer irrigation system with a WaterSense labeled controller can reduce irrigation water usage by 15% [44]. Moreover, Ref. [45] reinforced the potential for outdoor water conservation through the utilization of readily available technologies such as soil moisture sensor systems (SMSs), evapotranspiration (ET) controllers, rainwater harvesting and smartscape design. Estimates of outdoor water savings were calculated employing Pettinger’s simplified landscape irrigation design equation (SLIDE). The reported average water savings ranged from 63% to 84% across the commercial, industrial and institutional sectors in five distinct climate regions of Texas. Details on the percentage of water savings and the payback period of waterwise landscaping from selected literature are presented in Table S3 in the Supplementary Materials—Literature Review. The results confirmed that water savings can range from 29% to 78% based on the plant, irrigation type and climate.
2.4. Utilization of Greywater
The utilization of treated greywater stands as one of the alternative approaches to alleviate the strain on water resources. Greywater constitutes 50% to 80% of the total wastewater volume globally [46]. Greywater can be categorized based on pollutant load into low pollutant load greywater (LGW), moderate pollutant load greywater (MGW), high pollutant load greywater (HGW) and mixed greywater, with mixed greywater being notably more contaminated than other types [47]. A review by [48] highlighted the challenges associated with greywater reuse, notably the health risks stemming from pathogenic microorganisms and the environmental risks posed by various pollutants such as sodium, pH and surfactants. The implementation of proper treatment processes would mitigate these challenges. A systematic and bibliographic study by [49] identified three primary treatment techniques employed in buildings: physical, chemical and biological.
Interestingly, a study conducted in office buildings in Baghdad, Iraq, to examine the production and reuse of greywater per employee revealed that hand-washing generates 4.8 and 3.2 L per day per employee for females and males, respectively [50]. Additionally, the demand for toilet-flushing stands at 12 and 6 L per day per employee for females and males, respectively. Since the water demand for toilet-flushing exceeds the production of treated greywater in these office buildings, Ref. [51] suggest integrating rainwater harvesting into the greywater reuse system. This integration can effectively reduce freshwater consumption, promote water conservation and minimize wastewater discharge into the environment, highlighting the significance of water efficiency measures. The same has been suggested by many researchers. For example, [52,53].
Among several research studies investigating the feasibility of greywater reuse for toilet-flushing, Ref. [54] conducted a case study to explore the viability of greywater recycling systems (GWRSs) for toilet-flushing as well as make-up water for cooling towers across four different building types. The results from the study indicate that the reuse of greywater is feasible for the various types of buildings and applications assessed and that it can lead to significant reductions in water consumption. Studies that examined the feasibility of greywater reuse systems, drawn from the available literature, are presented in Table S4 in the Supplementary Materials—Literature Review.
2.5. Other Strategies
There are several other strategies, such as continuous monitoring of water consumption and the use of efficient cooling towers, discussed in the literature. For example, Ref. [55] confirmed a 4.8% reduction in water consumption by implementing control strategies and cooling tower configurations. Similarly, Ref. [56] also confirmed that efficient cooling towers help reduce water consumption. Concurrently, some studies highlighted the importance of continuous monitoring for water savings by preventing leakages [32]. Furthermore, research has been conducted to investigate the impact of educational programs on water saving [57].
Within the literature, there exist studies that examine and contrast the most cost-effective approaches for conserving water in building structures. For instance, a case study conducted in a commercial building in Colombo, Portugal, a temperate region, scrutinized three strategies aimed at improving water efficiency [58]. These strategies included the substitution of traditional fixtures with more efficient fittings, the implementation of a rainwater harvesting system and the installation of a greywater reuse system to utilize a cooling tower purge water for toilet-flushing. According to the study, the highest water savings were achieved through the replacement of fixtures with more efficient fittings, although the payback period for this strategy was longer, exceeding 15 years. In comparison, the payback periods for the rainwater harvesting system and greywater reuse system were approximately 10 and 2 years, respectively. However, it is crucial to emphasize that the savings’ value and the corresponding payback periods are contingent upon factors such as the building’s type, retrofit costs, occupancy rates, local climate, tariff rates and other relevant considerations. For example, an analogous case study was carried out in Abu Dhabi (a hot climate country), to examine the effectiveness of Estidama Pearl (a green building rating system developed in Abu Dhabi by the urban planning council) and Leadership in Energy and Environmental Design (LEED) regulations in improving electricity and water efficiency [11]. The findings of the study revealed that the degree of water conservation ranged between 22% and 36%, depending on various factors such as the type of building and other parameters.
While the outcomes of water efficiency strategies may differ based on building types, climatic regions and economies, the literature consistently affirms positive results. Consequently, authorities in various geographic locations recommend and enact regulatory frameworks and policies to promote the construction of water-efficient buildings. The implementation of a water efficiency strategy has enabled certain municipalities to either sustain or decrease their residential and commercial water consumption [59]. Nevertheless, a qualitative study conducted in the UK revealed a consistent rise in water consumption within buildings, leading the researcher to stress the need for explicit guidance on water efficiency solutions, such as water recycling, reuse and building retrofits [60]. Progress in achieving this objective is evident in the literature. For instance, in accordance with Seattle’s policies and frameworks, buildings are required to incorporate efficient toilets, irrigation systems, kitchens, laundry equipment and rainwater reuse (water catchment, storage and usage of pluvial water) programs in order to enhance indoor water efficiency [38]. This indicates that no single method is sufficient; instead, the adoption of a combination of methods yields better results. On the other hand, Outdoor Water-use Restrictions (OWRs) seem to be a growing policy tool for demand-side management to control water usage in outdoor spaces in the USA [61].
Nevertheless, the majority of literature and the building industry predominantly concentrate on enhancing energy efficiency in buildings, often overlooking the equally important aspect of water efficiency. This oversight has been recognized by several studies, as evidenced by the research conducted by [62]. Therefore, it would be valuable to examine the potential for water efficiency in tropical climates by adopting a green approach to validate the findings in the literature. For instance, Ref. [15] reported an 84% improvement in water efficiency in office buildings located in the tropics, while Ref. [17] observed improvements of 30%, 53% and 60%, respectively, through the implementation of a dual-flush system and the reuse of greywater and rainwater. Also, it is crucial to define potential water efficiency benchmarks during the design phase for comparison during the post-occupancy period. While there are case studies examining recorded water efficiency, there is a lack of assessment regarding potential improvements from the baseline design to the actual design. This case study action research aims to address this critical gap in the literature. Further to the above, based on the findings of the literature, the current study hypothesizes that implementing green initiatives significantly enhances water consumption efficiency in office buildings during the post-occupancy phase, particularly in tropical climates and developing economies.
3. Methodology
3.1. Research Methodology
This study examines the potential water savings achievable during the post-occupancy period of office buildings in tropical climates by implementing green initiatives at the design stage. Specifically, it aims to determine the extent of water conservation possible through the application of efficient plumbing fittings, RWHS, GWRS, use of native plants and trees and suitable irrigation system as outlined in existing literature. Given the contemporary nature of the investigation and the lack of control over its outcome, the researcher has adopted the case study methodology, as recommended by [63].
According to Schramm (1971), the primary objective of a case study is to illuminate a decision or series of decisions by understanding the reasons behind them, their implementation and their outcomes [63]. This study illuminates the decisions to implement strategies for enhancing water efficiency in office buildings in tropical climates, understanding the reasons behind these decisions. It then implements the strategies and reports the outcomes. Thus, this study adheres to the stated objectives. The researcher investigated the potential for enhancing water consumption efficiency through green initiatives, as suggested by multiple case studies in the literature. The outcomes of these initiatives were then analyzed and presented. Given that the case study building includes multiple sub-units of analysis, the methodology of an embedded single case study was applied. This concept is illustrated in Figure 2.
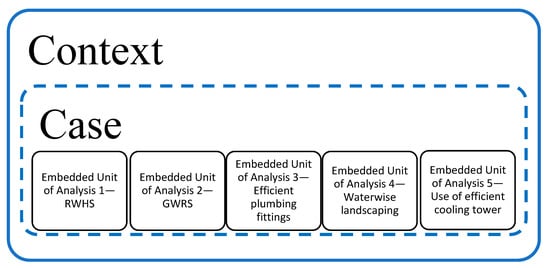
Figure 2.
Embedded single case study (adopted from [63]).
Given the adoption of the embedded single case study methodology, an analytic generalization approach was employed to generalize the study’s outcomes. This approach involves corroborating or reinterpreting the results of existing studies in light of the findings from the current research [63]. For example, previous studies found that implementing an RWHS in office buildings reduced water usage by 11% to 19% in Singapore, and 17% to 95% in Malaysia; this study might confirm or refine that finding based on its own results, demonstrating a similar or improved percentage of water conservation in tropical climates.
3.2. Overall Approach Used to Implement the Case-Study-Based Research
The researcher began by developing a hypothesis related to water usage in office buildings located in tropical climates. The hypothesis posits that water consumption can be reduced during post-occupancy by implementing strategies such as rainwater harvesting systems (RWHSs), greywater reuse systems (GWRSs), efficient plumbing fittings and fixtures, efficient cooling towers, appropriate irrigation systems and planting native plants for landscaping (waterwise landscaping). The unit of analysis for this study was determined to be the case study building, following a similar approach to that taken by other researchers [58,64]. Within this building, the researcher examined various strategies aimed at enhancing water consumption efficiency. These strategies include rainwater harvesting systems (RWHSs), greywater recycling systems (GWRSs), the installation of efficient plumbing units, the implementation of efficient irrigation systems and planting native plants and trees (adoption of waterwise landscaping) and the selection of efficient cooling towers for water saving. Each of these strategies is treated as a subunit of analysis within the same context. However, other strategies, such as continuous monitoring, were not considered as an embedded method, as they are not systems. Additionally, the results of selecting efficient cooling towers were evaluated along with the reuse of condensed water. Some of these strategies, such as efficient fittings and fixtures and dual-flush toilet systems, enhance indoor water efficiency, while the reuse of condensed water in cooling towers, suitable irrigation systems and native plants and trees for landscaping improve outdoor water efficiency. Implementing RWHSs can further enhance both indoor and outdoor water efficiency by connecting RWHSs for flushing and irrigation. The overall approach used to implement the case-study-based research is illustrated in Figure 3.
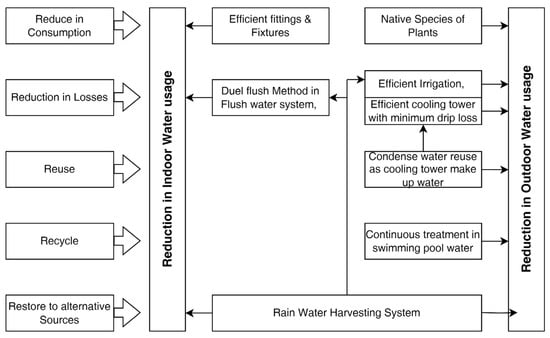
Figure 3.
Strategies adapted to enhance indoor and outdoor water efficiency in the building.
3.3. Methodologies Used to Improve Water Efficiency for the Case Study Construction Project
Water efficiency in a building can be achieved by applying the principle of the 5Rs: reduction in consumption, reduction in losses and waste, re-use, recycle and resort to alternative sources, as stated by [65]. These principles were incorporated into the LEED rating system [66]. Hence, the researcher deployed methodologies outlined in the LEED guidelines, as presented in Figure 3. A detailed description of each strategy to achieve the anticipated water consumption efficiencies in an office building in a hot, humid climate is provided below.
3.3.1. Implementation of RWHS as an Alternative Source of Potable Water
Based on the rainfall data in the area, the required rainwater tank was determined. The LEED specified two options for the calculations. Option 1 targets the use of percentile rainfall events and Option 2 targets the use of natural land-cover conditions. However, Option 2 requires measuring the annual increase in runoff volume on-site from the natural land-cover condition to the post-developed condition. Since these data are not available during the design stage, the design team selected Option 1 for convenience in calculating the optimum rainwater storage tank. The total volume of runoff was calculated using Equation (1) below. In calculating the surface runoff, the roof area and garden area were considered separately, but both surfaces were treated as concrete as per the design. According to LEED guidelines, the runoff coefficient for concrete is 0.95 [66].
3.3.2. Outdoor Water-Use Reduction
To achieve a reduction in outdoor water use, we implemented several strategies: efficient cooling towers, reusing condensed water in cooling towers, appropriate irrigation systems, using native plants and incorporating rainwater harvesting systems (RWHSs). As per the LEED guidelines, outdoor water reduction can be achieved by two means as listed below.
- Option 1. No irrigation required—Show that the landscape does not require a permanent irrigation system beyond a maximum two-year establishment period.
- Option 2. Reduced irrigation—Reduce the project’s landscape water requirement by at least 30% from the calculated baseline for the site’s peak watering month. Reductions must be achieved through plant species selection and irrigation system efficiency, as calculated by the Environmental Protection Agency (EPA) WaterSense Water Budget Tool.
Option 2, which involves reducing irrigation, was chosen for the action research case study because the designed landscape requires some amount of water throughout the building’s lifetime. Initially, the vegetated areas on the site layout plans were identified. Then, plants were carefully selected for these areas based on their intended function. To provide water for the landscape areas, a drip irrigation system was implemented. Several studies have confirmed that drip irrigation significantly reduces the water requirement for irrigation. For instance, a study carried out in a hot, humid climate (Dhaka, Bangladesh), demonstrated that using alternative methods could save 46% to 64% of water for any plant species compared to traditional irrigation [67]. Then, the baseline irrigation requirement was calculated, and the potential irrigation needs of the site were determined by collecting data on average monthly precipitation and evapotranspiration rates (ET0) specific to the project area. The baseline irrigation needs can be calculated by multiplying the landscape area by the peak watering month ET0. Subsequently, the irrigation requirement was optimized by replacing non-native plants with native species and those that thrive in the local environment. The irrigation needs for the designed landscape can be calculated by considering ET0 and the average rainfall of the peak watering month. The percentage reduction in water consumption from the baseline was calculated using Equation (2).
3.3.3. Indoor Water-Use Reduction
As per the LEED guidelines, by installing efficient fittings and fixtures (low- flow showerheads and taps, low-flow toilets, dual-flush toilets) water consumption was reduced from the baseline. The design team utilized a calculator provided by the USGBC to calculate the overall indoor water usage [68]. In addition to the above, the excess rainwater after irrigating the landscape was planned to be utilized for toilet-flushing which improves the portable water efficiency further.
3.3.4. Greywater Reuse System
Further to the above, steps were taken to reduce the water loss in cooling towers in the MVAC system after carefully studying the possible causes of water loss as listed below.
- (A)
- Reuse of condensed water in cooling towers make-up water (GWRS).
- (B)
- Reduction in water loss in cooling towers.
The total water savings can be calculated using Equation (3).
Many studies outlined in the literature have utilized the mentioned approaches either independently or in combination. In a study conducted in Portugal, Ref. [69] employed a comparable approach by installing efficient fixtures to reduce water consumption. The research investigated the water consumption of intermediate-level houses, comparing those equipped with efficient and conventional fixtures using 73,000 inhabitants in a municipality area. Further to the above, Ref. [11] adopted the Estidama and LEED approaches in investigating energy and water efficiency in buildings located in hot climates. The study thoroughly evaluated water consumption levels in the end-use segment undertaken by conducting a water-use analysis on selected representative buildings in Abu Dhabi. The objective of these analyses was to estimate the present consumption levels in existing buildings and anticipate changes following the adoption of the Estidama Pearl Rating System. The Estidama Pearl Rating System, developed by the United Arab Emirates, is a building rating system that promotes the development of sustainable buildings. A similar methodology was adopted by [58] in investigating water efficiency in commercial buildings in Portugal. The current study integrates all these approaches to optimize water consumption in office buildings in hot, humid climates during the post-occupancy phase.
3.4. Description of the Case Study Building Construction Project Used for Water Efficiency Improvement
The case study building is situated within a tropical region, where the prevailing climate is characterized by warmth and humidity. Surface air temperatures fluctuate between 29.7 °C and 32.10 °C for the maximum and 21.6 °C to 24.6 °C for the minimum throughout the year, based on data spanning from 1901 to 2021 [70]. Relative humidity levels range from 70% to 80% during the day and from 85% to 90% at night, according to data collected between 1990 and 2020 [71].
The primary purpose of the building is to provide office spaces for rent. The structure comprises 4 basement levels dedicated to services and parking, 2 levels encompassing commercial areas (ground and upper ground), 7 elevated parking floors, 22 floors designated for offices, 1 floor dedicated to recreation, and finally, a rooftop restaurant and club. The total floor area of the proposed building is approximately 45,000 m2. It is estimated that the building will accommodate a population of around 1500 individuals including visitors: 324 per day. A typical floor layout and the front elevation of the proposed office building is presented in Figure 4.

Figure 4.
Typical floor layout and front elevation of the building.
4. Data Collection
In the subsequent sections of this study, a detailed breakdown of the data sources and their respective contributions will be provided. This includes insights into the methodology employed for data collection, the specific agencies or organizations from which data were obtained and the relevance of each dataset to the analysis.
4.1. Rainwater Harvesting System
Historical rainfall data for the local areas were collected from the Department of Meteorology of Sri Lanka from 2008 to 2019 [72]. The land and roof areas were obtained from the land survey and building plans, respectively. The total land area of the project was 2155 m2, with 65% of the land being covered by the building.
4.2. Outdoor Water-Use Reduction—Option 2: Reduced Irrigation
In order to calculate the baseline water need, average monthly precipitation (rainfall) data were collected from the [73] and average monthly evapotranspiration rates, which include both the evaporation of water from surfaces and the transpiration of water from plants, were calculated using the “Food and Agriculture Organization of the United Nations—Evapotranspiration (ETo) Calculator” which was provided on the USGBC website [74]. The climatological data rely on monthly averages spanning the 30-year period from 1961 to 1990. The data file for Colombo, Sri Lanka, which is needed for the ET0 calculator was extracted from the “CLIMWAT climatic database” published by the [75]. The CLIMEWAT data encompass the timeframe from 1971 to 2000.
In order to determine the case study irrigation need, plant types and vegetation areas were taken from landscape and architectural drawings. The method of irrigation was reviewed and confirmed from irrigation drawings.
4.3. Indoor Water-Use Reduction
In order to calculate indoor water usage, the following data were collected in consultation with the design team and the developer of the commercial building.
- Building occupancy.
- Gender ratio.
- Days of operation.
- Fixture types used in the project.
The fittings and fixtures installed were efficient in water consumption. All toilets have dual flushing with a water usage of 0.95 gallons per flush. The flow rates of the showers and basin taps/mixers are 1.1 and 0.32 gallons per minute, respectively. The urinals use 0.13 gallons per flush. Table 2 provides a detailed breakdown of the maximum occupancy levels across various areas of the building, along with the corresponding time periods of occupation within a week. This detailed breakdown enables an understanding of the building’s usage patterns and the flow of activities across various sections. By considering occupancy levels, it becomes possible to ascertain the total water demand for different activities. The occupancy gender ratio was determined based on data from the [76], which indicates an equal male-to-female ratio in the service sector in Sri Lanka.
Table 2.
Building occupancy data.
5. Results of the Analysis
As outlined in the methodology, the action research conducted in the case study employed five strategies aimed at improving the efficiency of water consumption in the office building. These strategies encompassed all feasible methods for effectively utilizing portable water and maximizing the utilization of alternative water sources. The subsequent sections delve into the results obtained from each strategy implemented to enhance water usage efficiency in the case study building.
5.1. Implementation of a Rainwater Harvesting System
Based on the historical rainfall data (from 6 May 2008 to 28 April 2018), the results of the calculated percentile rainfall values are shown below in Figure 5. The rainfall at the 95th percentile is 63.6 mm and is used for determining the tank capacity for rainwater collection [66]. The total volume of runoff was calculated using Equation (1), and the total volume of runoff is estimated as 130.21 m3. In the above calculation, the roof area was used to determine the volume of rainwater collected on the rooftop, and the garden area was used to calculate the volume for the groundwater collection tank. However, it should be noted that rainfall from an additional area at ground level is collected due to the topography of the land, which is approximately equivalent to the vegetation on the ground level. The garden consists of concrete surfaces and concrete paving. In the calculation, the surface runoff coefficient was taken as 0.95 for concrete [66,77]. Hence, the volume of the roof and ground rainwater tank sizes were determined as 45 m3 and 90 m3 of which the summation is slightly higher than 130 m3.
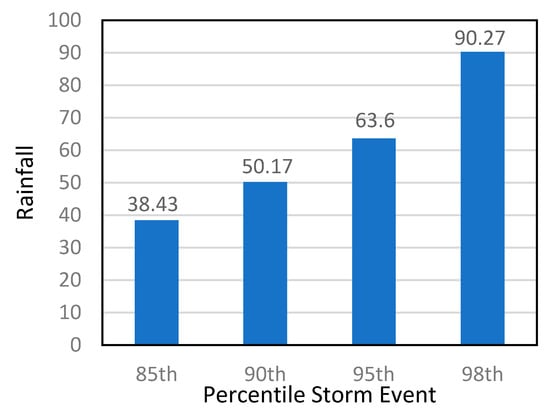
Figure 5.
The total rainfall values at different percentile storm events.
5.2. Outdoor Water-Use Reduction
The peak watering month at the project location was ascertained by using monthly rainfall and evapotranspiration data, and the result of the baseline water requirement is presented in Figure 6 below. Rainfall data covering the years 2008 to 2019 were utilized to calculate the monthly average rainfall for a landscape area of 1481.8 m2. Monthly average ET0 data were determined using information from a 30-year period spanning from 1961 to 1990. ET0 represents an evapotranspiration rate from a consistently well-watered, large uniform grass field (reference surface), with the crop covering the soil, maintained short and nurtured under optimal agricultural conditions [75]. According to Figure 6, the peak watering month is January and the peak watering demand is 72 mm. Moreover, the landscape water allowance is 135,051 L/month and the landscape water baseline is 192,930 L/month. Both the landscape water allowance and landscape water baseline were determined based on the ET0 value for the peak watering month. The peak watering ET0 is 130.2 mm.
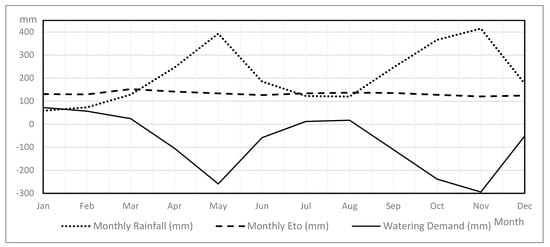
Figure 6.
Baseline water requirement.
The required water demand for the case study was optimized dramatically by altering the irrigation demand through carefully selecting plants that do not require much water to survive and are appropriate for their intended uses. The schedule of selected trees is presented in Figure 7 including the heights and canopy areas. There are six types of trees (T1 to T6) and five types of plants (P1 to P5) selected for the case study building. The details of the vegetation areas are presented in Table 3. The highest vegetation footprint is located on the ground floor and is 303 m2. The reasons for selecting the above-stated plans and trees are supported by the literature and presented in the Supplementary Materials—Table S5. All the selected trees; Calophyllum Inophyllum, Ficus Lyrata, Barringtonia and Plumeria are drought-tolerant and can survive for several months without water. Additionally, the five selected plants flower reasonably throughout the year and are well-suited to a hot, humid climate.
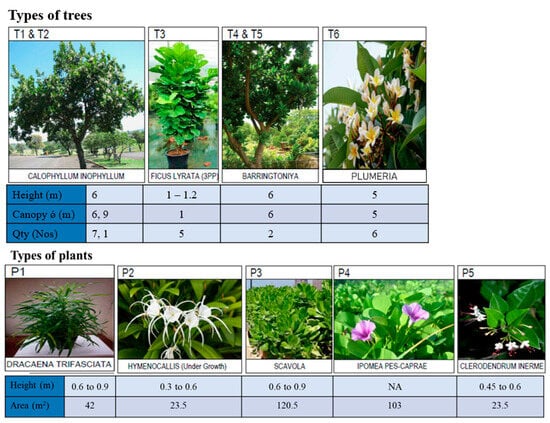
Figure 7.
Schedule of trees and plants and vegetation coverage.
Table 3.
Open-to-sky vegetation footprint area.
The landscaping layout differs on every floor of the building. The arrangement of trees and plants on the ground floor is illustrated in the Supplementary Materials—Figure S1. This layout not only enhances the building’s aesthetics but also helps to collect surface runoff, reducing water-related issues like soil erosion and waterlogging. The strategic placement of vegetation provides natural shade, improves air quality and promotes biodiversity, contributing to both visual appeal and sustainability.
The water demand for the landscape is presented in Table 4. The landscape water need was calculated using the area of the landscape, rainfall, ET0, landscape coefficient and distribution uniformity. Considering daily weather conditions and the plants’ water requirements (low/medium/high), the monthly average ET0 value is determined and a landscape coefficient is allocated (0.2/0.5/0.9). A sample calculation of landscape water requirement presented in the Supplementary Materials. According to the findings in Table 4, trees categorized as Types 1 and 2 do not require any irrigation due to their drought-resistant nature, while the remaining trees collectively demand 2901 L/month. The Type 1 and Type 2 trees are Calophyllum Inophyllum, a hardy tree native to tropical coastal areas that can survive wind, salt spray and drought [78]. It is worth noting that 50% of the proposed trees belong to Types 1 and 2, significantly reducing the overall irrigation needs of the garden. Additionally, the total irrigation requirement for plants is 10,822 L/month, covering a 379 m2 area across various floor levels of the building. This translates to an irrigation rate of only 28 L/m2/month for the plants.
Table 4.
Case study landscape water requirement.
By utilizing the baseline irrigation water demand (192,930 L/month) and the designed landscape water demand (13,723 L/month), the percentage reduction in water consumption was calculated using Equation (2) and found to be 93%. Equation (2) shows the percentage by which water usage for the landscape has been reduced due to the implementation of water-saving measures.
Determination of the rainwater tank capacity was based on the rainfall value of the 95th percentile and the roof area, resulting in a capacity of 131,000 L. Similarly, using the monthly average rainfall and the roof area, the average monthly rainwater availability was determined to be 153,900 L. Thus, there exists an excess volume of rainwater available after irrigation use, totaling 117,277 L/month. This surplus water can be utilized for toilet-flushing, as discussed in the following section.
5.3. Indoor Water-Use Reduction
This was achieved by implementing three strategies; the use of efficient fittings and fixtures, the use of rainwater for the flush water system and the reduction in water loss in the MVAC system.
5.3.1. Use of Efficient Fittings and Fixtures
The proposed fixtures have flush/flow rates that do not exceed the WaterSense maximum levels as presented in Table 5. For example, the maximum flow rates allowed by WaterSense for products are 2 gpm for showers and 0.5 gpf for urinals [43]. All the proposed product categories exceed the 20% reduction.
Table 5.
Flush and flow rates of selected fittings and fixtures.
The water consumption for both the baseline and case study scenarios was determined by analyzing the building occupancy data along with the flush and flow rates of the fittings and fixtures. The calculated annual water consumption is provided in Table 6. Water consumption has decreased from 2,126,480 gallons per year to 946,445 gallons per year, representing a 55% reduction in the proposed building.
Table 6.
Annual water consumption for the baseline and the case study design.
5.3.2. Use of Rainwater for the Flush-Water System
Connecting the excess rainwater storage (117,277 L/month or 3,717,756 gallons/year) to the flush water system further enhances the efficiency of water usage. The total water savings can be calculated using Equation (3). Since the baseline water need (2,126,479 gallons/year) remains unchanged, the case-study municipal water usage is reduced from 946,444 gallons/year to 574,669 gallons/year. Hence, in this study, the total water savings amount to 72.92%.
5.3.3. Indoor Water Loss Reduction in MVAC System
The condensed water from each FCU and AHU was collected on each floor, as shown in Figure 8, and diverted to the cooling tower make-up water tank. The calculation of the cumulative condensed water collection from each FCU, FAHU and AHU for the building’s maximum cooling load was derived from the simulated cooling load of the building, resulting in a value of 0.266 L/S. The condensed water flow rates vary for each piece of equipment since their capacities differ. These findings are detailed in Table 7.
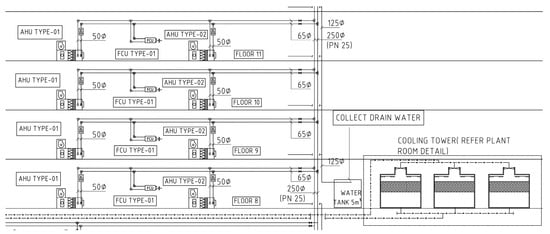
Figure 8.
Network of drain water from AHUs and FCUs—Cross-sectional view.
Table 7.
Calculation of the volume of condensed water.
In addition to the above, the design team focused on reducing other water losses in the cooling tower system such as drift, blowdown, windage and leakages. The efficient cooling towers were selected with a drift loss of less than 0.005%. We introduced a side-stream filtration system to help to remove suspended solids and impurities from the cooling tower water which reduces the buildup of contaminants and minimizes the blowdown (purge) requirements. We introduced an effective chemical dosing system which can help to control the concentration of dissolved solids and prevent scaling and fouling in the cooling tower. By maintaining cleaner system surfaces, the need for blowdowns can be reduced. Steps were taken to eliminate windage loss by preventing strong wind blows across the cooling towers.
The overall water loss attributed to the cooling tower operation amounts to less than 1% of the condensed water flow rate. As a result, the total water loss or make-up water required for the cooling tower system during the building’s peak cooling load is determined to be 47,315 L per day. This water loss calculation specifically pertains to the building’s cooling load from 7:30 AM to 5:30 PM on 15 May. The results are presented in Table 8. The peak water loss occurred between 11:30 and 14:30, coinciding with the period of the highest recorded cooling load during the day.
Table 8.
Total water loss from the operation of cooling towers.
The calculation of condensed water accumulation from the building’s maximum cooling load was also performed for the data from 15 May. Specifically, during the period from 7:30 AM to 5:30 PM, the volume of condensed water collected from the operational MVAC system amounts to 8947 L. This calculation is based on the moisture levels and airflow rates at the air intake and exit coils of each FCU or AHU, which depend on the dry and wet bulb temperatures during operation. In line with the results presented in Table 8, the highest volume of condensed water was collected from 11:30 AM to 2:30 PM. The results are presented in Table 9. Consequently, the estimated water conservation rate in the upgraded MVAC system is 19%, excluding the savings derived from employing efficient cooling towers. The monthly make-up water (the amount of water required to refill the cooling tower due to evaporation, blowdown and drift) requirement and condensate water collection are presented in Figure 9. Figure 9 clearly illustrates that the water loss in the cooling tower for 25 days of operation each month is around 1 million liters. It also shows that a significant volume of water can be added to the cooling tower make-up water, amounting to 25,000 L over 25 days of operation per month. Therefore, the calculation of the water savings volume and cost savings resulting from the implementation of the aforementioned green measures can be performed and is presented in Table 10.
Table 9.
Collection of condensed water volume calculation.
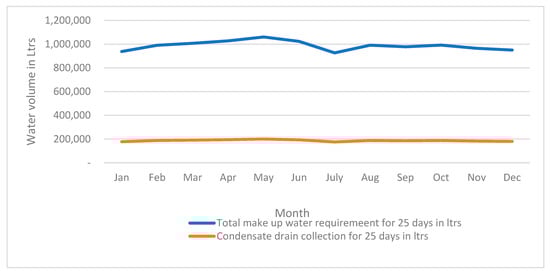
Figure 9.
Plot of make-up water need and condensate water collection.
Table 10.
Annual savings from water consumption.
The research yielded comprehensive findings on water consumption and efficiency metrics by comparing a baseline scenario (according to [66]) with a specific case study, as shown in Table 10 and Figure 10. In the baseline scenario, water consumption was notably higher across all categories: outdoor (landscape) usage totaled 192,930 L per month, indoor usage reached 670,800 L per month and the MVAC system contributed 1,182,867 L per month, resulting in a total of 2,046,597 L per month. In contrast, the case study demonstrated significant reductions in water consumption: outdoor usage decreased to 13,723 L per month, indoor usage to 298,557 L per month and MVAC system usage to 959,197 L per month, totaling 1,271,477 L per month. The study also calculated water efficiency metrics, revealing that excluding the MVAC system, the efficiency reached 72.92%, whereas, including the MVAC system, the efficiency was 37.87%. The financial implications were also analyzed, showing that the case study achieved savings equivalent to 775 units of water per month. Considering a tariff rate of 150 Sri Lankan Rupees per liter, the cost savings translated to 790 per month and 9496 per annum in USD, underscoring the economic benefits of improved water management practices in the studied context. The above results are graphically presented in Figure 10, which clearly shows the percentage of water savings from each strategy. The highest water savings, 93%, were achieved through waterwise landscaping (the use of native plants and drip irrigation). However, the volume of water saved through landscaping is not as significant compared to the use of efficient fittings and fixtures and the use of condensed water in an efficient cooling tower. The graph also illustrates that the highest water consumption was recorded in the MVAC system, emphasizing the need for attention to MVAC systems in tropical settings.
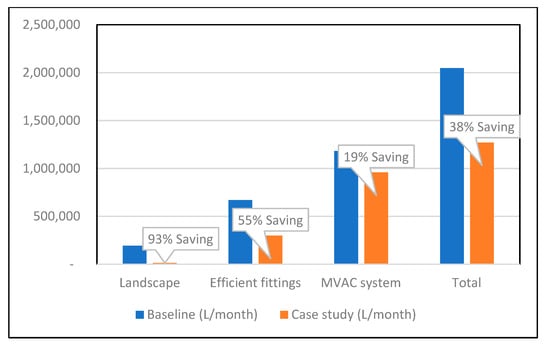
Figure 10.
Improvement in water consumption from baseline design to case study design.
6. Discussion
To determine the overall impact, it is necessary to compare the benefits of implementing water-saving measures in case studies with the additional costs incurred during design, construction and maintenance. To assess the additional expenses incurred by implementing the green strategies aimed at reducing water consumption in this action research, it is necessary to determine the costs associated with the following items.
- Cost of construction of rooftop rainwater harvesting tank and the related rainwater collected system. However, the cost reduction in the reduced capacity of the water tanks is to be considered to ascertain the net impact. Furthermore, it should be noted that the cost of installation of a rainwater treatment plant and its maintenance cost include chemical costs.
- Cost of construction of a separate flush water network.
- Cost of construction of a ground water tank and its operational and maintenance cost. However, the reduction in the capacity of the water sump is to be considered to ascertain the net impact.
- Incremental cost of fittings and fixtures.
- Cost of construction of a condensed water network in collecting and diverting to a cooling tower make-up water tank from each AHU and FCU located on each floor. However, it should be noted that the condensed water from AHUs and FCUs should be taken out from each floor.
- Cost of installation and maintenance of the chemical dosing system to treat the condensed water of the cooling tower system.
The examination of the results from the life cycle analysis is essential to accomplish this objective. However, Ref. [58] noted a lack of available information in the literature regarding the life cycle cost of water efficiency measures and the level of water efficiency performance. Moreover, the amount of additional investment depends on several factors such as the type of building, project location, local climate, site circumstances and the familiarity of the design team [79]. A study conducted in Israel on commercial buildings confirmed that an additional investment for water savings is returned within two years in a small building and within one year in a large one [80] according to a life cycle analysis. Nevertheless, a significant study undertaken by [81] emphasized that a substantial 85% of a facility’s lifecycle cost is incurred during its operational phase, rather than during construction. As a result, this action research case study prioritized identifying savings during the operational phase and did not specifically calculate incremental investments. The implementation of various measures to enhance water efficiency, including the introduction of an RWHS, the installation of efficient fittings and fixtures, the careful selection of suitable trees, plants and irrigation systems and enhancements in the MVAC (mechanical ventilation and air conditioning) system in commercial buildings, was validated by this action research case study. The study confirmed significant water savings resulting from these measures.
Ref. [69] confirmed that by using efficient products, water savings can be achieved at approximately 45% in a study conducted in Portugal. The above study reported that to address hydric stress, a Portuguese non-governmental organization, the National Association for Quality in Building, implemented a voluntary certification system for water-efficient products. The program encouraged replacing conventional water fittings with efficient fittings (labeled as A, A+, A++ based on their water usage) such as showers, taps and toilet flushes. A similar study conducted for residential buildings by [82] also confirmed a 50% saving by using efficient faucets (taps and mixers). This action research case study confirmed the above findings, showing 55.49% savings in water consumption only by using efficient fittings and fixtures.
In addition to the aforementioned points, there have been studies conducted to examine the challenges and advantages of implementing RWHSs. One such study by [34] emphasizes that bill savings are among the primary benefits that building owners can enjoy through the implementation of RWHSs. Furthermore, there are several other advantages, including mitigating flush floods and potentially delaying the need for new water distribution infrastructure which will be beneficial to society at large. Another case study carried out to assess the effectiveness of implementing large-scale rainwater harvesting (LSRWH) in a community comprising 200 houses confirmed a substantial water saving of up to 58% in Malaysia [83]. By integrating an RWHS into the building’s flush water system, this action research case study significantly improved water efficiency, increasing it from 55% to 72.92%, representing a 17.92% improvement, i.e., a 17.92% saving was achieved by utilizing rainwater in toilet-flushing. Similar results have been reported in Singapore and Malaysia, with savings of 12.4% and 43%, respectively [35,84]. Moreover, studies have confirmed a reduction in water consumption in buildings through the implementation of waterwise landscaping (using native plants and appropriate irrigation). For example, Ref. [45] reported reductions of 63% to 84% across five distinct climate regions in Texas. The current study reported a 93% saving by utilizing the same strategy in Colombo. Furthermore, many studies have confirmed that reusing condensed water from AHUs and FCUs can compensate for the make-up water needed in cooling towers [85,86,87]. Some studies have even reported the percentage of water savings achieved by reusing condensed water. For example, a study conducted in Singapore reported a 52.3% saving [88]. However, the current study conducted in Colombo confirmed a 19% saving.
The techniques employed to decrease water consumption are commonly associated with green or sustainable building designs. Various green certification systems exist worldwide to support these efforts. In a case study conducted using the EDGE green building application, Ref. [89] confirmed 51.11% savings from the water category in a school building in Egypt including condensate water recovery from an MVAC system. Another study conducted in Indonesia compared the possible water savings by adopting green building features and confirmed 84% savings [15]. Similarly, in alignment with the aforementioned study, the current case study utilized the LEED application and verified improved water savings of 38% for an office building located in the tropical climate of Colombo including condensate water recovery from an MVAC system. Nevertheless, the present case study observed a significant decline in water efficiency when accounting for the quantity of water consumed in both the make-up water demand and the conservation resulting from condensate water derived from the MVAC system. This decline can be attributed primarily to the improved efficiency of the MVAC system, which yielded a water efficiency rate of only 19%. Additionally, the investigation revealed that the MVAC system exhibited the highest water consumption when compared to the water requirements for indoor use and landscape irrigation. Nevertheless, it is crucial to acknowledge that certain studies in the existing literature have affirmed the potential for a substantial average reduction of around 20% in the water footprint through the implementation of green techniques [16].
While most scholars focus on determining the percentage of water consumption savings achieved through the implementation of green applications, Ref. [90] emphasized the significance of integrating Building Information Modeling, the Internet of Things and Facility Management (BIM-IoT-FM) to identify potential water saving opportunities. Their study highlighted that the central market of Belo Horizonte, Brazil, exhibited a potential 15% reduction in water consumption during operation.
Apart from the savings achieved through reduced water quantities, the decrease in water volume also has an impact on reducing energy consumption [69,82]. Although the current case study did not specifically calculate energy savings, the researchers involved in this study unanimously agree that the reduction in water consumption will inherently result in reduced energy usage. This can be attributed to factors such as decreased pumping and heating requirements, as well as a reduced need for chemical treatments. Hence, future studies that quantify the energy savings resulting from water conservation will be valuable in promoting sustainable development.
7. Conclusions
Water is primarily essential in commercial buildings for the purposes of occupants’ consumption, irrigation, toilet-flushing and operating the MVAC system. Given the scarcity of available blue water and the rising costs associated with potable water, building designers have responded by devising water-saving measures and integrating them into commercial buildings. Hence, the current study employed a case study action research methodology to investigate the potential water savings in an office building located in a tropical climate. The case study research has validated that a judicious selection of plants and trees for landscaping along with a suitable irrigation system can reduce to irrigation water requirements by an impressive 93%. Furthermore, this study emphasizes the substantial improvement of water efficiency, amounting to 55.49%, achieved through the installation of efficient plumbing fittings and fixtures in the examined office building. Most importantly, the introduction of an optimum RWHS will improve the overall water efficiency to 72.92% for the case study office building. Additionally, the incorporation of efficiency measures in the MVAC system plays a crucial role in achieving significant water savings. These measures encompass the utilization of condensed water obtained from Air-Handling Units (AHUs) and Fan Coil Units (FCUs) for cooling tower make-up, the careful selection of cooling towers with minimal drift loss (0.005%) and the treatment of condensed water to reduce the frequency of blowdown. As a result of this action research case study, approximately 20% of water is conserved through the reuse of condensed water collected from AHUs and FCUs as make-up water for the cooling tower. As a result, the overall efficiency achieved by these strategies amounts to 38%, leading to significant savings during the operational phase. The significance of this study is its potential to promote sustainable and water-efficient urban development, especially in areas with water scarcity issues.
8. Recommendations
The results of the case study can be used to propose a benchmark for water consumption in commercial buildings and recommend several actionable policy measures to promote water conservation. These measures include updating building codes to mandate the use of water-efficient fixtures, RWHSs, GWRSs and waterwise landscaping in new constructions. It also suggests retrofitting existing buildings using the provided guidelines and timelines. Additionally, offering tax rebates and subsidies to encourage the adoption of water-efficient appliances and implementing a tiered pricing structure to incentivize reduced water usage are recommended. Furthermore, setting consumption caps for commercial buildings and imposing penalties for exceeding these limits can further incentivize efficient water-use. The study also advises conducting awareness-raising campaigns through educational programs, workshops and public recognition initiatives to promote efficient water-use and conservation practices among businesses.
Further to the above, this action research study recommends extending future case studies in calculating the incremental investment in order to investigate the net impact.
Supplementary Materials
The following supporting information can be downloaded at: https://www.mdpi.com/article/10.3390/w16172396/s1, Figure S1: Landscape at ground level; Table S1: Feasibility of RWHS in commercial/office buildings; Table S2: Feasibility of efficient fixtures in commercial/office buildings; Table S3: Feasibility of use of waterwise landscaping in commercial/office buildings; Table S4: Feasibility of use of greywater in commercial/residence buildings; Table S5: Rationale for the Chosen Trees and Plants; References [91,92,93,94,95,96,97,98,99,100,101,102,103,104,105,106,107,108,109,110,111,112] are cited in the Supplementary Materials.
Author Contributions
Conceptualization, R.M.C.R.; Writing—original draft, A.C.H.J.T.; Supervision, S.M.S.M.K.S. All authors have read and agreed to the published version of the manuscript.
Funding
This research received no external funding.
Data Availability Statement
Data is contained within the article and Supplementary Materials.
Conflicts of Interest
Author A.C.H.J. Thebuwena was employed by the company Gall Face Properties Limited. The remaining authors declare that the research was conducted in the absence of any commercial or financial relationships that could be construed as a potential conflict of interest.
References
- Liu, J.; Yang, H.; Gosling, S.N.; Kummu, M.; Flörke, M.; Pfister, S.; Hanasaki, N.; Wada, Y.; Zhang, X.; Zheng, C.; et al. Water scarcity assessments in the past, present, and future. Earth’s Future 2017, 5, 545–559. [Google Scholar] [CrossRef]
- Mekonnen, M.M.; Hoekstra, A.Y. Four billion people facing severe water scarcity. Sci. Adv. 2016, 2, e1500323. [Google Scholar] [CrossRef]
- Peydayesh, M.; Mezzenga, R. The circular economy of water across the six continents. Chem. Soc. Rev. 2024, 53, 4333–4348. [Google Scholar] [CrossRef]
- Baynes, T.M.; Crawford, R.H.; Schinabeck, J.; Bontinck, P.-A.; Stephan, A.; Wiedmann, T.; Lenzen, M.; Kenway, S.; Yu, M.; Teh, S.H.; et al. The Australian industrial ecology virtual laboratory and multi-scale assessment of buildings and construction. Energy Build. 2018, 164, 14–20. [Google Scholar] [CrossRef]
- World Resources Institute, What’s the Difference Between Water Use and Water Consumption? Available online: https://clarity.ai/research-and-insights/climate/understanding-the-impact-of-water-water-consumption-vs-water-withdrawal/ (accessed on 21 January 2024).
- Miller, S.A.; Horvath, A.; Monteiro, P.J. Impacts of booming concrete production on water resources worldwide. Nat. Sustain. 2018, 1, 69–76. [Google Scholar] [CrossRef]
- Stoker, P.; Rothfeder, R. Drivers of urban water use. Sustain. Cities Soc. 2014, 12, 1–8. [Google Scholar] [CrossRef]
- Statista Research Department, Water Consumption of the Real Estate Sector in Europe in 2020, by Building Type. Available online: https://www.statista.com/statistics/1312154/water-intensity-of-real-estate-by-type-europe/ (accessed on 21 June 2024).
- Bannister, P.; Munzinger, M.; Bloomfield, C. Water Benchmarks for Offices and Public Buildings. Department of Environment and Heritage. Canberra Australia. September 2005. Available online: www.deh.gov.au (accessed on 8 August 2023).
- Zhou, H.; Zhao, Y.; Zhang, Z.; Geng, Y.; Yu, J.; Lin, B. Post occupancy investigation of 40 certified green buildings in Beijing: Results, lessons and policy suggestions. J. Build. Eng. 2022, 60, 105153. [Google Scholar] [CrossRef]
- Assaf, S.; Nour, M. Potential of energy and water efficiency improvement in Abu Dhabi’s building sector–Analysis of Estidama pearl rating system. Renew. Energy 2015, 82, 100–107. [Google Scholar] [CrossRef]
- Belhassan, K. Water scarcity management. In Water Safety, Security and Sustainability: Threat Detection and Mitigation; Springer International Publishing: Cham, Switzerland, 2021; pp. 443–462. [Google Scholar]
- Hoekstra, A.Y.; Mekonnen, M.M. The water footprint of humanity. Proc. Natl. Acad. Sci. USA 2012, 109, 3232–3237. [Google Scholar] [CrossRef]
- Plebankiewicz, E.; Juszczyk, M.; Kozik, R. Trends, costs, and benefits of green certification of office buildings: A Polish perspective. Sustainability 2019, 11, 2359. [Google Scholar] [CrossRef]
- Miraj, P.; Berawi, M.A.; Utami, S.R. Economic feasibility of green office building: Combining life cycle cost analysis and cost–benefit evaluation. Build. Res. Inf. 2021, 49, 624–638. [Google Scholar] [CrossRef]
- Wuni, I.Y.; Shen, G.Q.; Osei-Kyei, R. Scientometric review of global research trends on green buildings in construction journals from 1992 to 2018. Energy Build. 2019, 190, 69–85. [Google Scholar] [CrossRef]
- Proença, L.C.; Ghisi, E.; da Fonseca Tavares, D.; Coelho, G.M. Potential for electricity savings by reducing potable water consumption in a city scale. Resour. Conserv. Recycl. 2011, 55, 960–965. [Google Scholar] [CrossRef]
- Ramesh, T.; Prakash, R.; Shukla, K.K. Life cycle energy analysis of buildings: An overview. Energy Build. 2010, 42, 1592–1600. [Google Scholar] [CrossRef]
- Mishra, R.K. Fresh water availability and its global challenge. Br. J. Multidiscip. Adv. Stud. 2023, 4, 1–78. [Google Scholar] [CrossRef]
- Shi, X.; Liao, X.; Li, Y. Quantification of fresh water consumption and scarcity footprints of hydrogen from water electrolysis: A methodology framework. Renew. Energy 2020, 154, 786–796. [Google Scholar] [CrossRef]
- Dolan, F.; Lamontagne, J.; Link, R.; Hejazi, M.; Reed, P.; Edmonds, J. Evaluating the economic impact of water scarcity in a changing world. Nat. Commun. 2021, 12, 1915. [Google Scholar] [CrossRef] [PubMed]
- Hoekstra, A.Y.; Mekonnen, M.M.; Chapagain, A.K.; Mathews, R.E.; Richter, B.D. Global monthly water scarcity: Blue water footprints versus blue water availability. PLoS ONE 2012, 7, e32688. [Google Scholar] [CrossRef]
- Sood, A.; Prathapar, S.A.; Smakhtin, V. Green and blue water. In Key Concepts in Water Resource Management; Routledge: London, UK, 2014; pp. 91–102. [Google Scholar]
- Chanan, V.; White, S.; Howe, C.; Jha, M. Sustainable water management in commercial office buildings. In Proceedings of the Innovations in Water: Ozwater Convention & Exhibition, Perth, Australia, 6–10 April 2003; pp. 6–10. [Google Scholar]
- Fulazzaky, M.A.; Syafiuddin, A.; Roestamy, M.; Yusop, Z.; Jonbi, J.; Prasetyo, D.D. Reliability and Economic Analysis of a Rainwater-Harvesting System for a Commercial Building with a Large Rooftop Area. ACS EST Water 2022, 2, 604–615. [Google Scholar] [CrossRef]
- Abas, P.E.; Mahlia, T.M.I. Techno-economic and sensitivity analysis of rainwater harvesting system as alternative water source. Sustainability 2019, 11, 2365. [Google Scholar] [CrossRef]
- United States Environmental Protection Agency. Water Conservation at EPA. Available online: https://www.google.com/imgres?imgurl=https%3A%2F%2F19january2021snapshot.epa.gov%2Fsites%2Fstatic%2Ffiles%2Fstyles%2Flarge%2Fpublic%2F2015-09%2Fwc_l2_office_water_uses.jpg&tbnid=v05kXHvvAD-hwM&vet=10CAIQxiAoAGoXChMIyJKsz8eHiAMVAAAAAB0AAAAAEBc..i&imgrefurl=https%3A%2F%2F19january2021snapshot.epa.gov%2Fgreeningepa%2Fwater-conservation-epa&docid=nwdfo1bLZNjztM&w=800&h=739&itg=1&q=united%20states%20Environmental%20Protection%20Agency%20(2023)%2C%20water%20use%20in%20building%2C%20indoor%2050%25%2C%20MVAC%2028%25&ved=0CAIQxiAoAGoXChMIyJKsz8eHiAMVAAAAAB0AAAAAEBc (accessed on 22 January 2024).
- Mannan, M.; Al-Ghamdi, S.G. Environmental impact of water-use in buildings: Latest developments from a life-cycle assessment perspective. J. Environ. Manag. 2020, 261, 110198. [Google Scholar] [CrossRef] [PubMed]
- Proença, L.C.; Ghisi, E. Water end-uses in Brazilian office buildings. Resour. Conserv. Recycl. 2010, 54, 489–500. [Google Scholar] [CrossRef]
- Teston, A.; Geraldi, M.S.; Colasio, B.M.; Ghisi, E. Rainwater harvesting in buildings in Brazil: A literature review. Water 2018, 10, 471. [Google Scholar] [CrossRef]
- Mohd Zaini, F.; Kwong, Q.J.; Jack, L.B. Water efficiency in Malaysian commercial buildings: A green initiative and cost–benefit approach. Int. J. Build. Pathol. Adapt. 2021, 39, 702–719. [Google Scholar] [CrossRef]
- Wu, Z.; Wu, Z.; Li, H.; Zhang, X.; Jiang, M. Developing a strategic framework for adopting water-saving measures in construction projects. Environ. Geochem. Health 2020, 42, 955–968. [Google Scholar] [CrossRef]
- Das, O.; Bera, P.; Moulick, S. Water conservation aspects of green buildings. Int. J. Res. Eng. Technol 2015, 4, 75–79. [Google Scholar]
- Hafizi Md Lani, N.; Yusop, Z.; Syafiuddin, A. A review of rainwater harvesting in Malaysia: Prospects and challenges. Water 2018, 10, 506. [Google Scholar] [CrossRef]
- Adnan, A.; Ahmad, A.C.; Teriman, S. Rainwater Harvesting (RWH) installation for buildings: A systematic review and meta-analysis approach. Malays. J. Sustain. Environ. 2020, 6, 89–108. [Google Scholar] [CrossRef]
- Lopes, V.A.; Marques, G.F.; Dornelles, F.; Medellin-Azuara, J. Performance of rainwater harvesting systems under scenarios of non-potable water demand and roof area typologies using a stochastic approach. J. Clean. Prod. 2017, 148, 304–313. [Google Scholar] [CrossRef]
- Fane, S.A.; Liu, A.; Falletta, J. Assessing minimum water efficiency standards for plumbing products in homes and business. Water Supply 2024, 24, 1164–1175. [Google Scholar] [CrossRef]
- Ribeiro, J.M.P.; Bocasanta, S.L.; Ávila, B.O.; Magtoto, M.; Jonck, A.V.; Gabriel, G.M.; de Andrade, J.B.S.O. The adoption of strategies for sustainable cities: A comparative study between Seattle and Florianopolis legislation for energy and water efficiency in buildings. J. Clean. Prod. 2018, 197, 366–378. [Google Scholar] [CrossRef]
- Zhao, J.; Xie, X.; Liu, R.; Sun, Y.; Wu, M.; Gu, J. Water and energy saving potential by adopting pressure-reducing measures in high-rise building: A case analysis. Build. Serv. Eng. Res. Technol. 2018, 39, 505–517. [Google Scholar] [CrossRef]
- Rayno, V. The Water Efficient Landscape, the Water Efficient Landscape. 2016. Available online: https://stud.epsilon.slu.se/8791/11/rayno_v_160205.pdf (accessed on 23 April 2024).
- Özyavuz, A.; Özyavuz, M. Xeriscape in landscape design. Landsc. Plan. 2012, 353–360. Available online: http://www.intechopen.com/books/landscape-planning/xeriscape-in-landscape-design (accessed on 20 June 2024).
- Rafi, Z.N.; Kazemi, F.; Tehranifar, A. Public preferences toward water-wise landscape design in a summer season. Urban For. Urban Green. 2019, 48, 126563. [Google Scholar] [CrossRef]
- United States Environmental Protection Agency. Water Efficiency Management Guide Landscaping and Irrigation, WaterSense. 2017. Available online: https://nepis.epa.gov/Exe/ZyPURL.cgi?Dockey=P100TFYF.txt (accessed on 23 April 2024).
- Office Complex Reduces Outdoor Water Use. Watersense. 2014. Available online: https://www.epa.gov/sites/production/files/2017-01/documents/ws-commercial-casestudy-granite-park-office.pdf (accessed on 23 April 2024).
- Blanchard, D. Application of the Simplified Landscape Irrigation Design Estimation (Slide) Rule for Outdoor Water Conservation for the Industrial, Commercial, and Institutional (Ici) Sector. PrePrints 2023. [Google Scholar]
- Filali, H.; Barsan, N.; Souguir, D.; Nedeff, V.; Tomozei, C.; Hachicha, M. Greywater as an alternative solution for a sustainable management of water resources—A review. Sustainability 2022, 14, 665. [Google Scholar] [CrossRef]
- Khanam, K.; Patidar, S.K. Greywater characteristics in developed and developing countries. Mater. Today Proc. 2022, 57, 1494–1499. [Google Scholar] [CrossRef]
- Maimon, A.; Gross, A. Greywater: Limitations and perspective. Curr. Opin. Environ. Sci. Health 2018, 2, 1–6. [Google Scholar] [CrossRef]
- Yoonus, H.; Al-Ghamdi, S.G. Environmental performance of building integrated grey water reuse systems based on Life-Cycle Assessment: A systematic and bibliographic analysis. Sci. Total Environ. 2020, 712, 136535. [Google Scholar] [CrossRef]
- Salim, S.H.; Al-Anbari, R.H.; Haider, A.J. Calculation of the amount of greywater production and demands from the Iraqi government office buildings. In Proceedings of the AIP Conference Proceedings, Kuala Lumpur, Malaysia, 24–25 June 2023; AIP Publishing: Melville, NY, USA, 2023; Volume 2820. [Google Scholar]
- Habibullah, N.; Sahrir, S.; Ponrahono, Z. Integrating rainwater harvesting and greywater recycling to increase water efficiency in office buildings. Plan. Malays. 2023, 21, 253–266. [Google Scholar] [CrossRef]
- Leggett, D.J.; Shaffer, P. Buildings that save water—Rainwater and greywater use. In Proceedings of the Institution of Civil Engineers-Municipal Engineer, September 2002; Thomas Telford Ltd.: London, UK, 2015; Volume 151, pp. 189–196. [Google Scholar]
- Yoshikawa, N.; Shimizu, T.; Amano, K.; Nakajima, J. Evaluation of greywater reclamation and reuse system in a Japanese university building. J. Asia-Jpn. Res. Inst. Ritsumeikan Univ. 2019, 1, 44–55. [Google Scholar]
- Tayara, A.; Shanableh, A.; Atieh, M.A.; Abdallah, M.; Battacharjee, S.; Mustafa, A.; Al Bardan, M. Feasibility and impact of greywater recycling in four types of buildings in Sharjah, United Arab Emirates. In IOP Conference Series: Earth and Environmental Science; IOP Publishing: Bristol, UK, 2021; Volume 725, p. 012009. [Google Scholar]
- García Cutillas, C.; Ruiz Ramírez, J.; Lucas Miralles, M. Optimum design and operation of an HVAC cooling tower for energy and water conservation. Energies 2017, 10, 299. [Google Scholar] [CrossRef]
- Basil, A.A.M.; Agu, A.O.; Agbo, C.E. Water Use Efficiency and Conservation in Green Buildings. J. Environ. Manag. Saf. 2022, 13, 12. [Google Scholar]
- Roccaro, P.; Falciglia, P.P.; Vagliasindi, F.G.A. Effectiveness of water saving devices and educational programs in urban buildings. Water Sci. Technol. 2011, 63, 1357–1365. [Google Scholar] [CrossRef] [PubMed]
- Sousa, V.; Silva, C.M.; Meireles, I. Performance of water efficiency measures in commercial buildings. Resour. Conserv. Recycl. 2019, 143, 251–259. [Google Scholar] [CrossRef]
- Wolfe, S.E.; Hendriks, E. Building towards water efficiency: The influence of capacity and capability on innovation adoption in the Canadian home-building and resale industries. J. Hous. Built Environ. 2011, 26, 47–72. [Google Scholar] [CrossRef]
- Adeyeye, K. Water policy and regulations: A UK perspective. In Water Efficiency in Buildings: Theory and Practice; Wiley: Hoboken, NJ, USA, 2013; pp. 5–23. [Google Scholar]
- Milman, A.; Polsky, C. Policy frameworks influencing outdoor water-use restrictions. JAWRA J. Am. Water Resour. Assoc. 2016, 52, 605–619. [Google Scholar] [CrossRef]
- Bertone, E.; Stewart, R.A.; Sahin, O.; Alam, M.; Zou, P.X.; Buntine, C.; Marshall, C. Guidelines, barriers and strategies for energy and water retrofits of public buildings. J. Clean. Prod. 2018, 174, 1064–1078. [Google Scholar] [CrossRef]
- Yin, R.K. Case Study Research and Applications; Sage: Thousand Oaks, CA, USA, 2018; Volume 6. [Google Scholar]
- Karim, M.R.; Sakib, B.S.; Sakib, S.S.; Imteaz, M.A. Rainwater harvesting potentials in commercial buildings in Dhaka: Reliability and economic analysis. Hydrology 2021, 8, 9. [Google Scholar] [CrossRef]
- Silva-Afonso, A.; Pimentel-Rodrigues, C. The importance of water efficiency in buildings in Mediterranean countries. The Portuguese experience. Int. J. Syst. Appl. Eng. Dev. 2011, 5, 17–24. [Google Scholar]
- Council-USGBC. LEED Reference Guide for Building Design and Construction, 4th ed.; Green Building Council: Washington, DC, USA, 2013; pp. 259–266. [Google Scholar]
- Begum, M.S.; Kumar Bala, S.; Saiful Islam, A.K.M. Effect of Performance of Water Stashes Irrigation Approaches on Selected Species of Plant’s Water Productivity in Urban Rooftop Agriculture with Respect to Climate Change. Water 2021, 14, 7. [Google Scholar] [CrossRef]
- LEED v4 Indoor Water Use Reduction Calculator. US Green Building Council. 2014. Available online: https://www.usgbc.org/resources/leed-v4-indoor-water-use-reduction-calculator (accessed on 3 August 2024).
- Silva-Afonso, A.; Rodrigues, F.; Pimentel-Rodrigues, C. Water efficiency in buildings: Assessment of its impact on energy efficiency and reducing GHG emissions. In Proceedings of the 6th IASME/WSEAS International Conference on Energy & Environment—EE, Cambridge, UK, 23–25 February 2011; Volume 11. [Google Scholar]
- World Bank Group. Climate Change Knowledge Portal, World Bank Climate Change Knowledge Portal. 2021. Available online: https://climateknowledgeportal.worldbank.org/country/sri-lanka/climate-data-historical#:~:text=Sri%20Lanka’s%20commercial%20capital%2C%20Colombo,%C2%B0C%20all%20year%20round (accessed on 9 February 2024).
- Tharinda, W.M.; Ruwangika, N.R.A.; Jayasingha, K.P.; Aponsu, G.L.M.; Rathnayake, U. Statistical and Graphical Comparison of Relative Humidity in the Wet Zone of Sri Lanka. J. Sci. Res. Dev. 2022, 5, 1040–1050. [Google Scholar]
- Department of Meteorology—Sri Lanka. 2024. Climate of Sri Lanka, Meteo.gov.lk. Available online: https://www.meteo.gov.lk/index.php?option=com_content%26view=article%26id=94%26Itemid=310%26lang=en (accessed on 10 February 2024).
- World Meteorological Organization. Water, World Meteorological Organization. 2024. Available online: https://wmo.int/ (accessed on 28 January 2024).
- World Weather Information Service. 2020. Available online: http://worldweather.wmo.int/en/city.html?cityId=227 (accessed on 6 February 2020).
- ETo Calculator | Land & Water|Food and Agriculture Organization of the United Nations|Land & Water|Food and Agriculture Organization of the United Nations, Fao.org. 2020. Available online: http://www.fao.org/land-water/databases-and-software/eto-calculator/en/ (accessed on 6 February 2020).
- Department of Census and Statistics (No Date) Sri Lanka Labour Force Survey 1st Quarter. 2020. Available online: http://www.statistics.gov.lk/Resource/en/LabourForce/Bulletins/LFS_Q1_Bulletin_2020 (accessed on 5 August 2023).
- Alkhaledi, K.; Arnold, A.; Means, K.; Kim, I.J.; Bendak, S. A novel multicriteria decision making model for sustainable stormwater management. Sustainability 2020, 12, 9508. [Google Scholar] [CrossRef]
- Leksono, B.; Windyarini, E.; Hasnah, T.; Rahman, S.; Baral, H. Calophyllum inophyllum for green energy and landscape restoration: Plant growth, biofuel content, associate waste utilization and agroforestry prospect. In Proceedings of the 2018 International Conference and Utility Exhibition on Green Energy for Sustainable Development (ICUE), Phuket, Thailand, 24–26 October 2018; IEEE: Piscataway, NJ, USA, 2018; pp. 1–7. [Google Scholar]
- Morris, P.; Langdon, D. What does green really cost. PREA Q. 2007, 1, 55–60. [Google Scholar]
- Gabay, H.; Meir, I.A.; Schwartz, M.; Werzberger, E. Cost-benefit analysis of green buildings: An Israeli office buildings case study. Energy Build. 2014, 76, 558–564. [Google Scholar] [CrossRef]
- Azhar, S.; Khalfan, M.; Maqsood, T. Building information modeling (BIM): Now and beyond. Australas. J. Constr. Econ. Build. 2012, 12, 15–28. [Google Scholar]
- Englart, S.; Jedlikowski, A. The influence of different water efficiency ratings of taps and mixers on energy and water consumption in buildings. SN Appl. Sci. 2019, 1, 525. [Google Scholar] [CrossRef]
- Hashim, H.; Hudzori, A.; Yusop, Z.; Ho, W.S. Simulation based programming for optimization of large-scale rainwater harvesting system: Malaysia case study. Resour. Conserv. Recycl. 2013, 80, 1–9. [Google Scholar] [CrossRef]
- Leong, J.Y.C.; Chong, M.N.; Poh, P.E.; Vieritz, A.; Talei, A.; Chow, M.F. Quantification of mains water savings from decentralised rainwater, greywater, and hybrid rainwater-greywater systems in tropical climatic conditions. J. Clean. Prod. 2018, 176, 946–958. [Google Scholar] [CrossRef]
- Khan, S.A.; Al Abri, A.H.; Badr, A. Recycling Chilled Water Condensate From A/C Units to Reduce Water Scarcity in Oman. In Towards a Sustainable Water Future: Proceedings of Oman’s International Conference on Water Engineering and Management of Water Resources; ICE Publishing: London, UK, 2021; pp. 221–232. [Google Scholar]
- Algarni, S.; Saleel, C.A.; Mujeebu, M.A. Air-conditioning condensate recovery and applications—Current developments and challenges ahead. Sustain. Cities Soc. 2018, 37, 263–274. [Google Scholar] [CrossRef]
- Eades, W.G. Energy and water recovery using air-handling unit condensate from laboratory HVAC systems. Sustain. Cities Soc. 2018, 42, 162–175. [Google Scholar] [CrossRef]
- Licina, D.; Sekhar, C. Energy and water conservation from air handling unit condensate in hot and humid climates. Energy Build. 2012, 45, 257–263. [Google Scholar] [CrossRef]
- Ibrahim, H.; Elsayed, M.S.; Moustafa, W.S.; Abdou, H.M. Functional analysis as a method on sustainable building design: A case study in educational buildings implementing the triple bottom line. Alex. Eng. J. 2023, 62, 63–73. [Google Scholar] [CrossRef]
- Batista, L.T.; Franco, J.R.Q.; Fakury, R.H.; Porto, M.F.; Braga, C.M.P. Methodology for Determining Sustainable Water Consumption Indicators for Buildings. Sustainability 2022, 14, 5695. [Google Scholar] [CrossRef]
- Ward, S.; Memon, F.A.; Butler, D. Performance of a large building rainwater harvesting system. Water Res. 2012, 46, 5127–5134. [Google Scholar] [CrossRef]
- Thomollari, X.; Bahadır, Ü.; Toğan, V.; Tokdemir, O.B. Reducing water consumption with sustainable building design; a case study. Turk. J. Occup./Environ. Med. Saf. 2017, 2, 444–453. [Google Scholar]
- Bint, L.; Garnett, A.; Siggins, A.; Jaques, R. Alternative water sources in New Zealand’s commercial buildings. Water Supply 2019, 19, 371–381. [Google Scholar] [CrossRef]
- Lani, N.H.M.; Syafiuddin, A.; Yusop, Z.; bin Mat Amin, M.Z. Performance of small and large scales rainwater harvesting systems in commercial buildings under different reliability and future water tariff scenarios. Sci. Total Environ. 2018, 636, 1171–1179. [Google Scholar] [CrossRef] [PubMed]
- Barnard, P.; Darkins, T.; Earl, B.; Adeyeye, O. Retrofitting for water efficiency: A hotel case study. In Proceedings of the Water Efficiency Conference 2014, Brighton, UK, 9–11 September 2014; WATEF Network/University of Brighton. pp. 29–38. [Google Scholar]
- Varma, V.G. Water-efficient technologies for sustainable development. In Current Directions in Water Scarcity Research; Elsevier: Amsterdam, The Netherlands, 2022; Volume 6, pp. 101–128. [Google Scholar]
- Proença, L.C.; Ghisi, E. Assessment of potable water savings in office buildings considering embodied energy. Water Resour. Manag. 2013, 27, 581–599. [Google Scholar] [CrossRef]
- Ilemobade, A.A.; Olanrewaju, O.O.; Griffioen, M.L. Greywater Reuse for Toilet Flushing in High-Density Urban Buildings in South Africa: A Pilot Study; Water Research Comission: Johannesburg, South Africa, 2012; pp. 1–194. [Google Scholar]
- Alkhalidi, A.; Aljolani, O. Do green buildings provide benefits to the residential sector in Jordan? Yes, but…. Int. J. Low-Carbon Technol. 2020, 15, 319–327. [Google Scholar] [CrossRef]
- Zhang, Y.; Grant, A.; Sharma, A.; Chen, D.; Chen, L. Assessment of rainwater use and greywater reuse in high-rise buildings in a brownfield site. Water Sci. Technol. 2009, 60, 575–581. [Google Scholar] [CrossRef]
- Imteaz, M.; Shanableh, A. Feasibility of recycling grey-water in multi-storey buildings in Melbourne. In Proceedings of the World Sustainability Forum, 29 October 2012. pp. 1–7. Available online: www.sciforum.net (accessed on 20 June 2024).
- Prajapati, R.; Pandya, I.; Maitreya, B. Comparison of Normal Landscaping and Water-Wise Landscaping of Selected Farm in the Ahmedabad Area. Int. Assoc. Biol. Comput. Dig. 2023, 2, 211–214. [Google Scholar] [CrossRef]
- Al-Sulbi, A. Cost Estimation of Wastage Irrigation Water in Arid Public Landscape Areas King Abdullah Park–Dammam, Saudi Arabia. Emir. J. Eng. Res. 2020, 26, 4. [Google Scholar]
- Pauku, R.L. Barringtonia procera (cutnut). In Traditional Trees of Pacific Islands: Their Culture, Environment and Use; Permanent Agriculture Resources (PAR): Hōlualoa, HI, USA, 2006; pp. 153–170. [Google Scholar]
- Hasan, R.; Yeo, L.B.; Othmani, N.I.; Mohamed, S.A.; Awang, A.; Aziz, N.D. Improving Campus Sustainability and Resilience by Selecting Climate-Appropriate Plants. In BIO Web of Conferences; EDP Sciences: Les Ulis, France, 2023; Volume 73, p. 03006. [Google Scholar]
- Ikhsan, M.; Hadi, U.K.; Soviana, S. Diversity and distribution bromeliads plants as breeding habitat for mosquito larvae (Diptera: Culicidae) in Bogor, Indonesia. Biodiversitas J. Biol. Divers. 2020, 21, 3494–3498. [Google Scholar] [CrossRef]
- Tapia-Campos, E.; Rodriguez-Dominguez, J.M.; Revuelta-Arreola, M.M.; Van Tuyl, J.M.; Barba-Gonzalez, R. Mexican Geophytes II. The Genera Hymenocallis, Sprekelia and Zephyranthes. Floric. Ornam. Biotechnol. 2012, 6 (Suppl. S1), 129–139. [Google Scholar]
- Backhaus, R.A.; Pettit, G.R., III; Huang, D.S.; Pettit, G.R.; Groszek, G.; Odgers, J.C.; Ho, J.; Meerow, A. Biosynthesis of the antineoplastic pancratistatin following tissue culture of Hymenocallis littoralis (Amaryllidaceae). In Proceedings of the International Symposium on Medicinal and Aromatic Plants, XXIII IHC 306; International Society for Horticultural Science: Budapest, Hungary; Firenze, Italy, 1992; pp. 364–366. [Google Scholar]
- He, B.; Guo, T.; Huang, H.; Xi, W.; Chen, X. Physiological responses of Scaevola Aemula seedlings under high-temperature stress. S. Afr. J. Bot. 2017, 112, 203–209. [Google Scholar] [CrossRef]
- Starman, T.; Lombardini, L. Growth, gas exchange, and chlorophyll fluorescence of four ornamental herbaceous perennials during water deficit conditions. J. Am. Soc. Hortic. Sci. 2006, 131, 469–475. [Google Scholar] [CrossRef]
- Akinniyi, G.; Lee, J.; Kim, H.; Lee, J.G.; Yang, I. A medicinal halophyte Ipomoea pescaprae (Linn.) r. br.: A review of its botany, traditional uses, phytochemistry, and bioactivity. Mar. Drugs 2022, 20, 329. [Google Scholar] [CrossRef]
- EuroAsia (Agro) Pvt Ltd.; Clerodendron Inerme EuroAsia Biotechnology, EuroAsia Agro (Pvt) Ltd. 2020. Available online: https://euroasiaplantbiotec.com/clerodendron-inerme#:~:text=Clerodendrum%20is%20a%20genus%20of,%2C%20bagflower%20and%20bleeding%2Dheart (accessed on 16 December 2023).
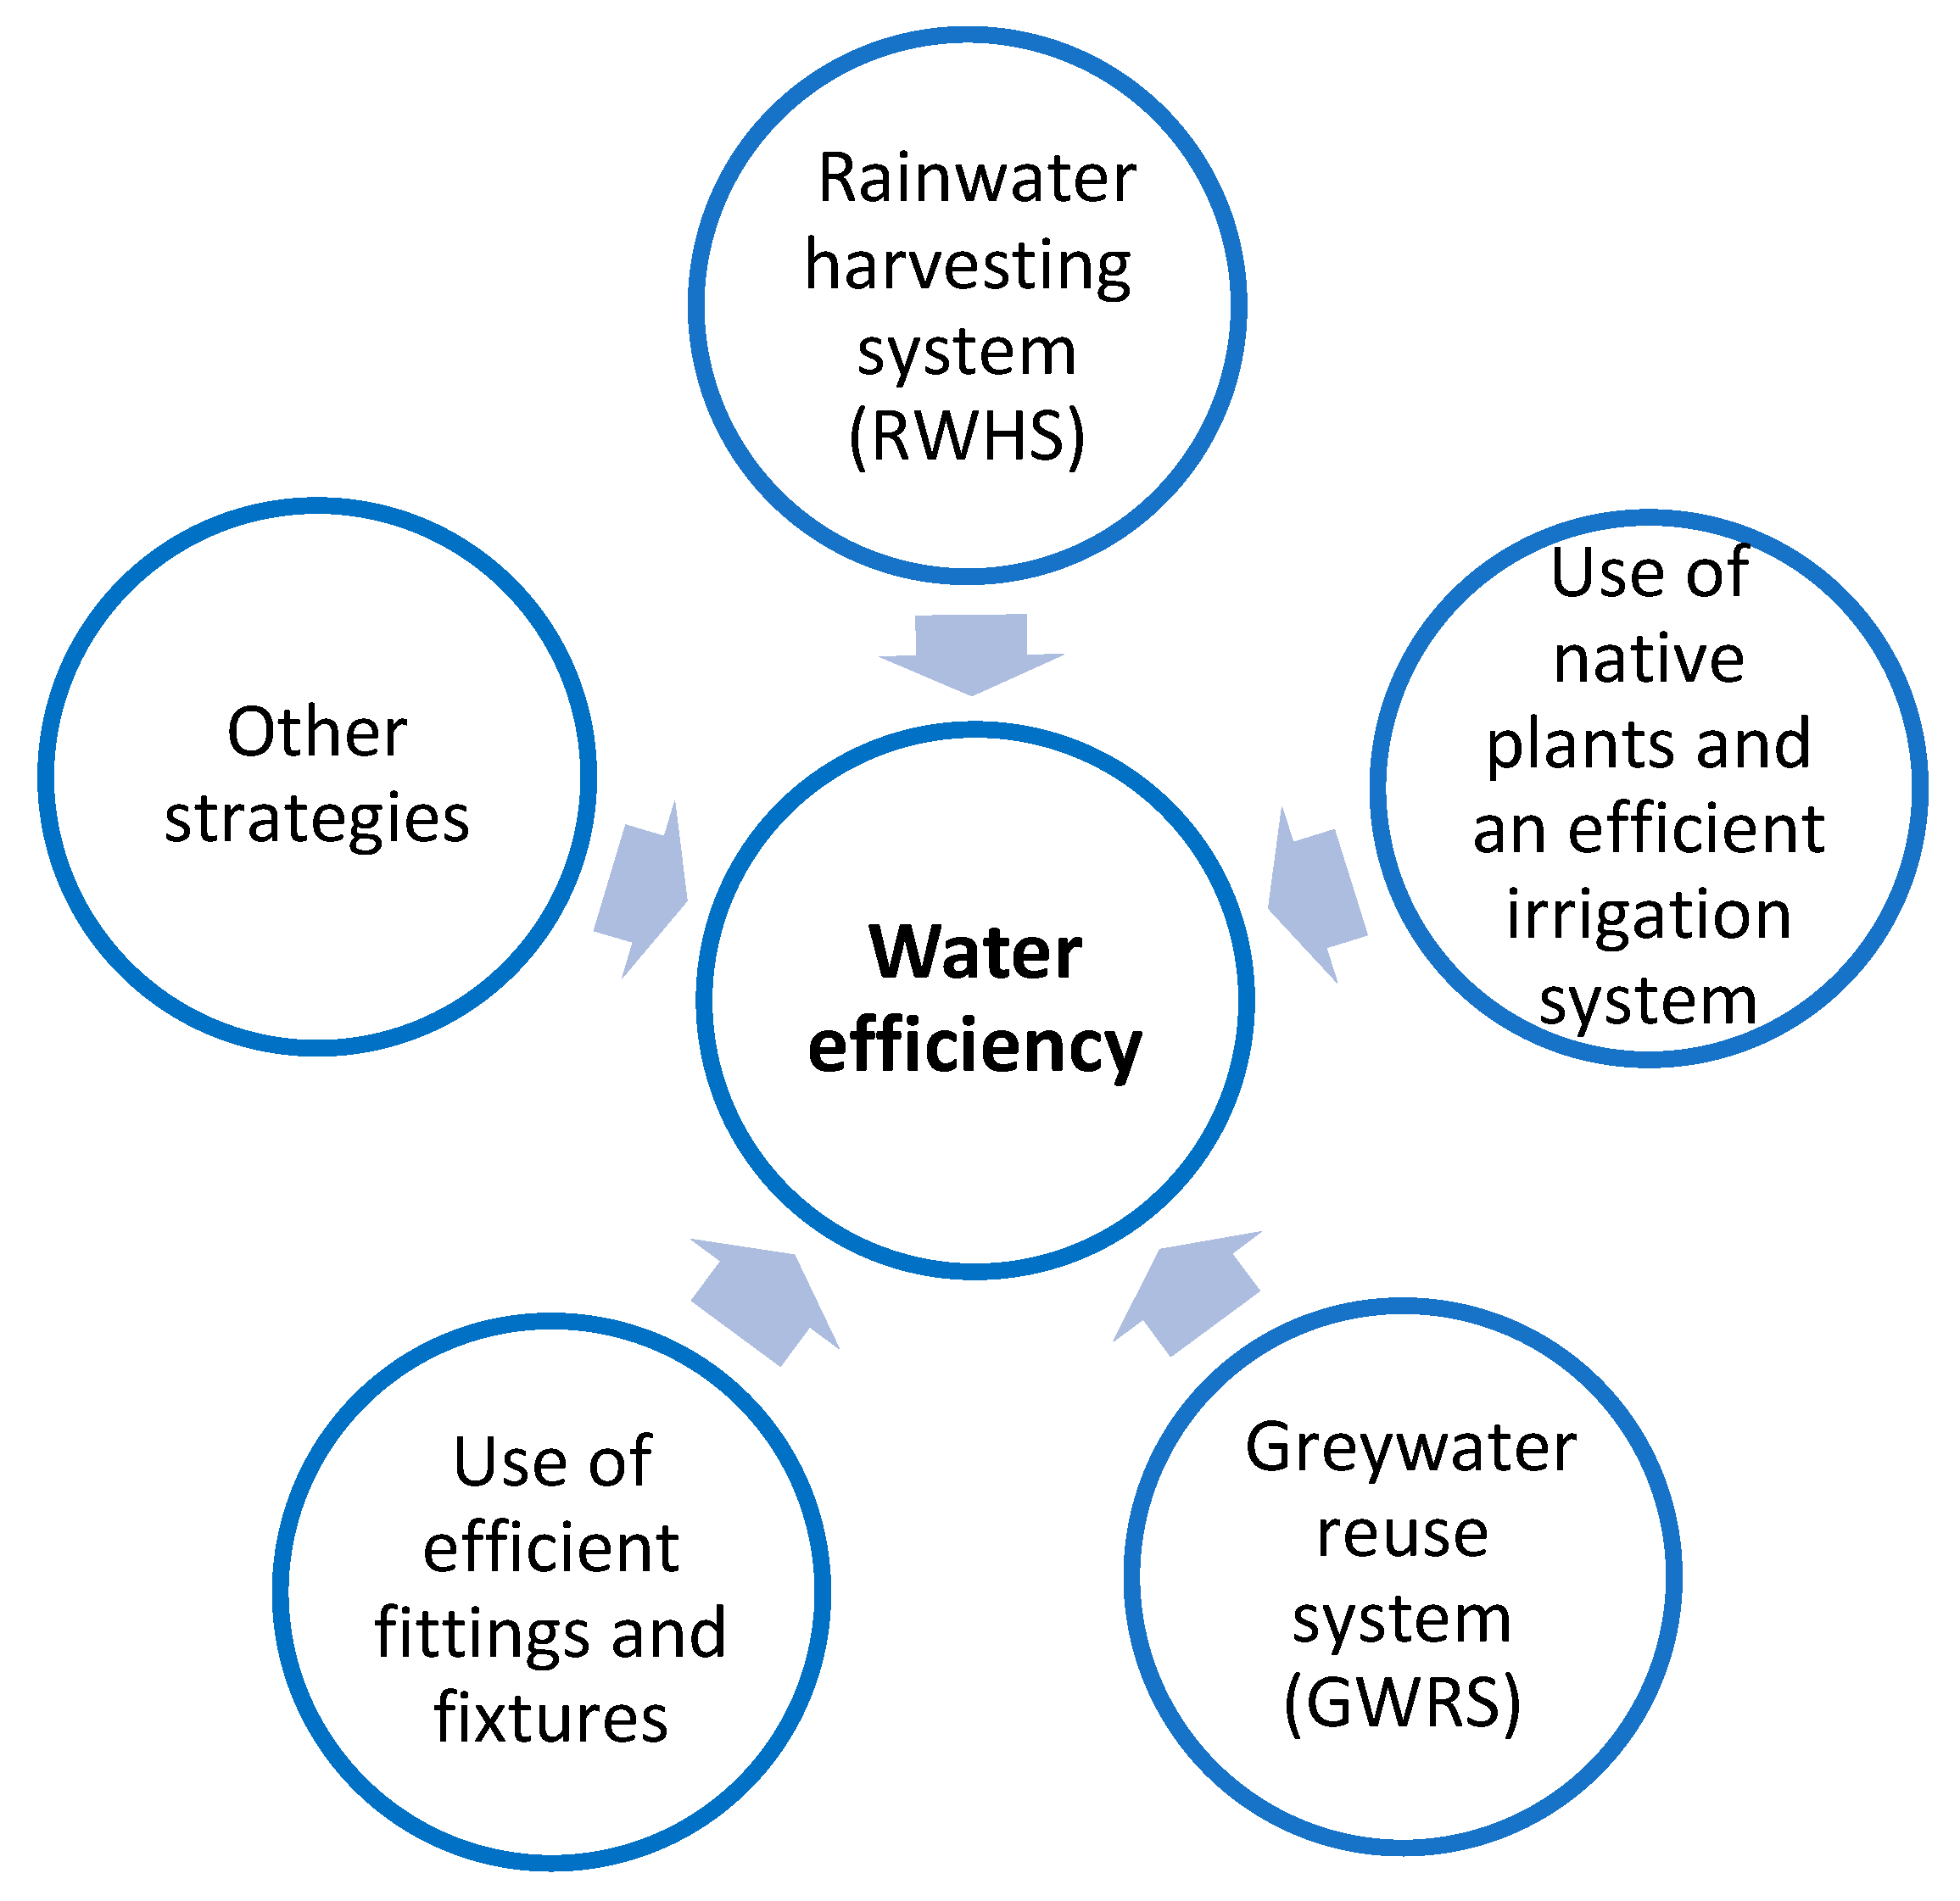
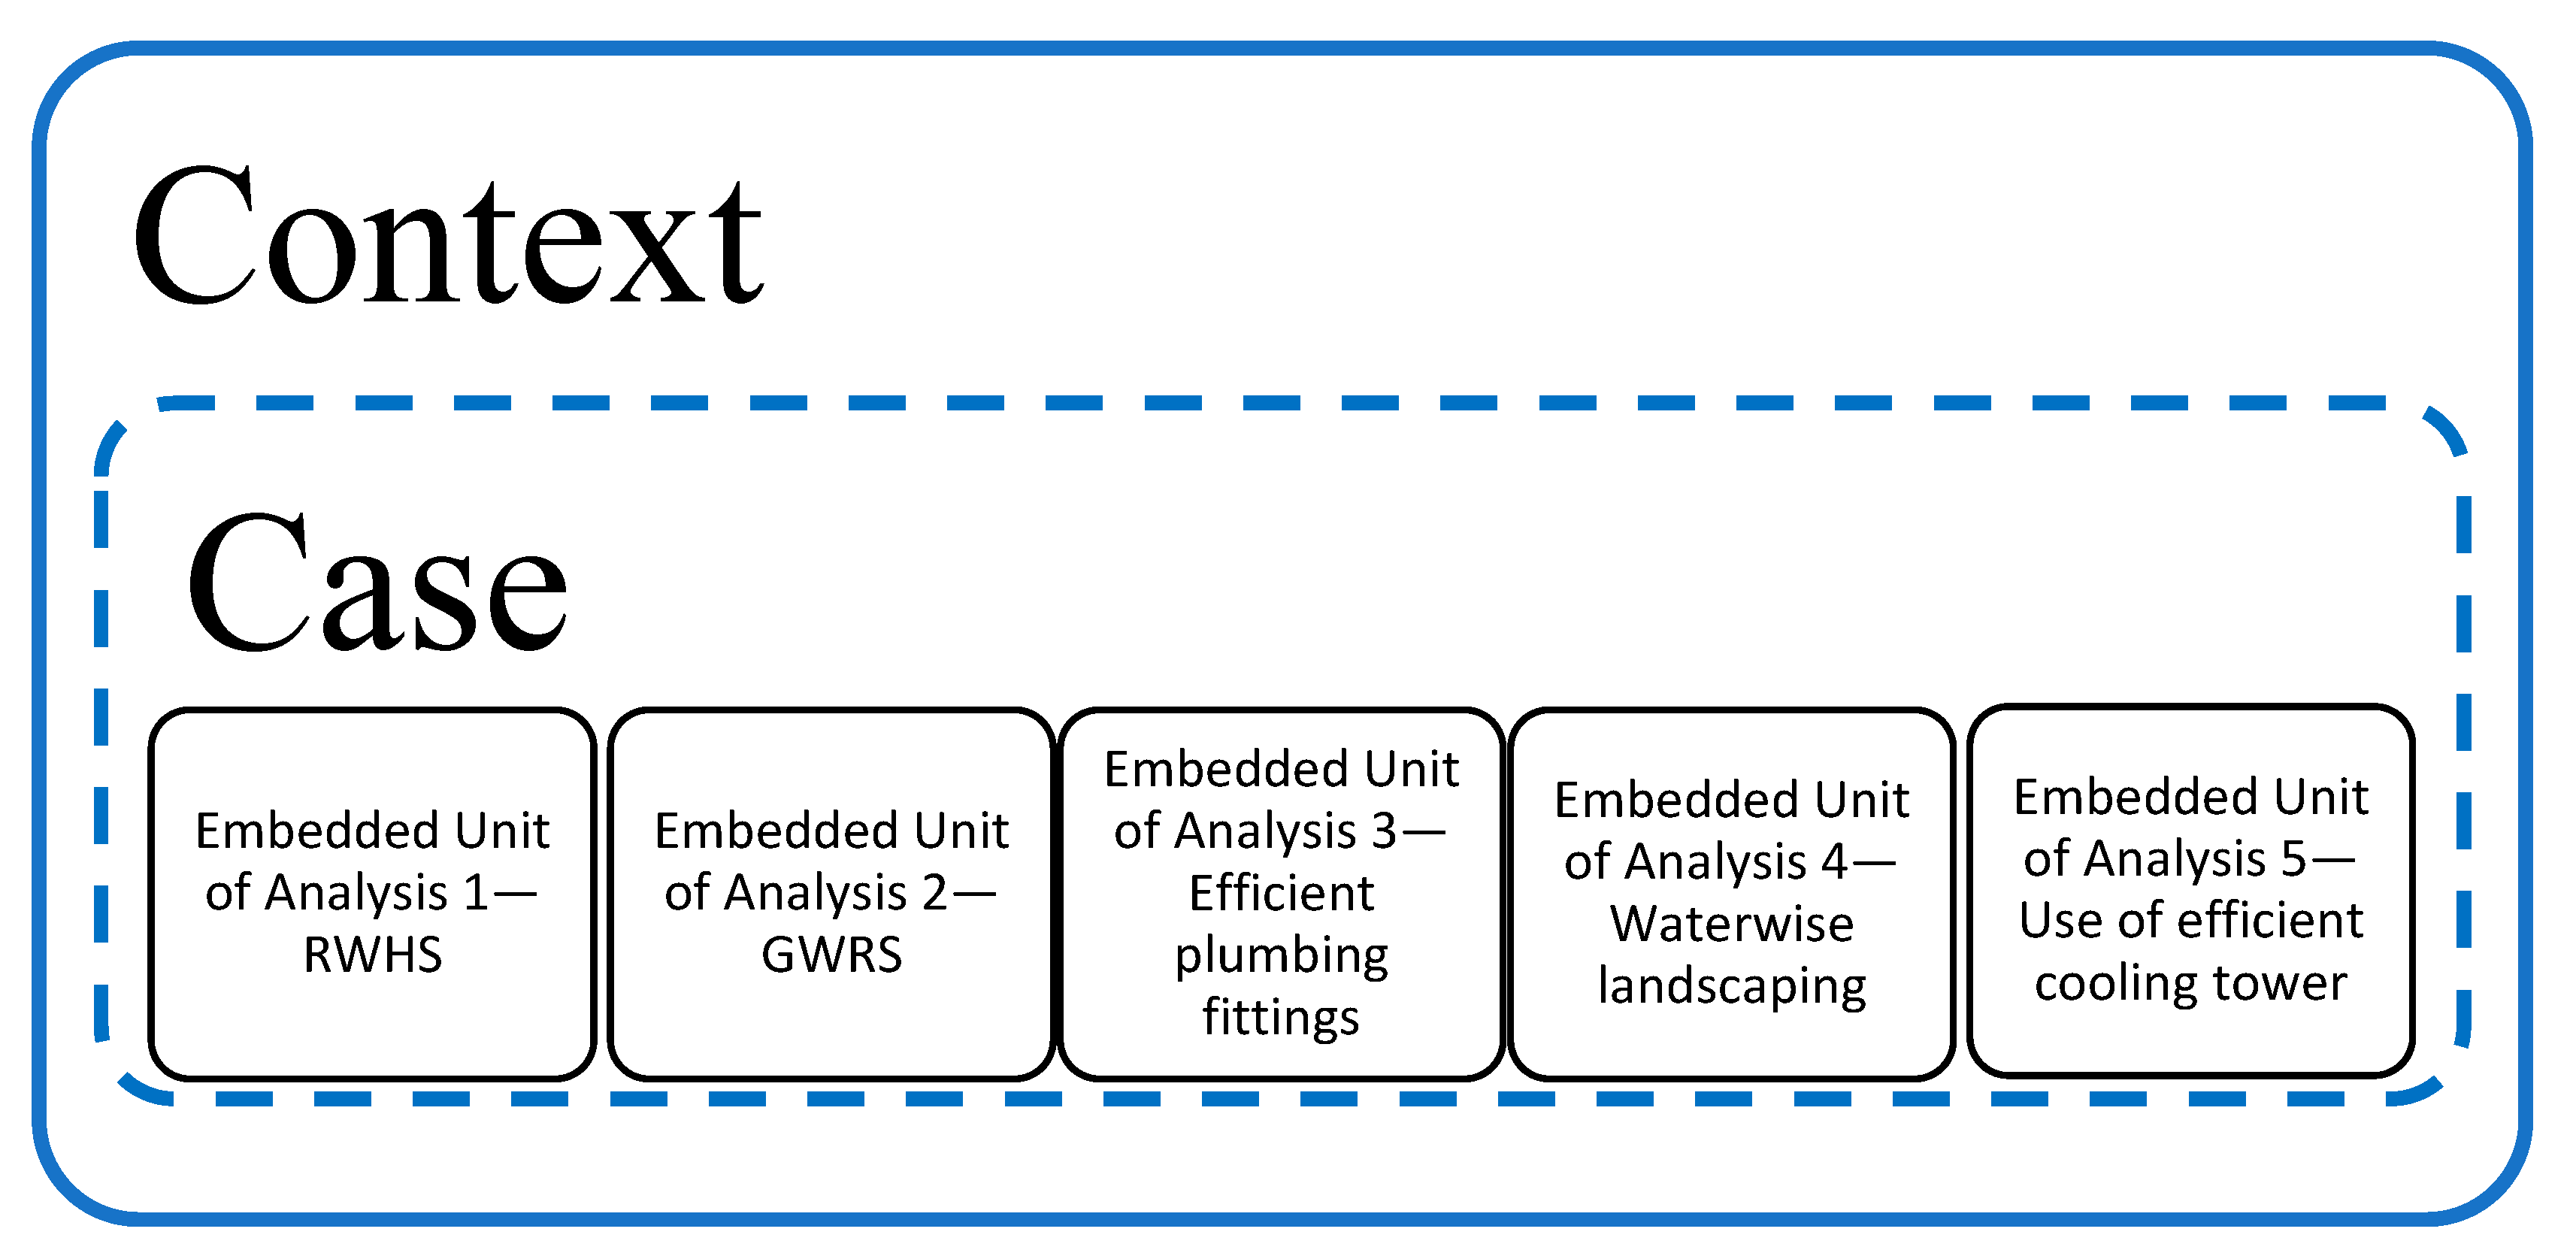

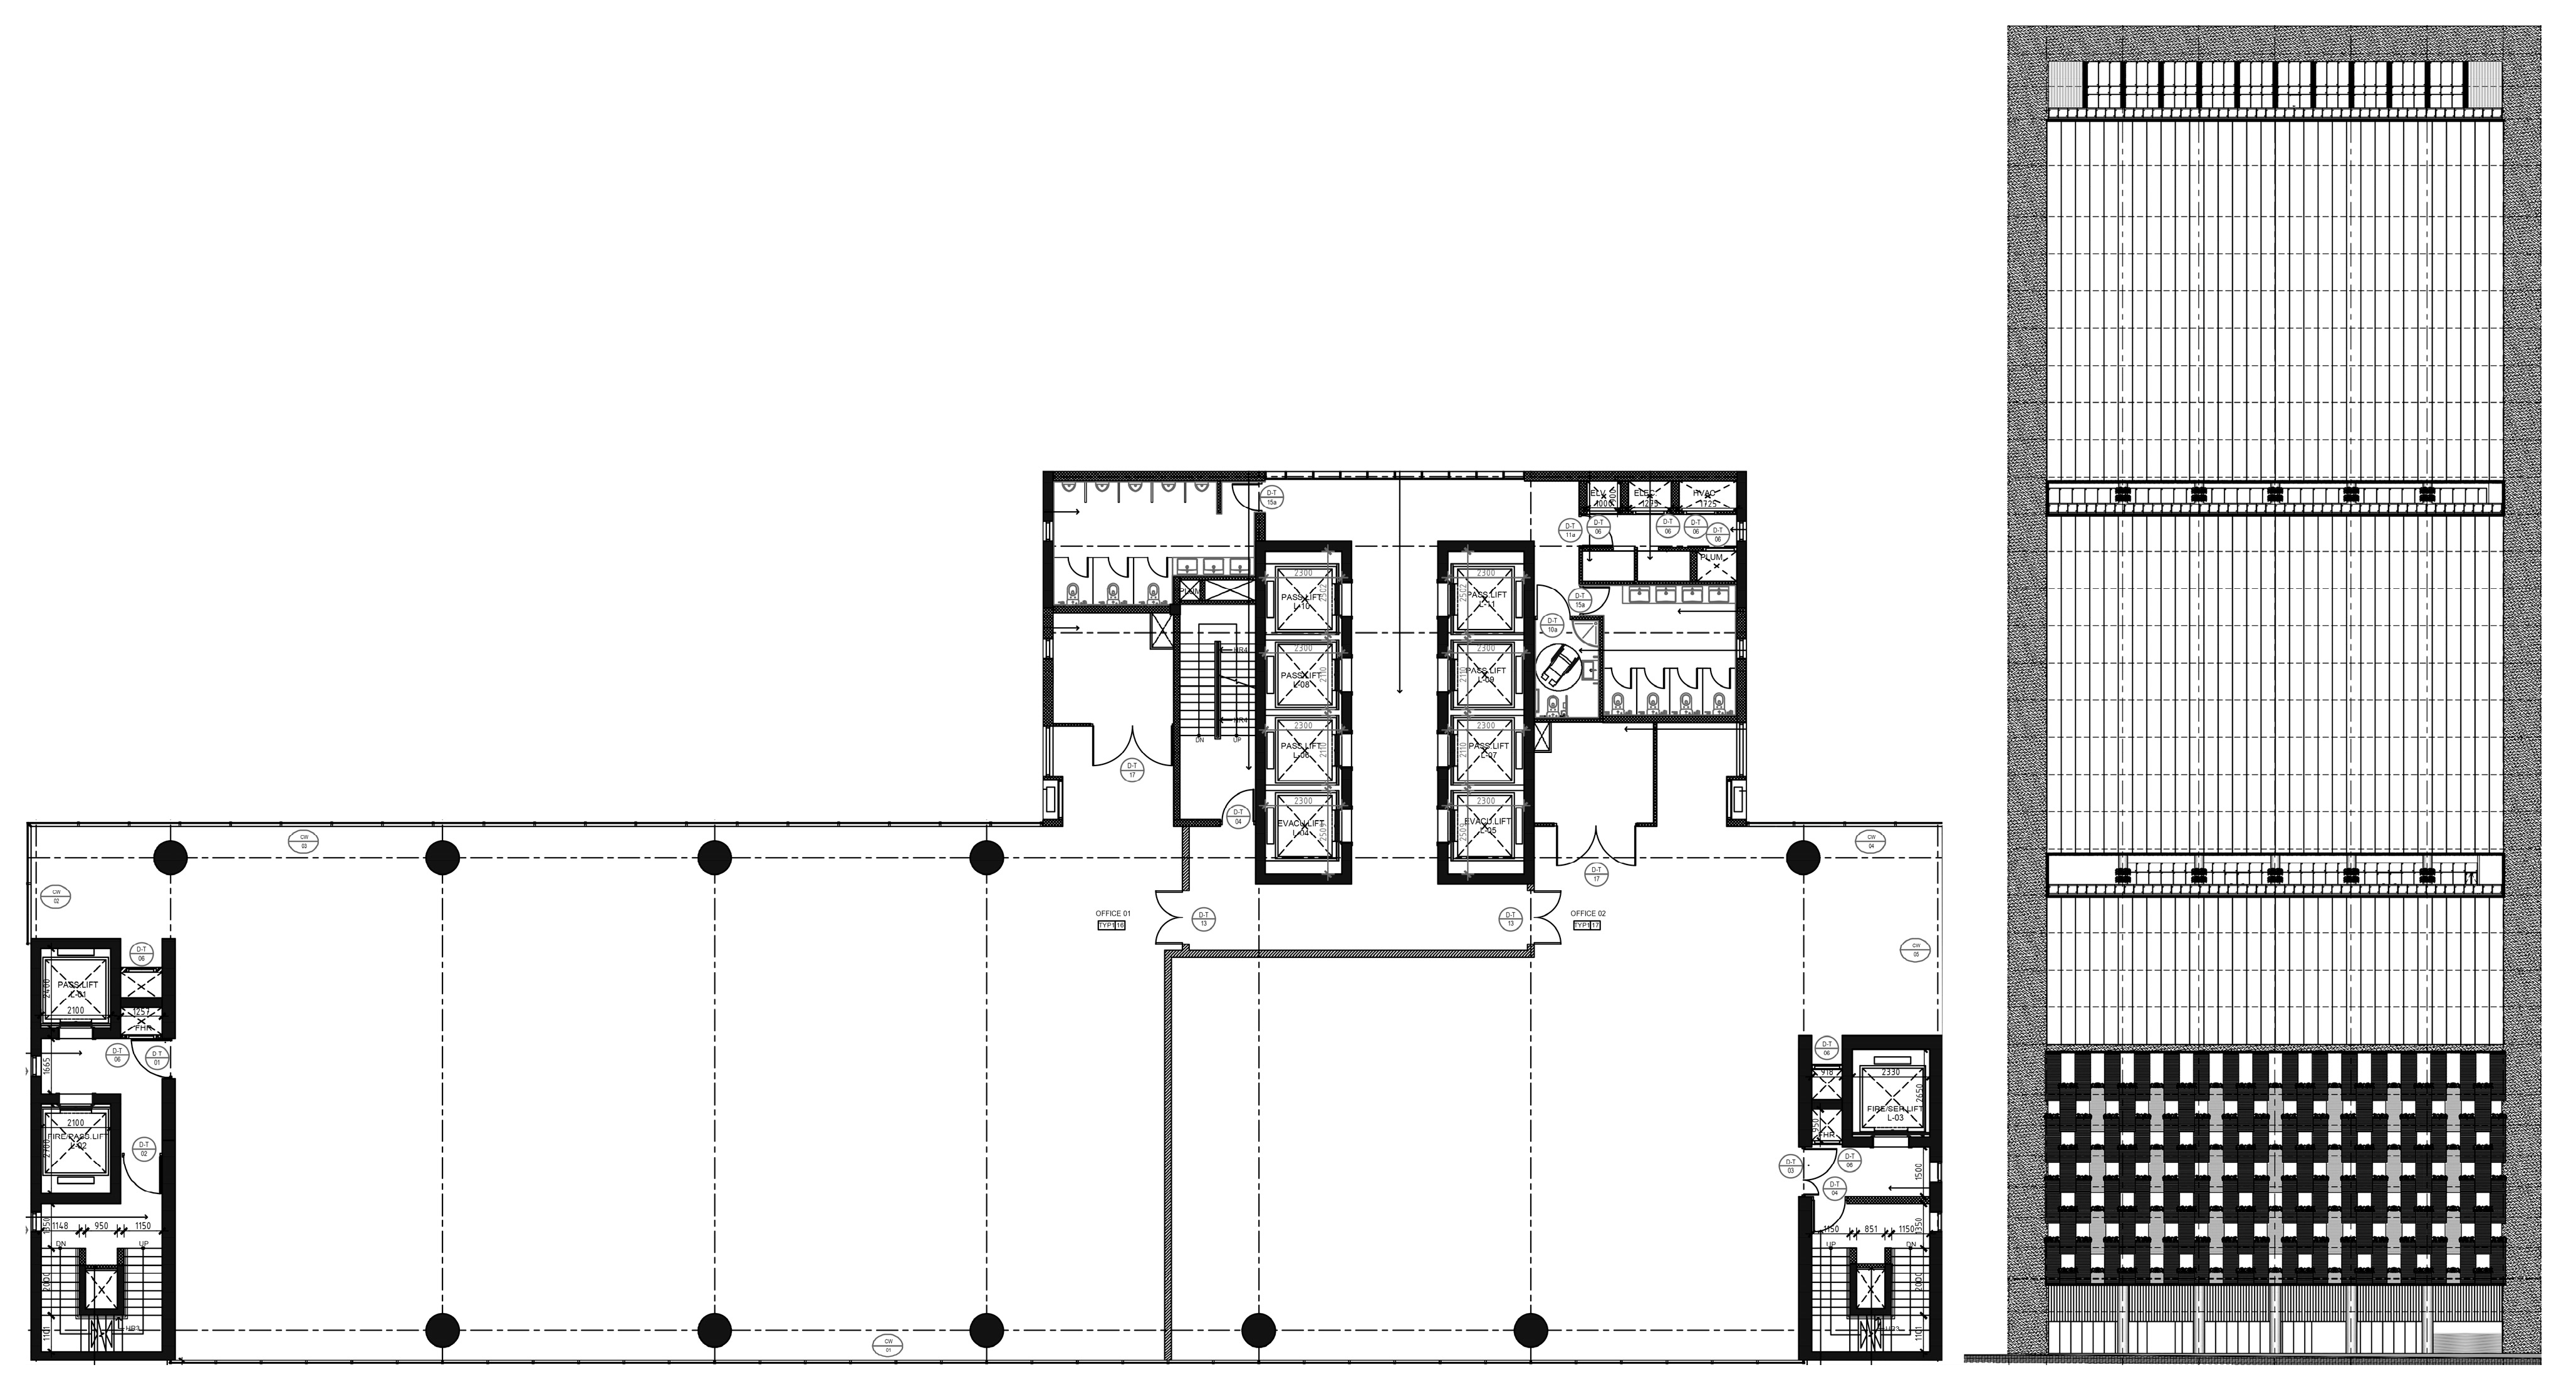

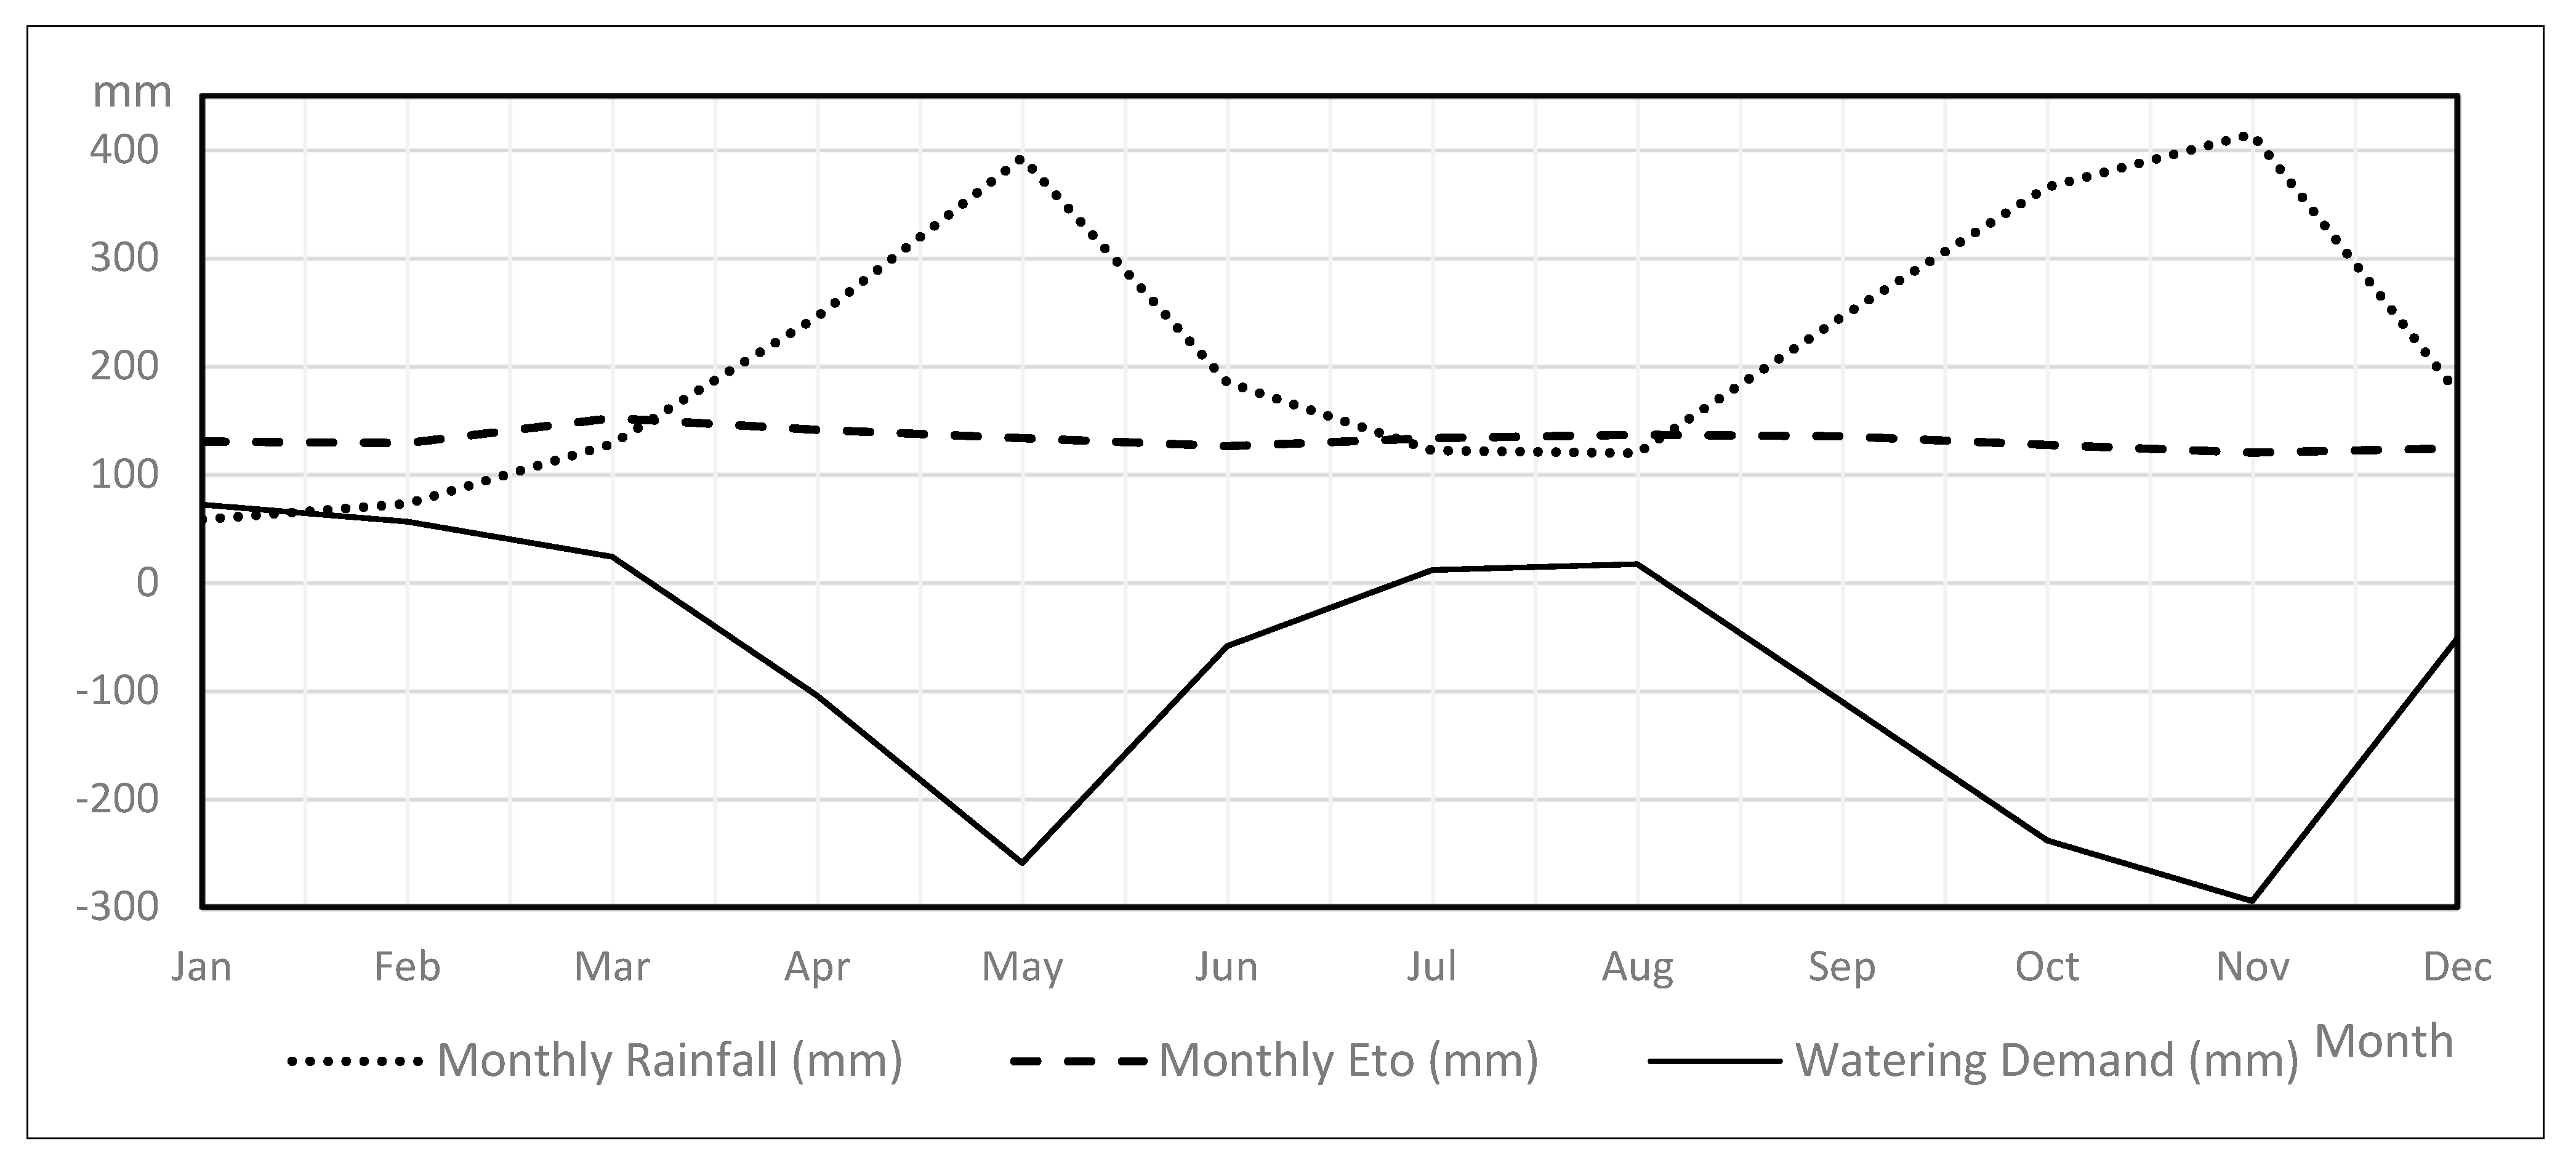
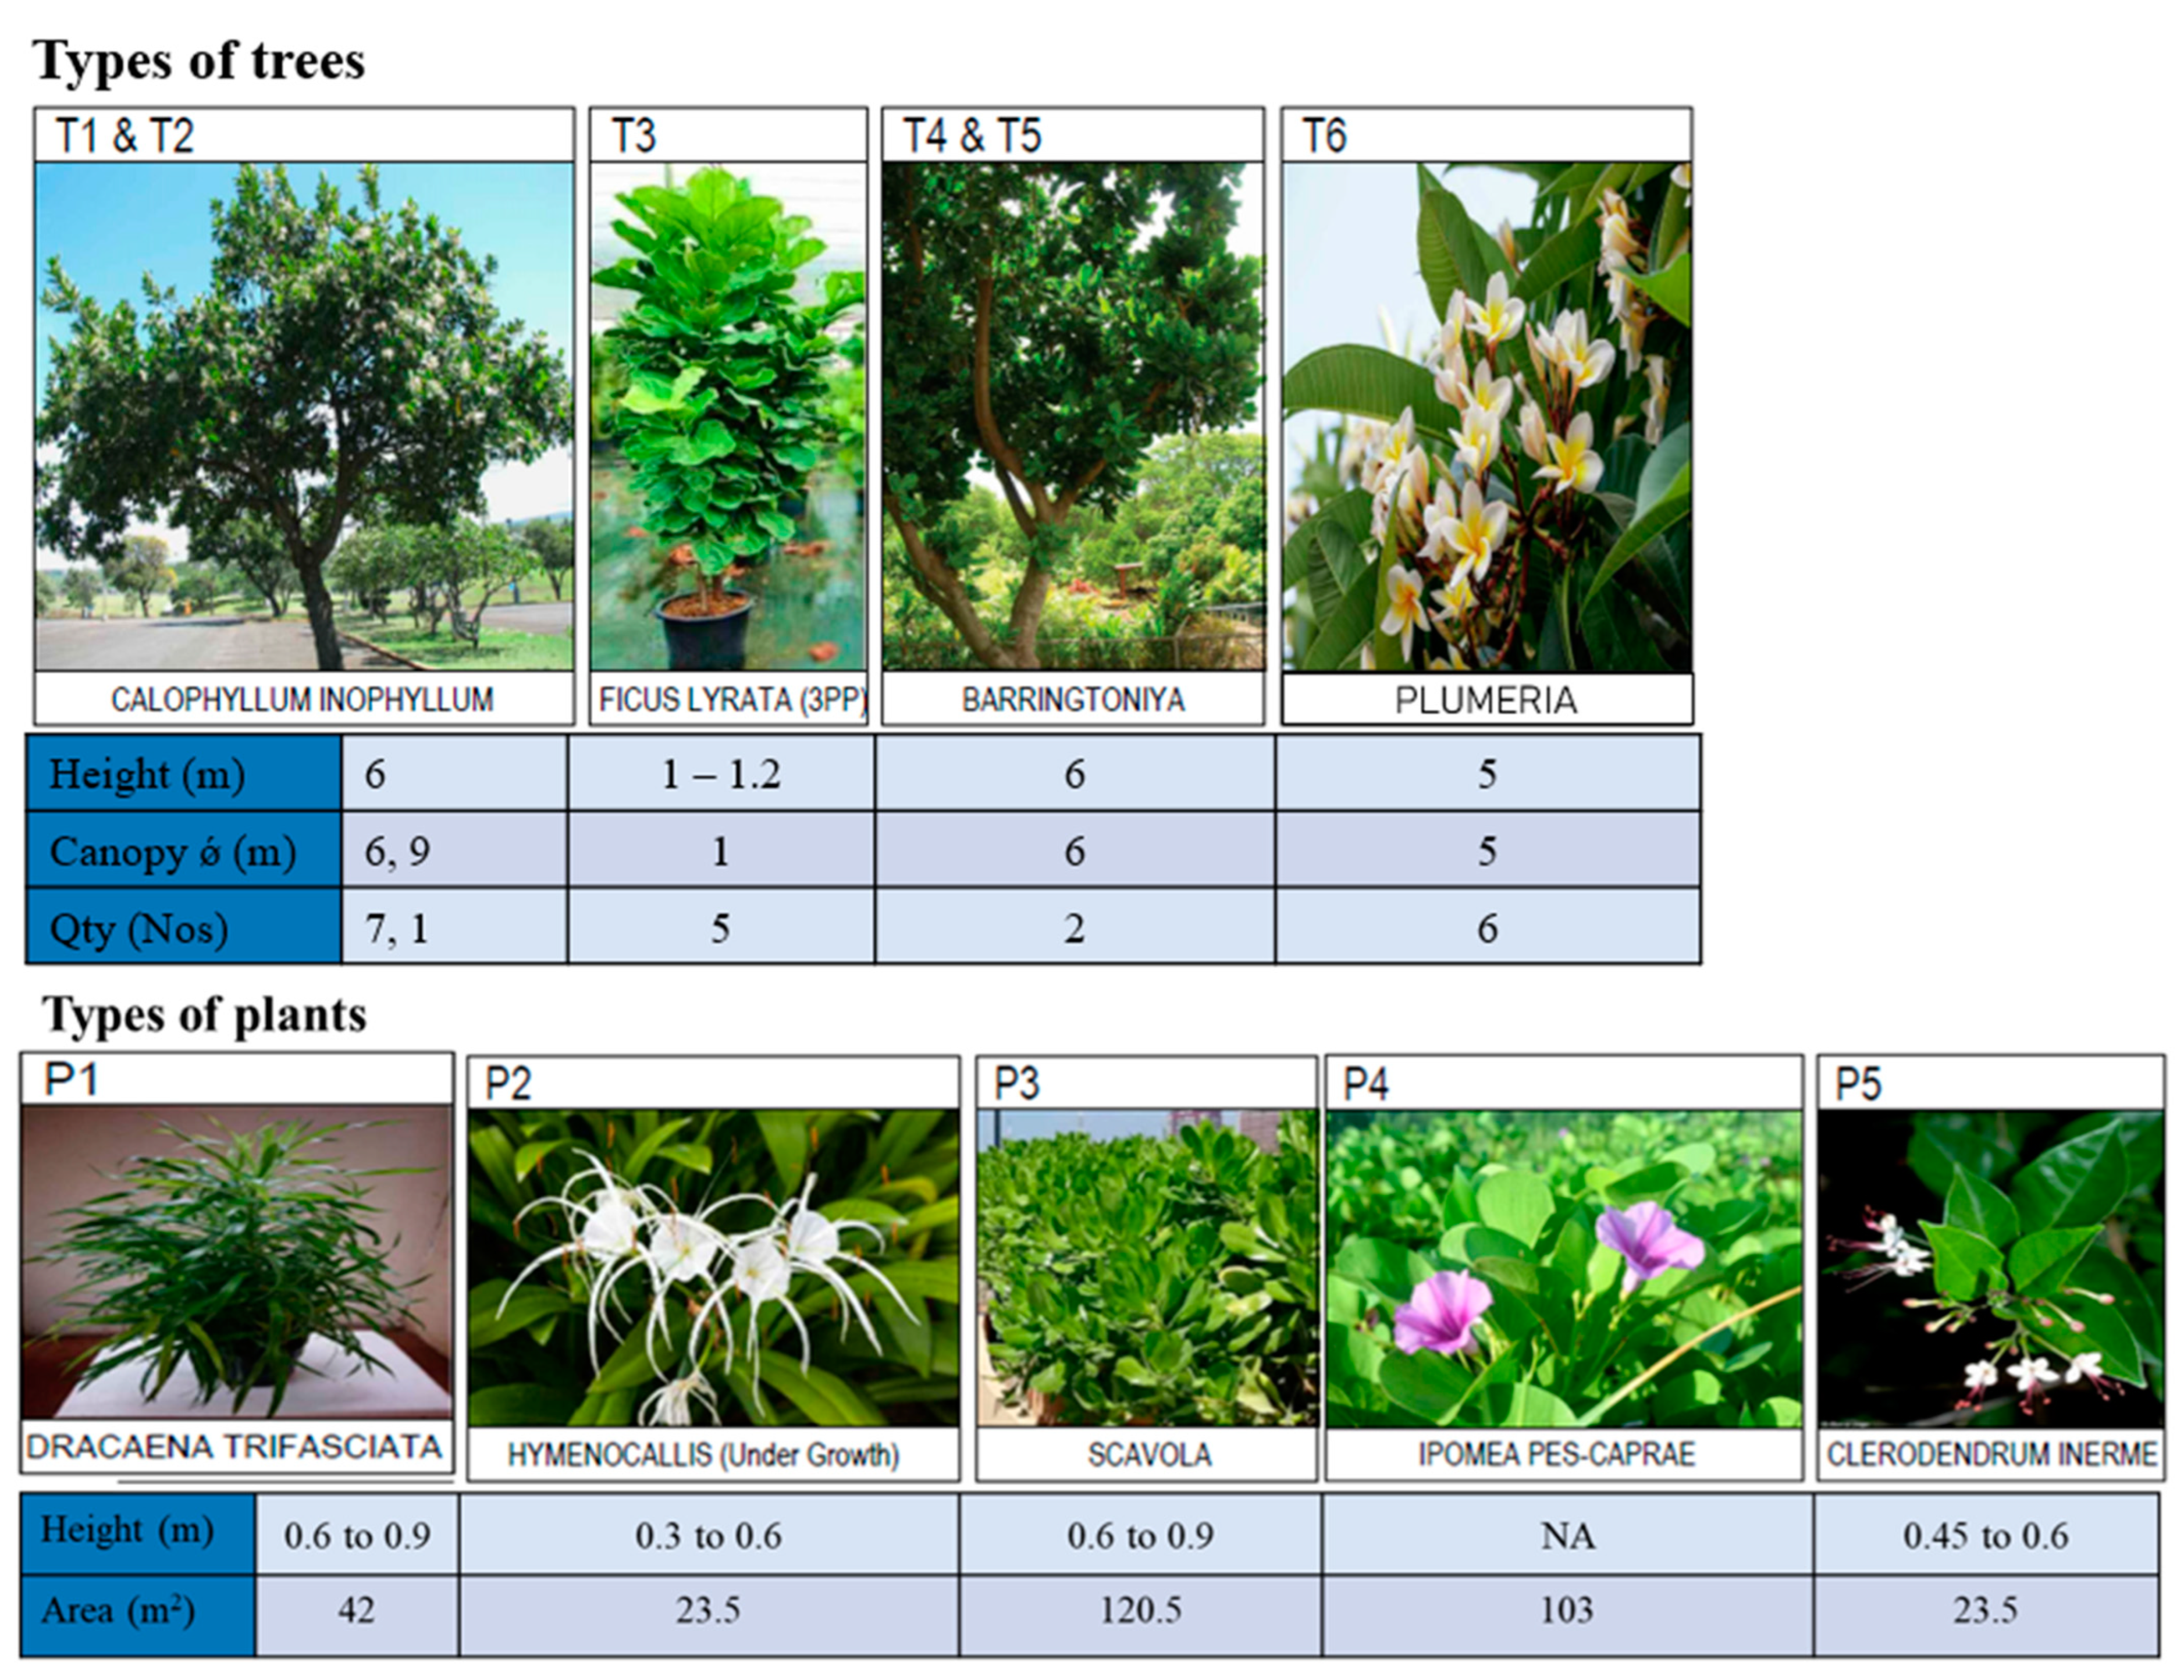

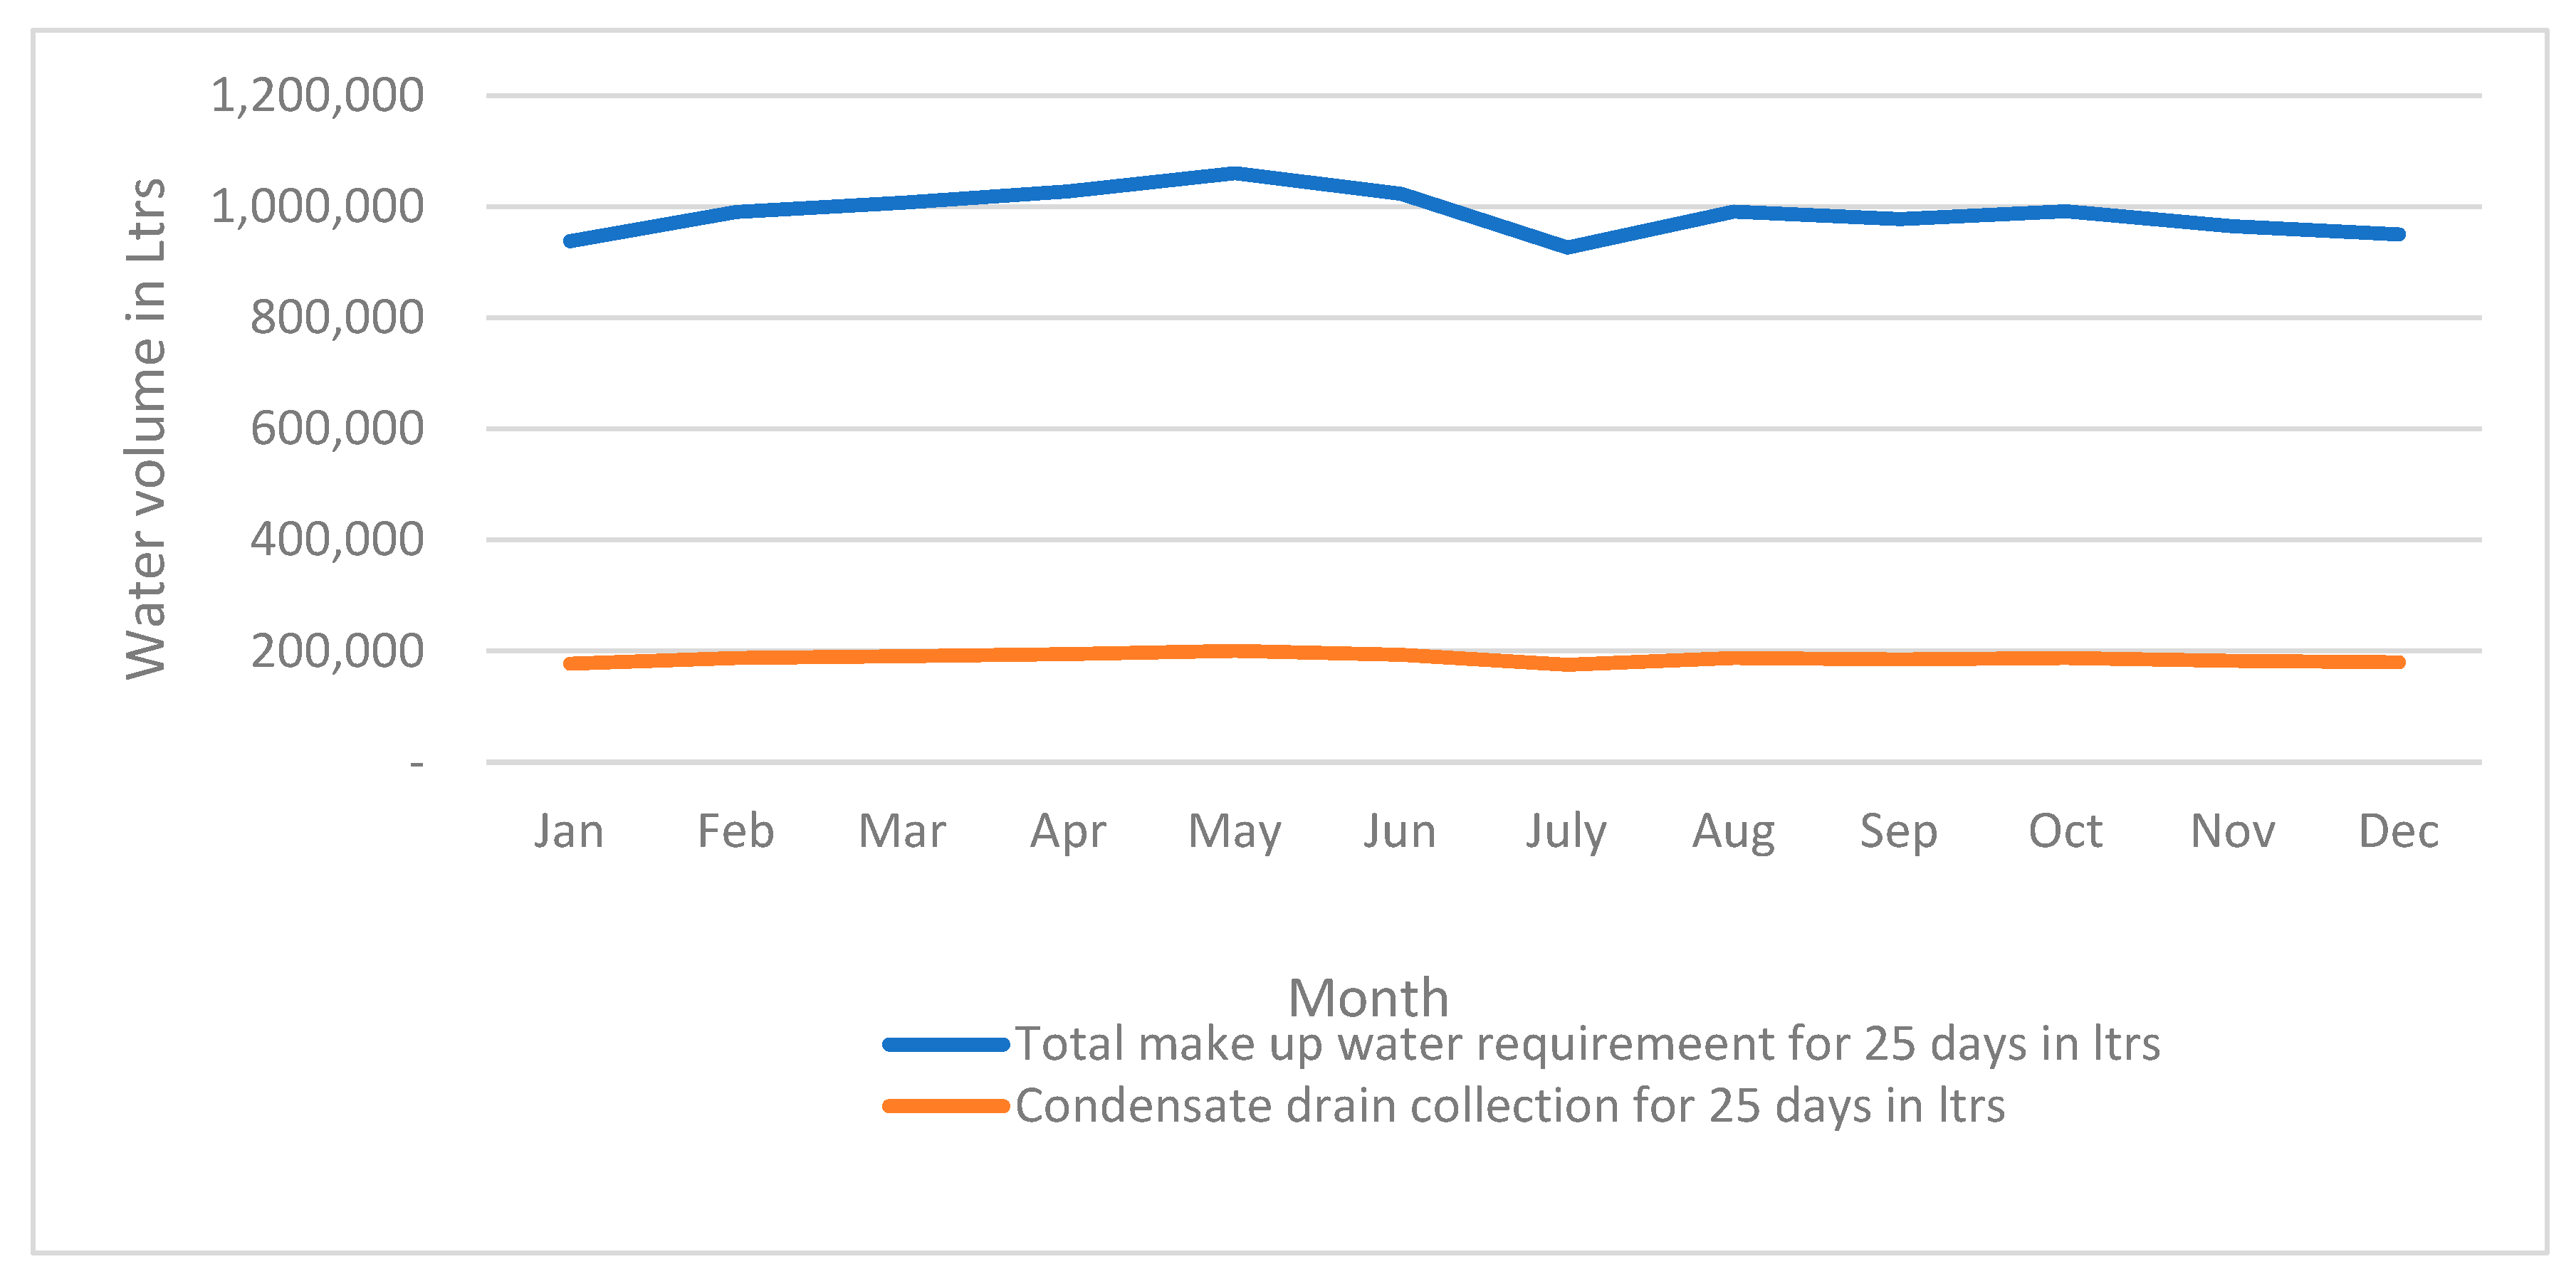

Disclaimer/Publisher’s Note: The statements, opinions and data contained in all publications are solely those of the individual author(s) and contributor(s) and not of MDPI and/or the editor(s). MDPI and/or the editor(s) disclaim responsibility for any injury to people or property resulting from any ideas, methods, instructions or products referred to in the content. |
© 2024 by the authors. Licensee MDPI, Basel, Switzerland. This article is an open access article distributed under the terms and conditions of the Creative Commons Attribution (CC BY) license (https://creativecommons.org/licenses/by/4.0/).