Article

Source-Oriented Health Risks and Distribution of BTEXS in Urban Shallow Lake Sediment: Application of the Positive Matrix Factorization Model

1
Department of Ecology and Technoeconomics, National Institute of the Republic of Serbia, Institute of Chemistry, Technology and Metallurgy, University of Belgrade, Njegoševa 12, 11001 Belgrade, Serbia
2
Faculty of Technology and Metallurgy, University of Belgrade, Karnegijeva 4, 11120 Belgrade, Serbia
3
Innovation Center of Faculty of Technology and Metallurgy, Karnegijeva 4, 11120 Belgrade, Serbia
*
Author to whom correspondence should be addressed.
Water 2024, 16(16), 2302; https://doi.org/10.3390/w16162302
Submission received: 18 July 2024 / Revised: 11 August 2024 / Accepted: 13 August 2024 / Published: 15 August 2024
(This article belongs to the Special Issue Fate, Transport, Removal and Modeling of Pollutants in Water)

Abstract

:
The degradation of sediments in urban environments worldwide is driven by population growth, urbanization, and industrialization, highlighting the need for thorough quality assessment and management strategies. As a result of these anthropogenic activities, benzene, toluene, ethylbenzene, xylenes, and styrene (BTEXS) are persistently released into the environment, polluting sediment. This study employed self-organizing maps (SOMs), positive matrix factorization (PMF), and Monte Carlo simulation of source-oriented health risks to comprehensively investigate sediment in an urban shallow lake in a mid-sized city in central Serbia. The results indicated a mean ∑BTEXS concentration of 225 µg/kg, with toluene as the dominant congener, followed by m,p-xylene, benzene, ethylbenzene, o-xylene, and styrene. Three contamination sources were identified: waste solvents and plastic waste due to intensive recreational activities, and vehicle exhaust from heavy traffic surrounding the lake. Both non-carcinogenic and carcinogenic health risks were below the permissible limits. However, children were more susceptible to health risks. Benzene from vehicle exhaust is the most responsible for non-carcinogenic and carcinogenic health risks in both population groups. The results of this study can help researchers to find a suitable perspective on the dynamics and impacts of BTEXS in lake sediments.

1. Introduction

The contamination of sediments in urban environments is associated with population growth, rapid industrial development, and urbanization [1,2,3]. When contaminants enter aquatic systems, they bind to suspended particles and settle in the bottom sediments, accumulating at concentrations far exceeding natural levels [4]. Moreover, serving as pollutant reservoirs, contaminants in sediment can resuspend, leading to secondary pollution in surface water [5].
Volatile organic compounds (VOCs) represent a significant category of contaminants that are persistently released into aquatic environments through human activities [6,7,8,9]. The group of VOCs consisting of benzene, toluene, ethylbenzene, xylenes (o, m, and p-), and styrene (BTEXS) stands out as the most commonly detected in environmental matrices [10,11]. BTEXS are major components of gasoline, and they are released into the environment through vehicle exhaust [12,13]. Moreover, they are often used as solvents in various industrial products and are typical byproducts of coal combustion [14].
Properly identifying and allocating pollution sources is crucial for controlling and mitigating BTEXS sediment contamination. Receptor models are predominantly used in source apportionment methods, with the positive matrix factorization (PMF) model being the most commonly used [15]. Unlike other receptor models, PMF assigns a weight to the uncertainty of data and incorporates this information into the final outcomes [16]. Additionally, the PMF solution is constrained to non-negative values, ensuring that its interpretation remains physically meaningful [2]. Numerous studies have demonstrated that PMF yields more precise results compared to other receptor models [17,18,19].
BTEXS are associated with significant health risks due to their toxic and carcinogenic properties [20]. Benzene is classified as a Group 1 human carcinogen, while ethylbenzene and styrene are considered potential human carcinogens (Group 2B) [21]. Xylene and toluene exposure can result in respiratory, cardiovascular, renal, and neurological health problems, although carcinogenicity to humans has not been determined [21,22]. Therefore, assessing the human health risks of BTEXS is of great importance.
Traditional deterministic health risk assessment (HRA) methods, such as that proposed by the United States Environmental Protection Agency (USEPA) [23], use set parameters, which may not be precise in assessing the exposure risk for a specific population group [24]. For example, adult individuals exhibit diverse body weights, ingestion rates, and skin area. This variability also extends to children as a population group. Calculating health risks using average body weight and ingestion rate can lead to considerable uncertainty in the resulting findings and may lead to overestimating or underestimating the risk. Monte Carlo probabilistic risk assessment, which integrates the uncertainty of HRA parameters into the evaluation process, can effectively address this problem [25]. By executing multiple random iterations, a Monte Carlo simulation assesses the likelihood of risk occurrence, providing a more precise assessment of health risks [26]. Despite their extensive use in evaluating health risks from contaminants in soil [27] and groundwater [28], Monte Carlo simulations have not been commonly employed in studies focusing on sediment quality, particularly BTEXS.
To the best of our knowledge, there has been a lack of studies examining BTEXS in sediments, while providing insights into pollution sources and health risks arising from BTEXS exposure. This gap underscores the need for additional research to advance the understanding of the distribution and impacts of BTEXS in lake sediment ecosystems. The current study aims to address this knowledge gap and contribute significantly to the scientific community by offering novel insights and data that can enrich the current understanding of the behavior of BTEXS and their effects on lake sediments.
Therefore, this study aimed to (1) characterize the BTEXS distribution in the sediments of the urban Bubanj Lake, (2) allocate potential BTEXS pollution sources, and (3) employ both deterministic and probabilistic human health risk assessment approaches to evaluate human exposure to BTEXS in sediments.

2. Materials and Methods

2.1. Study Area

In this study, sediment samples were taken from the urban shallow Bubanj Lake, located in the city of Kragujevac (44°01′0.01″ N, 20°55′0.01″ E), central Serbia (Figure 1). Kragujevac, with a population of approximately 170,000 residents, is the fourth largest city in the country and serves as the administrative center of the Šumadija District [29]. It is situated in the Lepenica river valley at an elevation of 180 m and covers an area of 835 km2 [30]. The city has a temperate continental climate with an annual average precipitation of 600–650 mm [31].
Bubanj Lake is approximately 2.7 ha in size with an average depth of 1.20 m. Its bed primarily consists of mud, which varies in thickness from 0.50 to 0.70 m. The primary sources of water for the lake include the “Bubanj” drinking water fountain and underground spring, in addition to precipitation. Situated in the city center, Bubanj Lake is bordered by busy roads on three sides. The lake is a well-visited tourist destination due to its natural beauty. Furthermore, the lake is also used for recreational sport fishing activities [32]. Despite its strategic location and potential importance for the surrounding area, Bubanj Lake has not been adequately researched. Moreover, urbanization poses numerous challenges, especially bearing in mind a high concentration of population in a small area, which requires a series of measures and procedures for building and organizing urban settlements, as well as measures to prevent impacts on the living environment.

2.2. Sampling and Laboratory Analysis

The sampling campaign was conducted during autumn 2022. A total of 25 sediment samples (Figure 1) were collected using a sediment core sampler (Royal Eijkelkamp, model 12.42) equipped with a piston to ensure the collection of an intact core without any loss. Three sediment samples were gathered at each sampling site and combined to produce a mixed sample weighing approximately 1 kg. The mixed samples were carefully stored in glass containers pre-rinsed with deionized water. Afterward, the samples were taken to the laboratory for further analysis.
A portion of the 5 g mixed sample was placed in a pre-weighed 40 mL glass vial with a septum-sealed screw cap. The vial with the sample was weighed in the laboratory, and 5 mL of deionized water was transferred into the vial using a disposable Pasteur pipette. The vial was then placed into the autosampler instrument.
Afterwards, concentrations of BTEXS in sediment samples were determined using Purge and Trap Gas Chromatography/Mass Spectrometry (P&T-GC/MS, Tekmar Atomx XYZ, Agilent 7820A/5977B, Santa Clara, CA, USA).

2.3. Quality Control and Quality Assurance

The P&T-GC/MS instrument was calibrated using six standards diluted from a certified multi-component reference standard stock solution: 8260 MegaMix (Restek, Bellefonte, PA, USA). The linearity of each of the five VOCs was verified with a correlation coefficient exceeding 0.995.
Certified reference material (BTEX-Silt Loam 1, Merck, Darmstadt, Germany), reagent blanks, and triplicate samples were included throughout the entire analytical procedure for quality assurance and quality control. Reagent blanks were included after every five samples, and the recovery rates for the analyzed VOCs in the certified reference material ranged from 91% to 108%. The concentrations of BTEXS in the sediment were obtained as the average of three measurements and expressed in μg/kg of dry matter.

2.4. Positive Matrix Factorization

This study utilized the positive matrix factorization (PMF) receptor model for the pollution source apportionment of BTEXS in sediments. This model can determine pollution sources and quantify the contribution of each source to each pollutant concentration. Factor analysis was optimized using the standard deviation of the data, aiming to minimize the objective function Q [33]. The PMF model is based on the following equations [26].
Q = i = 1 n j = 1 m e i j u i j 2 = i = 1 n j = 1 m x i j k = 1 p g i k f k j u i j 2 b
u i j = 5 6 × M D L c < M D L e f × c 2 + 0.5 × M D L 2 c > M D L
where xij, gik, fkj, eij, uij, c, ef, and MDL represent the concentration of the jth BTEXS in the ith sample, the contribution of the kth source to the ith sample, the concentration of the jth BTEXS from the kth source, the residual error of the jth BTEXS in the ith sample, the uncertainty of the jth BTEXS in the ith sample, the concentration of a certain BTEXS, the error fraction, and the method detection limit, respectively. The number of variables examined, samples analyzed, and sources identified are represented by m, n, and p, respectively.

2.5. Source-Oriented Health Risk Assessment

The source-oriented health risks of two population groups (adults and children) via ingestion and dermal exposure pathways were assessed using the deterministic health risk assessment model proposed by the USEPA [23] integrated with the PMF model.
Health risk assessment involves determining non-carcinogenic risk, denoted by hazard index (HI), and carcinogenic risk, denoted by total cancer risk (TCR). Calculation of the risks is based on the following equations [27]:
C i j k = F i j k × C i j
A D D i j   i n g k = C i j k × I n g R × E F × E D B W × A T × C F
A D D i j   d e r m k = C i j k × S A × A F × A B S × E F × E D B W × A T × C F
H I = H Q i j , p k = A D D i j ,   p k R f D i , p
T C R = C R i j , p k = A D D i j ,   p k × C S F i ,   p  
where C i j k , F i j k , and C i j represent the concentration of the jth BTEXS in the ith sample from the kth source in mg/kg, the contribution of the jth BTEXS in the ith sample from the kth source, and the measured concentration of the jth BTEXS in the ith sample in mg/kg, respectively; A D D i j   i n g k and A D D i j   d e r m k denote average daily dose (mg/(kg day)) of the jth BTEXS in the ith sample from the kth source for ingestion and dermal exposure pathways, respectively; H Q i j , p k and C R i j , p k are the hazard quotient and carcinogenic risk of the jth BTEXS in the ith sample from the kth source on the pth exposure pathway, respectively; the exposure parameters IngR, EF, ED, BW, AT, SA, AF, ABS, and CF are defined and valued in Table 1, with RfD and CSF provided in Table 2 [34,35,36,37,38].
Non-carcinogenic risk >1 is considered non-negligible. Carcinogenic risk below 10–6 is considered insignificant, while between 10−6 and 10−4 is deemed acceptable. However, when carcinogenic risk is greater than 10−4, the risk is unacceptable [39,40].

2.6. Monte Carlo Simulation

Considering the uncertainties associated with the exposure parameters used in the health risk evaluation, as well as the BTEXS concentrations obtained from the analysis, a Monte Carlo simulation was employed to minimize risk assessment uncertainty.
The model comprises three stages: first, establishing the probability distribution of uncertain parameters; second, employing random sampling to select values from the distribution; and finally, integrating these values into the deterministic HRA equations [26]. Consequently, probability distributions for health risks are generated. Through the integration of the PMF model and the Monte Carlo method, probabilistic source-oriented health risks arising from BTEXS exposure in sediment were obtained. A simulation approach involving 10,000 iterations was executed at a 95% confidence level. Table 1 presents the distributions used for exposure parameters.

2.7. Data Analysis

Statistical analyses were performed using SPSS software v. 23 (IBM, Armonk, NY, USA). Origin Pro v. 2022 (OriginLab, Northampton, MA, USA) was used to generate all graphs, while spatial distribution maps were generated using qGIS v. 3.34 software (qGIS, London, UK). Source apportionment was conducted using EPA PMF v. 5.0 software [41], whereas the Monte Carlo simulation was executed using Microsoft Excel 2016 (Microsoft Corporation, Redmond, WA, USA).

3. Results and Discussion

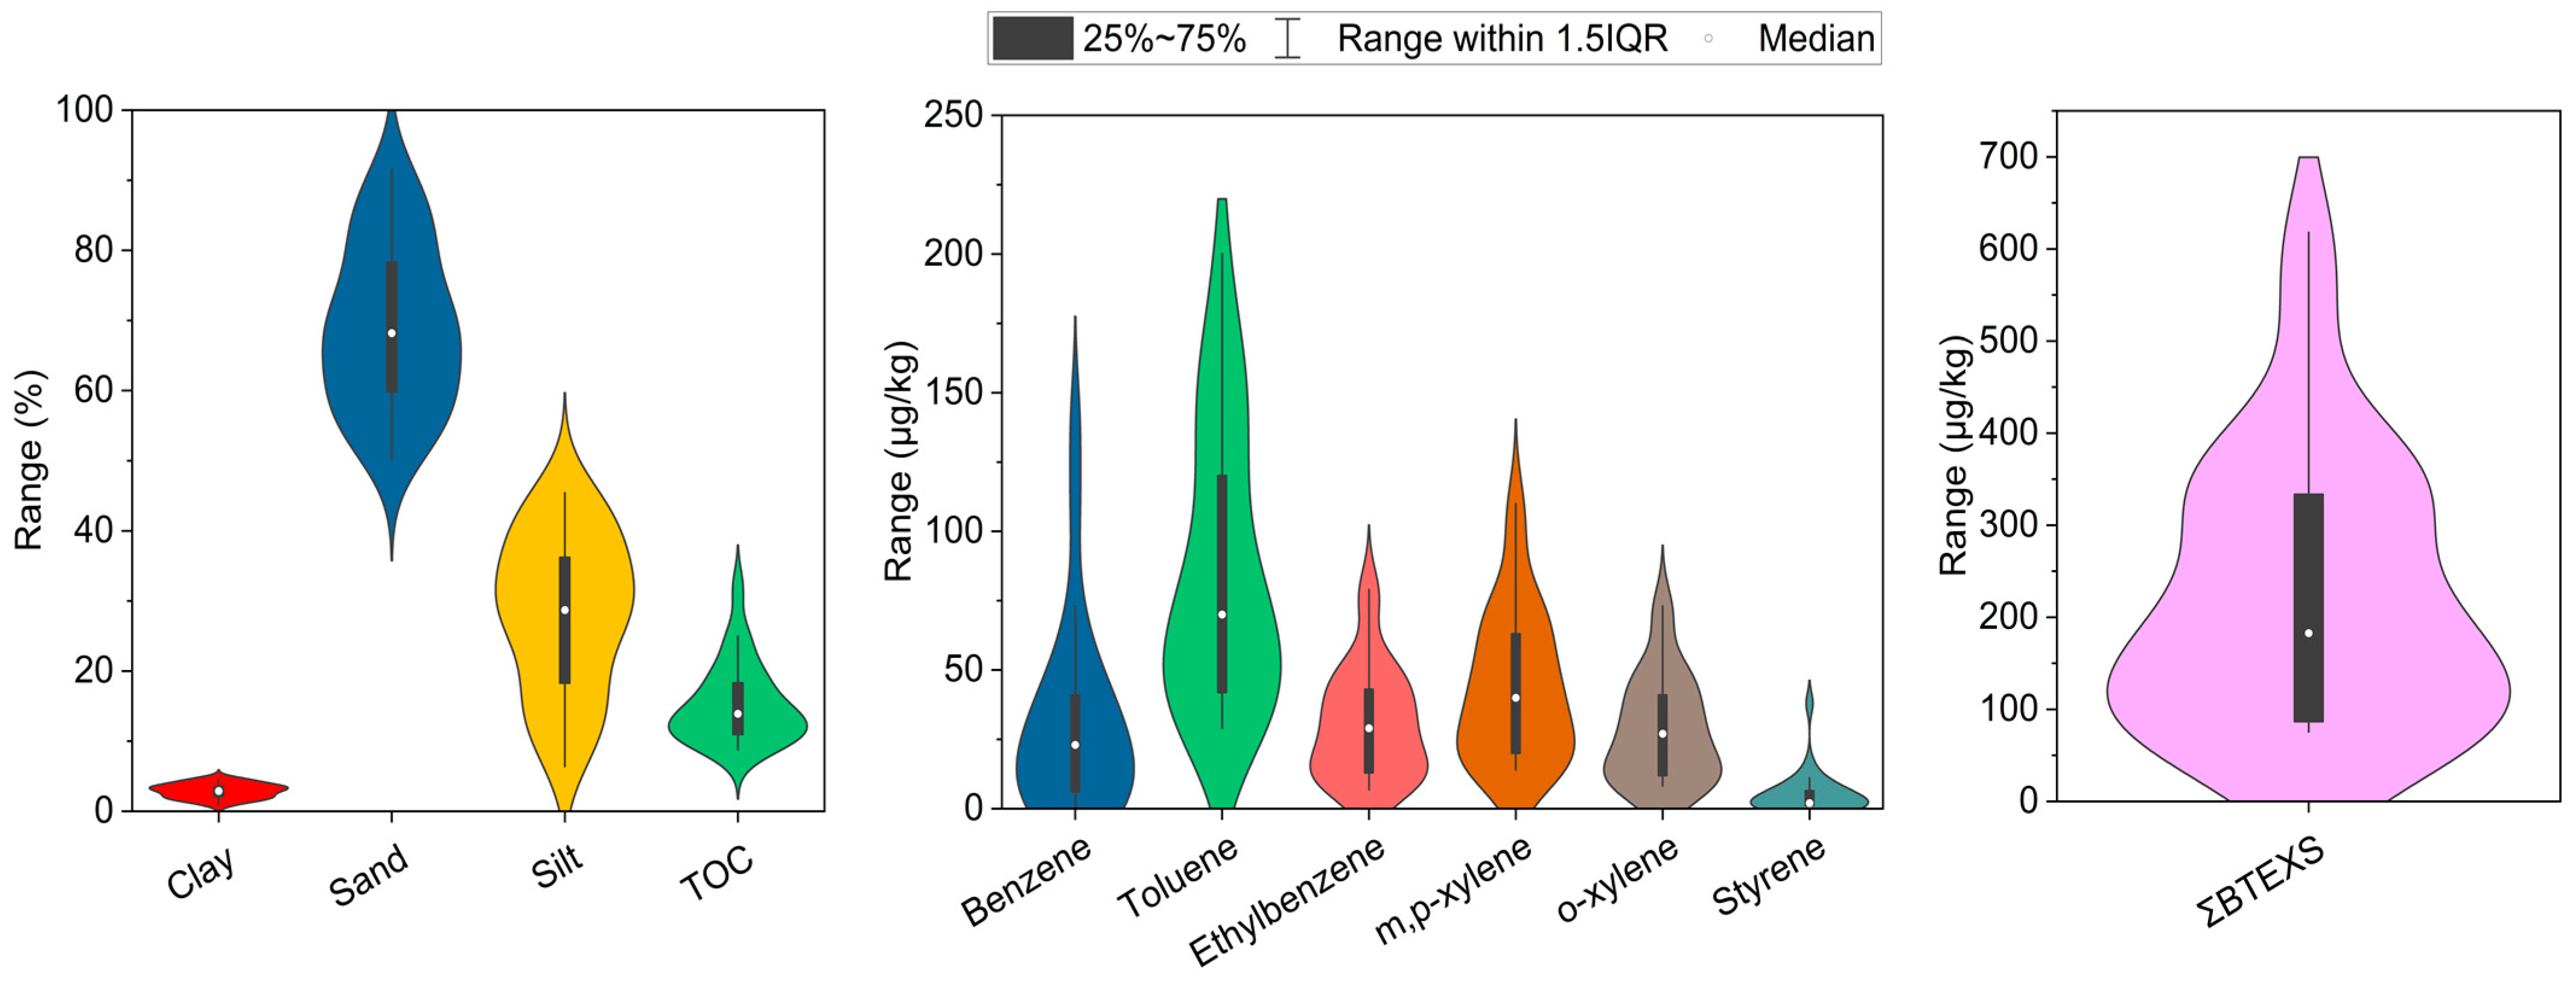
3.1. Occurrence of BTEXS in the Surface Sediments of Bubanj Lake with Concentration Characteristics

The results of sediment texture analysis and BTEXS concentrations are presented in Figure 2 and Table S1. The analysis of sediment texture showed that surface sediment samples from Bubanj Lake were predominantly composed of sand (mean content = 69.0%), followed by silt (28.1%) and clay (2.9%). The sediment texture and grain size may affect the BTEXS accumulation potential. It is known that sediments dominantly composed of sand exhibit lower adsorption of BTEXS, compared to sediments with high clay content, due to weaker bonds between particles [42,43].
The total BTEXS concentration (∑BTEXS) in the surface sediment in the study area was in the range of 75.5–618 µg/kg, averaging 225 µg/kg. The highest ∑BTEXS concentration was observed at sampling point S1 (618 µg/kg), followed by sampling points S3 (530 µg/kg), S6 (381 µg/kg), S4 (371 µg/kg), and S9 (354 µg/kg). The majority of samples exhibited a ∑BTEXS concentration above 100 µg/kg (68.0%), whereas 36% of samples showed a ∑BTEXS concentration in sediment above 300 µg/kg. More specifically, ∑BTEXS concentrations exceeding 300 µg/kg were observed at sampling points S1 to S9, located in the southeastern part of the lake.
The mean concentration of BTEXS in the sediments of Bubanj Lake decreased in the following order: toluene (85.8 µg/kg) > m-, p-xylene (43.8 µg/kg) > benzene (30.6 µg/kg) > ethylbenzene (30.5 µg/kg) > o-xylene (28.5 µg/kg) > styrene (5.4 µg/kg). It was observed that toluene was the dominant congener, accounting for 40.7% of the total concentration. Other congeners accounted for significantly lower proportions, with m-, p-xylene, ethylbenzene, o-xylene, benzene, and styrene contributing 20.4%, 13.8%, 12.7%, 10.5%, and 1.9%, respectively, to the total BTEXS concentration. The prevalence of toluene as a congener might be attributed to its extensive use as an organic solvent in the chemical and paint industries, as well as its role as a gasoline additive [44].
The mean ∑BTEXS concentration was significantly lower than that observed in the sediments of Ubeji Creek [42] (Table 3). This can be attributed to Ubeji Creek’s sediment clay content, which was almost 20 times higher than that of Bubanj Lake. A similar situation was observed in the sediments of the Epe Lagoon in Nigeria [45]. However, sediments from the Gulf of Saros coastal areas of northwestern Turkey [46], along with sediments from the Adriatic Sea in Italy [47], demonstrated much lower BTEXS concentrations than those from Bubanj Lake. High sand content in the sediments of both the Gulf of Saros and the Adriatic Sea resulted in relatively low ∑BTEXS concentrations. River sediments in industrial areas of South Korea also exhibit lower BTEXS concentrations [10]. However, the dominant congener in industrial areas of South Korea is toluene, with a mean concentration of 90 µg/kg, similar to that obtained in this study. Furthermore, BTEXS concentrations in sediments from the boat harbor in Pictou County, Canada, were significantly lower than in this study, with levels falling below the detection limit in all samples [48]. The concentrations of BTEXS at Bubanj Lake were notably higher compared to Chanomi Creek [49], offshore sediments in Nigeria [50], and Lake Iznik in Turkey [51], indicating a more significant local source of contamination. Higher levels of BTEXS congeners at Bubanj Lake suggest a substantial impact from industrial activities or vehicular emissions in the region, unlike the previously mentioned locations, which are relatively uninhabited and less impacted by such sources.
The spatial distribution of the BTEXS concentrations is depicted in Figure 3. It can be seen that all congeners exhibited similar distribution patterns. The highest concentrations were observed in the southern parts of the lake, with levels gradually decreasing toward the north. This trend may be attributed to the proximity of the southern part of the lake to the road, resulting in greater exposure to car exhaust gasses, which are common sources of BTEXS in the environment [43]. In addition, 40% of the samples exhibited a toluene-to-benzene ratio ranging from 1.5 to 4.0, suggesting vehicle exhaust as one of the main contributors to BTEXS in the study area [52].

3.2. Multivariate Statistics

3.2.1. Pearson Correlation Analysis
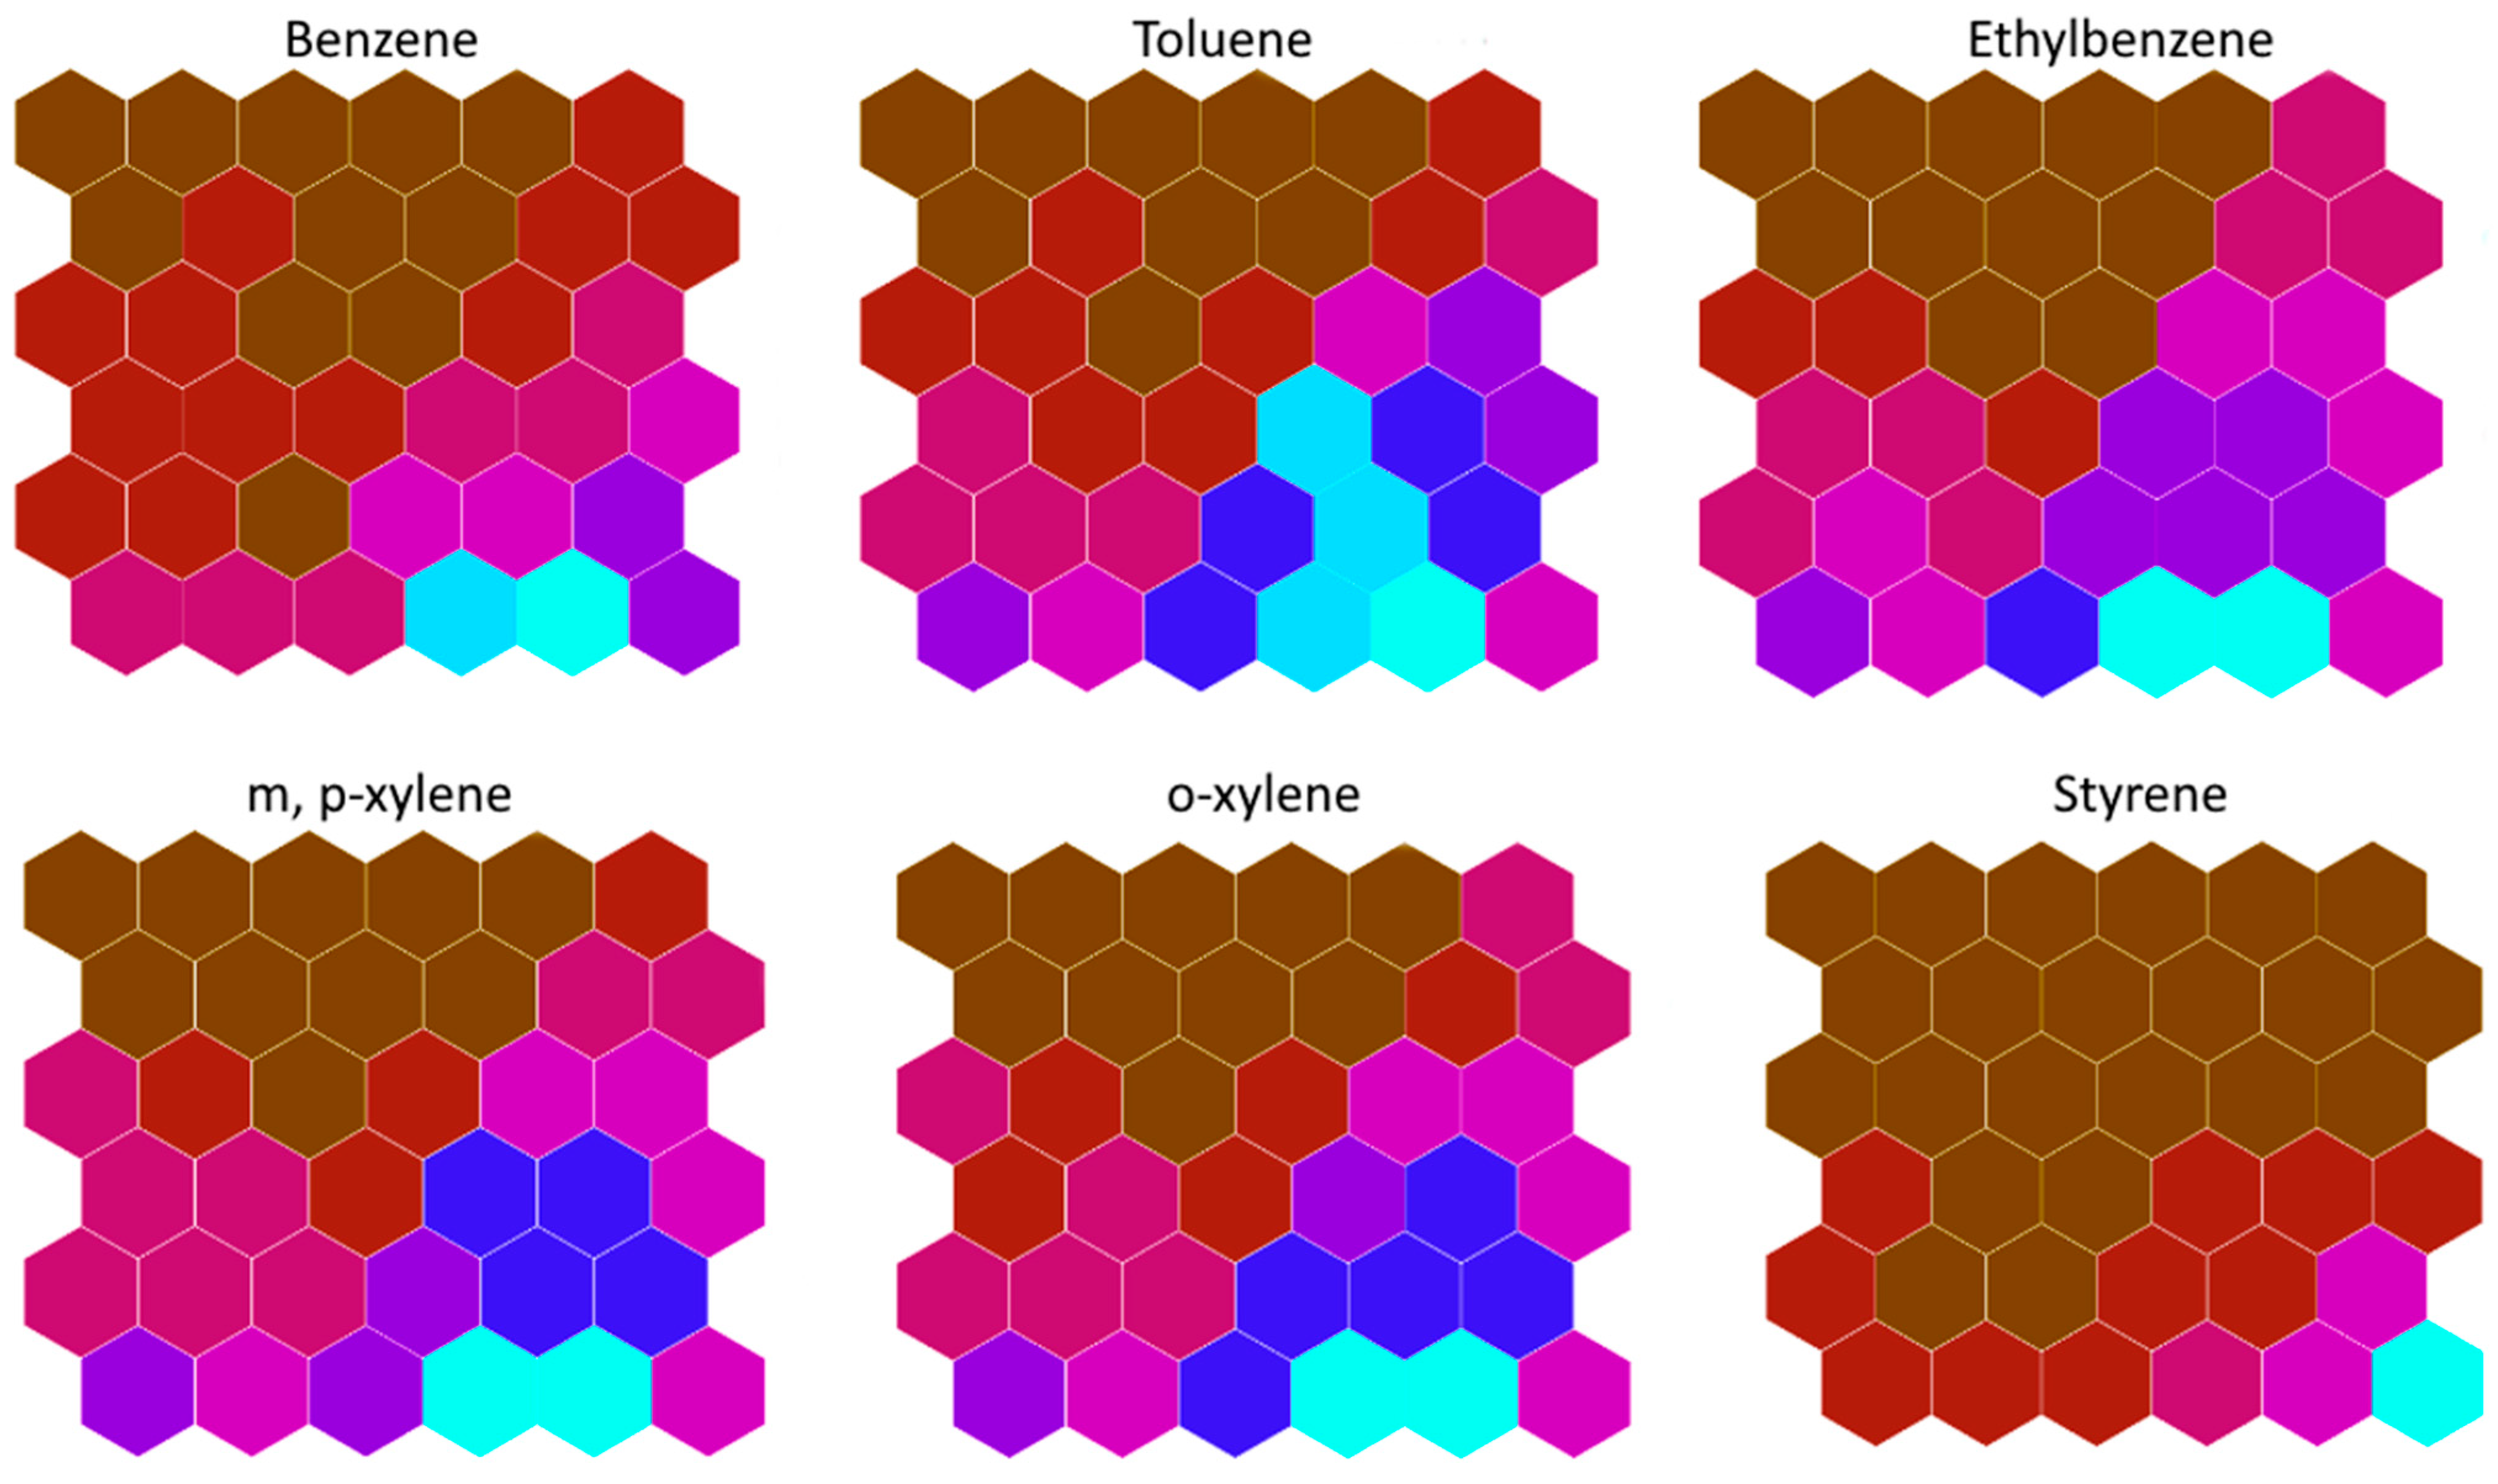
Pearson correlation analysis was performed to determine the relationship between BTEXS congeners and sediment characteristics and assess their origin in the sediment. The results are summarized in Table 4. Values of the correlation coefficient (r) below 0.5, between 0.5 and 0.7, and above 0.7 indicate weak, moderate, and strong correlations, respectively [53].
This study found a weak and non-significant correlation between BTEXS compounds and TOC, meaning that BTEXS compounds do not easily sorb onto organic matter. However, TOC was significantly but weakly correlated with silt (r = −0.418) and sand (r = 0.431). All BTEXS congeners showed significant medium to strong positive correlations with one another. The strongest correlation was found between m,p-xylene and o-xylene (r = 0.993) and between ethylbenzene and m,p-xylene (r = 0.992). Moreover, strong positive correlations were observed between toluene and ethylbenzene, m,p-xylene, and o-xylene, with correlation coefficients of 0.968, 0.980, and 0.974, respectively. These strong positive correlations between BTEXS congeners undoubtedly suggest their common pollution source in the lake sediment. Additionally, styrene exhibited a moderate positive correlation with all tested BTEXS compounds, indicating that styrene levels in the sediment are not primarily influenced by the same pollution sources as other BTEXS congeners.

3.2.2. SOMs

The relationships among BTEXS congeners can provide insights into their sources in sediments. However, SOM was employed to further examine the relationship between BTEXS and their sources. The bubble neighborhood function was trained on 6 variables and 25 observations. After multiple rounds of iterative training, the weight matrix for each variable was obtained, minimizing the quantization and topographic errors to 0.95 and 0.05, respectively. Consequently, SOM classification was achieved through a six-row by six-column arrangement with a hexagonal topology. The component planes of the SOM for BTEXS after training are illustrated in Figure 4, and the average distances between each neuron in the SOM component planes are presented in Figure S1. The weight vector value for each neuron is represented by different colors, where cyan indicates high values, while brown represents low values. Identifying correlations between variables can be achieved using a color gradient of each component plain, where identical or similar colors point to a positive correlation.
A similar color pattern was observed for toluene, ethylbenzene, m,p-xylene, and o-xylene. The weight vector value decreases smoothly from the top to the bottom of the component planes. Therefore, these four variables exhibit strong positive correlations. These findings are consistent with the Pearson correlation analysis results, further confirming that they originate from the same source.
Benzene showed a slightly different color pattern to toluene, ethylbenzene, m,p-xylene, and o-xylene, indicating positive but weaker mutual associations. Moreover, these findings point out that the factor affecting benzene content and distribution in sediment was similar to some extent to the one affecting toluene, ethylbenzene, m,p-xylene, and o-xylene.
Conversely, the styrene component plane showed a noticeable, distinctive unique pattern. The unsmooth color transition, with the weight vector value increasing from the bottom right corner of the plain, suggests nongradual changes in styrene concentration across the plane. A unique distribution pattern of styrene concentration in the sediment samples indicates a potential source distinct from the other BTEXS compounds. This observation was corroborated by the moderate correlation coefficient between styrene and the other BTEXS congeners (Table 4).

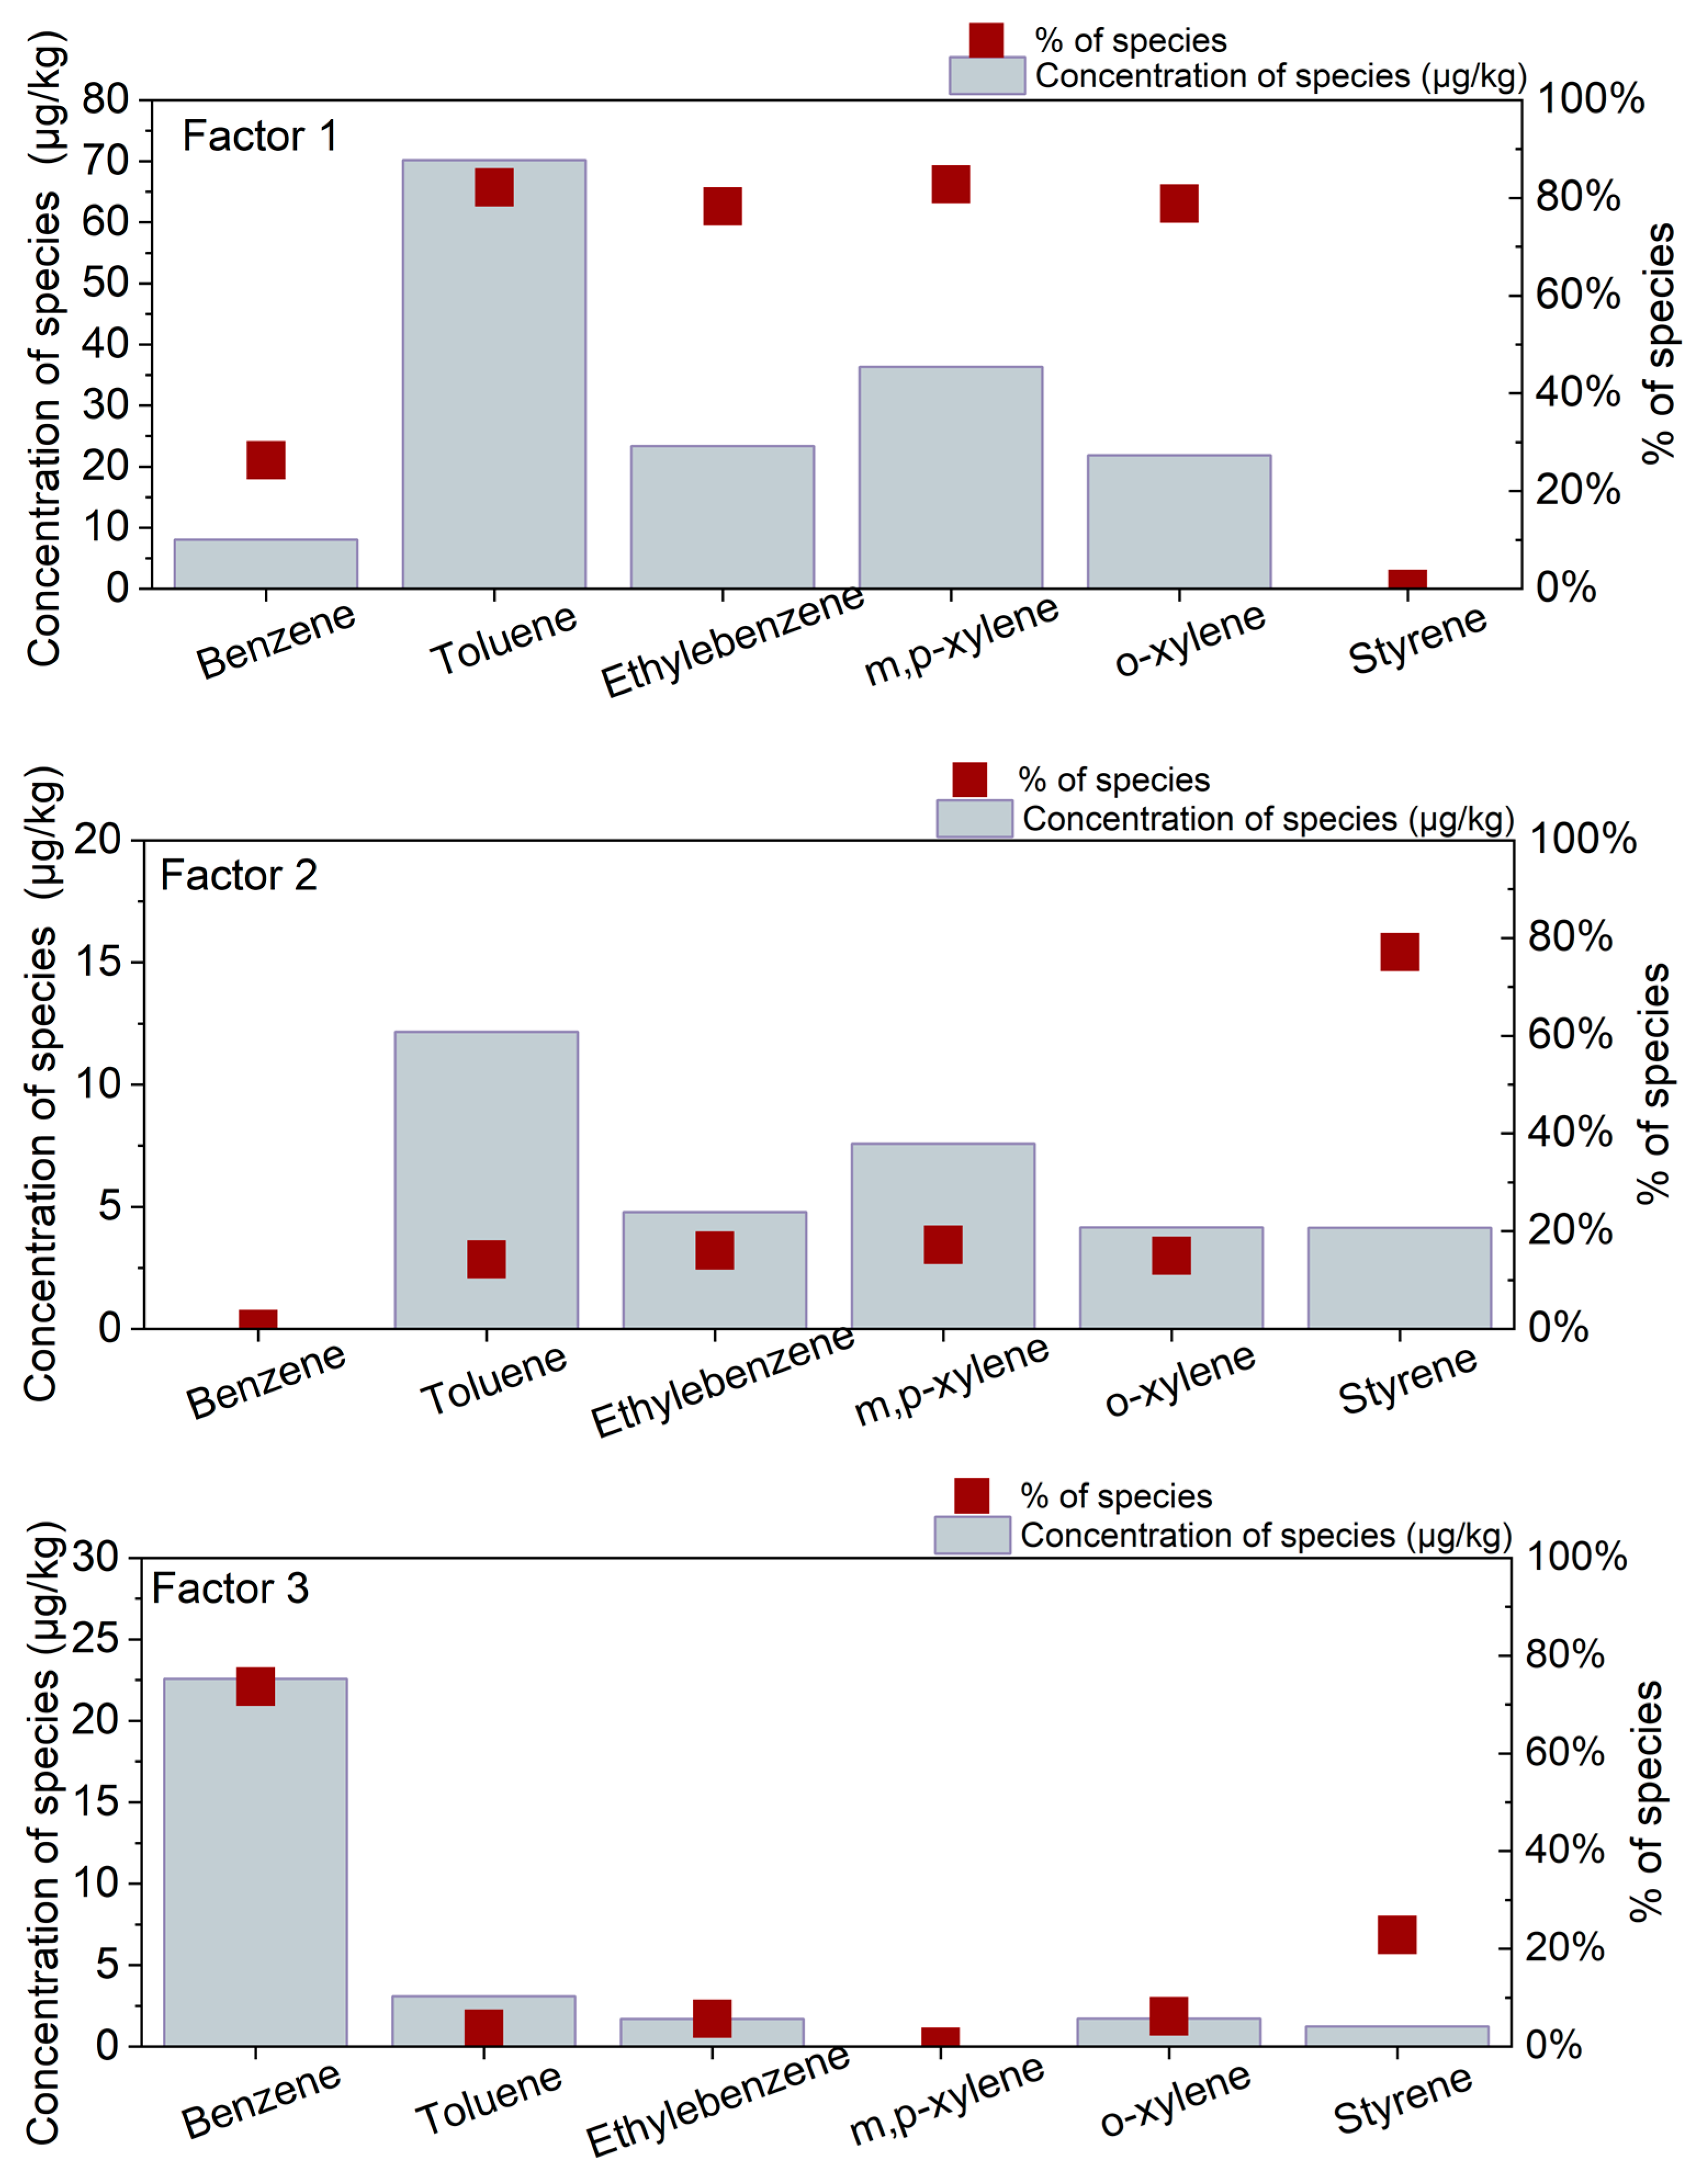
3.3. Pollution Source Apportionment Using the PMF Model

The relationship between BTEXS congeners was initially identified using SOM in conjunction with Pearson correlation analysis, which led to the differentiation of several pollution sources. Nevertheless, this method is unable to quantify pollution sources or apportion their respective BTEXS concentrations in sediment. This problem can be overcome by using the PMF model, which enables quantification of the contributions from different sources to each of the congeners.
The number of factors in the base PMF model was varied from two to five. The PMF model was run sequentially until the QRobust/QExp value reached a minimum. The process was configured for 20 iterations, and the starting seed was selected randomly. Configuring the number of source factors to three resulted in the smallest QRobust/QExp value. Moreover, the majority of the residual matrix values were within the range of ±3, indicating that the PMF model is valid. Moreover, the correlation coefficients between the measured and estimated values were >0.97 for all congeners, demonstrating that the PMF model allocated an adequate number of factors to the analyzed BTEXS to fully explain the data set.
The factor profiles and contributions of each factor to the BTEXS concentrations in the sediments of Bubanj Lake are presented in Figure 5. Factors 1, 2, and 3 accounted for 59.2%, 23.4%, and 17.4% of the contribution rate, respectively, representing different BTEXS pollution sources.
The major contributing variables to factor 1 were toluene (82.9%), ethylbenzene (79.3%), m,p-xylene (85.4%), and o-xylene (79.4%). The dominance of toluene, ethylbenzene, m,p-xylene, and o-xylene (TEX) in factor 1 likely points to solvent waste as a contributing source. Recreational activities around the lake contribute to TEX waste pollution, which can happen through improper disposal of leftover paint thinners, degreasers, or even household cleaning products containing these solvents. Tourists who are unaware of the solvent disposal procedure or simply neglect it leave behind these waste solvents that can leak into the lake water or be washed away by rain, eventually contaminating the lake sediment.
Factor 2 was dominated by styrene (71.9%). The widespread presence of styrene in the environment is primarily due to its extensive use in various plastic products commonly utilized in everyday activities. Styrene is extensively used in urban areas for food packaging applications, including food takeaway containers and disposable lids for soups and hot beverages [54]. Prior research documented the leaching of styrene oligomers from plastic into surrounding water under natural conditions [55]. Consequently, styrene can eventually accumulate in the underlying sediments. Therefore, factor 2 is attributed to plastic waste.
Factor 3 was dominated by benzene (79.6%). Benzene is a well-documented component of gasoline emissions [12,56,57]. This aromatic hydrocarbon is released into the environment during the incomplete combustion of gasoline in engines. A heavy-traffic road very close to the southern part of the lake could have been responsible for the anthropogenic discharge of benzene into the lake. Since Bubanj Lake is located in the traffic-dense urban environment of Kragujevac city, factor 3 can be attributed to vehicle exhaust.

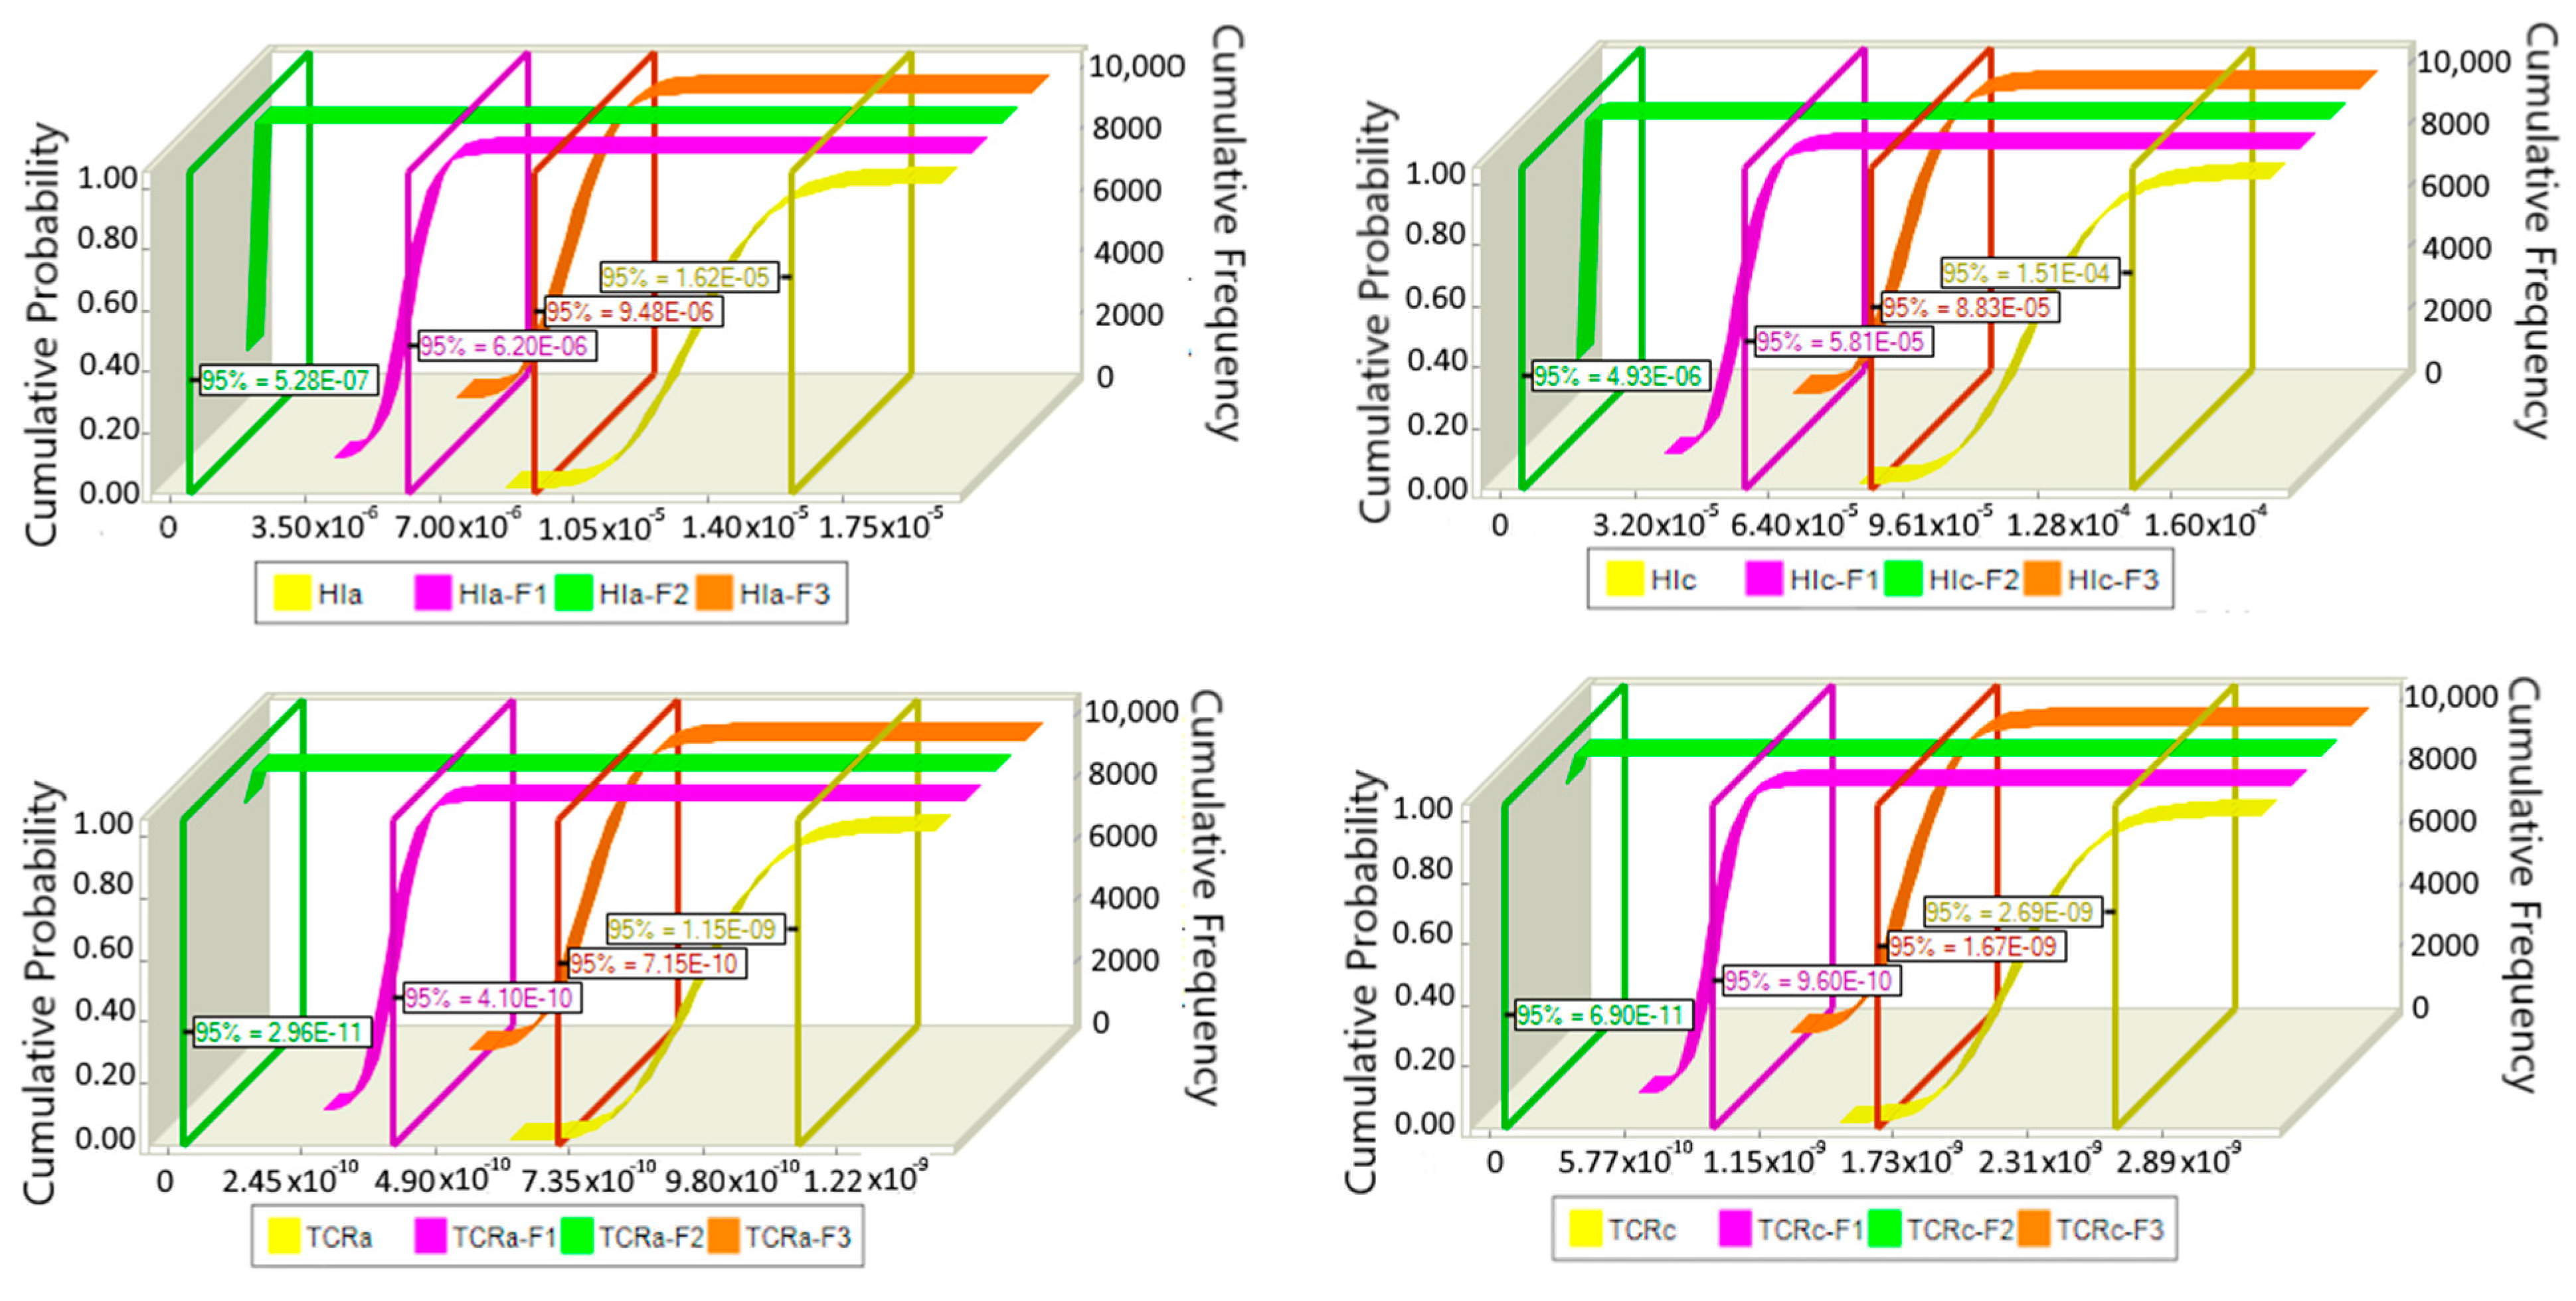
3.4. Health Risks of BTEXS in Sediments

The results of the deterministic health risk assessment are presented in Table 5. Non-carcinogenic health risk for adults (HIa) ranged between 1.29 × 10⁻⁶ and 1.34 × 10⁻⁵, averaging 1.34 × 10⁻⁵, while non-carcinogenic risk for children (HIc) was in the range of 1.20 × 10⁻⁵–5.14 × 10⁻⁴, with an average value of 1.25 × 10⁻⁴. The values of HIa and HIc were well below the permissible limit of 1, indicating negligible non-carcinogenic risk posed by BTEXS in sediment. However, children were more susceptible to non-carcinogenic risk, as evidenced by their approximately nine times higher average risk compared to adults. Regarding both population groups, ingestion was found to be the dominant exposure route to BTEXS in sediment. Both adults and children exhibited hazard quotients via ingestion (HQing) approximately three orders of magnitude higher compared to hazard quotients via dermal contact (HQderm) (Table S2). The contribution of the examined VOCs for both population groups followed the order benzene > toluene > ethylbenzene > m,p-xylene > o-xylene > styrene. Benzene was by far the most dominant, with an average contribution of 63.8% to the non-carcinogenic risk in both adults and children.
The carcinogenic health risk for adults (TCRa) ranged between 8.05 × 10⁻¹¹ and 4.04 × 10⁻⁹, averaging 9.52 × 10⁻¹⁰, whereas the carcinogenic risk for children (TCRc) was in the range of 1.87 × 10⁻¹⁰–9.42 × 10⁻⁹, with an average value of 2.22 × 10⁻⁹. With the carcinogenic risk well below the threshold of 1.0 × 10⁻⁴, it suggests that the population in the study area is not subjected to an unacceptable risk of developing cancer. Children also had higher exposure to carcinogenic risk. Similar to non-carcinogenic risk, ingestion remains the primary exposure route for carcinogenic risk (Table S2). Benzene made the highest contribution to TCRa and TCRc at 69.5%, followed by ethylbenzene with 30.5%.
Children are at a greater health risk than adults owing to their specific frequent hand-to-mouth behavior, including geophagy and pica, as well as lower body weight [58,59]. Those findings are supported by previous researchers who have also demonstrated that children are more susceptible to contaminants than adults [25,60].
In order not to overestimate or underestimate the health risk of BTEXS in the sediment of Bubanj Lake, Monte Carlo simulation was employed. The probability distributions of HI and TCR for adults and children are depicted in Figure 6. Figure 6 also shows the probability distributions of health risks from different sources identified by the PMF model.
The HI and TCR values for both population groups were below the thresholds of 1 and 1.0 × 10⁻⁴, respectively, even at the 95th percentile. Moreover, the 95th percentile values of HIa, HIc, TCRa, and TCRc were 1.62 × 10⁻⁵, 1.51 × 10⁻⁴, 1.15 × 10⁻⁹, and 2.69 × 10⁻⁹, respectively. Therefore, there was no probability of exceeding the thresholds and developing non-carcinogenic diseases or cancer. Previous studies have reported that maintaining risks below the acceptable risk threshold at the 95th percentile can classify the health risks associated with different contaminants as acceptable [61]. However, children remain at higher risk, with the probabilistic health risk assessment validating the conclusions obtained through the deterministic approach.
The contributions of different sources to non-carcinogenic and carcinogenic risks increased in the order of factor 2 < factor 1 < factor 3. Factor 2, attributed to plastic waste pollution, exhibited the least effect on health risk, whereas factor 3, associated with vehicle exhaust pollution, demonstrated the most significant influence. Such order is attributed to the dominance of benzene in the third factor, which has the lowest reference dose value and the highest cancer slope factor, resulting in the highest health risk.
Even with no current probability of non-carcinogenic diseases or cancer development, the risks could potentially increase over time. This trend is primarily due to the expanding population and subsequent increase in transportation modes, potentially resulting in higher BTEXS pollution levels from vehicle emissions. Additionally, annual increases in plastic consumption contribute to a rise in waste generation. Moreover, during the lifetime of plastic, additives such as styrene oligomers can be discharged into the environment, driven by their higher pressure within plastics compared to the surrounding environment [55]. Therefore, continuous monitoring of the sediment in Bubanj Lake is advised. Moreover, effective management strategies must include comprehensive risk assessments that prioritize ingestion, the primary exposure route, alongside dermal contact. Considering that children are more vulnerable to both non-carcinogenic and carcinogenic health risks, those strategies should focus on reducing children’s contact with sediments, potentially through education.

4. Conclusions

This study provides a detailed investigation of the distribution, pollution sources, and source-oriented health risks of BTEXS in the sediment of Bubanj Lake in central Serbia. The detection of BTEXS in all sediment samples, with concentrations ranging from 75.5 to 618 µg/kg, highlights the presence of these pollutants in the lake ecosystem, with the highest levels observed in southern regions due to proximity to roads and solvent waste exposure. The PMF model identified three primary sources of BTEXS in sediment: solvent waste, plastic waste, and vehicle exhaust; the benzene from vehicle exhaust poses the most significant health risks according to Monte Carlo simulations.
The findings underscore the importance of continuous monitoring of BTEXS in the sediments of Bubanj Lake, considering that increased urbanization rates and plastic production and usage may increase the BTEXS concentration in sediments over time. This study provides a critical baseline for authorities to develop environmental strategies and preventive measures for BTEXS contamination. These findings could aid in establishing the maximum allowable BTEXS concentrations in sediment, a standard that is not yet defined. Moreover, it provides a good reference and can be applied to managing other sustainable urban ecosystems. However, future research should consider long-term monitoring and explore the effects of seasonal variations on BTEXS distribution and risk levels. Additionally, expanding the study to include the assessment of environmental risk posed by BTEXS in sediment would guide more comprehensive management strategies. Moreover, a more detailed investigation into the interaction between BTEXS and other pollutants in sediments could reveal cumulative effects that this study did not address.

Supplementary Materials

The following supporting information can be downloaded at https://www.mdpi.com/article/10.3390/w16162302/s1: Figure S1: Average distances between each neuron in SOM component planes; Table S1: BTEXS concentrations (μg/kg) in the sediment of Bubanj Lake; Table S2: Assessment of ingestion and dermal health risks for adults and children population groups exposed to BTEXS in sediment.

Author Contributions

Conceptualization, I.T. and M.S.; methodology, M.S. and A.M.; software, J.V., M.L. and A.M.; validation, M.S. and M.L.; formal analysis, I.T. and M.L.; investigation, I.T.; resources, A.O.; data curation, J.V.; writing—original draft preparation, I.T.; writing—review and editing, A.O.; visualization, A.M. and J.V.; supervision, A.O.; project administration, A.O. and M.S.; funding acquisition, A.O. and M.S. All authors have read and agreed to the published version of the manuscript.

Funding

This research was funded by the Ministry of Science, Technological Development and Innovation of Republic of Serbia (grants 451-03-65/2024-03/200135, 451-03-66/2024-03/200026, and 451-03-66/2024-03/200287).

Data Availability Statement

The data supporting this study’s findings are available from the corresponding author upon reasonable request.

Conflicts of Interest

The authors declare no conflicts of interest.

References

  1. Al-Kahtany, K.; El-Sorogy, A.S.; Alharbi, T.; Giacobbe, S.; Nour, H.E. Health Risk Assessment and Contamination of Potentially Toxic Elements in Southwest of the Red Sea Coastal Sediment. Reg. Stud. Mar. Sci. 2023, 65, 103103. [Google Scholar] [CrossRef]
  2. Li, D.; Yu, R.; Chen, J.; Leng, X.; Zhao, D.; Jia, H.; An, S. Ecological Risk of Heavy Metals in Lake Sediments of China: A National-Scale Integrated Analysis. J. Clean. Prod. 2022, 334, 130206. [Google Scholar] [CrossRef]
  3. Xia, W.; Wang, R.; Zhu, B.; Rudstam, L.G.; Liu, Y.; Xu, Y.; Xin, W.; Chen, Y. Heavy Metal Gradients from Rural to Urban Lakes in Central China. Ecol. Process 2020, 9, 47. [Google Scholar] [CrossRef]
  4. De Andrade, L.C.; Coelho, F.F.; Hassan, S.M.; Morris, L.A.; De Oliveira Camargo, F.A. Sediment Pollution in an Urban Water Supply Lake in Southern Brazil. Environ. Monit. Assess. 2019, 191, 12. [Google Scholar] [CrossRef]
  5. Varol, M.; Tokatlı, C. Metals and Phosphorus in the Sediments of Streams Emptying into the Çanakkale Strait (Dardanelles): Spatial Distribution, Pollution Status, Risk Assessment and Source Identification. Environ. Res. 2024, 252, 118795. [Google Scholar] [CrossRef] [PubMed]
  6. Im, J.K.; Kim, S.; Kim, Y.S.; Noh, H.R.; Lee, Y.-M.; Yu, S.J. Characteristics and Sources of Selected Halocarbon and Hydrocarbon Volatile Organic Compounds in Surface Water of the Han River Basin. Water 2021, 13, 2568. [Google Scholar] [CrossRef]
  7. Akhtar, N.; Syakir Ishak, M.I.; Bhawani, S.A.; Umar, K. Various Natural and Anthropogenic Factors Responsible for Water Quality Degradation: A Review. Water 2021, 13, 2660. [Google Scholar] [CrossRef]
  8. Ustaoğlu, F.; Islam, M.S.; Tokatli, C. Ecological and Probabilistic Human Health Hazard Assessment of Heavy Metals in Sera Lake Nature Park Sediments (Trabzon, Turkey). Arab. J. Geosci. 2022, 15, 597. [Google Scholar] [CrossRef]
  9. Häder, D.-P.; Banaszak, A.T.; Villafañe, V.E.; Narvarte, M.A.; González, R.A.; Helbling, E.W. Anthropogenic Pollution of Aquatic Ecosystems: Emerging Problems with Global Implications. Sci. Total Environ. 2020, 713, 136586. [Google Scholar] [CrossRef]
  10. Sim, W.; Dominic Ekpe, O.; Lee, E.-H.; Arafath, S.Y.; Lee, M.; Kim, K.H.; Oh, J.-E. Distribution and Ecological Risk Assessment of Priority Water Pollutants in Surface River Sediments with Emphasis on Industrially Affected Areas. Chemosphere 2024, 352, 141275. [Google Scholar] [CrossRef]
  11. Xu, C.; Lin, X.; Yin, S.; Liu, K.; Liu, W. Spatio-Vertical Characterization of the BTEXS Group of VOCs in Chinese Agricultural Soils. Sci. Total Environ. 2019, 694, 133631. [Google Scholar] [CrossRef] [PubMed]
  12. Frischmon, C.; Hannigan, M. VOC Source Apportionment: How Monitoring Characteristics Influence Positive Matrix Factorization (PMF) Solutions. Atmos. Environ. X 2024, 21, 100230. [Google Scholar] [CrossRef] [PubMed]
  13. Sentic, M.; Trajkovic, I.; Manojlovic, D.; Stankovic, D.; Nikolic, M.V.; Sojic, N.; Vidic, J. Luminescent Metal–Organic Frameworks for Electrochemiluminescent Detection of Water Pollutants. Materials 2023, 16, 7502. [Google Scholar] [CrossRef] [PubMed]
  14. Davidson, C.J.; Hannigan, J.H.; Bowen, S.E. Effects of Inhaled Combined Benzene, Toluene, Ethylbenzene, and Xylenes (BTEX): Toward an Environmental Exposure Model. Environ. Toxicol. Pharmacol. 2021, 81, 103518. [Google Scholar] [CrossRef] [PubMed]
  15. Sun, X.; Wang, H.; Guo, Z.; Lu, P.; Song, F.; Liu, L.; Liu, J.; Rose, N.L.; Wang, F. Positive Matrix Factorization on Source Apportionment for Typical Pollutants in Different Environmental Media: A Review. Environ. Sci. Process. Impacts 2020, 22, 239–255. [Google Scholar] [CrossRef] [PubMed]
  16. Zhou, G.; Chen, S.; Li, A.; Xu, C.; Jing, G.; Chen, Q.; Hu, Y.; Tang, S.; Lv, M.; Xiao, K. Pollution Source Apportionment of River Tributary Based on PMF Receptor Model and Water Quality Remote Sensing in Xinjian River, China. Water 2022, 15, 7. [Google Scholar] [CrossRef]
  17. Haghnazar, H.; Johannesson, K.H.; González-Pinzón, R.; Pourakbar, M.; Aghayani, E.; Rajabi, A.; Hashemi, A.A. Groundwater Geochemistry, Quality, and Pollution of the Largest Lake Basin in the Middle East: Comparison of PMF and PCA-MLR Receptor Models and Application of the Source-Oriented HHRA Approach. Chemosphere 2022, 288, 132489. [Google Scholar] [CrossRef]
  18. Li, W.; Wu, J.; Zhou, C.; Nsabimana, A. Groundwater Pollution Source Identification and Apportionment Using PMF and PCA-APCS-MLR Receptor Models in Tongchuan City, China. Arch. Environ. Contam. Toxicol. 2021, 81, 397–413. [Google Scholar] [CrossRef]
  19. Wang, X.; Xiao, C.; Yang, W.; Liang, X.; Zhang, L.; Zhang, J. Analysis of the Quality, Source Identification and Apportionment of the Groundwater in a Typical Arid and Semi-Arid Region. J. Hydrol. 2023, 625, 130169. [Google Scholar] [CrossRef]
  20. Rodrigo-Ilarri, J.; Rodrigo-Clavero, M.-E.; Capilla, J.E.; Romero-Ballesteros, L. Environmental Assessment of Soil and Groundwater Pollution by BTEX Leaching in Valencia Region (Spain). Water 2023, 15, 3279. [Google Scholar] [CrossRef]
  21. IARC. Monographs on the Evaluation of Carcinogenic Risks to Humans. In IARC Monographs on the Evaluation of Carcinogenic Risks to Humans; International Agency for Research on Cancer; World Health Organization: Lyon, France, 2020; Volume 1–123, ISBN 978-92-832-0158-8. [Google Scholar]
  22. ATSDR Substance Listing. Toxic Substance Portal. Agency for Toxic Substances and Disease Registry. Available online: https://wwwn.cdc.gov/TSP/substances/SubstanceAZ.aspx (accessed on 12 July 2024).
  23. USEPA. User’s Guide: Human Health Risk Assessment; USEPA: Washington, DC, USA, 2008.
  24. Chen, K.; Liu, Q.; Yang, T.; Ju, Q.; Hou, X.; Gao, W.; Jiang, S. Groundwater Pollution Source Identification and Health Risk Assessment in the North Anhui Plain, Eastern China: Insights from Positive Matrix Factorization and Monte Carlo Simulation. Sci. Total Environ. 2023, 895, 165186. [Google Scholar] [CrossRef]
  25. Yuan, B.; Cao, H.; Du, P.; Ren, J.; Chen, J.; Zhang, H.; Zhang, Y.; Luo, H. Source-Oriented Probabilistic Health Risk Assessment of Soil Potentially Toxic Elements in a Typical Mining City. J. Hazard. Mater. 2023, 443, 130222. [Google Scholar] [CrossRef]
  26. Vesković, J.; Deršek-Timotić, I.; Lučić, M.; Miletić, A.; Đolić, M.; Ražić, S.; Onjia, A. Entropy-Weighted Water Quality Index, Hydrogeochemistry, and Monte Carlo Simulation of Source-Specific Health Risks of Groundwater in the Morava River Plain (Serbia). Mar. Pollut. Bull. 2024, 201, 116277. [Google Scholar] [CrossRef] [PubMed]
  27. Miletić, A.; Vesković, J.; Lučić, M.; Onjia, A. Monte Carlo Simulation of Source-Specific Risks of Soil at an Abandoned Lead-Acid Battery Recycling Site. Stoch. Environ. Res. Risk Assess. 2024, 38, 3313–3329. [Google Scholar] [CrossRef]
  28. Vesković, J.; Bulatović, S.; Miletić, A.; Tadić, T.; Marković, B.; Nastasović, A.; Onjia, A. Source-Specific Probabilistic Health Risk Assessment of Potentially Toxic Elements in Groundwater of a Copper Mining and Smelter Area. Stoch. Environ. Res. Risk Assess. 2024, 38, 1597–1612. [Google Scholar] [CrossRef]
  29. Kovačević, M.; Gavrilović, D. Municipalities and Regions of the Republic of Serbia; Statistical Office of the Republic of Serbia: Belgrade, Serbia, 2023; ISBN 2217-7981.
  30. Stajic, J.M.; Milenkovic, B.; Pucarevic, M.; Stojic, N.; Vasiljevic, I.; Nikezic, D. Exposure of School Children to Polycyclic Aromatic Hydrocarbons, Heavy Metals and Radionuclides in the Urban Soil of Kragujevac City, Central Serbia. Chemosphere 2016, 146, 68–74. [Google Scholar] [CrossRef]
  31. Arab Amiri, M.; Gocić, M. Innovative Trend Analysis of Annual Precipitation in Serbia during 1946–2019. Environ. Earth Sci. 2021, 80, 777. [Google Scholar] [CrossRef]
  32. Ranković, B.; Simić, S.; Bogdanović, D. Phytoplankton as Indicator of Water Quality of Lakes Bubanj and Šumarice during Autumn. Kragujev. J. Sci. 2006, 28, 107–114. [Google Scholar]
  33. Zhang, Y.; Zhang, Q.; Chen, W.; Shi, W.; Cui, Y.; Chen, L.; Shao, J. Source Apportionment and Migration Characteristics of Heavy Metal(Loid)s in Soil and Groundwater of Contaminated Site. Environ. Pollut. 2023, 338, 122584. [Google Scholar] [CrossRef]
  34. Ma, L.; Hurtado, A.; Eguilior, S.; Llamas Borrajo, J.F. Acute and Chronic Risk Assessment of BTEX in the Return Water of Hydraulic Fracturing Operations in Marcellus Shale. Sci. Total Environ. 2024, 906, 167638. [Google Scholar] [CrossRef]
  35. Miletić, A.; Lučić, M.; Onjia, A. Exposure Factors in Health Risk Assessment of Heavy Metal(Loid)s in Soil and Sediment. Metals 2023, 13, 1266. [Google Scholar] [CrossRef]
  36. RAIS. The Risk Assessment Information System: Toxicity Values and Physical Parameters. Available online: https://rais.ornl.gov/cgi-bin/tools/TOX_search?select=chemtox (accessed on 14 July 2024).
  37. Rajasekhar, B.; Nambi, I.M.; Govindarajan, S.K. Human Health Risk Assessment for Exposure to BTEXN in an Urban Aquifer Using Deterministic and Probabilistic Methods: A Case Study of Chennai City, India. Environ. Pollut. 2020, 265, 114814. [Google Scholar] [CrossRef] [PubMed]
  38. Zhang, Z.; Teng, Y.; Guo, G.; Li, F.; Zhang, C. Risk Assessment of BTEX in the Groundwater of Songyuan Region of Songhua River in China. Water Supply 2016, 16, 135–143. [Google Scholar] [CrossRef]
  39. Devic, G.; Pergal, M.; Pergal, M. Ecological and Health Risk Assessment of Nitrates and Heavy Metals in the Groundwater of the Alluvial Area of the Danube River near Kostolac Basin, Serbia. Water 2024, 16, 1839. [Google Scholar] [CrossRef]
  40. Slavković-Beškoski, L.; Ignjatović, L.; Ćujić, M.; Vesković, J.; Trivunac, K.; Stojaković, J.; Perić-Grujić, A.; Onjia, A. Ecological and Health Risks Attributed to Rare Earth Elements in Coal Fly Ash. Toxics 2024, 12, 71. [Google Scholar] [CrossRef]
  41. USEPA EPA. Positive Matrix Factorization (PMF) 5.0 Fundamentals and User Guide; USEPA: Washington, DC, USA, 2014.
  42. Asejeje, G.I.; Ipeaiyeda, A.R.; Onianwa, P.C. Occurrence of BTEX from Petroleum Hydrocarbons in Surface Water, Sediment, and Biota from Ubeji Creek of Delta State, Nigeria. Environ. Sci. Pollut. Res. 2021, 28, 15361–15379. [Google Scholar] [CrossRef]
  43. Yu, B.; Yuan, Z.; Yu, Z.; Xue-song, F. BTEX in the Environment: An Update on Sources, Fate, Distribution, Pretreatment, Analysis, and Removal Techniques. Chem. Eng. J. 2022, 435, 134825. [Google Scholar] [CrossRef]
  44. Durrani, T.; Clapp, R.; Harrison, R.; Shusterman, D. Solvent-based Paint and Varnish Removers: A Focused Toxicologic Review of Existing and Alternative Constituents. J. Appl. Toxicol. 2020, 40, 1325–1341. [Google Scholar] [CrossRef]
  45. Akinsanya, B.; Ayanda, I.O.; Onwuka, B.; Saliu, J.K. Bioaccumulation of BTEX and PAHs in Heterotis Niloticus (Actinopterygii) from the Epe Lagoon, Lagos, Nigeria. Heliyon 2020, 6, e03272. [Google Scholar] [CrossRef]
  46. Ünlü, S.; Alpar, B. Evaluation of Sediment Contamination by Monoaromatic Hydrocarbons in the Coastal Lagoons of Gulf of Saros, NE Aegean Sea. Mar. Pollut. Bull. 2017, 118, 442–446. [Google Scholar] [CrossRef]
  47. Etiope, G.; Panieri, G.; Fattorini, D.; Regoli, F.; Vannoli, P.; Italiano, F.; Locritani, M.; Carmisciano, C. A Thermogenic Hydrocarbon Seep in Shallow Adriatic Sea (Italy): Gas Origin, Sediment Contamination and Benthic Foraminifera. Mar. Pet. Geol. 2014, 57, 283–293. [Google Scholar] [CrossRef]
  48. Hoffman, E.; Alimohammadi, M.; Lyons, J.; Davis, E.; Walker, T.R.; Lake, C.B. Characterization and Spatial Distribution of Organic-Contaminated Sediment Derived from Historical Industrial Effluents. Environ. Monit. Assess. 2019, 191, 590. [Google Scholar] [CrossRef] [PubMed]
  49. Onyena, A.P.; Nkwoji, J.A.; Chukwu, L.O.; Walker, T.R.; Sam, K. Risk Assessment of Sediment PAH, BTEX, and Emerging Contaminants in Chanomi Creek Niger Delta, Nigeria. Environ. Monit. Assess. 2023, 195, 1080. [Google Scholar] [CrossRef]
  50. Okogbue, C.O.; Oyesanya, O.U.; Anyiam, O.A.; Omonona, V.O. Assessment of Pollution from Produced Water Discharges in Seawater and Sediments in Offshore, Niger Delta. Environ. Earth Sci. 2017, 76, 359. [Google Scholar] [CrossRef]
  51. Ünlü, V.S.; Alpar, B. Spatial Distribution and Sources of BTEX and TPH Contamination in Freshwater Sediments from Lake Iznik, NW Turkey. Int. J. Environ. Geoinform. 2018, 5, 304–313. [Google Scholar] [CrossRef]
  52. Miri, M.; Rostami Aghdam Shendi, M.; Ghaffari, H.R.; Ebrahimi Aval, H.; Ahmadi, E.; Taban, E.; Gholizadeh, A.; Yazdani Aval, M.; Mohammadi, A.; Azari, A. Investigation of Outdoor BTEX: Concentration, Variations, Sources, Spatial Distribution, and Risk Assessment. Chemosphere 2016, 163, 601–609. [Google Scholar] [CrossRef]
  53. Egbueri, J.C.; Ukah, B.U.; Ubido, O.E.; Unigwe, C.O. A Chemometric Approach to Source Apportionment, Ecological and Health Risk Assessment of Heavy Metals in Industrial Soils from Southwestern Nigeria. Int. J. Environ. Anal. Chem. 2022, 102, 3399–3417. [Google Scholar] [CrossRef]
  54. Ajaj, A.; J’Bari, S.; Ononogbo, A.; Buonocore, F.; Bear, J.C.; Mayes, A.G.; Morgan, H. An Insight into the Growing Concerns of Styrene Monomer and Poly(Styrene) Fragment Migration into Food and Drink Simulants from Poly(Styrene) Packaging. Foods 2021, 10, 1136. [Google Scholar] [CrossRef] [PubMed]
  55. Tian, Z.; Kim, S.-K.; Hyun, J.-H. Environmental Distribution of Styrene Oligomers (SOs) Coupled with Their Source Characteristics: Tracing the Origin of SOs in the Environment. J. Hazard. Mater. 2020, 398, 122968. [Google Scholar] [CrossRef] [PubMed]
  56. Kuranchie, F.A.; Angnunavuri, P.N.; Attiogbe, F.; Nerquaye-Tetteh, E.N. Occupational Exposure of Benzene, Toluene, Ethylbenzene and Xylene (BTEX) to Pump Attendants in Ghana: Implications for Policy Guidance. Cogent Environ. Sci. 2019, 5, 1603418. [Google Scholar] [CrossRef]
  57. Li, Z.; Ho, K.-F.; Yim, S.H.L. Source Apportionment of Hourly-Resolved Ambient Volatile Organic Compounds: Influence of Temporal Resolution. Sci. Total Environ. 2020, 725, 138243. [Google Scholar] [CrossRef] [PubMed]
  58. Vesković, J.; Onjia, A. Environmental Implications of the Soil-to-Groundwater Migration of Heavy Metals in Mining Area Hotspots. Metals 2024, 14, 719. [Google Scholar] [CrossRef]
  59. Zhou, H.; Yue, X.; Chen, Y.; Liu, Y. Source-Specific Probabilistic Contamination Risk and Health Risk Assessment of Soil Heavy Metals in a Typical Ancient Mining Area. Sci. Total Environ. 2024, 906, 167772. [Google Scholar] [CrossRef] [PubMed]
  60. Mondal, G.; Ghosh, S.; Banerjee, S.; Bhattacharyya, P. Appraisal of Potential Metal Risk in Calcareous Agricultural Soils: An Insight into Human and Environmental Health Employing Multimodal Tactics. Water Air Soil. Pollut. 2024, 235, 377. [Google Scholar] [CrossRef]
  61. Han, W.; Pan, Y.; Welsch, E.; Liu, X.; Li, J.; Xu, S.; Peng, H.; Wang, F.; Li, X.; Shi, H.; et al. Prioritization of Control Factors for Heavy Metals in Groundwater Based on a Source-Oriented Health Risk Assessment Model. Ecotoxicol. Environ. Saf. 2023, 267, 115642. [Google Scholar] [CrossRef]
Figure 1. Location of Bubanj Lake with sampling points.
Water 16 02302 g001
Figure 2. Violin plots showing the variations in and probability densities of sediment texture and BTEXS (µg/kg) in the sediment samples of Bubanj Lake.
Water 16 02302 g002
Figure 3. Spatial distribution of BTEXS concentration (μg/kg) in Bubanj Lake’s sediments.
Water 16 02302 g003
Figure 4. Component planes of BTEXS in the sediment samples of Bubanj Lake.
Water 16 02302 g004
Figure 5. Factor profiles and contributions of each factor to BTEXS concentrations in the sediments of Bubanj Lake identified by the PMF model.
Water 16 02302 g005
Figure 6. Probability distributions of source-oriented health risks from BTEXS in the sediment of Bubanj Lake.
Water 16 02302 g006
Table 1. Description and values of exposure parameters used in health risk assessment.
Exposure ParameterUnitsChildrenAdultsDistribution
Ingestion rate (IngR)mg/day200100Triangular
Exposure frequency (EF)day(s)/year350350Triangular
Exposure duration (ED)year(s)624Point
Body weight (BW)kg1570Lognormal
Average non-carcinogenic time (ATnc)day(s)21908760Point
Average carcinogenic time (ATc)day(s)25,55025,550Point
Skin surface area (SA)cm228005700Point
Adherence factor (AF)mg/cm2/day0.20.07Lognormal
Dermal absorption factor (ABS)unitless0.0010.001Point
Conversion factor (CF)kg/mg10−610−6Point
Table 2. Values of reference dose (RfD) and cancer slope factor (CSF) for the examined VOCs.
PollutantRfDing
(mg/kg/Day)
RfDderm
(mg/kg/Day)
CSFing
(mg/kg/Day)−1
CSFderm
(mg/kg/Day)−1
Benzene0.0040.003880.0550.0567
Toluene0.080.064
Ethylbenzene0.050.080.0110.0138
m,p-xylene0.20.16
o-xylene0.20.16
Styrene0.2
Note(s): – not available.
Table 3. BTEXS concentrations (µg/kg) in Bubanj Lake sediments compared with BTEXS values in sediments from other worldwide aquatic bodies.
Area, CountryBenzToleBmpXoXStyrΣBTEXSReference
Ubeji Creek, Nigeria160098010601140790n.a.5570[42]
Epe Lagoon, Nigeria010,070745077206140n.a.31,380[45]
Chanomi Creek, Nigeria3.5255.5236.7145.364 *5.646 **n.a.26.773[49]
Lake Iznik, Turkey2.825.96.057.913.5n.a.106.1[51]
Offshore sediments, Nigerian.r.n.a.2.0[50]
Gulf of Saros, Turkey0.723.44.131.91.5n.a.61.6[46]
Adriatic Sea, Italy20.35.441.18<0.5 ***n.a.26.9[47]
Industrial areas, South Korea0.38890.01.441.840.8980.055994.6[10]
Pictou County, Canada<DL<DL<DL<DL<DLn.a.[48]
Bubanj Lake, Serbia34.785.830.643.828.55.4225Current study
Note(s): Benz—benzene; Tol—toluene; eB—ethylbenzene; mpX—m,p-xylene; oX—o-xylene; Styr—styrene; n.a.—not analyzed; n.r.—not reported; DL—detection limit; * as p-xylene; ** as o- and m-xylene; *** as the sum of xylenes.
Table 4. Pearson correlation matrix of the Bubanj Lake sediments.
Clay SandSiltTOCBenzToleBmpXoX
Sand−0.464 *
Silt0.391−0.997 *
TOC−0.3270.431 *−0.418 *
Benz−0.339−0.1970.2360.092
Tol−0.113−0.3510.3750.2540.844 *
eB−0.191−0.3020.3320.1990.895 *0.968 *
mpX−0.192−0.30.3290.2380.887 *0.980 *0.992 *
oX−0.184−0.3370.3670.2310.879 *0.974 *0.985 *0.993 *
Styr−0.419−0.0540.0950.0410.648 *0.505 *0.541 *0.552 *0.527 *
Note(s): Benz—benzene; Tol—toluene; eB—ethylbenzene; mpX—m,p-xylene; oX—o-xylene; Styr—styrene; * correlation was significant at the 0.05 level.
Table 5. The results of deterministic non-carcinogenic and carcinogenic health risk assessment of BTEXS in Bubanj Lake sediment.
Health Risk IndexPollutantAdultsChildren
MeanMaxMinMeanMaxMin
HIBenzene1.05 × 10−54.81 × 10−51.72 × 10−79.81 × 10−54.49 × 10−41.60 × 10⁻⁶
Toluene1.48 × 10−63.44 × 10−64.99 × 10−71.38 × 10−53.21 × 10−54.65 × 10⁻⁶
Ethylbenzene8.39 × 10−72.17 × 10−61.87 × 10−77.83 × 10−62.02 × 10−51.74 × 10⁻⁶
m,p-xylene3.02 × 10−77.57 × 10−79.64 × 10−82.81 × 10−67.06 × 10−68.98 × 10⁻⁷
o-xylene1.96 × 10−75.02 × 10−75.64 × 10−81.83 × 10−64.68 × 10−65.26 × 10⁻⁷
Styrene3.68 × 10−82.60 × 10−73.42 × 10−93.43 × 10−72.43 × 10−63.20 × 10⁻⁸
Total1.34 × 10−55.51 × 10−51.29 × 10−61.25 × 10−45.14 × 10−41.20 × 10⁻⁵
TCRBenzene7.94 × 10−103.63 × 10−91.30 × 10−111.85 × 10−98.46 × 10−93.02 × 10⁻¹¹
Ethylbenzene1.59 × 10−104.10 × 10−103.53 × 10−113.70 × 10−109.56 × 10−108.23 × 10⁻¹¹
Total9.52 × 10−104.04 × 10−98.05 × 10−112.22 × 10−99.42 × 10−91.87 × 10⁻¹⁰
Disclaimer/Publisher’s Note: The statements, opinions and data contained in all publications are solely those of the individual author(s) and contributor(s) and not of MDPI and/or the editor(s). MDPI and/or the editor(s) disclaim responsibility for any injury to people or property resulting from any ideas, methods, instructions or products referred to in the content.

