Article

The Conditions for the Formation of Strontium in the Water of Ancient Silicate Deposits Near the Arctic Coast of Russia

by
Alexander I. Malov
N. Laverov Federal Center for Integrated Arctic Research of the Ural Branch of the Russian Academy of Sciences, 20 Nikolsky Avenue, Arkhangelsk 163020, Russia
Water 2024, 16(17), 2369; https://doi.org/10.3390/w16172369
Submission received: 29 July 2024 / Revised: 21 August 2024 / Accepted: 22 August 2024 / Published: 23 August 2024
(This article belongs to the Special Issue Water Environment Pollution and Control, Volume II)

Abstract

:
Strontium is a toxic chemical element widely distributed in groundwater. First of all, its appearance in water is associated with the dissolution of sulfate and carbonate rocks. The aim of this study was to assess the characteristics of strontium concentration in ancient aluminosilicate deposits that were filled with sedimentogenic brines and seawater in different geological periods. Studies were conducted on 44 water samples, in which the chemical and isotopic composition was determined with the subsequent assessment of saturation indices in relation to the main rock-forming minerals and the residence time of groundwater in the aquifer. It was found that minimal strontium concentrations are characteristic of the least mineralized waters and arise mainly due to the dissolution of carbonates. After their saturation in relation to calcite, the process of carbonate dissolution was replaced by their precipitation and an increase in silicate dissolution with an increase in strontium concentration in more mineralized waters. The incongruent dissolution of aluminosilicates resulted in the appearance of new clay minerals in the aquifer, which together with iron hydroxides and newly formed calcium carbonates created opportunities for sorption and ion exchange processes. The contribution of seawater consisted of an increase in strontium concentrations by approximately 15–20%. The effect of the duration of the water–rock interaction on strontium concentrations in groundwater was expressed in the fact that over a thousand years they increased by 0.1 mg/L, which is 20–30 times less than in the waters of carbonate deposits located 100 km to the east. An assessment of the non-carcinogenic risk to human health of contact with the groundwater showed the safety of using the studied groundwater for drinking purposes.

1. Introduction

Strontium is a toxic chemical element, and its distribution in drinking water is being actively studied in all countries. Strontium concentrations have been found to be highest in aquifers in carbonate sediments [1,2,3,4,5]. At the same time, strontium concentrations are also typically increased in unconsolidated sand–gravel and loess aquifers in arid or semi-arid areas where shallow groundwater is subject to evaporation [1,6,7]. A similar situation is observed when thermal waters come into contact with granite-porphyry bodies that have not yet completely cooled [8,9]. In almost all cases, special importance is attached to the dissolution of strontium-bearing minerals [10,11]. There are relatively few articles characterizing the distribution of strontium in aquifers in silicate rocks near the sea coast [12]. To fill this gap, this article examines the conditions for the formation of strontium in the aquifer of ancient sandy-clay deposits of the Vendian period near the sea coast of the Western Arctic of Russia. Currently, these waters are used in limited volumes for the centralized water supply of workers of the mining and processing plant at the M.V. Lomonosov diamond deposit and for sale in kiosks for bottling and dispensing in bottled form to residents of the regional center, the city of Arkhangelsk. The purpose of this study was to determine (i) the sources of strontium in groundwater, (ii) the processes of transition of strontium into water, (iii) the effect of proximity to the sea on strontium concentrations in groundwater, (iv) the effect of the duration of the water–rock interaction on strontium concentrations in groundwater, and (v) the danger of using these waters for drinking purposes.
The novelty of this study is that the processes of strontium concentration are considered in the world literature mainly for near-surface aquifers. The main processes are the interaction of sulfate and carbonate rocks with sediments and evaporation [13,14,15,16,17]. This paper discusses silicate sedimentary deposits that were filled with sedimentogenic brines of salt basins and waters of marine transgression with high concentrations of strontium at depths of up to two hundred meters for hundreds of millions of years. Their uniqueness is also associated with the powerful freshening effect of meltwaters from the last glaciation 11,700 years ago.

2. Materials and Methods

The research area with coordinates 65°17′–65°23′ north latitude and 40°55′–41°10′ east longitude is located 60 km from the sea coast (Figure 1a) within the boundaries of an ancient sedimentary basin called the Mezen syneclise. The basin is filled mainly with Vendian (V) sediments with a thickness of 1–3 km and an age of 570 million years. In the direction from bottom to top, mudstones are gradually replaced by siltstones and sandstones. The siltstones and sandstones of the uppermost 160 m part of this sequence (Vpd), containing fresh water, have the highest filtration properties (Figure 1b).
The chemical composition of sandstones and siltstones is shown in Table 1.
Table 1 reflects the fact that the clastic material is predominantly quartz, feldspars, and mica, as well as chalcedony, quartzite fragments, and clay aggregates. Cement has predominantly clay–iron and carbonate–clay compositions; gypsum compositions are less common. The Fe2O3 content is 5–18 times higher than the FeO content [18].
Clay minerals are represented by hydromicas, kaolinite, and chlorite. It should also be noted that in the Devonian period 370 million years ago, Vendian deposits were intruded by kimberlite melt, forming so-called explosion pipes or kimberlite diatremes (Figure 1). In this case, a powerful explosive interaction of the gas-saturated melt with groundwater occurred, which resulted in the saponitization of olivine and the penetration of clayey saponite material into the pores and cracks of the surrounding rocks over considerable distances.
In river valleys, Vendian sediments outcrop directly beneath Pleistocene sandy–clayey sediments (Figure 1). At the watersheds, the remains of a once thick sequence of sandstones and carbonates of the Carboniferous period (C2ur-C2ol-ok) have been preserved. Atmospheric precipitation in the amount of 580 mm/year infiltrates through the soil, saturates with carbon dioxide, and then spends it on dissolving carbonates C2 and silicates Vpd, enriching the composition of groundwater and increasing the total amount of dissolved substances (TDSs). After this, they are discharged into the river network.
Between 2012 and 2023, 44 groundwater samples were collected from 12 wells ranging in depth from 80 to 180 m from the Vendian Padun Formation aquifer (Table S1, Figure 1). Boreholes with the index “d” serve to protect the diamond quarry from flooding. The remaining wells are used to monitor the development of the depression funnel around the drained quarry.
In the field, temperature and pH determinations were carried out at all wells using portable HANNA instruments. To determine cations (10 mL) and anions (50 mL), the samples were filtered through a 0.45 μm cellulose acetate filter. Filtered samples (10 mL) were acidified with double-distilled HNO3 ( pH < 2 ); samples (50 mL) were not acidified. The methodology for determining the components of a chemical composition by using an atomic absorption spectrometer (AAS) (Perkin-Elmer 5100 PC, Turku, Finland), an automated titrator (Metrohm 716 DMS Titrino, Metrohm AG, Herisau, Switzerland), and ion chromatography (HPLC, Dionex ICS 2000, ThermoFisher, Waltham, MA, USA) is described in a previously published work [19].
The 14C was measured using a liquid scintillation spectrometer, Quantulus 1220 (background 14C is 0.15–0.20 counts per minute, with 95% counting efficiency). The measurement uncertainties for 14C (as percent modern carbon, or pmc) are reported individually and range from 1 to 2%. The measured 14C content was normalized, that is, a correction for isotopic fractionation was introduced according to the formula
14C (pMC) = 14C (pmc)·[1 − 2 (25 + δ13C)/1000].
To determine δ13C, a set of equipment from Thermo Fisher Scientific Corporation was used, including a CF–IRMS, DELTAplus XP mass spectrometer, a Trace GC gas chromatograph, and a GC–C/TC III reactor. The gas chromatograph was equipped with a SigmaAldrich Carboxen–1010 PLOT capillary column (length 30 m, diameter 0.32 mm, film thickness 15 μm). δ13C values are given relative to the V–PDB standard referenced using NIST RM8544 (NBS19). The measurement uncertainty for δ13C was (1σ) ± 0.2‰.
The uranium isotopes in the groundwater were determined in accordance with Malyshev et al. (1999) [20] and as also described by Fröhlich (2013) [21]. The spectrometric detection of alpha particles was performed using an alpha spectrometer “Progress-alpha”, uncertainty 10–20%. The measurement uncertainties for uranium are reported individually. The efficiency of 232U extraction was 40–50%.
Groundwater saturation indices in relation to rock-forming minerals (SI) were determined by the logarithm of the quotient of the ion activity product (Q) [22] and solubility product constant (SP0) [23]:
SI = lg ( Q / SP 0 )
Calculations of the residence time of groundwater in the aquifer based on carbon and uranium isotopes were performed, as described by Malov (2018) [24].

3. Results

3.1. Chemical Composition and Saturation of Groundwater in Relation to the Main Rock-Forming Minerals

The results of determining the chemical composition of groundwater are shown in Table S1. Table 2 provides descriptive statistics for these waters, and Figure 2 illustrates their ionic composition.
The hydrocarbonate ion with a concentration from 146 to 239 mg/L predominated in the composition of anions. In second place was the chlorine ion with a very wide range of concentrations from 1.1 to 195 mg/L. The content of the sulfate ion turned out to be minimal: 0.04–64.7 mg/L. Among the cations, sodium predominated (2.03–199 mg/L). The contents of calcium, magnesium, and potassium were minimal, amounting to 3.66–37.2 mg/L, 3.78–18.8 mg/L, and 1.54–9.14 mg/L, respectively.
Calcium and (or) magnesium predominated in the groundwater with TDSs up to 0.3 g/L, defining the Ca-Mg-Na-HCO3 type of water. In the TDS range from 0.3 to 0.4 g/L, the Na-HCO3 composition was more characteristic, and in the TDS range from 0.4 to 0.5 g/L, chlorine (Na-HCO3-Cl) became noticeable in the water composition. With a further increase in TDSs, chlorine began to prevail over the bicarbonate ion (Na-Cl-HCO3).
Synchronously with the increase in the TDSs and the change in the composition of groundwater from calcium to sodium, the pH values also increased from 7.8 to 9.2.
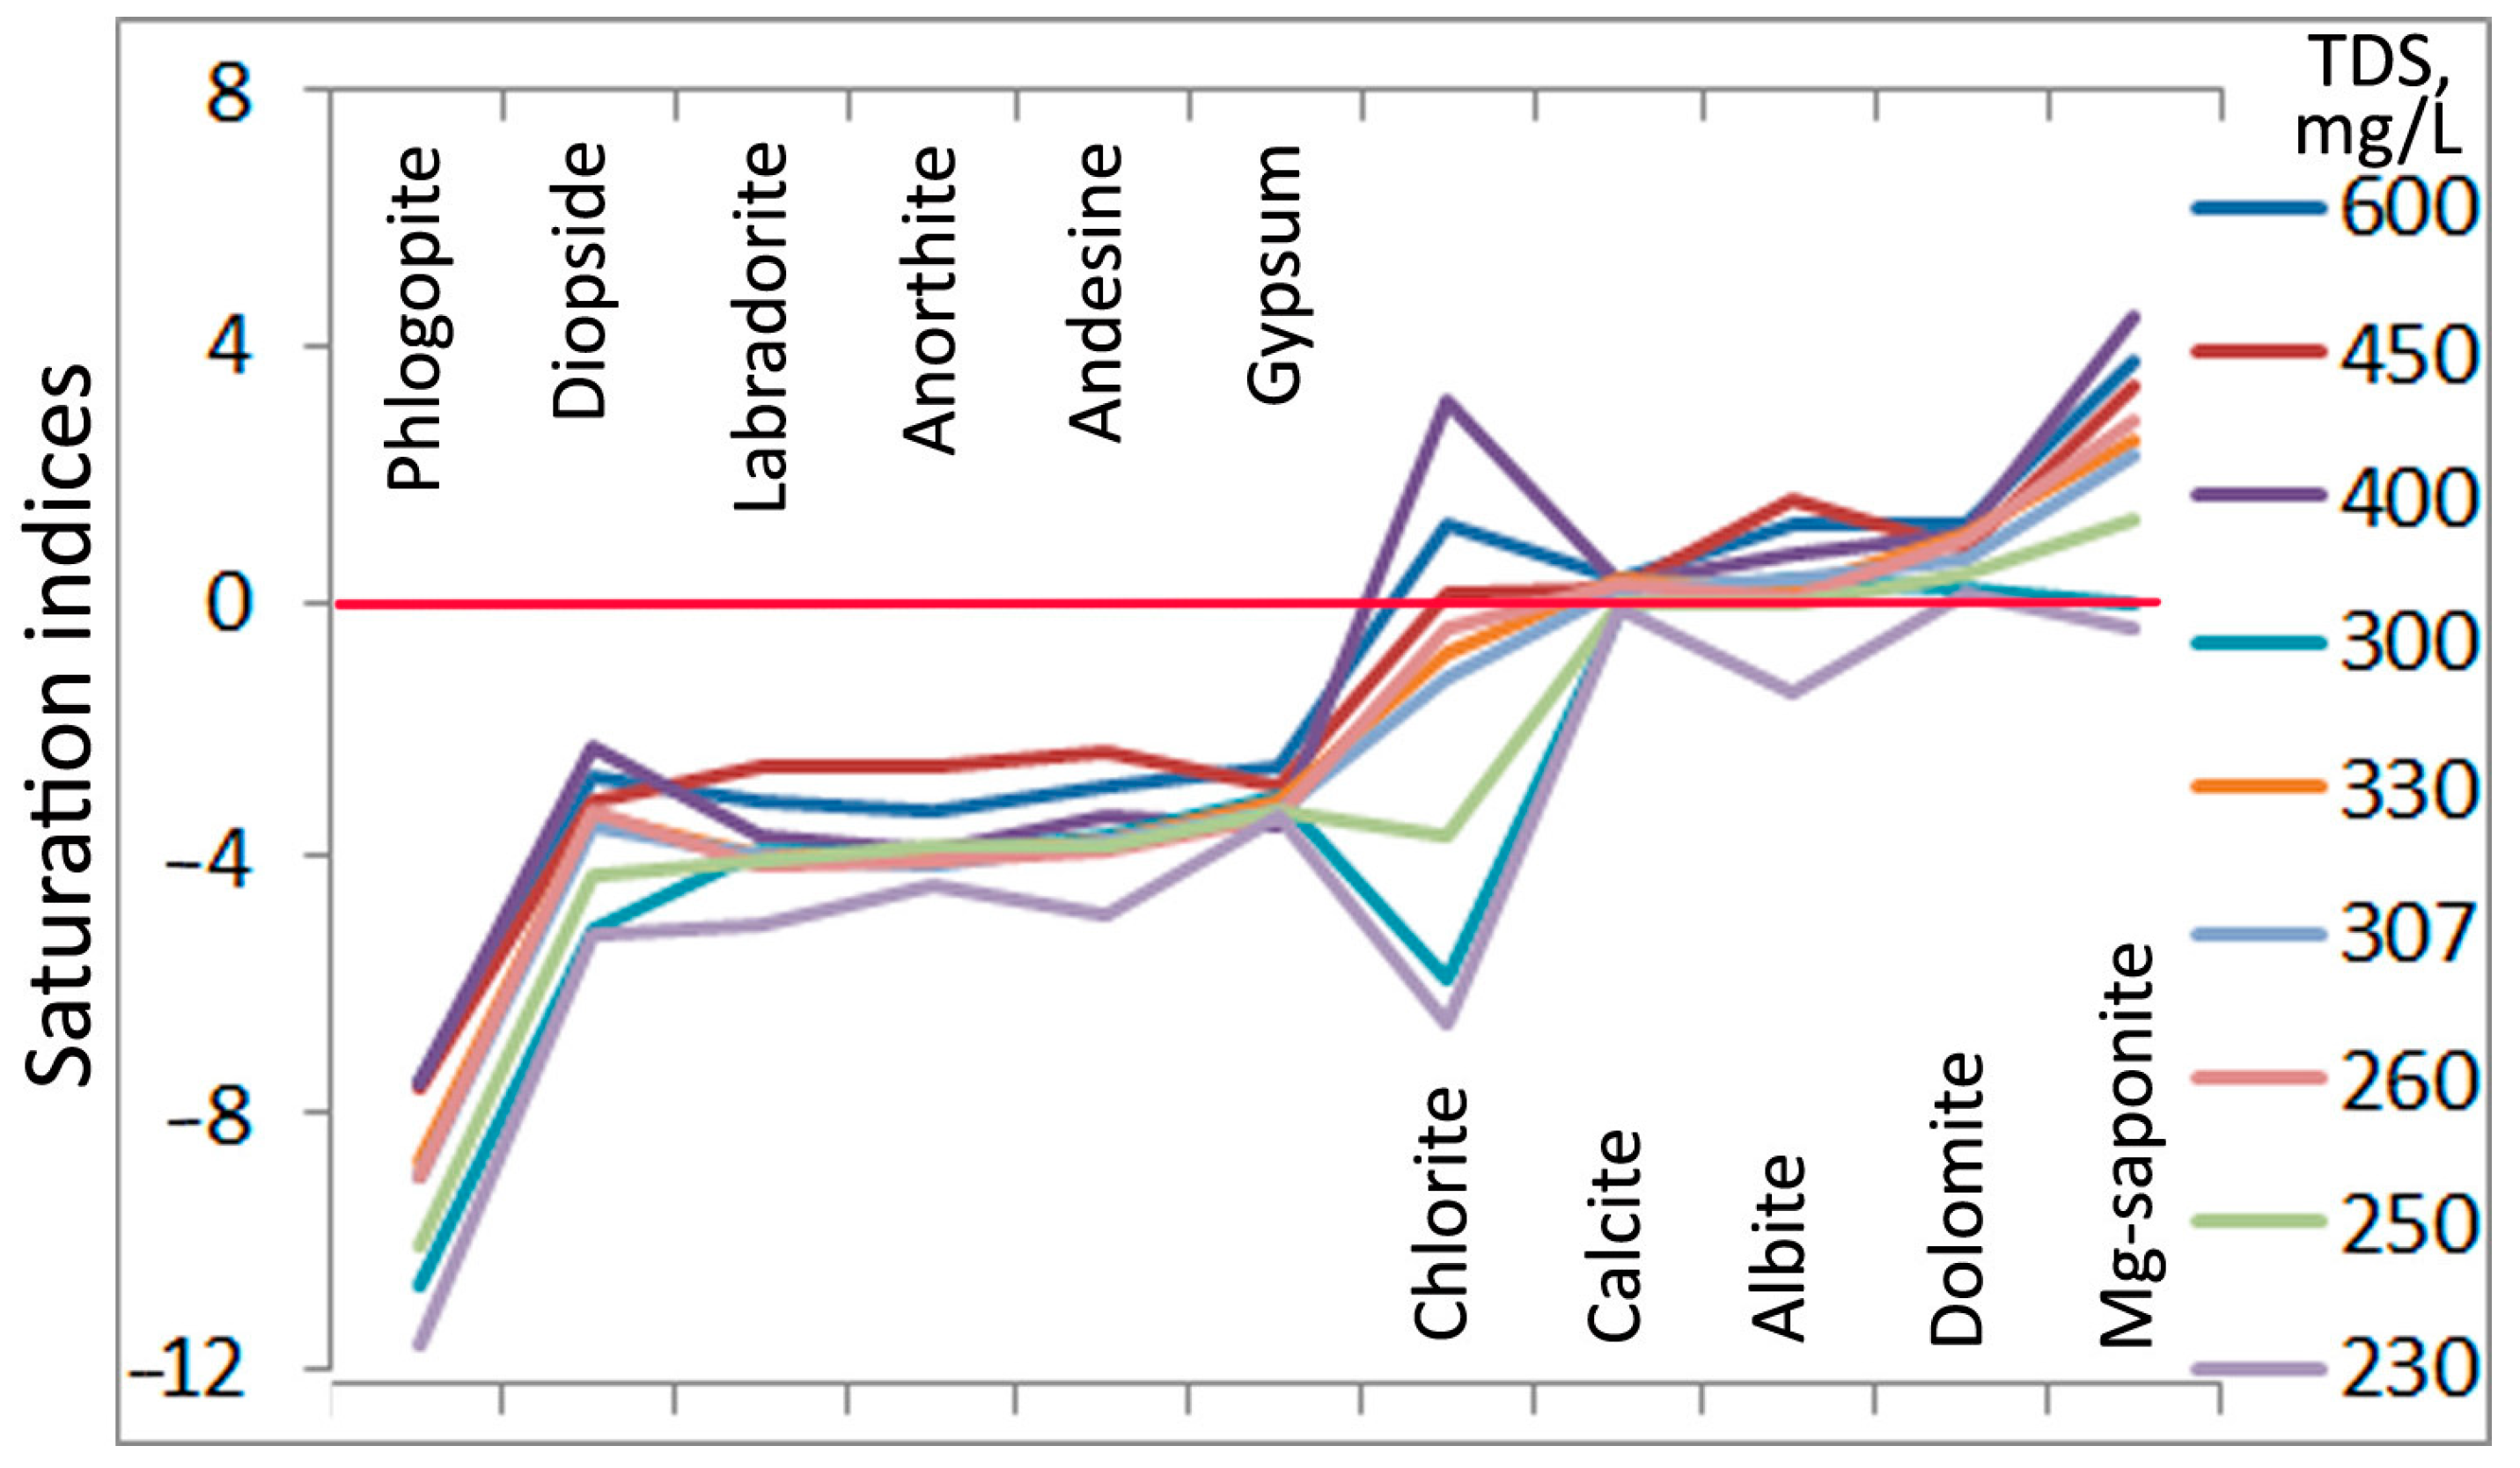
Table 3 and Figure 3 show that rock-forming minerals, according to the characteristics of the equilibrium–nonequilibrium conditions between them and the studied groundwater, could be divided into two groups: (i) nonequilibrium and (ii) with changing equilibrium–nonequilibrium conditions. The first group includes the primary calcium aluminosilicate minerals anorthite, labradorite, and andesine and the silicate mineral diopside. Also included in this group are the magnesium silicate phlogopite and the calcium sulfate gypsum. The second group includes the sodium aluminosilicate mineral albite, as well as the carbonates calcite and dolomite. The same group includes the magnesium silicate mineral chlorite and the magnesium aluminosilicate mineral saponite. Figure 3 clearly shows how for these minerals, as they moved from the lower to the upper parts of the section and the concentrations of individual components in groundwater decreased, a decrease in the value of the index of their nonequilibrium with groundwater was observed, that is, favorable conditions were created for their transformation and chemical weathering. The secondary products of this transformation are clay minerals in equilibrium with groundwater and, almost everywhere, silicic acids in water-soluble forms and, possibly, quartz.
In general, the distribution of minerals according to the degree of their disequilibrium with groundwater was as follows: phlogopite → diopside → labradorite → anorthite → andesine → gypsum → chlorite → calcite → albite → dolomite → Mg-saponite. The clay mineral saponite, as a product of the sequential intense chemical weathering of olivine and serpentine, was in equilibrium with almost all types of groundwater studied. Almost the same can be said about dolomite and albite. Chlorite, on the contrary, was not in equilibrium with almost all waters, except the most mineralized ones.

3.2. Isotopic Composition and Residence Time of Groundwater in the Aquifer

The δ13C values turned out to be quite uniform and ranged from −10.1‰ to −11.7‰ (Table 4), that is, δ13C ˃ 0.5 (δ13Cg+ δ13Cs) = δ13C ˃ 0.5 (−26 + 2) = δ13C ˃ (−12), where δ13Cg and δ13Cs characterize the carbon isotopic composition of gaseous soil CO2 and solid carbonate minerals, respectively [25,26]. Therefore, the Pearson model, which takes into account the isotope exchange between solid carbonates and total dissolved inorganic carbon (TDIC) [27,28], was used. Due to the wide spread of 14C values from 58.40 ± 0.89 pmc to 24.86 ± 0.43 pmc, the calculated values of the residence time of groundwater in the aquifer also turned out to be in a wide range from “modern” to 5.22 ± 0.39 ka.
Age determinations using uranium isotope dating showed values predominantly in the range from 0.56 ± 0.1 ka to 6.5 ± 1.0 ka (Table 4), which is consistent with age determinations obtained using radiocarbon dating. However, based on samples from well 10d with anomalous uranium concentrations of 13.35 ± 0.27 µg/L and 14.14 ± 0.28 µg/L, anomalous groundwater ages of 9.1 ± 1.2 ka and 11.7 ± 1.6 ka were also obtained, which were rejected (see Section 4).

4. Discussion

4.1. Formation of Groundwater Composition

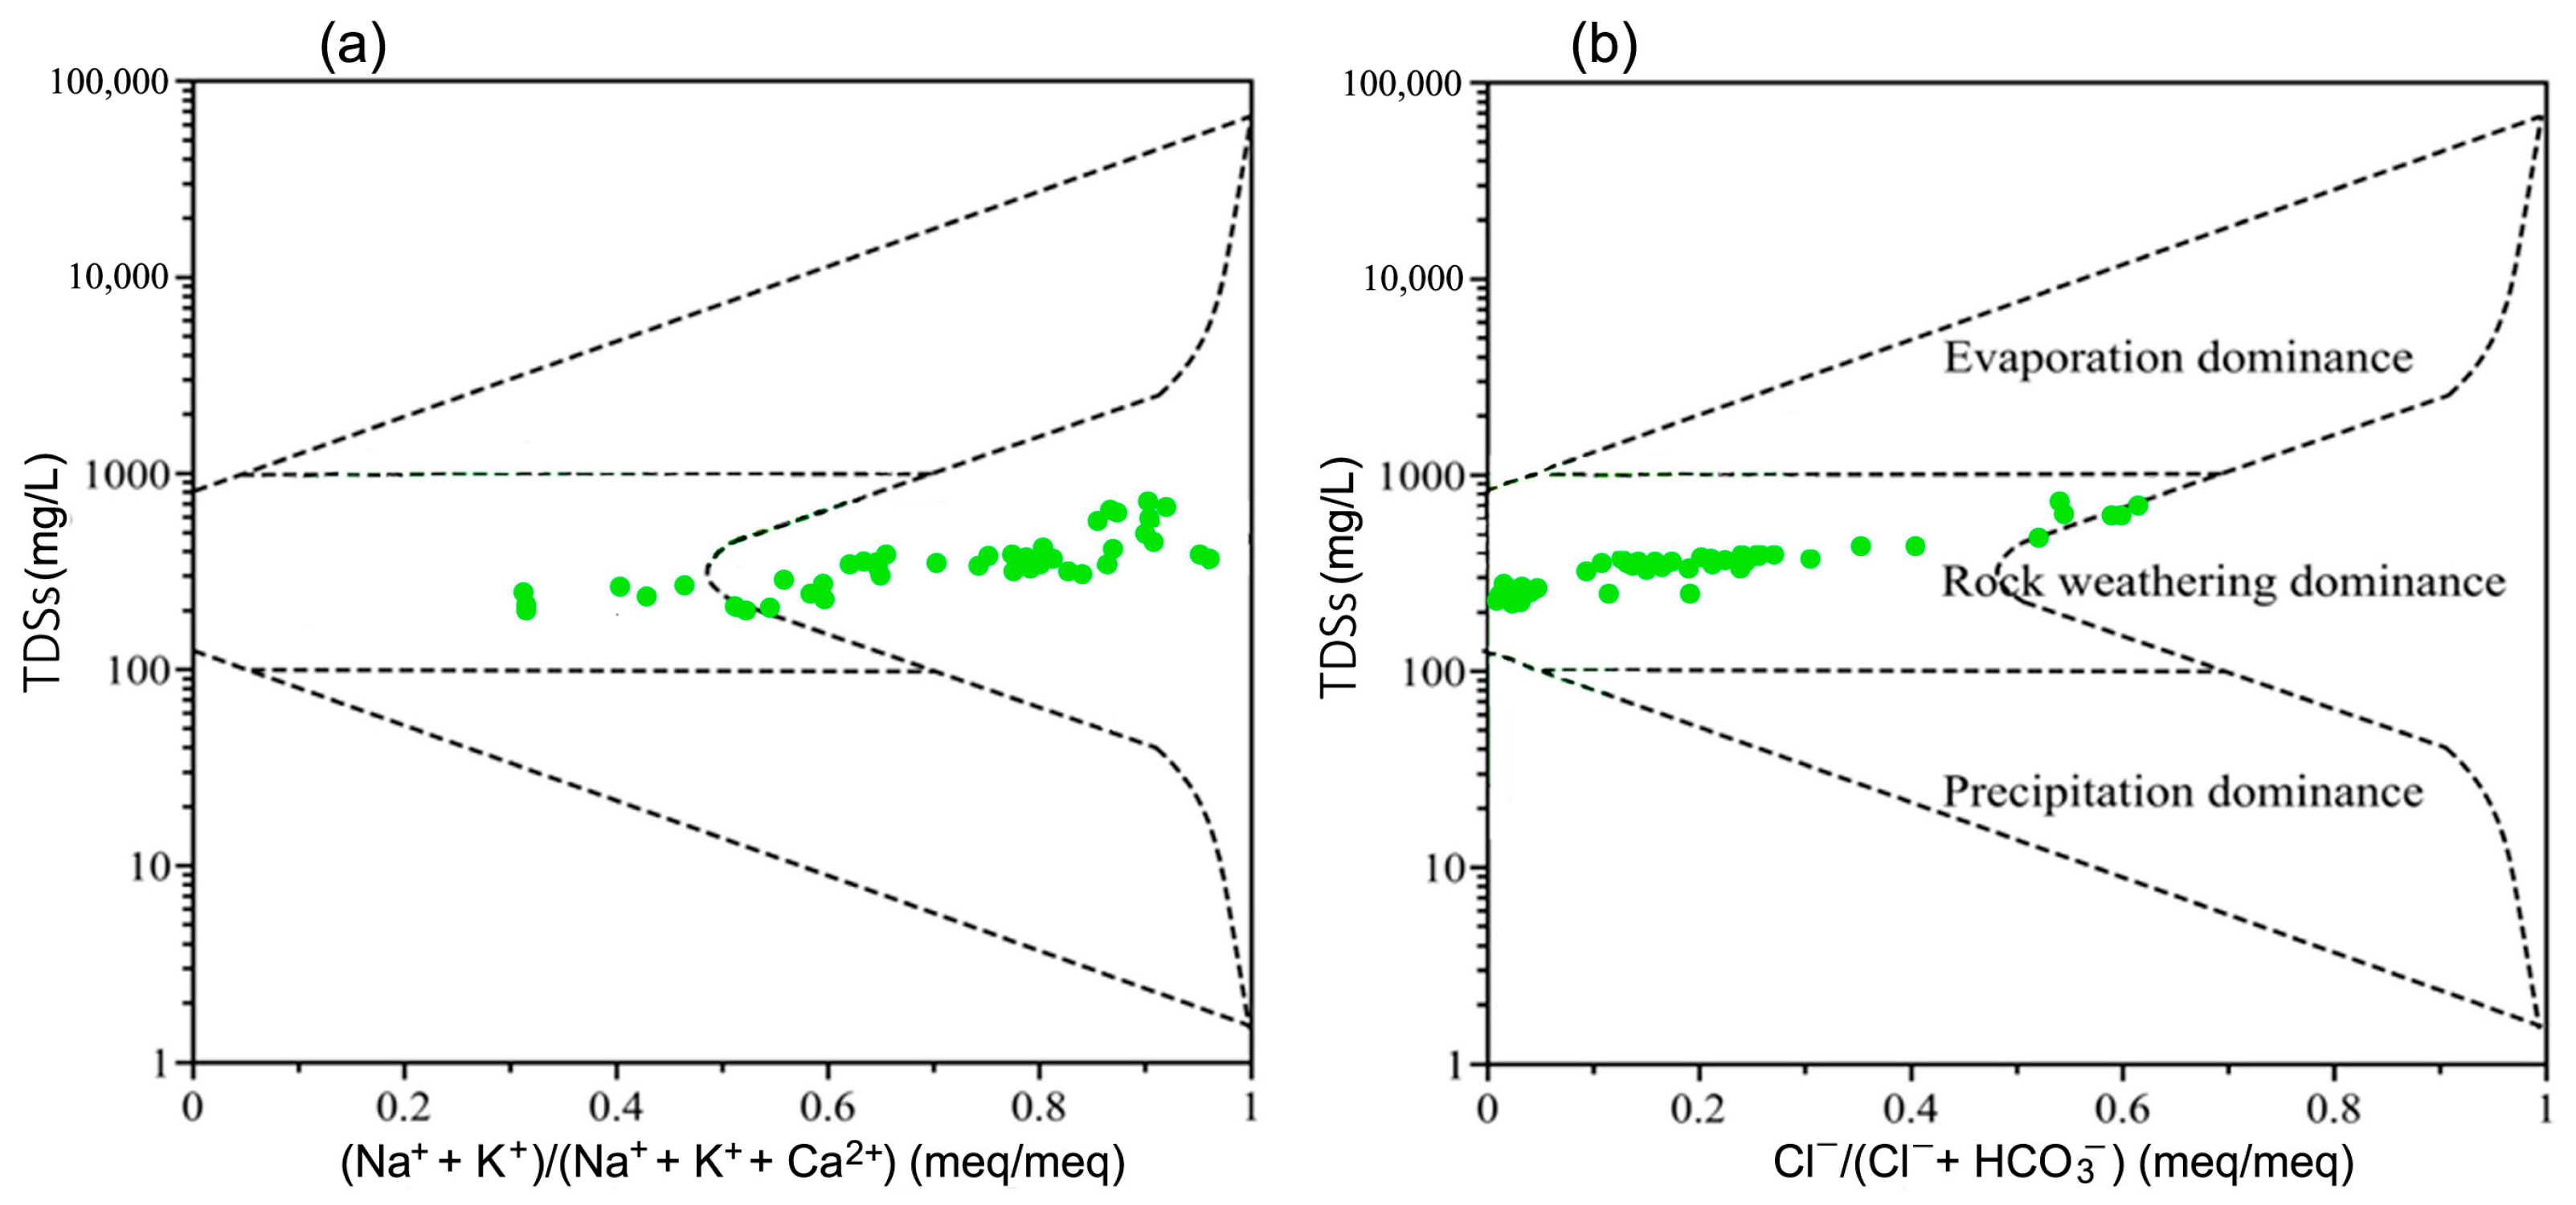
Figure 4a demonstrates that the formation of the chemical composition of groundwater was carried out mainly due to the weathering of rocks [31]. At (Na+ + K+)/(Na+ + K+ + Ca2+) < 0.5, i.e., Ca2+ > (Na+ + K+), the chemical weathering of carbonates predominated:
CaCO3 → Ca2+ + CO32−,
CaMg(CO3)2 → Ca2+ + Mg2+ + 2CO32−.
This is relevant for water samples from wells 28d, Bl, Br, and Ch with TDSs of 219–270 mg/L and concentrations of Ca2+, Mg2+, and Na+ of 13.7–37.2 mg/L, 13.5–16.4 mg/L, and 11.0–25.1 mg/L, respectively.
In water samples from other wells at (Na+ + K+)/(Na+ + K+ + Ca2+) > 0.5, i.e., (Na+ + K+) > Ca2+, there was an increasing participation of the chemical weathering of silicates in the series albite–anorthite and microcline:
NaAlSi3O8 → Na+ + AlO2 + 3SiO2,
CaAl2Si2O8 → Ca2+ + 2AlO2 + 2SiO2,
KAlSi3O8 → K+ + AlO2 + 3SiO2.
Figure 4b demonstrates that at Cl/(Cl + HCO3) < 0.5, i.e., HCO3 > Cl, the participation of seawater was insignificant compared to rock weathering processes, and at (Cl)/(Cl + HCO3) > 0.5, i.e., Cl > HCO3, there was an increasing participation of seawater in the formation of the composition of groundwater.
Figure 5a also demonstrates that the water composition in samples from wells 28d, Bl, Br, and Ch was formed mainly due to the chemical weathering of carbonates, while in the remaining samples, the prevailing weathering of silicate rocks was carried out.
As a result, the average concentrations of calcium and magnesium of approximately 20 and 10 mg/L in the least mineralized water from wells 28d, Bl, Br, and Ch with TDSs of 219–270 mg/L characterized the achievement of the saturation of fresh waters with these elements. Therefore, in more mineralized waters, these concentrations remained virtually unchanged, reflecting the balance between calcium from precipitating carbonates and calcium transferred into water during the dissolution of silicates (Figure 5c,d). In contrast, sodium concentrations increased 20-fold when the TDSs were increased to 700 mg/L (Figure 5e).
At the same time, Figure 5b shows that these sodium concentrations in the most mineralized waters are supplied to a greater extent by seawater rather than by water-bearing silicates. Figure 5f also shows a decrease in calcium and magnesium concentrations with increasing pH values, determined by increasing sodium concentrations in groundwater.
Finally, it should be noted that the weathering of silicates is a very slow process, since it occurs as an incongruent dissolution with the formation of a sparingly soluble solid phase on the surface of the dissolving substance [23,32,33,34,35,36]:
2NaAlSi3O8 (feldspar) + 2H+ + 9H2O = Al2Si2O5(OH)4 (kaolinite) + 2Na+ + 4H4SiO4.
In general, we can conclude that after groundwater mineralization reached approximately 0.3 g/L, it became saturated with respect to calcium. After this, the process of the dissolution of carbonates was replaced by their partial precipitation. At the same time, the incongruent dissolution of aluminosilicates led to the appearance of new clay minerals in the aquifer. Together with iron hydroxides, these newly formed calcium and clay carbonates provided the possibility of sorption and ion exchange processes:
2Na(solid) + Ca2+ → 2Na+ + Ca(solid).

4.2. Sources of Strontium in Groundwater and Processes of Transition of Strontium into Water

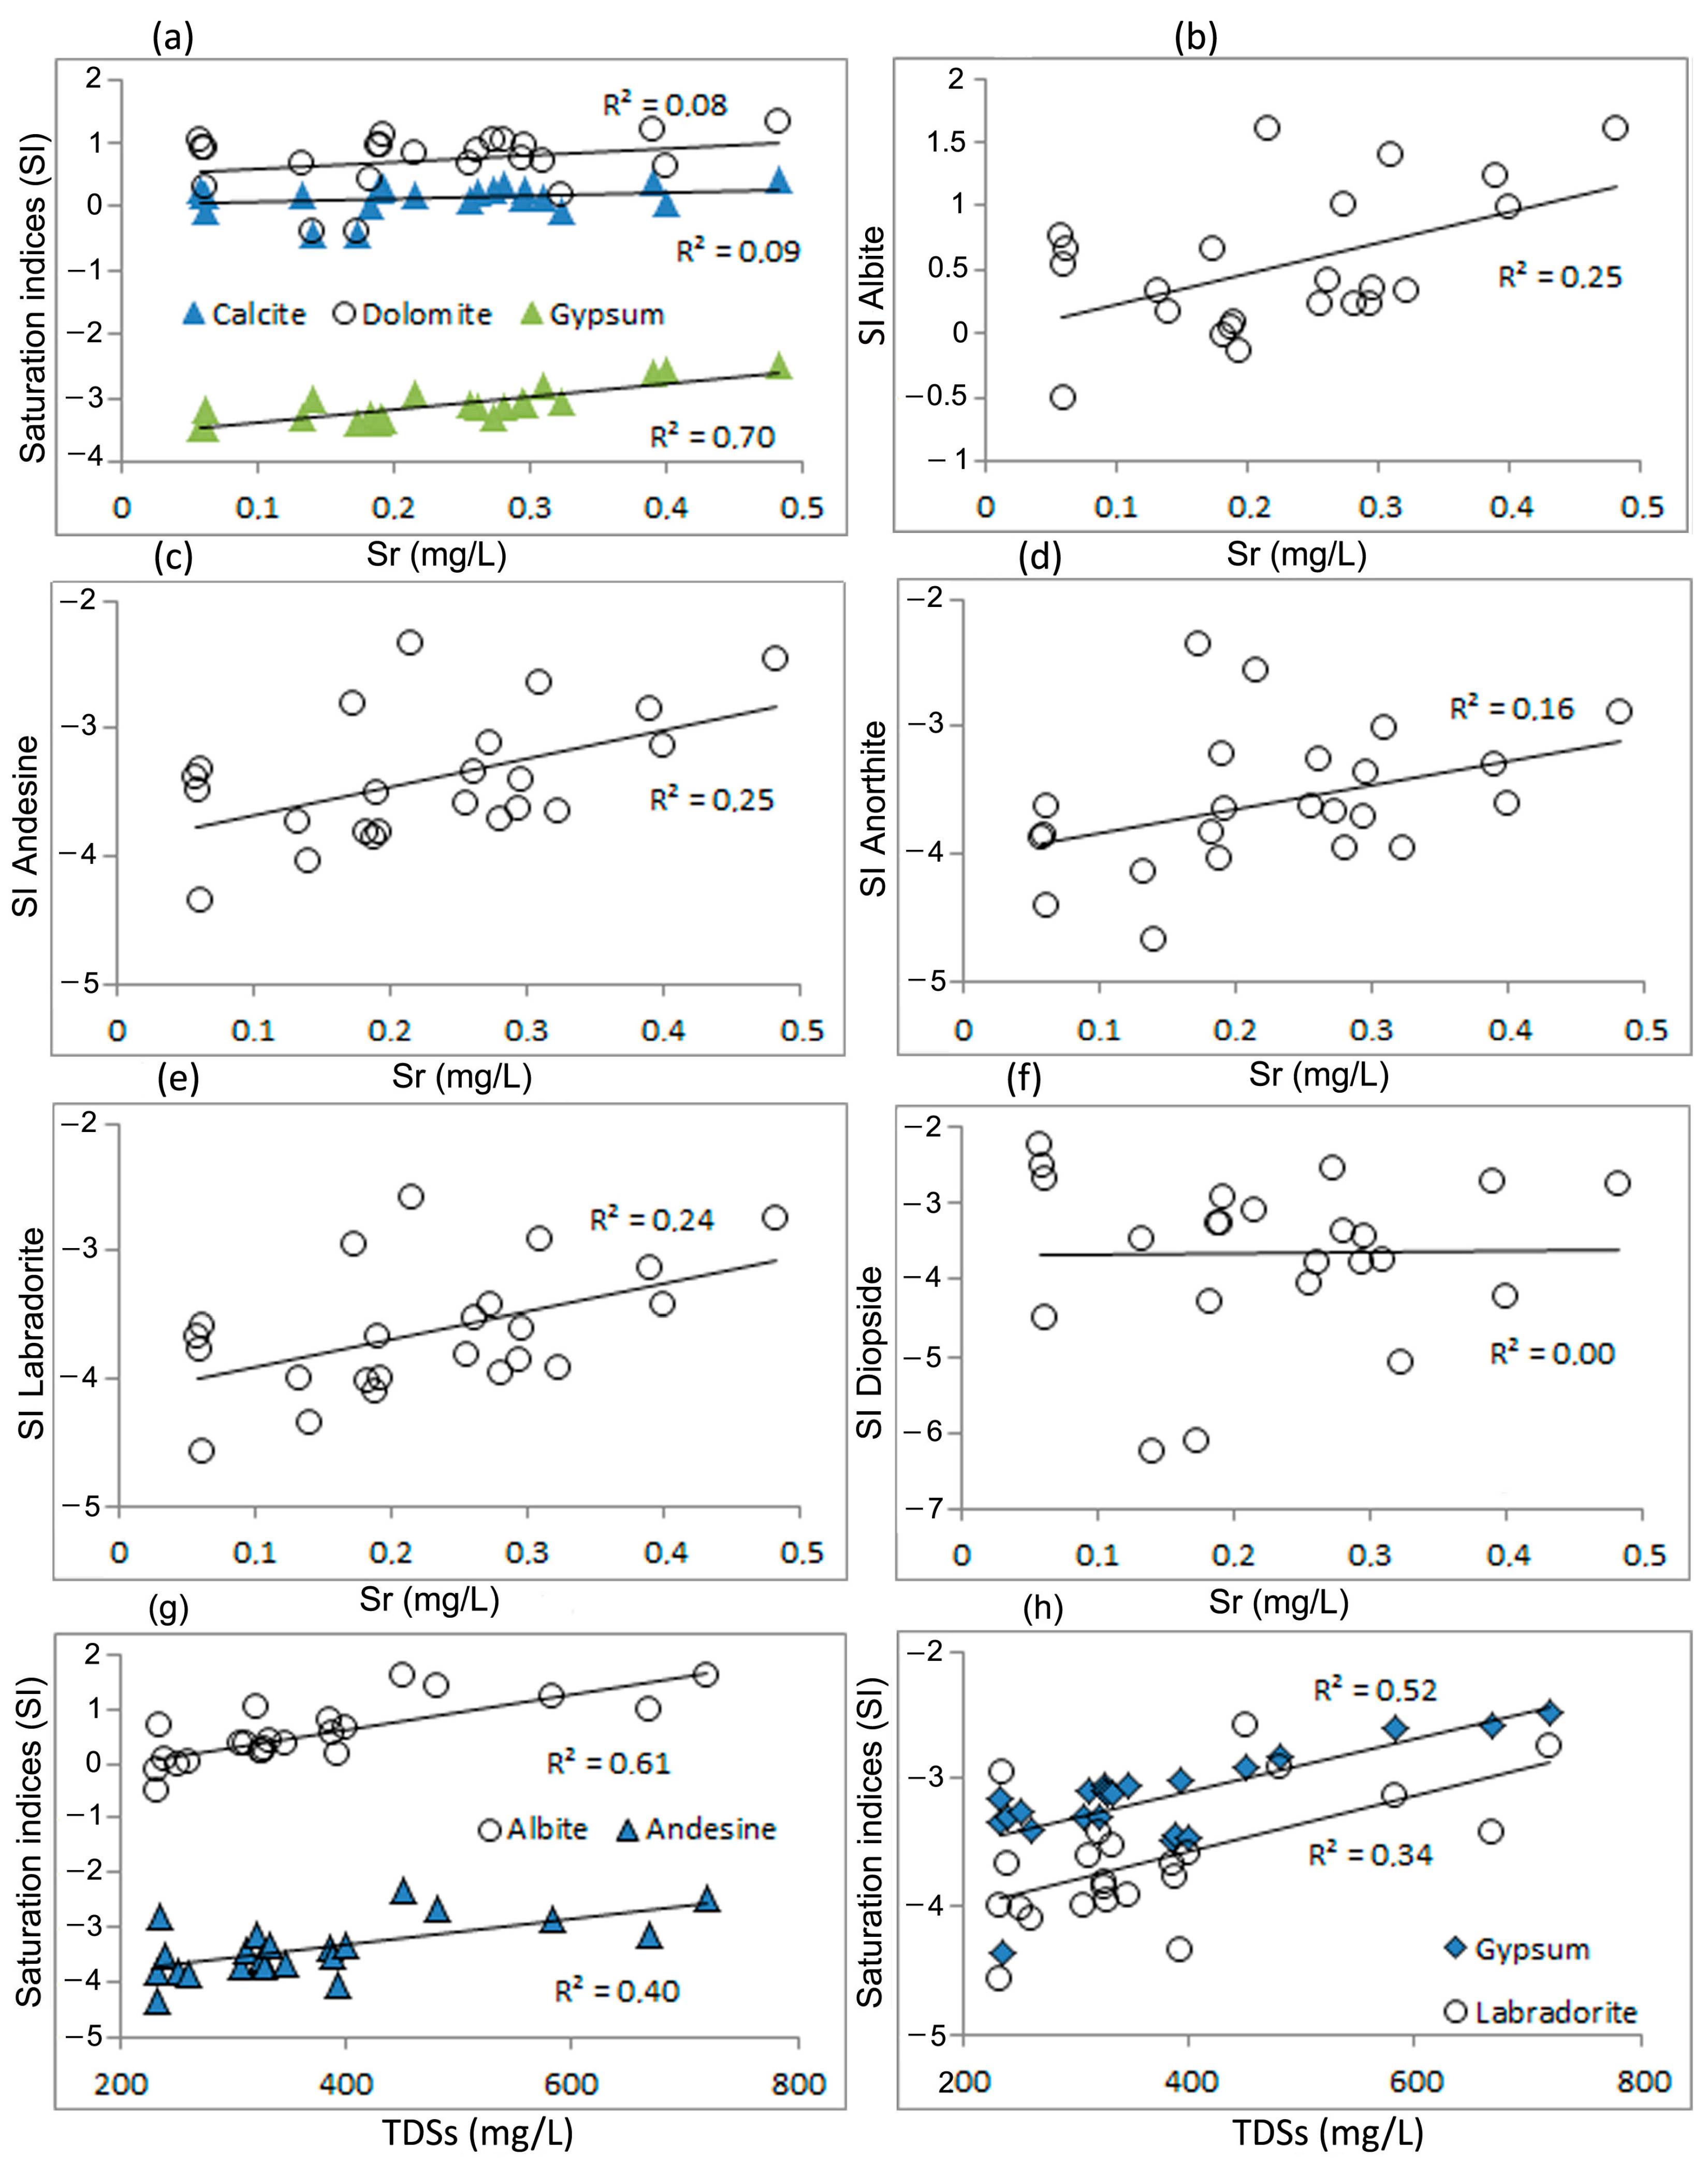
Only the saturation indices for albite, gypsum, andesite, and labradorite showed a positive linear correlation with the groundwater TDSs with R2 = 0.61, 0.52, 0.40, and 0.34, respectively (Figure 6g,h). This suggests the continued participation of these minerals in the formation of groundwater dissolved matter. The dissolution of albite was manifested in a good correlation of its saturation indices with sodium and potassium (Figure S1a) (R2 = 0.65). Gypsum dissolution was also well reflected in the correlation of its saturation indices with the concentration of the sulfate ion (Figure S1b) (R2 = 0.53). Phlogopite, diopside, anorthite, and chlorite apparently show virtually no such participation, since the values of their saturation indices remain at approximately the same level throughout the entire range of TDS values. Calcite, dolomite, and Mg-saponite played a role in saturating the water with calcium and magnesium, and at the moment only minimally mineralized water in certain areas in the areas where the aquifer is fed by precipitation participates in the dissolution of these minerals. The dissolution of calcite is clearly demonstrated in Figure S1c in which increasing calcium and magnesium concentrations are associated with a trend toward decreasing groundwater saturation indices relative to calcite. That is, calcium and magnesium already appear in water not so much due to the dissolution of carbonates but due to other sources.
With strontium, the saturation indices of the same minerals (albite, gypsum, andesite, and labradorite) also showed a positive linear correlation R2 = 0.25, 0.70, 0.25, and 0.34, respectively (Figure 6a–c,e). Strontium has a weak correlation with anorthite (R2 = 0.16) (Figure 6d), and with diopside, calcite, and dolomite there is practically no correlation (R2 = 0–0.08) (Figure 6a,f).
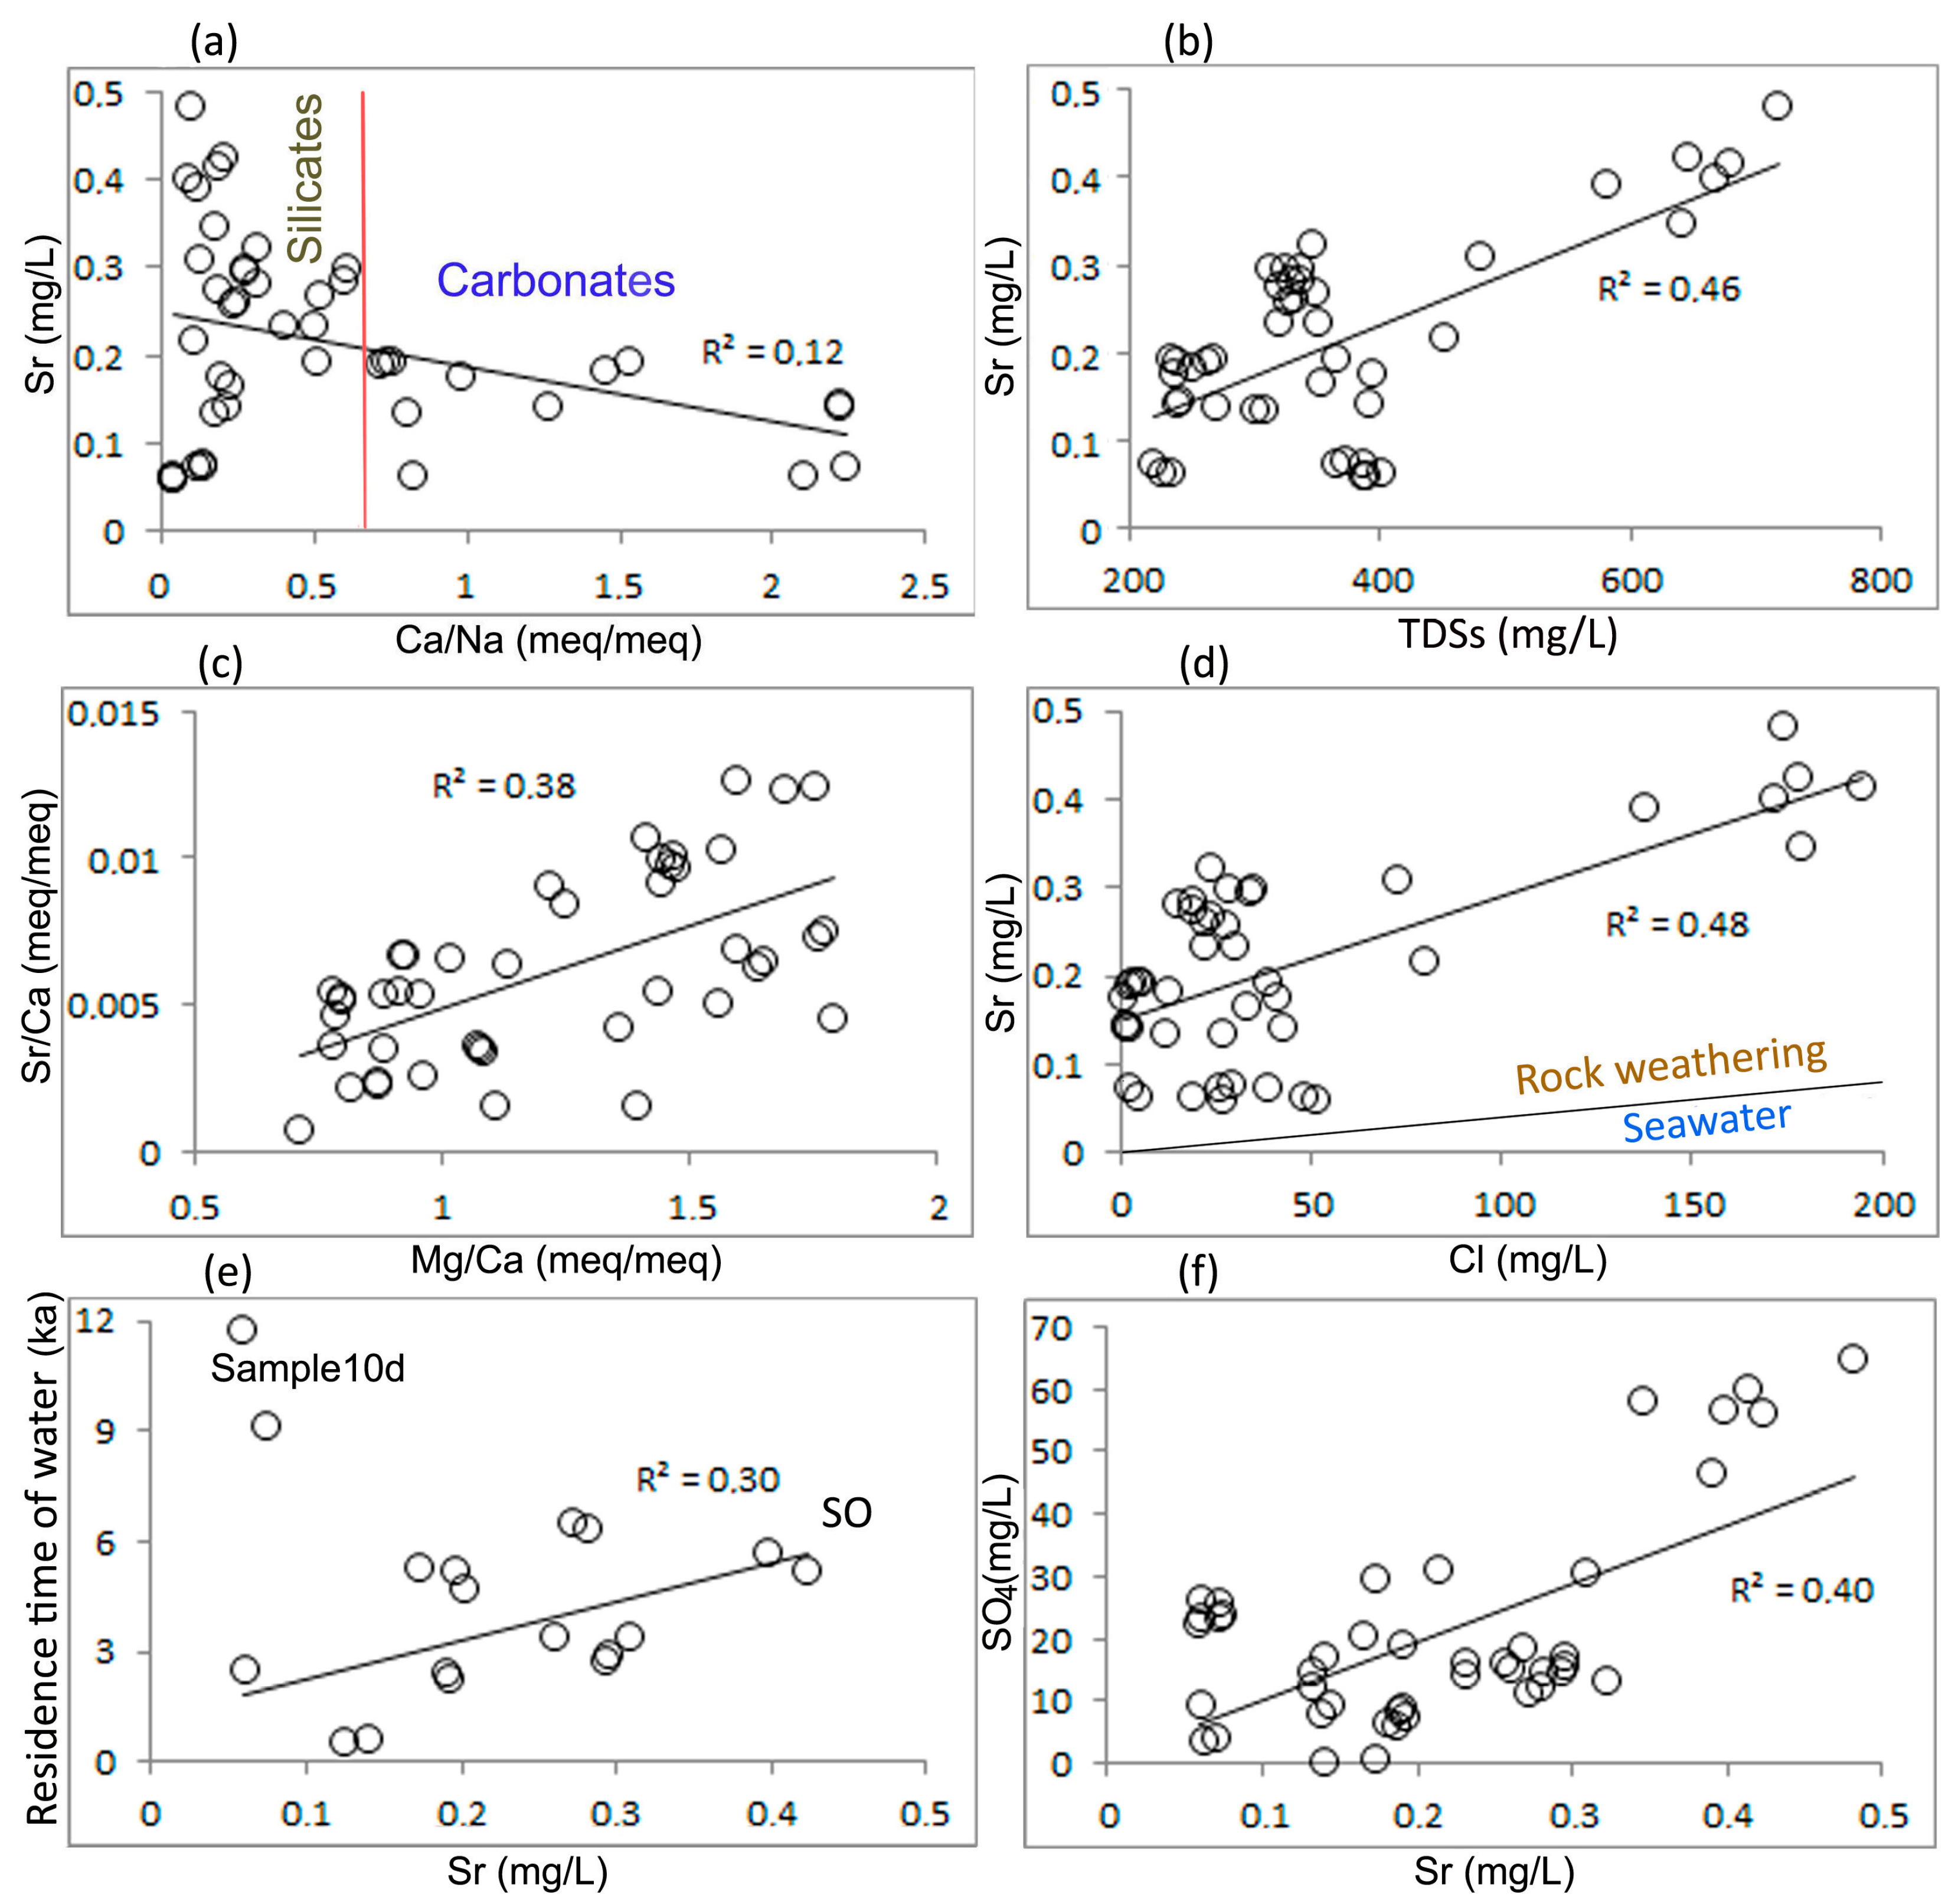
As one would expect, minimum strontium concentrations of 0.06–0.19 mg/L were found in the least mineralized waters of wells 28d, Bl, Br, and Ch with TDSs of 219–270 mg/L. They appeared mainly due to the dissolution of carbonates (Figure 7a). In more mineralized waters, where the importance of silicate dissolution and the participation of seawater in the formation of groundwater composition increases, strontium concentrations increase to 0.5 mg/L (Figure 7a). The relationship of strontium with the dissolution of the main rock-forming minerals also explains the positive linear correlation of its concentrations with groundwater TDSs (R2 = 0.46) (Figure 7b).
A positive correlation of Sr/Ca and Mg/Ca ratios may also indicate the role of the dedolomitization process in the relative increase in strontium concentrations [1,37,38] (Figure 7c).
In Section 4.1, it was shown that at (Cl)/(Cl + HCO3) > 0.5 there was an increasing participation of seawater in the formation of the composition of groundwater (Figure 4b and Figure 5b). The penetration of seawater into the Vendian aquifers occurred repeatedly during the period of marine transgressions in the Pleistocene–Holocene. The meltwater of the Last Glacial Period and atmospheric waters of the Holocene largely replaced these waters [39,40], but quite large “lenses” of salty waters have still been preserved in the Zolotitsa River valley [41].
Since in seawater with TDSs of 35 g/L the contents of chlorine and strontium are 19.4 g/L and 8 mg/L, respectively [42], then with chlorine concentrations in the studied groundwater of up to 200 mg/L (seawater is diluted 100 times), the concentration of “marine” strontium will be approximately 80 μg/L. This accounts for 15–20% of the total strontium content in water. Figure 7d shows a noticeable additional increase in strontium content due to seawater in the most mineralized samples with a chlorine concentration of more than 70 mg/L in wells 21d and 22d.
The effect of the duration of the water–rock interaction on strontium concentrations in groundwater is demonstrated in Figure 7e. Over six thousand years, they increased to 0.5 mg/L. For comparison, in carbonate sediments with a high content of celestine, strontium concentrations increased by 2–3 mg/L for every thousand years [19].
Finally, there is a correlation between strontium concentrations and sulfate ion concentrations (R2 = 0.40) (Figure 7f). This is due to the dissolution of a few gypsum inclusions in carbonate cement. The low gypsum content is confirmed by the very low degree of groundwater saturation with respect to this mineral, with the SI varying from −4.46 to −2.47 (Table 3, Figure 6a). In addition, the coefficient of determination of the ratio of saturation index for gypsum to TDSs (R2 = 0.52) is lower than for albite (R2 = 0.61) (Figure 6g,h).

4.3. Statistical Estimates

Table 5 and Table 6 show significant positive correlations of strontium concentrations with the well depth, total dissolved solids, and sodium, magnesium, chlorine, sulfate, and bicarbonate ion concentrations. There is no such connection with calcium. This confirms that the concentration of strontium in groundwater is mainly due to the dissolution of the main rock-forming silicates and gypsum inclusions, ion exchange, and the influence of seawater. The significant role of carbon dioxide in rock dissolution processes is associated with an increase in the concentration of the bicarbonate ion.
Section 4.1 showed that the negative correlation of calcium and magnesium concentrations with pH values (Table 6) is determined by increasing sodium concentrations in groundwater.

4.4. The Danger of Strontium When Using Groundwater for Drinking

The assessment of the non-carcinogenic human health risk from contact with the groundwater (HI) was carried out in accordance with the procedure described by the US Environmental Protection Agency [43,44,45]. The methodology for assessing the exposure and risk to human health, as well as the main parameters and values used for deterministic exposure calculations, has been presented in previous work [5].
The calculation results are presented in Table 7 and demonstrate the safety of using the studied groundwater for drinking purposes, since the hazard index (HI) values in all samples are less than one. The strontium concentrations are also below the maximum permissible values (Table S2) [46].
Previously conducted studies of the full composition of metals in groundwater have shown that for drinking purposes it is preferable to use low-mineralized water with preliminary aeration [47].

5. Conclusions

The purpose of this study was to determine (i) the sources of strontium in groundwater, (ii) the processes of transition of strontium into water, (iii) the effect of proximity to the sea on strontium concentrations in groundwater, (iv) the effect of the duration of the water–rock interaction on strontium concentrations in groundwater, and (v) the danger of using these waters for drinking purposes.
The results showed the following:
  • Minimum concentrations of strontium were characteristic of the least mineralized waters and appeared there mainly due to the dissolution of carbonates. After their saturation with respect to calcite, the process of the dissolution of carbonates was replaced by their precipitation.
  • Increased strontium concentrations were observed in more mineralized waters where silicate dissolution increased. The incongruent dissolution of aluminosilicates led to the appearance of new clay minerals in the aquifer. Together with iron hydroxides, newly formed calcium and clay carbonates provided the possibilities for sorption and ion exchange processes.
  • There was an increase in the strontium–calcium ratio associated with the dedolomitization process.
  • The transfer of strontium into water due to the dissolution of gypsum inclusions in cement was limited.
  • The contribution of seawater was significant in increasing sodium and chlorine concentrations. The strontium content increased due to seawater by approximately 15–20%.
  • The influence of the duration of the water–rock interaction on strontium concentrations in groundwater was expressed in the fact that over a thousand years they increased by 0.1 mg/L, which is 20–30 times less than in the waters of carbonate sediments located 100 km to the east.
  • An assessment of the non-carcinogenic risk to human health of contact with the groundwater showed the safety of using the studied groundwater for drinking purposes.

Supplementary Materials

The following supporting information can be downloaded at https://www.mdpi.com/article/10.3390/w16172369/s1, Figure S1: Graphs showing the dependence of (a) Na+K concentrations in water on albite water saturation indices, (b) SO4 concentrations in water on gypsum water saturation indices, (c) Ca+Mg concentrations in water on calcite water saturation indices. Table S1: Ionic composition of groundwater. Table S2: Maximum permissible concentration, as described by the Russian (SanPiN, 2001) [48] and Chinese (GB 5749-2022, 2022) [49] national guidelines, as well as the international guideline (WHO, 2022) [50] for drinking water quality.

Funding

This work was supported by the Russian Ministry of Education and Science (project no. 122011300333-1).

Data Availability Statement

Data are available upon reasonable request from the corresponding author.

Conflicts of Interest

The author declares no conflicts of interest.

References

  1. Musgrove, M. The occurrence and distribution of strontium in U.S. groundwater. Appl. Geochem. 2021, 126, 104867. [Google Scholar] [CrossRef]
  2. Heine, F.; Zosseder, K.; Einsiedl, F. Hydrochemical Zoning and Chemical Evolution of the Deep Upper Jurassic Thermal Groundwater Reservoir Using Water Chemical and Environmental Isotope Data. Water 2021, 13, 1162. [Google Scholar] [CrossRef]
  3. Li, D.; Gan, S.; Li, J.; Dong, Z.; Long, Q.; Qiu, S.; Zhou, Y.; Lu, C. Hydrochemical Characteristics and Formation Mechanism of Strontium-Rich Groundwater in Shijiazhuang, North China Plain. J. Chem. 2021, 5547924. [Google Scholar] [CrossRef]
  4. Liang, C.; Wang, W.; Ke, X.; Ou, A.; Wang, D. Hydrochemical Characteristics and Formation Mechanism of Strontium-Rich Groundwater in Tianjiazhai, Fugu, China. Water 2022, 14, 1874. [Google Scholar] [CrossRef]
  5. Malov, A.I. Features of the Formation of Strontium Pollution of Drinking Groundwater and Associated Health Risks in the North-West of Russia. Water 2023, 15, 3846. [Google Scholar] [CrossRef]
  6. Huang, T.; Ma, B. The Origin of Major Ions of Groundwater in a Loess Aquifer. Water 2019, 11, 2464. [Google Scholar] [CrossRef]
  7. Mughal, A.; Sultan, K.; Ashraf, K.; Hassan, A.; Zaman, Q.U.; Haider, F.U.; Shahzad, B. Risk Analysis of Heavy Metals and Groundwater Quality Indices in Residential Areas: A Case Study in the Rajanpur District, Pakistan. Water 2022, 14, 3551. [Google Scholar] [CrossRef]
  8. Wang, B.; Zhou, X.; Zhou, Y.; Yan, Y.; Li, Y.; Ouyang, S.; Liu, F.; Zhong, J. Hydrogeochemistry and Precursory Anomalies in Thermal Springs of Fujian (Southeastern China) Associated with Earthquakes in the Taiwan Strait. Water 2021, 13, 3523. [Google Scholar] [CrossRef]
  9. Yu, M.; Wang, G.; Ma, F.; Zhang, W.; Lin, W.; Zhu, X.; Zhang, H. Geochemical Characteristics of Geothermal Fluids of a Deep Ancient Buried Hill in the Xiong’an New Area of China. Water 2022, 14, 3182. [Google Scholar] [CrossRef]
  10. Wu, C.; Wu, X.; Mu, W.; Zhu, G. Using Isotopes (H, O, and Sr) and Major Ions to Identify Hydrogeochemical Characteristics of Groundwater in the Hongjiannao Lake Basin, Northwest China. Water 2020, 12, 1467. [Google Scholar] [CrossRef]
  11. Yang, N.; Su, C.; Liu, W.; Zhao, L. Occurrences and mechanisms of strontium-rich groundwater in Xinglong County, northern China: Insight from hydrogeological and hydrogeochemical evidence. Hydrogeol. J. 2022, 30, 2043–2057. [Google Scholar] [CrossRef]
  12. Swarzenski, P.W.; Baskaran, M.; Rosenbauer, R.J.; Edwards, B.D.; Land, M. A Combined Radio- and Stable-Isotopic Study of a California Coastal Aquifer System. Water 2013, 5, 480–504. [Google Scholar] [CrossRef]
  13. Khandare, A.L.; Validandi, V.; Rajendran, A.; Singh, T.G.; Thingnganing, L.; Kurella, S.; Nagaraju, R.; Dheeravath, S.; Vaddi, N.; Kommu, S.; et al. Health risk assessment of heavy metals and strontium in groundwater used for drinking and cooking in 58 villages of Prakasam district, Andhra Pradesh, India. Environ. Geochem. Health 2020, 42, 3675–3701. [Google Scholar] [CrossRef]
  14. Bui, D.T.; Khosravi, K.; Karimi, M.; Busico, G.; Khozani, Z.S.; Nguyen, H.; Mastrocicco, M.; Tedesco, D.; Cuoco, E.; Kazakis, N. Enhancing nitrate and strontium concentration prediction in groundwater by using new data mining algorithm. Sci. Total Environ. 2020, 715, 136836. [Google Scholar] [CrossRef]
  15. Ding, D.; Kong, L.; Jiang, D.; Wei, J.; Cao, S.; Li, X.; Zheng, L.; Deng, S. Source apportionment and health risk assessment of chemicals of concern in soil, water and sediment at a large strontium slag pile area. J. Environ. Manag. 2022, 304, 114228. [Google Scholar] [CrossRef] [PubMed]
  16. Keesari, T.; Sabarathinam, C.; Sinha, U.K.; Pethaperumal; Thilagavathi, R.; Kamaraj, P. Fate and transport of strontium in groundwater from a layered sedimentary aquifer system. Chemosphere 2022, 307, 136015. [Google Scholar] [CrossRef]
  17. Plechacek, A.; Scott, S.R.; Gotkowitz, M.B.; Ginder-Vogel, M. Strontium and radium occurrence at the boundary of a confined aquifer system. Appl. Geochem. 2022, 142, 105332. [Google Scholar] [CrossRef]
  18. Malov, A.I.; Zykov, S.B. Study of the Mobilization of Uranium Isotopes in a Sandstone Aquifer in Combination with Groundwater Data. Water 2020, 12, 112. [Google Scholar] [CrossRef]
  19. Malov, A.I.; Sidkina, E.S.; Ershova, D.D.; Cherkasova, E.V.; Druzhinin, S.V. Time regularities of strontium concentration in drinking groundwater distant from the sea coast. Env. Geochem. Health 2023, 45, 8097–8118. [Google Scholar] [CrossRef]
  20. Malyshev, V.I.; Bakhur, A.E.; Manuylova, L.I. Methods for Measuring the Volumetric Activity of Uranium Isotopes (234, 238) in Natural Water Sample Alpha Spectrometry with Radiochemical Separation; RIMR: Moscow, Russia, 1999. (In Russian) [Google Scholar]
  21. Fröhlich, K. Dating of old groundwater using uranium isotopes—Principles and applications. In Isotope Methods for Dating Old Groundwate; IAEA: Vienna, Austria, 2013; pp. 153–178. [Google Scholar]
  22. Garrels, R.M.; Christ, C.L. Solutions, Minerals, and Equilibria; Jones and Bartlett Publishers: Boston, MA, USA, 1990. [Google Scholar]
  23. Krainov, S.R.; Ryzhenko, B.N.; Shvets, V.M. Geochemistry of Groundwater. Fundamental, Applied and Environmental Aspects; CenterLitNefteGaz: Moskow, Russia, 2012. (In Russian) [Google Scholar]
  24. Malov, A.I. Evolution of the groundwater chemistry in the coastal aquifers of the south-eastern White Sea area (NW Russia) using 14C and 234U-238U dating. Sci. Total Environ. 2018, 616–617, 1208–1223. [Google Scholar] [CrossRef]
  25. Han, L.-F.; Plummer, N. Revision of Fontes and Garnier’s model for the initial 14C content of dissolved inorganic carbon used in groundwater dating. Chem. Geol. 2013, 351, 105–114. [Google Scholar] [CrossRef]
  26. Han, L.-F.; Plummer, N. A review of single-sample-based models and other approaches for radiocarbon dating of dissolved inorganic carbon in groundwater. Earth Sci. Rev. 2016, 152, 119–142. [Google Scholar] [CrossRef]
  27. Ingerson, E.; Pearson, F.J. Estimation of age and rate of motion of groundwater by the 14C method. In Recent Researches in the Fields of Hydrosphere; Atmosphere and Nuclear Geochemistry: Tokyo, Japan, 1964; pp. 263–283. [Google Scholar]
  28. Pearson, F.J., Jr.; Hanshaw, B.B. Sources of dissolved carbonate species in groundwater and their effects on carbon-14 dating. In Isotope Hydrology; IAEA: Vienna, Austria, 1970; pp. 271–286. [Google Scholar]
  29. Reimer, P.J.; Austin, W.E.N.; Bard, E.; Bayliss, A.; Blackwell, P.G.; Ramsey, C.B.; Butzin, M.; Cheng, H.; Edwards, R.L.; Friedrich, M.; et al. The IntCal20 Northern Hemisphere radiocarbon age calibration curve (0–55 ka cal BP). Radiocarbon 2020, 62, 725–757. [Google Scholar] [CrossRef]
  30. Stuiver, M.; Reimer, P.J.; Reimer, R.W. CALIB 8.2 [WWW Program]. 2021. Available online: http://calib.org (accessed on 16 February 2021).
  31. Gibbs, R.J. Mechanisms Controlling World Water Chemistry. Sci. New Ser. 1970, 170, 1088–1090. [Google Scholar] [CrossRef]
  32. Shvartsev, S.L. Interaction of water with aluminosilicate rocks. Geol. Geophys. 1991, 12, 16–50. (In Russian) [Google Scholar]
  33. Shvartsev, S.L. Hydrogeochemistry of the Hypergenesis Zone; Nedra: Moscow, Russia, 1998. (In Russian) [Google Scholar]
  34. Shao, H.B.; Ray, J.R.; Jun, Y.S. Dissolution and Precipitation of Clay Minerals under Geologic CO2 Sequestration Conditions: CO2-Brine-Phlogopite Interactions. Environ. Sci. Technol. 2010, 44, 5999–6005. [Google Scholar] [CrossRef]
  35. Cappelli, C.; Lamarca-Irisarri, D.; Camas, J.; Huertas, F.J.; Van Driessche, A.E. In situ observation of biotite (001) surface dissolution at pH 1 and 9.5 by advanced optical microscopy. Beilstein J. Nanotechnol. 2015, 6, 665–673. [Google Scholar] [CrossRef]
  36. Wang, J.; Yagi, M.; Tamagawa, T.; Hirano, H.; Watanabe, N. Reactivity and Dissolution Characteristics of Naturally Altered Basalt in CO2-Rich Brine: Implications for CO2 Mineralization. ACS Omega 2024, 9, 4429–4438. [Google Scholar] [CrossRef]
  37. Magaritz, M.; Kafri, U. Stable isotope and Sr2+/Ca2+ evidence of diagenetic dedolomitization in a schizohaline environment: Cenomanian of northern Israel. Sediment. Geol. 1981, 28, 29–41. [Google Scholar] [CrossRef]
  38. Musgrove, M.; Banner, J.L. Controls on the spatial and temporal variability of vadose dripwater geochemistry: Edwards aquifer, central Texas. Geochem. Cosmochim. Acta 2004, 68, 1007–1020. [Google Scholar] [CrossRef]
  39. Pärn, J.; Raidla, V.; Vaikmäe, R.; Martma, T.; Ivask, J.; Mokrik, R.; Erg, K. The recharge of glacial meltwater and its influence on the geochemical evolution of groundwater in the Ordovician-Cambrian aquifer system, northern part of the Baltic Artesian Basin. Appl. Geochem. 2016, 72, 125–135. [Google Scholar] [CrossRef]
  40. Gerber, C.; Vaikmäe, R.; Aeschbach, W.; Babre, A.; Jiang, W.; Leuenberger, M.; Lu, Z.-T.; Mokrik, R.; Müller, P.; Raidla, V.; et al. Using 81Kr and noble gases to characterize and date groundwater and brines in the Baltic Artesian Basin on the one-million-year timescale. Geochim. Cosmochim. Acta 2017, 205, 187–210. [Google Scholar] [CrossRef]
  41. Malov, A.I.; Sidkina, E.S.; Cherkasova, E.V. The Influence of DOC on the Migration Forms of Elements and Their Sedimentation from River Waters at an Exploited Diamond Deposit (NW Russia). Water 2023, 15, 2160. [Google Scholar] [CrossRef]
  42. Riley, J.P.; Skirrow, G. (Eds.) Chemical Oceanography; Academic Press: London, UK, 1965. [Google Scholar]
  43. USEPA. Supplemental Guidance for Developing Soil Screening Levels for Superfund Sites; OSWER 9355.4-24; U.S. Environmental Protection Agency: Washington, DC, USA, 2002.
  44. USEPA. Risk Assessment Guidance for Superfund; Volume I: Human Health Evaluation Manual (Part E, Supplemental Guidance for Dermal Risk Assessment). Final. EPA/540/R/99/005; U.S. Environmental Protection Agency: Washington, DC, USA, 2004. [Google Scholar]
  45. USEPA. Health Effects Support Document for Strontium; EPA 820-P-14-0012014; U.S. Environmental Protection Agency: Washington, DC, USA, 2014.
  46. Nazir, M.A.; Yasar, A.; Bashir, M.A.; Siyal, S.H.; Najam, T.; Javed, M.S.; Ahmad, K.; Hussain, S.; Anjum, S.; Hussain, E.; et al. Quality assessment of the noncarbonated-bottled drinking water: Comparison of their treatment techniques. Int. J. Environ. Anal. Chem. 2020, 102, 8195–8206. [Google Scholar] [CrossRef]
  47. Malov, A.I. Assessment of water supply to the East European Arctic agglomeration from groundwater, taking into account their quality and health risks. Environ. Pollut. 2024, 360, 124636. [Google Scholar] [CrossRef]
  48. SanPiN. Sanitary and Epidemiological Rules and Regulations "Drinking Water. Hygienic Requirements for Water Quality in Centralized Drinking Water Supply Systems. Quality Control"; Ministry of Health of the Russian Federation: Moscow, Russia, 2001; p. 67. (In Russian)
  49. GB 5749-2022; Standards for Drinking Water Quality. National Standard of the People’s Republic of China: Beijing, China, 2022; p. 10. Available online: https://faolex.fao.org/docs/pdf/chn222304.pdf (accessed on 29 July 2024).
  50. WHO. Guidelines For Drinking-Water Quality, 4th ed.; World Health Organization: Geneva, Switzerland, 2022; p. 614.
Figure 1. Scheme of groundwater sampling (a) on a map and (b) on a hydrogeological cross-section.
Water 16 02369 g001
Figure 2. Ionic composition of groundwater.
Water 16 02369 g002
Figure 3. Saturation indices of groundwater for minerals.
Water 16 02369 g003
Figure 4. (a,b) Gibbs plot of groundwater. Green points are groundwater samples.
Water 16 02369 g004
Figure 5. Diagrams characterizing the sources of the main components of the chemical composition of groundwater and the distribution of Ca, Mg, and Na depending on TDSs and pH: (a) Mg2+/Na+ vs. Ca2+/Na+, (b) Na+ vs. Cl, (c) Ca2+ vs. TDSs, (d) Mg2+ vs. TDSs, (e) Na+ vs. TDSs, and (f) Ca2+ and Mg2+ vs. pH.
Water 16 02369 g005
Figure 6. Graphs showing the dependence of strontium concentrations on the degree of saturation of groundwater in relation to (a) calcite, dolomite, and gypsum, (b) albite, (c) andesite, (d) anorthite, (e) labradorite, (f) diopside, (g) albite and andesine, and (h) gypsum and labradorite.
Water 16 02369 g006
Figure 7. Graphs showing the dependence of strontium concentrations on (a) Ca2+/Na+, (b) TDSs, (c) Mg2+/Ca2+, (d) Cl, (e) residence time, and (f) SO42−.
Water 16 02369 g007
Table 1. Average chemical composition of water-bearing sediments, %.
SiO2TiO2Al2O3Fe2O3FeOMnOMgOCaONa2OK2OP2O5Cr2O3V2O5LOI
Sa 191.50.383.591.080.220.040.480.500.101.110.040.020.010.99
Si 272.00.8112.85.300.300.141.240.480.142.940.070.020.013.66
Notes: 1 sandstones; 2 siltstones.
Table 2. Descriptive statistics of groundwater chemistry.
ParameterUnitMeanMaxMinStd. Dev.
Depthm14018080.021.3
pHunit8.459.207.800.37
TDSmg·L−1368719219132
Na+mg·L−168.81992.0349.4
K+mg·L−14.039.141.541.37
Ca2+mg·L−117.537.23.667.61
Mg2+mg·L−111.918.83.783.70
Clmg·L−144.81951.1054.7
SO42−mg·L−120.664.70.0416.5
HCO3mg·L−120123914619.6
Srµg.L−121248158.4112
Table 3. Indices of groundwater saturation in relation to the main rock-forming minerals.
(Ca)(Ca-Na)(Ca-Mg)(Mg)
Well
ID
GypsumCalciteAnorthiteLabradoriteAndesineAlbiteDolomiteDiopsideChloritePhlogopiteMg-Saponite
21d−2.600.39−3.29−3.13−2.851.231.21−2.741.24−7.543.78
22d−2.910.20−2.56−2.58−2.341.60.84−3.090.13−7.633.39
16h−3.02−0.45−4.66−4.34−4.030.18−0.39−6.24−8.96−10.73−1.56
10d−3.480.27−3.88−3.66−3.370.771.03−2.253.15−7.574.46
26d−3.05−0.08−3.96−3.91−3.650.340.18−5.1−5.92−10.69−0.01
36d−3.120.34−3.96−3.96−3.710.241.04−3.39−0.77−8.762.54
24d−3.290.18−4.13−4.00−3.720.340.69−3.48−1.20−9.012.31
28d−3.390.26−4.03−4.10−3.860.040.95−3.28−0.40−9.032.83
Ch−3.260.00−3.83−4.02−3.81−0.010.41−4.31−3.69−10.071.29
21d−2.580.06−3.61−3.42−3.130.980.62−4.24−2.89−8.851.57
21d−2.470.41−2.88−2.74−2.461.611.33−2.771.29−7.223.96
Ae−3.300.25−3.67−3.42−3.121.021.03−2.552.47−7.444.10
22d−2.820.13−3.02−2.91−2.641.400.72−3.74−1.80−8.352.41
10d−3.440.19−3.85−3.76−3.490.540.91−2.532.70−7.434.08
10d−3.460.19−3.62−3.58−3.320.660.91−2.712.11−8.123.83
26d−3.090.27−3.36−3.61−3.400.360.96−3.45−0.49−8.342.63
26d−3.060.16−3.71−3.84−3.620.230.76−3.80−1.59−9.192.06
36d−3.120.21−3.26−3.52−3.330.410.86−3.79−1.47−8.682.14
36d−3.090.12−3.63−3.80−3.580.230.67−4.07−2.31−9.271.66
28d−3.340.32−3.64−3.99−3.81−0.141.13−2.921.20−8.013.48
28d−3.290.25−3.21−3.67−3.510.080.98−3.260.17−8.273.05
Ch−4.36−0.43−2.36−2.95−2.810.67−0.41−6.09−8.67−11.7−1.06
Br−3.16−0.05−4.41−4.56−4.34−0.510.32−4.51−3.81−10.80.85
Mean−3.160.14−3.59−3.63−3.390.530.73−3.67−1.28−8.812.34
Table 4. The main components of the isotopic composition and age of the groundwater.
Sample IDU
(µg/L)
234U/238U
(unit)
14C
(pmc)
δ13C
(‰)
14C Age
(cal BP, ka) a
234U-238U Age
(ka) b
Ae-20132.53 ± 0.055.26 ± 0.68NANANC6.5 ± 1.0
Br-20134.36 ± 0.091.97 ± 0.29NANANC2.5 ± 0.4
28d-20133.27 ± 0.062.11 ± 0.32NANANC2.2 ± 0.3
28d-20142.99 ± 0.062.39 ± 0.3658.40 ± 0.89−11.0modern2.4 ± 0.4
28d-20210.65 ± 0.014.08 ± 0.5930.07 ± 0.44−11.74.7 ± 0.36NC
26d-20132.44 ± 0.053.04 ± 0.45NANANC2.9 ± 0.4
26d-20132.41 ± 0.052.86 ± 0.43NANANC2.7 ± 0.4
36d-20131.99 ± 0.044.34 ± 0.65NANANC3.4 ± 0.2
36d-20142.00 ± 0.044.81 ± 0.6225.01 ± 0.47−11.76.34 ± 0.36NC
10d-201314.14 ± 0.282.39 ± 0.36NANANC11.7 ± 1.6
22d-20146.37 ± 0.131.63 ± 0.2424.86 ± 0.43−10.15.22 ± 0.39NC
22d-20213.30 ± 0.063.23 ± 0.4526.62 ± 0.32−11.05.20 ± 0.44NC
10d-201413.35 ± 0.272.14 ± 0.31NANANC9.1 ± 1.2
22d-20134.47 ± 0.092.28 ± 0.34NANANC3.4 ± 0.5
21d-20139.60 ± 0.191.99 ± 0.30NANANC5.7 ± 0.8
21d-201410.38 ± 0.211.84 ± 0.27NANANC5.2 ± 0.8
21d-20211.80 ± 0.043.64 ± 0.4745.17 ± 0.66−11.610.5 ± 0.07NC
16h-20121.12 ± 0.021.93 ± 0.28NANANC0.56 ± 0.1
Notes: NA, not analyzed; NC, not calculated. a Pearson model; the ages were calibrated using the Calib Rev 8.1.0 program, which uses the 2020 international calibration datasets with respect to IntCal20 [29,30], two sigma ranges. b Malov, 2018 model [24].
Table 5. Pearson correlation matrix for groundwater composition components.
hpHTDSNa+K+Ca2+Mg2+ClSO42−HCO3Sr
h10.040.85 a0.820.580.040.170.830.840.520.56
pH 10.220.35 b0.20−0.71−0.710.110.260.37−0.16
TDS 10.980.60−0.030.130.970.980.620.68
Na+ 10.62−0.210.020.920.970.660.60
K+ 1−0.310.030.540.570.470.28
Ca2+ 10.700.10−0.02−0.320.23
Mg2+ 10.280.11−0.330.49
Cl 10.970.430.69
SO42− 10.550.63
HCO3− 10.37
Sr 1
Notes: a—significance value p ≤ 0.01; b—significance value p ≤ 0.05.
Table 6. Principal component analysis of groundwater.
ParameterComponent
12
h, m0.890.07
pH0.18−0.86
TDS0.99−0.02
Na+0.97−0.19
K+0.66−0.22
Ca2+−0.030.89
Mg2+0.170.91
Cl0.960.13
SO42−0.97−0.03
HCO30.64−0.43
Sr0.720.39
% of variance54.425.4
Sum 79.8%
Table 7. Hazard index (HI) of fresh drinking groundwater.
Non-Carcinogenic Risks for AdultsNon-Carcinogenic Risks for Children
Well IDHazard Index (HI) for Strontium
21d0.01870.0549
22d0.00990.0290
16h0.00640.0188
10d0.00310.0090
36d0.01190.0348
26d0.01170.0342
Ae0.01250.0366
24d0.00610.0178
28d0.00820.0242
Ch0.00730.0215
Br0.00280.0083
Bl0.00330.0095
HI0.00870.0250
Disclaimer/Publisher’s Note: The statements, opinions and data contained in all publications are solely those of the individual author(s) and contributor(s) and not of MDPI and/or the editor(s). MDPI and/or the editor(s) disclaim responsibility for any injury to people or property resulting from any ideas, methods, instructions or products referred to in the content.