Abstract
This paper deals with beach litter presence on the Ionian coast of Albania, i.e., at Vlora Bay and the Albanian Riviera, which is the most famous coastal tourist destination in the country. Along 16 beaches surveyed in November–December 2022 was found a total amount of 6621 litter items (or 416 kg) belonging to 114 categories of the EU J−code list. Most of these were plastic fragments and items (82%), mainly linked to local tourist activities. Wastewaters were responsible for bringing different litter items to the urban beaches of Vlora Bay. The most commonly observed litter items were cigarette butts, plastic caps/lids, and medium-sized plastic fragments of non-foamed plastic. The cleanest beaches, quite often, were the ones where beach clubs implemented clean-up programs during and at the end of the summer season. The results of this paper constitute a baseline of the beach litter amount and content along the study coast, which has never been investigated before. Municipalities and beach clubs have to implement more frequent and efficient clean-up activities and educational initiatives to reduce beach pollution, with special attention paid to the presence of cigarette butts and other small plastic items.
1. Introduction
Litter enters seas and oceans worldwide from the land (ca. 80%), e.g., it is transported by rivers, runoff waters, winds, and illegal dumping and/or is abandoned by visitors on the beach and marine-based sources (ca. 20%), e.g., is accidentally lost or discarded to the sea from ports, offshore installations, and different shipping [1] and fishing activities [2,3]. Circa 70% of the total amount of litter that enters oceans and seas ends up on the sea bottom, 15% floats in the water column and on the ocean surface, and 15% is stranded on coastal environments [4], e.g., on beaches, salt marshes, and mangrove swamps [5] and/or is trapped within protection structures, especially revetments and groins/breakwaters, which present a great porosity [6]. The presence of litter greatly affects the aesthetic quality of beaches [7,8,9]. Especially relevant is the occurrence of unattractive and potentially hazardous items such as condoms, syringes, vials, glass fragments, etc., which have negative effects on beach tourism since causes losses of tourist days and associated economic incomes [8]. As an example, Krelling et al. [10] evidenced in several municipalities in Brazil that the occurrence of >15 litter items m−2 (or 30 items per linear meter) produced a reduction in local tourism incomes by 39%, i.e., ca. US$ 8.5 million/year. Litter also causes detrimental environmental problems to ecosystems (e.g., the entanglement of animals in abandoned nets, ropes, ribbons, fishing lines, etc., [11]) and human beings (e.g., lacerations and cuts, [12]).
The absence of beach litter is, according to the results of thousands of questionnaires, carried out in different countries one of the five parameters (namely the “Big Five”, i.e., no litter, safety, facilities, water and sediment quality, and scenery) that are of the uppermost relevance to beach visitors [13,14].
Therefore, beach litter constitutes a relevant threat to international tourist arrivals, which increased from 25 million (in 1950) to 1.5 billion (in 2019) and contributed to US$ 1481 billion in receipts [15]. The above trend is supposed to increase, and international visitors should bring in 1.8 billion on a global scale by 2030 [16]. International tourism is rapidly recovering after the relevant decrease recorded during the COVID-19 pandemic [17,18] and, in 2022, over 900 million tourists traveled internationally, recovering 63% of the pre-pandemic value, with Europe being one of the leaders of this sector with 585 million arrivals in 2022, i.e., nearly 80% of the pre-pandemic levels.
In Albania, the tourism industry started after the “transition period” in the 1990s. From the Stalinist period to the tourism “gold rush” (and related 100,000 jobs), tourism revenues increased from about 8 million in the 1980s to 1.7 billion US dollars, representing 6% of Albania’s national GDP in 2009 [19]. In 2022, Albania recorded US$ 2990 million in tourism income due to 6.7 million international arrivals that, in August of 2023, increased by 62.3%—exceeding the pre-pandemic levels [20]. Foreign tourists came from Kosovo (12.6%), Poland (9.2%), Italy (8.3%), Germany (7.0%), Spain (4.3%), and other countries [20].
Local and international tourists are especially interested in coastal areas and beaches, which constitute the preferred destination for billions of national and international visitors [21] mainly due to the attraction of Sea, Sun, and Sand (“3S”) tourism and coastal scenic beauty [13,22,23]. Coastal areas, especially beaches, started to acquire great relevance in the 20th century [24], when visitors began to consider them ideal places for rest and relaxation [14,25]. In Albania, the main tourism destination was the southern part of the country (39.4%), especially its coastal area (84.8%), i.e., the Albanian Riviera [21,26].
This paper deals with a preliminary and basic investigation concerning a beach litter surveying program carried out on 16 beaches located along Vlora Bay and the Albanian Riviera. This is an area that has never been investigated before, as the closer points sampled in other studies are in northern Albania [27,28], Greece [27], and Montenegro [27,29].
Most of those 16 beaches are very tourist areas; therefore the presence of beach litter constitutes a significant environmental and socio-economic problem. Beach litter pollution was investigated by recollecting data on its abundance, distribution, and composition. This is of extreme relevance since it gives local managers and administrators very useful information on beach litter origin, the first step for the determination and control of waste sources, and the implementation of preventative actions and sound cleaning programs. The gathered information allows the establishment of sound mitigation strategies within the sustainable tourism concept [30,31], which is based on the conservation of natural and cultural resources, the responsible development of future infrastructures/emplacements, the satisfaction of beach visitors, and the sharing of local society and actor activities with tourists [32,33,34].
2. Materials and Methods
2.1. Study Area and Sampling Sites
The Albanian coastline, including islands, is 523 km in length [35], and this study focused on the 175 km long coastal sector including Vlora Bay and the open Ionian Coast in the Central Mediterranean (namely the Albanian Riviera, Figure 1). The tidal range is <30 cm (microtidal) and the surface coastal current flows with a velocity of 10 to 40 cm s−1 northward, while a deep, opposing current flows southward through the middle of the Otranto Strait [36]. Wind velocities range from 4.2 and 10.5 m s−1 in August and December, respectively. At Vlora, in the northern part of the study area, predominant winds blow from the E and NW during winter and summer, respectively. At Saranda, in the southern part of the study area (Figure 1), winds blow from the NE during winter and from the SW during summer [37]; therefore, associated wave fronts principally approach from the SW in the Albanian Riviera and from the NW at Vlora Bay.
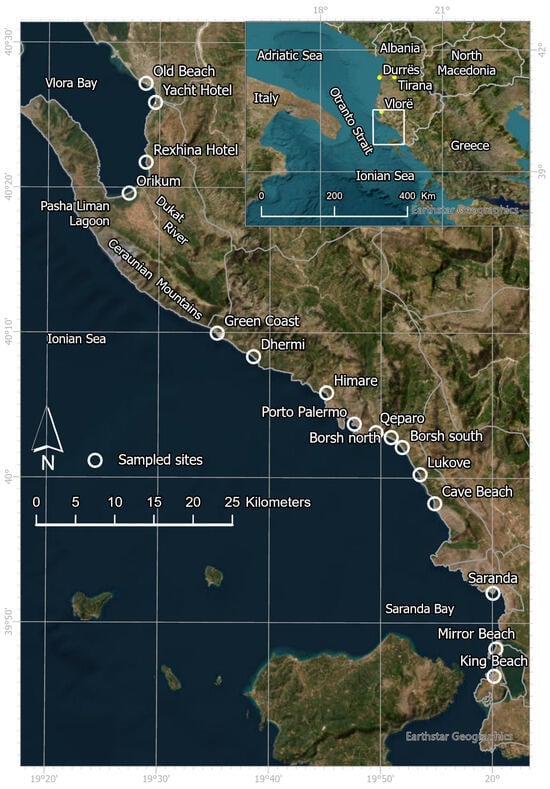
Figure 1.
Map showing the location of the sixteen sampled sites.
Vlora Bay is located in the limit between the Adriatic and the Ionian Sea, i.e., the Otranto Strait, and represents the westernmost point of the Ceraunian Mountains, whose proximity to the coast produces significant differences in temperature between the coastal area and the hinterland [38]. The Albanian Riviera represents a very important tourist destination because of its good weather conditions and its characteristic turquoise water color.
Despite most of the Adriatic coast being constituted by low coastal plains mainly consisting of long sandy beaches, lagoons, and wetlands, the Ionian Sea coastal area falls straight into the sea via high, plunging cliffs of great scenic value at places forming headlands enclosing isolated beaches composed of gravel and pebbles. Most of them are fully occupied by touristic facilities, e.g., beach clubs with sun loungers and umbrellas, etc., and record beach litter manual clean-up operations only during summer.
To ensure a suitable study scenario, 16 sites were arbitrarily chosen according to their accessibility in order to have a homogeneous cover of the study area: 4 sites were located in Vlora Bay (Vlorës County) and 12 were along the Albanian Riviera (Sarandës County). The two counties presented different land uses being “Forest and semi-natural areas” and “Agricultural areas” the most relevant (Table 1).

Table 1.
Land uses in Vlorës and Sarandës counties [39].
The minimum average distance between investigated sites was 3 km and larger distances existed from Cave Beach to the Sarande site (14 km) and from Orikum to the Green Coast site (20 km)—a few small beaches exist between the two mentioned localities but they are very isolated and only accessible by boat.
Orikum Beach is the main tourist attraction in Vlora Bay. The site sampled was 2 km west of the Dukat river mouth and 1.5 km east of the Pasha Liman coastal lagoon (Figure 1). In Vlora City and Old Beach, there were several sewage collectors and streams—some of them have been covered and flow underground, but litter items deposited on the ground surface are often able to enter them (Figure 2).
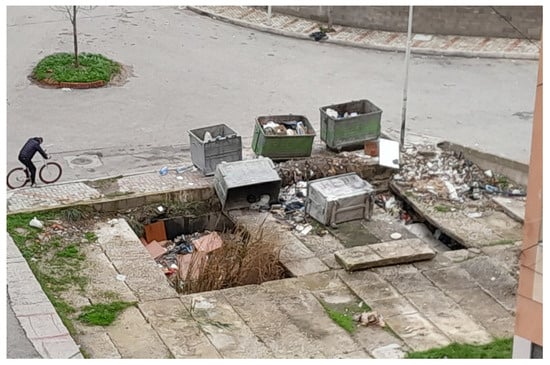
Figure 2.
Concrete slabs covering one stream in Vlora.
The Albanian Riviera boasts several tourist hotspots, mostly developed on small and picturesque beaches belonging to depopulated municipalities. Numerous real estate developments are ongoing, especially at the Green Coast (Palasa). In contrast, Borsh is the largest (4.5 km) and is one of the most pristine beaches sampled along the Albanian Riviera. The main southern municipality, Sarande, has two tourist agglomerations, i.e., the Sarande City coast, which is almost entirely urbanized, and the southern coast (namely Ksamil Coast, where King Beach and Mirror Beach are located, Figure 1) that, despite being the flagship of Albanian tourism, maintains some natural spaces between densely urbanized areas. Sewage spills were observed at several urban beaches, e.g., at Vlora, and many natural unpolluted streams outflow close to Orikum and along the Albanian Riviera. A detailed description of land uses at the different studied beaches according to the Copernicus Land Monitoring Services [39] is presented in Table 2.
Table 2.
Different land uses at investigated beaches. Terminology is used according to the Copernicus Land Monitoring Services [39].
2.2. Methodology
Beach characteristics, i.e., dimensions, grain size, and morphodynamic beach state (dissipative versus reflective) were visually determined during the fieldwork. The Bathing Area Registration and Evaluation (BARE) classification system [14], which considers criteria such as environmental conditions, accessibility, and community services, was used to discriminate among remote (areas with difficulty of access), rural (areas located outside the urban/village environment and not reached by public transport), village (associated with a permanent, small population outside the main urban environment and reached by public transport), resort beaches (areas with hotels and resorts), and urban sites.
Beach litter surface surveys were carried out according to the availability of surveyors in November and December 2022, i.e., ca. 2−3 months after the end of the summer period. Usually, in the Mediterranean Sea in autumn, beaches show large quantities of litter accumulated during the summer period, and such litter amount/typology has usually not been affected yet by the marine storms that especially hit the coast in January and February [9,31,40,41,42]. At each studied site, beach litter was surveyed along a 100 m-wide sector parallel to the coastline, usually 50 m extended at each side from an access point located in the central part of the beach.
In correspondence of small beaches (<100 m), i.e., Porto Palermo, Lukove, and Mirror Beach, the sector investigated covered the whole beach length. The surveyed area extended from the water line to the beach’s landward edge [41] which, in most cases, coincided with a promenade or other anthropogenic structure (e.g., beach clubs) separated from the beach by a wall. The observer virtually covered the entire beach sector area by moving along 5 m-separated shoreline parallel transects. According to UNEP/MAP methodology [42], all litter items > 2.5 cm in their longest linear dimension were gathered, including caps and lids and cigarette butts. Litter items were transported to the laboratory, counted, weighted, and classified into 113 categories according to their composition following the EU J-code litter characterization standards [43]. Heavy wood items were weighted in the field.
Litter amount was presented as the total number and weight of recollected items per unit of beach length and surface. Litter density was calculated considering an area of constant alongshore extension (i.e., 100 m or the one surveyed at smaller beaches) and different cross-shore dimensions, which ranged from place to place according to beach width.
To allow comparisons with previous surveys carried out in nearby areas [27], the Clean Coast Index (CCI) was calculated [44]:
where K is a constant (i.e., 20) and CCI values ranging from 0 to 2 indicate “Highly clean” beaches, values from 2 to 5 indicate “Clean” beaches, values from 5 to 10 indicate “Moderately clean” beaches, values from 10 to 20 indicate “Dirty” beaches, and values > 20 indicate “Extremely dirty” beaches.
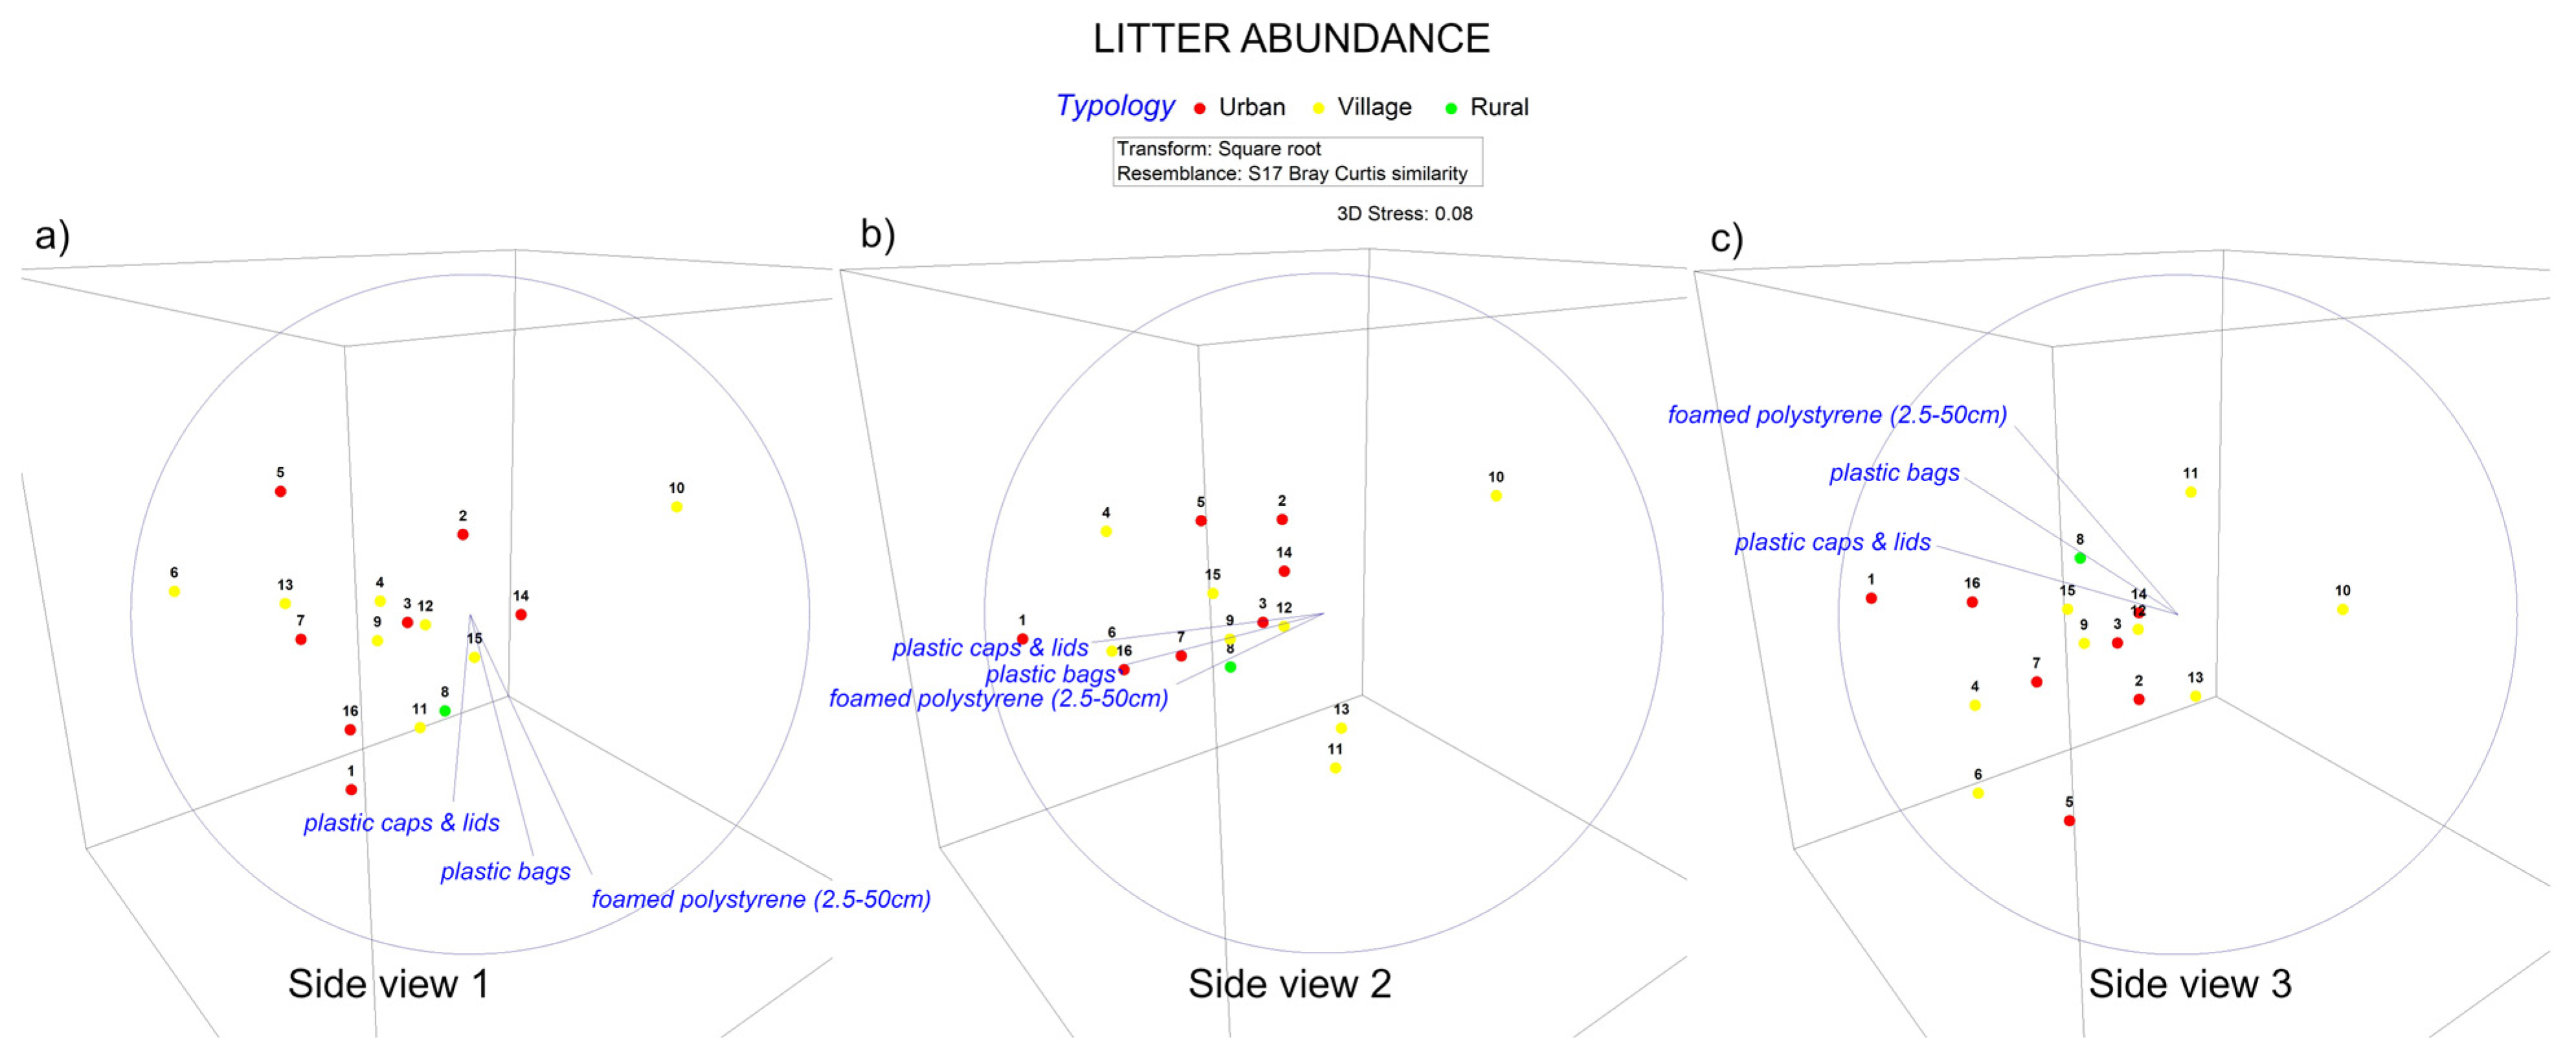
A nonparametric multidimensional scaling (nMDS) analysis was carried out considering litter abundance. The number of items per beach was transformed into items m−2 and a square root transformation was then performed. Analyses were made based on the Bray–Curtis dissimilarity index [45]. In the nMDS graphs, to identify litter groups that showed the highest weight in the distribution of the studied beaches, litter categories with a Pearson correlation > 0.8 were represented as vectors from a central point in a three-dimensional space. The orientation of the vectors, respective to the distribution of the beaches, is linked to the composition of the most important items recorded, which is sometimes related to beach typology. All statistical tests were conducted with a significance level of α = 0.05. The analyses were elaborated using the computer software PRIMER 6 Version 6.1.13 (Plymouth Routines In Multivariate Ecological Research), from PRIMER-E Ltd., Plymouth, UK.
3. Results
3.1. Beach Characteristics and Typologies
Beaches were from 92 to 4518 m in length with an average value of 873.5 m. They were usually made up of a combination of sand, gravel, pebbles, and boulders. Six of them presented a dissipative state and 10 presented a reflective one (Table 3). Regarding beach typology, which was evaluated according to the Bathing Area Registration and Evaluation (BARE) classification system [14], seven sampled beaches were “Urban”, eight of them presented few touristic constructions and were classified as “Village”, and Ali Pasha’s Castle, a historical site in Porto Palermo, was classified as “Rural” (Table 3). Beaches quite often presented in the backing area a car park or a promenade, which were usually at an elevated position and separated from adjacent beaches by a wall. Beach clubs were common at most of the beaches investigated (Table 3).
Table 3.
Beach name and length, sediment/morphodynamic state, beach type, and presence of infrastructures.
3.2. Litter Abundance and Characteristics
Beach litter was gathered in correspondence with 16 sampling points located at the 15 beaches investigated. The observer walked along a total of 75 transects covering 6570 linear meters, or 31,498 m2. Collected beach litter consisted of a total amount of 6621 items, or 168.12 kg, corresponding to an average of 1.0 items m−1 or 0.21 items m−2, or 0.02 kg m−1 or 0.005 kg m−2.
Regarding litter abundance, at Old Beach, 6.54 items m−1 or 1.31 items m−2 were found, and at Orikum, 2.07 items m−1 or 0.54 items m−2 were found. The lowest values were found at Borsh North (0.02 items m−1 or 0.001 items m−2) and Cave Beach (0.28 items m−1 or 0.06 items m−2) (Table 4). Regarding the weight of the collected items, Qeparo showed 0.553 kg m−1 or 0.111 kg m−2, Mirror Beach presented 0.113 kg m−1 or 0.023 kg m−2, and Himare showed 0.108 kg m−1 or 0.022 kg m−2. The lowest values were recorded at Borsh North, 0.001 kg m−1 or 0.0002 kg m−2, and at Cave Beach and Sarande, 0.002 kg m−1 or 0.0005 kg m−2 (Table 4).
Table 4.
Number, weight, and density of items and Clean Coast Index (CCI).
Sampled litter items belonged to 114 different categories (Table A1 and Table A2, Figure 3). Considering the total amount of collected items, the top 20 categories accounted for 90% of all items recorded and the top 10 categories accounted for 78% of the total litter amount. In order to have a visual example of a very polluted site considering litter weight, Qeparo Beach was presented in Figure 4.
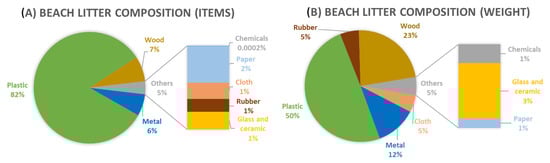
Figure 3.
Beach litter composition at all studied beaches: Number (A) and weight (B) of items.
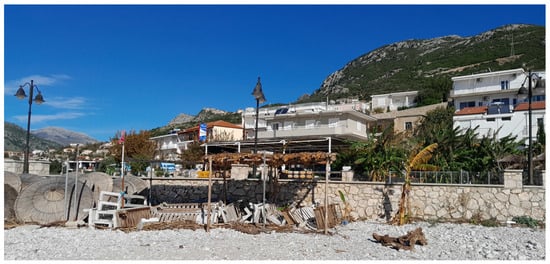
Figure 4.
Neglected Beach club furniture at the Qeparo site, a very polluted beach considering litter weight.
Concerning litter amount (i.e., numbers of items, Figure 3A and Table A1), it is possible to observe that ca. 82% of the total items collected belonged to the plastic material group, which was the most abundant at every sampled beach, with the highest concentrations recorded at Old Beach (0.95 items m−2) and the lowest at Borsh North Beach (0.002 items m−2). Five categories formed 72.98% of all plastic items: Tobacco products with filters (cigarette butts with filters), Plastic caps/lids, Plastic drink bottles, Fragments of foamed polystyrene, and Non-foamed plastic (both from 2.5 to 50 cm).
Within the Plastic group, cigarette butts were the most abundant (ca. 23% of the total amount of litter recorded), e.g., in Orikum, 750 cigarette butts were collected, presenting a density of 0.335 items m−2. Plastic caps/lids of drinks represented the second most relevant category (13%, Table A1), followed by the Non-foamed plastic fragments (11%) that were very common at every sampled point, with the smallest amounts recorded at Borsh North and the greatest at Mirror Beach. Foamed polystyrene fragments, water bottles, plastic bags, and foil wrappers were also quite common and were found almost everywhere. Other important litter types were Wood (7.3%) and Metal (6.3%), Figure 3A and Table A1. Processed wood, essentially (86.8%) composed of small items such as ice-cream sticks, chip forks, chopsticks, or toothpicks, represented up to 0.33 items m−2 at Old Beach, but was not relevant at other beaches. The Metal material group consisted of drink cans, bottle caps, lids and pull tabs. Together, they comprised 63.4% of the total metal items and 4.0% of the total items. Other items represented 36.6% of total metal items (Table A1). Despite most of them only presenting a few items, three relevant categories stood out: Other metal pieces > 50 cm, Other metal pieces 2.5–50 cm, and Metal industrial scrap, which represented 17.8% of metal items and 1.1% of total items. At Mirror Beach, metal items were constituted by abandoned materials from local beach clubs, mostly aluminum and plastic chairs, and were significantly abundant (0.058 items m−2), respective to the average (0.015 items m−2) for the study area (Table 4).
Other interesting results concern the distribution of different and less abundant litter categories:
- Chemicals, which were related to maintenance works of fishing boats, were only found at Porto Palermo.
- A small number of clothing items were found scattered throughout the entire study area. At Old Beach, those items were principally associated with fishermen and showed a density of up to 0.012 items m−2.
- Regarding glass fragments > 2.5 cm, it is remarkable that only 0.007 items m−2 were found at Qeparo, but it has to be highlighted that such items are almost indistinguishable on pebble beaches.
- Paper items were absolutely absent on five beaches. The highest values (0.022 items m−2) were recorded at Borsh South and linked to 23 coffee cups and an accumulation of 12 cigarette packets found close to the wall separating the beach by the backing promenade.
- Rubber items were absolutely absent in six beaches and almost absent in five. Only 0.004 and 0.005 items m−2 were found at Orikum and Old Beach, respectively.
Concerning litter weight (Figure 3B, Table A2), plastic was the most frequent material (50%). Distributed in 66 different categories, 49 of them represented <1% of the total plastic weight. The most abundant categories were: Other identifiable non-foamed plastic items (34.4% of plastic weight and 17.1% of total weight); Fragments of non-foamed plastic 2.5–50 cm (12.7% of plastic weight and 6% of total weight); and Plastic drink bottles ≤ 0.5 L (7.3% of plastic weight and 3.6% of total weight). Wood, which represented 23% of the total weight, essentially consisted of the rest of the objects related to beach visitors and/or beach clubs (e.g., at Queparo, Figure 4). Regarding the total weight of the different wood items (Figure 3B and Table A2), 13.2% corresponded to heavy items and the most relevant categories were Other processed wooden items > 50 cm (70.3% of wood weight and 16.1% of total weight) and Other processed wooden items 2.5–50 cm (15.6% of wood weight and 3.6% of total weight).
Metal represented 12% of all items (Figure 3B and Table A2) and essentially consisted of items linked to beach visitors. Metal drink and food cans, bottle caps, lids, and pull tabs from cans represented 9.9% of metal weight and 1.2% of total weight. The remaining was composed of a great variety of other metal categories, some of them including isolated heavy items. The highest values concerned Other metal pieces > 50 cm (73.5% of metal weight and 7.5% of total weight) and Metal industrial scrap (6.5% of metal weight and 0.8% of total weight).
3.3. Clean Coast Index (CCI)
The CCI [44] concerns the plastic litter abundance that represented about 82% of the total recollected litter (Figure 3A). The beaches investigated presented an average value of 4.9, corresponding to the “Clean” category. On the one hand, Old Beach (Urban) and Orikum (Village) were classified as “Very dirty” and “Dirty” and Porto Palermo and Mirror Beach were included in the “Moderately clean” category (Table 4). Therefore, 25% of the sampled beaches presented different levels of pollution, i.e., they ranged from “Very dirty” to “Moderately clean” (Table 4). On the other hand, seven beaches were classified as “Clean” and five as “Very clean”. In the latter category, one Urban beach (Yacht Hotel) and four Villages (Dhermi, Borsh North, Borsh South, and Cave Beach, Table 4) were observed.
3.4. Statistical Analysis
Results corresponding to the nonparametric multidimensional scaling (nMDS) analysis are presented in Figure 5.
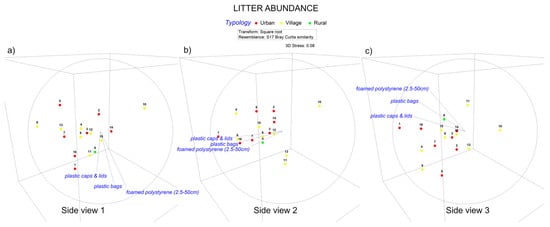
Figure 5.
Distance among beaches in the nMDS 3D analysis reflects the observed dissimilarities in litter content expressed as abundance. Different side views are presented (a–c).
Statistical analysis, presented in Figure 5, showed the distribution of the sites studied according to their litter abundance (expressed as the number of items), composition, and orientation of the vectors depicted in the figure reflected most commonly recorded items. This type of analysis is very useful when studying many sites to identify litter distribution patterns and to improve sound waste management actions. Concerning the beaches represented in Figure 5, the farther apart they were, the larger the differences in their litter amount/composition, and vice versa, e.g., close beaches were very similar in terms of litter abundance/composition and, therefore, similar cleaning operations can be employed at such sites. It can be observed that most polluted beaches, i.e., Orikum Beach (1202 items, no. 4 in Figure 5) and Old Beach (1688 items, no. 1), are very close, and their pollution was related to the presence of most abundant litter categories: Plastic caps/lids (J21 in EU J-code list), Plastic shopping/carrier/grocery bags (J3), and Fragments of foamed polystyrene between 2.5 and 50 cm (J82). Opposite is the case of Borsh North, which differs and, therefore, is far from the rest of the sites because of the low quantities of litter observed there (no. 10, Figure 5). Statistical analyses using litter items weight are usually not very reliable and useful to interpret differences among beaches since it is not always representative of the real state of beach pollution: as an example, a single item of litter (e.g., a piece of processed wood) may be heavier than thousands of other litter items (e.g., hundreds of cigarette butts). For this reason, statistical analyses using litter items weight were not carried out in this paper.
4. Discussion
4.1. Beach Characteristics/Infrastructures versus Litter Amount
The beaches investigated consisted of sandy sediments at places mixed with gravel, pebbles, and boulders (Table 3). Dissipative states were recorded in the northern and southern parts of the coast and reflective states in the central part. In this paper, neither the beach sediment composition nor beach morphodynamic state presented a clear relationship with litter abundance, highlighting the relevance of other factors such as river supplies, beach use, human activities in the hinterland, and the accomplishment, frequency, and modalities of clean-up operations, etc., as observed at different localities [9,30,46]. Regarding the distribution of the different beach typologies evaluated according to the BARE classification system [14], “Urban” beaches were essentially located in the northern and southern parts of the study area, and “Village” beaches were located in the central part (Figure 1, Table 1 and Table 2). Beach typology generally reflects the number of visitors, e.g., rural beaches receive few visitors and this number progressively increases from village to urban sites, which receive the largest amount of visitors, according to Williams and Micallef [14] and Quintela et al. [47]. In general, urban and village beaches are cleaned more frequently than rural or remote beaches, which are not cleaned because they present difficulty to access and/or because they do not generate economic benefits [30,48,49,50]. In this paper, the above-mentioned trend was not observed, and urban beaches presented, on average, a higher level of pollution (1.57 items m−1) with respect to village beaches (0.84 items m−1). The only observed rural beach presented a level of pollution close to urban beaches. Considering beach litter amount and the presence of beach clubs (Table 3 and Table 4), the two beaches that did not present such facilities recorded high values of pollution, especially Old Beach, which was the most polluted site in the study area. Differences in litter amount and content among the investigated beaches can be partially attributed to the presence of promenades, car parks, and walls that, at many sites, limit the dry beach landward. Such limits are prone to litter accumulation because wind and wave processes move stranded litter landward (Figure 4), as observed at many sites along the continental coast of Spain [9,49] and the Canary Islands [51], and at other sites in Montenegro [29], Brazil [52], and the Baltic Sea [53]. The small amount of litter observed at Borsh North, which was clearly reflected by the statistical analysis (Figure 5), may be due to the proper maintenance of the beach by the local beach club and the absence of a wall between the beach and the car park, which are at the same level.
4.2. Beach Litter Amounts and Categories
The comparison of litter content and abundance observed in this paper along the study area with the national and regional scale trends is difficult because of data scarcity, as well as the diverging methodologies and spatial and temporal distribution of surveys used in the existing studies. Factors such as the frequency and modality of clean-up operations and the quantity of beach visitors vary during the year. Clean-up operations are usually carried out during the summer period [54] and, in the Mediterranean countries, good weather conditions determine seasonal peaks of beach users, observed during July–August, and associated pollution, and this was also the case for the Ionian beaches of Albania studied in this paper. As an example, Vlachogianni et al. [55] listed 16 studies developed since 2010 in 11 Mediterranean countries, finding remarkable differences in litter classifications used and methodological discrepancies, which make it hard to achieve standardized data. In this paper, along the Vlora Bay and the Albanian Riviera, an average density of 0.21 items m−2 was observed in November and December 2022 (Table 5).
Table 5.
Average litter density, plastics percentages, and top litter categories observed at the Albanian Riviera (this paper), the Adriatic and Ionian coasts (Vlachogianni et al. [27]), the Albanian Adriatic coast (Gjyli et al. [28]), and the Mediterranean Sea (Vlachogianni et al. [55]).
This value is close to the average value (0.22 items m−2) observed in the Albanian Adriatic coast by Vlachogianni et al. [27], who seasonally monitored, between October 2014 and April 2016, 31 sites in 7 coastal countries belonging to the Adriatic-Ionian macroregion. The closest beaches to the area investigated in this paper were 3 beaches on the Albanian Adriatic coast and 10 beaches on the Greek Ionian coast (Table 5). Further, values observed in this paper are greater than the average 0.14 items m−2 value found by Gjyli et al. [28], who surveyed five Adriatic beaches near Durrës in April 2018, and smaller than the average value observed by Vlachogianni et al. [27] along the Adriatic-Ionian coast (0.67 items m−2) and Vlachogianni et al. [55] in 23 northern Mediterranean sites surveyed in five different countries in autumn and winter 2018 (0.61 items m−2).
Comparing the litter abundance data (0.21 items m−2) recorded in this paper with studies carried out along the whole Mediterranean Sea, the value recorded along the Albanian Riviera is higher than the average seasonal value (0.116 items m−2) found in Alicante (SE Spain) by Asensio-Montesinos et al. [50] and the average value of 0.054 items m−2 reported by Nachite et al. [30] in Morocco. In Ceuta, similar values were recorded in February (0.216 items m−2) and March (0.235 items m−2), however an increase in April, due to the start of the tourism season, (0.356 items m−2) was observed [56].
Regarding the most important categories of litter, they were not numerous in the study area (Table 5): the top 20 categories accounted for 90% of the collected items, which represented the highest value in Table 5, and the amount of Plastic items (82.57%) was close to the one observed at other areas. Most of them consisted of short-lived single-use plastic items such as Drink bottles, Plastic cups/lids from drinks, Crisp packets and Sweet wrappers, Food wrappers and Fast food containers, Straws and stirrers, and Shopping bags. In this paper, the top 3 categories included Cigarette butts, Plastic caps/lids from drinks, and medium-sized Fragments of non-foamed plastic (Table 5). As an example, the accumulation of cigarette butts is particularly evident during the summer months and remains at Orikum Beach for extended periods. A remarkable amount of Plastic drink bottles, Straws, and other Plastics was also observed. In the Adriatic-Ionian macroregion, Vlachogianni et al. [27] observed that the top 20 categories accounted for 79.75% of the total items collected, and the top 3 categories included medium-sized Plastic pieces, medium-sized Polystyrene pieces, and Cotton bud sticks (Table 5). In the Mediterranean context (Table 5), Vlachogianni et al. [55] analyzed data collected by seven NGOs at 23 coastal sites in France, Italy, Croatia, Greece, and Cyprus during the low tourist season. The top 20 items only accounted for 81.4% of all items recorded, while the top 10 items accounted for ca. 70%. Artificial polymer materials constituted 90% of litter items and the top 3 items included Plastic pieces 2.5–50 cm (26%), followed by Cigarette butts and filters (12%) and Plastic caps/lids from drinks (8.1%). In the Albanian Adriatic coast, Gjyli et al. [28] did not present the top 20 categories, and the top 3 categories consisted of Artificial polymer materials, Glass and ceramic fragments, and Cigarette butts.
4.3. Clean Coast Index Distribution
Concerning the Clean Coast Index [44], in this paper, just two beaches were classified as “Dirty” (Orikum) and “Very dirty” (Old Beach), both located in Vlora Bay (Table 4). In the Adriatic-Ionian macroregion, Vlachogianni et al. [27] found only one “Very dirty” beach, a Village site, and few “Dirty” and “Moderately clean” beaches, classified as Rural and Village. Three Albanian Adriatic beaches were monitored in that study. Plepa, which is a “Moderately clean” Urban beach in Durrës (the second-largest city of Albania), is located in a flat alluvial plain with heavy tourism affluence from the surrounding areas and nearby countries. Other surveyed beaches were Velipoje and Shengjin, both “Clean” Village sites close to the Montenegro border. Old Beach, investigated in this paper, is a sandy and dissipative beach, similar to Plepa but located in a very different setting. It is placed in a large bay surrounded by mountains and is close to Vlora, which is the largest city in Albania after Durrës. Orikum is a tourist village situated 13 km away from Vlora, in a flat alluvial plain at the foot of the Ceraunian Mountains. The discrepancy between the Plepa and Vlora Bay beaches can be attributed to the lack of adequate clean-up activities at beaches belonging to Vlora Bay. Overall, the two dirty beaches observed along the study area (Table 4) constituted exceptions in a remarkably clean coast with an average CCI value (4.87) corresponding to the “Clean” class with most of the sites belonging to the “Very clean”, “Clean”, and “Moderately clean” classes (Table 4). Such CCI values were broadly close to data presented by Vlachogianni et al. [27]: the average value for the Adriatic-Ionian beaches corresponded to “Highly clean” beaches, and “Dirty” beaches were observed in Zaglav (Croatia) and at Ipsos (Greece). “Very clean” scores were recorded at four Greek beaches and in Bosnia and Herzegovina, where large-scale hotels are actually cleaning the coast, representing an exceptional resource in a country showing a coastline with a length of only 29.61 km.
4.4. Sources of Beach Litter
Regarding the origins/sources of beach litter along the study area, although most of them are still undetermined, land-based sources are likely to be the most relevant. Along the studied coast, beach visitors have a certain relevance, especially during the summer period, as observed at many places [30,49,57], and this is reflected by the most commonly observed litter categories including Cigarette butts, Plastic caps/lids, and abandoned old sun loungers and umbrellas. The presence and abundance of such items are particularly relevant and linked to the summer period because the local population on the Ionian coast is not numerous and the beaches investigated do not record many visitors during winter or short-time holiday periods because they are far away from Tirana Airport and Durrës Port and the lack of connecting highways discourages a massive affluence of tourists for short periods. Usually, during summer, beach club staff carry out daily beach cleaning operations. However, at the end of the season, different situations are observed. Few beach clubs properly remove their infrastructure, and others totally neglect to do that. As a result, in some places, old sun loungers and umbrellas become heavy litter items in the Metal, Wood, and Textile categories. Beach clubs sometimes do not remove cigarette butts that, along with other small items, can remain on the beach for many months, e.g., at Orikum. Furthermore, generally, the abundance of small items increases during summer because of the great affluence of tourists and the low efficiency of clean-up operations to collect small items [58,59]. The great abundance of small items observed at the studied beaches is very probably linked to generally fair weather conditions recorded from the end of the summer period to the surveying period—the occurrence of relevant storms would have removed them [40]. In gravel and pebble beaches, litter items tend to be buried more deeply than on sandy beaches and are exhumed only during energetic conditions, e.g., sea storms [54,56]. At such beaches, concern must be taken regarding the soundness of litter counts because surface litter may be related to the reappearance of buried litter rather than the beaching of fresh items [40,60].
Concerning the relevance of water course contribution, most of the rivers and streams outflowing in the Albanian Riviera are remarkably clean, since they run across rural environments and natural areas. A different situation is observed at Vlora Bay. There, six cotton bud sticks were collected, e.g., at Old Beach, because streams are affected both by sewage and poor waste management (Figure 2). Such items clearly have an urban origin and are transported onto the beach through sewage and rivers and are usually attributed to the inefficiency of sewage treatment plants [61].
Concerning litter arriving from the sea, a coastal surface current flows northward along the shoreline, and an opposite deep current flows southward through the middle of the Otranto Strait. Winds blow from eastern directions during winter and therefore have no influence on the coast investigated and approach from the NW at Vlora Bay and the SW in the Albanian Riviera during summer. Associated waves approach during the summer from the NW at Vlora Bay and the SW at the Albanian Riviera. Therefore, considering the behavior of positive buoyancy items, i.e., items that protrude well from the water surface, and neutral buoyancy items, i.e., items that stay at water level, it is possible to suppose that they are transported landward by both wind and waves action, with the former being more efficient with respect to the Stokes drift, as stated by many authors, e.g., Ryan [62], Duhec et al. [63], Ruiz et al. [64], Maclean et al. [65], Fazey and Ryan [66], and Anfuso et al. [67]. The ubiquitous medium-sized plastic fragments come from the sea and, since they have neutral buoyancy, they are more likely to be transported by superficial currents linked to wind, along with plenty of floating plastic items clearly related to fishing activities, including fishing nets, three plastic mussels/oyster mesh bags, and one piece of plastic net. At Old Beach, several items were also related to fishing activities and were abandoned on the beach by local fishermen: clothes, plastic, tangled nets, and ropes mixed with dolly ropes. Chemicals materials found in Porto Palermo were likely to have the same source. Fishing lines, ropes, and ribbons were also very common on the Spanish Atlantic beaches [24] and represent 15.8% of the total number of debris collected along the Brazilian marine shorelines [68].
Trends on beach litter origin observed along the study area confirm the one recorded in the Adriatic-Ionian macroregion [27], where tourism and recreational activities were responsible for 33.4% of total litter items collected (especially single-use plastic items), whilst sea-based sources (related to fisheries, aquaculture, and shipping) ranged from 1.54% to 14.84% among countries, with an average of 6.30% value at the regional level. According to data collected in Albanian Adriatic beaches near Durrës, Gjyli et al. [28] stated that litter was linked to recreational activities and insufficient waste facilities to support beach tourism and, in general, tourism along coastal villages. Special mention was devoted to the local origin of cigarette butts, which were especially abundant in urban beaches, and litter contributions from rivers and sewage waters, a trend commonly observed by different authors around the world [69,70,71].
4.5. Beach Litter Impacts and Management Issues
Beach litter was clearly linked to beach tourist use, as reflected by observed litter types and their general good conservation state, e.g., the absence of abrasion and/or other evidence of transport/deterioration. The most relevant categories, considering both litter abundance and weight, were Plastics, Wood, and Metal.
Five categories formed 72.98% of all Plastic items, i.e., Tobacco products with filters (Cigarette butts with filters), Plastic caps/lids, Plastic drink bottles, and Fragments of foamed polystyrene and non-foamed plastic (both from 2.5 to 50 cm). Plastic is considered one of the most versatile materials and can be released into the environment from a variety of sources. Its abundance in the environment is linked to its great durability and persistence, rising production rates, and low amounts of recovery [72]. In 2022, the world plastics production reached 400.3 million tons and, in Europe, it reached 58.7 Mt [73], essentially (80%) consisting of six main polymers, i.e., polypropylene (PP), high- and low-density polyethylene (HDPE and LDPE), polyvinyl chloride (PVC), polyurethane (PUR), polyethylene terephthalate (PET), and polystyrene (PS) [74]. Plastic items are fragmented because of UV light and physical degradation due to the impacts of waves and currents in small pieces forming microplastics that are easily dispersed by winds, currents, and waves in marine/coastal environments, and they easily enter the food chain. Therefore, plastic items observed along the study area, if not recollected, can produce negative effects on local coastal biota and ecosystems because of their ingestion by marine and coastal fauna [75] and the spreading of chemical compounds as heavy metals [76], additives [77], PAHs (Polycyclic Aromatic Hydrocarbons), PCBs (Polychlorinated Biphenyls), and POPs (Persistent Organic Pollutants), which have important eco−toxicological impacts since they produce behavioral changes, changes in metabolic processes, and endocrine disruption in marine organisms [78], even in very remote environments [79]. Among plastics, cigarette butts were the most common items. They are composed of more than 5000 compounds, at least 150 of them being highly toxic [80]. Further, when burned, many new compounds are generated [81,82]. The toxicity of cigarette butts has been demonstrated in a great diversity of marine organisms, from foraminifera [83] to invertebrates and fishes [80,83,84].
Processed wood represented the beach litter category second in abundance and weight. The toxicity of this category of litter greatly depends on the manufacturing process recorded by each item, since this category includes different types of treated wood, i.e., sawn, planed, painted, impregnated, and coated wood. Therefore, the toxicity of each item depends on the used paints, additives, etc. [42].
Metal represented 6% and 12% of all items by abundance and weight, respectively, and was clearly related to beach visitors. Metal items have a toxicological relevance linked to their composition (in this case, usually aluminum and iron) and compounds used during their manufacturing process such as used paints and additives. Furthermore, along with wood with nails, screws, etc., metal objects are considered dangerous items because they can produce injuries and cuts to beach visitors [9].
Concerning the management of beach litter, there is an imperative necessity to establish sound municipal beach litter management actions. Such activities have to be based on the determination and control of waste sources and cleaning programs. In the study area, the main sources are rivers and, essentially, beach users. Therefore, efforts have to be devoted to the improvement of the treatment of wastewater to avoid the presence of sewage evidence on the beach, e.g., cotton butts, preservatives, etc., which have a very negative effect on beach users’ perception [9]. High concentrations of debris observed at the studied beaches were especially associated with beach users activities and, therefore, it is urgent to carry out different actions, e.g., to improve and consolidate beachgoers’ public awareness by the installation and maintenance of information panels and handy recycling bins, by distributing beach ashtrays (to reduce cigarette butts) and, if necessary, by establishing penalty fees for polluters. In order to reduce the presence of cigarette butts, specific laws can be established to prohibit smoking, e.g., at most crowded beaches, or allowing it only at specific places, a restriction that has given good results in many different places [2]. Further, clean-up programs have to be implemented by local municipalities at free beaches, i.e., at beaches without beach clubs, throughout the year, with an increased frequency during summer months. Special attention has to be devoted to small-sized litter, particularly to cigarette butts that have to be removed manually because mechanical cleaning is often not adequate [58,59]. Last, municipalities have to make beach clubs responsible for beach manual and mechanical clean-up activities that have to be carried out daily during the whole summer period until the very end of the tourist season. Beach clubs also have to remove all kinds of furniture and accumulated litter at the end of the tourist season to avoid their dispersion into the marine/coastal environment, linked to the impacts of winter storms [40].
5. Conclusions
Beach littering along the studied coast was mainly due to cigarette butts, plastic caps/lids, plastic fragments, and, at places, abandoned beach furniture such as old sun loungers and umbrellas, all of them essentially linked to land-based touristic activities. Litter items, e.g., cotton buds, related to poor wastewater management, were recorded at Vlora Bay. Based on the CCI obtained values, sampled beaches were essentially classified as “Clean” and “Very clean”. Only two beaches showed an elevated level of pollution: a village location in Orikum, with plenty of cigarette butts, and Old Beach, an urban site close to Vlora, where fishing and sewage-related items and the prolonged absence of clean-up operations contributed to the very negative score recorded. Further, in pebble beaches, which are very common along the study area, is not possible to use mechanical cleaning methods, and manual clean-up operations are carried out by beach club employees at many of the investigated sites. Unfortunately, poor results are obtained concerning the recollection of specific items such as cigarette butts and, in general, of small plastic pieces, which tend to be accumulated on the beach during the summer period. Plastic caps were also very abundant but, hopefully, their amount will probably decrease in the next years since the EU Directive 2019/904 [85] states that it is necessary for most closures to remain attached to bottles to ensure their recycling with the rest of the container.
Concerning litter diversity, the top 20 categories constituted around 80% of all items in the Adriatic and Ionian seas and 90% along Vlora Bay and the Albanian Riviera, which were more polluted with respect to nearby areas in the Albanian Adriatic and Greek coasts. This data confirms the poor diversity of litter sources recorded and highlights the necessity for increasing the relevance and efficiency of clean-up operations that are carried out only by beach clubs. Further, clean-up operations are not homogeneously carried out by beach clubs: at some places, e.g., at Borsh North, clean beaches are observed, while at others, a clear mismanagement is observed concerning cigarette butts (e.g., at Orikum) or the presence of abandoned beach furniture (e.g., at Mirror Beach). Indeed, programs to integrate sound beach litter management actions based on the determination and control of waste sources and cleaning programs have to also involve municipal authorities and managers, and have to be implemented throughout the year and not only during the summer period. Educational initiatives are also needed to enhance beach visitors’ responsibility, especially concerning cigarette butts, e.g., by distributing beach ashtrays at beach clubs and free beaches. The results recorded in this study are partially limited and conditioned by the timing of the survey program and further investigations should be carried out during the whole year, i.e., at least at a seasonal scale, to fully understand beach litter amounts and typology temporal variability.
Author Contributions
A.F.-E.: Writing—original draft, Methodology, Investigation, Formal analysis, Data curation, Conceptualization. G.A.: Writing—review and editing, Supervision, Methodology, Investigation, Conceptualization. F.A.-M.: Writing—review and editing, Methodology, Investigation, Statistical analysis. A.B.: Supervision, Resources, Investigation. M.I.: Methodology, Investigation, Formal analysis. G.C.: Resources, Methodology, Investigation. All authors have read and agreed to the published version of the manuscript.
Funding
This research received funding from the University of Cadiz’s research support plan (“Plan propio de estímulo y apoyo a la Investigación y Transferencia”).
Data Availability Statement
Data will be made available on request.
Acknowledgments
This research is a contribution to the Andalusia PAI Research Groups RNM-373 (Geosciences) and HUM-117 (Coastal Planning and Management) and the PROPLAYAS Network.
Conflicts of Interest
The authors declare no conflicts of interest.
Appendix A
Table A1.
Percentages of the different categories of litter obtained, considering the number of items gathered at the 16 sites investigated. A detailed description is presented for those categories representing > 1% of the total amount.
Table A1.
Percentages of the different categories of litter obtained, considering the number of items gathered at the 16 sites investigated. A detailed description is presented for those categories representing > 1% of the total amount.
| Material | Total Nos. of Items/Percentage | Description | Items per Each Sub-Category | Percentages Respect to Each Category and the Total Number of Items |
|---|---|---|---|---|
| Chemicals | 1/0.02 | - | - | - |
| Cloth/Textile | 48/0.72 | - | - | - |
| Glass and ceramic | 53/0.80 | - | - | - |
| Metal | 421/6.36 | Metal drinks cans | 162 | 38.48/2.45 |
| Metal bottle caps, lids, and pull tabs from cans | 105 | 24.94/1.59 | ||
| Other metal categories (each one < 1%) | 154 | 36.58/2.33 | ||
| Plastic | 5467/82.57 | Plastic drink bottles (>0.5 L) | 150 | 2.74/2.27 |
| Plastic drink bottles (≤0.5 L) | 306 | 5.60/4.62 | ||
| Plastic caps/lids drinks | 844 | 15.44/12.75 | ||
| Plastic straws | 349 | 6.38/5.27 | ||
| Plastic crisps packets/sweets wrappers | 232 | 4.24/3.50 | ||
| Plastic shopping/carrier/grocery bags | 151 | 2.76/2.28 | ||
| Small plastic bags | 141 | 2.58/2.13 | ||
| Fragments of foamed polystyrene 2.5–50 cm | 432 | 7.90/6.52 | ||
| Fragments of non-foamed plastic 2.5–50 cm | 736 | 13.46/11.12 | ||
| Other identifiable non-foamed plastic items | 139 | 2.54/2.10 | ||
| Tobacco products with filters (Cigarette butts with filters) | 1522 | 27.84/22.99 | ||
| Other plastic categories (each one < 1%) | 465 | 8.51/7.02 | ||
| Paper | 108/1.63 | - | - | - |
| Rubber | 38/0.57 | - | - | - |
| Wood | 485/7.33 | Wooden ice-cream sticks, chip forks, chopsticks, toothpicks | 421 | 86.80/6.36 |
| Other wood categories (each one < 1%) | 64 | 13.20/0.97 |
Table A2.
Percentages of the different categories of litter obtained, considering the weight of items gathered at the 16 sites investigated. A detailed description is presented for those categories representing >1% of the total weight.
Table A2.
Percentages of the different categories of litter obtained, considering the weight of items gathered at the 16 sites investigated. A detailed description is presented for those categories representing >1% of the total weight.
| Material | Total Weight of Items (kg)/Percentage | Description | Weight (kg) | Percentages, with Respect to Each Category, and the Total Weight of Items |
|---|---|---|---|---|
| Chemicals (all categories) | 2/1.19 | Engine oil | - | - |
| Cloth/Textile | 8.37/4.98 | Clothing | 5.27 | 63.04/3.14 |
| Shoes and sandals made of leather and/or textile | 1.39 | 16.71/0.83 | ||
| Other textile items (<1 kg) | 1.69 | 4.78/1.00 | ||
| Glass and ceramic | 5.81/3.46 | Glass bottles | 4.96 | 85.37/2.95 |
| Other glass items (<1 kg) | 0.85 | 14.63/0.51 | ||
| Metal | 19.87/11.82 | Metal drinks cans | 1.77 | 8.91/1.05 |
| Metal food cans | 2.20 | 11.07/1.31 | ||
| Other metal pieces > 50 cm | 12.61 | 63.46/7.51 | ||
| Metal industrial scrap | 1.28 | 6.44/0.76 | ||
| Other metal items (<1 kg) | 1.98 | 9.96/1.17 | ||
| Plastic | 83.46/49.65 | Plastic flip-flops | 1.95 | 2.34/1.16 |
| Plastic drink bottles > 0.5 L | 4.59 | 5.50/2.73 | ||
| Plastic drink bottles ≤ 0.5 L | 6.06 | 7.26/3.61 | ||
| Plastic caps/lids drinks | 1.43 | 1.71/0.85 | ||
| Plastic bottles and containers of cleaning products | 1.31 | 1.57/0.78 | ||
| Other plastic bottles and containers (drums) | 1.07 | 1.28/0.64 | ||
| Plastic shopping/carrier/grocery bags | 2.08 | 2.49/1.24 | ||
| Plastic crates, boxes, baskets | 2.51 | 3.00/1.50 | ||
| Plastic buckets | 1.40 | 1.68/0.83 | ||
| Other foamed plastic items not made of foamed polystyrene | 5.20 | 6.23/3.10 | ||
| Fragments of foamed polystyrene 2.5–50 cm | 1.65 | 1.98/0.98 | ||
| Fragments of non-foamed plastic 2.5–50 cm | 10.14 | 12.15/6.03 | ||
| Other identifiable non-foamed plastic items | 28.74 | 34.44/17.10 | ||
| Plastic rope (diameter > 1 cm) | 2.10 | 2.52/1.25 | ||
| Other plastic items (<1 kg) | 13.17 | 15.78/8.25 | ||
| Paper (all categories) | 0.98/0.58 | - | - | - |
| Rubber | 91.85/5.46 | Rubber boots | 1.23 | 1.34/0.73 |
| Rubber tyres | 6.50 | 7.08/3.87 | ||
| Other rubber items (<1 kg) | 1.45 | 1.58/0.86 | ||
| Wood | 38.43/22.86 | Other processed wooden items > 50 cm | 27.00 | 70.26/16.06 |
| Other processed wooden items 2.5–50 cm | 6.00 | 15.61/3.57 | ||
| Wooden pallets | 5.00 | 13.01/2.97 | ||
| Other wood items (<1 kg) | 0.43 | 1.11/0.25 |
References
- Agarwala, N.; Saengsupavanich, C. Oceanic Environmental Impact in Seaports. Oceans 2023, 4, 360–380. [Google Scholar] [CrossRef]
- Portman, M.E.; Brennan, R.E. Marine litter from beach-based sources: Case study of an Eastern Mediterranean coastal town. Waste Manag. 2017, 69, 534–544. [Google Scholar] [CrossRef] [PubMed]
- Prevenios, M.; Zeri, C.; Tsangaris, C.; Liubartseva, S.; Fakiris, E.; Papatheodorou, G. Beach litter dynamics on Mediterranean coasts: Distinguishing sources and pathways. Mar. Pollut. Bull. 2018, 19, 448–457. [Google Scholar] [CrossRef] [PubMed]
- Galgani, F.; Hanke, G.; Werner, S.; Oosterbaan, L.; Nilsson, P.; Fleet, D.; Kinsey, S.; Thompson, R.C.; van Franeker, J.; Vlachogianni, T.; et al. Guidance on Monitoring of Marine Litter in European Seas; Scientific and Technical Research Series; Publications Office of the European Union: Luxembourg, 2013; p. 128. [Google Scholar]
- Bolívar-Anillo, H.J.; Asensio-Montesinos, F.; Reyes Almeida, G.; Solano Llanos, N.; Sánchez Moreno, H.; Orozco-Sánchez, C.J.; Villate Daza, D.A.; Iglesias-Navas, M.A.; Anfuso, G. Litter Content of Colombian Beaches and Mangrove Forests: Results from the Caribbean and Pacific Coasts. J. Mar. Sci. Eng. 2023, 11, 250. [Google Scholar] [CrossRef]
- Sanitwong-Na-Ayutthaya, S.; Saengsupavanich, C.; Ariffin, E.H.; Ratnayake, A.S.; Yun, L.S. Environmental impacts of shore revetment. Heliyon 2023, 9, e19646. [Google Scholar] [CrossRef]
- Gabrielides, G.P.; Golik, A.; Loizides, L.; Marino, M.G.; Bingel, F.; Torregrossa, M.V. Man-made garbage pollution on the Mediterranean coastline. Mar. Pollut. Bull. 1991, 23, 437–441. [Google Scholar] [CrossRef]
- Tudor, D.T.; Williams, A. Public perception and opinion of visible beach aesthetic pollution: The utilisation of photography. J. Coast. Res. 2003, 19, 1104–1115. [Google Scholar]
- Asensio-Montesinos, F.; Anfuso, G.; Oliva Ramírez, M.; Smolka, R.; García Sanabria, J.; Fernández Enríquez, A.; Arenas, P.; Macías Bedoya, A. Beach litter composition and distribution on the Atlantic coast of Cádiz (SW Spain). Reg. Stud. Mar. Sci. 2020, 34, 101050. [Google Scholar] [CrossRef]
- Krelling, A.P.; Williams, A.T.; Turra, A. Differences in perception and reaction of tourist groups to beach marine debris that can influence a loss of tourism revenue in coastal areas. Mar. Policy 2017, 85, 87–99. [Google Scholar] [CrossRef]
- Votier, S.C.; Archibald, K.; Morgan, G.; Morgan, L. The use of plastic debris as nesting material by a colonial seabird and associated entanglement mortality. Mar. Pollut. Bull. 2011, 62, 168–172. [Google Scholar] [CrossRef] [PubMed]
- Campbell, M.L.; Peters, L.; McMains, C.; Rodrigues de Campos, M.C.; Sargisson, R.J.; Blackwell, B.; Hewitt, C.L. Are our beaches safe? Quantifying the human health impact of anthropogenic beach litter on people in New Zealand. Sci. Total Environ. 2019, 651, 2400–2409. [Google Scholar] [CrossRef] [PubMed]
- Williams, A. Definitions and Typologies of Coastal Tourism Beach Destinations. In Disappearing Destinations: Climate Change and Future Challenges for Coastal Tourism; Andrew, J., Phillips, M., Eds.; University of Wales: Cardiff, UK, 2011; p. 268. [Google Scholar]
- Williams, A.T.; Micallef, A. Beach Management, Principles & Practice; Earthscan: London, UK, 2009. [Google Scholar]
- UNWTO (United Nations World Tourism Organization). World Tourism Barometer and Statistical Annex. 2019. Available online: https://www.e-unwto.org/loi/wtobarometereng (accessed on 8 August 2024).
- Klein, Y.L.; Osleeb, J.P.; Viola, M.R. Tourism generated earnings in the coastal zone: A regional analysis. J. Coast. Res. 2004, 20, 1080–1088. [Google Scholar]
- UNWTO (United Nations World Tourism Organization). Tourism Highlights. 2020. Available online: https://www.e-unwto.org/doi/book/10.18111/9789284422456 (accessed on 8 August 2024).
- UNWTO. World Tourism Barometer and Statistical Annex. 2023. Available online: https://www.e-unwto.org/loi/wtobarometereng (accessed on 8 August 2024).
- Göler, D.; Doka, D. Tourism and Transition in the Western Balkans; Südosteuropa-Mitteilungen; Albania as a Laboratory for Tourism Development: München, Germany, 2018. [Google Scholar]
- INSTAT (Albanian Institute of Statistics). Available online: https://www.instat.gov.al/en/ (accessed on 8 August 2024).
- Houston, J.R. The economic value of beaches—A 2018 update. Shore Beach 2013, 81, 3–13. [Google Scholar]
- Dodds, R.; Kelman, I. How climate change is considered in sustainable tourism policies: A case of the Mediterranean Islands of Malta and Mallorca. Tour. Rev. Int. 2008, 12, 57–70. [Google Scholar] [CrossRef]
- Mestanza-Ramón, C.; Anfuso, G.; Chica-Ruiz, J.A.; Mooser, A.; Botero, C.M.; Pranzini, E. Coastal Scenic Evaluation of Continental Ecuador and Galapagos Islands: Human Impacts and Management Issues. J. Mar. Sci. Eng. 2020, 8, 468. [Google Scholar] [CrossRef]
- Corbin, A. El Territorio del Vacío. In Occidente y la Invención de la Playa; Editorial Mondadori: Barcelona, Spain, 1993; pp. 1750–1840. [Google Scholar]
- Rubio, D. Gestión Integral de Playas; Editorial Síntesis y Agencia Valenciana de Turismo: Madrid, Spain, 2005. [Google Scholar]
- Kotsis, N.; Miltiadis, B. Macroeconomic variables (Gross Domestic Product Per Capita, Imports, Private Consumption and General Government Consumption) and Tourism: The cases of Albania and Croatia. IOSR J. Humanit. Soc. Sci. (IOSR-JHSS) 2023, 28, 17–22. [Google Scholar]
- Vlachogianni, T.; Fortibuoni, T.; Ronchi, F.; Zeri, C.; Mazziotti, C.; Tutman, P.; Bojanić Varezić, D.; Palatinus, A.; Trdan, S.; Peterlin, M.; et al. Marine litter on the beaches of the Adriatic and Ionian Seas: An assessment of their abundance, composition and sources. Mar. Pollut. Bull. 2018, 131 Pt A, 745–756. [Google Scholar] [CrossRef] [PubMed]
- Gjyli, L.; Vlachogianni, T.; Kolitari, J.; Matta, G.; Metalla, O.; Gjyli, S. Marine litter on the Albanian coastline: Baseline information for improved management. Ocean Coast. Manag. 2020, 187, 105108. [Google Scholar] [CrossRef]
- Peraš, I.; Divanović, M.; Pešić, A.; Joksimović, A.; Marković, O.; Đurović, M.; Mandić, M. Composition and abundance of beach litter in Montenegro (South Adriatic Sea). Stud. Mar. 2017, 30, 17–27. [Google Scholar]
- Nachite, D.; Maziane, F.; Anfuso, G.; Williams, A.T. Spatial and temporal variations of litter at the Mediterranean beaches of Morocco mainly due to beach users. Ocean Coast. Manag. 2019, 179, 104846. [Google Scholar] [CrossRef]
- Nelms, S.E.; Easman, E.; Anderson, N.; Berg, M.; Coates, S.; Crosby, A.; Godley, B.J. The role of citizen science in addressing plastic pollution: Challenges and opportunities. Environ. Sci. Policy 2022, 128, 14–23. [Google Scholar] [CrossRef]
- Liburd, J.J.; Becken, S. Values in nature conservation, tourism and UNESCO World Heritage Site stewardship. J. Sustain. Tour. 2017, 25, 1719–1735. [Google Scholar] [CrossRef]
- Labadi, S. UNESCO, world heritage, and sustainable development: International discourses and local impacts. In Collision or Collaboration; Springer: Berlin/Heidelberg, Germany, 2017; pp. 45–60. [Google Scholar]
- Hall, C.M. Constructing sustainable tourism development: The 2030 agenda and the managerial ecology of sustainable tourism. J. Sustain. Tour. 2019, 27, 1044–1060. [Google Scholar] [CrossRef]
- MarineRegions.org. Available online: www.marineregions.org (accessed on 8 August 2024).
- Orlić, M.; Gačić, M.; La Violette, P.E. The current and circulation of the Adriatic Sea. Oceanol. Acta 1992, 15, 109–124. [Google Scholar]
- United Nations Environment Programme (UNEP). Implications of Climate Change for the Albanian Coast; MAP Technical Reports Series No. 98; UNEP: Athens, Greece, 1996; p. 186. [Google Scholar]
- Orlić, M.; Kuzmić, M.; Pasarić, Z. Response of the Adriatic Sea to the bora and sirocco forcing. Cont. Shelf Res. 1994, 14, 91–116. [Google Scholar] [CrossRef]
- Copernicus Land Monitoring Services. Corinne Land Cover 2108. Available online: https://land.copernicus.eu/en (accessed on 8 August 2024).
- Asensio-Montesinos, F.; Anfuso, G.; Williams, A.T.; Sanz-Lázaro, C. Litter behaviour on Mediterranean cobble beaches, SE Spain. Mar. Pollut. Bull. 2021, 173, 113106. [Google Scholar] [CrossRef] [PubMed]
- EA/NALG (Environment Agency and the National Aquatic Litter Group). Assessment of Aesthetic Quality of Coastal and Bathing Beaches. Monitoring Protocol and Classification Scheme; Environment Agency and The National Aquatic Litter Group: London, UK, 2000; p. 120.
- United Nations Environment Programme (UNEP). Integrated Monitoring and Assessment Guidance. UNEP(DEPI)/MED. Available online: https://www.rac-spa.org/sites/default/files/ecap/ig22_inf7.pdf (accessed on 8 August 2024).
- Fleet, D.; Vlachogianni, T.; Hanke, G. A Joint List of Litter Categories for Marine Macrolitter Monitoring; EUR 30348 EN; Publications Office of the European Union: Luxembourg, 2021. [Google Scholar]
- Alkalay, R.; Pasternak, G.; Zask, A. Clean-coast index—A new approach for beach cleanliness assessment. Ocean Coast. Manag. 2007, 50, 352–362. [Google Scholar] [CrossRef]
- Bray, J.R.; Curtis, J.T. An ordination of the upland forest communities of southern Wisconsin. Ecol. Monogr. 1957, 27, 325–349. [Google Scholar] [CrossRef]
- Garcés-Ordóñez, O.; Díaz, L.F.E.; Cardoso, R.P.; Muniz, M.C. The impact of tourism on marine litter pollution on Santa Marta beaches, Colombian Caribbean. Mar. Pollut. Bull. 2020, 160, 111558. [Google Scholar] [CrossRef]
- Quintela, A.; Silva, C.P.; Calado, H.; Williams, A.T. The relation of litter with bathing areas typologies, number of users and scenic value. The case study of Sao Miguel (Azores). J. Coast. Conserv. 2012, 16, 575–584. [Google Scholar] [CrossRef]
- Micallef, A.; Williams, A.T.; Gallego Fernandez, J.B. Bathing area quality and landscape evaluation on the Mediterranean coast of Andalucia, Spain. J. Coast. Res. 2011, 61, 87–95. [Google Scholar] [CrossRef]
- Rangel-Buitrago, N.; Mendoza, A.V.; Gracia, A.; Mantilla-Barbosa, E.; Arana, V.A.; Trilleras, J.; Arroyo-Olarte, H. Litter impacts on cleanliness and environmental status of Atlantico department beaches, Colombian Caribbean coast. Ocean Coast. Manag. 2019, 179, 104835. [Google Scholar] [CrossRef]
- Asensio-Montesinos, F.; Anfuso, G.; Randerson, P.; Williams, A.T. Seasonal comparison of beach litter on Mediterranean coastal sites (Alicante, SE Spain). Ocean Coast. Manag. 2019, 181, 104914. [Google Scholar] [CrossRef]
- López-Arquillo, J.D.; Oliveira, C.; Serrano González, J.; Durán Sánchez, A. Interdependence in Coastal Tourist Territories between Marine Litter and Immediate Tourist Zoning Density: Methodological Approach for Urban Sustainable Development. Land 2023, 13, 50. [Google Scholar] [CrossRef]
- Souza Filho, J.R.; Chagas, A.A.; Silva, I.R.; Guimarães, J.K.; Sakanaka, T.E.; Fernandino, G. Litter reduction during beach closure in the context of the COVID-19 pandemic: Quantifying the impact of users on beach litter generation. Sustainability 2023, 15, 2009. [Google Scholar] [CrossRef]
- Łabuz, T.A. Litter sources on the Polish Baltic shore—Effect of increased anthropogenic pollution. Stud. Quat. 2023, 38, 85–100. [Google Scholar] [CrossRef]
- Morton, J.K.; Ward, E.J.; de Berg, K.C. Potential small-and large-scale effects of mechanical beach cleaning on biological assemblages of exposed sandy beaches receiving low inputs of beach-cast macroalgae. Estuaries Coasts 2015, 38, 2083–2100. [Google Scholar] [CrossRef]
- Vlachogianni, T.; Skocir, M.; Constantin, P.; Labbe, C.; Orthodoxou, D.; Pesmatzoglou, I.; Scannella, D.; Spika, M.; Zissimopoulos, V.; Scoullos, M. Plastic pollution on the Mediterranean coastline: Generating fit-for-purpose data to support decision-making via a participatory-science initiative. Sci. Total Environ. 2020, 711, 135058. [Google Scholar] [CrossRef]
- Asensio-Montesinos, F.; Anfuso, G.; Aguilar-Torrelo, M.T.; Oliva Ramírez, M. Abundance and temporal distribution of beach litter on the coast of Ceuta (north Africa, Gibraltar strait). Water 2021, 13, 2739. [Google Scholar] [CrossRef]
- Vaz, B.; Williams, A.T.; Silva, C.P.D.; Phillips, M. The importance of user’s perception for beach management. J. Coast. Res. 2009, 56, 1164–1168. [Google Scholar]
- Ariza, E.; Jiménez, J.A.; Sardá, R. Seasonal evolution of beach waste and litter during the bathing season on the Catalan coast. Waste Manag. 2008, 28, 2604–2613. [Google Scholar] [CrossRef] [PubMed]
- Fernandez Garcia, G.; Asensio-Montesinos, F.; Anfuso, G.; Arenas-Granados, P. Beach Litter Variability According to the Number of Visitors in Cádiz Beaches, SW Spain. J. Mar. Sci. Eng. 2024, 12, 201. [Google Scholar] [CrossRef]
- Williams, A.T.; Tudor, D.T. Litter burial and exhumation: Spatial and temporal distribution on a cobble pocket beach. Mar. Pollut. Bull. 2001, 42, 1031–1039. [Google Scholar] [CrossRef]
- Poeta, G.; Battisti, C.; Bazzichetto, M.; Acosta, A.T. The cotton buds beach: Marine litter assessment along the Tyrrhenian coast of central Italy following the marine strategy framework directive criteria. Mar. Pollut. Bull. 2016, 113, 266–270. [Google Scholar] [CrossRef]
- Ryan, P.G. Does Size and Buoyancy Affect the Long-Distance Transport of Floating Debris? Environ. Res. Lett. 2015, 10, 084019. [Google Scholar] [CrossRef]
- Duhec, A.V.; Jeanne, R.F.; Maximenko, N.; Hafner, J. Composition and Potential Origin of Marine Debris Stranded in the Western Indian Ocean on Remote Alphonse Island, Seychelles. Mar. Pollut. Bull. 2015, 96, 76–86. [Google Scholar] [CrossRef]
- Ruiz, I.; Rubio, A.; Abascal, A.J.; Basurko, O.C. Modelling Floating Riverine Litter in the South-Eastern Bay of Biscay: A Regional Distribution from a Seasonal Perspective. Ocean Sci. 2022, 18, 1703–1724. [Google Scholar] [CrossRef]
- Maclean, K.; Weideman, E.A.; Perold, V.; Ryan, P.G. Buoyancy Affects Stranding Rate and Dispersal Distance of Floating Litter Entering the Sea from River Mouths. Mar. Pollut. Bull. 2021, 173, 113028. [Google Scholar] [CrossRef]
- Fazey, F.M.C.; Ryan, P.G. Biofouling on Buoyant Marine Plastics: An Experimental Study into the Effect of Size on Surface Longevity. Environ. Pollut. 2016, 210, 354–360. [Google Scholar] [CrossRef] [PubMed]
- Anfuso, G.; Álvarez, O.; Dilauro, G.; Sabato, G.; Scardino, G.; Sozio, A.; Rizzo, A. A First Attempt to Describe the Real-Time Be-havior and Fate of Marine Litter Items in the Nearshore and Foreshore under Low Energetic Marine Conditions. Water 2024, 16, 409. [Google Scholar] [CrossRef]
- Santos, I.R.; Friedrich, A.C.; Ivar do Sul, J.A. Marine debris contamination along undeveloped tropical beaches from northeast Brazil. Environ. Monit. Assess. 2009, 148, 455–462. [Google Scholar] [CrossRef]
- Araújo, M.C.B.; Costa, M.F. A critical review of the issue of cigarette butt pollution in coastal environments. Environ. Res. 2019, 172, 137–149. [Google Scholar] [CrossRef] [PubMed]
- Poeta, G.; Conti, L.; Malavasi, M.; Battisti, C.; Acosta, A.T.R. Beach litter occurrence in sandy littorals: The potential role of urban areas, rivers and beach users in central Italy. Estuar. Coast. Shelf Sci. 2016, 181, 231–237. [Google Scholar] [CrossRef]
- Williams, A.T.; Simmons, S.L. The degradation of plastic litter in rivers: Implications for beaches. J. Coast. Conserv. 1996, 2, 63–72. [Google Scholar] [CrossRef]
- Driedger, A.G.; Dürr, H.H.; Mitchell, K.; Van Cappellen, P. Plastic debris in the Laurentian Great Lakes: A review. J. Great Lakes Res. 2015, 41, 9–19. [Google Scholar] [CrossRef]
- Plastics Europe, 2023. Plastics—The Fast Facts 2023. Plastics Europe AISBL. Available online: https://plasticseurope.org/knowledge-hub/plastics-the-fast-facts-2023/ (accessed on 8 August 2024).
- Bringer, A.; Thomas, H.; Prunier, G.; Dubillot, E.; Bossut, N.; Churlaud, C.; Clérandeau, C.; Le Bihanic, F.; Cachot, J. High density polyethylene (HDPE) microplastics impair development and swimming activity of Pacific oyster D-larvae, Crassostrea gigas, depending on particle size. Environ. Pollut. 2020, 260, 113978. [Google Scholar] [CrossRef]
- Browne, M.A.; Crump, P.; Niven, S.J.; Teuten, E.; Tonkin, A.; Galloway, T.; Thompson, R. Accumulation of microplastic on shorelines worldwide: Sources and sinks. Environ. Sci. Technol. 2011, 45, 9175–9179. [Google Scholar] [CrossRef] [PubMed]
- Turner, A. Heavy metals, metalloids and other hazardous elements in marine plastic litter. Mar. Pollut. Bull. 2016, 111, 136–142. [Google Scholar] [CrossRef]
- Savoca, D.; Arculeo, M.; Barreca, S.; Buscemi, S.; Caracappa, S.; Gentile, A.; Persichetti, M.F.; Pace, A. Chasing phthalates in tissues of marine turtles from the Mediterranean Sea. Mar. Pollut. Bull. 2018, 127, 165–169. [Google Scholar] [CrossRef]
- Anderson, J.C.; Park, B.J.; Palace, V.P. Microplastics in aquatic environments: Implications for Canadian ecosystems. Environ. Pollut. 2016, 218, 269–280. [Google Scholar] [CrossRef]
- Bhardwaj, L.K. Occurrence of microplastics (MPs) in Antarctica and its impact on the health of organisms. Marit. Technol. Res. 2024, 6, 1–17. [Google Scholar] [CrossRef]
- Slaughter, E.; Gersberg, R.M.; Watanabe, K.; Rudolph, J.; Stransky, C.; Novotny, T.E. Toxicity of cigarette butts, and their chemical components, to marine and freshwater fish. Tob. Control 2011, 20, i25–i29. [Google Scholar] [CrossRef] [PubMed]
- Moriwaki, H.; Kitajima, S.; Katahira, K. Waste on the roadside, ‘poi-sute’ waste: Its distribution and elution potential of pollutants into environment. Waste Manag. 2009, 29, 1192–1197. [Google Scholar] [CrossRef]
- Novotny, T.E.; Lum, K.; Smith, E.; Wang, V.; Barnes, R. Filtered cigarettes and the case for an environmental policy on cigarette waste. Int. J. Environ. Res. Public Health 2009, 6, 1691–1705. [Google Scholar] [CrossRef]
- Caridi, F.; Sabbatini, A.; Birarda, G.; Costanzi, E.; De Giudici, G.; Galeazzi, R.; Medas, D.; Mobbili, G.; Ricciutelli, M.; Ruello, M.L.; et al. Cigarette butts, a threat for marine environments: Lessons from benthic foraminifera (Protista). Mar. Environ. Res. 2020, 162, 105150. [Google Scholar] [CrossRef] [PubMed]
- Green, D.S.; Kregting, L.; Boots, B. Smoked cigarette butt leachate impacts survival and behaviour of freshwater invertebrates. Environ. Pollut. 2020, 266, 115286. [Google Scholar] [CrossRef] [PubMed]
- EU Directive 2019/904. Available online: http://data.europa.eu/eli/dir/2019/904/oj (accessed on 8 June 2024).


Disclaimer/Publisher’s Note: The statements, opinions and data contained in all publications are solely those of the individual author(s) and contributor(s) and not of MDPI and/or the editor(s). MDPI and/or the editor(s) disclaim responsibility for any injury to people or property resulting from any ideas, methods, instructions or products referred to in the content. |
© 2024 by the authors. Licensee MDPI, Basel, Switzerland. This article is an open access article distributed under the terms and conditions of the Creative Commons Attribution (CC BY) license (https://creativecommons.org/licenses/by/4.0/).