
Flood Simulation in the Complex River Basin Affected by Hydraulic Structures Using a Coupled Hydrological and Hydrodynamic Model

Abstract
:1. Introduction
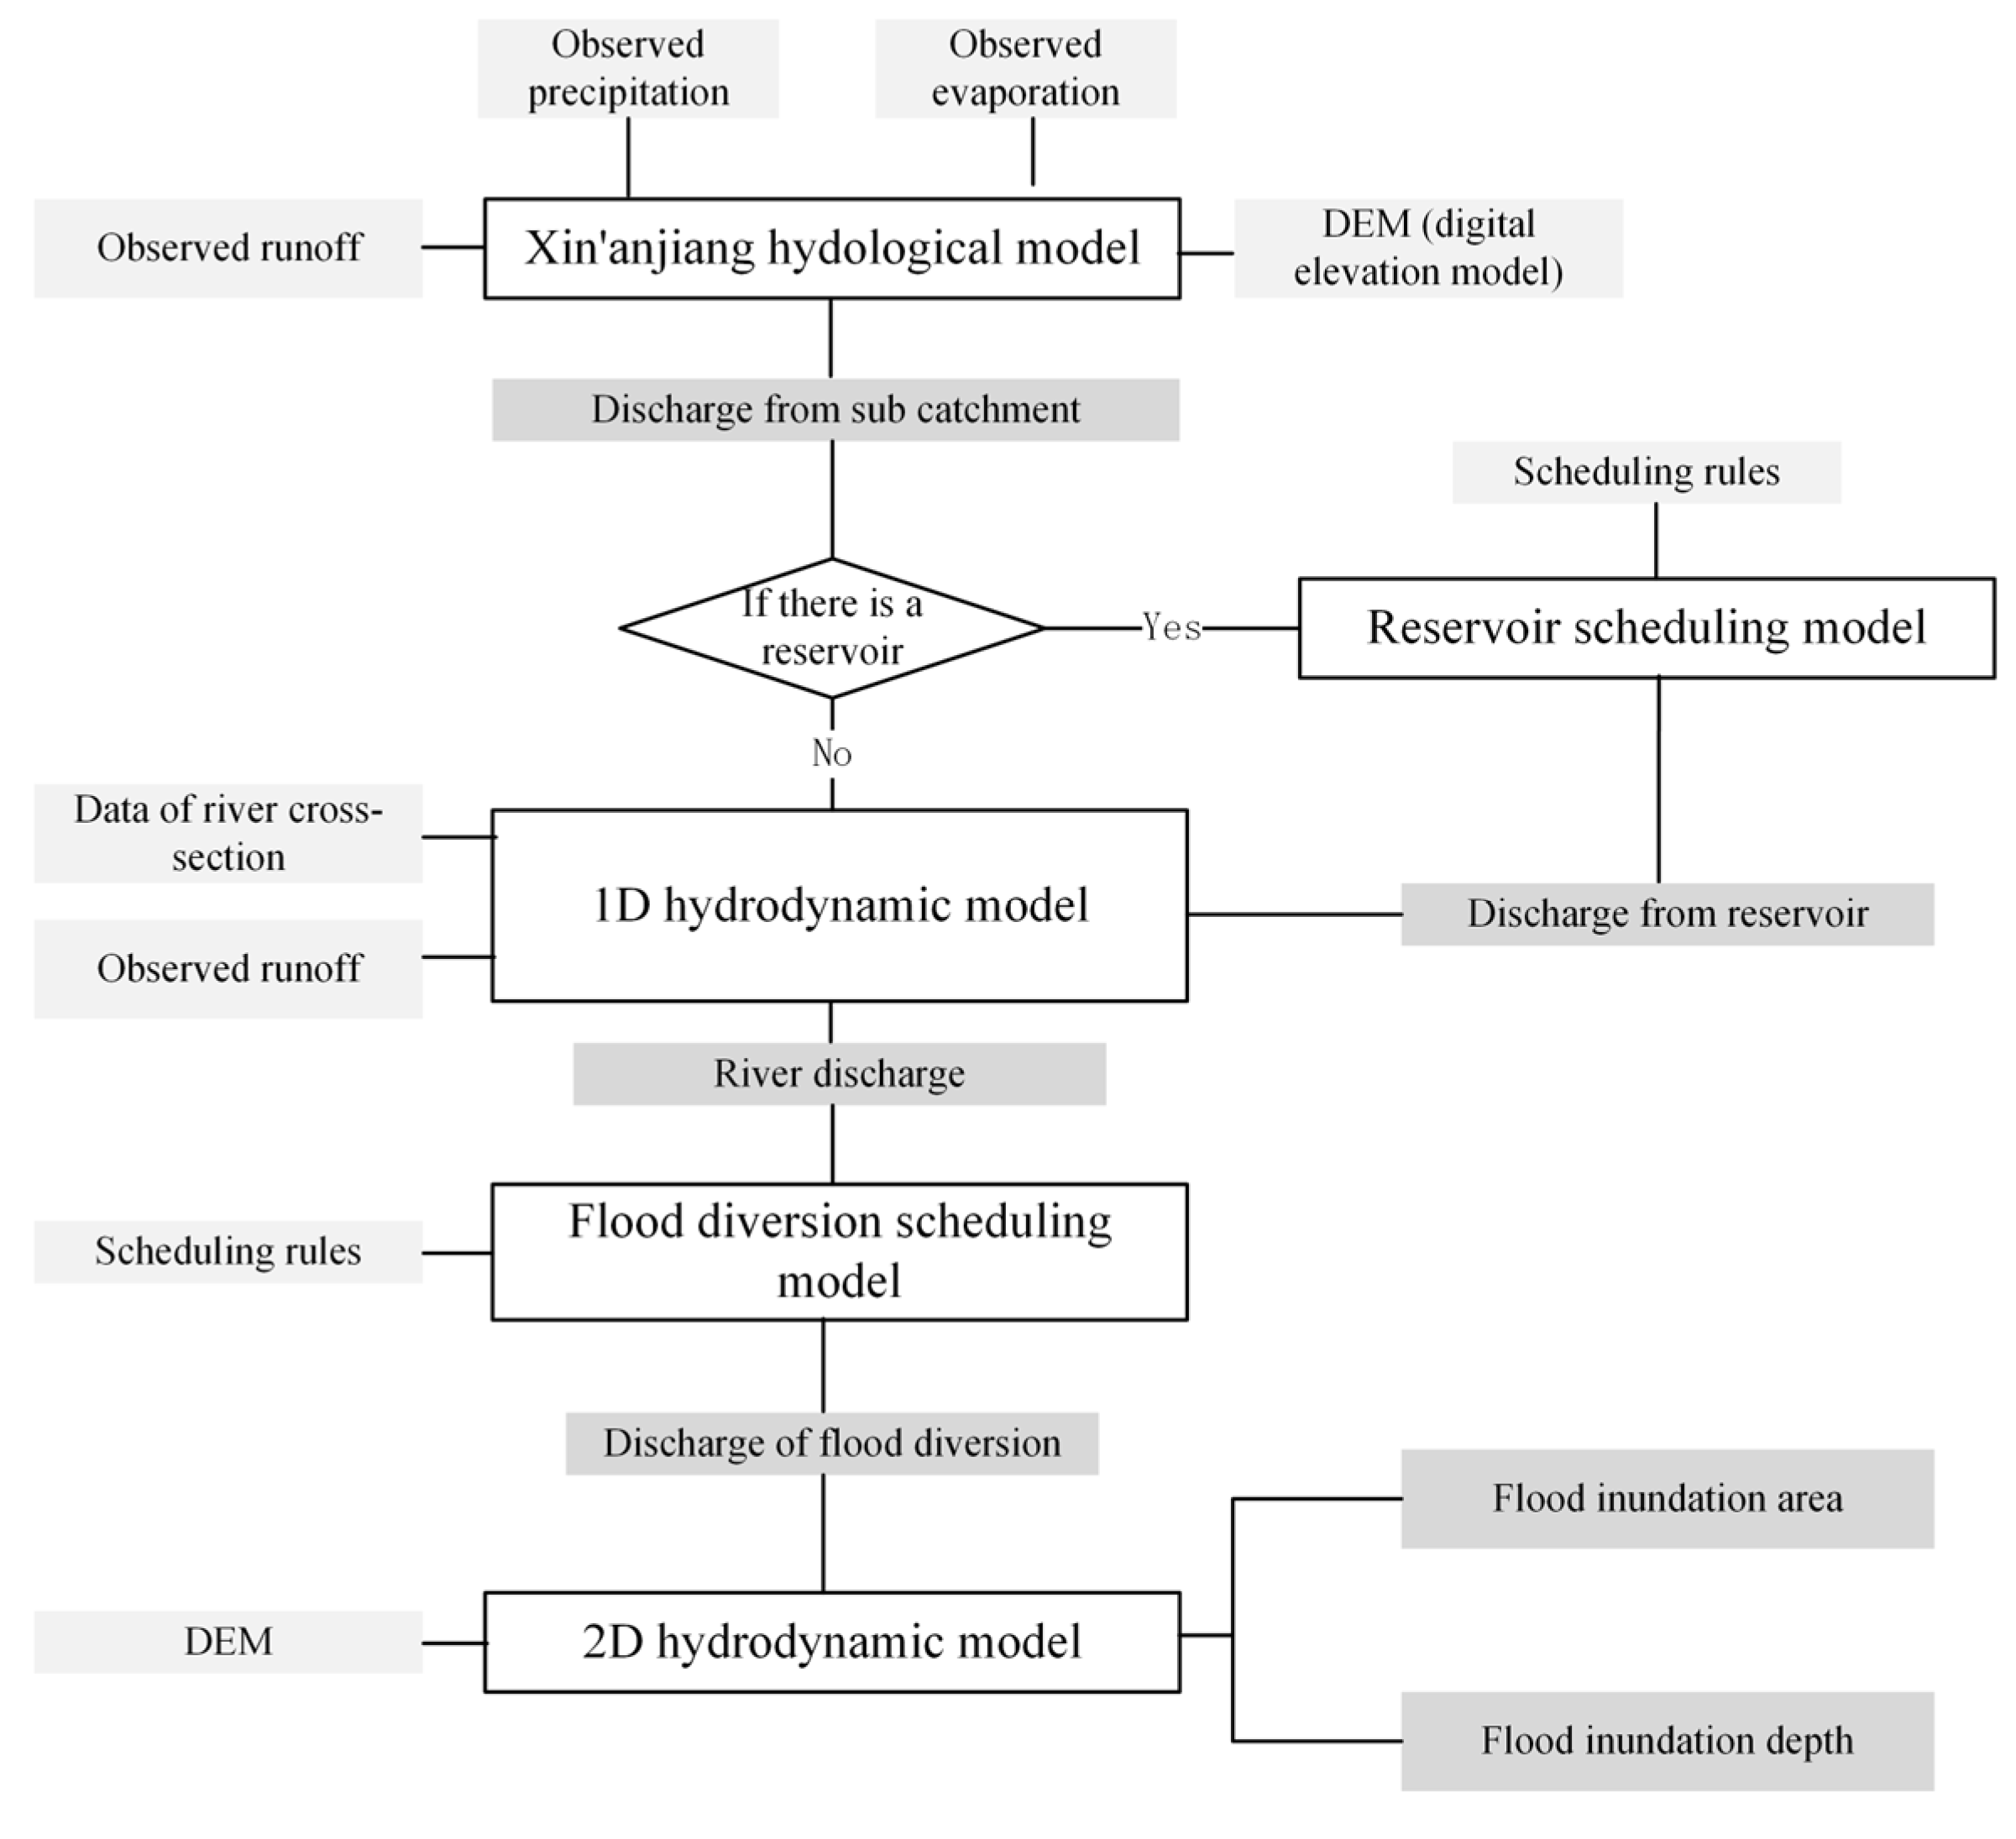
2. Methods
2.1. Xin’anjiang Hydrological Model
2.2. Reservoir Scheduling Model
2.3. One-Dimensional Hydrodynamic Model
2.4. Two-Dimensional Hydrodynamic Model
2.5. Flood Diversion Scheduling Model
3. Case Study
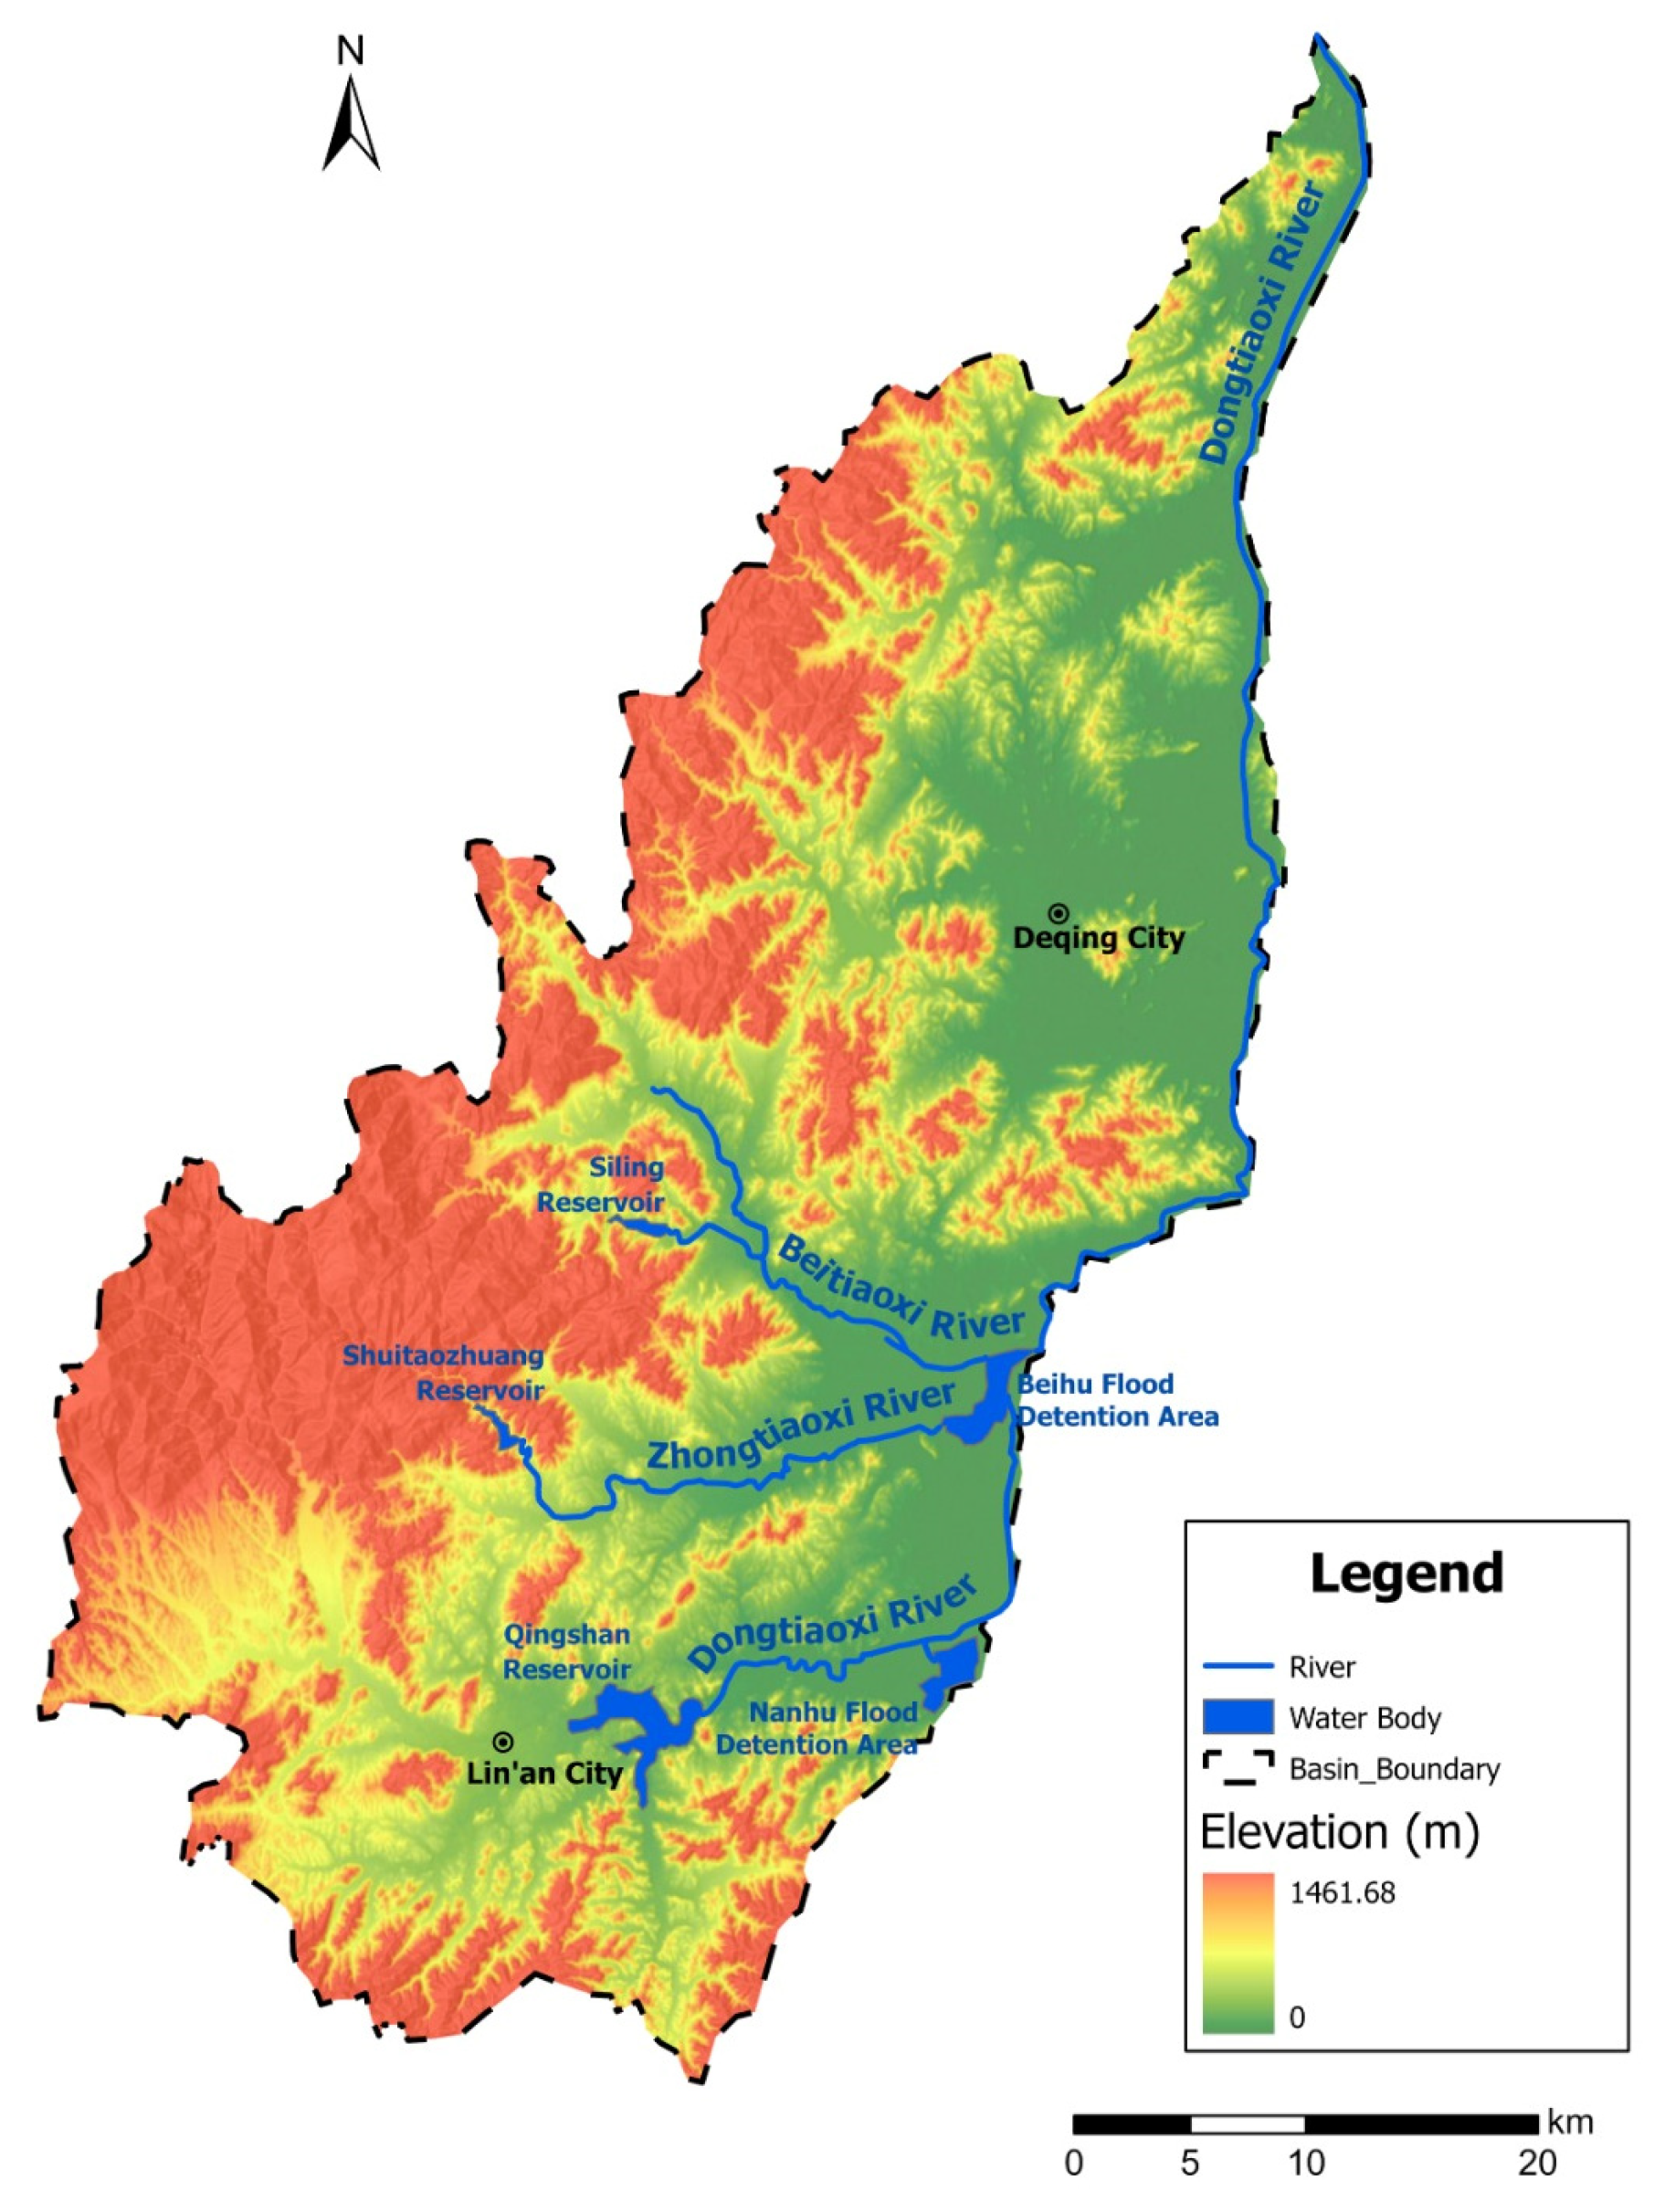
3.1. Study Area
3.2. Datasets
3.3. Model Calibration and Validation
3.3.1. Xin’anjiang Hydrological Model of Qingshan Reservoir
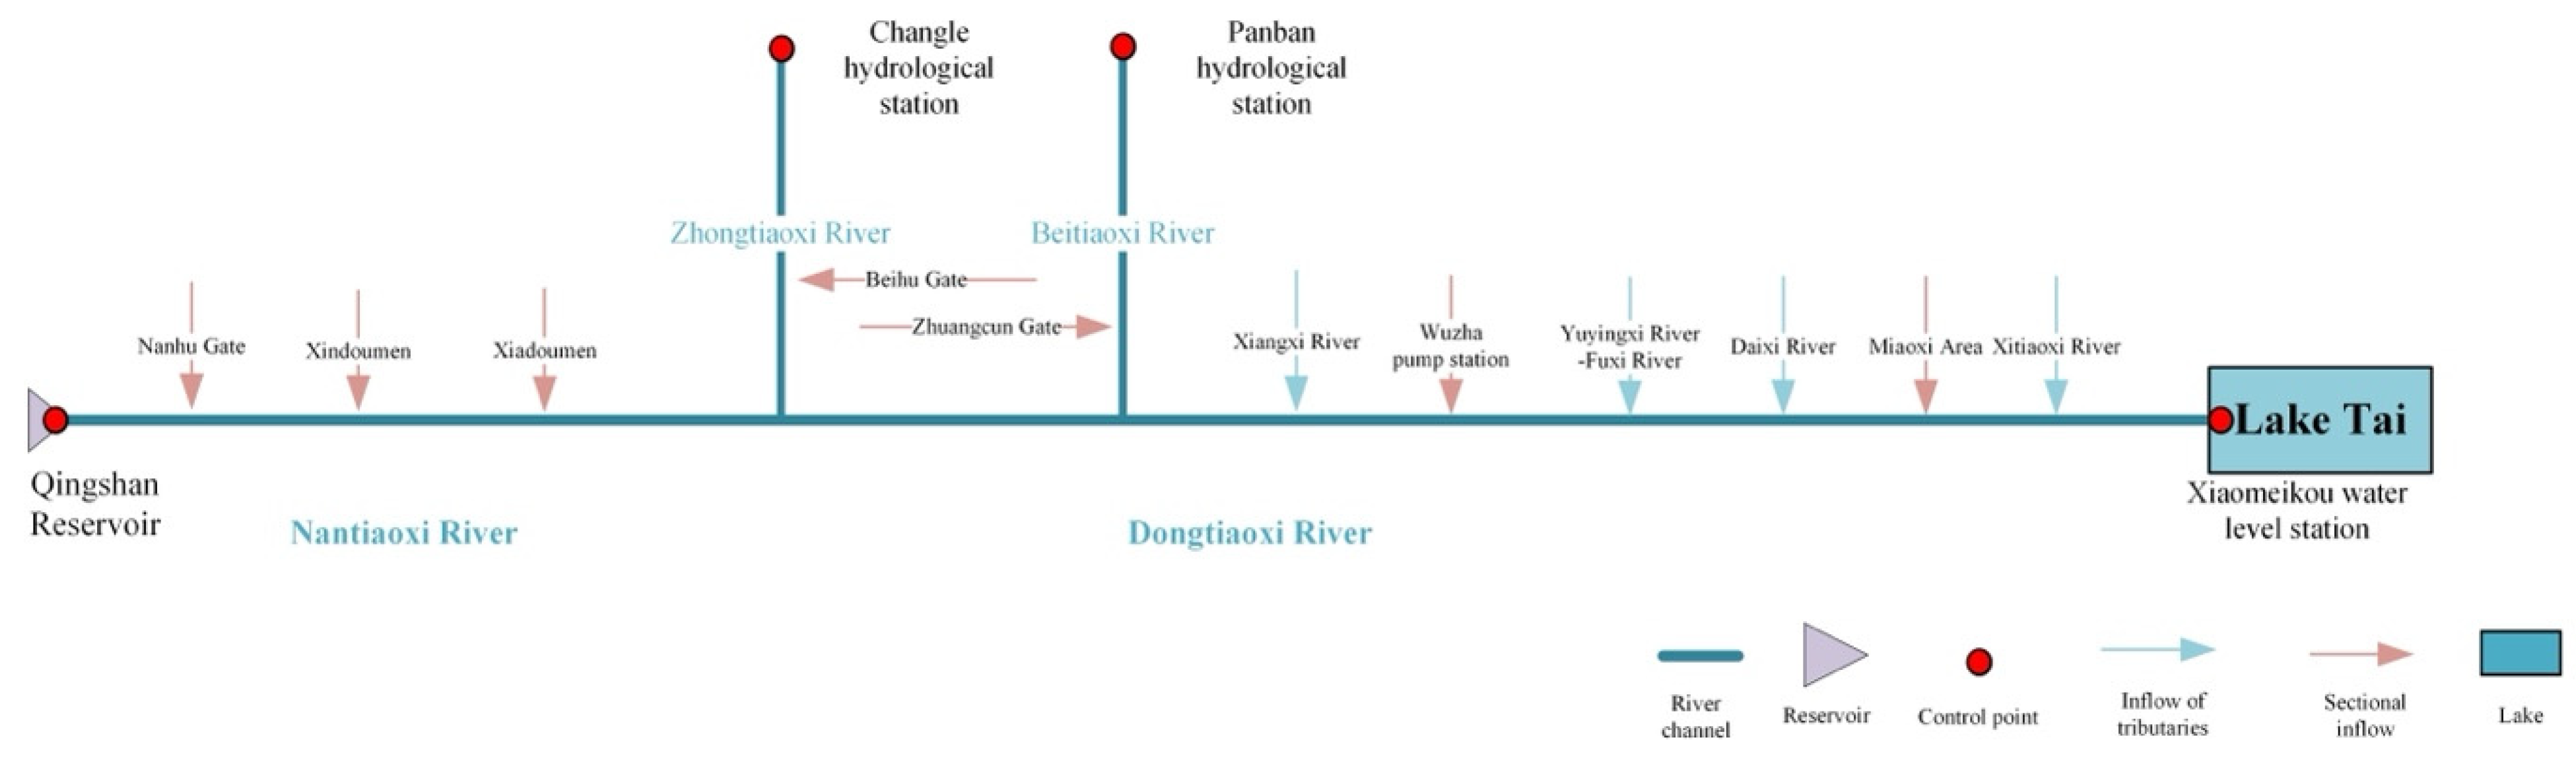
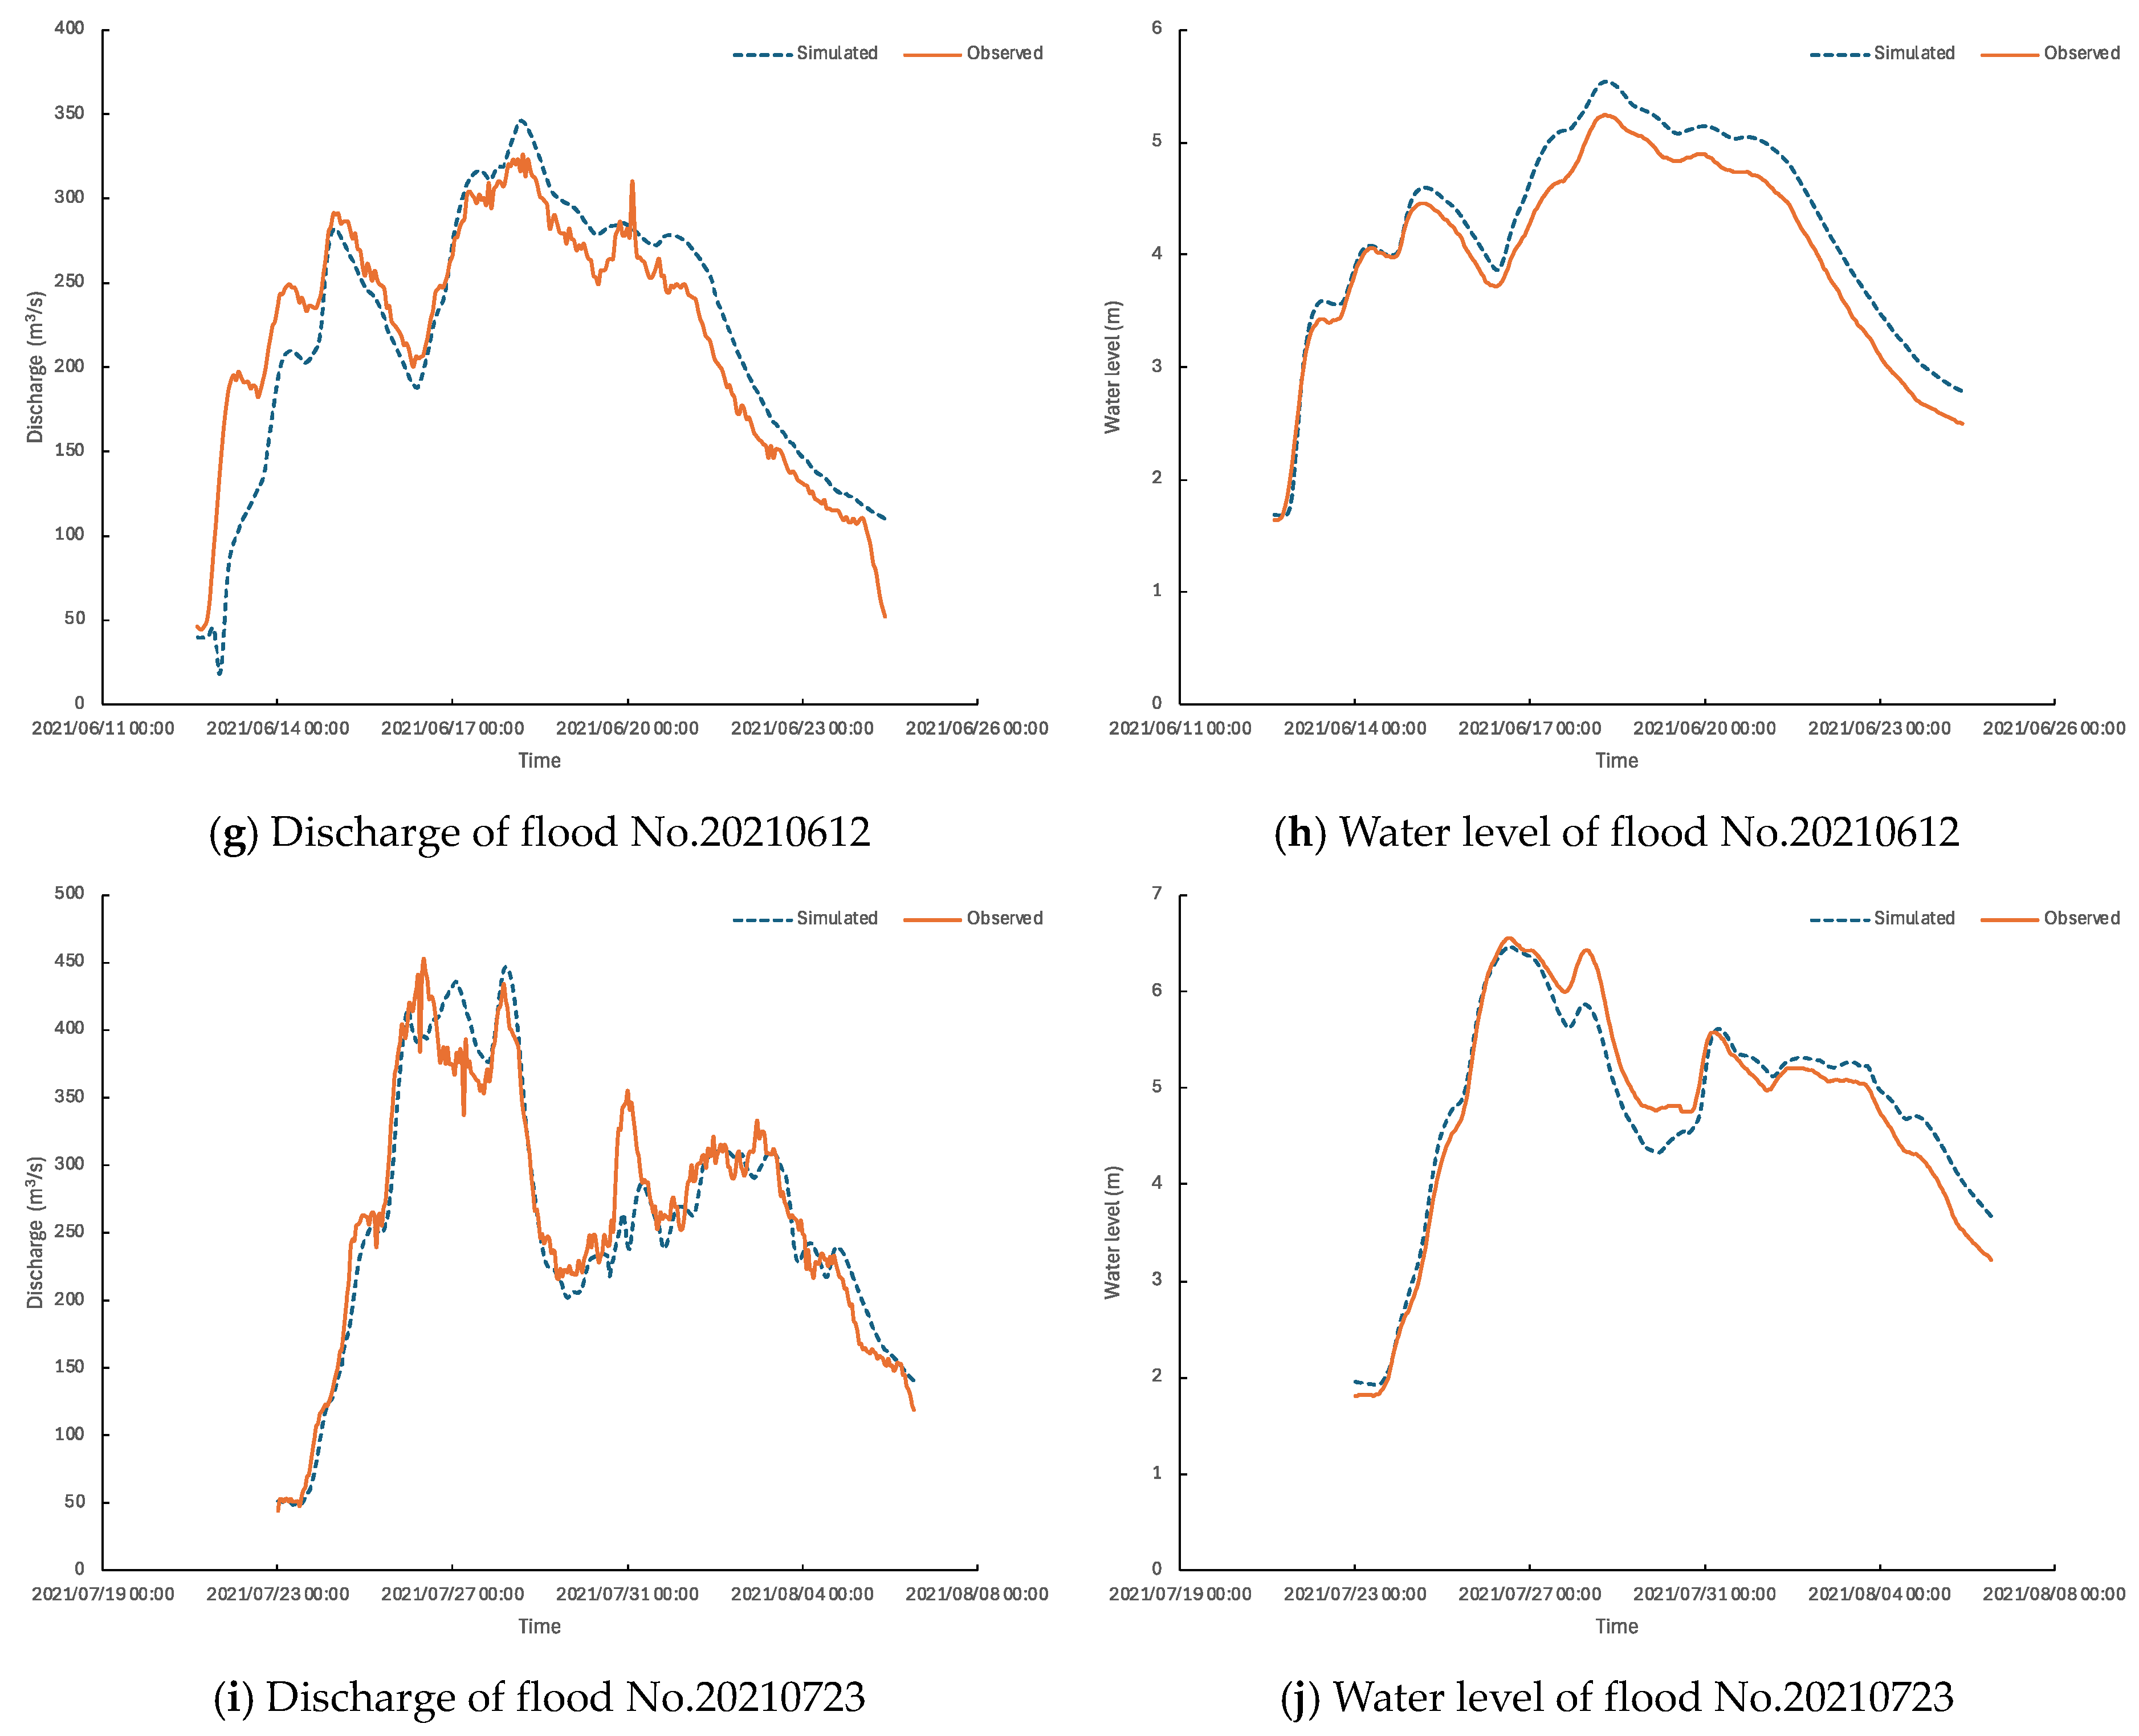
3.3.2. One-Dimensional Hydrodynamic Model of Dongtiaoxi River Basin
3.3.3. Two-Dimensional Hydrodynamic Model of Flood Detention Areas
3.3.4. Flood Diversion Simulation
4. Discussion
5. Conclusions
- By coupling the hydrological model, hydrodynamic model, and scheduling model, the proposed model can effectively capture the complex hydrodynamic interactions within the basin, including effectively reproduced water levels and discharge rates and detailed representations of floodplain dynamics and inundation patterns.
- Through the reservoir scheduling model and flood diversion scheduling model, the flood simulations effectively estimate the operation impact of reservoirs and flood detention areas, illustrating their potential as flood rehearsal tools capable of informing flood management strategies and emergency response plans.
- The study acknowledges the challenges posed by climate change, uncertainty of model parameters, and potential errors in hydraulic engineering operations.
- Future work should focus on integrating advanced technologies, such as AI, ML, meteorological models, and engineering automatic control, to improve forecasting accuracy and operational efficiency.
Author Contributions
Funding
Data Availability Statement
Conflicts of Interest
References
- Nevo, S.; Morin, E.; Gerzi Rosenthal, A.; Metzger, A.; Barshai, C.; Weitzner, D.; Voloshin, D.; Kratzert, F.; Elidan, G.; Dror, G.; et al. Flood forecasting with machine learning models in an operational framework. Hydrol. Earth Syst. Sci. 2011, 26, 4013–4032. [Google Scholar] [CrossRef]
- Alfieri, L.; Burek, P.; Dutra, E.; Krzeminski, B.; Muraro, D.; Thielen, J.; Pappenberger, F. GloFAS—Global ensemble streamflow forecasting and flood early warning. Hydrol. Earth Syst. Sci. 2013, 17, 1161–1175. [Google Scholar] [CrossRef]
- Xiang, Y.; Peng, T.; Qi, H.; Yin, Z.; Shen, T. Improving Flood Forecasting Skill by Combining Ensemble Precipitation Forecasts and Multiple Hydrological Models in a Mountainous Basin. Water 2024, 16, 1887. [Google Scholar] [CrossRef]
- Stoffel, M.; Wyżga, B.; Marston, R.A. Floods in mountain environments: A synthesis. Geomorphology 2016, 272, 1–9. [Google Scholar] [CrossRef]
- Phillips, J.D. Hydrological connectivity of abandoned channel water bodies on a coastal plain river. River Res. Appl. 2013, 29, 149–160. [Google Scholar] [CrossRef]
- Tapas, M.R.; Do, S.K.; Etheridge, R.; Lakshmi, V. Investigating the impacts of climate change on hydroclimatic extremes in the Tar-Pamlico River basin, North Carolina. J. Environ. Manag. 2024, 363, 121375. [Google Scholar]
- Tran TN, D.; Nguyen, B.Q.; Grodzka-Łukaszewska, M.; Sinicyn, G.; Lakshmi, V. The role of reservoirs under the impacts of climate change on the Srepok River basin, Central Highlands of Vietnam. Front. Environ. Sci. 2023, 11, 1304845. [Google Scholar] [CrossRef]
- Vionnet, V.; Fortin, V.; Gaborit, E.; Roy, G.; Abrahamowicz, M.; Gasset, N.; Pomeroy, J.W. Assessing the factors governing the ability to predict late-spring flooding in cold-region mountain basins. Hydrol. Earth Syst. Sci. 2020, 24, 2141–2165. [Google Scholar] [CrossRef]
- Contreras, M.T.; Gironás, J.; Escauriaza, C. Forecasting flood hazards in real-time: A surrogate model for hydrometeorological events in an Andean watershed. Nat. Hazards Earth Syst. Sci. Discuss. 2020, 20, 3261–3277. [Google Scholar] [CrossRef]
- Teraguchi, H.; Nakagawa, H.; Kawaike, K.; Yasuyuki BA, B.A.; Zhang, H. Effects of hydraulic structures on river morphological processes. Int. J. Sediment Res. 2011, 26, 283–303. [Google Scholar] [CrossRef]
- Liu, Q.; Qin, Y.; Zhang, Y.; Li, Z. A coupled 1D–2D hydrodynamic model for flood simulation in flood detention basin. Nat. Hazards 2015, 75, 1303–1325. [Google Scholar] [CrossRef]
- Patel, D.P.; Ramirez, J.A.; Srivastava, P.K.; Bray, M.; Han, D. Assessment of flood inundation mapping of Surat city by coupled 1D/2D hydrodynamic modeling: A case application of the new HEC-RAS 5. Nat. Hazards 2017, 89, 93–130. [Google Scholar] [CrossRef]
- Jain, S.K.; Mani, P.; Jain, S.K.; Prakash, P.; Singh, V.P.; Tullos, D.; Kumar, S.; Agarwal, S.P.; Dimri, A.P. A Brief review of flood forecasting techniques and their applications. Int. J. River Basin Manag. 2018, 16, 329–344. [Google Scholar] [CrossRef]
- Khattak, M.S.; Anwar, F.; Saeed, T.U.; Sharif, M.; Sheraz, K.; Ahmed, A. Floodplain Mapping Using HEC-RAS and ArcGIS: A Case Study of Kabul River. Arab. J. Sci. Eng. 2016, 41, 1375–1390. [Google Scholar] [CrossRef]
- Tran, T.-N.-D.; Nguyen, B.Q.; Zhang, R.; Aryal, A.; Grodzka-Łukaszewska, M.; Sinicyn, G.; Lakshmi, V. Quantification of Gridded Precipitation Products for the Streamflow Simulation on the Mekong River Basin Using Rainfall Assessment Framework: A Case Study for the Srepok River Subbasin, Central Highland Vietnam. Remote Sens. 2023, 15, 1030. [Google Scholar] [CrossRef]
- Thompson, J.R.; Sørenson, H.R.; Gavin, H.; Refsgaard, A. Application of the coupled MIKE SHE/MIKE 11 modelling system to a lowland wet grassland in southeast England. J. Hydrol. 2024, 293, 151–179. [Google Scholar] [CrossRef]
- Chen, Y.; Wang, Y.; Zhang, Y.; Luan, Q.; Chen, X. Flash floods, land-use change, and risk dynamics in mountainous tourist areas: A case study of the Yesanpo Scenic Area, Beijing, China. Int. J. Disaster Risk Reduct. 2020, 50, 101873. [Google Scholar] [CrossRef]
- Liu, Z.; Zhang, H.; Liang, Q. A coupled hydrological and hydrodynamic model for flood simulation. Hydrol. Res. 2019, 50, 589–606. [Google Scholar] [CrossRef]
- Zhang, Y.; Zhou, J.; Lu, C. Integrated Hydrologic and Hydrodynamic Models to Improve Flood Simulation Capability in the Data-Scarce Three Gorges Reservoir Region. Water 2020, 12, 1462. [Google Scholar] [CrossRef]
- Jha, M.K.; Afreen, S. Flooding Urban Landscapes: Analysis Using Combined Hydrodynamic and Hydrologic Modeling Approaches. Water 2020, 12, 1986. [Google Scholar] [CrossRef]
- Han, C.; Mei, Q.; Liu, S.G. Research and application on a coupled hydrological and hydrodynamic model in plain tidal river network. Chin. J. Hydrodyn. 2014, 29, 706–712. [Google Scholar]
- Zhong, H.; Zhang, B.; Ma, T.; Qi, X.; Wang, X.; Shang, H.; Qu, S.; Fang, W. Flood Scenario Simulation, Based on the Hydrological and Hydrodynamic Model in the Puyang River Catchment. Water 2022, 14, 3873. [Google Scholar] [CrossRef]
- Wu, M.; Dong, M.; Chen, F.; Yu, Z.; Luo, Y. A comparison of different station data on revealing the characteristics of extreme hourly precipitation over complex terrain: The case of Zhejiang, China. Earth Space Sci. 2023, 10, e2023EA002925. [Google Scholar] [CrossRef]
- Zhao, R.J. The Xin’anjiang model applied in China. J. Hydrol. 1992, 135, 371–381. [Google Scholar]
- Gill, M.A. Flood routing by the Muskingum method. J. Hydrol. 1978, 36, 353–363. [Google Scholar] [CrossRef]
- Chen, H.; Ahmadianfar, I.; Liang, G.; Bakhsizadeh, H.; Azad, B.; Chu, X. A successful candidate strategy with Runge-Kutta optimization for multi-hydropower reservoir optimization. Expert Syst. Appl. 2022, 209, 118383. [Google Scholar] [CrossRef]
- Strelkoff, T. Numerical solution of Saint-Venant equations. J. Hydraul. Div. 1970, 96, 223–252. [Google Scholar] [CrossRef]
- Defina, A. Two-dimensional shallow flow equations for partially dry areas. Water Resour. Res. 2000, 36, 3251–3264. [Google Scholar] [CrossRef]
- Xue, L.; Hao, Z.; Liu, X.; Li, Y. Numerical simulation and optimal system scheduling on flood diversion and storage in Dongting Basin, China. Procedia Environ. Sci. 2012, 12, 1089–1096. [Google Scholar]
- Ji, Z.; Zhang, G.; Huang, W. Flood Process Forecasting Method of Dongtiaoxi Based on LS-SVM. Zhejiang Hydrotech. 2021, 49, 5–8. [Google Scholar]
- Chen, Y.; Huang, Y.; Zhu, X. On Flood Control in Upper and Middle Reach of Dongtiaoxi River. J. Zhejiang Univ. Water Resour. Electr. Power 2019, 31, 42–46. [Google Scholar]
- Liao, S.; Wang, C.; Ji, R.; Zhang, X.; Wang, Z.; Wang, W.; Chen, N. Balancing Flood Control and Economic Development in Flood Detention Areas of the Yangtze River Basin. ISPRS Int. J. Geo-Inf. 2024, 13, 122. [Google Scholar] [CrossRef]
- Wang, K.; Wang, Z.; Liu, K.; Cheng, L.; Bai, Y.; Jin, G. Optimizing flood diversion siting and its control strategy of detention basins: A case study of the Yangtze River, China. J. Hydrol. 2021, 597, 126201. [Google Scholar] [CrossRef]
- Wang, Z.L.; Geng, Y.F.; Jin, S. The two-dimensional flood routing simulation. Chin. J. Comput. Mech. 2007, 2007, 533–538. [Google Scholar]
- Bellucci, V.; Bruno, C. Incompressible flows with combustion simulated by a preconditioning method using multigrid acceleration and MUSCL reconstruction. Int. J. Numer. Methods Fluids 2001, 36, 619–637. [Google Scholar] [CrossRef]
- Hossain, A.A.; Jia, Y.; Chao, X. Estimation of Manning’s roughness coefficient distribution for hydrodynamic model using remotely sensed land cover features. In Proceedings of the 17th International Conference on Geoinformatics 2009, Fairfax, VA, USA, 12–14 August 2009; IEEE: Fairfax, VA, USA, 2009; pp. 1–4. [Google Scholar]
- O’Brien, J.S. FLO-2D Reference Manual; FLO-2D Inc.: Nutrioso, AZ, USA, 2009. [Google Scholar]
- Xu, Y.P.; Zhang, X.; Ran, Q.; Tian, Y. Impact of climate change on hydrology of upper reaches of Qiantang River Basin, East China. J. Hydrol. 2013, 483, 51–60. [Google Scholar] [CrossRef]
- Wu, S.J.; Chang, C.H.; Hsu, C.T. Real-time error correction of two-dimensional flood-inundation simulations during rainstorm events. Stoch. Environ. Res. Risk Assess. 2020, 34, 641–667. [Google Scholar] [CrossRef]
- Puttinaovarat, S.; Horkaew, P. Flood forecasting system based on integrated big and crowdsource data by using machine learning techniques. IEEE Access 2020, 8, 5885–5905. [Google Scholar] [CrossRef]
- Jasper, K.; Gurtz, J.; Lang, H. Advanced flood forecasting in Alpine watersheds by coupling meteorological observations and forecasts with a distributed hydrological model. J. Hydrol. 2002, 267, 40–52. [Google Scholar] [CrossRef]
- Nguyen, H.M.; Bae, D.H. An approach for improving the capability of a coupled meteorological and hydrological model for rainfall and flood forecasts. J. Hydrol. 2019, 577, 124014. [Google Scholar] [CrossRef]
- Fraehr, N.; Wang, Q.J.; Wu, W.; Nathan, R. Supercharging hydrodynamic inundation models for instant flood insight. Nat. Water 2023, 1, 835–843. [Google Scholar] [CrossRef]


| Parameter | Indication |
|---|---|
| K | Ratio of the PET * to pan evaporation |
| WM | Areal mean tension water capacity |
| WUM | The upper layer of WM |
| WLM | The lower layer of WM |
| c | Deep evapotranspiration coefficient |
| b | Parameter in the distribution of the tension water capacity |
| EX | Parameter in the distribution of free water storage capacity |
| KI | Interflow coefficients |
| KG | Groundwater coefficients |
| CS | Flow-routing parameter |
| CI | Recession constant of lower interflow storage |
| CG | Recession constant of groundwater storage |
| KE | Travel time through the reach |
| XE | Number of subreaches |
| No. | NSE 1 | Relative Error/% | Time Lag/h | Observed Flood Volume/m3 | Simulated Flood Volume/m3 | |
|---|---|---|---|---|---|---|
| Calibration | 20130607 | 0.877 | 28.8 | 0 | 10,898.2 | 14,040.2 |
| 20130624 | 0.884 | 11.3 | 2 | 26,240.4 | 29,208.3 | |
| 20131006 | 0.851 | 27.5 | 2 | 19,496.6 | 24,859.0 | |
| 20160928 | 0.822 | −12.8 | 2 | 18,649.0 | 16,269.2 | |
| 20170623 | 0.847 | −19.1 | 0 | 20,417.1 | 16,517.7 | |
| 20180628 | 0.891 | −10.8 | 0 | 29,408.5 | 26,228.2 | |
| 20190708 | 0.872 | 5.4 | 0 | 19,568.5 | 20,621.4 | |
| 20190809 2 | 0.756 | 31.9 | −5 | 20,075.1 | 26,472.5 | |
| 20200702 | 0.940 | −11.8 | 0 | 50,015.9 | 44,119.1 | |
| Validation | 20210612 | 0.788 | −0.6 | −1 | 35,884.4 | 35,667.2 |
| 20210723 | 0.840 | 19.4 | 0 | 36,909.9 | 44,062.5 |
| Parameter Value | K | WM | WUM | WLM | c | b | SM | EX |
| 0.75 | 325 | 20 | 65 | 1.05 | 1.05 | 20 | 2.5 | |
| Parameter Value | KI | KG | CS | CI | CG | KE | XE | |
| 0.515 | 0.305 | 0.873 | 0.3 | 0.9 | 1.333 | 0.183 |
| River Section | Upstream Boundary | Downstream Boundary | Sectional Inflow |
|---|---|---|---|
| Nantiaoxi River–Dongtiaoxi River (Main Channel) | Qingshan Reservoir Dam Site (discharge) | Xiaomeikou water level station (water level) | Manhu Gate Xindoumen Xiadoumen Beihu Gate Zhuangcun Gate Xiangxi River Wuzha pump station Yuyingxi River–Fuxi River Daixi River Miaoxi Area Xitiaoxi River |
| Zhongtiaoxi River (tributary) | Changle hydrological station (discharge) | Confluence of Zhongtiao River and Dongtiao River | / |
| Beitiao River (tributary) | Panban hydrological station (discharge) | Confluence of Beitiaoxi River and Dongtiao River | / |
| No. | Measured Flow/(m3/s) | Calculated Flow/(m3/s) | Relative Error/% | NSE of Flow | Measured Water Level/m | Calculated Water Level/m | Error/m | NSE of Water Level | |
|---|---|---|---|---|---|---|---|---|---|
| Calibration | 20190712 | 532 | 582 | 9.36 | 0.68 | 6.85 | 7.09 | 0.24 | 0.88 |
| 20190809 1 | 396 | 526 | 32.8 | 0.13 | 6.18 | 6.94 | 0.77 | 0.78 | |
| 20200702 | 534 | 568 | 6.33 | 0.91 | 6.88 | 6.81 | −0.01 | 0.94 | |
| 20210612 | 326 | 346 | 6.22 | 0.82 | 5.25 | 5.54 | 0.29 | 0.91 | |
| Validation | 20210723 | 453 | 447 | −1.3 | 0.93 | 6.55 | 6.47 | −0.08 | 0.93 |
| River Reach | Roughness |
|---|---|
| Qingshan Reservoir–Yuhang hydrological station (Main Channel) | 0.032 |
| Yuhang hydrological station–Pingyao hydrological station (Main Channel) | 0.03 |
| Pingyao hydrological station–Xiaomeikou water level station (Main Channel) | 0.028 |
| Zhongtiaoxi River (tributary) | 0.03 |
| Beitiao River (tributary) | 0.03 |
| No. | Type | Name | Gate | River |
|---|---|---|---|---|
| 1 | Permanent | Nanhu Flood Detention Area | Nanhu Gate | Nantiaoxi River |
| 2 | Permanent | Beihu Flood Detention Area | Beihu Gate Zhuangcun Gate | Zhongtiaoxi River Beitiaoxi River |
| Flood Diversion Gate | Catchment/km2 | Scheduling Rules |
|---|---|---|
| Nanhu Gate | 726 | Start flood diversion when the water level at Yuhang station is 8.4 m and keeps rising. Stop flood diversion when the discharge reaches 17.5 million m3, or when the water level upstream of the gate and at Yuhang reaches the water level to reduce water levels. |
| Beihu Gate | 249 | Start flood diversion when the water level at Pingyao station is 6.5 m and keeps rising. Stop flood diversion when the discharge reaches 20.5 million m3, or when the water level upstream of the gate and at Pingyao reaches the water level to reduce water levels. |
| Zhuangcun Gate | 322 | Start flood diversion when the water level at Pingyao station is over 6.5 m and over 9 m at Panban station. Stop flood diversion when the discharge reaches 20.5 million m3, or when the water levels at the gate and Pingyao reach the recession water levels. |
Disclaimer/Publisher’s Note: The statements, opinions and data contained in all publications are solely those of the individual author(s) and contributor(s) and not of MDPI and/or the editor(s). MDPI and/or the editor(s) disclaim responsibility for any injury to people or property resulting from any ideas, methods, instructions or products referred to in the content. |
© 2024 by the authors. Licensee MDPI, Basel, Switzerland. This article is an open access article distributed under the terms and conditions of the Creative Commons Attribution (CC BY) license (https://creativecommons.org/licenses/by/4.0/).
Share and Cite
Zhang, K.; Ji, Z.; Luo, X.; Liu, Z.; Zhong, H. Flood Simulation in the Complex River Basin Affected by Hydraulic Structures Using a Coupled Hydrological and Hydrodynamic Model. Water 2024, 16, 2383. https://doi.org/10.3390/w16172383
Zhang K, Ji Z, Luo X, Liu Z, Zhong H. Flood Simulation in the Complex River Basin Affected by Hydraulic Structures Using a Coupled Hydrological and Hydrodynamic Model. Water. 2024; 16(17):2383. https://doi.org/10.3390/w16172383
Chicago/Turabian StyleZhang, Keying, Zhansheng Ji, Xiaoliang Luo, Zhenyi Liu, and Hua Zhong. 2024. "Flood Simulation in the Complex River Basin Affected by Hydraulic Structures Using a Coupled Hydrological and Hydrodynamic Model" Water 16, no. 17: 2383. https://doi.org/10.3390/w16172383