Article

Study on the Evolution Characteristics of Dam Failure Due to Flood Overtopping of Tailings Ponds

1
School of Civil Engineering, North China University of Technology, Beijing 100144, China
2
Beijing Science and Technology Innovation Promotion Center, Beijing 100142, China
*
Author to whom correspondence should be addressed.
Water 2024, 16(17), 2406; https://doi.org/10.3390/w16172406
Submission received: 15 July 2024 / Revised: 8 August 2024 / Accepted: 11 August 2024 / Published: 27 August 2024

Abstract

:
There has been a frequent occurrence of tailing dam failures in recent years, leading to severe repercussions. Flood overtopping is an important element contributing to these failures. Nevertheless, there is a scarcity of studies about the evolutionary mechanisms of dam breaches resulting from flood overtopping. In order to fill this knowledge vacuum, this study focused on the evolutionary characteristics and triggering mechanisms of overtopping failures, utilizing the Heshangyu tailings pond as a prototype. The process of overtopping breach evolution was revealed by the conduction of small-scale model testing. A scaled-down replica of the tailings pond was constructed at a ratio of 1:150, and a controlled experiment was conducted to simulate a breach in the dam caused by water overflowing. Based on the results, the following conclusions were drawn: (1) The rise in water level in the pond caused the tailings to become saturated, leading to liquefaction flow and local slope sliding at the initial dam. If the sediment-carrying capacity of the overflowing water exceeded the shear strength of the tailings, water erosion would accelerate landslides on the slope, generating a sand-laden water flow. (2) The breach was primarily influenced by water erosion, which subsequently resulted in both laterally widened and longitudinally deepened breach. As the breach expanded, the sand-carrying capacity of the water flow increased, leading to a faster rate of failure. The breach process of overtopping can be categorized into four distinct stages: gully formation stage, lateral broadening stage of gully, cracks and collapse on the slope surface, and stable stage of collapse. (3) The tailings from the outflow spread downstream in a radial pattern, forming an alluvial fan. Additionally, the depth of the deposited mud first increased and subsequently declined as the distance from the breach grew. The findings of this research provide an important basis for the prevention and control of tailings dam breach disasters due to overtopping.

1. Introduction

Tailing ponds are crucial facilities used to store the waste materials, known as tailings, that are generated during the processing of minerals in both metal and non-metal mines. Occasional tailing pond dam failures have occurred in recent years. In 2015, a dam failure at the Fundão tailings impoundment in Brazil resulted in the loss of 19 lives and the devastation of nearby settlements, causing serious pollution of the environment [1]. In 2019, the Córrego do Feijão tailings impoundment burst due to static liquefaction, which caused at least 278 deaths and the destruction of aquatic and terrestrial ecosystems [2]. Tailings impoundment dam failures are a frequent occurrence globally, with a likelihood approximately 10 times higher than that of water reservoir failures [3]. On a global scale, there is an annual average of two to five incidents of breaches in tailing ponds [4,5].
By analyzing more than 300 tailing dam failure accidents, Lyu et al. [6] pointed out that dam failures caused by liquefaction and floodwater overtopping were more common. Unforeseen heavy rainfall is the primary cause of overtopping failures, as it prevents the effective release of floodwater from tailings storage facilities. When the water level rises above the beach crest of tailing dams, it creates an overtopping flow that washes over the dam and causes the dam to burst. When the shear stress produced by the overflow surpasses the erosion resistance threshold of the dammed tailings particles, the water overflowing from the top of the dam converges into water flow on the slope face of the dam, triggering the erosion of the dam body [7]. Wahl [8] and Froehlich et al. [9] found that the erosion of overtopping failures could be divided into two stages: formation and development. This process occurs from downstream to upstream during the formation stage, and from upstream to downstream during the development stage. When the collapse was in the developing stage, the collapse increased rapidly. Following the developing stage, the collapse began to erode laterally. This process ultimately leads to geologic hazard [10].
Focusing on conventional earth and rockfill dams, Ralston [11] and Hanson et al. [12] discovered the “Scarp” scour erosion pattern through the overtopping failure test, and the “Scarp” was the cause of various developmental states of breaches. Rico [13] collected global data on tailing dam failures over the years and conducted regression analysis to derive empirical correlations between physical parameters and spillage characteristics. These correlations could be used to make preliminary estimates regarding spillage and the distance of discharge in the event of a dam failure. Initially, research on overtopping failures was mainly focused on earth and rockfill dams in the early stage [14,15,16,17,18,19].
The safety of tailing ponds is generally lower compared with that of earth and rockfill dams. Due to the presence of a two-phase body consisting of soil and water in tailing ponds, the mechanism and evolution law of bottom flow during breaching become more intricate. At present, model tests or numerical simulations are mainly used to investigate the process and mechanism of dam failures. Souza [20] conducted prototype experiments on breaching to study the number of tailings discharged from 20 different forms of breaches. The findings indicated that the types of breaches have a significant impact on the amount of released sediment. Gens et al. [21] conducted breaching tests on tailing dams in rainy conditions. They revealed the decreasing stability factors over the duration of rainfall and proposed a progressive damage pattern of tailing dams. Alexio et al. [22] measured the flow rate of breaching sediment flow and derived the characteristics of breaching sediment flow from the tailings reservoir. Jing et al. [23] established a slip collapse model and studied the relationship between the height of the seepage line and dam failures. In general, model tests related to the overtopping of tailing ponds have mainly focused on the evolution process after dam break. Before the tailing pond overtops, the seepage line in the pond will first rise, leading to a reduction in stability or local damage of the slope. However, investigating how the localized damage triggers the complete rupture of the dam is a significant issue that merits further study.
The failure process of tailing dams involves complex issues of physics, mechanics, and fluid properties. Numerical models can be employed to investigate the process of dam failure in real-scale tailing dams under various conditions. Martínez-Aranda et al. [24] explored the complexity of water–sediment flow by introducing a novel physical model. The proposed mixing-layer model was employed to simulate the tailings flow, a mixture of water and sediment, during the dam failure process. This facilitated the prediction of tailing dam failure disasters. In order to elucidate the intricacies of tailings flow, Yang et al. [25] postulated that the tailings flow could be modeled as a homogeneous and incompressible non-Newtonian fluid. This was then subjected to rheological investigation through the utilization of rheological tests based on the Bingham model. Analyzing the flow characteristics of tailing dams through this method was of great significance for the prevention and control of tailings flow disasters. Martínez-Aranda et al. [26] proposed a 2D Finite Volume model for non-equilibrium bedload transport. The model was employed to simulate the processes of dyke erosion and dam breach, and the numerical results were found to align closely with the experimental data, thereby enhancing the comprehension of the phenomenon of tailings pond failure. However, the development process of breaches during overtopping failures in tailings dams is characterized by significant uncertainty. The use of numerical simulations for the study of dam failure does not allow for the accurate simulation of the complex evolution and triggering mechanisms of the breach. Consequently, it is crucial to examine the evolution process of breaches in tailing dams through physical model experiments.
In this paper, we took a tailings pond in China as a prototype and constructed a similar model test system to simulate overtopping based on the similarity theory. During the test, the water level underwent changing until it reached a point wherein it overflowed. The seepage line and pore pressure in the pond were monitored, and the damage process of the slope was analyzed. Finally, the discussion focused on the evolutionary characteristics and internal mechanisms of dam failure caused by overtopping.

2. Similar Model Test System

Based on the principle of model similarity, an indoor physical model test system for dam break was set up. The model dam was constructed in the flume according to an actual tailings pond in China.

2.1. Project Overview

The Heshangyu iron tailings impoundment, owned by Shounyun mining Co., Ltd., Miyun District, Beijing, is located in a claw-shaped valley, as shown in Figure 1. The tailings pond had a top elevation of 225 m, a dam height of 83 m, and a storage capacity of approximately 13.7 million m3. The average elevation of the beach crest was 223.5 m, and the slope ratio of the sedimentary beach was 1.5%. In addition, the external slope ratio of the stacked dam was 1:3.

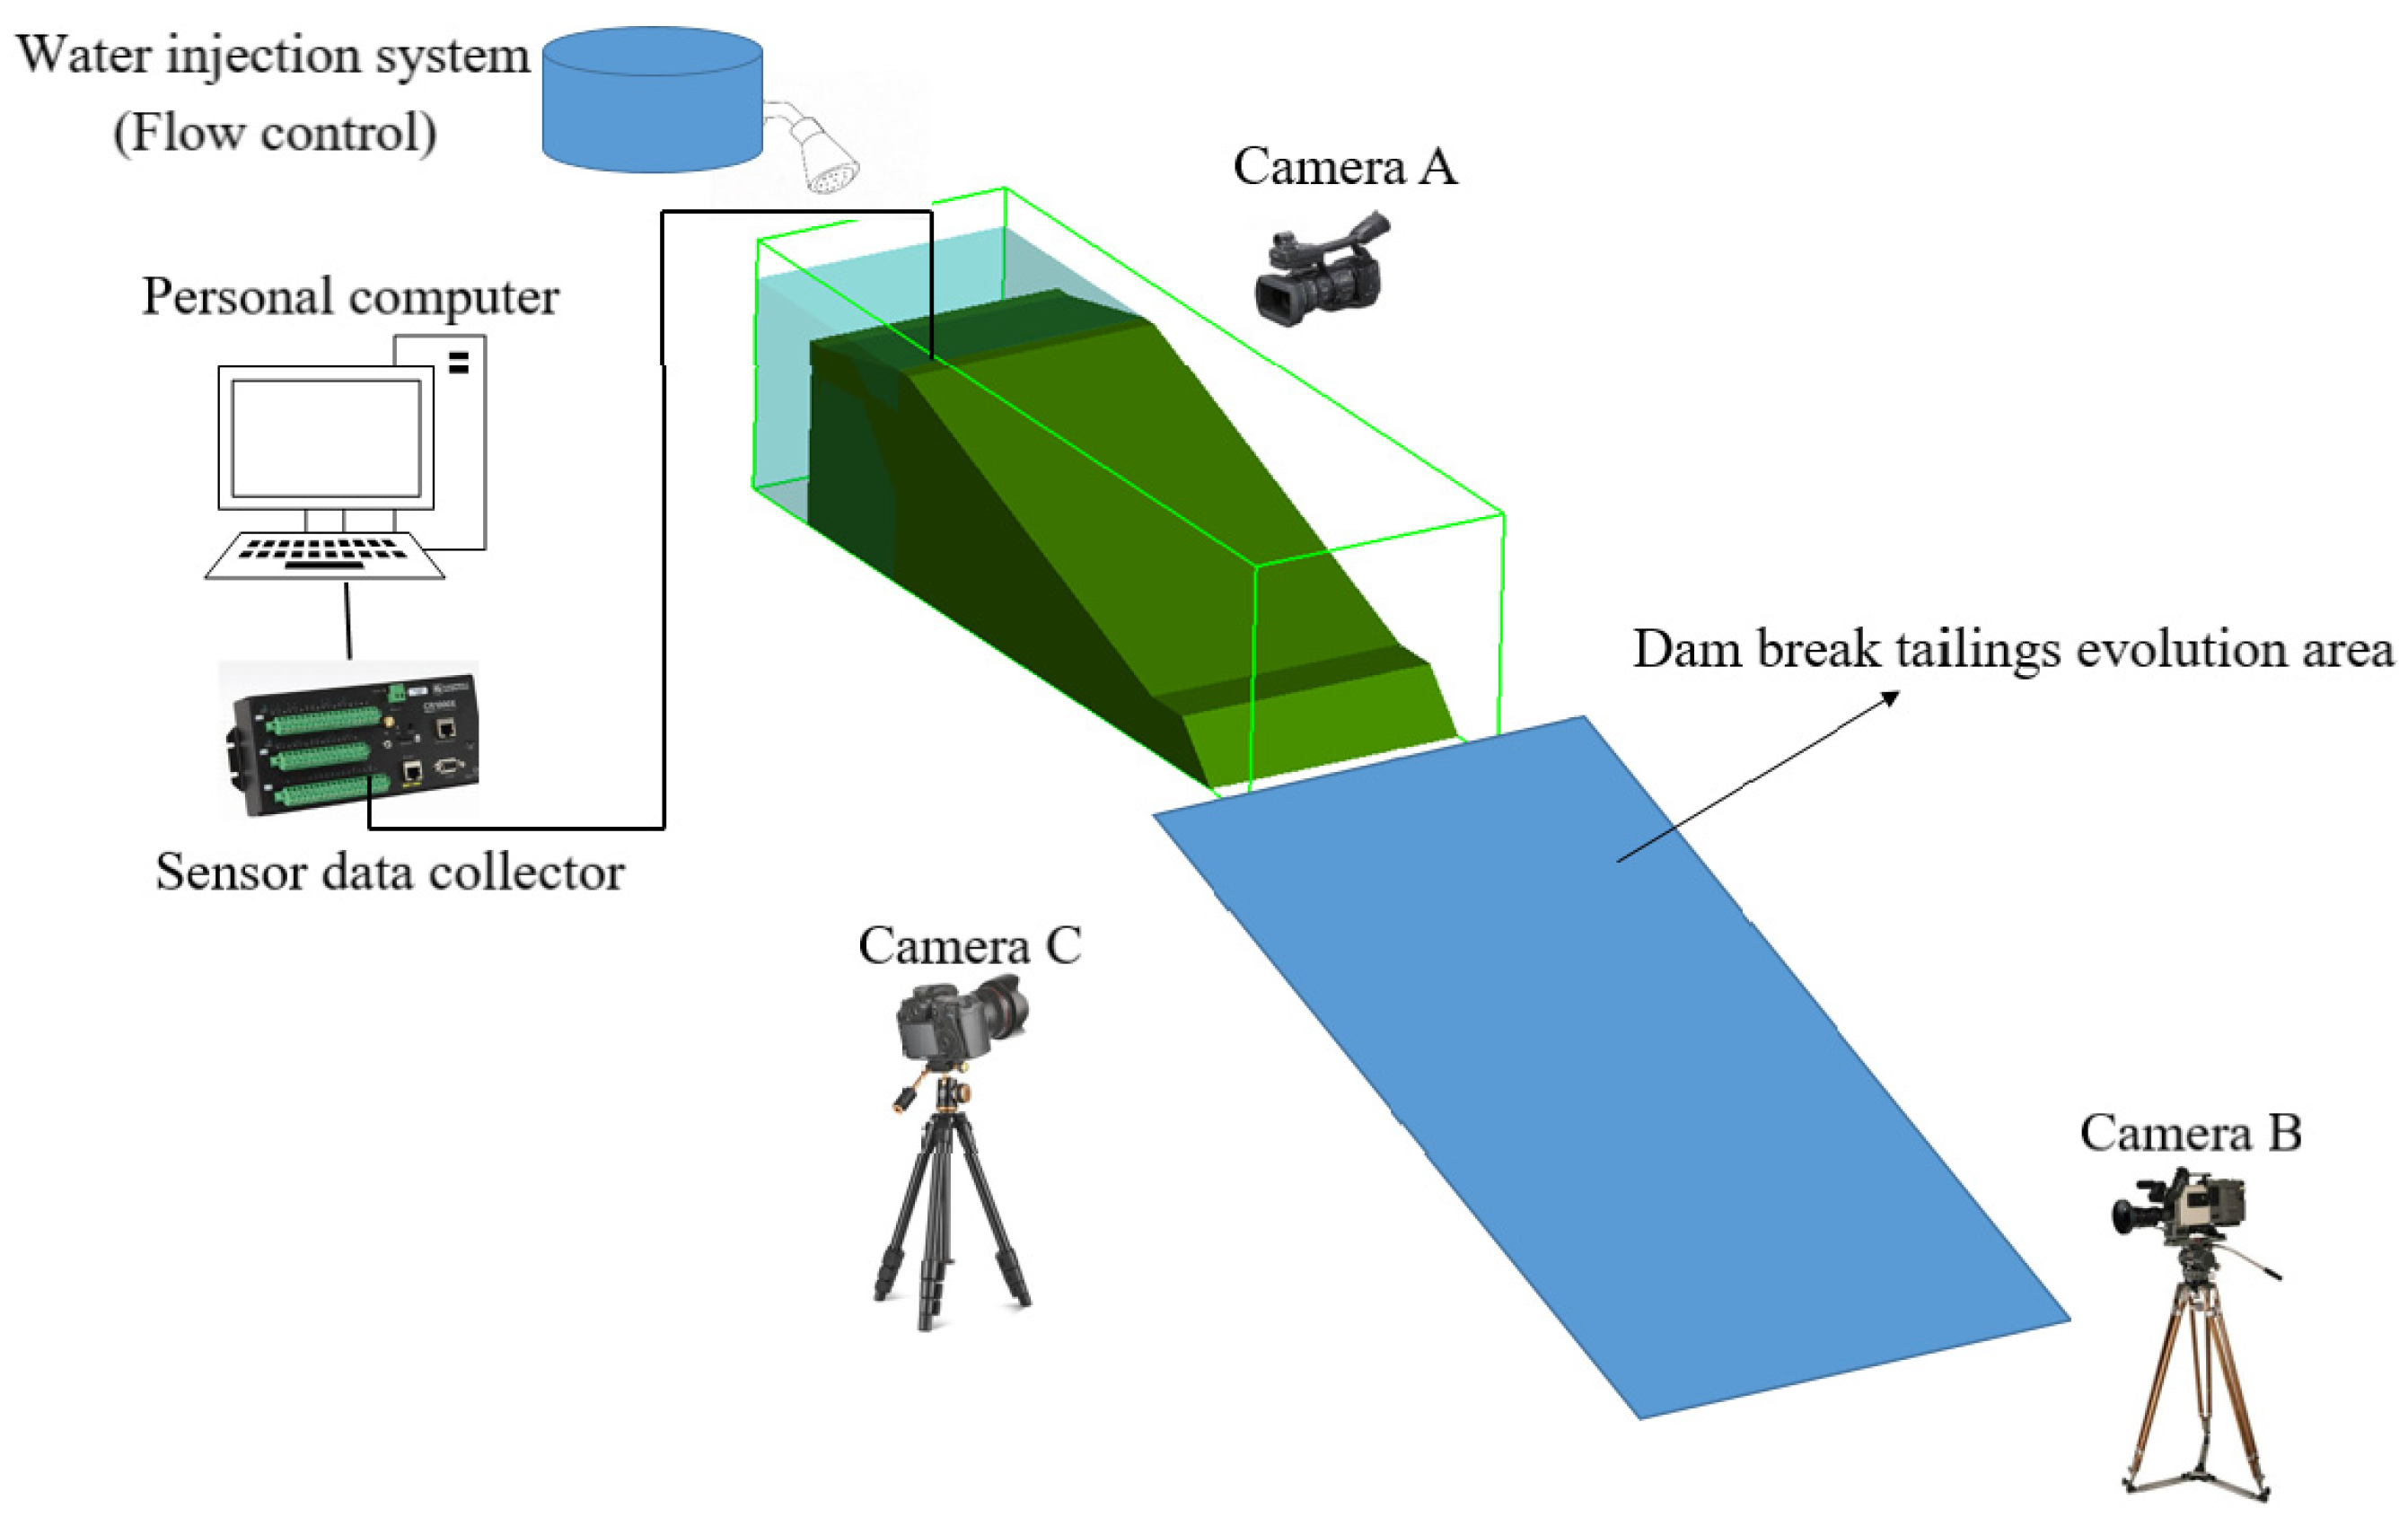
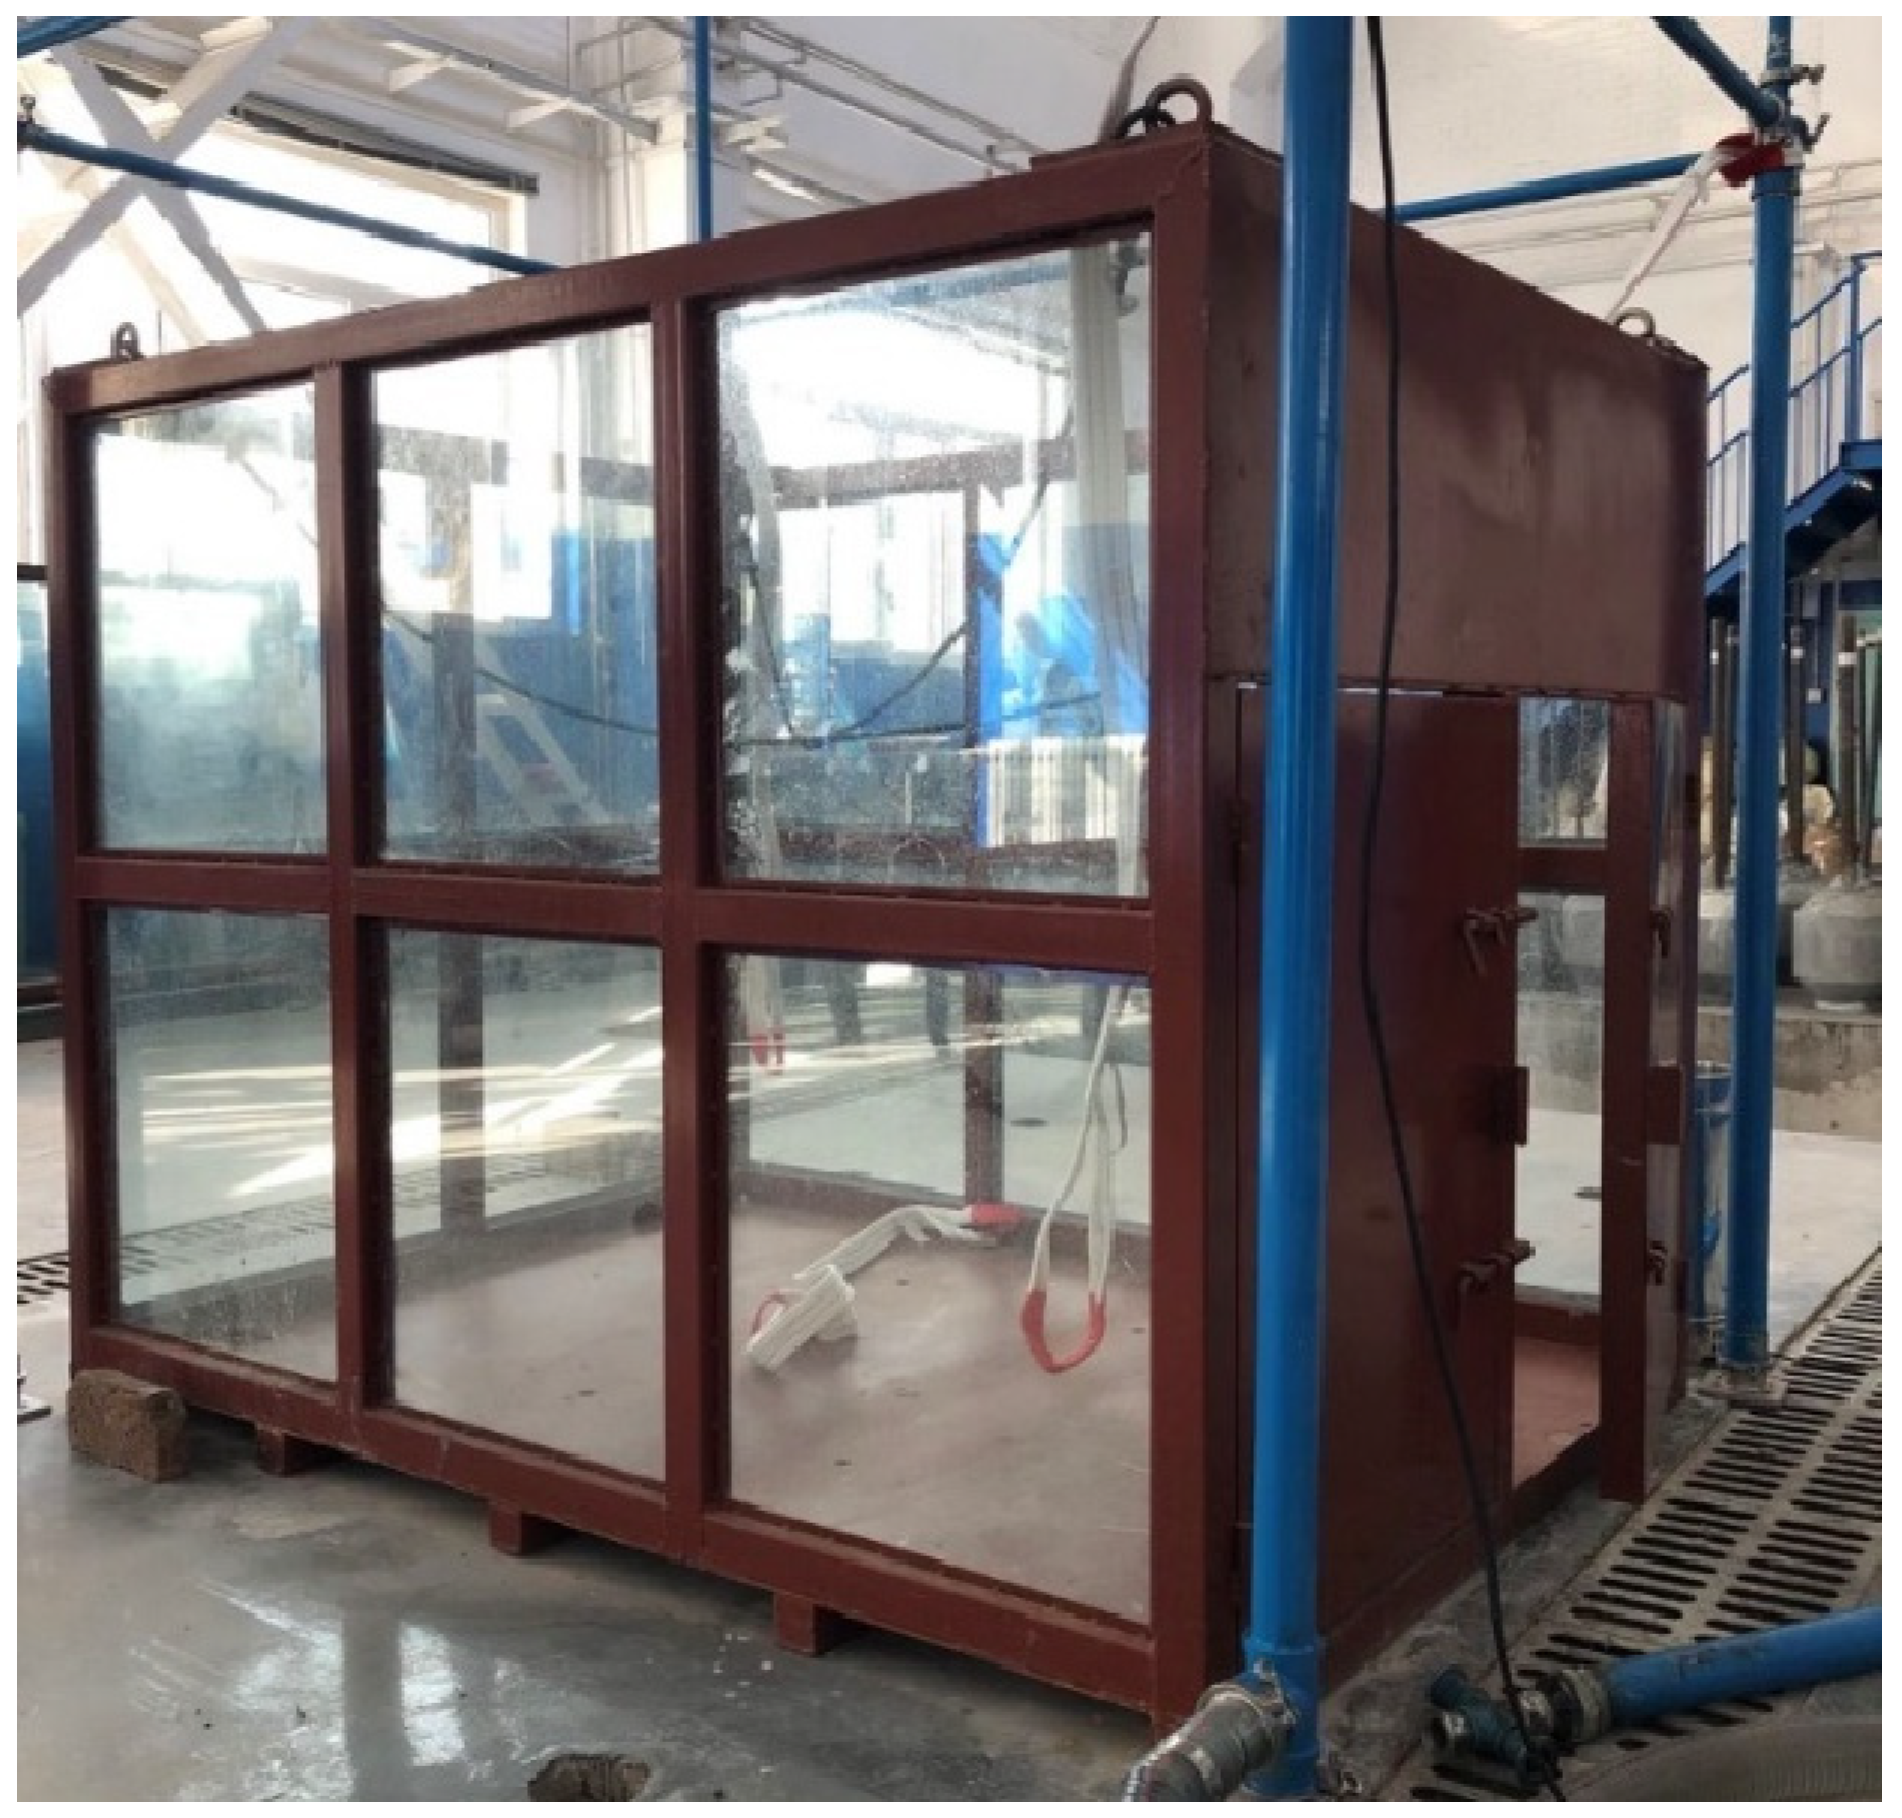
2.2. Model Test System of Overtopping

The system consisted of a water injection part, model flume, monitoring sensors, and an observation part, as shown in Figure 2. The water injection system was used to simulate rainfall during experiments and could be further used to control the water level in the pond.
The model tailings dam was arranged in a flume, as shown in Figure 3. The length, width, and height of the flume were 2.0 m, 1.5 m, and 1.5 m, respectively. Three sides of the flume were Plexiglas, which could facilitate the observation of rainwater infiltration and slope failure.

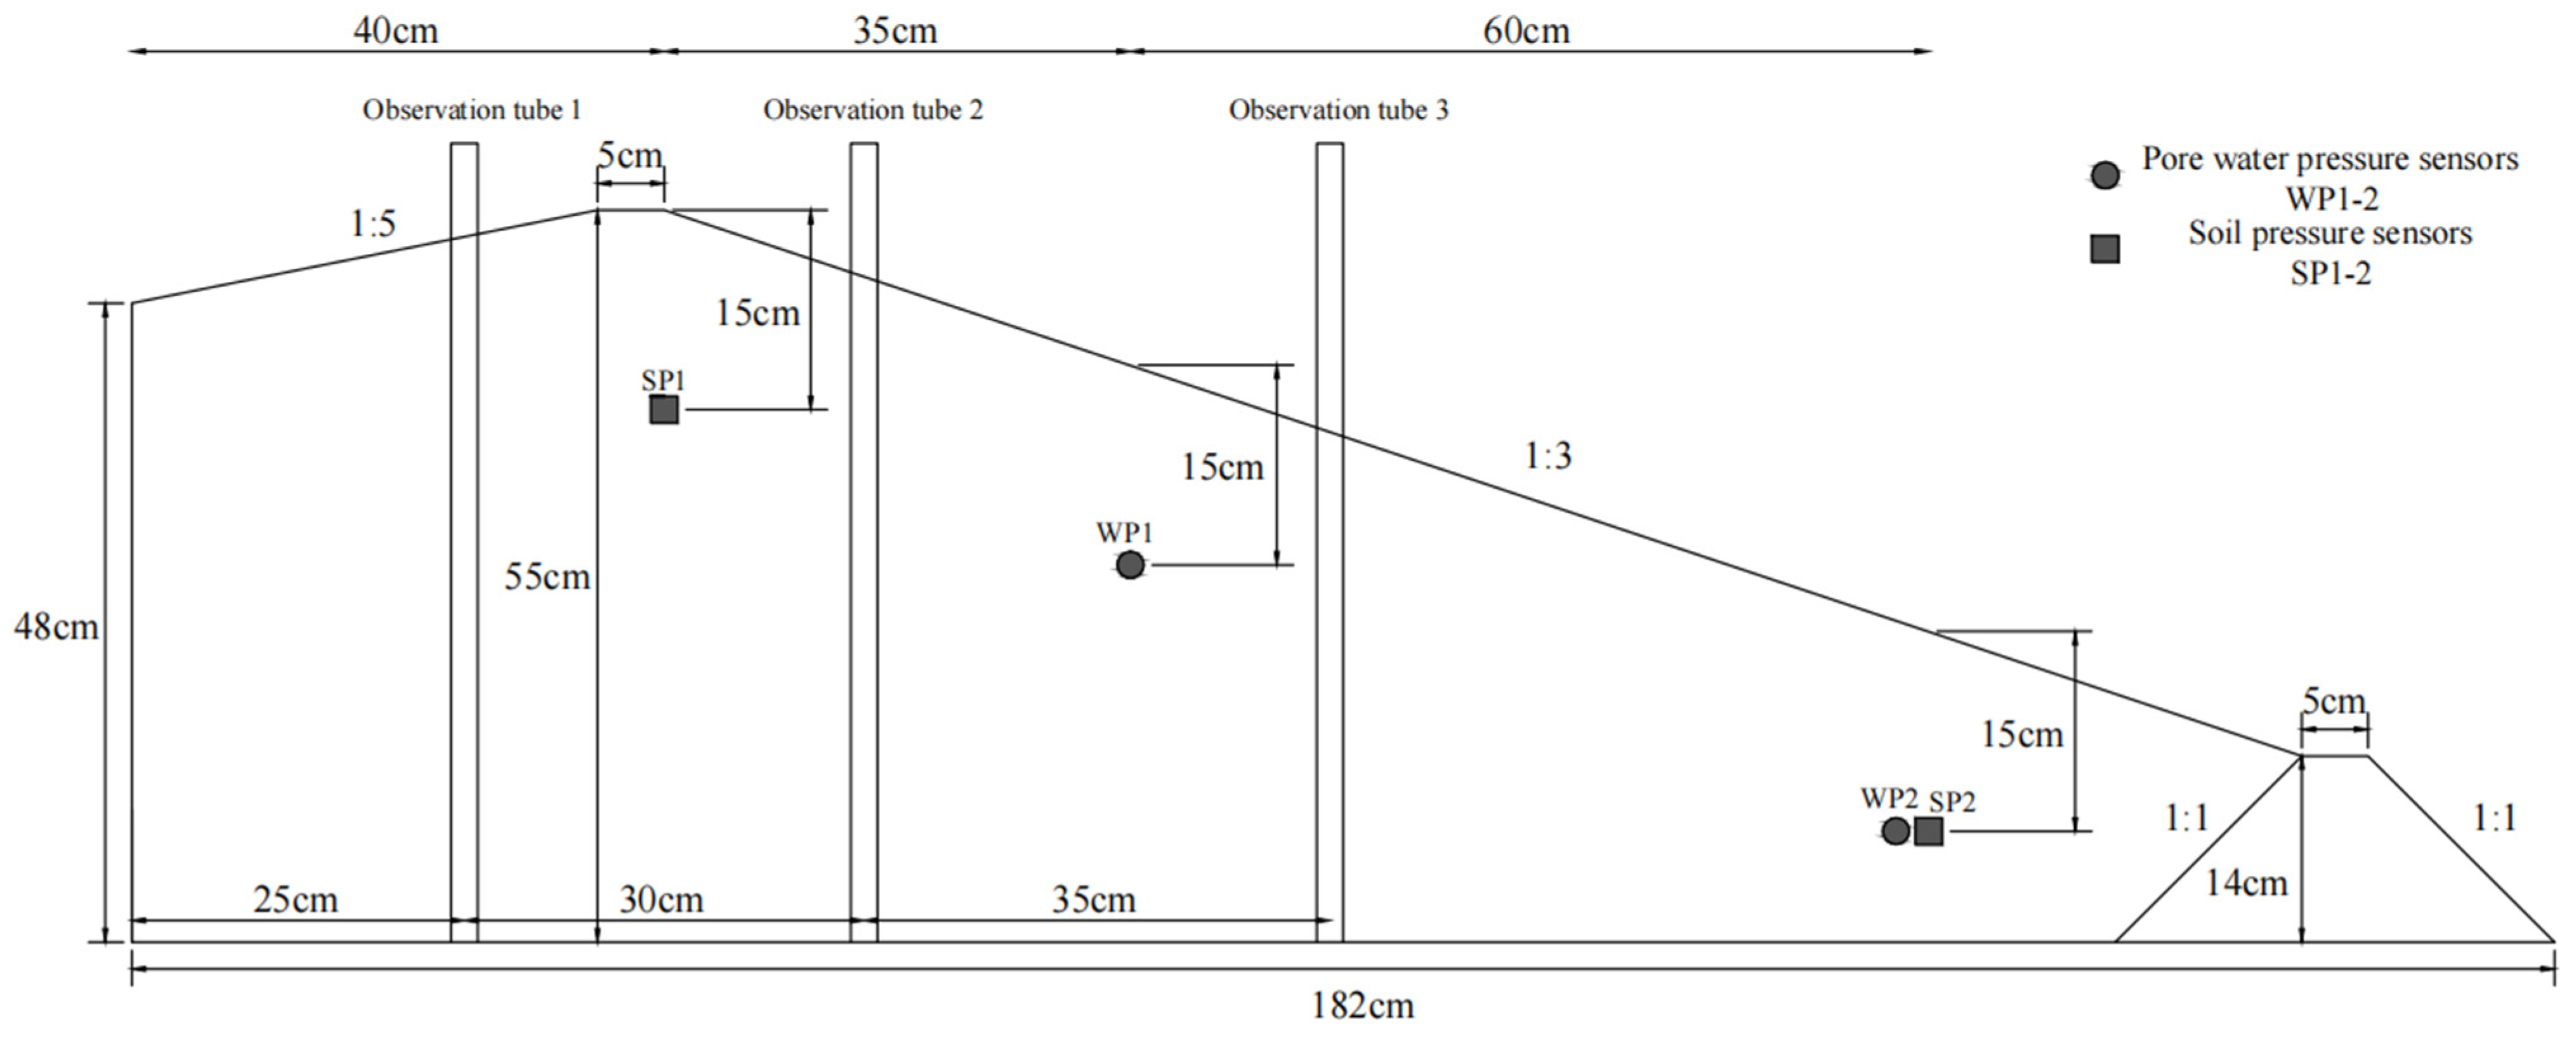
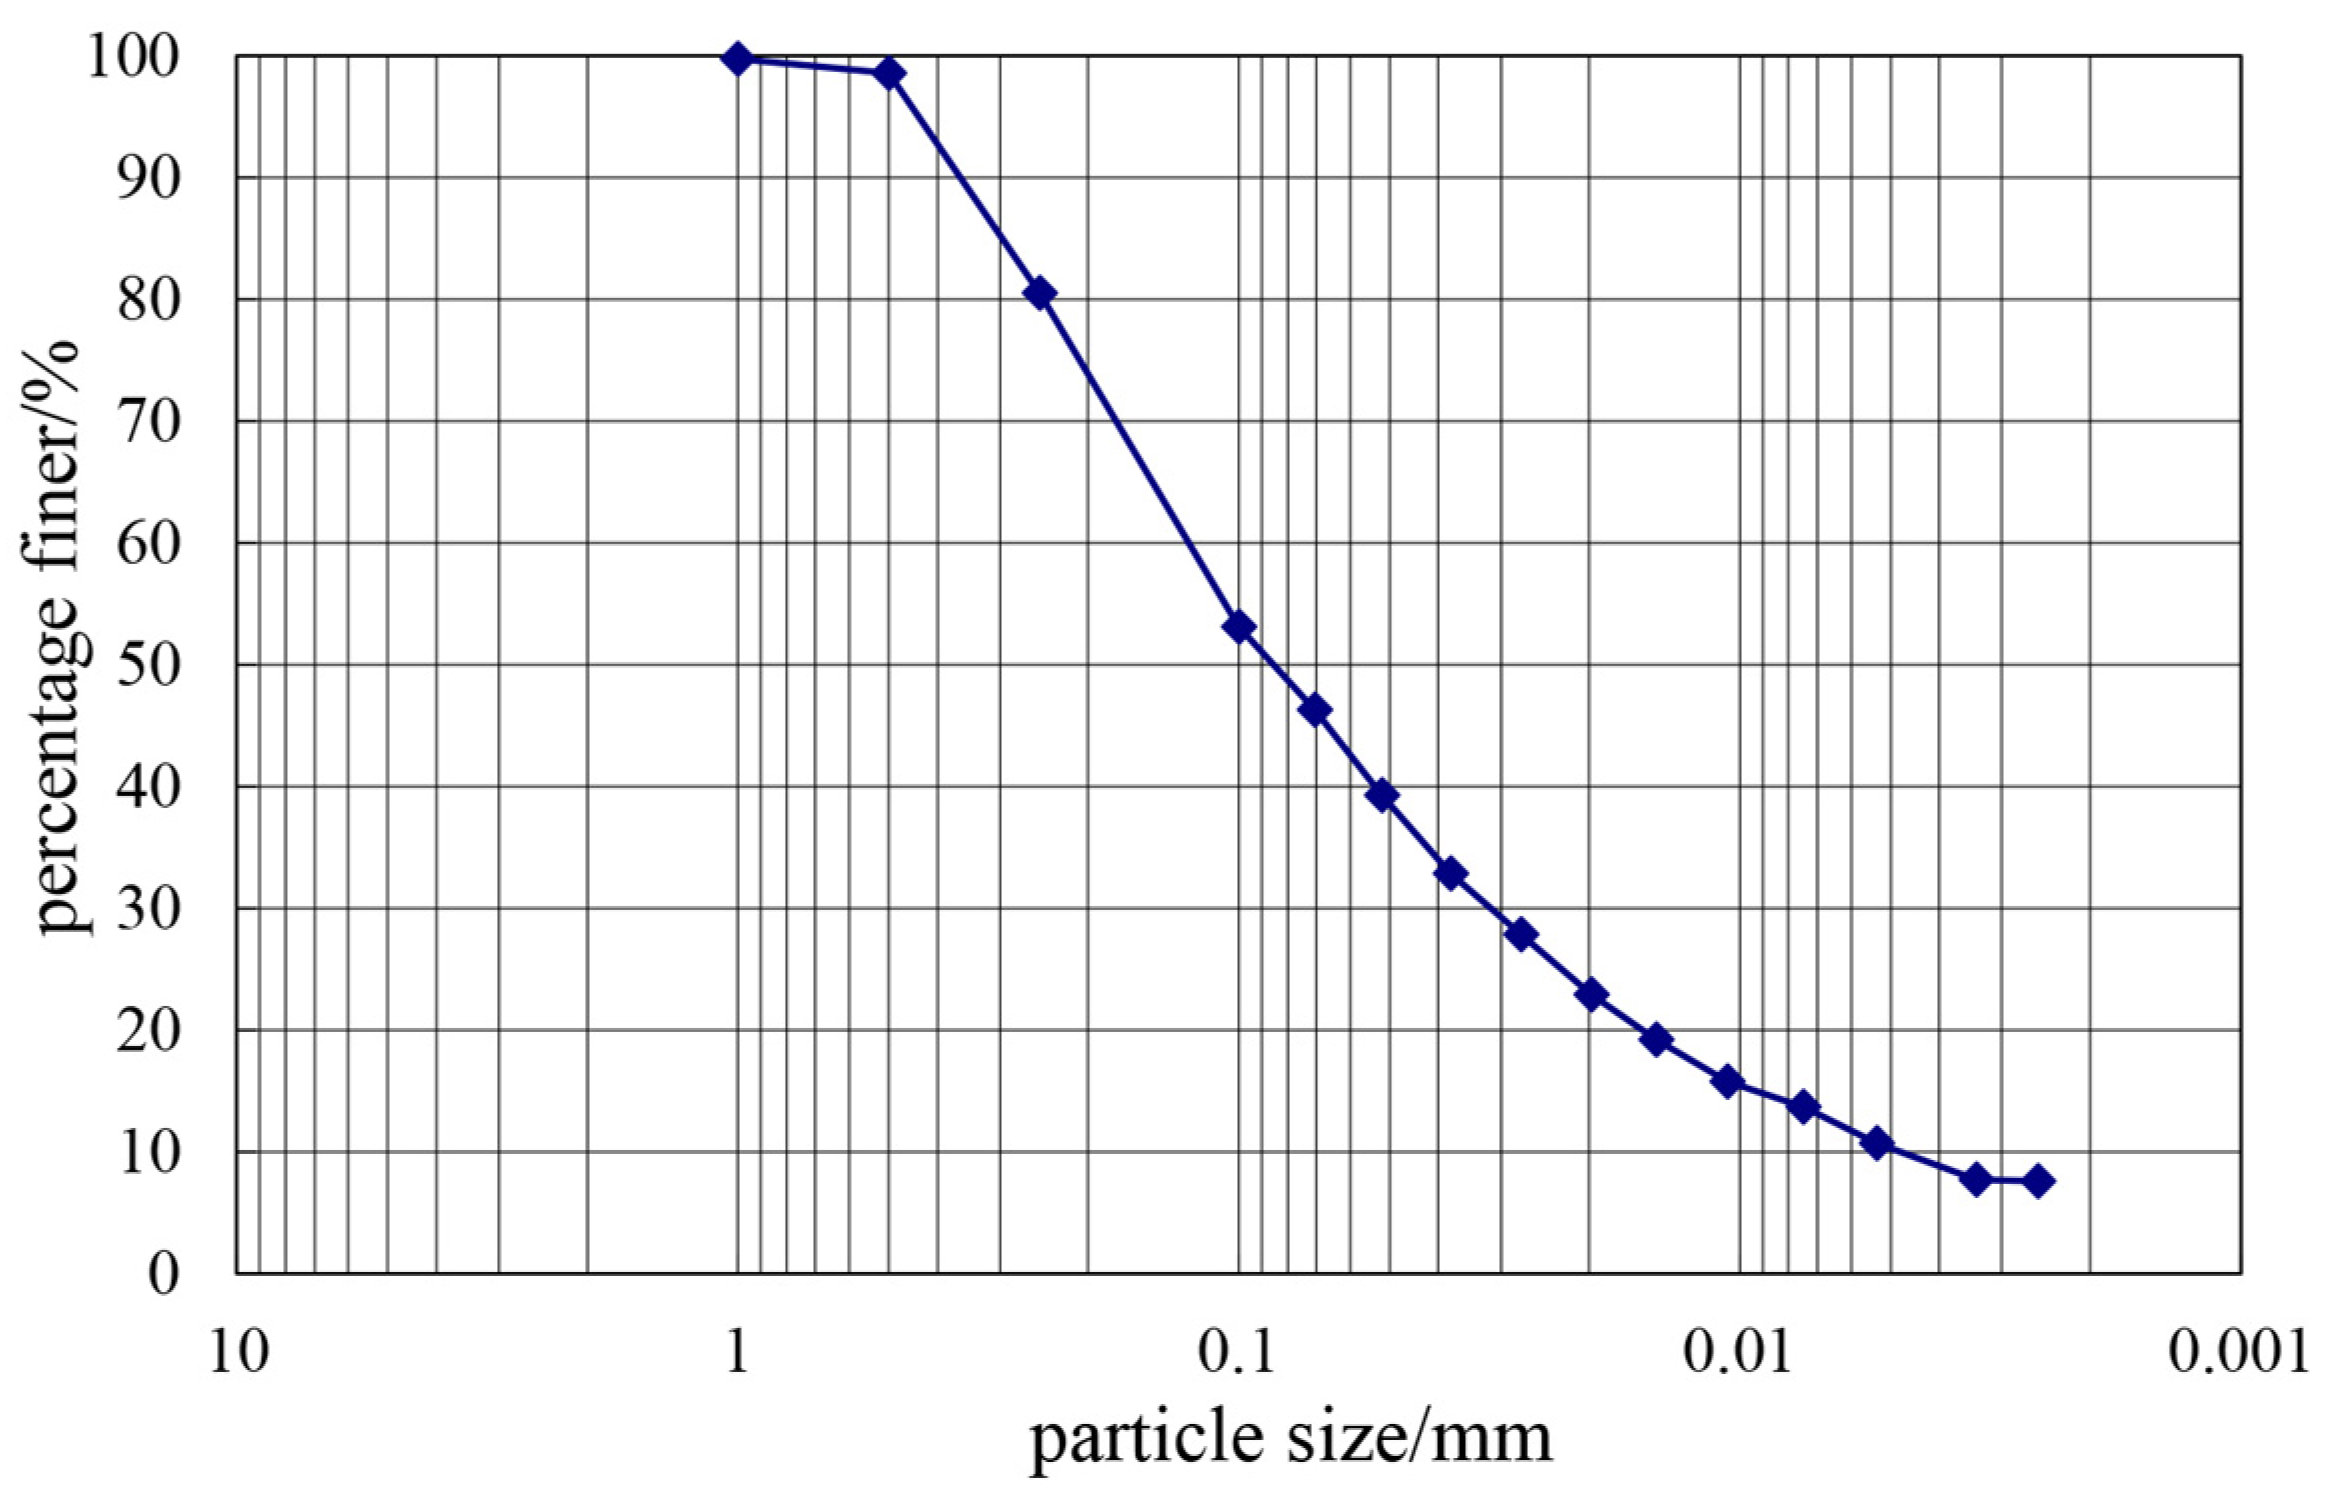
2.3. Tailings Dam Model

Given that the majority of damage to tailing ponds occurs in the dam area, this test specifically aimed to simulate the dam in tailing ponds. A reduced-scale model was adopted to intercept the dam part of the tailing pond, which was scaled down according to the scale of 1:150, and the similarity scale is shown in Table 1. The size of the model was 182 cm in length, 55 cm in height, and 65 cm in width. The external slope ratios of the stacked dam and the initial dam were 1:3 and 1:1, respectively, and the slope ratio of the deposited beach was 1:5, both of which were consistent with the prototype. The cross-section of the model dam is shown in Figure 4. The moisture content of the dry tailings used in the model was about 3%, and the dry density of the deposited tailings was 1.6 g/cm3. The physical properties are shown in Table 2, while the particle size distribution curve is shown in Figure 5. Before putting tailings sand into the flume, the tailing was thoroughly mixed with water in order to control the moisture content to a precise level of 12%. There were many ways to reduce the moisture content [27]. The technique of layered fill was employed to ensure that the compaction level of the model dam matched that of the prototype dam. Each layer had a thickness of 5 cm, and the weight of each layer when stacked was converted according to the dry density and volume of each layer. When stacking the model, each layer was uniformly compacted to the specified thickness to ensure that the dry density of the model dam was 1.6 g/cm3.

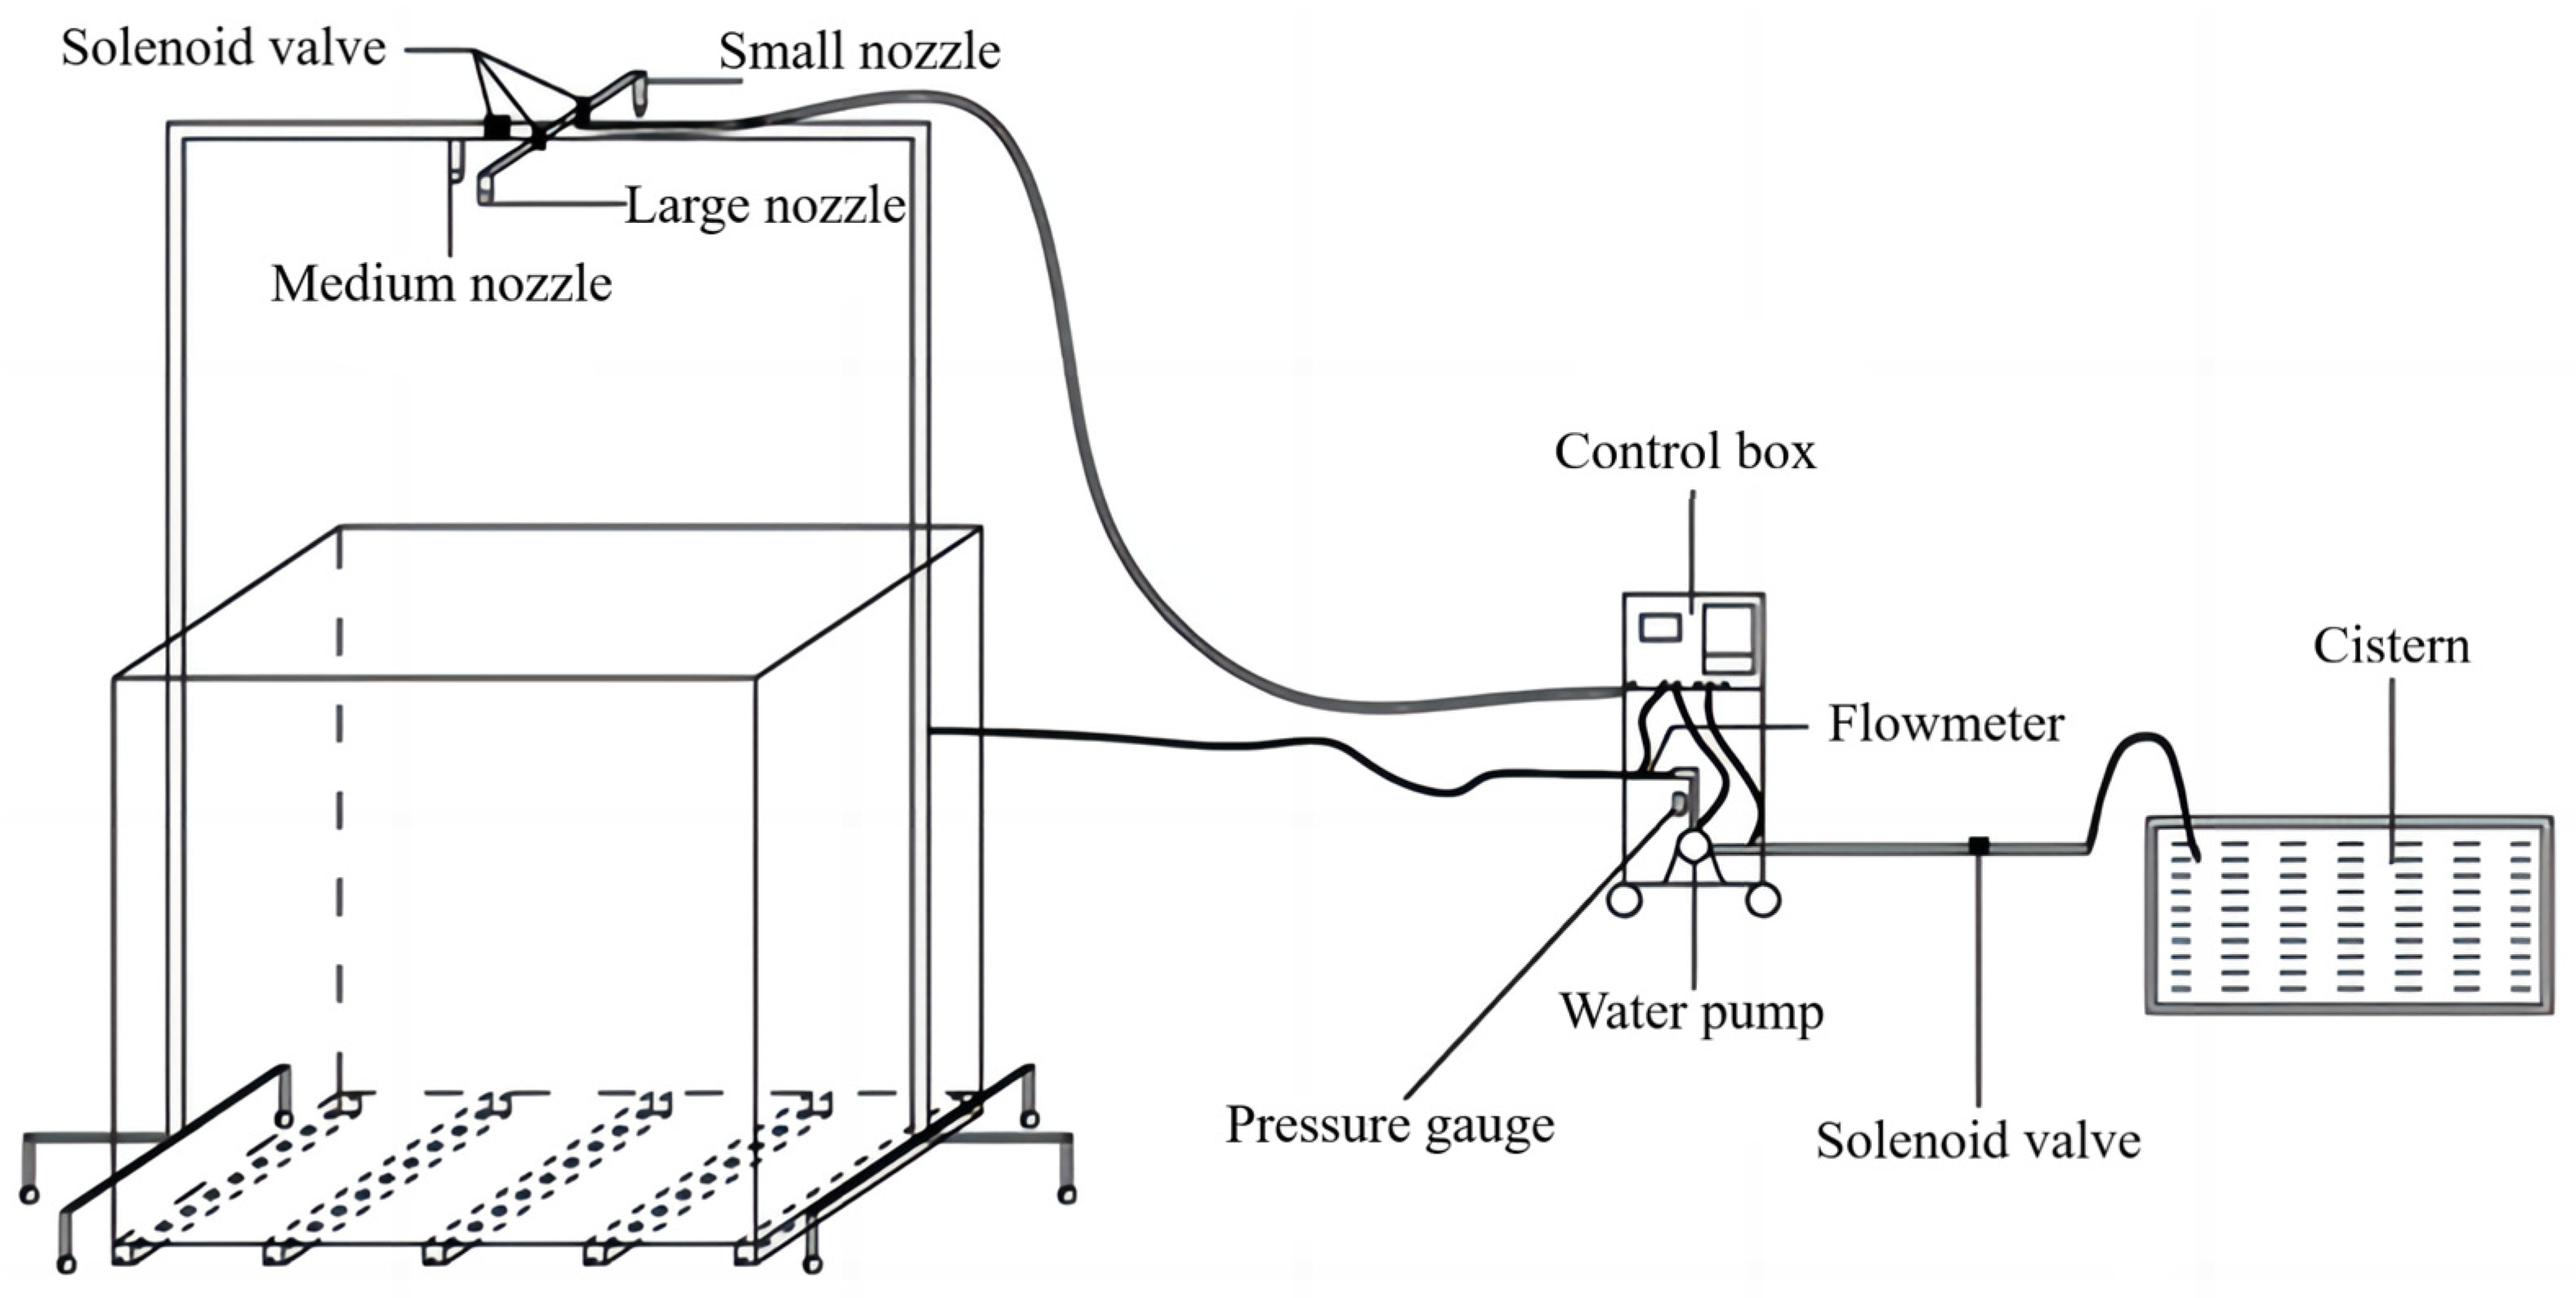
2.4. Water Injection Unit

The overtopping test needs to simulate the rainfall conditions. Thus, a water injection device was designed, as shown in Figure 6. The sprinklers above the model dam were used to regulate the direct input of rainfall into the pond area, with a controlled rate of 0.02 m3/h. When the water level in the pond reached the designed water level, the control box was adjusted to ensure that the water level remained constant.

2.5. Monitoring and Observation Unit
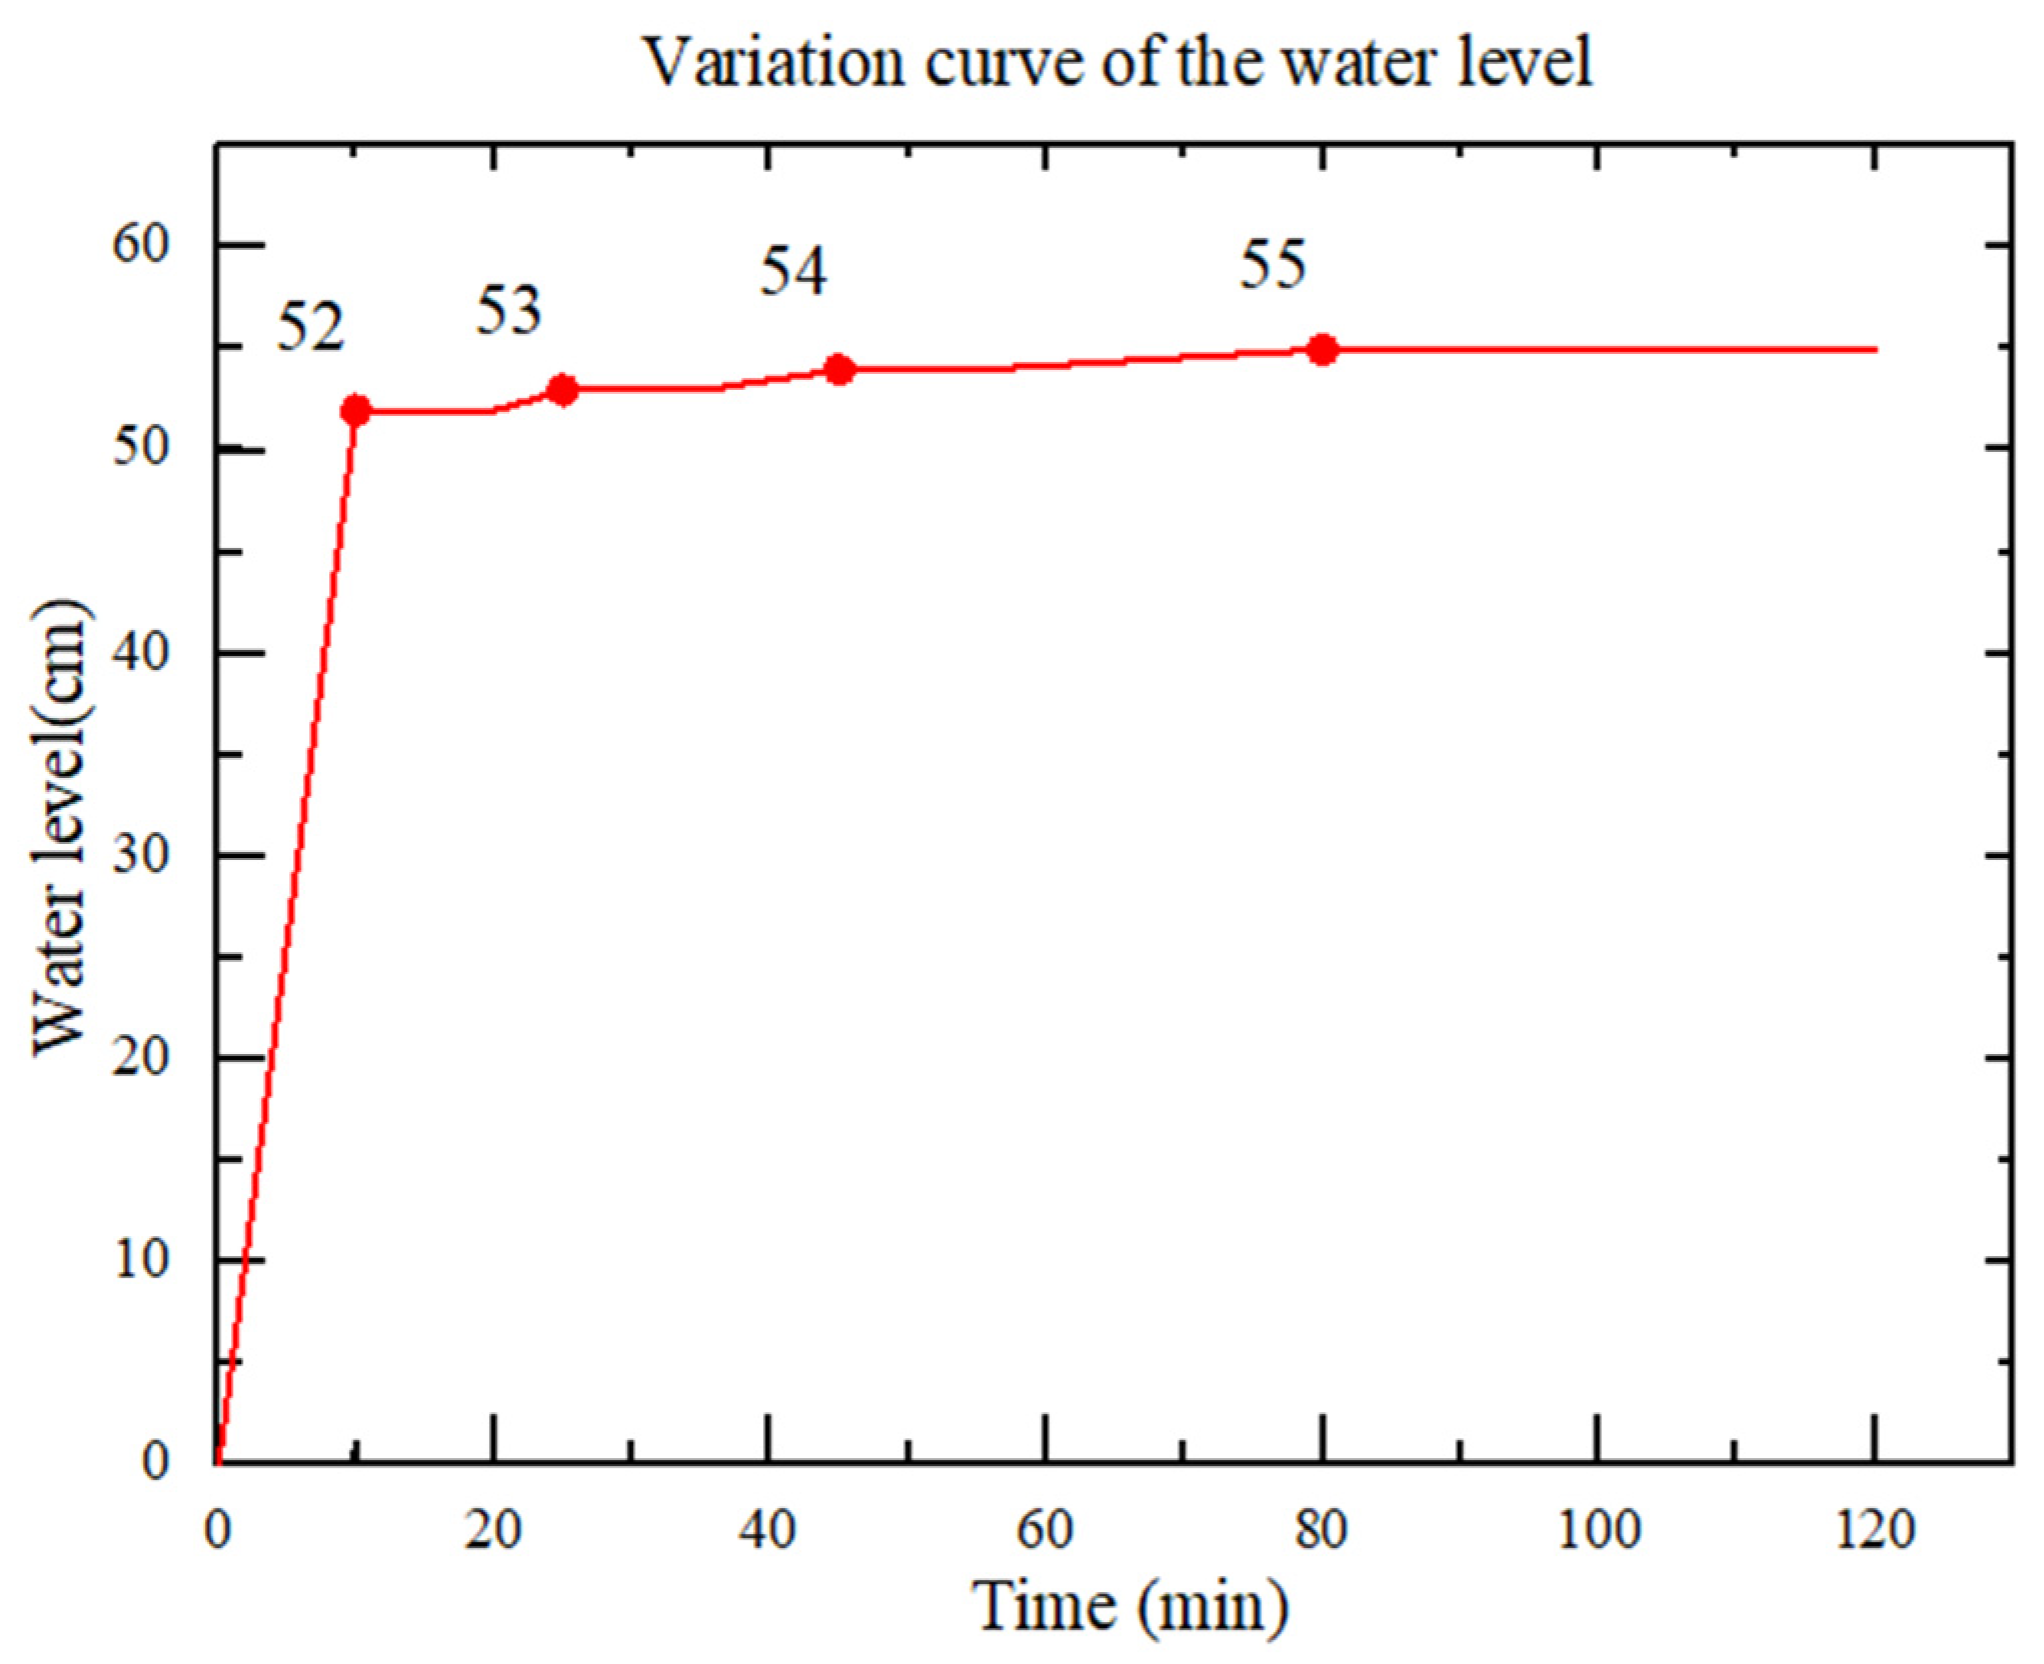
Three observation tubes were set up on one side of the model flume to monitor the seepage line in the model dam, as depicted in Figure 4. The observation tubes were all buried in the same horizontal plane, 25 cm, 55 cm, and 90 cm away from the left boundary of the flume. In order to avoid mutual influence between sensors, different sensors were buried at an interval of 5 cm, and the specific buried position of the monitoring sensors is shown in Figure 4. The observation unit was mainly used to record the whole evolution process of dam break. Three high-definition cameras were installed from the perspectives of front view, top view, and side view. Camera A was fixed in the middle of the beam at the top of the test chamber, which could capture the failure dynamics of the dam surface completely. Camera B was fixed downstream of the test system, 3 m away from the flume. Camera C was fixed at 1.5 m downstream of the test system and 1.5 m away from the left boundary of the flume, as shown in Figure 2.

2.6. Test Procedure

The physical model test assumed that the drainage facilities of the tailings pond were unable to effectively release floodwater. Through continuous rainfall, water accumulated in the pond, causing the water level to rise above the dam crest and leading to flood overtopping and dam failure. The specific test procedures were as follows:
(1) Model dams were stacked in layers in the flume according to the given dry density.
(2) Cameras were positioned at the corresponding spots and grid lines made of chalk ash were drawn across the whole surface of the dam at equal intervals. By means of grid lines on the dam surface and cameras, the damage dynamics of the dam surface could be continuously tracked.
(3) Prior to the test, the physical model lacked any water. The flow rate remained constant during the rainfall event in the pond area.
(4) The experiment involved incrementally introducing rainfall into the pond. Once the water level in the pond reached heights of 52 cm, 53 cm, and 54 cm, it was kept at each height for around 10 min. Seepage line measurements were taken at 5 min intervals.
(5) The dam break test started when the water level reached a measurement of 54 cm. Continued rainfall with a flow rate of 0.02 m3/h persisted until the floodwater overtopped the top of the dam and caused it to breach. The variation curve of the water level is shown in Figure 7.
(6) The monitoring data of various sensors and video data of three different cameras were collected during the whole test process.

3. Analysis of Test Results

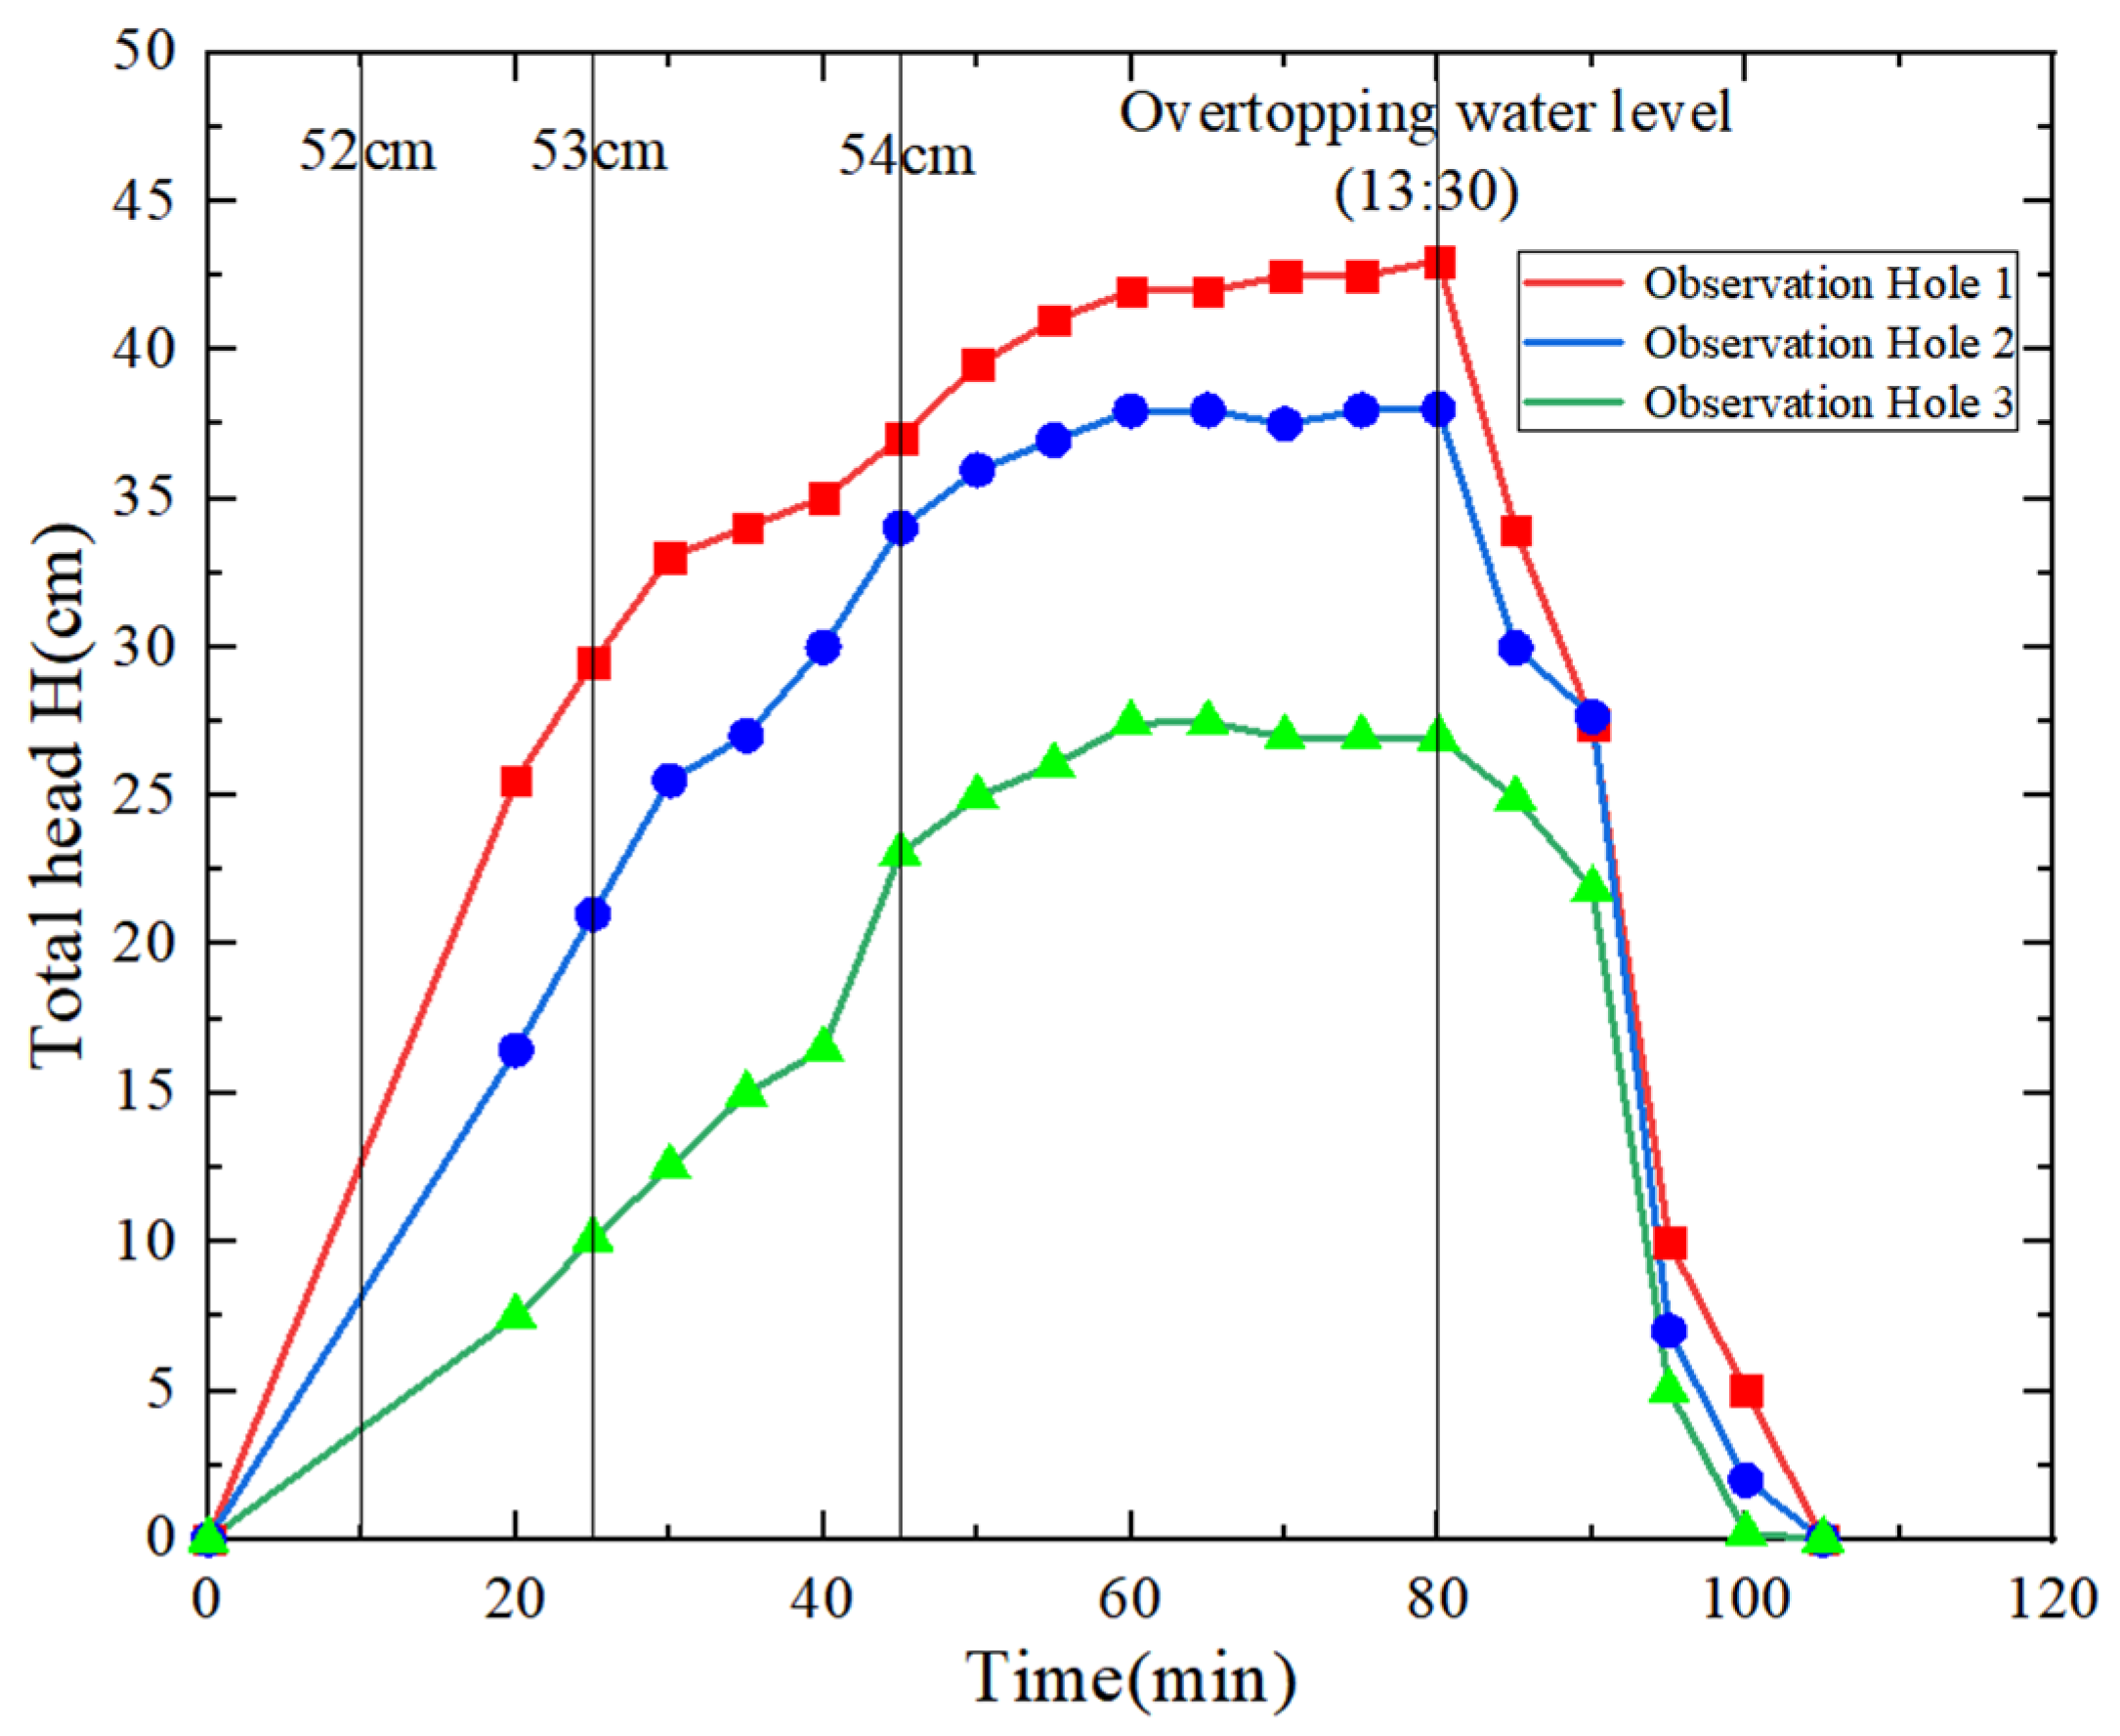
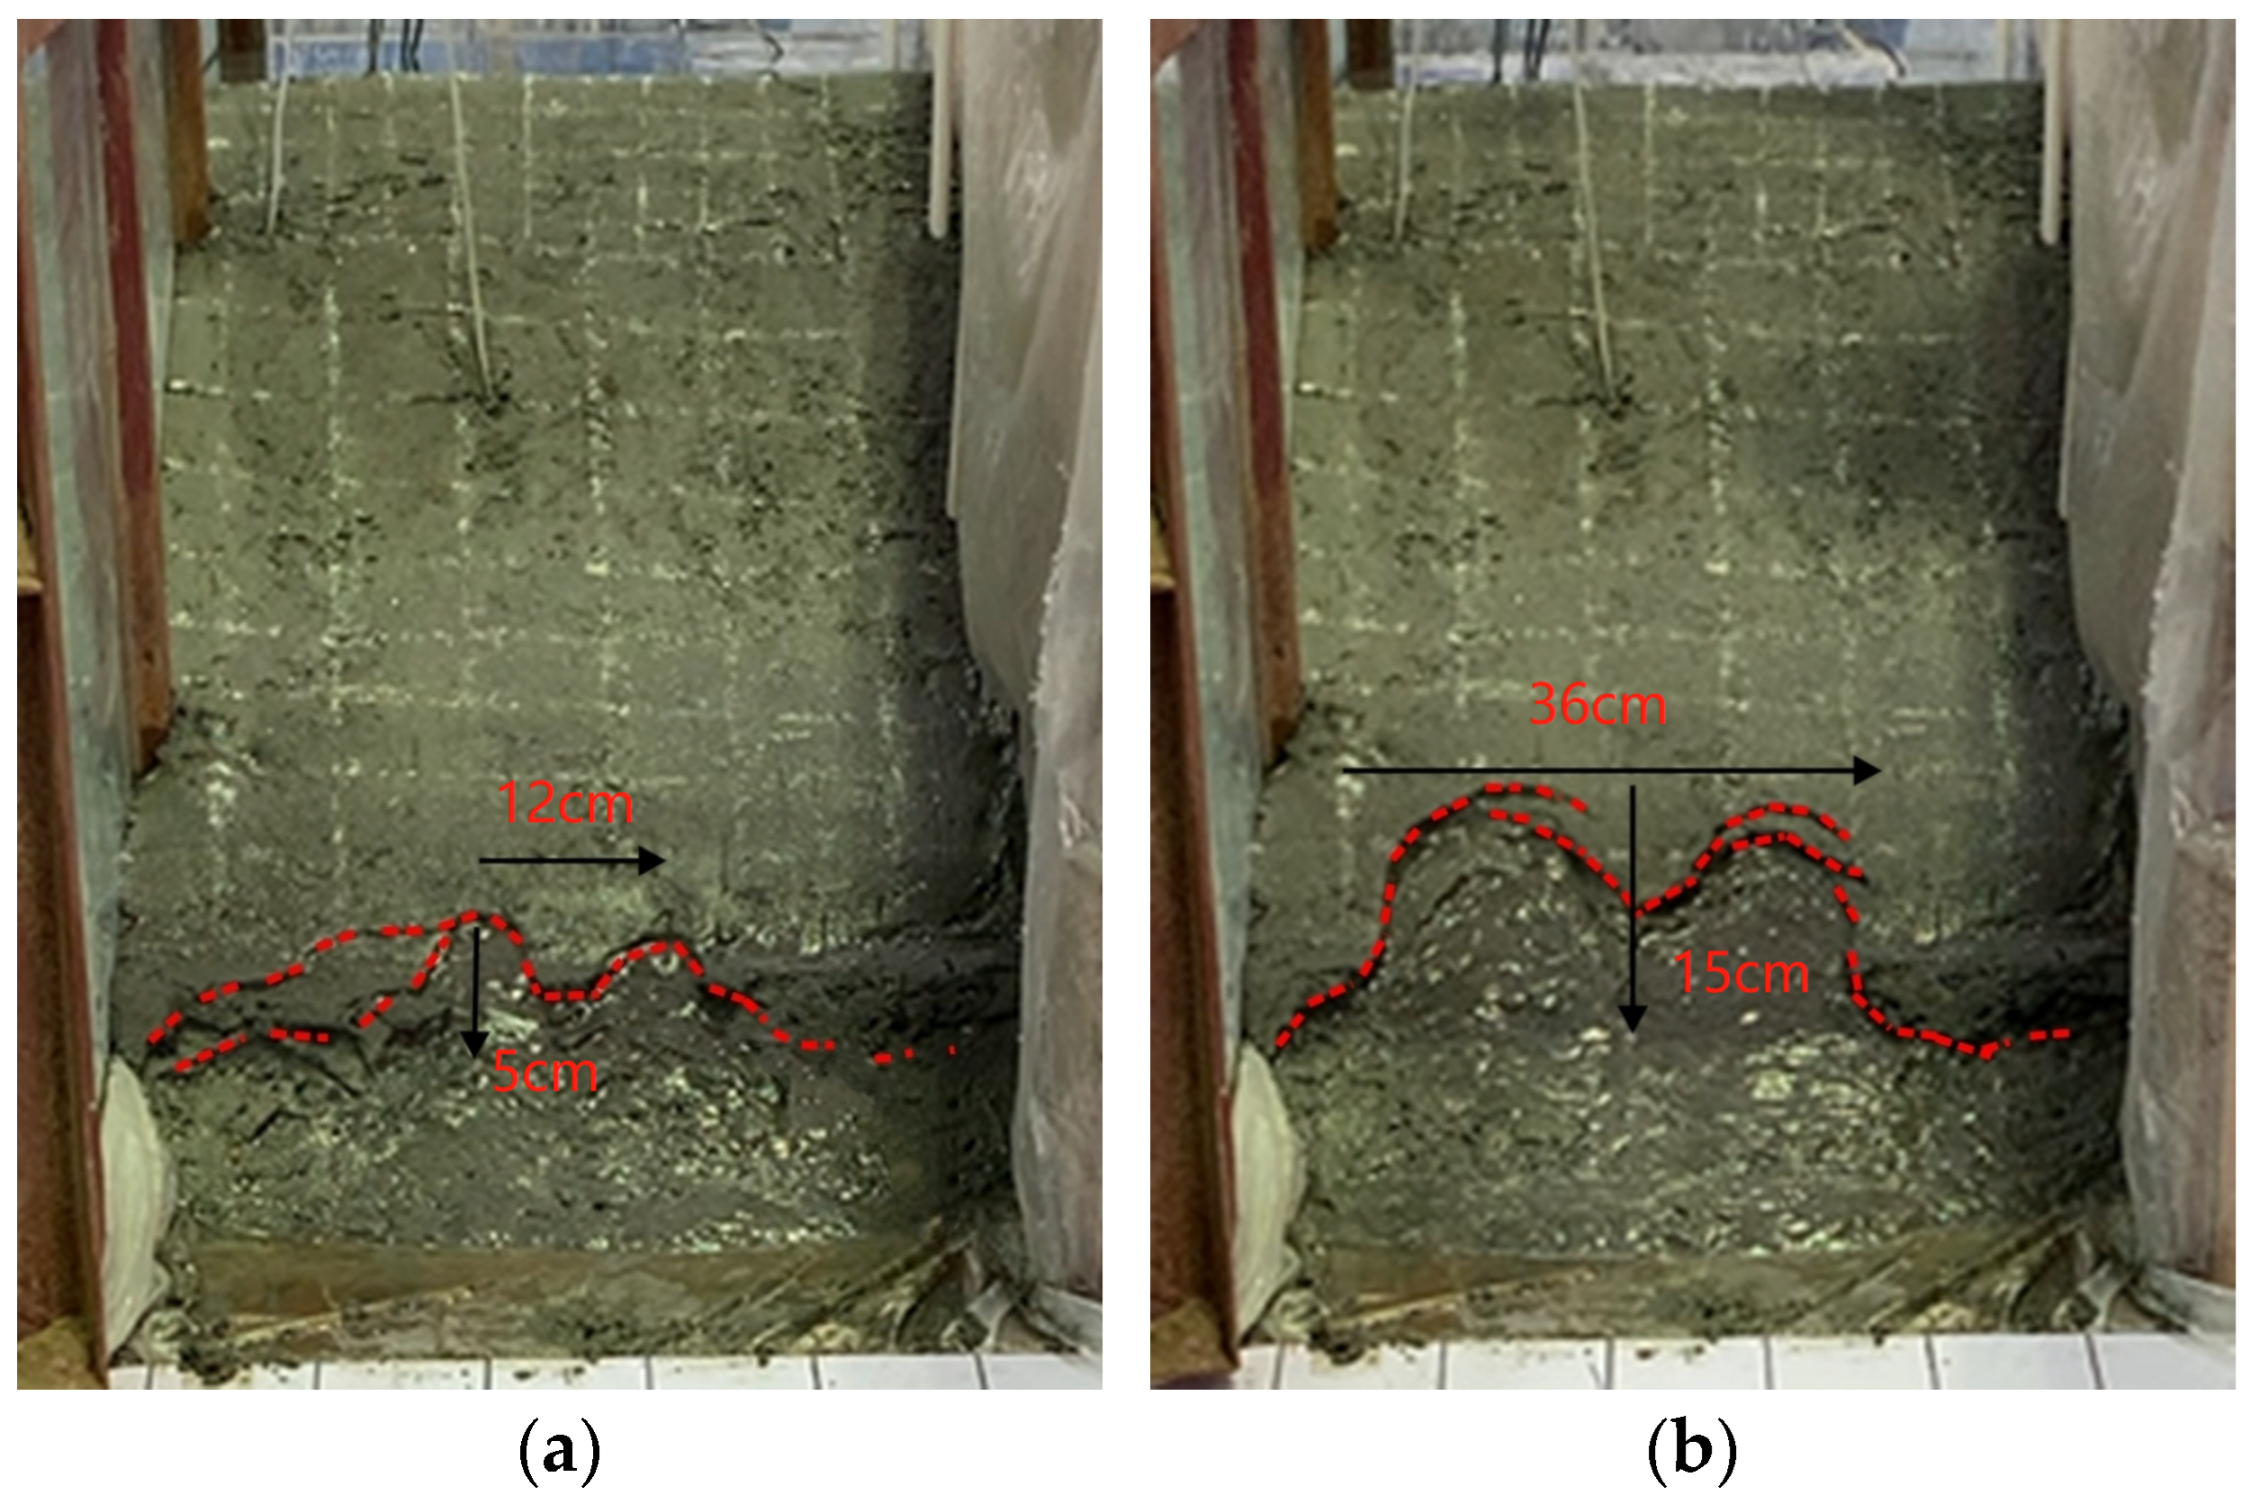
3.1. Variation Characteristics of Seepage Line

During the rise in water level, variation in the water level in each observation tube with time was recorded, and the variation curve is shown in Figure 8. As can be seen from Figure 8, as the water level in the pond rises, the water level in each observation tube basically rises at different speeds. During rainfall, the water level at observation tube 1 was measured 10 min after the test began, and it was found to be 12 cm. In comparison, the water level in the pond was 52 cm. The water level in observation tube 2 was 8 cm, while in tube 3 it was 3 cm. The water level in various observation tubes was still rising, indicating that seepage in the model dam had not yet reached a steady state at this point.
After the water level in the pond reached 54 cm, the seepage line measured by the three observation tubes remained rather constant. The measurements were 42 cm, 38 cm, and 27 cm. This indicates that a steady seepage rate was achieved in the model dam. After eighty minutes from the beginning of the experiment, the model experienced a breach in which water overflowed, and subsequently, there was a swift decrease in the water level at each observation tube during the next twenty minutes until the experiment concluded.
The seepage lines of the model dam were drawn at different periods using the water level data from the three observation tubes and the model boundary, all represented in the same coordinates. Figure 9 shows the variation diagram of the seepage lines in the model dam at various time intervals. Figure 9 clearly demonstrates that, during the initial phase of the test, the seepage line exhibited a fast increase as the upstream water level rose. The alteration in the upstream water level induced a modification in the seepage field of the dam, resulting in a transition from one stable state to another. This transition between stable states took place over a specific time span, characterized as the lag effect [28]. After the water level stopped rising, due to the lag effect, the upward lifting speed of the seepage line slowed down significantly (from 50 min to 70 min, as seen in Figure 9), and then maintained a certain burial depth. After 50 min of the test, most of the dam tended to be saturated and the matrix suction decreased. Approximately 80 min after the test, a breach in the model dam occurred in an overflow, causing a sudden and significant dip in the seepage line.

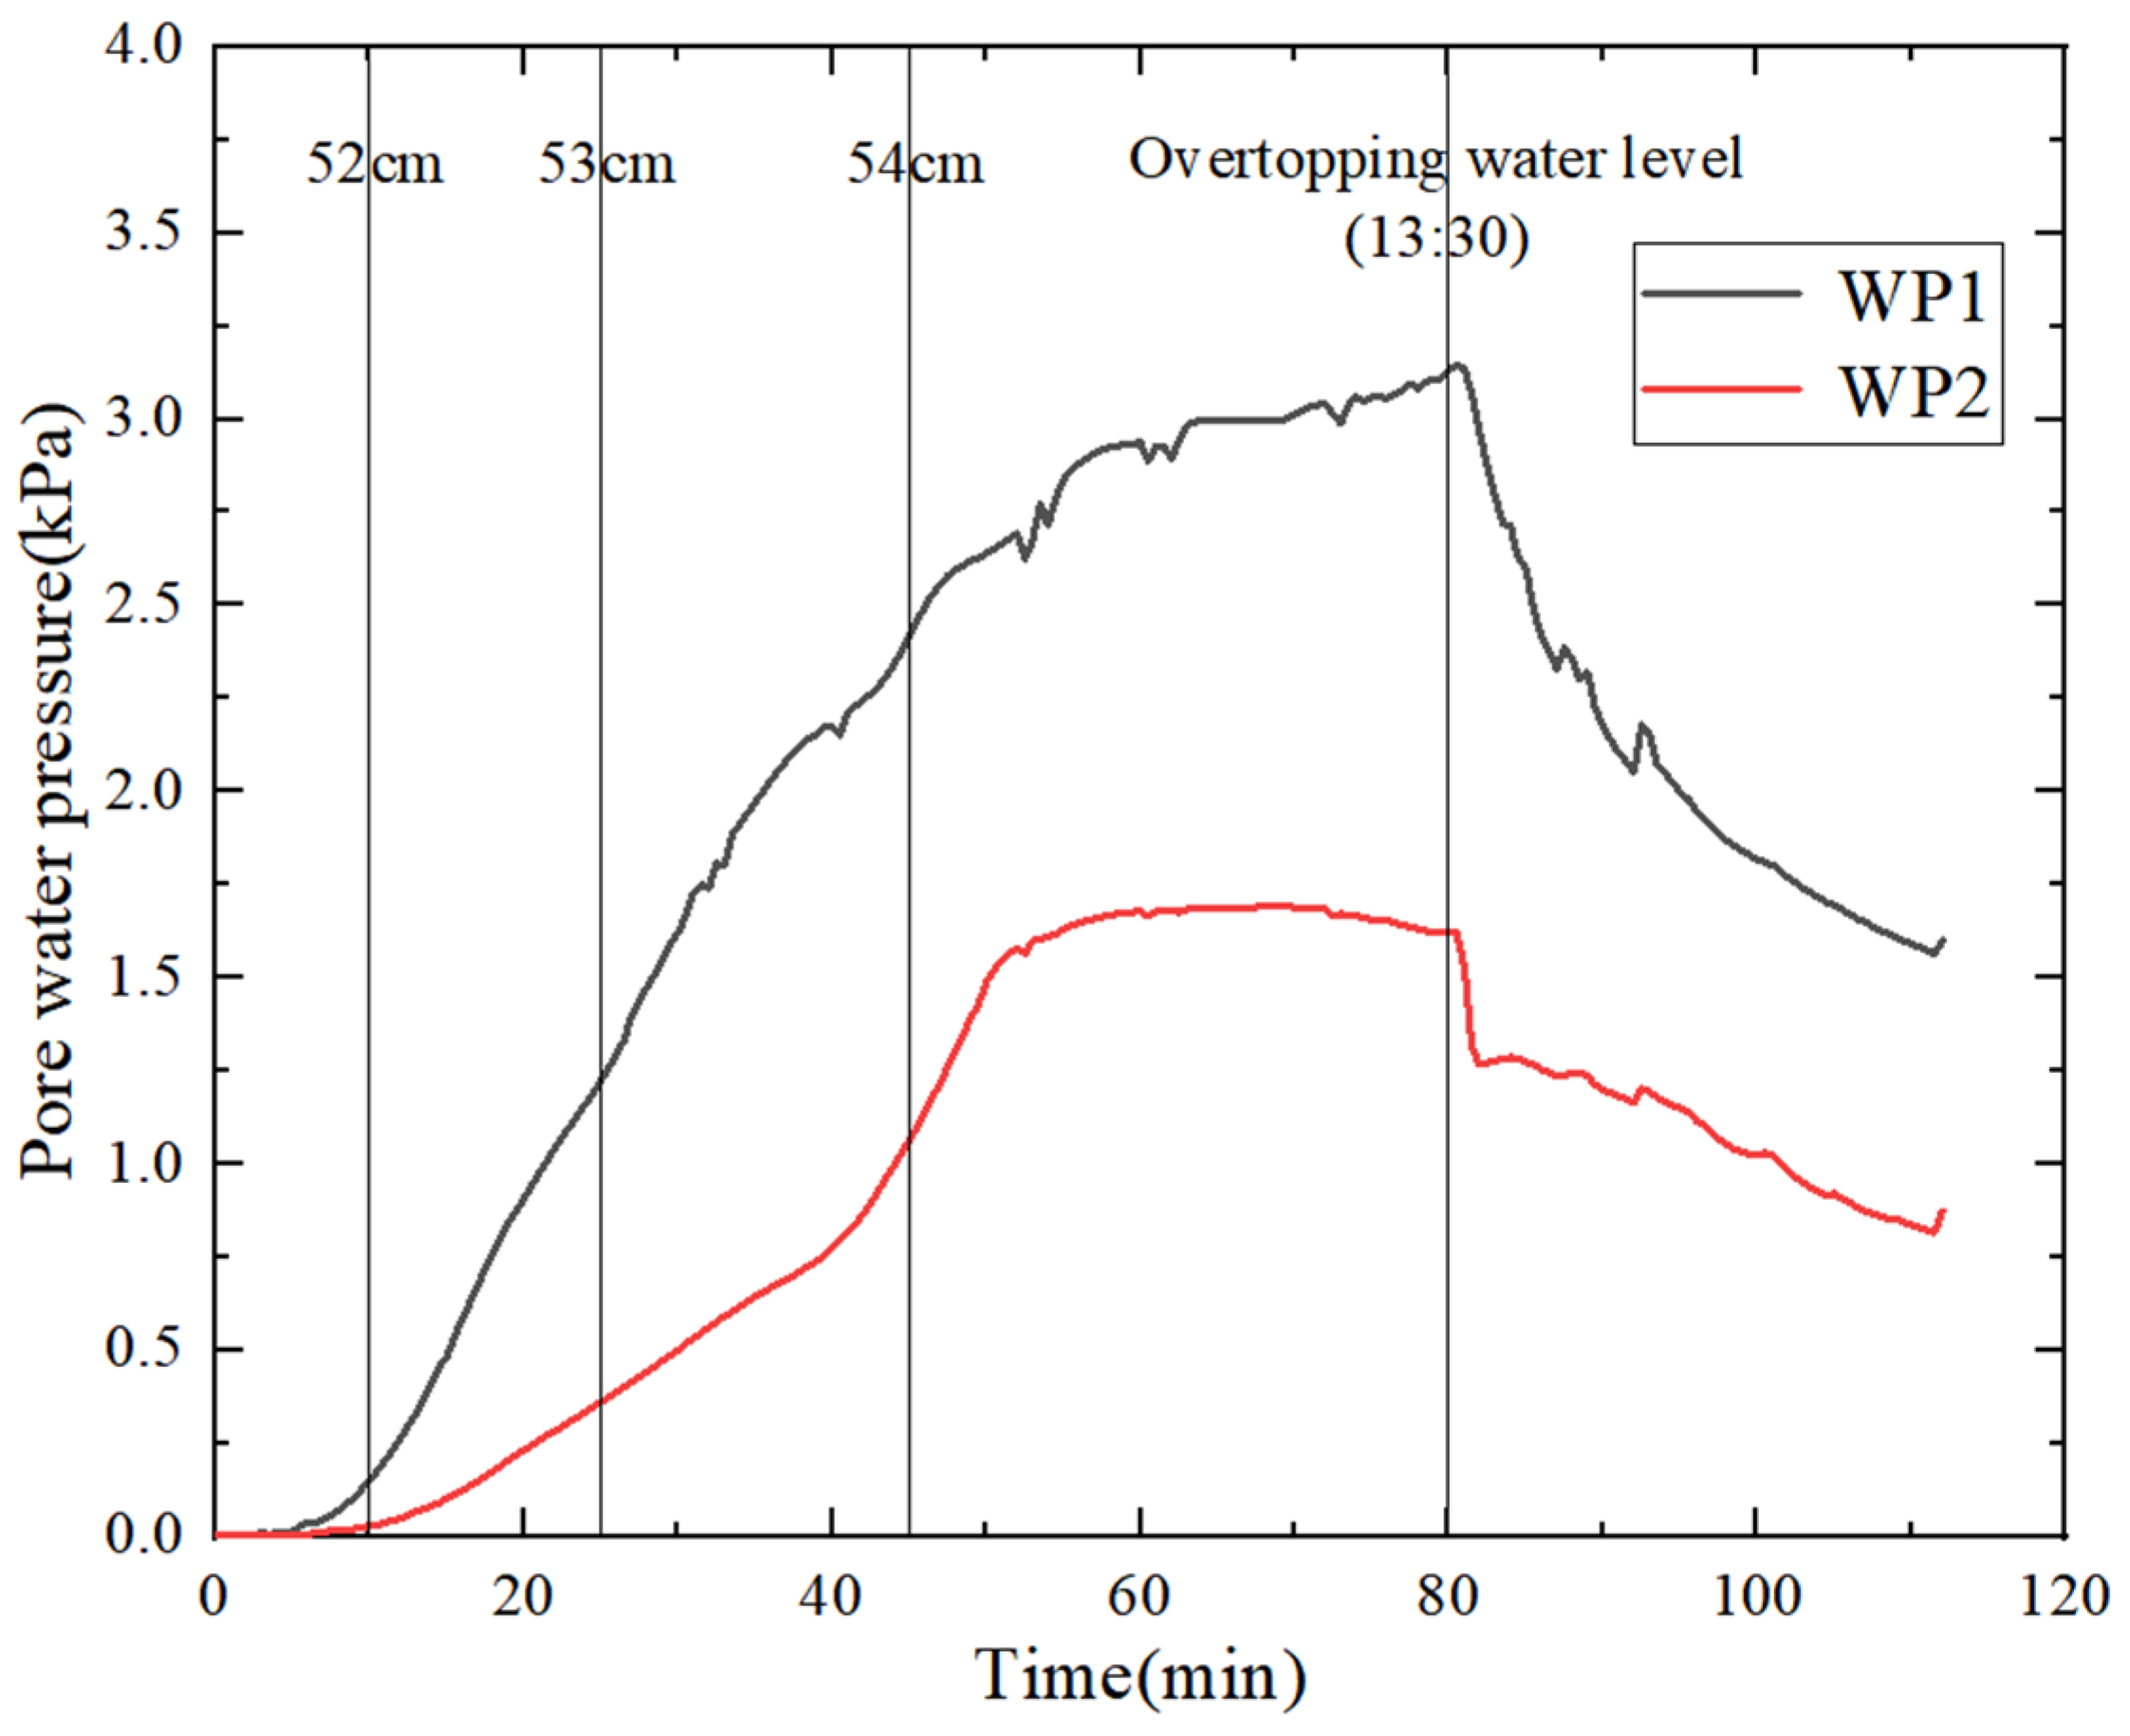
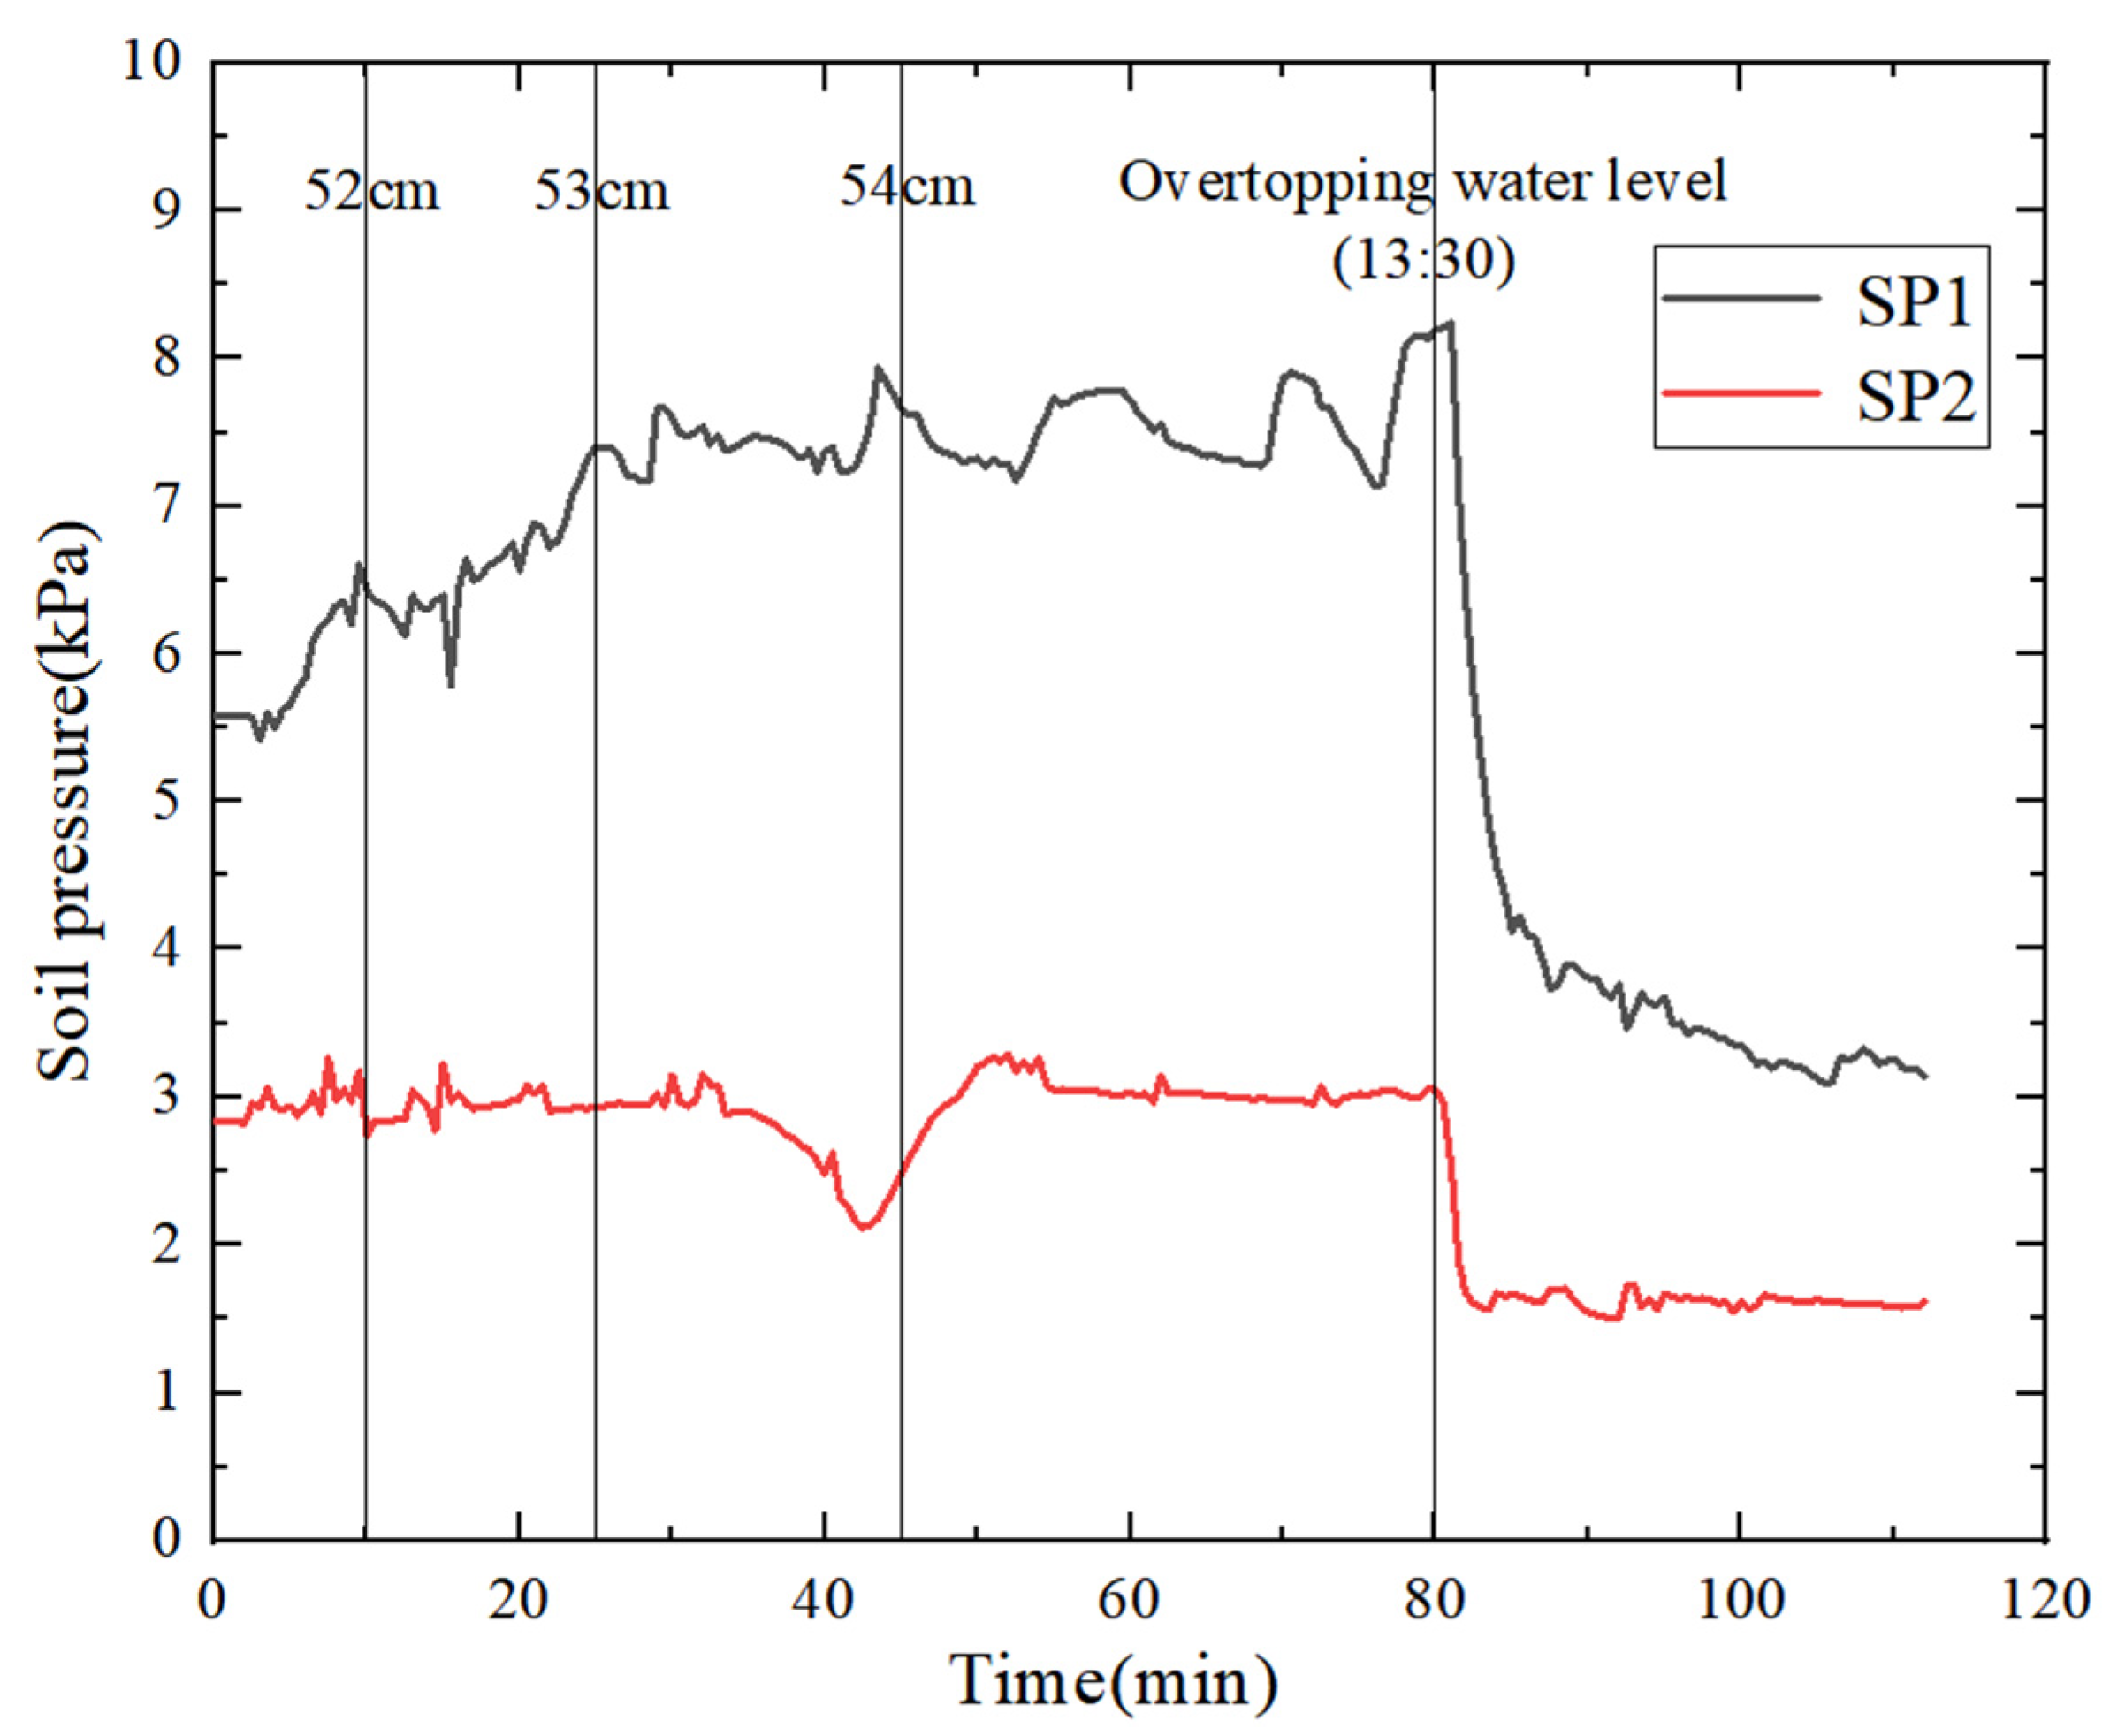
3.2. Variation Characteristics of Pore Water Pressure and Soil Pressure

A total of four sensors in two groups were used in this test, including two pore water pressure sensors and two soil pressure sensors. The sensor layout diagram is shown in Figure 4. The total duration of the test was approximately 120 min. The above sensors collected data every 30 s, and the data collected by each sensor are shown in Figure 10 and Figure 11.
It can be seen from Figure 10 that the pore water pressure showed the characteristics of slowly rising, tending to be stable, and then rapidly decreasing after dam break. The pore water pressure at WP2 exhibited a substantial delay compared to WP1. This can be attributed to the shallow burial depth and distance of the WP2 sensor from the pond region. Additionally, the model dam had unstable seepage due to rainfall. When the overtopping water level was reached, the pore water pressure at the measuring point WP1 was about 3.1 kPa, which was consistent with the static pore pressure at the location.
The measuring point WP1 first reached about 2.9 kPa at a rate of about 48 Pa/min at 60 min after the test, and then the pore water pressure no longer increased significantly. When rainfall began at 75 min, the pore water pressure gradually increased until it reached its maximum value. After 80 min, the dam began to break, and the water pressure at the measuring point WP1 dropped to 1.6 kPa at a rate of 43 Pa/min.
With the progress of the test, the seepage line began to move toward the initial dam. The measuring point WP2 reached a stable value of about 1.5 kPa at 50 min of the test. There were approximately two stages of rising water pressure: the first stage was from 10 min to 45 min. After 45 min of the test, the water level in the pond reached 54 cm, and the water pressure at the measuring point WP2 was about 1 kPa. At this stage, the water pressure rose at a rate of about 25 Pa/min, and then the water level in the pond remained unchanged. The second stage was from 45 min to 50 min, during which the pore water pressure increased to 1.5 kPa at a faster rate of 100 Pa/min. This indicates that the seepage in the dam was slightly delayed compared to the uplift of the water level in the pond. With gradual infiltration, the matrix suction of tailings decreased, but the pore water pressure increased at a faster rate. Subsequently, the model dam reached a state of near saturation, causing the pore water pressure to stabilize and no longer fluctuate with the increase in water level. The rainfall started at 75 min and peaked at 80 min. Then, the pore water pressure also reached the highest value of about 1.6 kPa at the same time. After a duration of 80 min, the dam began to break, causing a gradual decline in water pressure at the measuring location at a rate of around 120 Pa/min. Approximately three minutes after the dam burst, the water pressure at monitoring site WP2 experienced a decline at the rate of 15 Pa/min, eventually reaching a stable value of 0.81 kPa.
In summary, the pore water pressure increased gradually along the depth direction of the model dam. During the process of seepage in the dam, the variation in pore water pressure had a lag of about 5 min relative to the change in water level in the pond.
Figure 11 shows the variation curve of soil pressure at each measuring point. The variation trend of soil pressure at measuring points SP1 and SP2 was basically the same as the tendency of pore water pressure. The soil pressure fluctuated slightly before the dam break and plummeted sharply after the dam break.
The initial value of soil pressure at the SP1 was 5.5 kPa. The soil pressure progressively escalated over time, reaching a peak value of 8.2 kPa before the occurrence of a dam break. With the seepage of rainwater into the dam, the moisture content of the tailings gradually increased, and the tailings sand gradually transited from natural weight to saturated weight, reaching the highest value of soil pressure when the water level reached its highest point. After dam break, the measuring point of SP1 first dropped to 4 kPa at a rate of 420 Pa/min and then dropped to 3.1 kPa at a rate of 36 Pa/min.

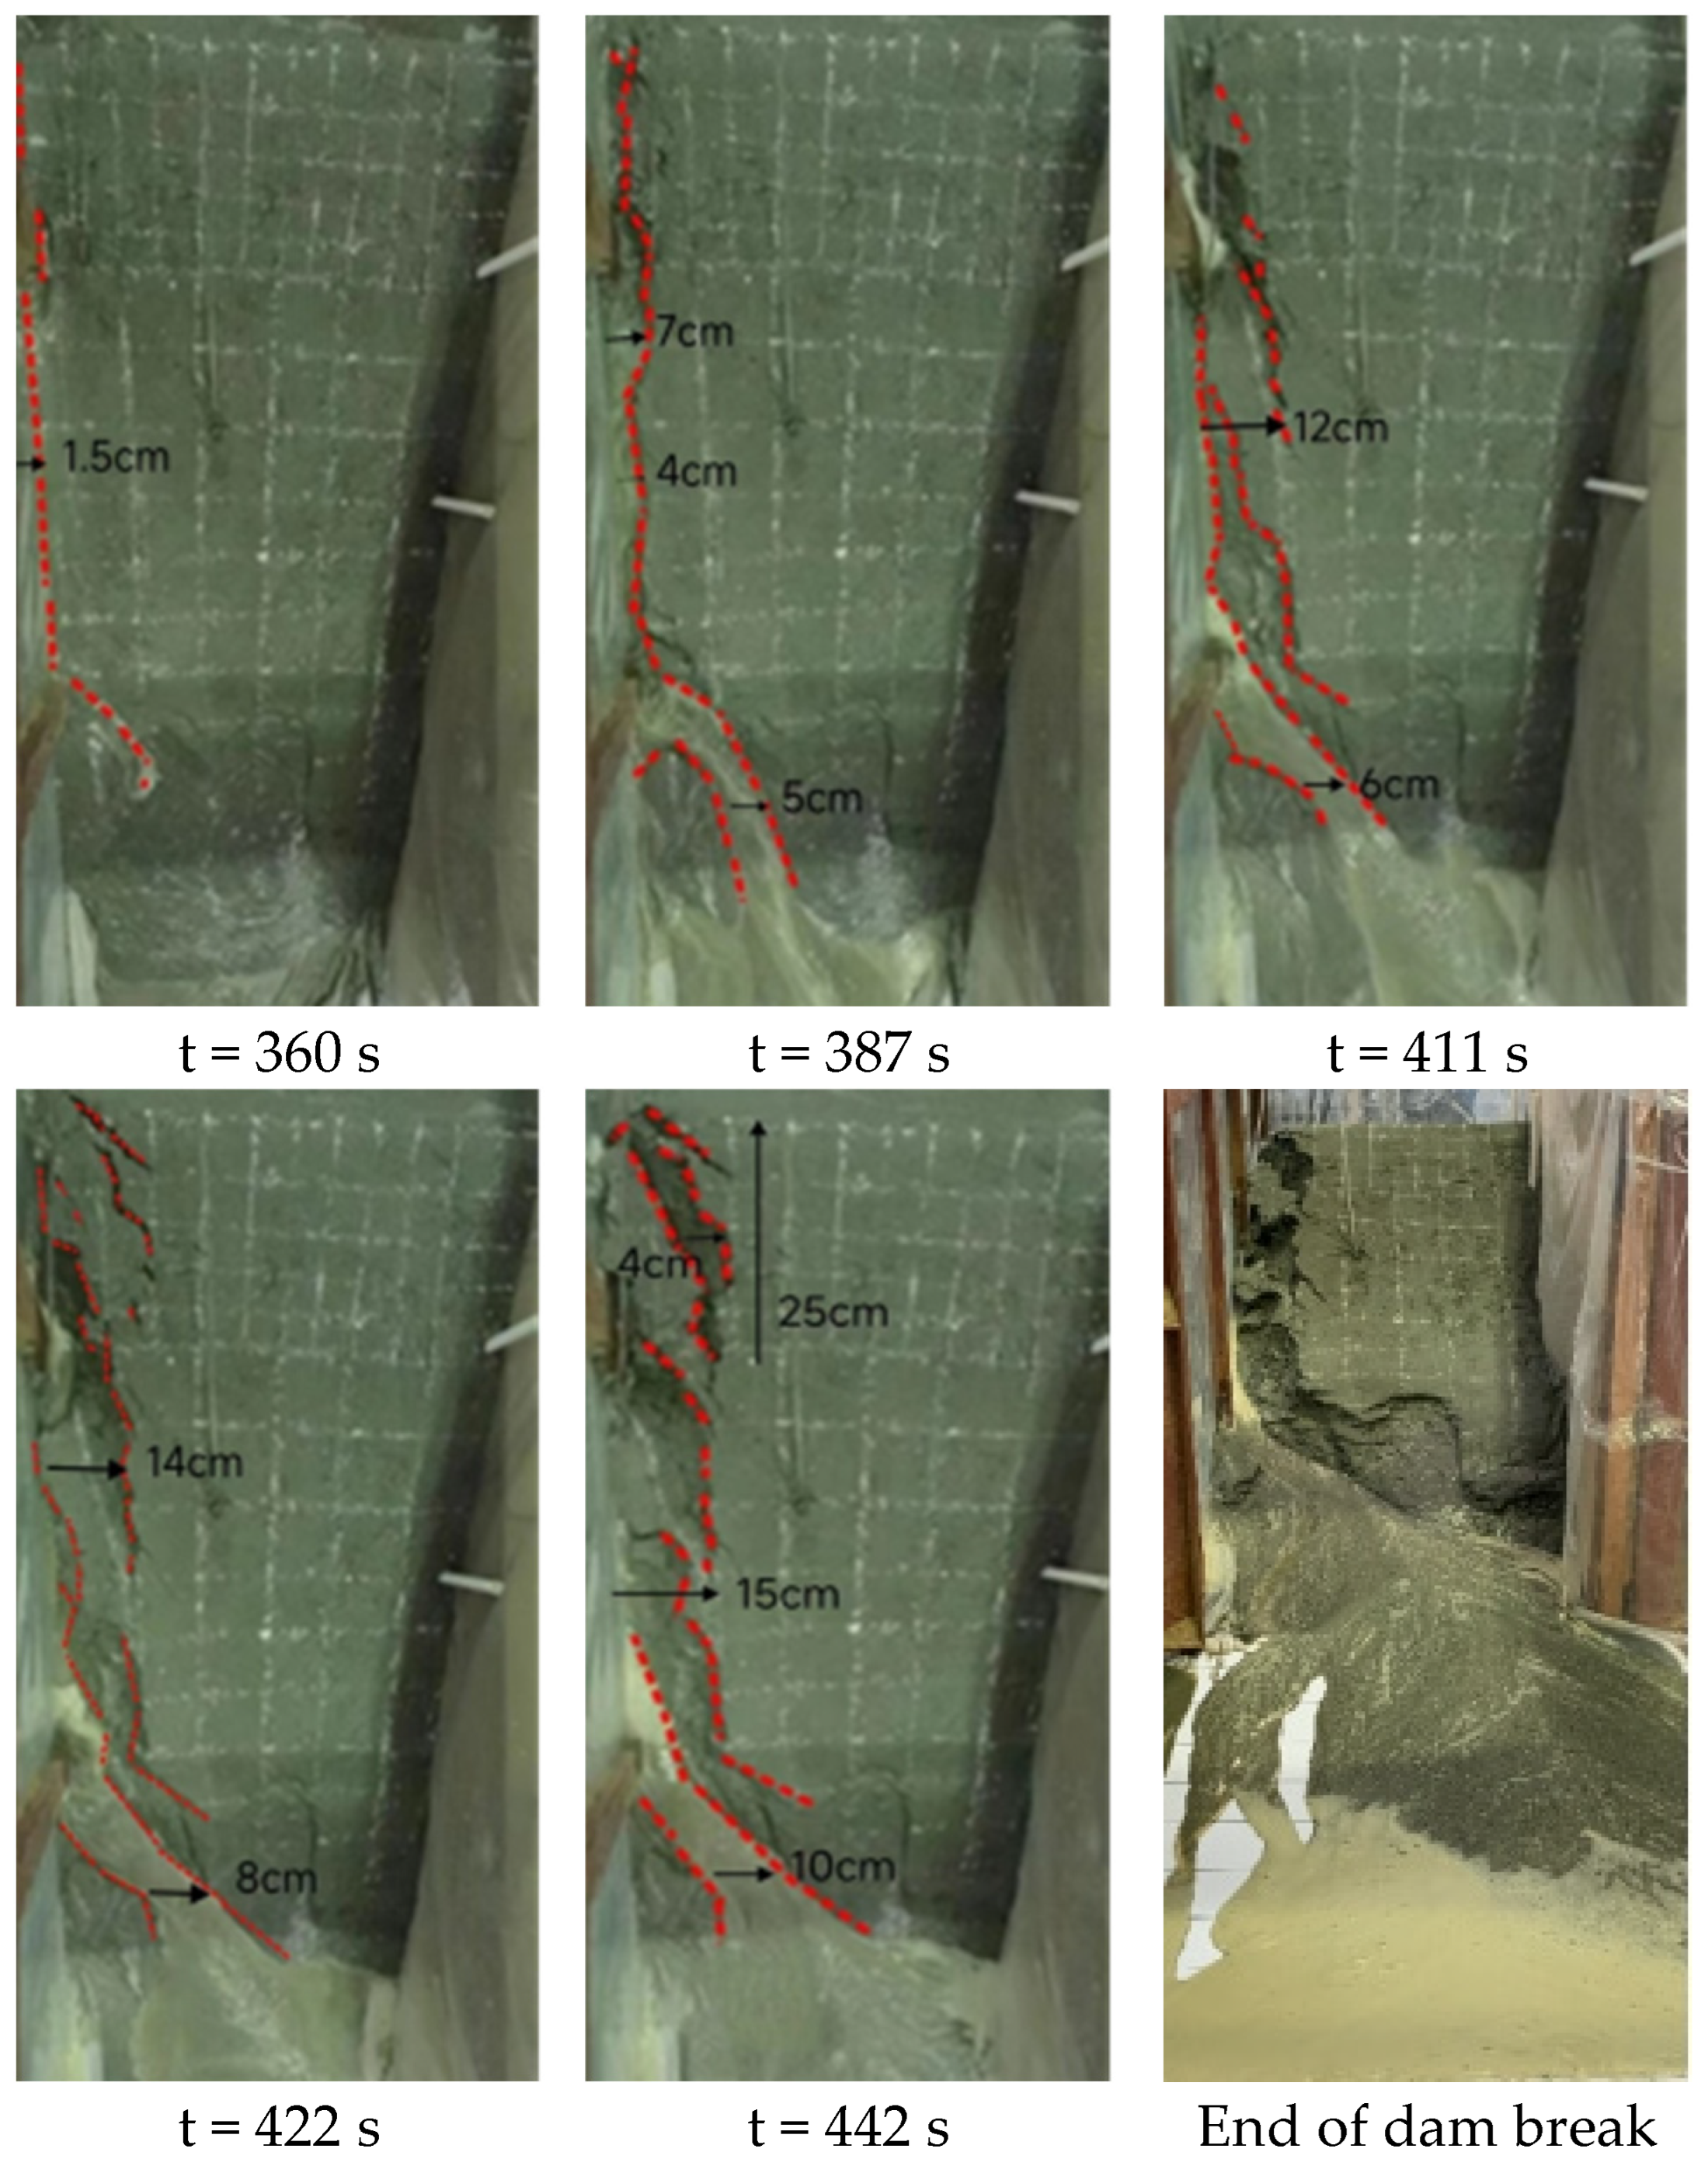
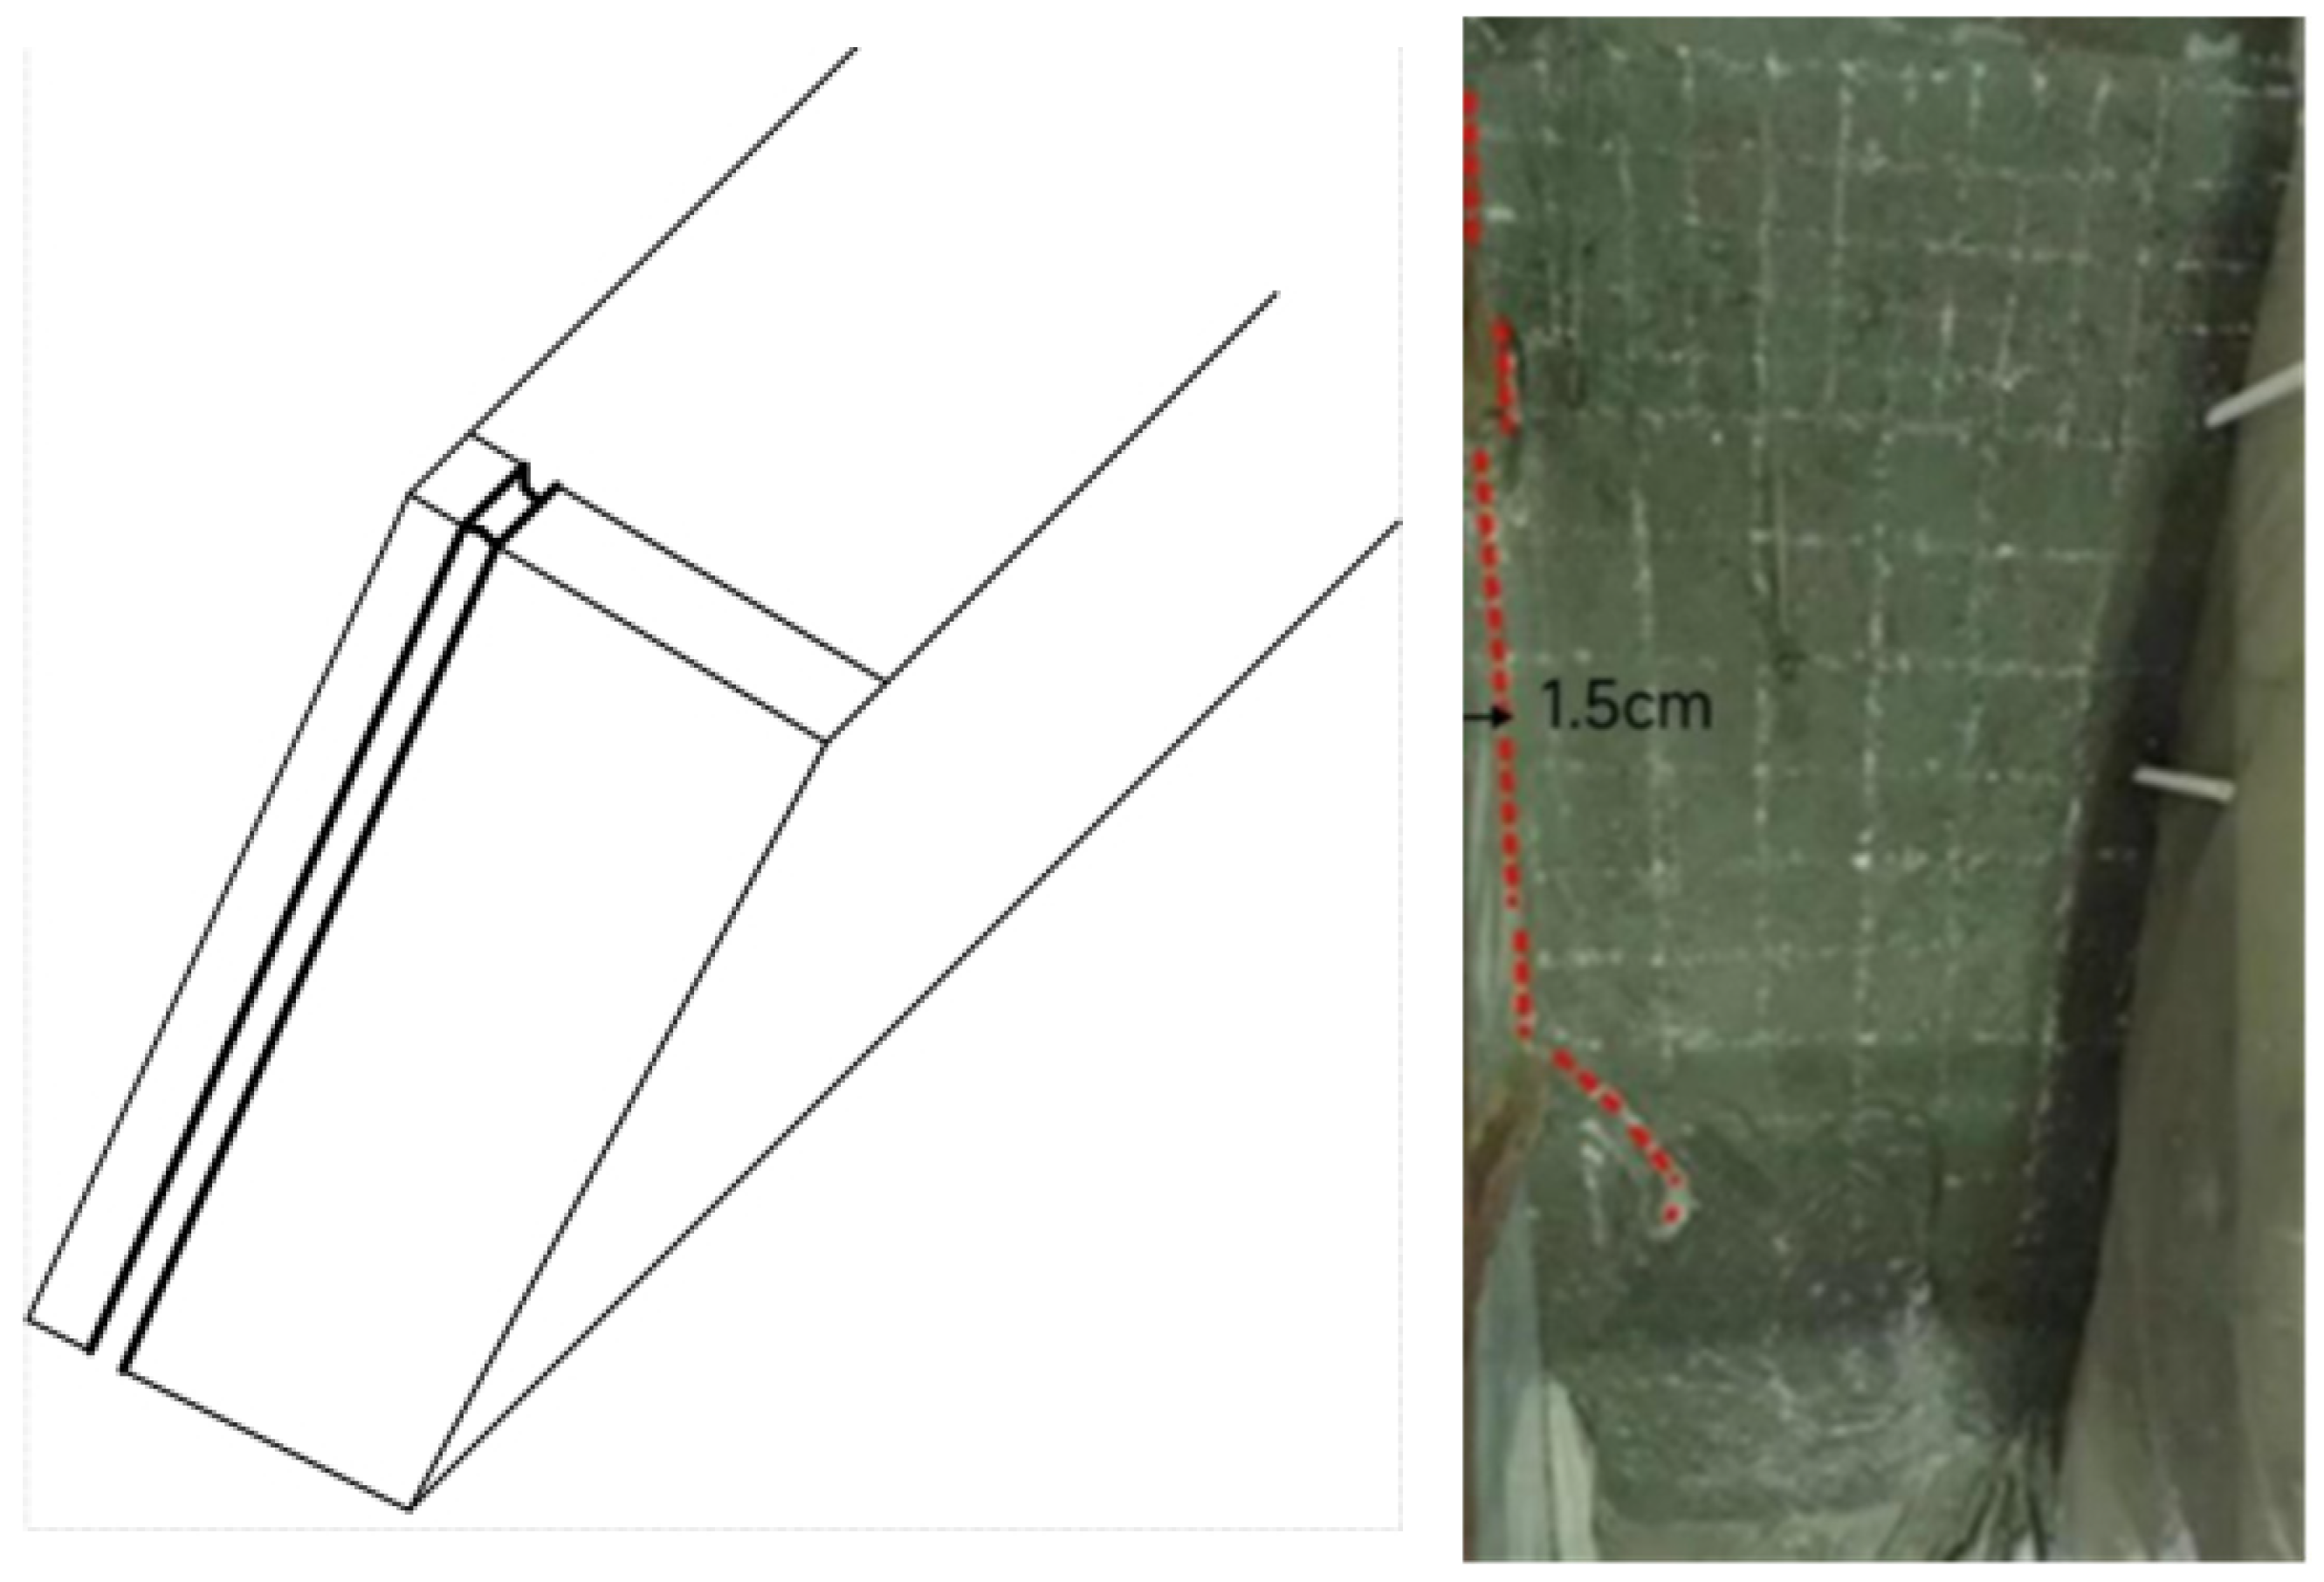
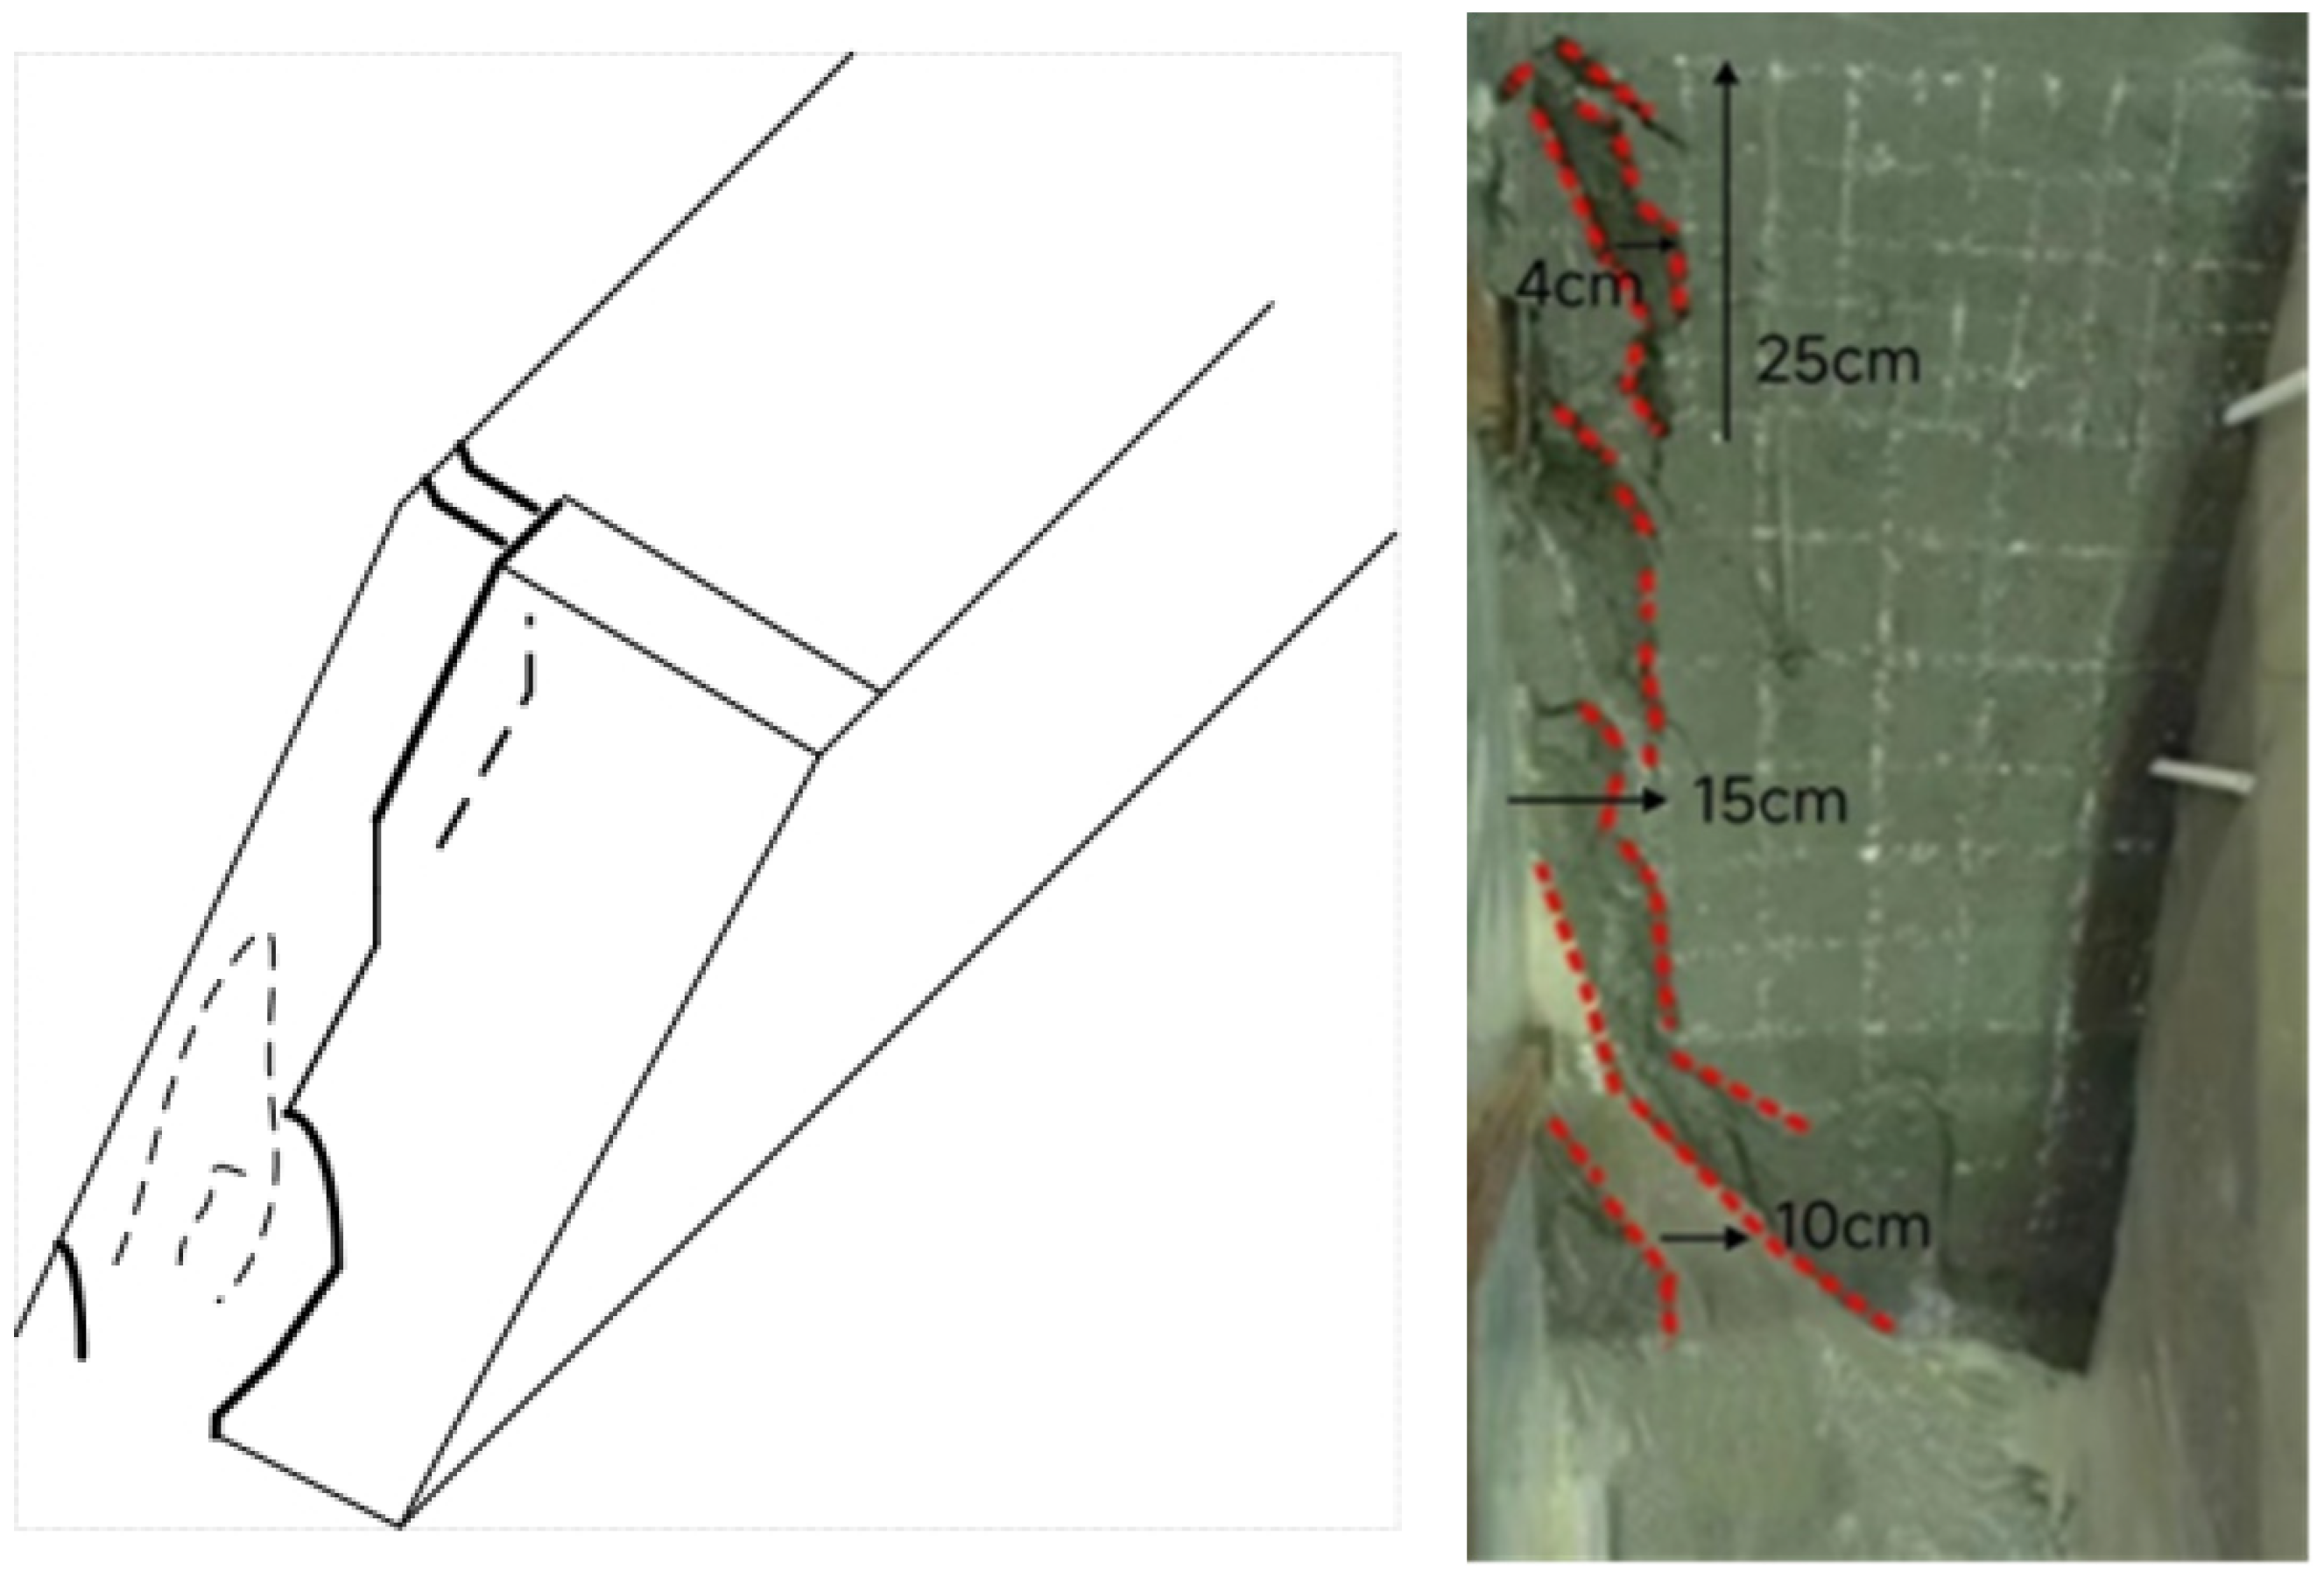
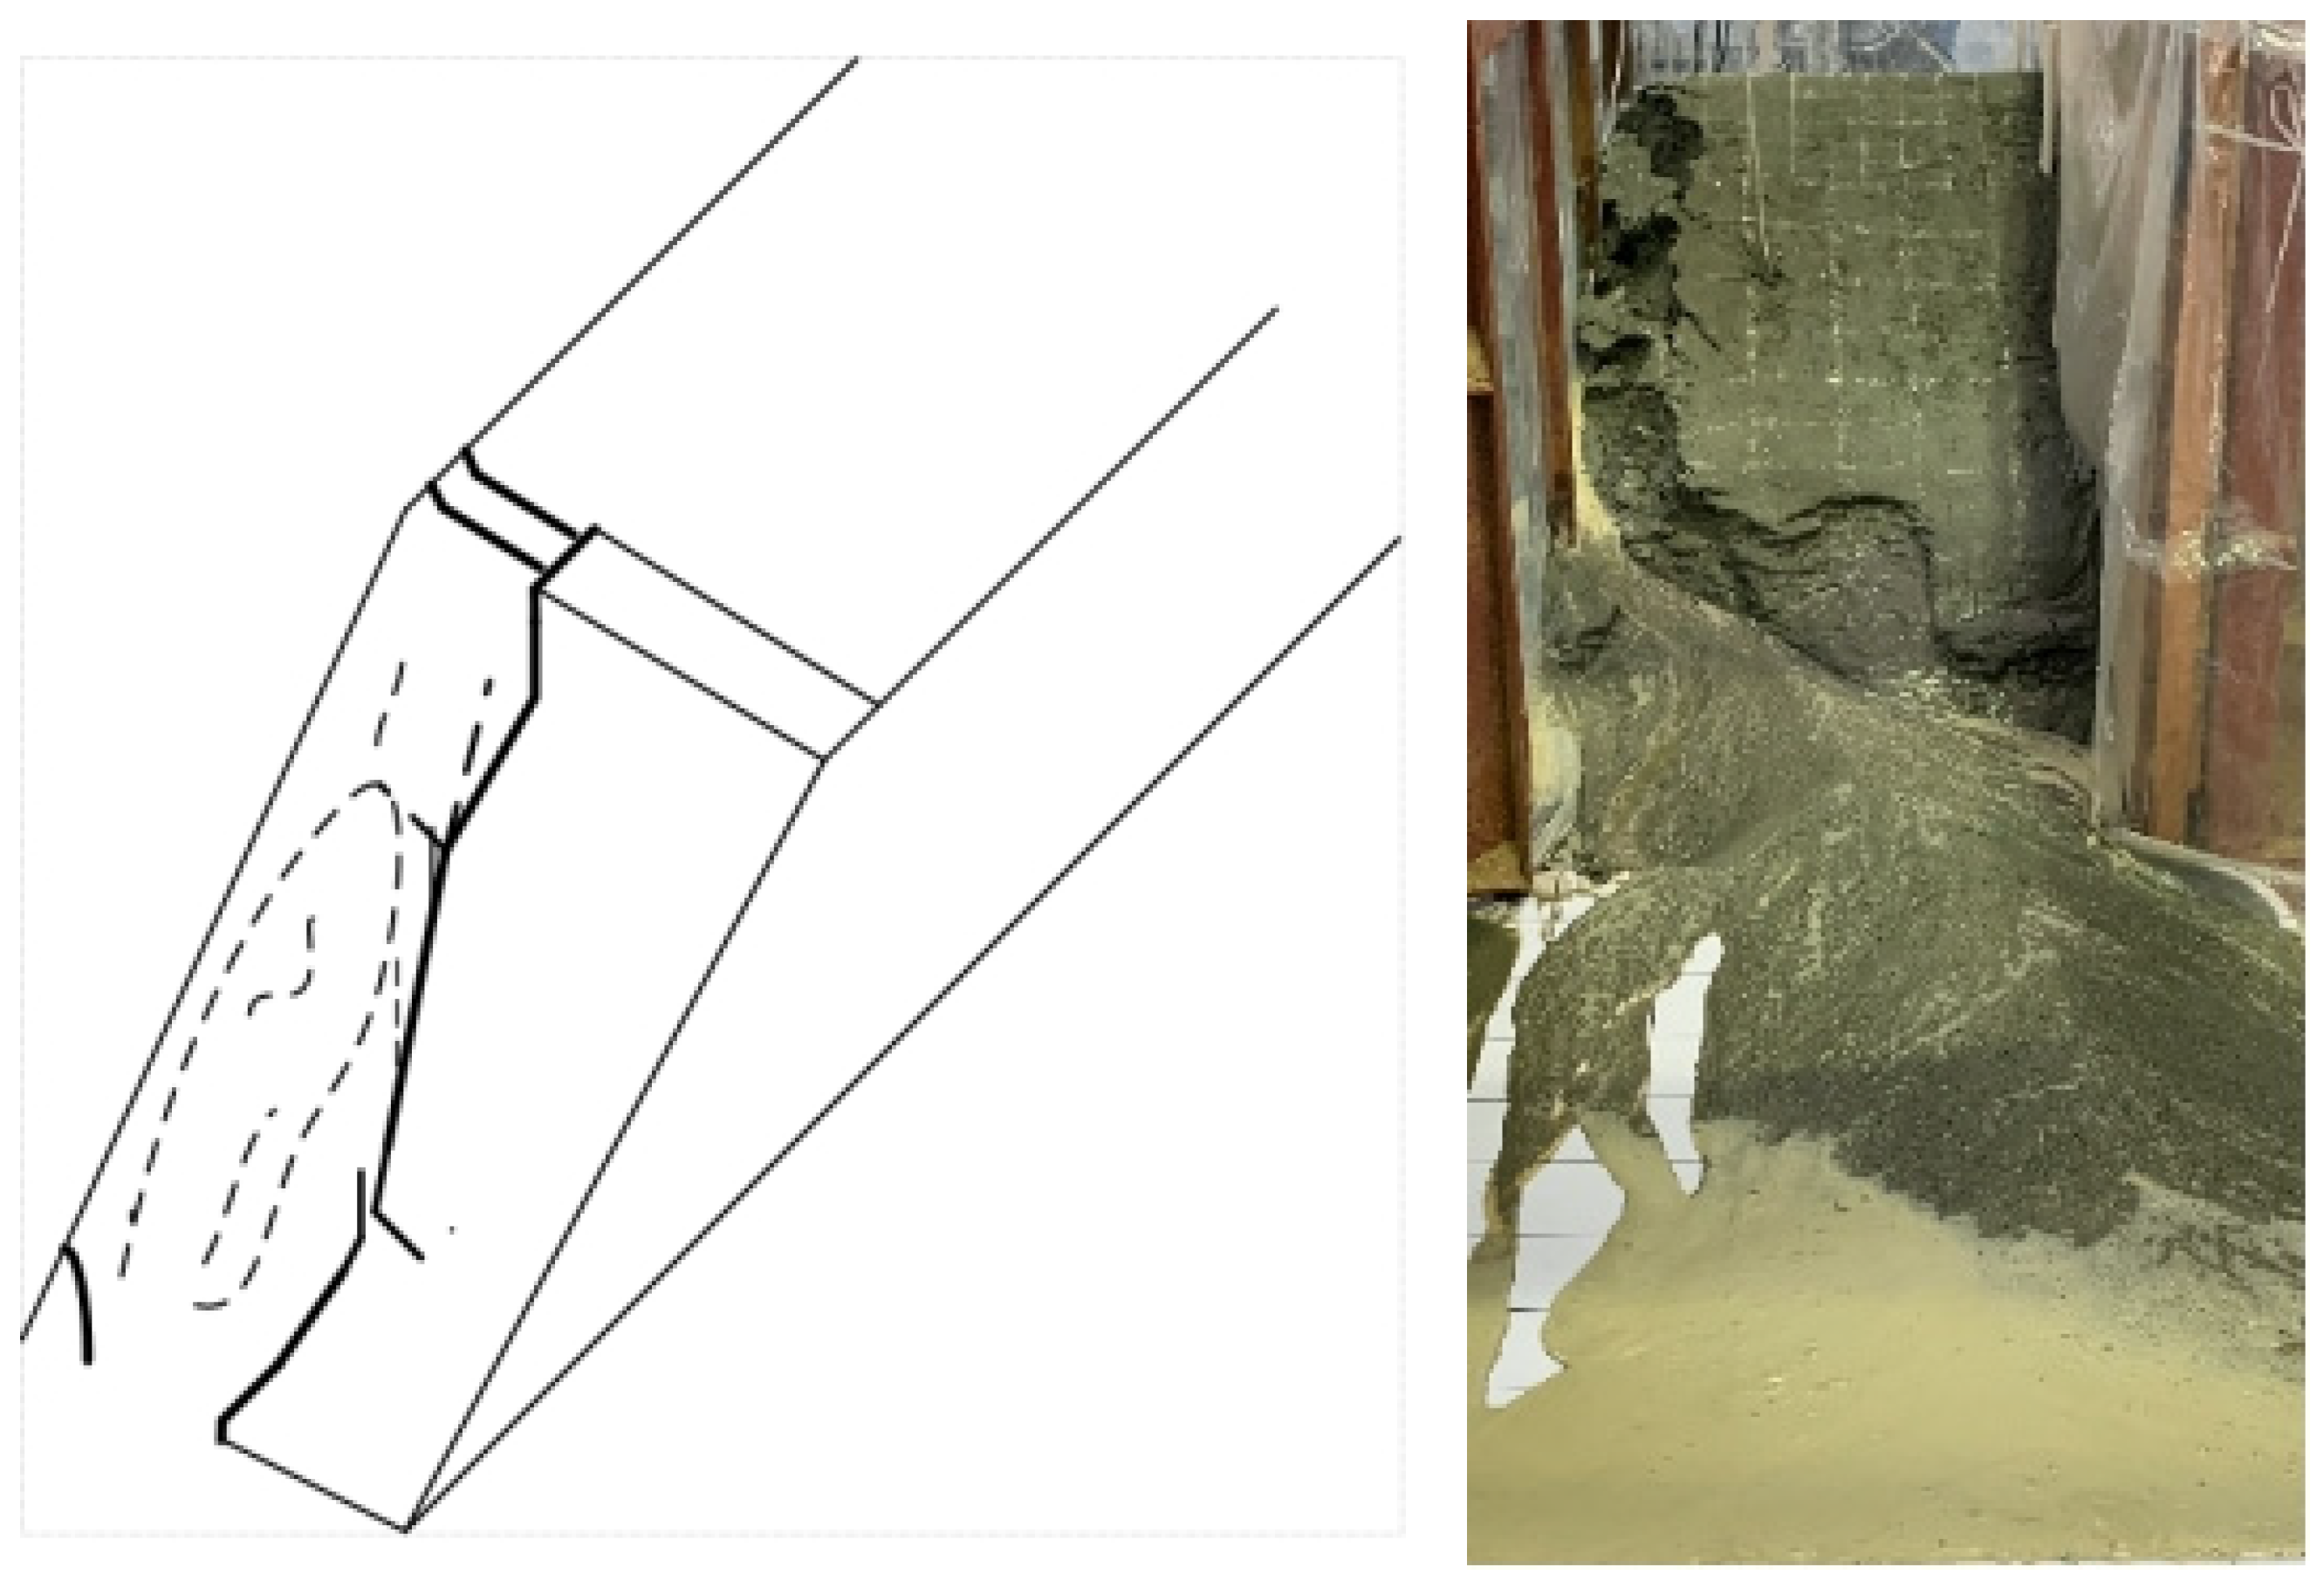
3.3. Process of Dam Break

The overtopping test lasted for a total duration of 120 min. At 55 min after the start of the test, the water level in the pond was 54 cm. At this point, the seepage in the model dam had reached a state of stability, and water started to gently seep out of the initial dam, as shown in Figure 12.
At 70 min after the start of the test, the seepage in the model dam was stable, and a large amount of water seeped out from the initial dam. Meanwhile, the tailings gradually became saturated and liquefied at the initial dam and the dam surface about 15 cm away from the initial dam. The initial dam, constructed using a mixture of fine-grained tailings, had a limited ability to drain water, making it difficult to effectively lower the height of the seepage line. Swamping began to occur at a distance of 5 cm from the dam foundation, and the swamp area was 12 cm wide. The swamping of the dam foundation is shown in Figure 13a.
At 75 min after the start of the test, the water level in the pond was gradually approaching the dam crest as the rainfall continued. At this time, more water seeped out from the vicinity of the initial dam. The saturation degree of tailing near the initial dam was further increased, and the swamping area was further expanded to 36 cm wide. Local slippage and instability occurred in the swamping area of the dam foundation, and the slippage occurred 15 cm away from the dam foundation, as shown in Figure 13b.
Due to the ongoing increase in water level, the water flow surpassed the lowest point of the dam crest and spilled over at the left shoulder of the dam. At this time, the breach and the flow rate from the breach were both small. The water flowed through the slope surface to form a trench with the same width as the breach, about 1.5 cm. About 387 s later, the gully laterally widened to 4 cm, and there was a breach of about 5 cm wide at the dam foundation. The velocity of the flow through the breach increased rapidly, resulting in a continuous and forceful stream that carried away loose tailings from the dam and flowed toward the dam foundation. As the discharge from the breach increased, the erosion effect on the slope surface became more pronounced, causing the breach to widen laterally and deepen longitudinally. Then, 411 s later, the fracture at the dam foundation widened to 6 cm, and a longitudinal crack with a length of about 20 cm appeared in the middle of the slope face. After 422 s, the crack in the dam collapsed, and a crack 25 cm long and 14 cm wide appeared at the top of the dam. Then, the water level in the pond dropped rapidly, cracks penetrated the upstream crest, and the dam failed in its entirety. After the collapse, a large amount of tailings flow was fan-shaped downstream of the model, and the dam break process ended. The overtopping dam breach process is shown in Figure 14, and the side view of the model after the dam break is shown in Figure 15.
The test had a duration of approximately 90 s, starting from the moment when overflow became visible on the slope surface and ending with the collapse of the dam. The test results indicate that the collapse underwent an evolution primarily driven by longitudinal deepening and transverse broadening. This occurred as a result of the erosion caused by the continuous rise in water level in the pond. Under the erosion action of the downstream flow, the tailing sand of the dam foundation was carried away, resulting in a longitudinal crack that gradually developed from the middle of the slope face to the crest of the dam. With the appearance of the longitudinal crack and the instability collapse, the collapse gradually increased, and finally led to the collapse of the entire slope. In this process, the rate at which water flowed through the dam breach increased, and the ability of the flow to carry sand was also improved. This led to an increase in the ability of the flow to erode, finally causing the breach to accelerate gradually.

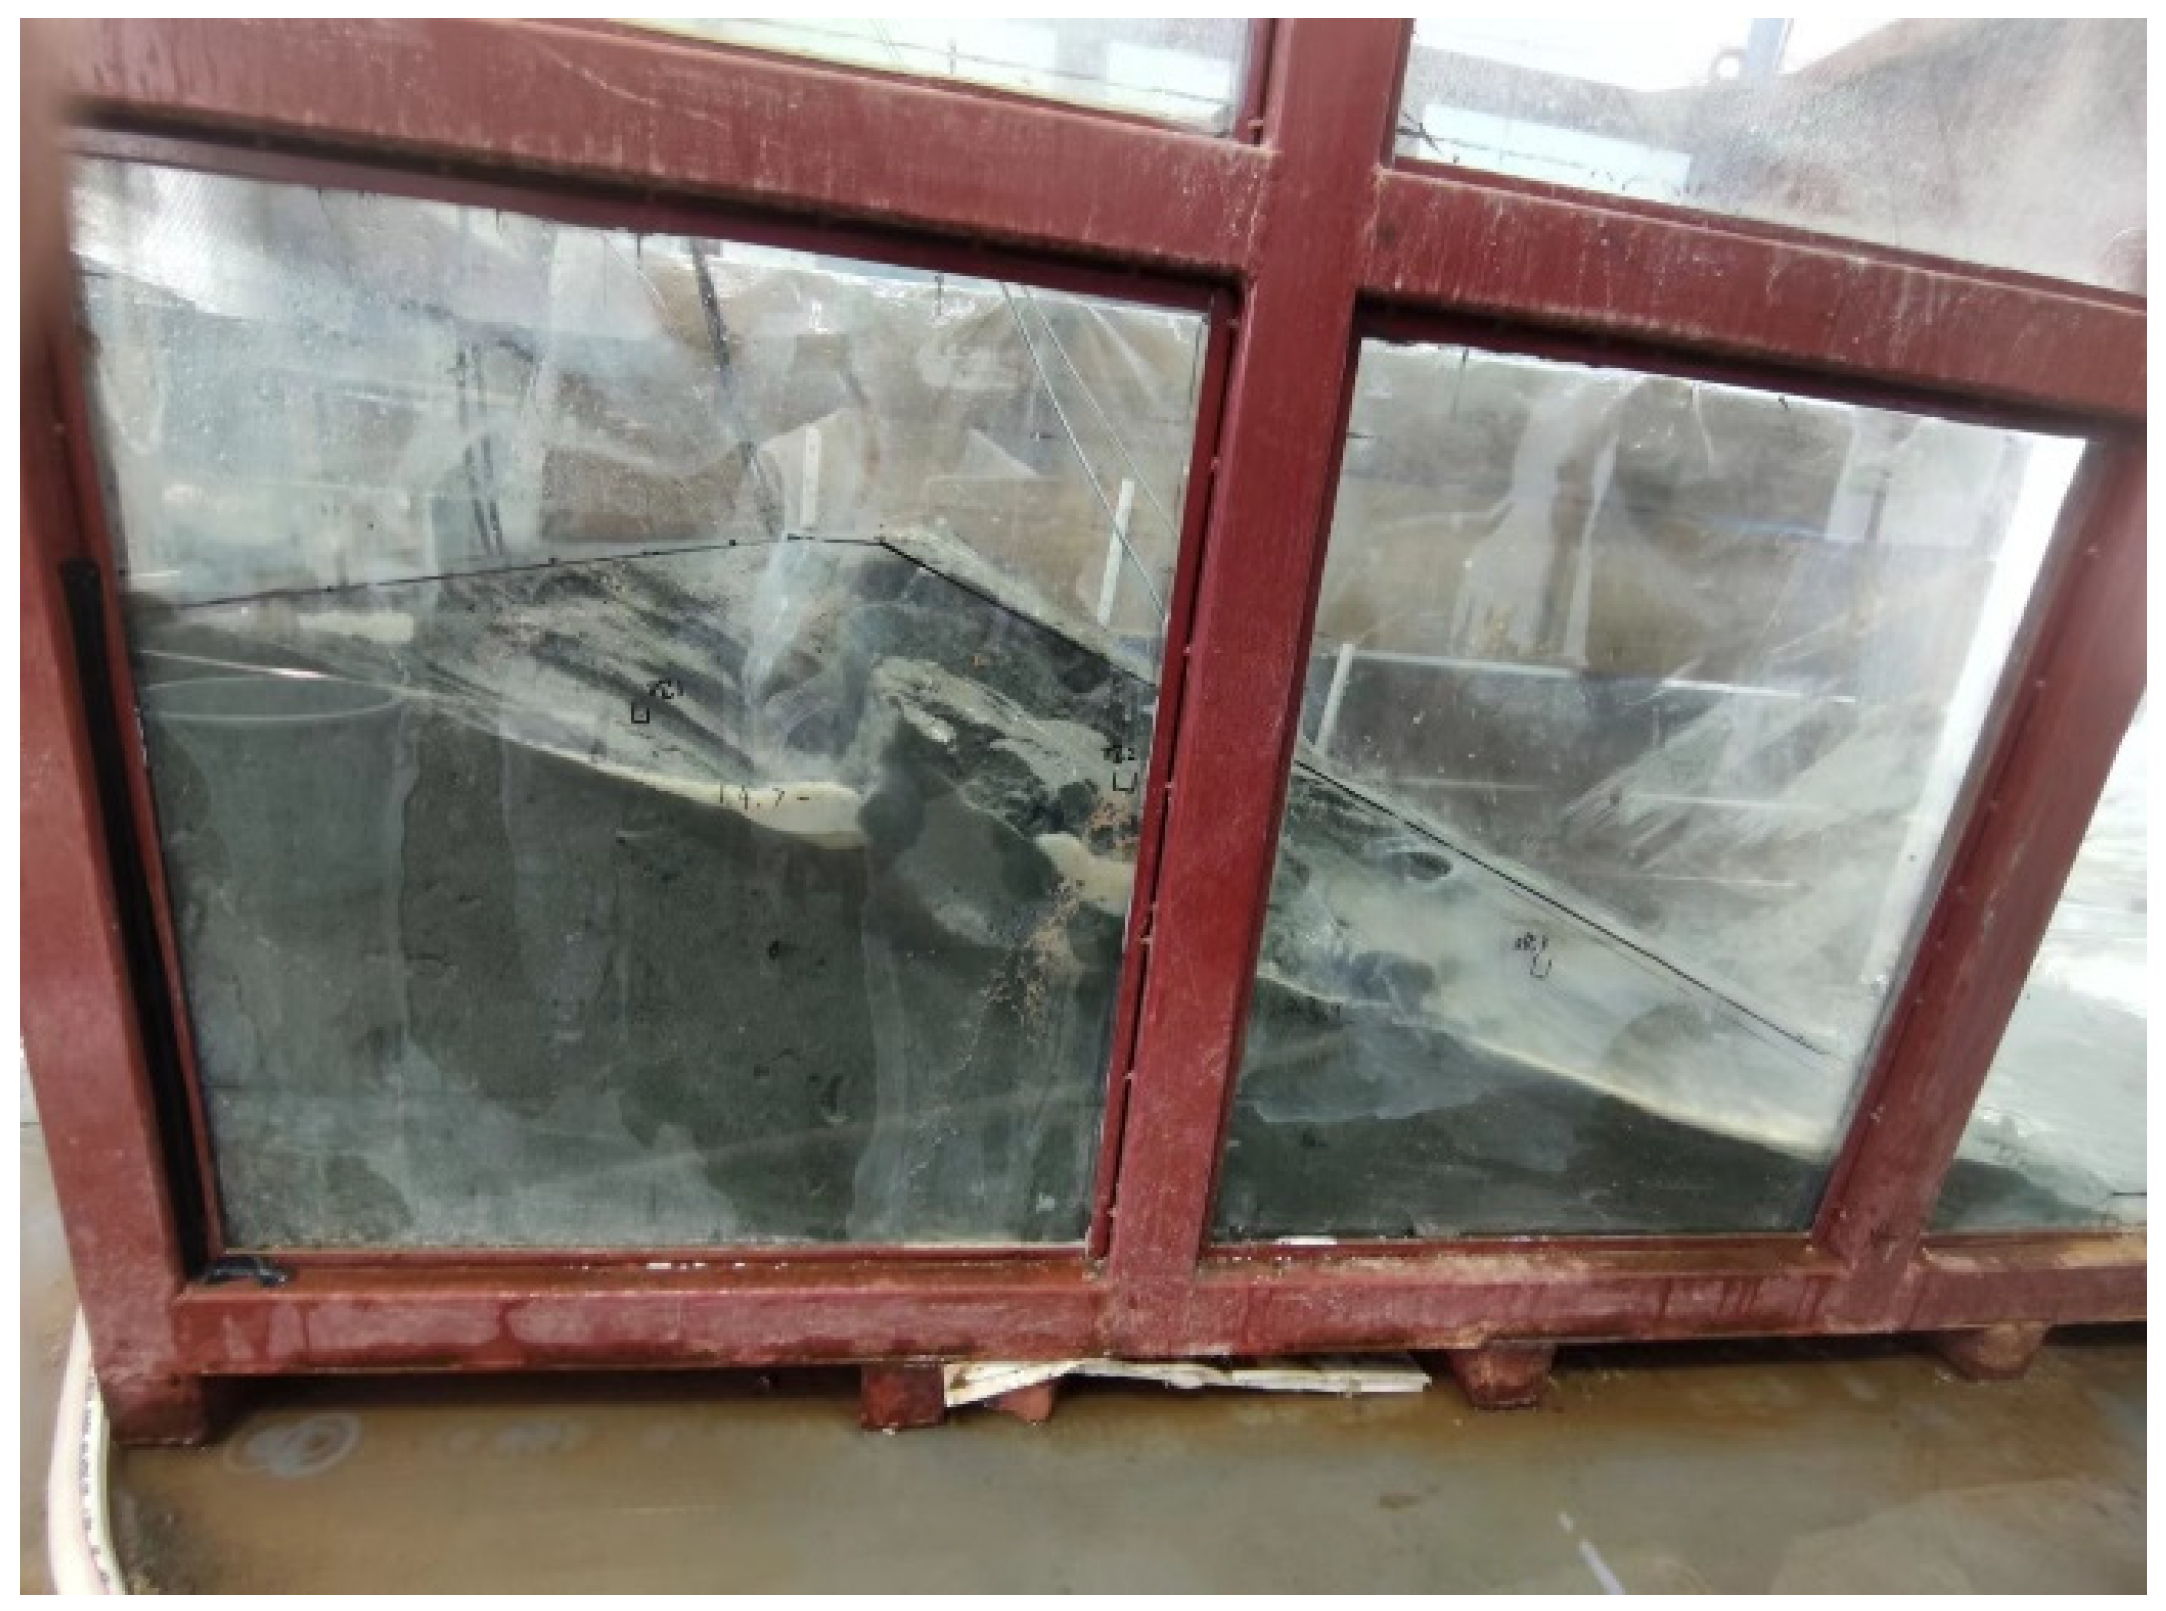
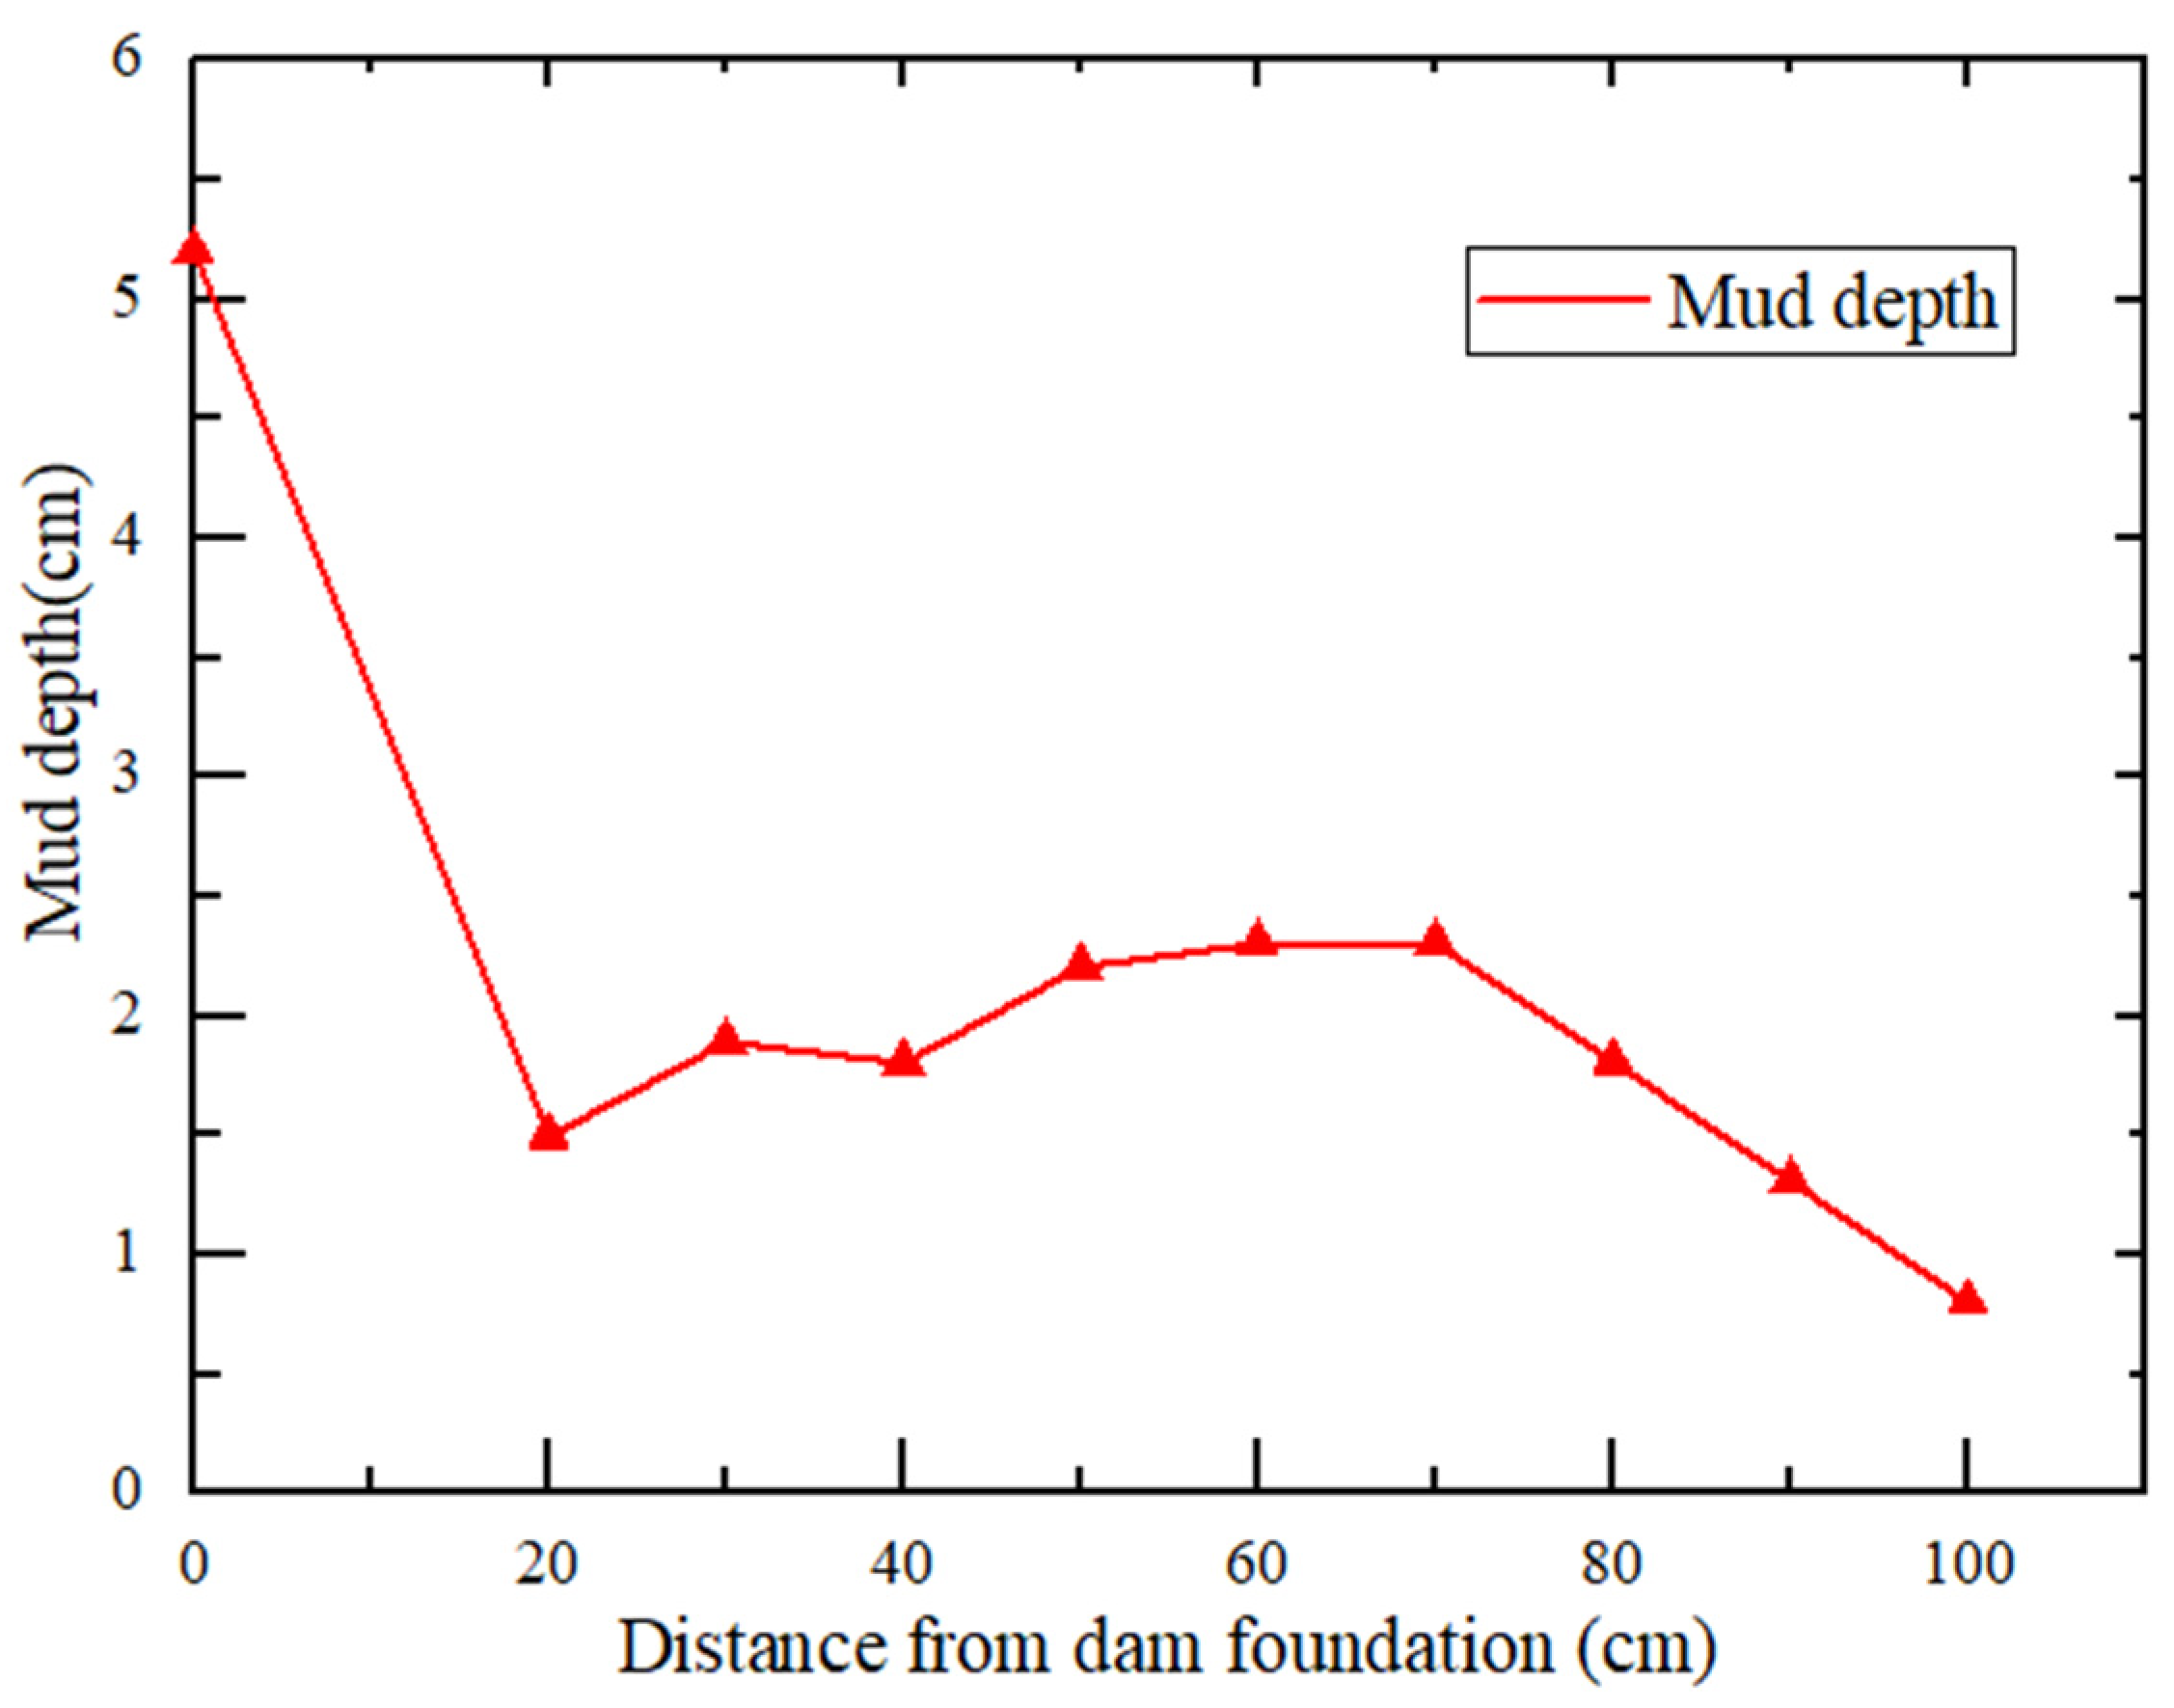
3.4. Outflow of Tailings after Dam Break

After the break of the dam, the extent of the flooded area where the tailings were discharged was measured. The deposited tailings discharged from the breach were about 156 cm in length and 140 cm in width. The depth of the mud at a distance of 156 cm was 0.2 cm. The depth of deposited mud was measured by ten monitoring points, as shown in Figure 16. The figure illustrates the substantial accumulation of tailings at the foundation of the dam, with a mud depth of 5.2 cm in front of the dam foundation. The mud depth increased first with the distance from the breach, reaching the maximum of 2.2 cm at the distance of 71 cm. Since then, the depth of mud decreased as the distance of transportation increased. The reason for this was that there was an ample supply of water and tailings at the beginning of the dam break, allowing the tailing sand to flow over a distance of 156 cm. As the dam broke, the ability of the water flow to carry sand decreased. The majority of the sand that was being carried lost its energy when it reached a depth of 60 cm–70 cm and settled at the bottom. After that, there was a reduction in the rate at which tailings were discharged, resulting in a decrease in the overall quantity of tailings. Tailings could not be transported farther and had to be silted up near the initial dam.
Typically, when there is flat terrain downstream, the tailings released from the breach disperse downstream in a radial pattern, forming an alluvial fan and covering a wide expanse of area. The furthest transportation distance of the outflow tailings was 156 cm, which was equivalent to an actual 234 m according to the similarity scale. The diffusion width was 140 cm, which was equivalent to an actual 210 m. At a distance of 150 m from the initial dam, the depth of deposited mud was 1.2 m, and at the farthest distance of 234 m, the depth of deposited mud was 0.3 m.

4. Discussion

4.1. Analysis of Dam Break Process

Based on a large number of dam break tests and relevant data of dam break accidents, Ralston [11] and Hanson et al. [12] put forward the “Scarp theory”. The term “scarp” refers to the erosion of the surface of a dam body caused by the scouring action of water, resulting in the formation of gullies on the surface. The gully is deepened due to the ongoing erosion caused by water flow, which leads to damage to the nearby dam and a decrease in elevation. The damaged elevation reduction allows water to flow, creating a cascading water flow that can cause further damage to the dam body and accelerate the process of dam failure. The schematic diagram of the “Scarp” is shown in Figure 17.
According to the results of the physical model test conducted in this study, the process of dam breach caused by overtopping may be divided into four distinct stages, as shown in Figure 18, Figure 19, Figure 20 and Figure 21.
(1) Gully formation stage
With the continuous inflow of water in the pond, the water level rises. When the water level reaches the dam crest, an initial breach occurs at the weak point on the dam crest. After the water overflows, water continuously flows out of the weak breach at the dam crest and overflows on the slope surface. When the scour erosion generated by water flow on the slope exceeds the shear strength of the tailings on the slope surface, the tailing particles begin to move with the water flow, forming gullies on the slope surface, which provides conditions for the next step of damage.
(2) Lateral broadening stage of gully
Due to the ongoing erosion caused by water flow, the tailing sand on the slope surface is constantly carried away, resulting in the gradual widening of gullies. The tailing flow constantly erodes the dam foot, resulting in the fan-shaped collapse of the dam foot.
(3) Cracks and collapse on the slope surface
The water flow persistently erodes the dam, causing the trench on the dam surface to cease widening and instead gradually deepen, ultimately resulting in the formation of a distinctive “scarp”. The water flow at the scarp transforms into a cascading motion, resulting in the formation of “falling water”. The subsequent swirling motion created by the “falling water” continuously erodes the base of the scarp, leading to an enhanced vertical erosion. Subsequently, longitudinal cracks appear in the center of the slope, resulting in a progressive collapse caused by the combined influence of gravity and water erosion. Along with the collapse, longitudinal cracks also appear at the dam crest. As with the development of cracks in the middle of the dam surface, the cracks at the top of the model dam gradually collapse along with the water flow action.
(4) Stable stage of collapse
With the further development of the dam break, the flow velocity and erosion stress formed by water flow reduce. The liquefied saturated tailings at the base of the dam undergo natural settling and eventual consolidation, resulting in an increase in shear strength over time. The outburst process tends to be stable.
In the study of tailing dam failures due to overtopping, Du et al. [29] divided the entire failure process into three parts: early, middle, and late dam breaks. After the start of rainfall, surface gullies appear on the slope. With the progress of the test, the depth of the breach deepens, forming a “U” shape, and multiple cracks appear. At this point, the breach gradually enlarges. In the later stage of the experiment, the cracks reach their maximum size and no longer continue to develop. By analyzing the cross-sectional shape of the dam body in specific regions, further research on the development of the breach can be conducted. However, because specific cross-sections were selected for the study, the evolution patterns of the breach are not accurate. This paper accurately reveals the complete process of the tailings dam breach by recording the entire overtopping failure process using observation equipment, thus enabling an accurate depiction of the evolution of the breach.

4.2. Mechanisms of Dam Break Due to Flood Overtopping

In the presence of rainfall, the wetting of the tailings dam was a necessary condition for the dam to fail. While the water level in the pond rose, water seeped from the interior of the dam to the downstream area, causing a rapid increase in the moisture content of the tailings sand. After the dam was soaked, the shear strength of the tailings decreased, resulting in poor overall stability of the dam and making the dam more susceptible to failure.
During the test, the foundation of the dam remained saturated for an extended period, resulting in a decrease in the cohesiveness of the saturated tailings and eventual liquefaction of the dam foot. As the liquefaction zone expanded, the tailings at the foot of the slope induced local landslide, which then spread toward the upstream slope, as shown in Figure 22.
Figure 23 shows the slip failure at the foot of the model dam. The model dam was in a stable state at the beginning. The dam foot experienced liquefaction as a result of seepage when the water level increased. The shaded region in the diagram corresponds to the area where liquefaction occurred. The occurrence of a local slide was expedited as a result of the liquefaction area. The liquefaction of tailings at the base of the dam resulted in slip flow, which led to instability in the upper portion of the dam. Then, the tailing in the middle part lost the support of the dam foot, which lay the foundation for the crack on the dam surface after overflow.
When the water in the pond exceeded the height of the dam, it would typically follow the cracks or slide down the gullies created by the liquefaction of the dam’s foundation. Later, the small gullies that had developed on the surface of the dam were gradually excavated and eroded by the movement of water, resulting in their further expansion. The gullies at the dam foot developed into a “scarp”, as shown in Figure 24a. The presence of the scarp leads to the formation of a powerful waterfall when water flows down the gullies. This waterfall erodes the downstream area, forcing the bottom of the scarp to swiftly cut down and create a reverse vortex in the upstream direction. The reverse vortex would additionally incise the scarp, resulting in the collapse of the slope. The scarp would continuously develop in the upstream direction, forming a multi-stage scarp, as shown in Figure 24b,c. The presence of the scarp significantly enhanced the erosive force of the water flow, leading to the rapid destruction of the dam through erosion.
After dam break, the water in the pond flowed downstream, spreading out in a radial pattern and forming an alluvial fan. The process diagram of dam break due to overtopping is shown in Figure 25.
In the study of tailing dam failures due to overtopping, Mei et al. [30] divided the overtopping failure process into three stages: initial, acceleration, and stable. In the initial stage, the overtopping flow creates an initial erosion gully downstream of the tailings dam. As the experiment progresses, the gullies merge and backward erosion occurs. In the acceleration stage, the dam slope fractures and expands on both sides due to erosion. In the stable stage, the scouring capacity of the overtopping flow weakens, the breach gradually stabilizes, and the overtopping failure experiment concludes. The three stages proposed by the aforementioned research are of significant importance for the study of tailing dam overtopping failures. However, accurately describing the evolution mechanism and triggering conditions of breaches in tailing dams solely based on the factor of overtopping flow is not possible as the impact of the seepage line height inside the tailings dam has not been considered. This paper reveals that liquefaction and flow sliding that occur at the base of the dam are also major factors causing overtopping failure in tailing dams by taking into account the variation in seepage line height inside the tailings dam.

5. Conclusions

Based on the principle of model similarity, a model test system of dam break with a scale of 1:150 was built based on the Heshangyu tailings pond. Under the condition of an inflow rate of 0.02 m3/h, a dam break test was conducted. The seepage characteristics of the model dam and the development process of dam break under the condition of flood overtopping were studied. The specific results and conclusions are as follows:
The primary cause of the dam failure of the model dam was the rise in water level. The foundation of the dam became liquefied due to the rise in water level. The liquefaction of tailings at the base of the dam resulted in slip flow, which led to the instability of the dam’s upper body. Then, the tailing in the middle part lost the support of the dam foot, which lay the foundation for the crack on the dam surface after the overflow. When the water in the pond exceeded the height of the dam, it would typically follow the fractures or slide down the gullies formed by the liquefaction of the dam’s foundation. The presence of the scarp significantly amplified the erosive impact of water flow, leading to the rapid destruction of the dam through erosion.
To prevent and control dam overtopping due to flooding, it is essential to monitor the liquefaction zone at the base of the dam. In the event of liquefaction, it is important to implement counterweight measures to enhance the stability of the dam base. Additionally, monitoring the length of the dry beach is of paramount importance. The installation of check dams can also prove instrumental in mitigating the impact of overflow on the tailings dam. These methods are of paramount importance for the prevention and control of tailings dam failure due to flood overtopping.
Water erosion has played a pivotal role in the evolution of dam failure through the process of longitudinally deepened and transversely broadened breaches. The phenomenon of overtopping failure can be categorized into four distinct stages: gully formation stage, lateral broadening stage of gully, cracks and collapse on the slope surface, and stable stage of collapse. Under the flat downstream terrain circumstances, the tailings were scattered downstream in the shape of radial and alluvial fans. The depth of the mud initially rose and then fell as the distance increased.
This study investigates the mechanisms and triggering conditions of the evolution of tailing dam breaches through model experiments. The revealed characteristics of the evolution of a breach by overflow are applicable to tailing ponds of the same scale with the same physical properties and particle gradation. However, this study still has certain limitations. Due to the uncertainty in the formation and development of breaches, the process of overtopping failures in tailing ponds was not numerically modeled. To address this, it is necessary to combine model tests and numerical simulations to jointly study the mechanism of dam breaches in tailing ponds.

Author Contributions

Conceptualization, Z.D. and J.C.; methodology, Z.D. and Q.L.; validation, J.X., H.Z. and C.C.; formal analysis, Z.D.; investigation, J.C.; resources, Q.L.; data curation, J.X.; writing—original draft preparation, Z.D. and J.C.; writing—review and editing, Z.D. and Q.L.; visualization, J.X. and H.Z.; supervision, Q.L.; project administration, Q.L.; funding acquisition, Z.D. and Q.L. All authors have read and agreed to the published version of the manuscript.

Funding

This research was funded by the National Natural Science Foundation of China (grant number 52304202), the National Key Research and Development Program of China (No. 2021YFC3001303), the Science and Technology Plan of Beijing: Beijing-Tianjin-Hebei Science and Technology Innovation Collaboration (Z231100003923001), and the Research Start-up Fund of North China University of Technology.

Data Availability Statement

Data will be made available upon request.

Conflicts of Interest

The authors declare no conflicts of interest.

References

  1. Czajkowski, M.; Meade, N.; da Motta, R.S.; Ortiz, R.A.; Welsh, M.; Blanc, G.C. Estimating environmental and cultural/heritage damages of a tailings dam failure: The case of the Fundão dam in Brazil. J. Environ. Econ. Manag. 2023, 121, 102849. [Google Scholar] [CrossRef]
  2. Buch, A.C.; Sims, D.B.; de Ramos, L.M.; Marques, E.D.; Ritcher, S.; Abdullah, M.M.; Silva-Filho, E.V. Assessment of environmental pollution and human health risks of mine tailings in soil: After dam failure of the Córrego do Feijão Mine (in Brumadinho, Brazil). Environ. Geochem. Health 2024, 46, 72. [Google Scholar] [CrossRef] [PubMed]
  3. Turi, D.; Pusztai, J.; Nyari, I. Causes and circumstances of red mud reservoir dam failure in 2010 at Mal Zrt factory site in Ajka, Hungary. In Proceedings of the 7th Conference of the International Conference on Case Histories in Geotechnical Engineering, Chicago, IL, USA, 29 April–4 May 2013. [Google Scholar]
  4. Berghe, J.F.V.; Ballard, J.C.; Pirson, M.; Reh, U. Risks of tailings dams failure. Proc. Int. Symp. Geotech. Risk Saf. ISGSR 2011, 2, 6. [Google Scholar]
  5. Kossoff, D.; Dubbin, W.E.; Alfredsson, M.; Edwards, S.J.; Macklin, M.G.; Hudson-Edwards, K.A. Mine tailings dams: Characteristics, failure, environmental impacts, and remediation. Appl. Geochem. 2014, 51, 229–245. [Google Scholar] [CrossRef]
  6. Lyu, Z.; Chai, J.; Xu, Z.; Qin, Y.; Cao, J. A comprehensive review on reasons for tailings dam failures based on case history. Adv. Civ. Eng. 2019, 2019, 4159306. [Google Scholar] [CrossRef]
  7. Du, C.; Tao, H.; Yi, F.; Cheng, C. Experimental study on overtopping dam-break of a tailing reservoir under extreme conditions. Environ. Sci. Pollut. Res. 2024, 31, 6874–6890. [Google Scholar] [CrossRef]
  8. Wahl, T.L. Prediction of Embankment Dam Breach Parameters: A Literature Review and Needs Assessment; Dam Safety Research Report; Water Resources Research Laboratory, U.S. Department of the Interior, Bureau of Reclamation Dam Safety Office: Washington, DC, USA, 1998.
  9. Froehlich, D.C. Embankment-Dam Breach Parameters. In Proceedings of the Hydraulic Engineering, Proceedings of the 1987 National Conference, Williamsburg, VA, USA, 3–7 August 1987; pp. 570–575. [Google Scholar]
  10. Zuo, T.; Li, X.; Wang, J.; Hu, Q.; Tao, Z.; Hu, T. Insights into natural tuff as a building material: Effects of natural joints on fracture fractal characteristics and energy evolution of rocks under impact load. Eng. Fail. Anal. 2024, 163, 108584. [Google Scholar] [CrossRef]
  11. Ralston, D.C. Mechanics of embankment erosion during overflow. In Hydraulic Engineering; ASCE: Reston, VI, USA, 1987; pp. 733–738. [Google Scholar]
  12. Hanson, G.J.; Temple, D.M.; Cook, K.R. Dam overtopping resistance and breach processes research. In Proceedings of the Association of State Dam Safety Officials Annual Conference, St. Louis, MO, USA, 13 October 1999. [Google Scholar]
  13. Rico, M.; Benito, G.; Diez-Herrero, A. Floods from tailings dam failures. J. Hazard. Mater. 2008, 154, 79–87. [Google Scholar] [CrossRef]
  14. Chen, S.; Zhong, Q.; Cao, W. Breach mechanism and numerical simulation for seepage failure of earth-rock dams. Sci. China Technol. Sci. 2012, 55, 1757–1764. [Google Scholar] [CrossRef]
  15. Shengshui, C.; Qiming, Z.; Qiang, R.E.N. Numerical study on break development due to piping failure for earth-rock dams. Chin. J. Geotech. Eng. 2009, 31, 653–657. [Google Scholar]
  16. Chen, S.S.; Zhong, Q.M.; Cao, W. Centrifugal model test and numerical simulation of the breaching process of clay core dams due to overtopping. Adv. Water Sci. 2011, 22, 674–679. [Google Scholar] [CrossRef]
  17. Hanson, G.J.; Robinson, K.M.; Cook, K.R. Prediction of headcut migration using a deterministic approach. Trans. ASAE 2001, 44, 525. [Google Scholar] [CrossRef]
  18. Hanson, G.J.; Cook, K.R.; Hunt, S.L. Physical modeling of overtopping erosion and breach formation of cohesive embankments. Trans. ASAE 2005, 48, 1783–1794. [Google Scholar] [CrossRef]
  19. Hunt, S.L.; Hanson, G.J.; Cook, K.R.; Kadavy, K.C. Breach widening observations from earthen embankment tests. Trans. ASAE 2005, 48, 1115–1120. [Google Scholar] [CrossRef]
  20. Souza, T.F., Jr.; Teixeira, S.H.C. Simulation of tailings release in dam break scenarios using physical models. REM Int. Eng. J. 2019, 72, 385–393. [Google Scholar] [CrossRef]
  21. Gens, A.; Alonso, E.E. Aznalcollar dam failure. part 2: Stability conditions and failure mechanism. Geotechnique 2006, 55, 185–201. [Google Scholar] [CrossRef]
  22. Aleixo, R.; Ozeren, Y.; Altinakar, M. Tailings dam-break flow analysis by means of a combined PIV-PTV tool. In River Flow 2014, Lausanne; CRC Press: London, UK, 2014. [Google Scholar] [CrossRef]
  23. Jing, X.F.; Yin, G.Z.; Wei, Z.A.; Li, X.S.; Wang, M.L. Model experimental study of collapse mechanism and broken mode of tailings dam. Rock Soil Mech. 2011, 32, 1377–1404. [Google Scholar] [CrossRef]
  24. Martínez-Aranda, S.; Fernández-Pato, J.; García-Navarro, P. Mixing-phase model for shear-induced contractive/dilative effects in unsteady water-sediment mixture flows. Adv. Water Resour. 2024, 188, 104710. [Google Scholar] [CrossRef]
  25. Yang, Y.; Zhou, X.; Chen, X.; Xie, C. Numerical simulation of tailings flow from dam failure over complex terrain. Materials 2022, 15, 2288. [Google Scholar] [CrossRef] [PubMed]
  26. Martínez-Aranda, S.; Fernández-Pato, J.; García-Navarro, P. Non-Equilibrium Bedload Transport Model Applied to Erosive Overtopping Dambreach. Water 2023, 15, 3094. [Google Scholar] [CrossRef]
  27. Zhang, X.; Du, D.; Wu, Y.; Ye, P.; Xu, Y. Theoretical and analytical solution on vacuum preloading consolidation of landfill sludge treated by freeze–thaw and chemical preconditioning. Acta Geotech. 2024, 19, 221–238. [Google Scholar] [CrossRef]
  28. Shi, Y.; Zhao, C.; Peng, Z.; Yang, H.; He, J. Analysis of the lag effect of embankment dam seepage based on delayed mutual information. Eng. Geol. 2018, 234, 132–137. [Google Scholar] [CrossRef]
  29. Du, C.; Niu, B.; Yi, F.; Jiang, X.; Liang, L. Impact of inundation range of overtopping dam break of tailings pond under actual terrain conditions. PLoS ONE 2023, 18, e0295056. [Google Scholar] [CrossRef]
  30. Mei, S.; Zhong, Q.; Chen, S.; Shan, Y. Investigation of the overtopping-induced breach of tailings dams. Comput. Geotech. 2022, 149, 104864. [Google Scholar] [CrossRef]
Figure 1. Site location of the Heshangyu tailing pond: (a) Site location; (b) Satellite image.
Water 16 02406 g001
Figure 2. Schematic diagram of physical test system.
Water 16 02406 g002
Figure 3. Photo of the model flume.
Water 16 02406 g003
Figure 4. Physical model section.
Water 16 02406 g004
Figure 5. Grain gradation curve of the tailings.
Water 16 02406 g005
Figure 6. Water injection device.
Water 16 02406 g006
Figure 7. Variation curve of the water level.
Water 16 02406 g007
Figure 8. Change curve of water level in the three observation tubes.
Water 16 02406 g008
Figure 9. Curve of seepage line with time.
Water 16 02406 g009
Figure 10. Change curve of pore water pressure.
Water 16 02406 g010
Figure 11. Change curve of soil pressure.
Water 16 02406 g011
Figure 12. Water seeped out of the initial dam.
Water 16 02406 g012
Figure 13. Deformation of slope surface: (a) Dam foundation swamping; (b) Sliding of dam foundation.
Water 16 02406 g013
Figure 14. Test process of overtopping dam breach.
Water 16 02406 g014
Figure 15. Side view after dam break.
Water 16 02406 g015
Figure 16. Change curve of mud depth.
Water 16 02406 g016
Figure 17. Diagram of the scarp theory.
Water 16 02406 g017
Figure 18. Gully on dam surface.
Water 16 02406 g018
Figure 19. Gradual widening of gully.
Water 16 02406 g019
Figure 20. Crack occurrence and collapse.
Water 16 02406 g020
Figure 21. Collapse of the entire dam.
Water 16 02406 g021
Figure 22. Liquefaction of dam foundation from the top view.
Water 16 02406 g022
Figure 23. Liquefaction and flow slip at dam foundation. (a) Initial liquefaction area; (b) Fluid-slip development in liquefaction area; (c) Fluid-slip failure area.
Water 16 02406 g023
Figure 24. Schematic diagram of steep ridge formation. (a) The scarp appeared; (b) Multi-stage scarp appeared; (c) Multi-stage scarp widened.
Water 16 02406 g024
Figure 25. Diagram of dam break evolution process.
Water 16 02406 g025
Table 1. Similarity scale.
Geometric Scale
λ L
Flow Scale
λ Q = λ L 5 / 2
Time Scale
λ t = λ L 1 / 2
Roughness Scale
λ n = λ L 1 / 6
Area Scale
λ A = λ L 2
Volume Scale
λ V = λ L 3
Velocity Scale
λ V = λ L 1 / 6
150275,567.612.252.3122,5003,375,00012.25
Table 2. Physical properties of the tailings.
ParameterMedian Particle Size (mm)Specific
Gravity
Void RatioDry Density (g/cm3)Internal Friction
Angle (°)
Non-Uniform
Coefficient
Value0.1702.740.811.6029.027.66
Disclaimer/Publisher’s Note: The statements, opinions and data contained in all publications are solely those of the individual author(s) and contributor(s) and not of MDPI and/or the editor(s). MDPI and/or the editor(s) disclaim responsibility for any injury to people or property resulting from any ideas, methods, instructions or products referred to in the content.

