Article

Intrusion Event Classification of a Drainage Tunnel Based on Principal Component Analysis and Neural Networking

1
China Yangtze Power Co., Ltd., Yibin 644612, China
2
School of Resources and Safety Engineering, Chongqing University, Chongqing 400044, China
*
Author to whom correspondence should be addressed.
Water 2024, 16(17), 2409; https://doi.org/10.3390/w16172409
Submission received: 18 July 2024 / Revised: 17 August 2024 / Accepted: 21 August 2024 / Published: 27 August 2024

Abstract

:
Drainage tunnel stability is crucial for engineering project safety (e.g., mine engineering and dams), and rockfall events and water release are key indicators of drainage tunnel stability. To address this, we developed a monitoring system to simulate drainage tunnel intrusions based on distributed acoustic sensing (DAS), and we obtained typical characteristics of events like rockfall events and water release. Given the multitude of DAS signal feature parameters and challenges, such as high-dimensional features impacting the classification accuracy of machine learning, we proposed an identification method for drainage tunnel intrusion events using principal component analysis (PCA) and neural networks. PCA reveals that amplitude-related parameters—amplitude, mean amplitude, and energy—significantly contribute to DAS signal classification, reducing the feature parameter dimensions by 54.8%. The accuracy of intrusion event classification improves with PCA-processed data compared to unprocessed data, with overall accuracy rates of 79.1% for rockfall events and 72.7% for water release events. Additionally, the artificial neural network model outperforms the Bayesian and logistic regression models, demonstrating that ANN has advantages in handling complex models for intrusion event classification.

1. Introduction

The drainage tunnel stability is crucial for the safety of engineering projects (e.g., mine engineering and dams). However, it can be affected by rock lithology, rock mass fault, seepage water, etc. Drainage tunnel stability monitoring is getting more and more attention [1,2,3]. Common engineering monitoring methods include rock mass stress and displacement monitoring, satellite remote sensing, 3D laser scanning, geological radar, microseismic monitoring, and distributed acoustic sensing (DAS). Rock mass stress and displacement monitoring is simple but limited to point monitoring and cannot reflect intrusion events like personnel inspections. Satellite remote sensing can only monitor surface displacement [4] and cannot observe internal damage or locate intrusion events within drainage tunnels. Three-dimensional laser scanning can capture the shape of drainage tunnels but cannot penetrate the internal structure of rock mass or detect intrusion events like personnel inspections or rock mass collapses [5]. Microseismic monitoring technology is well suited for monitoring rock mass fractures but struggles to detect small-scale intrusion events, and it cannot provide real-time locations for personnel inspections or animal intrusions [6]. DAS technology, with its high sensitivity and stability [7,8], is highly suitable for monitoring various intrusion events, where type classification of intrusion events is crucial in DAS monitoring for drainage tunnels.
Initially, intrusion event classification in DAS monitoring was based on manual observation of signals and heavily influenced by subjective judgment [9]. To handle this, Fast Fourier Transform (FFT) was adopted to convert DAS signals from time to frequency domain [10], which provides a fresh perspective for classifying intrusion events. However, due to factors such as signal propagation distance, frequency bands of different intrusion types often overlap and reduce the classification accuracy of the frequency-based methods. Furthermore, parameters like amplitude threshold, short-term energy, amplitude zero-crossing rate, and Mel Frequency Cepstral Coefficients were employed for intrusion event classification [11,12]. Additionally, techniques such as wavelet decomposition and empirical mode decomposition were introduced to perform multi-scale extraction of DAS signal features [13,14], thereby enriching the DAS signal feature database. Based on these characteristics, machine learning methods such as Support Vector Machines, Random Forests, Artificial Neural Networks, and Hidden Markov Models have also been applied to classify DAS signals [15,16,17].
In recent years, time–frequency techniques have been employed to classify intrusion events. For example, Xu et al. [18] used the Short-Time Fourier Transform (STFT) to transform DAS signals into the time–frequency domain, which then served as input for a Convolutional Neural Network (CNN), achieving notable success in classifying intrusion events. Furthermore, Li et al. [19] utilized CNN to extract features from multi-channel signals in spatial DAS systems. They used Long Short-Term Memory (LSTM) to analyze temporal relationships, achieving real-time monitoring of DAS signal intrusions, although with a low detection rate and slow response time. In conclusion, the time domain features of DAS signals are still commonly used to classify intrusion events. However, the extraction of numerous feature parameters can limit the classification accuracy of machine learning, and it is unclear which parameters are crucial for the precise classification of DAS signals.
Given the numerous feature parameters of DAS signals, which may reduce the accuracy of machine learning-based classification, and the absence of an established method for classifying intrusion events in drainage tunnel environments, this study proposed a model based on principal component analysis (PCA) and neural networks for intrusion event classification. Firstly, laboratory experiments adapted to the drainage tunnel environment were conducted to capture DAS signals from intrusion events. Subsequently, these DAS signals and their multi-scale features were extracted to build a feature library. Then, the PCA was used to evaluate the importance of each feature parameter, facilitating data dimensionality reduction. Finally, the post-dimensionality reduction data were served as the input of the neural network. By comparing the effectiveness of intrusion event classification before and after PCA dimensionality reduction, this study aims to provide a new and effective method for classifying intrusion events in drainage tunnel environments.

2. Methodology

2.1. Parameter Selection and Calculation Principles

As stated in the Introduction section, it is known that DAS signals have an extensive number of feature parameters. This study focused on commonly used features for intrusion event classification. The selected features include signal duration T, maximum amplitude A, mean amplitude μ, variance σ2, rise time RT, ring count N, energy E, Kurtosis K, Skewness S, dominant frequency fdom, median frequency fmed, fractal dimension L, signal entropy H, wavelet energy ratio P1 to P6, wavelet fractal dimension L1 to L6, and wavelet signal entropy H1 to H6. Typical DAS signal feature parameters are shown in Figure 1. Then, the parameters’ computation from T to fmed can be found in Grosse et al. [20], the fractal dimension is calculated using the Higuchi algorithm [21], and the computation methods of signal entropy and wavelet-coefficient-related parameters are given as follows:
(1)
Signal Entropy
Signal entropy is often used to measure the uncertainty of a signal or probability distribution. Assume that the DAS signal time series is x ( i ) (i = 1, 2, …, N) and divide the x(i) into j intervals (buckets, j = 1, 2, …, M) according to the signal amplitudes. Then, divide the number of data points N j in each bucket by the total number of points N; the probability P j = N j / N for each bucket is obtained, from which the signal entropy is calculated by the following:
H = i = 1 M P j log 2 P j
(2)
Wavelet-Coefficient-Related Parameters
The wavelet basis db3 was selected to decompose the DAS signal into five levels, resulting in five approximation coefficients and one detail coefficient, denoted as C 1 ~ C 6 . The fractal dimension and signal entropy calculation methods based on wavelet coefficients are similar to those mentioned above, requiring only the replacement of the signal with wavelet coefficients. The process to calculate the energy ratio of wavelet coefficients is given as follows: the energy of each wavelet coefficient is represented by E k = k = 1 6 C k 2 , k = 1, 2, …, 6, and the energy ratio of each coefficient is calculated as:
P k = E k / k = 1 6 E k

2.2. Principal Component Analysis

The feature parameters selected in Section 2.1 are used to classify DAS signals. However, employing these 31 features in a neural network or similar classifiers can reduce the classification accuracy. To address this, PCA is adopted to reduce the dimensionality of the feature parameter matrix while retaining essential information as much as possible. This method identifies correlations within the data and extracts key features (i.e., principal components), transforming them into a new coordinate system where each axis represents a primary variable direction of the original data. The main steps of PCA for the DAS signal feature parameter matrix are given as follows:
Data normalization: Each feature is normalized to ensure feature comparability. Feature normalization is achieved by subtracting the mean of each feature and dividing by its standard deviation, as follows:
Z i j = X i j X ¯ j / σ j
where X ij is the jth feature value of the ith signal, X ¯ j the mean value, and σ j the standard deviation.
Covariance matrix construction: Then, the covariance matrix of the normalized data Z i j is calculated. The covariance matrix elements are the covariances between features, reflecting their interrelationships. The formula for calculating the covariance matrix is as follows:
Cov ( Z i , Z j ) = 1 n 1 k = 1 n Z k i Z k j
where Z k i and Z j i are the ith and jth feature values of the kth signal, respectively.
Eigenvalue and eigenvector calculation: The covariance matrix is decomposed to find its eigenvalues and corresponding eigenvectors. This step reveals the data primary directions, where the magnitude of an eigenvalue indicates the variance (i.e., the amount of information) in that direction, and the eigenvectors define these directions. The formula for eigendecomposition is as follows:
C v = λ v
where C is the covariance matrix, λ represents an eigenvalue, and v is the corresponding eigenvector.
Selection of principal components and data transformation: The most significant eigenvectors are selected based on the magnitude of the eigenvalues (usually those associated with the largest values that account for 80% of the sum of the eigenvalues [22]). These eigenvectors form the basis of the new feature space. The original data are then projected onto this basis to create a new reduced dataset. The data transformation formula is as follows:
T = Z P
where Z is the normalized data matrix, P is the matrix composed of selected eigenvectors, and T is the transformed data matrix.
Through the above principal component analysis, we can obtain insights into the primary variables and their interactions in the data and reduce the data complexity, thereby potentially enhancing the accuracy of DAS signal classification.

2.3. PCA-ANN Classification Model

The feature vector T obtained from the principal component analysis is used to construct the PCA-ANN model for DAS signal classification, as shown in Figure 2. The input layer has 14 neurons, corresponding to the principal component number extracted by PCA (Section 4.1), and there are 29 neurons in the hidden layer according to 2 × neurons + 1 of the input layer [23]; the output layer is designated for DAS signal classification. The weight matrix from the input layer to the hidden layer is denoted as W ( 1 ) (size 14 × 29), and the bias vector is b ( 1 ) (length 29). The weight matrix from the hidden layer to the output layer is W ( 2 ) (size 29 × 1), with a bias b ( 2 ) (single value).
The transfer formula from the input layer to the hidden layer is:
h = f ( W ( 1 ) T + b ( 1 ) )
where f is the activation function for the hidden layer, chosen as the Sigmoid activation function.
The transfer formula from the hidden layer to the output layer is as follows:
y = g ( W ( 2 ) h + b ( 2 ) )
where g is the activation function for the hidden layer, chosen as the softmax activation function.

3. Intrusion Event Simulation

3.1. Experiment Setup

This study focuses on addressing issues threatening the safety of a hydropower station’s slopes, personnel, and equipment. These issues include roof collapses in drainage tunnels, water release, and intrusions by outsiders and animals. To handle this, a DAS monitoring system was set up in Area A of the air raid shelter at Chongqing University (experimental details and monitoring principles as shown in Figure 3) to simulate the environment of the drainage tunnel at the hydropower station and intrusion events. Based on this, research on classifying intrusion events was conducted to support the safety monitoring of the drainage tunnel.
The detailed experiment (Figure 4) is conducted as follows: ① Personnel inspection: Three scenarios were designed, involving one, two, and three personnel, respectively. Inspection personnel will move at the tunnel entrance and distances of 60 m, 120 m, and 300 m, with a walking speed of 0.4 m/s and a running speed of 3 m/s, while recording the corresponding acoustic signals. ② Animal intrusion simulation: Sounds of snakes crawling, bats flying, mice moving, and wild boars walking and howling were downloaded from an internet sound library. Using speakers, these sounds are played at 40 dB, 60 dB, and 80 dB. Additionally, a toy snake is dragged to simulate snake intrusions. ③ Rockall simulation: Rocks weighing 1 kg, 3 kg, and 5 kg are dropped from heights of 0.5 m, 1.5 m, and 3 m to simulate rock collapse intrusion events. ④ Water release simulation: Water flows of 0.5 L/s, 1 L/s, and 2 L/s are dropped from heights of 0.5 m, 1 m, and 2 m to simulate seepage water dropping intrusion events, where the water release rates are controlled by a valve. ⑤ Vehicle intrusion simulation: Driving past the air raid shelter to simulate a vehicle passing by the drainage tunnel. During the experiment, the base parameters for the demodulator are as follows: Sampling frequency, start distance, and stop distance are set to 100 Hz, 2.76 m, and 53.71 m, respectively. System settings include acquisition mode in continuous mode, fiber type as single-mode fiber, and refractive index at 1.468.

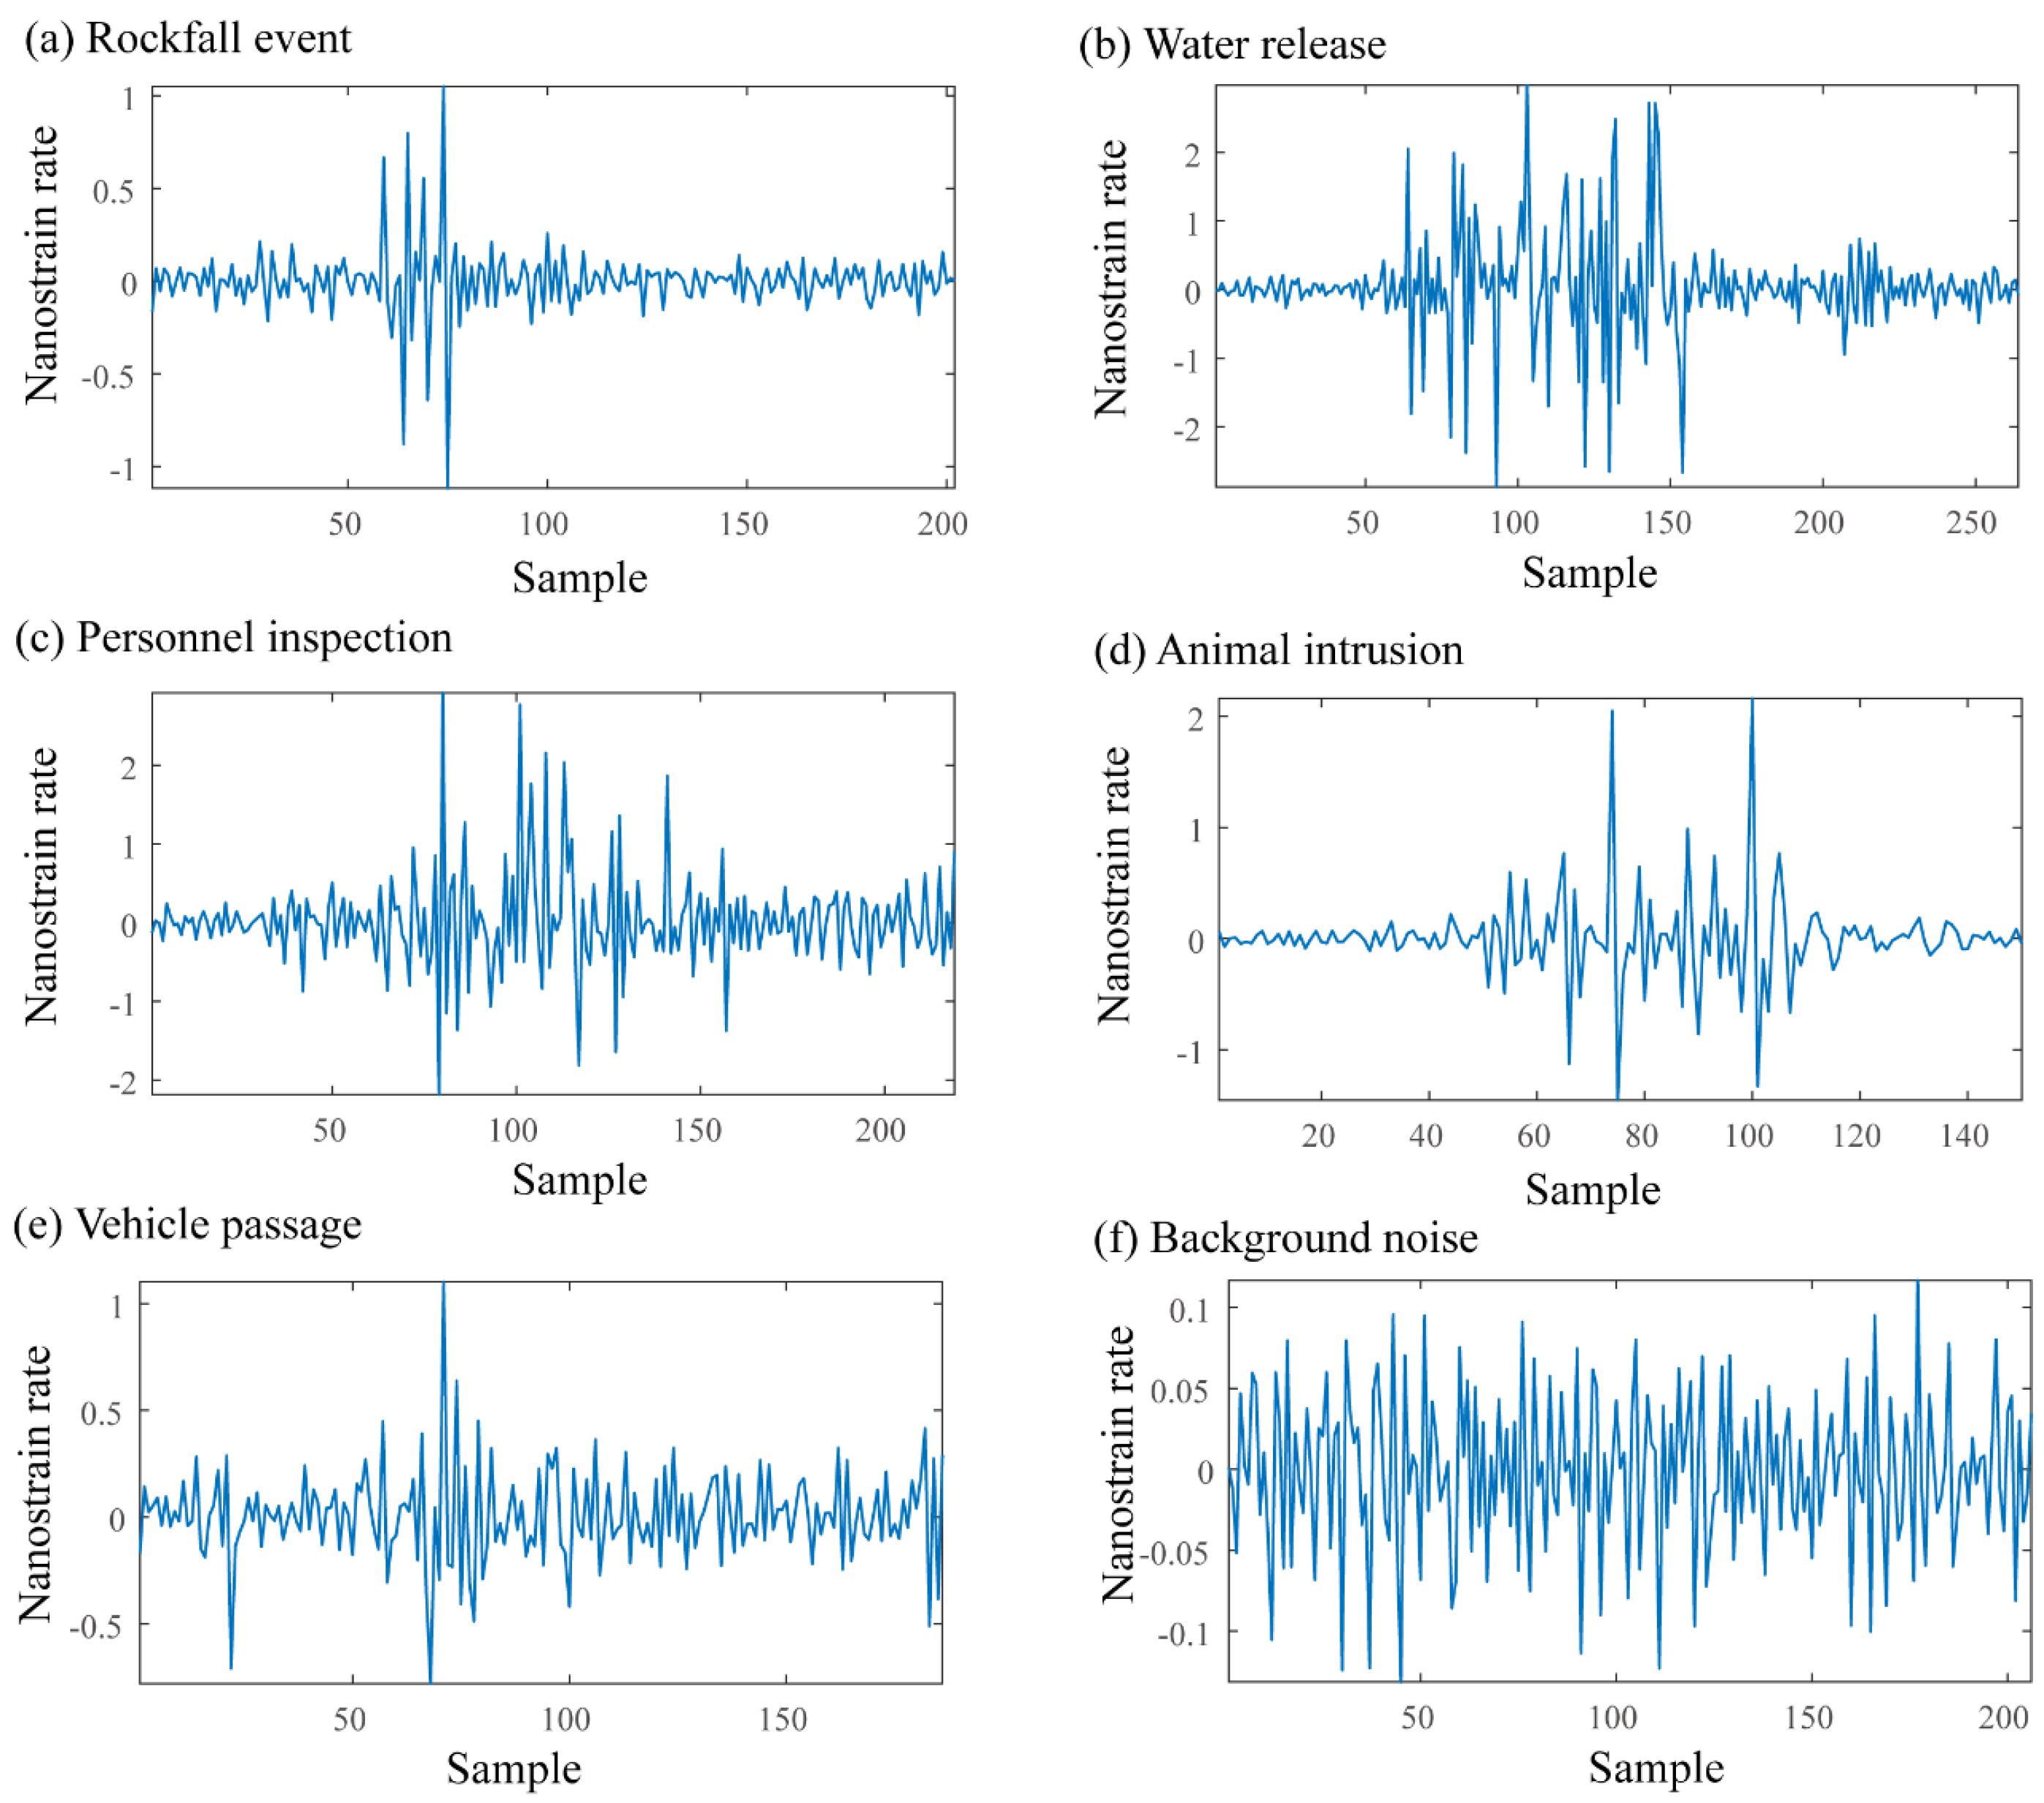
3.2. Character Analysis of Intrusion Event Signals

The experiment obtained typical acoustic signals of rockfall events, water release, personnel inspection, animal intrusion, vehicle passage, and background noise are shown in Figure 5. It is evident that the vehicle passage signal has a low signal-to-noise ratio due to the distance from the car to the sensor. The personnel inspection signal also has a low signal-to-noise ratio; it fluctuates as the amplitude increases when personnel approach the sensor and decreases as they move away. The snake crawling event displays distinct repetitiveness due to multiple simulations of snake movement. The rockfall event and water release show pronounced initial vibrations resulting from the rapid impact of rockfalls or water release.
Then, the computation theories shown in Section 2.1 were used to obtain the acoustic signal characteristics of Figure 5, and the 31 characteristic values are listed in Table 1. There are some differences in the acoustic signal parameters among different types of intrusion events, suggesting a need to understand the statistical characteristics of these parameters more generally. The box plots of typical features for each type of intrusion signal are displayed in Figure 6, with the background noise selected from signals being automatically detected from continuous background signals. These box plots illustrate the disparities among features, with water release signals showing relatively significant differences from other intrusion event types and some features of background noise (mean, rise time, energy, etc.) also differing markedly from other intrusion event types. The feature extraction results indicate that, due to the signal complexity of drainage tunnel intrusion events, it is challenging to classify events using single or simple feature parameters accurately. Thus, there is a need to develop methods based on multi-parameter or image deep learning to classify intrusion events accurately.

4. Result and Discussion

4.1. PCA Analysis

The correlation matrix for the parameters calculated by Equation (4) is shown in Figure 7. It can be seen that there are relatively significant correlations between some parameters. Specifically, a strong correlation exists between the DAS signal amplitude, mean, and variance, suggesting that signal amplitude and dispersion are interrelated. The signal duration significantly correlates with rise time and ring count, which is attributed to the duration encompassing rise time and the number of threshold crossings within the signal duration. Skewness exhibits negative correlations with multiple variables, while signal entropy shows positive correlations. Additionally, wavelet coefficient energy ratios generally display negative correlations, whereas wavelet signal entropies show positive correlations. This complexity in correlations among the feature parameters highlights the necessity of conducting PCA to reduce the impact of these correlations.
Then, Equation (5) was used to obtain the eigenvalues of the correlation matrix depicted in Figure 7. These eigenvalues are arranged in descending order, and their cumulative contribution is calculated, as shown in Figure 8. It is apparent that the first four principal eigenvalues decrease rapidly, accounting for 48.71% of the total variance. The decline in eigenvalues slows after that, with the 14th eigenvalue reaching the 80% cumulative contribution threshold. Therefore, the first 14 eigenvectors corresponding to these eigenvalues are used with Equation (6) to reconstruct the feature parameter matrix.
Furthermore, the component loadings of the first four principal components are depicted in Figure 9. This visualization indicates that signal duration, mean, variance, rise time, ring count, energy, Kurtosis, Skewness, signal entropy, and wavelet signal entropy contribute significantly to PC1. Signal maximum amplitude, mean, variance, energy, dominant frequency, fractal dimension, and wavelet energy ratios contribute significantly to PC2. Overall, parameters related to signal amplitude, such as amplitude, mean, and energy, make substantial contributions to DAS signal classification, followed by signal entropy.

4.2. ANN Classification

In Section 4.1, the feature parameter matrix reconstructed after PCA is used as the input for the ANN to conduct intrusion event classification. Given the emphasis on rockfall and water release events in drainage tunnels, this study showcases the classification results for these two types of intrusion events. For simplification, the rockfall event and water release are marked as “1” and “2”, respectively. Moreover, the results from the ANN using the normalized original feature parameter matrix are also displayed. The proportions of data for training, validation, and test in the ANN are approximately 70%, 15%, and 15%, respectively. As shown in Figure 10, the loss curves of training, validation, test, and all datasets demonstrate good convergence, indicating that the ANN model possesses strong generalization capabilities. Furthermore, classifications made with the PCA-processed data show smaller average errors for DAS signal classes, confirming the necessity of PCA processing.
Moreover, the training, validation, test, and all dataset-based ROC curves for the ANN are presented in Figure 11. The larger the area under the ROC curve on the lower right side, the better the classification performance. It is observed that the training, validation, test, and all datasets-based ROC curves exhibit the following similar patterns: the True Positive Rate (TPR) for rockfall events is better than that for water release when the False Positive Rate (FPR) is low; however, the TPR for rockfall events is worse than that for water release when the FPR is high. For the same type of event, the ROC curves processed with PCA are positioned above those not processed with PCA, indicating that the PCA-processed model offers better classification results.
The classification accuracy of rockfall and water release events is shown in Figure 12, suggesting that the intrusion event classification performance is similar across training, validation, and test datasets, demonstrating the practical fitness of the constructed ANN model. The overall higher classification accuracy in the training, validation, and test data processed with PCA underscores the effectiveness of PCA processing. Specifically, the classification accuracies for intrusion events based on data before and after PCA processing reached 73.6% and 75.6%, respectively, with the PCA-processed data achieving overall classification accuracies of 79.1% for rockfall events and 72.7% for water release.
The above analysis shows that the intrusion event classification performance of the ANN with PCA-processed data surpasses that of the data without PCA processing. This improvement is primarily due to the principal components obtained through PCA retaining the primary variance information of the data, which reduces noise in the data and highlights essential features [24], thereby reducing the complexity and potential overfitting of the ANN model and enhancing the accuracy of the DAS signal classification.

4.3. Comparison with Other Classification Models

Further analysis involves comparing the commonly used Bayesian and logistic regression models (Figure 13). It is evident that both the Bayesian and logistic regression models exhibit lower classification accuracies than the ANN model described in this study, with the logistic regression model slightly outperforming the Bayesian model. The logistic regression model’s overall classification accuracies for rockfall events and water release are 66.1% and 74.3%, respectively. The superior performance of the ANN is attributed to its use of multiple layers and nonlinear activation functions, which enable it to learn and model complex patterns and nonlinear relationships in the data [25]. Consequently, ANNs generally perform better in handling complex classification tasks. The performance of the Bayesian model partially depends on its feature independence assumption [26]. Despite being a linear model, logistic regression can be highly effective if the data can be linearly separated after transformations such as PCA. Then, the logistic regression models generally have fewer parameters to estimate compared to the Bayesian model. The reasons discussed above explain why, in this model, ANNs achieve higher classification accuracy compared to Bayesian and logistic regression models and why logistic regression models outperform Bayesian models.

4.4. How to Further Improve the Intrusion Event Classification Accuracy

The above comparisons show the superiority of our method; however, the overall recognition accuracy of 75.6% is relatively low. This is due to our fiber optics being suspended rather than closely attached to the wall in the experiments, which reduces the signal quality. Additionally, we included not only the most characteristic signals from each intrusion event but also signals from adjacent channels, some of which were of lower quality. Therefore, we can optimize the setup of the fiber optics and select higher quality signals to improve classification effectiveness. Further, we can explore more signal feature parameters and other machine learning classification methods or employ deep learning based on image recognition to enhance the accuracy of intrusion event classification.

5. Conclusions

In response to issues such as unclear characteristics of intrusion events in drainage tunnels, unknown effects of feature parameters on intrusion event classification, and the potential restriction of high-dimensional feature parameters on the accuracy of intrusion event classification, research was conducted based on PCA and neural networks. The main conclusions are as follows:
(1)
A monitoring system based on DAS was established for intrusion event simulation in drainage tunnels. Typical characteristics of events such as rockfalls and water release were obtained. However, due to the complexity of the intrusion signals in the drainage tunnels, it is difficult to accurately classify intrusion events using only one or a few feature parameters.
(2)
Principal component analysis indicated relatively significant correlations among feature parameters, necessitating the use of PCA to mitigate these correlations. Features related to signal amplitude, such as maximum amplitude, mean, and energy, contributed substantially to the DAS signal classification, followed by signal entropy. The first four principal components account for 48.71% of the variance, and there is a 54.8% reduction in the dimensionality of the feature parameters.
(3)
The classification accuracy of intrusion events using PCA-processed data is higher than that without PCA processing, with overall recognition accuracies for rockfall events and water releases at 79.1% and 72.7%, respectively. Moreover, the performance of the artificial neural network model surpassed that of Bayesian and logistic regression models, demonstrating ANNs’ advantage in handling complex models such as intrusion event classification.

Author Contributions

Methodology, X.S.; software, X.S.; writing—original draft preparation, X.S.; funding—P.Y.; supervising—P.Y.; resources, P.Y.; writing—review and editing, W.Z. and Y.P. All authors have read and agreed to the published version of the manuscript.

Funding

This research was funded by the China Yangtze Power Co., Ltd. Technology Development Project under Grant Z422302020.

Data Availability Statement

The data presented in this study are available on request from the corresponding author. The data are not publicly available due to the project confidentiality.

Conflicts of Interest

Authors Peng Yuan and Weihao Zhang are employed by the company China Yangtze Power Co., Ltd. The remaining authors declare that the research was conducted in the absence of any commercial or financial relationships that could be construed as a potential conflict of interest.

References

  1. Yi, C.; Senent, S.; Jimenez, R. Effect of Advance Drainage on Tunnel Face Stability Using Limit Analysis and Numerical Simulations. Tunn. Undergr. Space Technol. 2019, 93, 103105. [Google Scholar] [CrossRef]
  2. Zou, Q.; Chen, Z.; Zhan, J.; Chen, C.; Gao, S.; Kong, F.; Xia, X. Morphological Evolution and Flow Conduction Characteristics of Fracture Channels in Fractured Sandstone under Cyclic Loading and Unloading. Int. J. Min. Sci. Technol. 2023, 33, 1527–1540. [Google Scholar] [CrossRef]
  3. Gu, H.; Lai, X.; Tao, M.; Momeni, A.; Zhang, Q. Dynamic Mechanical Mechanism and Optimization Approach of Roadway Surrounding Coal Water Infusion for Dynamic Disaster Prevention. Measurement 2023, 223, 113639. [Google Scholar] [CrossRef]
  4. Pipitone, C.; Maltese, A.; Dardanelli, G.; Lo Brutto, M.; La Loggia, G. Monitoring Water Surface and Level of a Reservoir Using Different Remote Sensing Approaches and Comparison with Dam Displacements Evaluated via GNSS. Remote Sens. 2018, 10, 71. [Google Scholar] [CrossRef]
  5. Wai-Lok Lai, W.; Dérobert, X.; Annan, P. A Review of Ground Penetrating Radar Application in Civil Engineering: A 30-Year Journey from Locating and Testing to Imaging and Diagnosis. NDT E Int. 2018, 96, 58–78. [Google Scholar] [CrossRef]
  6. Gorshkov, B.G.; Yüksel, K.; Fotiadi, A.A.; Wuilpart, M.; Korobko, D.A.; Zhirnov, A.A.; Stepanov, K.V.; Turov, A.T.; Konstantinov, Y.A.; Lobach, I.A. Scientific Applications of Distributed Acoustic Sensing: State-of-the-Art Review and Perspective. Sensors 2022, 22, 1033. [Google Scholar] [CrossRef]
  7. Shang, Y.; Sun, M.; Wang, C.; Yang, J.; Du, Y.; Yi, J.; Zhao, W.; Wang, Y.; Zhao, Y.; Ni, J. Research Progress in Distributed Acoustic Sensing Techniques. Sensors 2022, 22, 6060. [Google Scholar] [CrossRef] [PubMed]
  8. Xie, T.; Zhang, C.-C.; Shi, B.; Wang, Z.; Zhang, S.-S.; Yin, J. Seismic Monitoring of Rockfalls Using Distributed Acoustic Sensing. Eng. Geol. 2023, 325, 107285. [Google Scholar] [CrossRef]
  9. Zhang, Y.; Zhao, W.; Dong, L.; Zhang, C.; Peng, G.; Shang, Y.; Liu, G.; Yao, C.; Liu, S.; Wan, N.; et al. Intrusion Event Identification Approach for Distributed Vibration Sensing Using Multimodal Fusion. IEEE Sens. J. 2024. [Google Scholar] [CrossRef]
  10. Stajanca, P.; Chruscicki, S.; Homann, T.; Seifert, S.; Schmidt, D.; Habib, A. Detection of Leak-Induced Pipeline Vibrations Using Fiber—Optic Distributed Acoustic Sensing. Sensors 2018, 18, 2841. [Google Scholar] [CrossRef]
  11. Fang, N.; Wang, L.; Jia, D.; Shan, C.; Huang, Z. Walking Intrusion Signal Recognition Method for Fiber Fence System. In Proceedings of the 2009 Asia Communications and Photonics conference and Exhibition (ACP), Shanghai, China, 2–6 November 2009; pp. 1–6. [Google Scholar]
  12. Sun, Q.; Feng, H.; Yan, X.; Zeng, Z. Recognition of a Phase-Sensitivity OTDR Sensing System Based on Morphologic Feature Extraction. Sensors 2015, 15, 15179–15197. [Google Scholar] [CrossRef] [PubMed]
  13. Wang, B.; Pi, S.; Sun, Q.; Jia, B. Improved Wavelet Packet Classification Algorithm for Vibrational Intrusions in Distributed Fiber-Optic Monitoring Systems. Opt. Eng. 2015, 54, 055104. [Google Scholar] [CrossRef]
  14. Zhao, Y.; Zhong, Z.; Li, Y.; Shao, D.; Wu, Y. Ensemble Empirical Mode Decomposition and Stacking Model for Filtering Borehole Distributed Acoustic Sensing Records. Geophysics 2023, 88, WA319–WA334. [Google Scholar] [CrossRef]
  15. Xu, C.; Guan, J.; Bao, M.; Lu, J.; Ye, W. Pattern Recognition Based on Enhanced Multifeature Parameters for Vibration Events in φ-OTDR Distributed Optical Fiber Sensing System. Microw. Opt. Technol. Lett. 2017, 59, 3134–3141. [Google Scholar] [CrossRef]
  16. Wang, X.; Liu, Y.; Liang, S.; Zhang, W.; Lou, S. Event Identification Based on Random Forest Classifier for Φ-OTDR Fiber-Optic Distributed Disturbance Sensor. Infrared Phys. Technol. 2019, 97, 319–325. [Google Scholar] [CrossRef]
  17. Wu, H.; Qian, Y.; Zhang, W.; Tang, C. Feature Extraction and Identification in Distributed Optical-Fiber Vibration Sensing System for Oil Pipeline Safety Monitoring. Photonic Sens. 2017, 7, 305–310. [Google Scholar] [CrossRef]
  18. Xu, C.; Guan, J.; Bao, M.; Lu, J.; Ye, W. Pattern Recognition Based on Time-Frequency Analysis and Convolutional Neural Networks for Vibrational Events in φ-OTDR. Opt. Eng. 2018, 57, 016103. [Google Scholar] [CrossRef]
  19. Li, Z.; Zhang, J.; Wang, M.; Zhong, Y.; Peng, F. Fiber Distributed Acoustic Sensing Using Convolutional Long Short-Term Memory Network: A Field Test on High-Speed Railway Intrusion Detection. Opt. Express 2020, 28, 2925–2938. [Google Scholar] [CrossRef]
  20. Grosse, C.U. Acoustic Emission Testing: Basics for Research-Applications in Civil Engineering, 1st ed.; Grosse, C., Ohtsu, M., Eds.; Springer: Berlin/Heidelberg, Germany, 2008; ISBN 978-3-540-69895-1. [Google Scholar]
  21. Wanliss, J.A.; Wanliss, G.E. Efficient Calculation of Fractal Properties via the Higuchi Method. Nonlinear Dyn. 2022, 109, 2893–2904. [Google Scholar] [CrossRef]
  22. Lever, J.; Krzywinski, M.; Altman, N. Principal Component Analysis. Nat. Methods 2017, 14, 641–642. [Google Scholar] [CrossRef]
  23. Reyes, J.; Morales-Esteban, A.; Martínez-Álvarez, F. Neural Networks to Predict Earthquakes in Chile. Appl. Soft Comput. 2013, 13, 1314–1328. [Google Scholar] [CrossRef]
  24. Tharwat, A. Principal Component Analysis—A Tutorial. Int. J. Appl. Pattern Recognit. 2016, 3, 197–240. [Google Scholar] [CrossRef]
  25. Abdolrasol, M.G.M.; Hussain, S.M.S.; Ustun, T.S.; Sarker, M.R.; Hannan, M.A.; Mohamed, R.; Ali, J.A.; Mekhilef, S.; Milad, A. Artificial Neural Networks Based Optimization Techniques: A Review. Electronics 2021, 10, 2689. [Google Scholar] [CrossRef]
  26. Geiger, D.; Verma, T.; Pearl, J. Identifying Independence in Bayesian Networks. Networks 1990, 20, 507–534. [Google Scholar] [CrossRef]
Figure 1. Schematic diagram of calculation principle of typical signal characteristics.
Water 16 02409 g001
Figure 2. PCA-ANN-based DAS signal classification model.
Water 16 02409 g002
Figure 3. DAS monitoring experimental system and its principle.
Water 16 02409 g003aWater 16 02409 g003b
Figure 4. Simulation experiment of drainage tunnel intrusion events.
Water 16 02409 g004
Figure 5. Typical DAS signals of intrusion events.
Water 16 02409 g005
Figure 6. Box plots of typical features for each type of intrusion event. The numbers 1 to 6 on the horizontal axis of each box plot correspond to the rockfall event, water release, personnel inspection, animal intrusion, vehicle passage, and background noise, respectively.
Water 16 02409 g006aWater 16 02409 g006b
Figure 7. Correlation matrix of the 31 parameters. The parameter id corresponds to that shown in Table 1.
Water 16 02409 g007
Figure 8. Eigenvalues and cumulative contribution of principal components.
Water 16 02409 g008
Figure 9. Component loadings of the first four principal components.
Water 16 02409 g009
Figure 10. ANN loss curve and classification error before and after the PCA process.
Water 16 02409 g010
Figure 11. ROC curves before and after PCA processing.
Water 16 02409 g011
Figure 12. DAS signal classification accuracy before and after PCA processing.
Water 16 02409 g012
Figure 13. Comparison of classification accuracy using PCA-processed data: Bayesian model vs. logistic regression.
Water 16 02409 g013
Table 1. Acoustic signal characteristics for the events shown in Figure 5.
No.ParameterVehicle PassagePersonnel InspectionAnimal IntrusionRockfall EventWater ReleaseBackground Noise
1T1850.002180.001490.002010.002630.00/
2A1.102.922.161.122.980.13
3μ0.160.390.210.100.420.04
4σ20.050.370.160.030.550.00
5RT700.00790.00990.00730.001020.00/
6N26.0020.0010.007.0023.00/
7E8.7581.2223.626.74144.880.49
8K6.928.6214.0719.078.322.84
9S0.361.001.32−0.210.02−0.26
10fdom39.7847.4942.6734.6540.5340.78
11fmed49.4649.7750.0050.0049.6250.00
12L1.171.151.051.171.091.16
13H2.142.041.841.392.022.95
14P10.710.660.670.840.650.69
15P20.160.150.280.100.160.20
16P30.090.050.040.030.110.06
17P40.010.060.000.010.060.01
18P50.010.010.000.000.000.00
19P60.020.070.000.020.010.03
20L10.730.870.700.910.910.95
21L20.950.790.880.901.090.77
22L30.800.980.551.060.881.08
23L40.471.000.250.700.830.77
24L51.121.160.421.530.701.44
25L60.860.930.510.270.560.45
26H12.482.101.921.321.973.00
27H22.272.191.961.782.282.89
28H32.952.452.432.621.842.77
29H43.022.442.302.702.122.82
30H52.922.482.282.372.502.66
31H61.571.972.112.412.142.37
Note: The background noise data were randomly extracted from periods without any intrusion experiments. Many of these signals, similar to Figure 5f, have no significant amplitude anomalies, making it impossible to define parameters such as signal duration (T), rise time (RT), and ring count (N).
Disclaimer/Publisher’s Note: The statements, opinions and data contained in all publications are solely those of the individual author(s) and contributor(s) and not of MDPI and/or the editor(s). MDPI and/or the editor(s) disclaim responsibility for any injury to people or property resulting from any ideas, methods, instructions or products referred to in the content.

