Abstract
Accurate and timely information on building age is essential for mitigating the impacts of natural disasters such as earthquakes and floods. Traditional methods for collecting these data are often inefficient and costly. This study leverages remote sensing and machine learning to classify building age and integrate this information into a comprehensive flood hazard map for Al Ain City. By combining building age with elevation, topography, land use, population density, and other factors, we generated a flood hazard map that effectively identifies high-risk areas. Our results show that a significant portion of the city is has low potential for flooding (61%), while others face moderate (32%), high, or very high flood hazards. This study provides crucial information for informed decision-making regarding future urban planning, disaster management, and development strategies in Al Ain City. By identifying vulnerable buildings in advance, it supports efforts to reduce disaster risks, protect lives, and optimize resource allocation.
1. Introduction
A hazard is an event, condition, or process that has potential for causing injury, loss of life, damage to the environment or property, and social and economic disruption (UNDRR, 2024). Hazard map shows where a hazard is located. Risk is the probability of an outcome having a negative effect on people, systems, or assets [1]. Flood hazard maps form the basis for a preliminary risk assessment. Risk maps are intended as an overlay of hazard maps and exposure in order to identify the exposed elements on which to intervene [2]. Many researchers used “Flood hazard maps”. For example, Asare-Kyei et al., Dung et al., Ogania et al., and Hamlat et al. [3,4,5,6]. Other researchers, such as Papaioannou et al. [7] and Allafta and Opp [8], used “flood prone areas” or “Flood vulnerable zones”. Flood-hazard mapping is a crucial tool for mitigating the devastating impacts of floods on communities worldwide [9]. As climate change leads to more frequent and intense extreme weather events, it has become increasingly important to understand and manage flood risks. Flood-hazard mapping involves the systematic collection, analysis, and visualization of data to identify areas at risk of flooding and make informed decisions about land use planning, emergency response strategies, and infrastructure development [2,3]. The process of flood-hazard mapping begins with gathering data on rainfall patterns, river flow rates, topography, and land use [4,5]. Hydrological factors such as rainfall patterns in addition to topographic data, land use, and drainage networks are important in flood mapping [10,11]. Rainfall patterns, both intensity and duration, directly influence the likelihood of flooding. Extreme rainfall events can overwhelm drainage systems and urban infrastructure, leading to inundation. Rainfall data helps in predicting how floodwater will spread across landscapes and flooding magnitudes. This information is integrated into computer models and geographic information systems (GIS) to simulate and predict flooding scenarios. By analyzing historical flood data and considering environmental changes, experts can assess the probability of future flooding events [6].
A study conducted in Eldoret Municipality, Kenya, used an integrated approach that combined an analytical hierarchy process (AHP) and GIS-analysis techniques to model and predict the magnitude of flood risk across the area. Flood-risk vulnerability maps the causative factors of flooding, such as the distribution of rainfall, elevation and slope of the terrain, drainage networks and their density, type of land use and land cover (LULC), and soil type [7]. Saha and Agrawal [12] identified several similar parameters as factors that affect flooding, including drainage density, elevation, flow accumulation, LULC, roughness, slope of the terrain, and the topographic wetness index. Another study conducted in suburban areas in the Fangshan District in Beijing used a model that, following disaster-risk theory, defines flood risk due to hazards and vulnerability. This model can quantitatively reflect the relative magnitude and spatial distribution patterns of flood risk in a region [13].
Torab [14] performed a morphometric analysis that enabled him to identify basins with high probabilities for flash floods. A similar hydrologic study conducted in the northern region of the United Arab Emirates used geospatial, hydrologic, and hydrodynamic models to determine potential flooding areas and magnitudes [15]. The study identified the magnitudes of floods and areas that may experience large floods with return periods varying from 50 to 500 years. The identification of areas with varying levels of vulnerability to flash floods aids policymakers and decision-makers in making informed choices about the efficacy of protective structures to mitigate the risk of future flash floods [16].
In addition to the factors mentioned in these previous studies—such as elevation, slope, LULC, rainfall, and soil type—building age has been identified as an important damage factor in studies related to flood-risk mapping [17,18,19,20]. The ages of buildings can influence their vulnerability to flooding because older structures are likely to have employed different construction standards and materials than newer ones. One recommendation from the post-disaster building damage assessment report following the 2010 Haiti earthquake was to create databases that include the numbers of buildings by occupancy, construction type, floor areas, heights, and age [21]. Building age is important in many applications. For example, it can be used to identify existing buildings that require energy-consumption optimization or retrofitting [22]. This topic has gained significant momentum with the move toward smart cities and blockchain technology. Building ages can also be obtained from municipalities or government agencies [23,24].
In the present work, we first employed the Scopus database to identify published articles that focused on the application of GIS and remote sensing in flood-hazard mapping and integrated building age. We chose the Scopus database because it has a larger journal coverage than other databases [25]. We constructed a comprehensive search query—using PRISMA (Preferred Reporting Items for Systematic Reviews and Meta-Analyses)—that incorporated terms such as “flood-risk” or “flood-hazard”, along with “GIS”, “remote sensing”, or “building age”. We applied this query to the abstracts, titles, and keywords of the articles. We specifically confined the search to peer-reviewed English-language journals. Through this systematic process, we identified 1263 documents published between 2003 and 2023 and included them in our review. Of the 1263 articles, only 2 incorporated building age in flood-hazard modeling to generate flood-hazard maps [17,20]. Thus, we found it necessary to add building age into the flood-hazard model to obtain a comprehensive understanding of the risks associated with flooding. Considering building age as a flood-hazard factor helps in assessing the potential impact and susceptibility of different structures to flooding events. Older buildings may have outdated drainage systems or weakened foundations, increasing their vulnerability, while newer structures might incorporate flood-resistant designs. Incorporating this information into flood-hazard mapping can offer a more nuanced understanding of an area’s susceptibility to flooding, allowing for better-informed decision-making in urban planning and disaster preparedness. The advancement of remote sensing technologies and the availability of high-resolution satellite images, coupled with easily accessible cloud computing platforms (e.g., Google Earth Engine: GEE), provide valuable resources for extracting building age data efficiently and at scale. These technological developments enable researchers to gather extensive building information without the need for time-consuming on-site surveys. Therefore, in this study, we leveraged remote sensing techniques to derive building age data and incorporate it into our flood-hazard model, enhancing the accuracy and comprehensiveness of our risk assessments.
There is a very clear gap in the literature regarding the inclusion of building age in flood hazards maps and models. Therefore, the main goal of the present study is to address this gap by using remote sensing and machine learning to classify buildings according to their age and to integrate this information into the generation of a comprehensive flood-hazard map. We hypothesize that areas near valleys and city centers (old areas) are more likely to be vulnerable to flooding. The novel component of our work is the use of machine learning to determine building ages and to couple this information with other factors to produce a flood-hazard map. This paper is organized so that the methodology covered in Section 2 and Section 3 addresses the results, and Section 4 focuses on the discussion. Our conclusions and recommendations are addressed in Section 5.
2. Materials and Methods
2.1. Study Area
The city of Al Ain is located in the eastern region of the United Arab Emirate (UAE) (Figure 1). It is the fourth largest city in the UAE and is experiencing rapid growth. The population of Al Ain is currently 284,730, as reported by the Statistics Centre in Abu Dhabi in 2020. Census data reveal that the population of Al Ain is clustered in urbanized areas located primarily in the city’s east and center. Three main valleys drain from the northeast to the southwest through Al Ain; they are the Wadi Al Tiwayyah, Wadi As Silemi, and Wadi Al Ain. Wadi Al Tiwayyah and Wadi As Silemi come together in the western part of the city. Flood management and response in the UAE is under NCEMA (National Emergency Crisis and Disaster Management Authority), which encompasses strategic planning, inter-agency coordination, and centralized command through the National Operations Center. NCEMA provides guidance to federal entities, implements training programs, and focuses on strengthening infrastructure resilience—all crucial elements in flood management. The authority also establishes performance standards, conducts predictive research, and makes legislative recommendations, which would inform flood-related policies. Additionally, NCEMA’s adaptive approach suggests a flexible stance in addressing evolving flood risks [26].
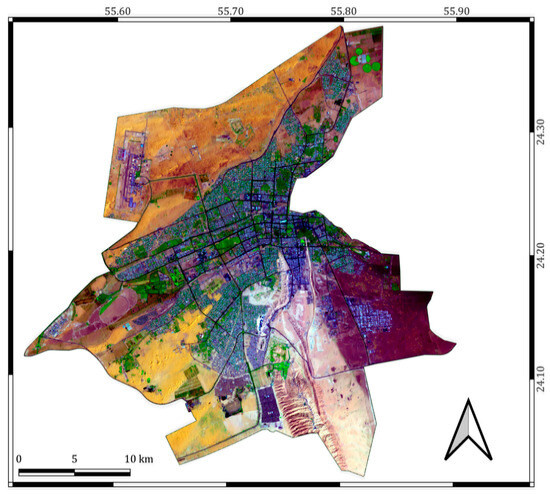
Figure 1.
The study area (Al Ain city).
The United Arab Emirates is located in an arid region. Although rain is infrequent, heavy rain can occur in a short time and cause flash flooding [15,27]. Average monthly rainfall from four meteorological stations in the city during the period 2013–2020 showed that the rainfall is high during winter (25 mm) and low during summer (<5 mm) (Figure 2). Although the average amount of rainfall is low, flooding occurs most commonly from rare heavy rainfall (trigger) when natural valleys and drainage systems lack the capacity to convey excess water (flash flood). For example, in February of 1988 (average rainfall: 200–300 mm), 1990 (average rainfall: 40–130 mm), and 1993 (average rainfall: 30–90 mm) [27]. The most recent severe one happened on 16 April 2024 with 254 mm of rain in less than 24 h, and according to the National Centre of Meteorology, this is the highest amount of rainfall that is above the average since 1949 [28]. The floods resulted in some damage to buildings, roads, farms, and gardens, but there is no quantification of the loss. An increase in built-up areas and the absence of hydraulic-control structures at the outlets of streams and valleys are some of the factors that exacerbate flooding events [14,15,29]. The rainy season in the UAE occurs during winter (October to March). However, some rain events also occur in summer [30], possibly due to climate change. Flash floods, which are triggered by a combination of climatic, geomorphological, and hydrogeological factors, pose a recurring threat to the city of Al Ain. These destructive events occur almost every year and result in significant damage, particularly to buildings and farms [27] (Figure 3). For instance, on 4 August 2023, Al Hayer (northern Al Ain) was hit by heavy rainstorms and hailstorms, which caused trees to fall and created traffic disruption [29]. Varying degrees of rainfall, ranging from light to heavy, occurred on 21 July 2019, resulting in flooding in certain regions [31]. These flash floods caused severe damage to buildings and agricultural areas. Buildings are particularly vulnerable to flooding, with the potential for structural damage, property loss, and disruption to essential services. Farms and agricultural lands also suffer significant losses, including crop damage, soil erosion, and potential contamination of agricultural products [14,27].
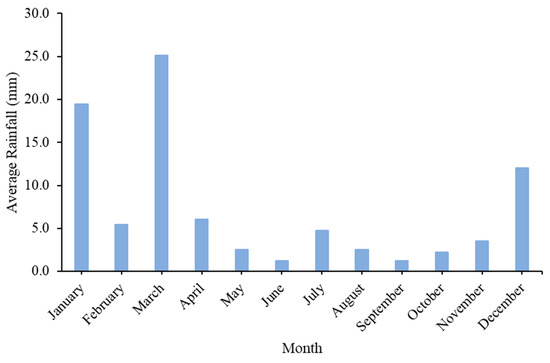
Figure 2.
Average monthly rainfall from four meteorological stations in Al Ain city during the period 2013–2020.
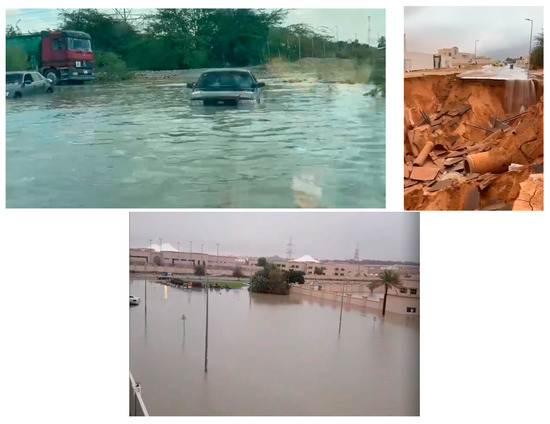
Figure 3.
Flooding in Al Ain on 16 April 2024, and sinkholes on the road after the flash flood (top-right).
In addition to property damage, previous floods in Al Ain resulted in other adverse effects, such as school closures and water levels reaching above the tires of some cars. These incidents highlight the broader impact of flash floods on communities and infrastructure [32,33]. Al Ain Municipality funded many projects to develop preventive measures such as implementing zoning rules and improving the capacity of the valleys. Recently, the municipality spent around US $32.4 million to reduce flash flooding hazards in the city [34].
2.2. Flood-Hazard Factors and Mapping
In this study, the focus is on flood hazard maps (identification of areas that might be potentially flooded). Our flood-hazard map was generated by a weighted overlay of factors that are important for assessing flood susceptibility (Figure 4). These factors include building age, elevation, land use, geology, topographic position index (TPI), curve number (CN), topographic wetness index (TWI), population density, and proximity to a valley. We discuss each of these factors in more detail below. We excluded rainfall as a factor because the average rainfall within the study area ranges from 3 mm to 11 mm and does not vary spatially within the study area.
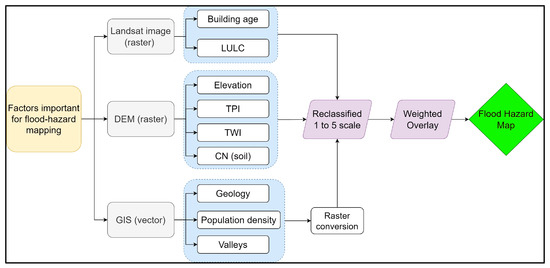
Figure 4.
Flow chart illustrating the methodology applied to the study area.
Rainfall: The average recorded rainfall at four meteorological stations in the study area for the period 2013–2020 showed that the difference between the stations is small (Table 1, Figure 2). Moreover, the study area is small (768 square kilometers), and it represents 0.92% of the UAE area (83,600 square kilometers). In addition to this, DEM, valleys, and TWI are included, and they have a link to the flow of water. Therefore, the rainfall is assumed to be equal across the study area. However, in cases of large areas and spatial variability of rainfall, then the rainfall must be added as an input factor in the hazard model. Some previous studies treated rainfall as equal and did not include it in the generation of flood hazard maps. For example, a study by Elmahdy et al. [29] constructed flash flood parameters based on terrain and geohydrology (lithology, stream network), and rainfall is not included. Similarly, Torab [14] produced a flood hazard map based on land use and morphometric factors (stream network) for major flood channels in Al Ain city and did not include rainfall.

Table 1.
Rainfall at four meteorological stations within the study area for the period 2013–2020.
Building age: Building age is an essential parameter for disaster-risk mapping [19] because older buildings are more easily damaged by disasters such as earthquakes and flooding. In comparison, newer buildings have better resistance to such disasters. To integrate building age into flood hazard mapping, we extracted building ages from LULC maps. We prepared LULC maps of the study site using Landsat images from 1972, 1993, 2013, and 2022 (Table 2). Landsat data (30-m resolution) was used because it is freely available and has historical records from 1972. Other freely available data with better resolution, such as Sentinel 2A (10-m resolution), is available from 2015 and afterward [35], and this will not show older buildings. The building age was not applied to individual buildings but to groups of homogenous settled areas by aggregation. We began the selection of images for analysis in 1972, when Landsat images first became available. Initially, we intended to use 10-year intervals for image classification; however, due to factors such as image-quality issues (such as cloud cover and dropped scan lines) and limited availability, strict adherence to 10-year intervals was not possible.
Table 2.
Datasets and their sources.
To classify the images at the city level, we employed a Random Tree (RT) classifier that categorized each image pixel into one of the following five classes: built-up area, desert, grass, highland, and palm trees. The RT classifier uses ensemble learning, in which a training dataset is used to create a set of decision trees. This nonparametric algorithm requires two parameters to create the model: the total number of trees and the total number of features in each split [39]. To train the classifier, we used a significant number of training samples (379 samples in total), with varying proportions for different types of land cover (built-up area, desert, grass, palm trees, and highlands). Because deserts have different soil textures and built-up areas frequently contain a mix of trees, we used more samples for these two types of environments. We assessed the accuracy of the classification using 250 testing samples. We used aerial photography from 1976 to obtain the training samples for the 1972 Landsat images because identifying training samples directly from those Landsat images was challenging. For subsequent years, we prepared the training samples by adjusting the Landsat image-band combinations and referring to Google Earth. We then used testing samples to assess the classification accuracy. The accuracy assessment metrics employed in this study were the producer’s accuracy (PA), the user’s accuracy (UA), and the Kappa index. The Kappa index evaluates the classification performance by comparing it to a random assignment and determining whether or not the classification outperforms random chance. Finally, we extracted the built-up portion of each LULC category for flood vulnerability mapping.
LULC: Land use controls the infiltration and runoff of rainfall. For example, built-up areas such as buildings and roads decrease water infiltration, whereas green areas increase water infiltration [3]. Using supervised classification, we employed a Landsat satellite image to create the LULC map. We used 250 randomly selected ground truth samples to verify the classification’s accuracy and form a confusion matrix.
Elevation: Elevation plays a crucial role in assessing flood susceptibility. Lower elevations have a higher probability of flooding, making elevation a strong indicator of flood vulnerability [5]. However, elevation alone is not a determining factor because some areas with low elevation may have good drainage systems.
TPI: The TPI is a measure that compares the elevation of each cell with the average elevation of the surrounding cells within a specified radius [40]. Positive TPI values correspond to ridges, whereas lower values correspond to lower elevations than the surrounding areas, often corresponding to valleys [41]. Values close to zero indicate flat areas. The TPI is commonly used for landform classification, and—by considering factors such as slope and drainage networks—it plays a crucial role in identifying flood-prone areas [42]. In this study, we generated the TPI from a digital elevation model using ArcMap 10.8.2. The TPI value can be calculated as follows [43]:
where is the mean elevation of neighborhood within radius and total number of surrounding points . The TPI is computed by subtracting the elevation at the central point and average elevation .
TWI: We derived the TWI from a combination of flow direction, flow accumulation, and slope data (Equation (1); [43]):
where TWI is the topographic wetness index, is the up-slope area per unit contour length (catchment area), and tan is the gradient of the slope. To improve the visual representation and eliminate local irregularities and unwanted noise, we smoothed the resulting TWI output using bilinear interpolation (Figure 4). We then reclassified the file into five distinct classes using the natural-breaks (Jenks) method [44]. This classification method maximizes the variance between classes and minimizes the variance within classes in an attempt to find naturally occurring groupings within the data.
CN: The CN is an empirical parameter commonly used in hydrology to estimate direct runoff or infiltration resulting from excess rainfall [7,45]. We extracted the CN values from the USDA-NRCS database (1986), which provides comprehensive information about the hydrological characteristics of different land use types. The CN value, which ranges from 0 to 100, considers the hydrologic soil group, land use, and soil-moisture conditions. A higher CN indicates a greater potential for runoff and lower infiltration, as is typically observed in urban areas. Conversely, a lower CN implies lower runoff and higher infiltration rates, which are often associated with drier soil conditions [46]. To incorporate CN into the analysis, we merged the soil and land use layers and included relevant attributes—such as the hydrologic soil group, land use type, and corresponding CN values—for each land use type (Table 3). This integration of soil and land use data with the appropriate CN values allows for a more accurate assessment of runoff and infiltration processes.
Table 3.
Curve Numbers (CN) for the land use/land cover (LULC) in the study area modified after [45].
Geology: Similar to soil type, geology also plays a significant role in determining the amount of water that infiltrates into, or runs off of, a particular area. Different types of rocks have varying capacities for water infiltration. Hard rocks, such as igneous and compacted sedimentary rocks, typically exhibit low infiltration rates and higher runoff. On the other hand, fissured and weathered rocks tend to have higher rates of water infiltration [47,48,49]. Therefore, incorporating geology into flood modeling is crucial for accurate assessment. In the study area, the predominant rock type is sedimentary.
Population density: Population density is an important factor for disaster mitigation. For example, a flood will be more devastating if it occurs in an area with a higher population density than in an area with a lower population density [50].
Valleys: Valleys play a crucial role in assessing the risk of flooding, particularly when they intersect with built-up areas, where overflows can pose significant threats of property damage. To incorporate proximity to the main valleys in our study area, we created buffer zones around them. Previous research by Hazarika et al. [51] employed a proximity range starting at 300 m and increasing in 300-m increments. Similarly, a study conducted in Ile-Ife used a 30-m buffer zone to delineate flood-prone areas [52]. In our study, we implemented each buffer zone starting at 300 m and increased it in 200-m increments (300 m, 500 m, 700 m, 900 m, and 1100 m).
2.3. Score and Weight Assignment
The scores and weights set by the experts (AHP) were assigned to the GIS layers (Table 4). The GIS layers were then converted to integer-type raster format and reclassified to a common scale (1 to 5). A value of 1 represents a very low probability of flooding, whereas a value of 5 represents a very high probability of flooding. The scale 1 to 5 is based on INFORM guidelines [53]. INFORM is a collaboration of the Inter-Agency Standing Committee Reference Group on Risk, Early Warning, and Preparedness and the European Commission.
Table 4.
Confusion matrix for 262 LULC classifications of the 2022 Landsat image.
The calculation of weighted values for the criteria involved a multi-step process. First, a comprehensive literature review identified the most relevant factors influencing flood hazards in urban environments. Subsequently, a panel of five experts in hydrology, urban planning, and disaster management evaluated the relative importance of each criterion. The Analytic Hierarchy Process (AHP) was employed to systematically quantify these expert judgments through pairwise comparisons on a 1–9 scale [54]. Pairwise comparison matrices were normalized, and eigenvectors were calculated to derive the final weights for each criterion. A consistency check was performed to ensure the reliability of these weights, aiming for a consistency ratio (CR) below 0.1 [55]. To inform the weight assignment, previous studies [6,16] and expert consultations on flood damage assessment were considered. For instance, a study in Algeria assigned a 27% weight to proximity to rivers [6], while a Philippine study allocated 22.6% to drainage density [18]. Both studies prioritized building density with a 43.7% weight. The GIS software (ArcGIS Desktop 10.8.2) offers a user-friendly platform for adjusting weights based on expert or user preferences. Further refinement of weights can be achieved through additional AHP iterations [6,18].
3. Results
Building Age Extraction
We assessed the accuracy of the classification of built-up areas using testing samples for each LULC type [56]. For the built-up areas for 2022, the PA was 0.92 and the UA was 0.90 (Table 4). The achieved accuracy surpassed the threshold (85%) recommended by Foody [57] and Thomlinson et al. [58].
We classified the built-up areas derived from the LULC map into four distinct categories based on the construction periods of the buildings. Specifically, these four groups were as follows: buildings constructed before 1972, between 1972 and 1993, between 1993 and 2013, and between 2013 and 2022 (Figure 5). The oldest buildings are concentrated in the city center and northeast of the study area, whereas the newer ones are located around the periphery of the city (Figure 4).
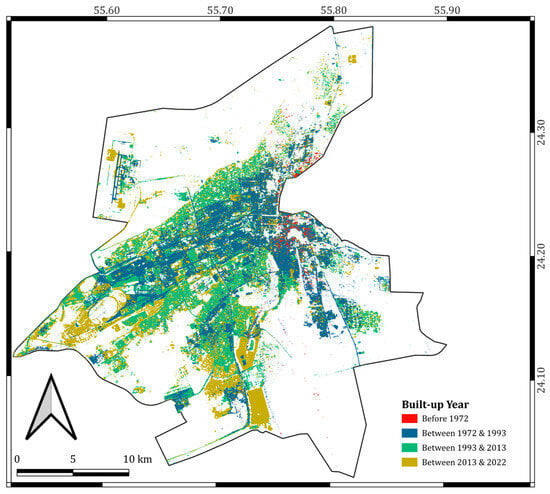
Figure 5.
Building age extracted from the land use and land cover map.
We reclassified the factors deemed significant for flood-hazard assessment—including building age, elevation, land use, geology, TPI, CN, TWI, population density, and proximity to valleys—into a range of values on a scale from 1 to 5. Here, a value of 1 represents a very low potential for flooding, whereas a value of 5 represents a very high risk. To refine the analysis further, we assigned weights to each factor based on its importance within the study area (Table 5).
Table 5.
Weights of the factors considered in generating the flood-hazard map.
The high TWI values correspond to the drainage systems in the study area and to the zones with high flood hazards (Figure 6). Hence, TWI values alone could be used to delineate flood-prone regions [59] because they incorporate elevation, slope, flow direction, and flow accumulation. Indeed, Papaioannou et al. [7] established that TWI is the most significant index/factor, followed closely by CN.
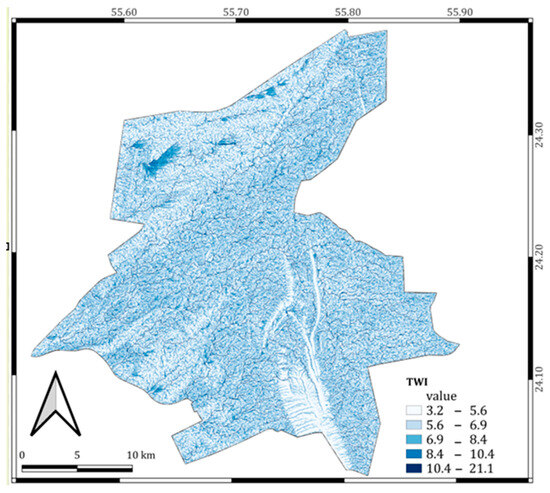
Figure 6.
Map of the topographic wetness index (TWI) in the study area.
After assigning weights to each factor that contributes to the assessment of flood-hazards, we used the weighted overlay function in Arc Map 10.8 to generate the comprehensive flood hazards map shown in Figure 7. This flood-hazard map demonstrates that the areas with the highest flood hazards—ranging from very high to high—are concentrated mainly within the primary valleys that extend from the northeast to the southwest through Al Ain city. Conversely, regions characterized by low risk of flooding are situated primarily along the city’s periphery, which is predominantly covered by desert terrain. Notably, the Jebel Hafit Mountain area has a very low potential for flooding. Areas that are located far from the main valleys, such as the airport, fall within the medium-risk category for potential flooding incidents.
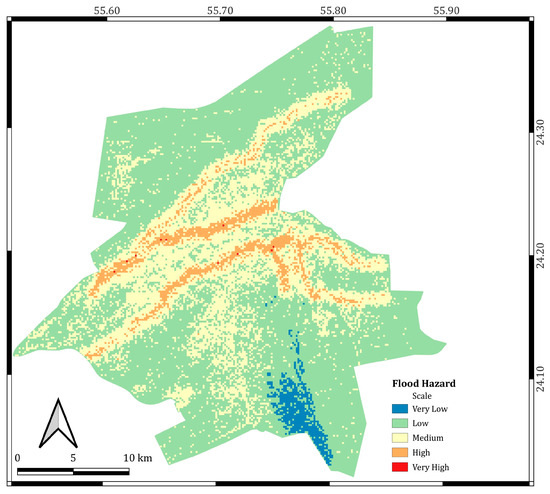
Figure 7.
Flood-hazard map of Al Ain city.
Approximately 61% of the study area is classified as low potential for flooding, and the medium potential category encompasses approximately 32% of the area. The high-potential flooding areas account for approximately 5% of the study area, whereas less than 0.1% of the total area has a very high flood hazard.
Because the high hazard is found in proximity to the valleys, we generated a three-level buffer zone around each one to estimate the influence on different LULC classes. The first level is 500 m, which is very close to the valley and susceptible to flooding. The second and third levels are 1000 m and 1500 m, respectively. We extracted the LULC areas within each buffer zone level, as shown in Table 6. Furthermore, we identified heritage sites, schools, hospitals, petrol stations, mosques, and hotels within each buffer zone (Figure 8). Such information is essential for policymakers and disaster-risk-management experts to use in crafting plans for areas that require greater attention. Furthermore, the city has used green areas as buffers to reduce floods, as evident in the preservation of oases and in the development of Wadi Park (Figure 9).
Table 6.
Land use and land cover (LULC) areas that fall within the 500-m, 1000-m, and 1500-m buffer zones of a valley.
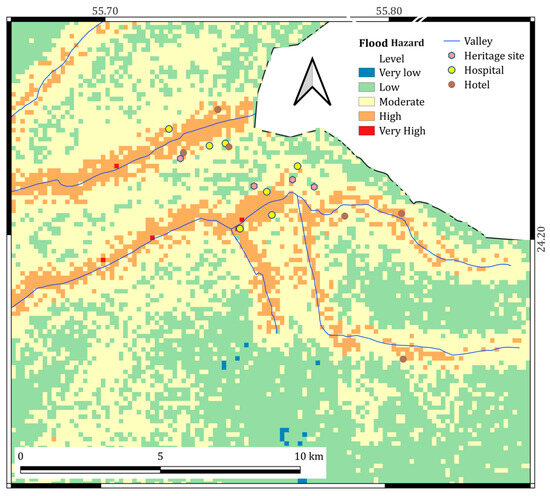
Figure 8.
Part of the Al Ain flood-hazard map is overlaid with the locations of heritage sites, hospitals, and hotels.
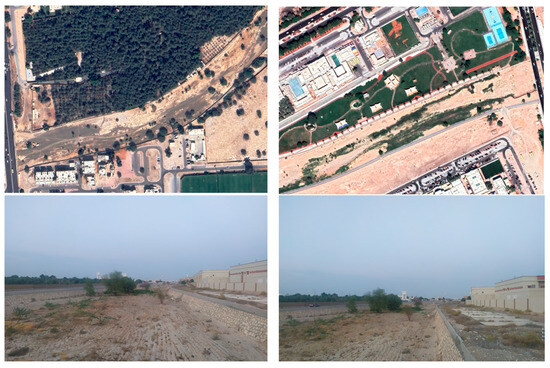
Figure 9.
Green areas used as buffers to reduce flooding: Al Ain Oasis (top left) and Wadi Park (top right) (Google Earth images). The (bottom) photos show valley embarkments.
4. Discussion
In this work, we presented a comprehensive flood-hazard assessment of the study area based on various factors, including building age, elevation, land use, geology, topography, population density, and proximity to valleys. We divided the built-up area into four categories based on construction periods, ranging from buildings constructed before 1972 to those built between 2013 and 2022. Additionally, we classified land use and land cover into the categories of desert, built-up areas, vegetation, and highlands. The study area consists predominantly of desert terrain, which covers approximately 62% of the total area, followed by built-up areas, which comprise 27%. Vegetation and highlands cover relatively smaller proportions, accounting for 8% and 3% of the total area, respectively.
After assigning weights to each contributing factor, we used the weighted overlay function in Arc Map to generate a comprehensive flood-hazard map. The results revealed that the areas with the highest flood hazards are concentrated within the primary valleys that extend from the east to the west through Al Ain city. A similar study that used a land-morphology approach to study flood risk in Portugal highlighted floodplains adjacent to streams as being prone to flooding [60]. In the same vein, research performed in the Lam River basin (Vietnam) revealed that—based on multigeospatial hazard mapping—areas along rivers and streams are high-flood-hazard areas [4]. Another study assessed the damage caused to settlements in proximity to Dir Valley in Pakistan, which included human causality and ranged from partial to complete destruction of buildings, infrastructure, and agricultural land [61]. Conversely, we identified regions located along the periphery of Al Ain city, which are predominantly covered by desert, as having low flood potential. We also found that the Jebel Hafit Mountain has a minimal risk of flooding, ensuring its safety and stability. Significant historical sites are nestled in the eastern part of the Hafit Mountain range. Among these are remarkable beehive tombs, which date back 5000 years [62]. The airport, situated away from the main valleys, falls within the medium-risk category for potential flooding incidents.
The majority of the study area (approximately 61%) is categorized as having a low flood potential, and approximately 32% of the area has only a moderate level of flood hazards. High flood potential areas that are more susceptible to flooding comprise approximately 5% of the study area. Notably, less than 0.1% of the total area has very high flood hazards, although at least one of these areas includes a hospital site. The Al Ain municipality has spent millions of dollars on embankments bordering and bridges over the valleys that pass through this area. Maintenance of valleys and drainage systems is crucial for reducing flooding risks. This includes cleaning those areas of waste and garbage, cutting trees inside the valleys, and establishing monitoring cameras along the valley.
Implementing a combination of structural and non-structural measures is essential for effective flood management and adaptation. While structural solutions such as dams, levees, and retention basins offer temporary protection, they often demand substantial investments and may have unintended consequences. Conversely, non-structural approaches such as early warning systems, land-use planning, and floodplain management provide more sustainable and cost-effective alternatives. Integrating nature-based solutions, such as wetland restoration and green infrastructure, can enhance flood resilience while offering additional ecological benefits. Regular maintenance, including clearing vegetation along valleys, has contributed to the efficient functioning of the drainage network during flash floods. However, the presence of heritage sites within valley areas poses challenges. For instance, the Al Muwaji, Al Jahli, and Al Ain oases, located within 1-km buffer zones of main valleys, are susceptible to flooding during extreme events (Figure 8). The Al Ain oasis, with its date palm plantations strategically positioned at the confluence of two valleys, serves as a natural barrier against flooding while emphasizing the need for conservation (Figure 9). To safeguard other heritage sites, the implementation of protective measures, such as embankments, is necessary. This research study provides valuable information about the spatial distribution of flood hazard within the study area. Identification of high flood potential areas can aid in effective urban planning, land use management, and disaster preparedness efforts. Moreover, by understanding the factors that contribute to flood hazards and their respective weights, authorities and stakeholders can prioritize mitigation strategies and allocate resources appropriately. Additionally, the categorization of different time periods for the built-up areas provides a historical context and highlights the impact of urban development on flood hazards patterns. A study conducted in Romblon in the Philippines highlighted the argument discussed above [18]. The investigators used GIS, existing flood-hazard maps integrated with base maps, and building characteristics. This study produced a crucial hazard map at the local scale that shows a building-risk index associated with the structural details of each vulnerable building. Out of the 3094 structures assessed in the community, 10.25% were identified as being at moderate flood potential, 76.79% as being at high flood potential, and 12.94% as being at very high flood potential. A building flood hazard map thus holds immense importance for the development policies of the local government. AECOM [63] used hydrological models with flood depths greater and less than 300 mm, one in a 100-year existing situation, and calculated the flood extend until 2030. However, the lack of data about previous floods, such as the exact locations and quantification of losses, makes it difficult to verify or predict the likelihood of when and where a flood will occur. Therefore, detailed data about flood events coupled with GIS and hydrological models will help in flood simulation and generation of spatial and temporal flood hazard maps.
There are limitations that are worth mentioning. Reliance on remote sensing and machine learning for building age classification could potentially introduce inaccuracies. The accuracy of the flood hazard map depended on the quality and resolution of the input data, which varied. The weighted overlay method for combining parameters was subjective and might not fully capture complex interactions between factors. The Digital Elevation Model (DEM) used is of low resolution (30 m) and is generally not suitable for accurate flood modeling [64]. It was utilized because no other source is available. The Landsat satellite image is also of low spatial resolution (30 m) and was used because of the non-availability of high-resolution data. Only center lines of valleys were used, and there is no accurate information available about width, depth, and discharge capacity. Moreover, population is available at district level, and this will not show the exact location of high and low densities within the districts. There is no data about the locations of previous floods in the city, and this makes it difficult to validate the output maps. Therefore, the results obtained provide a general guide for flood hazards and should not be used for decision-making. Hydrological models are not used in this study. Future work could incorporate them to enhance the flood hazard mapping and prediction.
5. Conclusions
This study used remote sensing and GIS-derived parameters to map flood-hazard areas in Al Ain. We extracted building ages, which are considered important factors in the generation of flood hazard maps, from historical Landsat images and incorporated them into the flood-hazard model. The comprehensive flood-hazard assessment presented in this work offers significant contributions to understanding and managing flood hazards in the study area. The study employed various factors—including building age, elevation, land use, geology, topography, population density, and proximity to valleys—to generate a comprehensive flood-hazard map using weighted overlay functions. The resulting flood-hazard map clearly delineates high flood potential areas, which are predominantly concentrated within the primary valleys that extend from east to west through Al Ain city. The overall distribution of flood hazards in the study area indicates that a significant portion (approximately 61%) is categorized as having low potential flood hazards, while 32% falls under medium flood potential and only 5% under high flood potential. This information is invaluable for urban planning, land use management, and disaster preparedness efforts. By understanding the contributing factors and their respective weights, authorities and stakeholders can effectively prioritize mitigation strategies. In conclusion, this research not only improves our understanding of flood hazard distribution but also serves as a key resource for developing informed flood hazard management policies in the study area. By leveraging these findings, decision-makers can work toward minimizing the effect of floods on communities and enhancing overall resilience to such natural disasters.
6. Recommendations
- There is a need to document flood events spatially and temporally, both from rainfall and from infrastructure failure. Moreover, predictive analysis needs to be improved to assess areas that could be prone to flooding by adding more accurate data coupled with hydrological models.
- Soft solutions: Implementing effective planning rules and enhancing public awareness can play a crucial role in addressing the issue of flooding potential. By establishing comprehensive planning regulations, including zoning and land-management guidelines, Al Ain can ensure sustainable development and minimize the impact of flooding.
- Hard solutions: Al Ain has already constructed several dams to harness rainfall, and further dams can be considered as land use alters the topography. Expansion of green areas and maintenance of efficient drainage systems are also important.
- In assessing building resilience and establishing construction guidelines, it is essential to allow zoning planning and to establish more stringent requirements for issuing building permits. This will ensure that the structures can withstand potential disasters. Educating people about the hazard levels of their structures will provide valuable insights into their structural vulnerabilities and encourage them to implement the necessary improvements to make their buildings more resilient and better prepared for potential hazards [18].
- Assessing the effectiveness of property-level resistance and resilience measures can reduce loss and repair time due to flooding. For example, property owners can retrofit or demolish old buildings and adjust building heights in flood-vulnerable areas [65]. Develop a comprehensive database about buildings, including building age, and use the database in flood hazard and risk mapping.
- Cooperation between various stakeholders, such as central and local governments and the private sector, is needed. Future research can use machine learning models and satellite-derived rainfall data to predict flash floods in Al Ain [66].
Author Contributions
Conceptualization, T.A., M.M.Y. and Y.T.T.; methodology, T.A., Y.T.T. and M.M.Y.; software, Y.T.T.; validation, M.M.Y., Y.T.T., T.A., N.A. and S.P.; data curation, Y.T.T.; writing—original draft preparation, T.A., M.M.Y. and Y.T.T.; writing and editing, M.M.Y., Y.T.T., T.A., N.A. and S.P. All authors have read and agreed to the published version of the manuscript.
Funding
This research received no external funding.
Data Availability Statement
The data used in this study are available on request from the corresponding author.
Acknowledgments
The United Arab Emirates University is acknowledged for providing the support for this study. We thank Shehab Majud for following up with the editing process.
Conflicts of Interest
The authors declare no conflicts of interest.
References
- UNDRR Hazard. Available online: https://www.undrr.org/terminology/hazard (accessed on 28 July 2024).
- UNISDR. Flood Hazard and Risk Assessment. 2017. Available online: https://www.unisdr.org/files/52828_04floodhazardandriskassessment.pdf (accessed on 22 June 2024).
- Asare-Kyei, D.; Forkuor, G.; Venus, V. Modeling Flood Hazard Zones at the Sub-District Level with the Rational Model Integrated with GIS and Remote Sensing Approaches. Water 2015, 7, 3531–3564. [Google Scholar] [CrossRef]
- Dung, N.B.; Long, N.Q.; An, D.T.; Minh, D.T. Multi-Geospatial Flood Hazard Modelling for a Large and Complex River Basin with Data Sparsity: A Case Study of the Lam River Basin, Vietnam. Earth Syst. Environ. 2022, 6, 715–731. [Google Scholar] [CrossRef]
- Ogania, J.L.; Puno, G.R.; Alivio, M.B.T.; Taylaran, J.M.G. Effect of Digital Elevation Model’s Resolution in Producing Flood Hazard Maps. Glob. J. Environ. Sci. Manag. 2019, 5, 95–106. [Google Scholar] [CrossRef]
- Hamlat, A.; Meharzi, S.; Guidoum, A.; Sekkoum, M.; Mokhtari, Y.; Kadri, C.B. GIS-Based Multi-Criteria Analysis for Flood Hazard Areas Mapping of M’zab Wadi Basin (Ghardaia, North-Central Algeria). Arid. Land Res. Manag. 2023, 38, 1–25. [Google Scholar] [CrossRef]
- Papaioannou, G.; Vasiliades, L.; Loukas, A. Multi-Criteria Analysis Framework for Potential Flood Prone Areas Mapping. Water Resour. Manag. 2015, 29, 399–418. [Google Scholar] [CrossRef]
- Allafta, H.; Opp, C. GIS-Based Multi-Criteria Analysis for Flood Prone Areas Mapping in the Trans-Boundary Shatt Al-Arab Basin, Iraq-Iran. Geomat. Nat. Hazards Risk 2021, 12, 2087–2116. [Google Scholar] [CrossRef]
- Marco, J.B. Flood Risk Mapping. In Coping with Floods; Springer: Dordrecht, The Netherlands, 1994; pp. 353–373. [Google Scholar]
- Barredo, J.I.; de Roo, A.; Lavalle, C. Flood Risk Mapping at European Scale. Water Sci. Technol. 2007, 56, 11–17. [Google Scholar] [CrossRef]
- Santos, P.P.; Pereira, S.; Zêzere, J.L.; Tavares, A.O.; Reis, E.; Garcia, R.A.C.; Oliveira, S.C. A Comprehensive Approach to Understanding Flood Risk Drivers at the Municipal Level. J. Environ. Manag. 2020, 260, 110127. [Google Scholar] [CrossRef]
- Saha, A.K.; Agrawal, S. Mapping and Assessment of Flood Risk in Prayagraj District, India: A GIS and Remote Sensing Study. Nanotechnol. Environ. Eng. 2020, 5, 1–18. [Google Scholar] [CrossRef]
- Hu, S.; Cheng, X.; Zhou, D.; Zhang, H. GIS-Based Flood Risk Assessment in Suburban Areas: A Case Study of the Fangshan District, Beijing. Nat. Hazards 2017, 87, 1525–1543. [Google Scholar] [CrossRef]
- Torab, M.M. Flood-Hazard Mapping of The Hafit Mountain Slopes—The Eastern of United Arab Emirates (U.A.E.). Bull. Soc. Cartogr. 2002, 36, 39–44. [Google Scholar]
- Elhakeem, M. Flood Prediction at The Northern Region of UAE. MATEC Web Conf. 2017, 103, 04004. [Google Scholar] [CrossRef]
- Pakam, S.; Ahmed, A.; Ebraheem, A.A.; Sherif, M.; Mirza, S.B.; Ridouane, F.L.; Sefelnasr, A. Risk Assessment and Mapping of Flash Flood Vulnerable Zones in Arid Region, Fujairah City, UAE-Using Remote Sensing and GIS-Based Analysis. Water 2023, 15, 2802. [Google Scholar] [CrossRef]
- Komolafe, A.A.; Herath, S.; Avtar, R. Establishment of Detailed Loss Functions for the Urban Flood Risk Assessment in Chao Phraya River Basin, Thailand. Geomat. Nat. Hazards Risk 2019, 10, 633–650. [Google Scholar] [CrossRef]
- Lahmer, T.; Harirchian, E.; Novelli, V.; Gacu, J.G.; Monjardin, C.E.F.; Lawrence, K.; De Jesus, M.; Senoro, D.B. GIS-Based Risk Assessment of Structure Attributes in Flood Zones of Odiongan, Romblon, Philippines. Buildings 2023, 13, 506. [Google Scholar] [CrossRef]
- Darabi, H.; Choubin, B.; Rahmati, O.; Torabi Haghighi, A.; Pradhan, B.; Kløve, B. Urban Flood Risk Mapping Using the GARP and QUEST Models: A Comparative Study of Machine Learning Techniques. J. Hydrol. 2019, 569, 142–154. [Google Scholar] [CrossRef]
- Yu, Y.; Xu, H.; Wang, X.; Wen, J.; Du, S.; Zhang, M.; Ke, Q. Residents’ Willingness to Participate in Green Infrastructure: Spatial Differences and Influence Factors in Shanghai, China. Sustainability 2019, 11, 5396. [Google Scholar] [CrossRef]
- GFDRR. 2010 Haiti Earthquake Final Report. Available online: https://www.gfdrr.org/sites/default/files/publication/2010haitiearthquakepost-disasterbuildingdamageassessment.pdf (accessed on 26 July 2024).
- Garbasevschi, O.-M. Large Scale Building Age Classification for Urban Energy Demand Estimation. Master’s Thesis, Delft University of Technology, Delft, The Netherlands, 2010. [Google Scholar]
- Aksoezen, M.; Daniel, M.; Hassler, U.; Kohler, N. Building Age as an Indicator for Energy Consumption. Energy Build. 2015, 87, 74–86. [Google Scholar] [CrossRef]
- Tooke, T.R.; Coops, N.C.; Webster, J. Predicting Building Ages from LiDAR Data with Random Forests for Building Energy Modeling. Energy Build. 2014, 68, 603–610. [Google Scholar] [CrossRef]
- Burnham, J.F. Scopus Database: A Review. Biomed. Digit. Libr. 2006, 3, 1. [Google Scholar] [CrossRef]
- NCEMA. National Emergency Crisis and Disaster Management Authority. 2022. Available online: https://www.ncema.gov.ae/ (accessed on 20 May 2024).
- Al-Shamsei, M.H. Drinage Basins and Flash Flood Hazards in Al Ain Area, United Arab Emirates. Master’s Thesis, United Arab Emirates University, Al Ain, United Arab Emirates, 1993. [Google Scholar]
- WAM. UAE Witnesses Largest Rainfall in 75 Years. Available online: https://www.wam.ae/en/article/13vbuq9-uae-witnesses-largest-rainfall-over-past-years (accessed on 31 July 2024).
- Elmahdy, S.; Ali, T.; Mohamed, M. Flash Flood Susceptibility Modeling and Magnitude Index Using Machine Learning and Geohydrological Models: A Modified Hybrid Approach. Remote Sens. 2020, 12, 2695. [Google Scholar] [CrossRef]
- Terry, J.P.; Al Ruheili, A.; Almarzooqi, M.A.; Almheiri, R.Y.; Alshehhi, A.K. The Rain Deluge and Flash Floods of Summer 2022 in the United Arab Emirates: Causes, Analysis and Perspectives on Flood-Risk Reduction. J. Arid. Environ. 2023, 215, 105013. [Google Scholar] [CrossRef]
- Gulf News Video: Heavy Rains and Hail Cause Trees to Fall in Al Ain, Traffic Disruptions Ensue. Available online: https://gulfnews.com/uae/weather/video-heavy-rains-and-hail-cause-trees-to-fall-in-al-ain-traffic-disruptions-ensue-1.1691159537359 (accessed on 7 August 2023).
- Kumar, A. Heavy Rains, Hail, Flood Lash Al Ain. Available online: https://www.khaleejtimes.com/uae/video-heavy-rains-hail-flood-lash-al-ain (accessed on 26 July 2024).
- Campbell, M. Al Ain Residents Struggle to Manage Flooding Water as Heavy Rains Hit. Available online: https://www.thenationalnews.com/uae/al-ain-residents-struggle-to-manageflooding-water-as-heavy-rains-hit-1.156224 (accessed on 10 July 2023).
- Arabianbusines Work Starts on $32 m Plan to Reduce Al Ain Flash Flooding Risk. Available online: https://www.arabianbusiness.com/gcc/uae/437749-work-starts-on-32m-plan-to-reduce-al-ain-flash-flooding-risk (accessed on 31 July 2024).
- ESA Sentinel-2-Missions-Sentinel Online-Sentinel Online. Available online: https://sentinels.copernicus.eu/web/sentinel/missions/sentinel-2 (accessed on 25 October 2022).
- EROS; USGS; EROS. Archive-Digital Elevation-Shuttle Radar Topography Mission (SRTM) 1 Arc-Second Global. Available online: https://www.usgs.gov/centers/eros/science/usgs-eros-archive-digital-elevation-shuttle-radar-topography-mission-srtm-1 (accessed on 14 August 2023).
- USGS. Landsat 8|U.S. Geological Survey. Available online: https://www.usgs.gov/landsat-missions/landsat-8 (accessed on 26 October 2022).
- FAO. Harmonized World Soil Database v 1.2. Available online: https://www.fao.org/soils-portal/data-hub/soil-maps-and-databases/harmonized-world-soil-database-v12/en/ (accessed on 14 August 2023).
- Sheykhmousa, M.; Mahdianpari, M.; Ghanbari, H.; Mohammadimanesh, F.; Ghamisi, P.; Homayouni, S. Support Vector Machine Versus Random Forest for Remote Sensing Image Classification: A Meta-Analysis and Systematic Review. IEEE J. Sel. Top. Appl. Earth Obs. Remote Sens. 2020, 13, 6308–6325. [Google Scholar] [CrossRef]
- Weiss, A.D. Topographic position and landforms analysis. Presented at the ESRI Users Conference, SanDiego, CA, USA, 9–13 July 2001. [Google Scholar]
- Jenness, J.S. Calculating Landscape Surface Area from Digital Elevation Models. Wildl. Soc. Bull. 2004, 32, 829–839. [Google Scholar] [CrossRef]
- Al-Husban, Y. Landforms Classification of Wadi Al-Mujib Basin in Jordan, Based on Topographic Position Index (TPI), and the Production of a Flood Forecasting Map. Human. Social. Sci. 2019, 46, 44–55. [Google Scholar]
- Kopecký, M.; Macek, M.; Wild, J. Topographic Wetness Index Calculation Guidelines Based on Measured Soil Moisture and Plant Species Composition. Sci. Total Environ. 2021, 757, 143785. [Google Scholar] [CrossRef]
- Chen, J.; Yang, S.T.; Li, H.W.; Zhang, B.; Lv, J.R. Research on Geographical Environment Unit Division Based on the Method of Natural Breaks (Jenks). Int. Arch. Photogramm. Remote Sens. Spat. Inf. Sci. 2013, XL-4/W3, 47–50. [Google Scholar] [CrossRef]
- USDA. Urban Hydrology for Small Watersheds. 1986. Available online: https://www.nrc.gov/docs/ML1421/ML14219A437.pdf (accessed on 1 July 2024).
- Zhan, X.; Huang, M.L. ArcCN-Runoff: An ArcGIS Tool for Generating Curve Number and Runoff Maps. Environ. Model. Softw. 2004, 19, 875–879. [Google Scholar] [CrossRef]
- Periyasamy, P.; Yagoub, M.M.; Sudalaimuthu, M. Flood Vulnerable Zones in the Rural Blocks of Thiruvallur District, South India. Geoenviron. Disasters 2018, 5, 21. [Google Scholar] [CrossRef]
- Tesfaldet, Y.T.; Puttiwongrak, A. Seasonal Groundwater Recharge Characterization Using Time-Lapse Electrical Resistivity Tomography in the Thepkasattri Watershed on Phuket Island, Thailand. Hydrology 2019, 6, 36. [Google Scholar] [CrossRef]
- Tesfaldet, Y.T.; Puttiwongrak, A.; Arpornthip, T. Spatial and Temporal Variation of Groundwater Recharge in Shallow Aquifer in the Thepkasattri of Phuket, Thailand. J. Groundw. Sci. Eng. 2020, 8, 10–19. [Google Scholar] [CrossRef]
- Nigusse, A.G.; Adhanom, O.G. Flood Hazard and Flood Risk Vulnerability Mapping Using Geo-Spatial and MCDA around Adigrat, Tigray Region, Northern Ethiopia. Momona Ethiop. J. Sci. 2019, 11, 90. [Google Scholar] [CrossRef]
- Hazarika, N.; Barman, D.; Das, A.K.; Sarma, A.K.; Borah, S.B. Assessing and Mapping Flood Hazard, Vulnerability and Risk in the Upper Brahmaputra River Valley Using Stakeholders’ Knowledge and Multicriteria Evaluation (MCE). J. Flood Risk Manag. 2018, 11, S700–S716. [Google Scholar] [CrossRef]
- Alaigba, D.; Orewole, M.; Oviasu, O. Riparian Corridors Encroachment and Flood Risk Assessment in Ile-Ife: A GIS Perspective. Open Trans. Geosci. 2015, 2015, 17–32. [Google Scholar] [CrossRef]
- MMarin-Ferrer, M.; Luca, V.; Karmen, P. Index for Risk Management Inform Concept and Methodology Report—Version 2017; European Union Publications: Luxembourg, 2017. [Google Scholar] [CrossRef]
- Saaty, T.L. How to Make a Decision: The Analytic Hierarchy Process. Eur. J. Oper. Res. 1990, 48, 9–26. [Google Scholar] [CrossRef]
- Teknomo, K. Analytic Hierarchy Process (AHP) Tutorial. Available online: https://people.revoledu.com/kardi/tutorial/AHP/ (accessed on 28 July 2024).
- Yagoub, M.M.; AlSumaiti, T.; Tesfaldet, Y.T.; AlArfati, K.; Alraeesi, M.; Alketbi, M.E. Integration of Analytic Hierarchy Process (AHP) and Remote Sensing to Assess Threats to Preservation of the Oases: Case of Al Ain, UAE. Land 2023, 12, 1269. [Google Scholar] [CrossRef]
- Foody, G.M. Status of Land Cover Classification Accuracy Assessment. Remote Sens. Environ. 2002, 80, 185–201. [Google Scholar] [CrossRef]
- Thomlinson, J.R.; Bolstad, P.V.; Cohen, W.B. Coordinating Methodologies for Scaling Landcover Classifications from Site-Specific to Global. Remote Sens. Environ. 1999, 70, 16–28. [Google Scholar] [CrossRef]
- Ballerine, C. Topographic Wetness Index Urban Flooding Awareness Act Action Support Will and DuPage Counties, Illinois. 2017. Available online: https://www.isws.illinois.edu/pubdoc/CR/ISWSCR2017-02.pdf (accessed on 1 July 2024).
- Cunha, N.S.; Magalhães, M.R.; Domingos, T.; Abreu, M.M.; Küpfer, C. The Land Morphology Approach to Flood Risk Mapping: An Application to Portugal. J. Environ. Manag. 2017, 193, 172–187. [Google Scholar] [CrossRef]
- Mahmood, S.; Ullah, S. Assessment of 2010 Flash Flood Causes and Associated Damages in Dir Valley, Khyber Pakhtunkhwa Pakistan. Int. J. Disaster Risk Reduct. 2016, 16, 215–223. [Google Scholar] [CrossRef]
- Abu Dhabi Culture. The Bronze Age Tombs of Jabel Hafit. Available online: https://abudhabiculture.ae/en/discover/pre-historic-and-palaeontology/jebel-hafeet-tombs (accessed on 19 July 2023).
- AECOM. Drainage of Flood Water in Al Ain Region; Report Prepared by AECOM for Al Ain Municipality; AECOM: Dallas, TX, USA, 2011. [Google Scholar]
- Finn, H. Dam Failure and Inundation Modeling: Test Case for Ham Dam; Summary Report, Project Conducted by “DHI Gulf” for UAE Ministry of Environment & Water; UAE Ministry of Environment & Water: Dubai, United Arab Emirates, 2008.
- Lamond, J.; Rose, C.; Bhattacharya-Mis, N.; Joseph, R. Evidence For Property Flood Resilience Phase 2 Report; University of the West of England: Bristol, UK, 2018. [Google Scholar]
- Hamouda, M.A.; Hinge, G.; Yemane, H.S.; Al Mosteka, H.; Makki, M.; Mohamed, M.M. Reliability of GPM IMERG Satellite Precipitation Data for Modelling Flash Flood Events in Selected Watersheds in the UAE. Remote Sens. 2023, 15, 3991. [Google Scholar] [CrossRef]
Disclaimer/Publisher’s Note: The statements, opinions and data contained in all publications are solely those of the individual author(s) and contributor(s) and not of MDPI and/or the editor(s). MDPI and/or the editor(s) disclaim responsibility for any injury to people or property resulting from any ideas, methods, instructions or products referred to in the content. |
© 2024 by the authors. Licensee MDPI, Basel, Switzerland. This article is an open access article distributed under the terms and conditions of the Creative Commons Attribution (CC BY) license (https://creativecommons.org/licenses/by/4.0/).