Article

Analysis of the Water Quality Status and Its Historical Evolution Trend in the Mainstream and Major Tributaries of the Yellow River Basin

1
Yellow River Water Resources Protection Institute, Zhengzhou 450004, China
2
School of Water Conservancy and Transportation, Zhengzhou University, 100 Kexue Avenue, Zhengzhou 450001, China
3
Ecohydrology Research Group, Department of Earth and Environmental Sciences, University of Waterloo, 200 University Avenue West, Waterloo, ON N2L 3G1, Canada
*
Author to whom correspondence should be addressed.
Water 2024, 16(17), 2413; https://doi.org/10.3390/w16172413
Submission received: 19 July 2024 / Revised: 17 August 2024 / Accepted: 21 August 2024 / Published: 27 August 2024

Abstract

:
The Yellow River basin, an area of extreme water scarcity, has faced significant challenges in water quality management due to rapid economic and social development since the 1980s. This study analyzes the water quality evolution over nearly 40 years, focusing on primary pollutants like chemical oxygen demand (COD), ammonia nitrogen (NH3-N), and permanganate index (CODMn). In the 1990s, sections of the river were severely polluted, with some areas failing to meet the lowest national standards. In 2000, 32% of the river water was classified as inferior Class V. However, enhanced water resource management and stricter pollutant regulations introduced after 2000 have significantly improved water quality. By 2010, water quality reached its nadir, with 16% of water classified as inferior Class V and 25% as Class IV–V. By 2020, water quality showed marked improvement, with a significant reduction in segments classified as inferior Class V and Class IV–V. Recent years have seen water quality stabilize, with COD meeting Class I standards and NH3-N and CODMn meeting Class II standards based on national criteria. The study also highlights discrepancies in water quality between the mainstream and tributaries of the Yellow River. While the mainstream generally maintains good water quality, many tributaries remain severely polluted. In 2022, 85% of the water in tributaries was classified as Class I to III, 12.3% as Class IV to V, and only 2.7% as Class V. However, all water in the mainstream reached Class I–III, with 86% achieving Class II and 14% achieving Class I. A detailed analysis of the Huayuankou section over the past three decades shows a general decline in pollution indicators. Seasonal water quality fluctuations, correlated with flow rates and temperatures, were observed, often exhibiting normal distribution patterns. These findings underscore the effectiveness of sustained pollution control and the need for continuous, adaptive management strategies to improve and maintain water quality in the Yellow River basin.

1. Introduction

The Yellow River, the mother river of the Chinese nation originating from the Qinghai–Tibet Plateau, is 5464 km long and has a total basin area of 795,000 km2 [1]. This river is essential not only as a water supply source for the arid regions of northwestern and northern China but also as a linchpin for major agricultural, industrial, and energy production activities [2,3,4]. The Yellow River basin serves as a critical region for national economic development and supports a significant portion of China’s grain production. Specifically in recent years, the basin is responsible for about 13% of China’s food production area and 15% of the arable land area, underscoring its importance to food security [5]. The basin is also responsible for urban water supply to over 50 large-and medium-sized cities [2]. Furthermore, the basin is a vital area for energy resources, including the Longyanxia’s hydropower station and the Qinghai power grid [6,7].
Despite its importance, the Yellow River basin faces extreme water scarcity, complicating efforts to protect and manage its water environment. Since the 1990s, there has been a persistent water scarcity characterized by total water withdrawals exceeding the total available water [8]. In the applications of Yellow River water, agriculture, industry, and urban residential areas contributed to a reduction in the water amount by 40%, 26%, and 16%, respectively [2]. Meanwhile, the intricate hydrology of the river, combined with the diverse ecological and economic functions it serves, underscore the urgent need for effective water quality management [9]. Over the past four decades, the Yellow River has experienced significant fluctuations in water quality due to a combination of natural factors and human activities [10]. Natural factors such as climate change and seasonal variability have influenced water flow and quality, while anthropogenic activities, including industrial discharge, agricultural runoff, and urban development, have significantly contributed to pollution levels [11]. Rapid economic and social development, starting in the 1980s and continuing onward, led to substantial increases in water pollution [12]. Industrial discharges surged as factories proliferated along the river, and agricultural activities intensified, leading to the increased runoff of fertilizers and pesticides, thereby elevating the heavy metal pollution in the area [13]. Urbanization further exacerbated the situation, with untreated sewage effluents being one of the major pollutants [14]. Specifically, industrial wastewater, domestic wastewater, phosphorus, and nitrogen accounted for 66%, 21%, 8%, and 5% of the influence on water quality, respectively [2]. During urbanization, deteriorated water quality adversely impacted both the ecosystem’s health and the millions of people depending on it. For instance, the migratory fish species in the lower Yellow River have been gradually affected by anthropogenic modifications to the river system since the 1950s, which led to their current rarity [15]. Additionally, 30.1–34.7% of the total population experienced seasonal water scarcity, while 20.2–35.5% faced perennial water scarcity [8].
However, since 2000, enhanced water resource management and stricter pollutant regulations have begun to mitigate water pollution, leading to gradual improvements in water quality [5,15]. Initiatives such as the implementation of the “Action Plan for Prevention and Control of Water Pollution” in 2015, along with increased investment in wastewater treatment facilities, have contributed to these improvements [15,16]. Recent years have seen improvements and stabilization in water quality, which is evident in the decreasing trend of CODMn and NH3-N from 2008 [17]. The increased water resource carrying capacity since 2005 also indicates the improving trend of the Yellow River water body [18]. Although water quality has improved in various areas, sustainable water use and comprehensive management still need to be strengthened. Just like the lack of identification and diagnosis technology that leads to little control and insufficient scientific basis in management, achieving the precise identification and diagnosis of water environment problems remain challenging [19].
Studying the water quality status and its historical evolution in the mainstream and major tributaries of the Yellow River basin is essential for understanding the impacts of human activities and natural processes on this vital water resource. Our studies in this article focus on several key investigations regarding the water quality of the Yellow River basin and aim to provide insights into the precise management of the water body. These investigations include examining trends in water usage, wastewater discharge, and pollutant emissions over the period from 1980 to 2015, as well as tracking changes in overall water quality classification from 1980 to 2022 by categorizing water into different quality classes. Additionally, the article observes water quality in the mainstream of the Yellow River from 2011 to 2022 and compares concentrations of pollutants, specifically COD and NH3-N, in the mainstream between 2000 and 2018. It also analyzes water quality in the tributaries of the Yellow River from 2011 to 2022 and investigates concentrations of COD and NH3-N in specific segments of the Yellow River tributaries between 2000 and 2018. Furthermore, the study assesses daily, monthly, and annual fluctuations in primary pollutants in the Huayuankou section from 1992 to 2022. This study also highlights the differences in water quality trends between the mainstream and tributaries of the Yellow River, revealing that while the mainstream’s water quality has generally been acceptable, some tributaries continue to suffer from severe pollution.

2. Materials and Methods
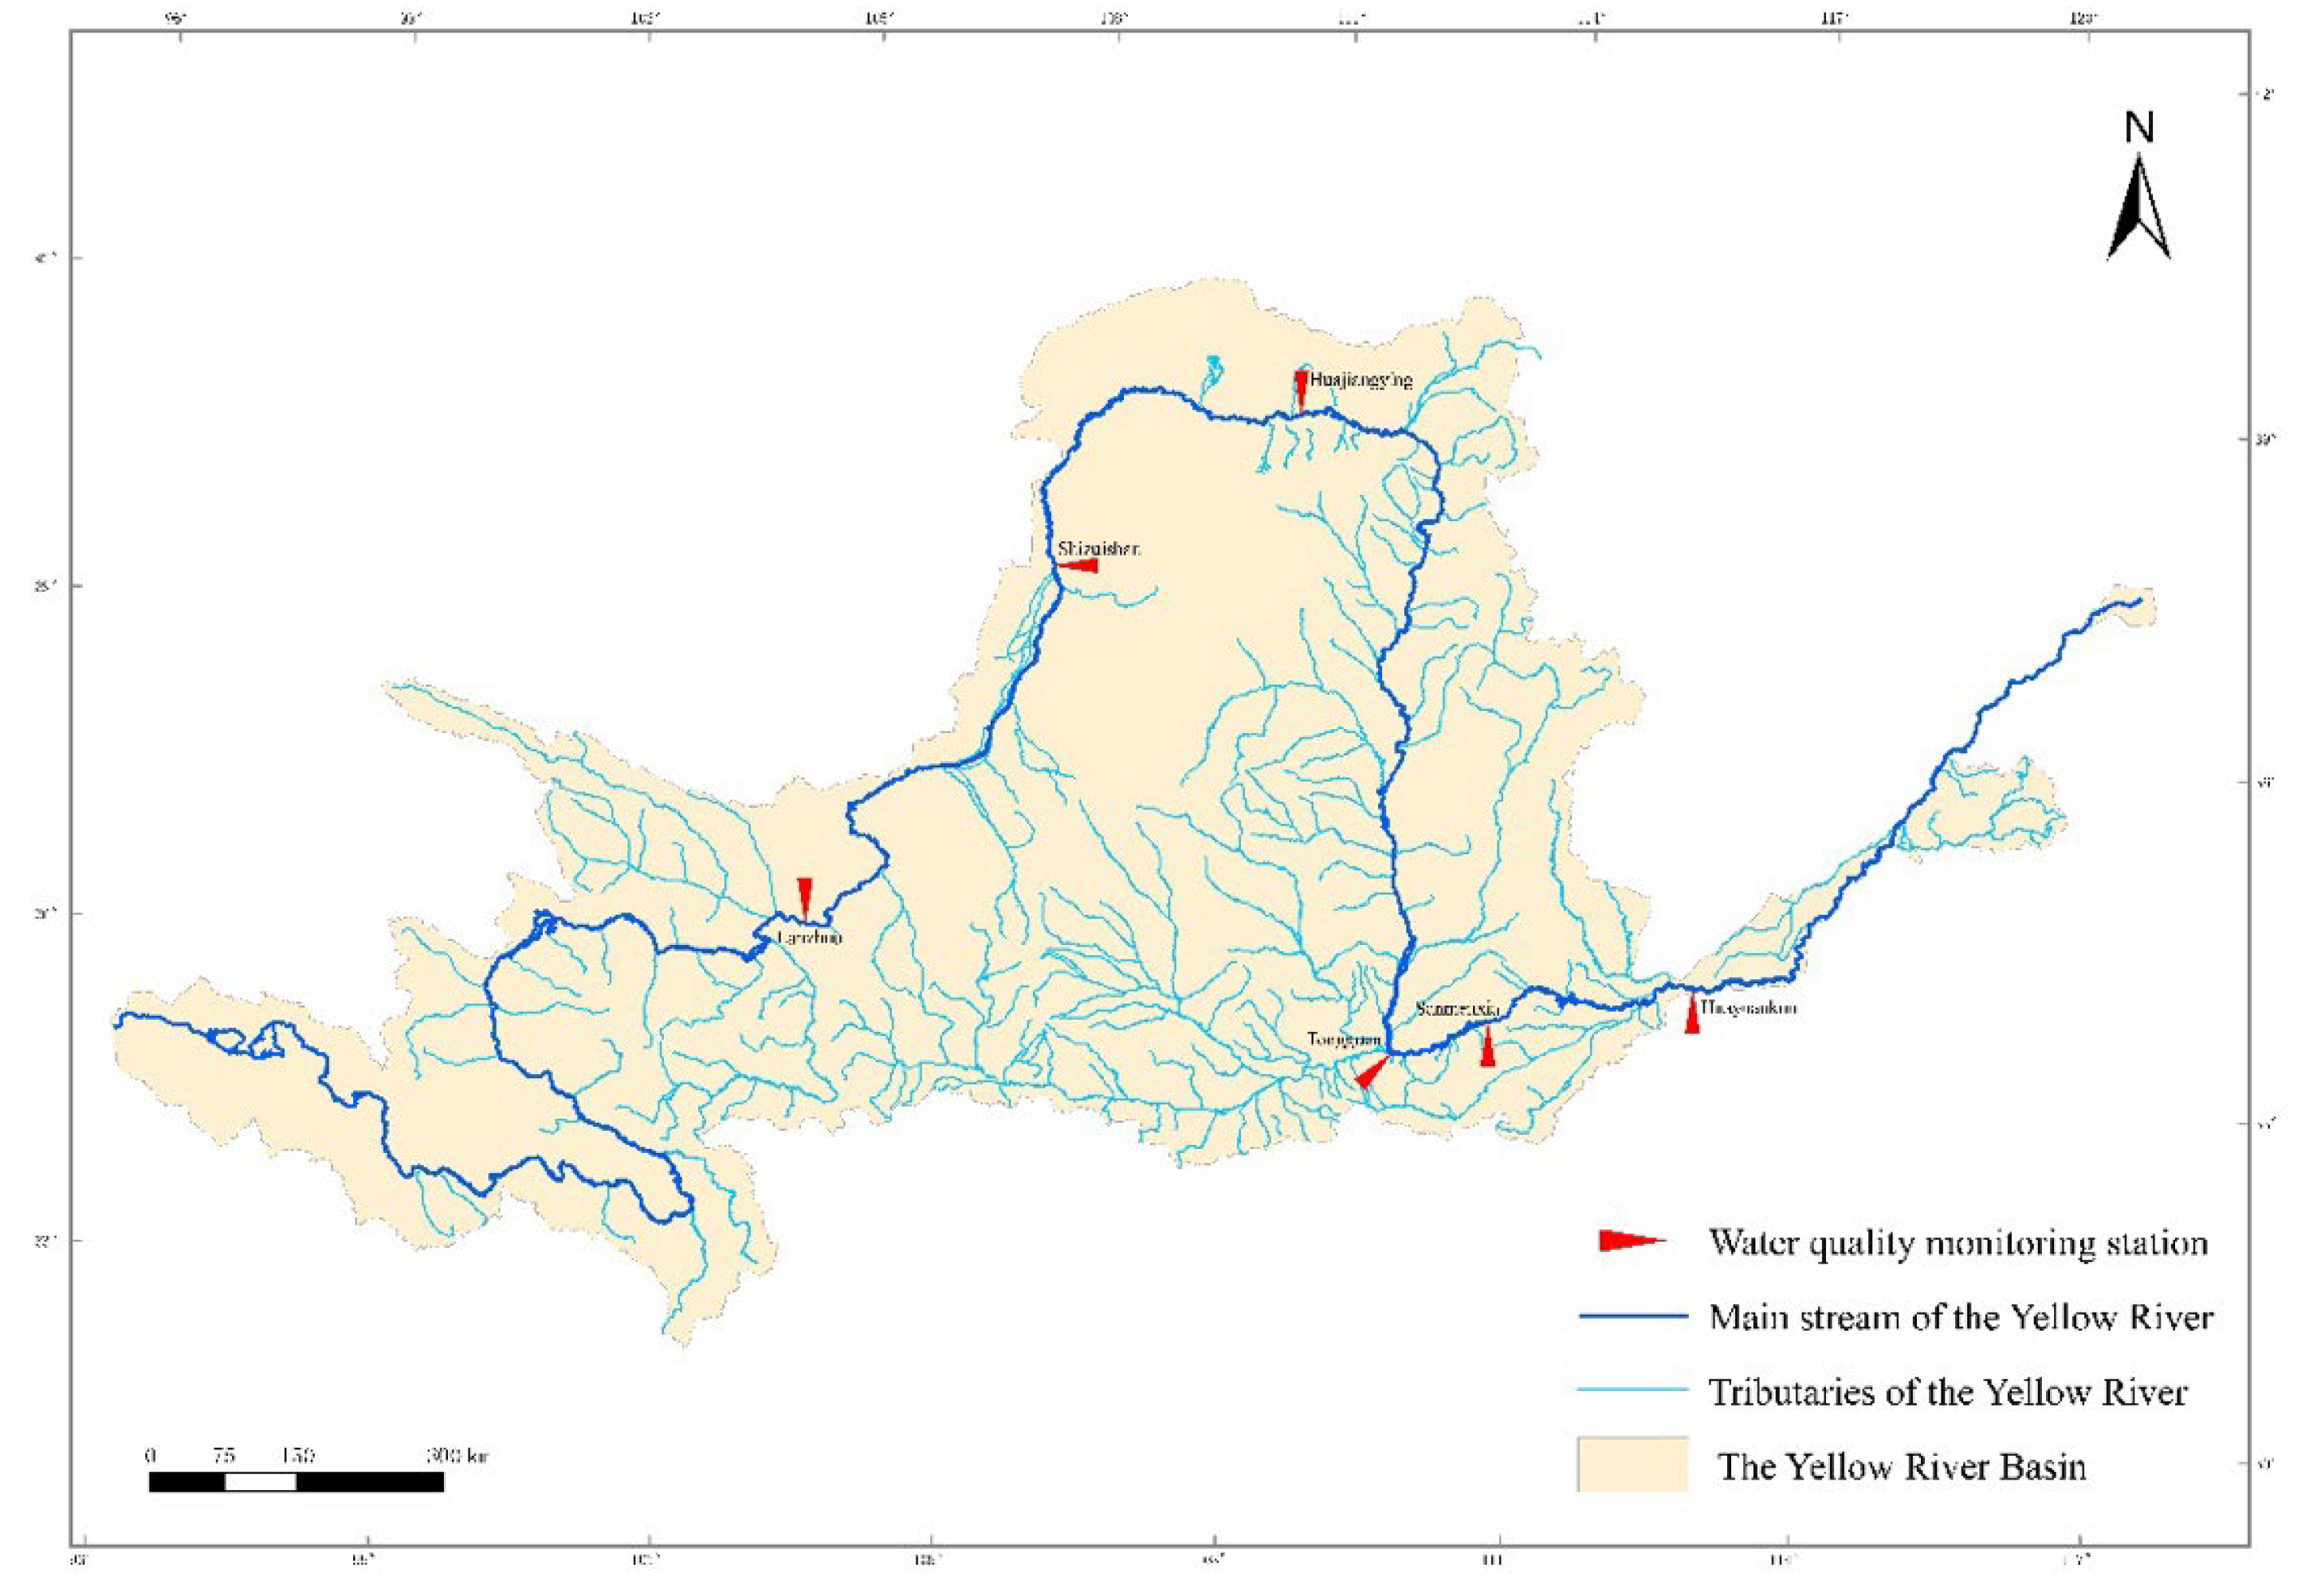
2.1. Study Area

The physical characteristics of the Yellow River include a winding and variable mainstream, unevenly distributed tributaries, and a large longitudinal drop in the riverbed (Figure 1). The length of the main river channel is 5464 km, winding eastward from the source with the river channel shaped similar to the Chinese character “几” [1]. The upper reaches are the main runoff area of the Yellow River [20]. From Longyangxia to Xiaheyuan in Ningxia, the river drops are mainly located between gorges, providing sufficient hydraulic resources [21]. From Xiaheyuan to Hepu Town, the Yellow River flows through the wide and flat Ning–Mongolian plain, where large irrigation areas are scattered on both sides [21]. Floods and ice disasters occurred in the plains along the river to different extents. Notably, in the Sanshenggong section, ice jams and ice dams obstruct water flow during the ice flood period, resulting in dike breaches [22]. Most middle reaches are located in Loess Plateau, which is the primary source of floods and silt, characterized by the loss in soil and water [23]. The longest continuous canyon on the mainstream of the Yellow River is the Jinshaan Canyon, which is located from Hepu Town to Yumenkou and offers rich hydraulic resources [24]. From Yumenkou to Tongguan, the Yellow River flows through the Fenwei trench, where the river channel becomes wide and shallow, and the erosion and siltation changes are extremely severe [25]. Valleys gradually widen below the Xiaolangdi, which is the transition section of the Yellow River from mountains to plains [26]. The downstream area is the world-famous suspended river with a serious threat of floods [27]. From Taohuayu to the estuary, with the exception of the hills from the south bank of Dongping Lake to Jinan, the remaining banks rely on dikes to obstruct water [28].
There are 220 tributaries with a catchment area greater than 100 km2 in the Yellow River basin [29]. Among these tributaries, there are 76 tributaries with an area greater than 1000 km2 (43 in the upper reaches, 30 in the middle reaches, and 3 in the lower reaches) [29]. The basin area is 580,000 km2, accounting for 77% of the total river catchment area [30]. Moreover, there are 10 tributaries larger than 10,000 km2, whose basin area reaches 370,000 km2, accounting for 50% of the total river catchment area [31]. Key tributaries, including the Fen River, Luo River, Qin River, Wei River, and Yi River, constitute the main body of Yellow River basin area [32]. These tributaries originate from various regions and bring with them unique hydrological and sediment characteristics which affect the overall water quality and ecological health of the Yellow River [33].
The Fen River originates from the Luliang Mountains and is a major tributary in Shanxi Province [32]. It is known for its high sediment load due to soil erosion in the Loess Plateau region [34]. The Luo River, another significant tributary, flows through the provinces of Shaanxi and Henan, contributing to the Yellow River’s flow and sediment [32]. The Qin River, which flows from the Taihang Mountains, also joins the Yellow River in Henan Province, impacting its hydrological dynamics [32]. The Wei River is one of the largest tributaries, originating from the Longshan Mountains in Gansu Province [32]. It plays a critical role in the agriculture and water resources of the region [35]. The Yi River, flowing through the provinces of Henan and Shandong, is noted for its historical significance and contributions to the Yellow River’s sediment and flow [36]. These tributaries, along with others, contribute to the Yellow River’s complex hydrology, influencing water quality, sediment transport, and ecological dynamics across different regions [33].
Huayuankou was a significant historical city in the Central Plains of China, known for the establishment, survival, and development of the Yellow River warping irrigation area [37]. The Huayuankou section is an important water quality control point in the lower reaches of the Yellow River [11]. Located downstream from Huayuankou, the river section features a typical wandering channel constrained by large dikes on both sides, resembling an elevated river [38]. The environmental conditions of water bodies in the Huayuankou section are affected not only by upstream tributaries like the Yi River, Luo River, Qin River, Mang River, and direct sewage outlets into the Yellow River, but also constrained by the riverbank conditions, the operation mode of the Xiaolangdi reservoir, and its outflow characteristics [39]. Therefore, this Huayuankou section serves as a typical section for analyzing fluctuations in water quality.

2.2. Methodology

This study focuses on the analysis of water quality in the Yellow River, utilizing nearly four decades of water quality data collected from various monitoring stations [40], with the Huayuankou section serving as a key sampling point. Based on the analysis of national surface water environmental monitoring statistical data, the evaluation metrics of water quality include the pH value, DO, CODMn, COD, BOD5, NH3-N, total phosphorus (TP), copper, zinc, fluoride, selenium, arsenic, mercury, cadmium, hexavalent chromium, lead, cyanide, volatile phenol, petroleum, anionic surfactants, and sulfides [40,41]. Data analysis was performed using Python 3.10 for statistical computations, graph generation, and OriginPro 2024 for graph production and visualization.
In this study, the water quality assessment primarily focuses on the evaluation of primary pollutants, including COD, NH3-N, and CODMn. These were analyzed using the dichromate method, salicylic acid spectrophotometry, and titration method, respectively. In addition, water flow rate and temperature were recorded. The single-factor evaluation method was then employed against the national water quality standards (GB3838-2002) [41], where each parameter was compared with the established standard values to determine the water quality class. The overall classification was based on the parameter showing the poorest performance, which determines the final evaluation outcome.
The water quality classification system, ranging from Class I to Class V, offers a structured approach for evaluating and managing the health of rivers, water systems, and watersheds. Supplementary Table S1 provides specific details regarding the classification of water. This system establishes a comprehensive framework for monitoring a wide array of chemical and physical parameters [41]. These stringent guidelines ensure the preservation of water quality across different classes, thereby protecting aquatic ecosystems and public health by controlling key pollutants and maintaining ecological balance.
Time-series analysis and data visualization techniques—such as bar charts, radar charts, line graphs, and composite graphs—were employed to identify trends and variations in pollutant concentrations from 1980 to 2022. This analysis utilized data from the National Surface Water Quality Automatic Monitoring Real-Time Database and on-site test results from the Yellow River Huayuankou section conducted between 1 March and 30 March 2020, as detailed in Supplementary Table S2. The detection limits for each testing item are provided in Supplementary Table S3 to ensure the accuracy and reliability of the measurements. Statistical tools were employed to calculate the maximum, minimum, range, and average values, enabling the interpretation of data and the exploration of relationships between pollutant levels and different years. Rigorous quality control measures, including regular instrument calibration, ensured data accuracy and consistency. Anomalies were thoroughly investigated and corrected to maintain data integrity. This comprehensive methodology enabled a detailed assessment of water quality and its historical evolution in the Yellow River basin, providing valuable insights for environmental management and policymaking.

3. Results

3.1. Water Quality in the Yellow River Basin

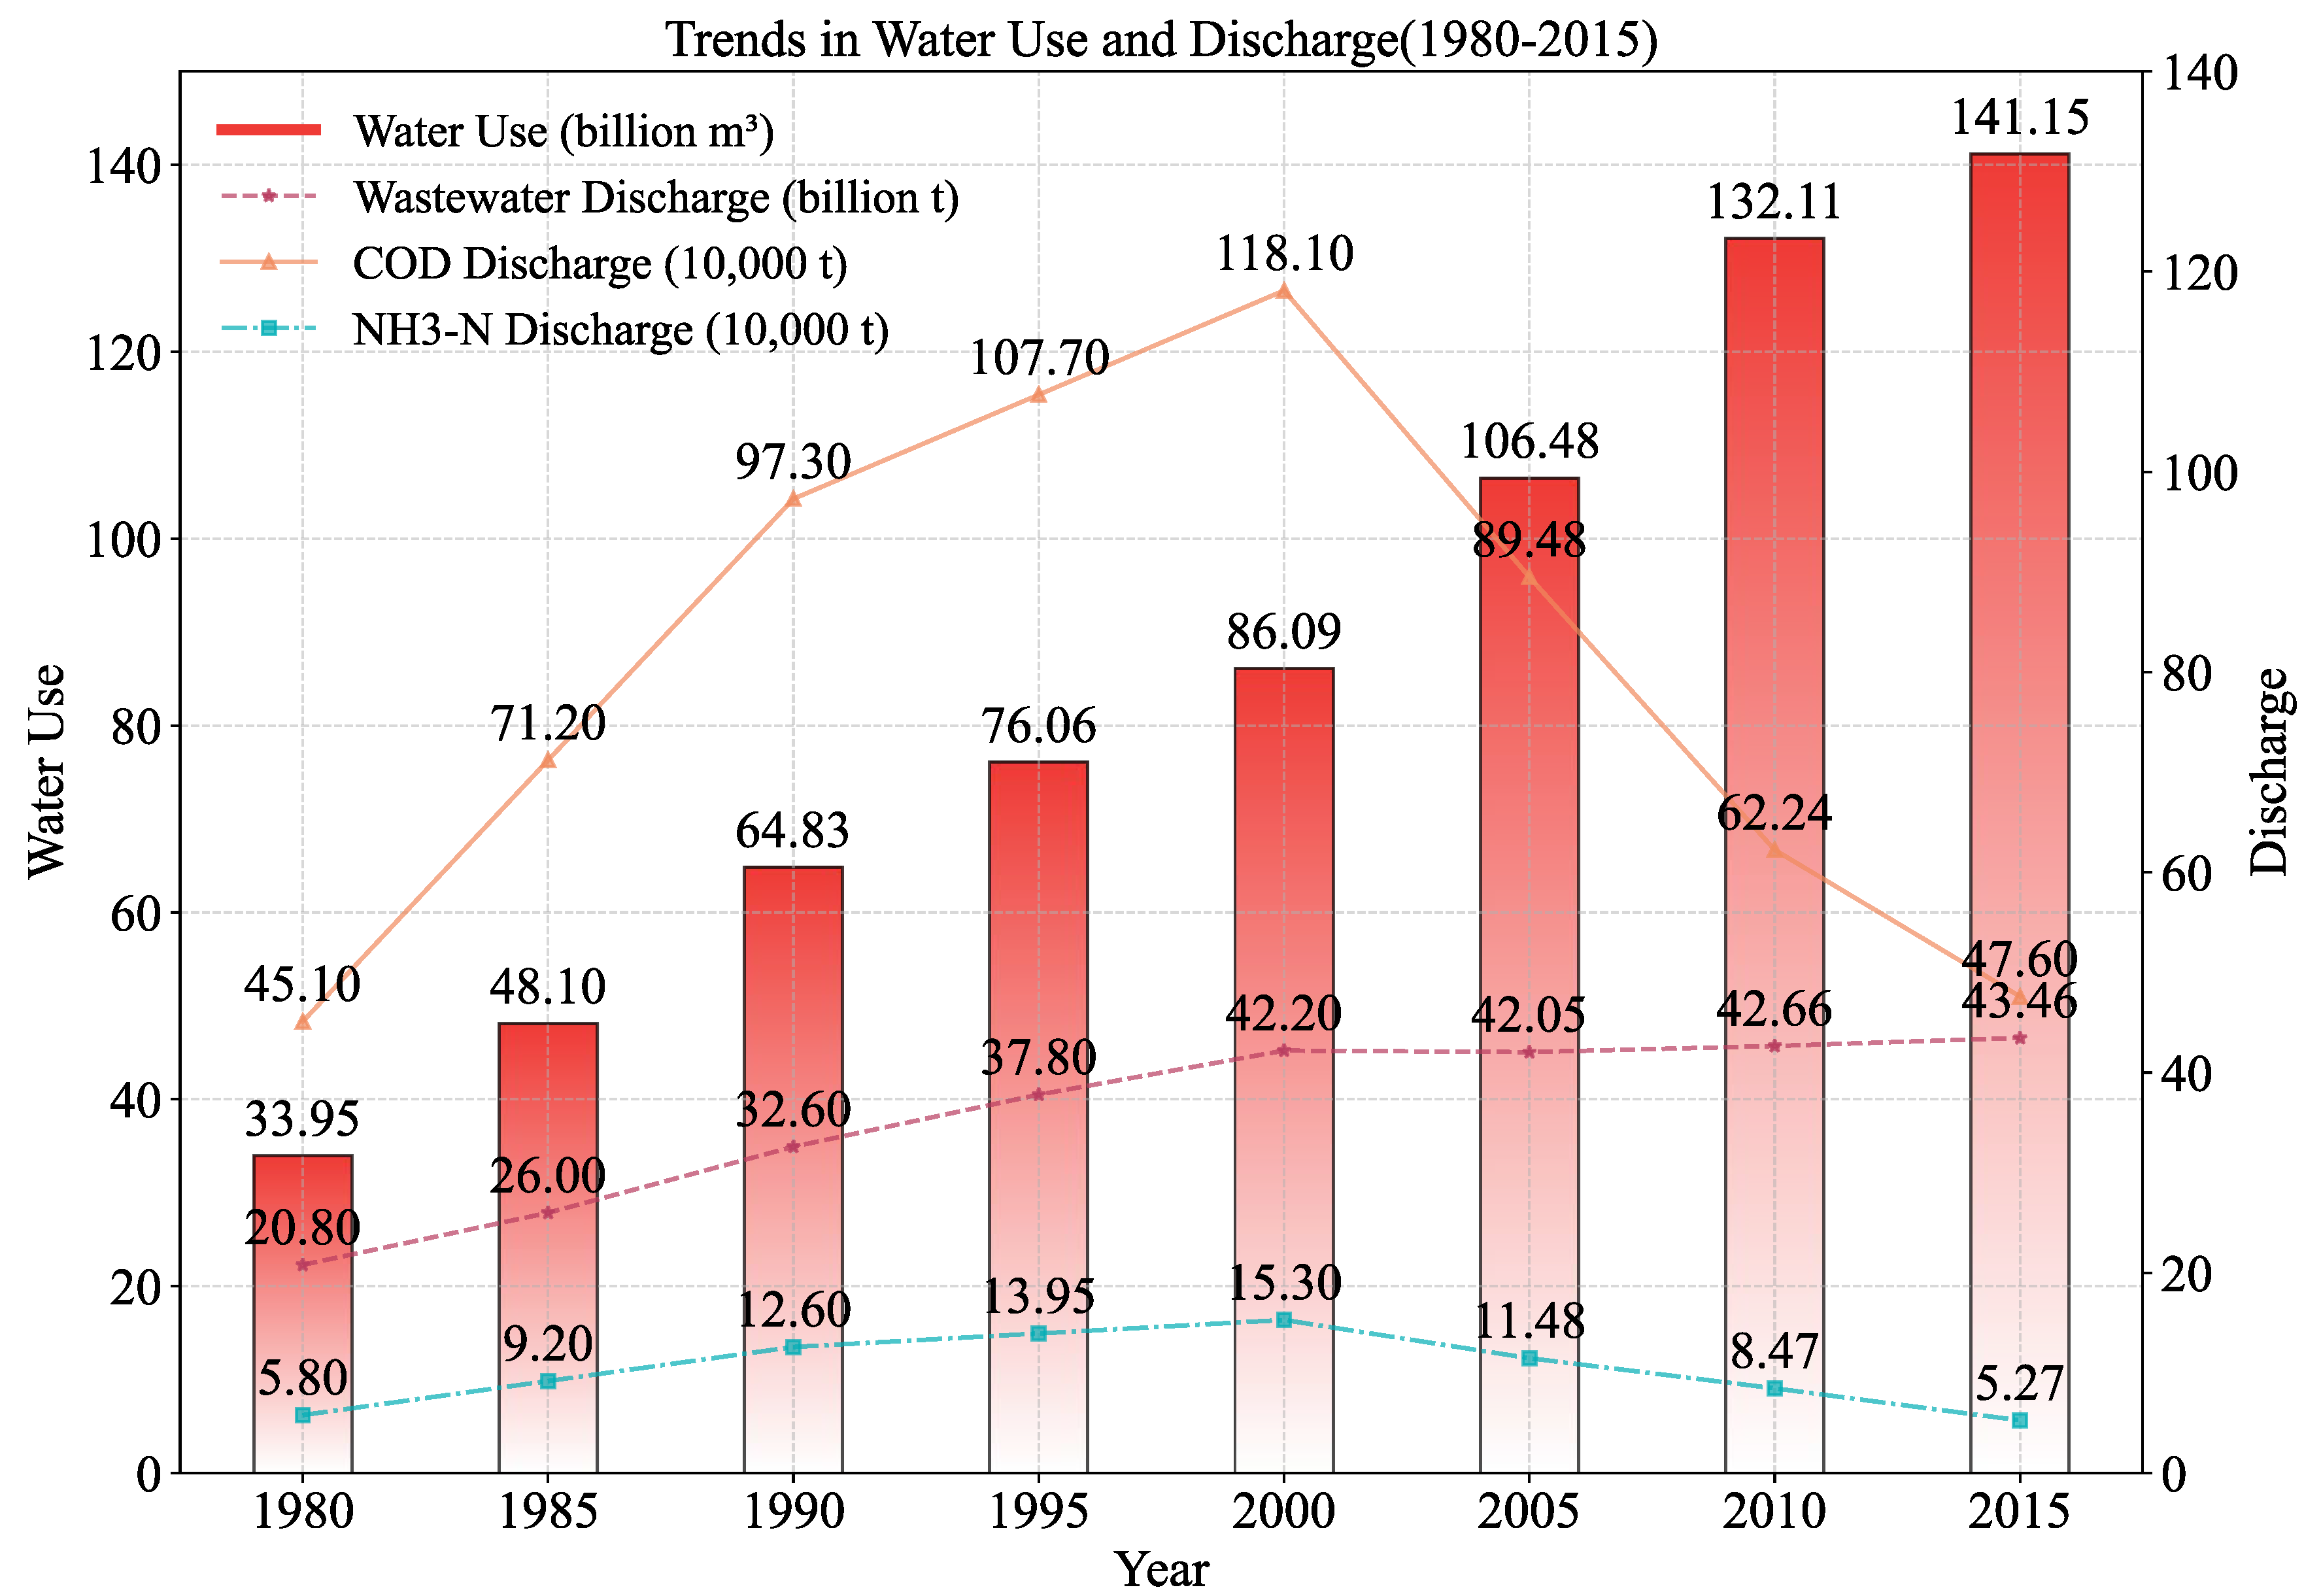
3.1.1. Water Usage, Wastewater Discharge, and Pollutant Emissions in the Yellow River Basin

Figure 2 below presents a comprehensive overview of the trends in water usage, wastewater discharge, and pollutant emissions in the Yellow River basin from 1980 to 2015. The graph highlights significant increases in water usage and wastewater discharge, along with fluctuations in pollutant levels, particularly COD and NH3-N.
The red bars represent the total water usage per billion cubic meters (m3). Over the 35-year period, water usage exhibits a marked increase, starting from 33.95 billion m3 in 1980 and reaching a peak of 141.15 billion m3 in 2015. This upward trend underscores the escalating demand for water resources driven by industrial growth, agricultural expansion, and urbanization. The purple dashed line with star markers illustrates the volume of wastewater discharged into the Yellow River basin, measured per billion tons. Wastewater discharge increased from 20.80 billion tons in 1980 to a peak of 43.46 billion tons in 2015. Notably, post-2000, the wastewater discharge fluctuated between 42 billion tons and 43 billion tons. While there is a slight increase from 42.20 billion tons in 2000 to 43.46 billion tons in 2015, the overall rate of increase in wastewater discharge is relatively small compared to the previous 20 years, during which it rose from 20.80 billion tons in 1980 to 42.20 billion tons in 2000. This slowdown in the pace indicates efforts to control and manage wastewater emissions through improved treatment facilities and regulatory measures.
The graph also tracks the discharge of two major pollutants: COD and NH3-N, both critical indicators of water quality. The COD discharge is represented by the orange line with square markers; COD discharge shows a significant rise from 451,000 tons in 1980 to a peak of 1.181 million tons in 2000. Following this peak, there is a noticeable decline, with levels dropping to 476,000 tons by 2015. On the other hand, the NH3-N discharge is indicated by the blue line with circular markers; NH3-N discharge initially increased from 58,000 tons in 1980 to 153,000 tons in 2000. After reaching this peak, NH3-N levels exhibited a steady decrease, reducing to 52,700 tons by 2015. The declines in both major pollutants signify the effectiveness of pollution control measures implemented over the years after 2000.

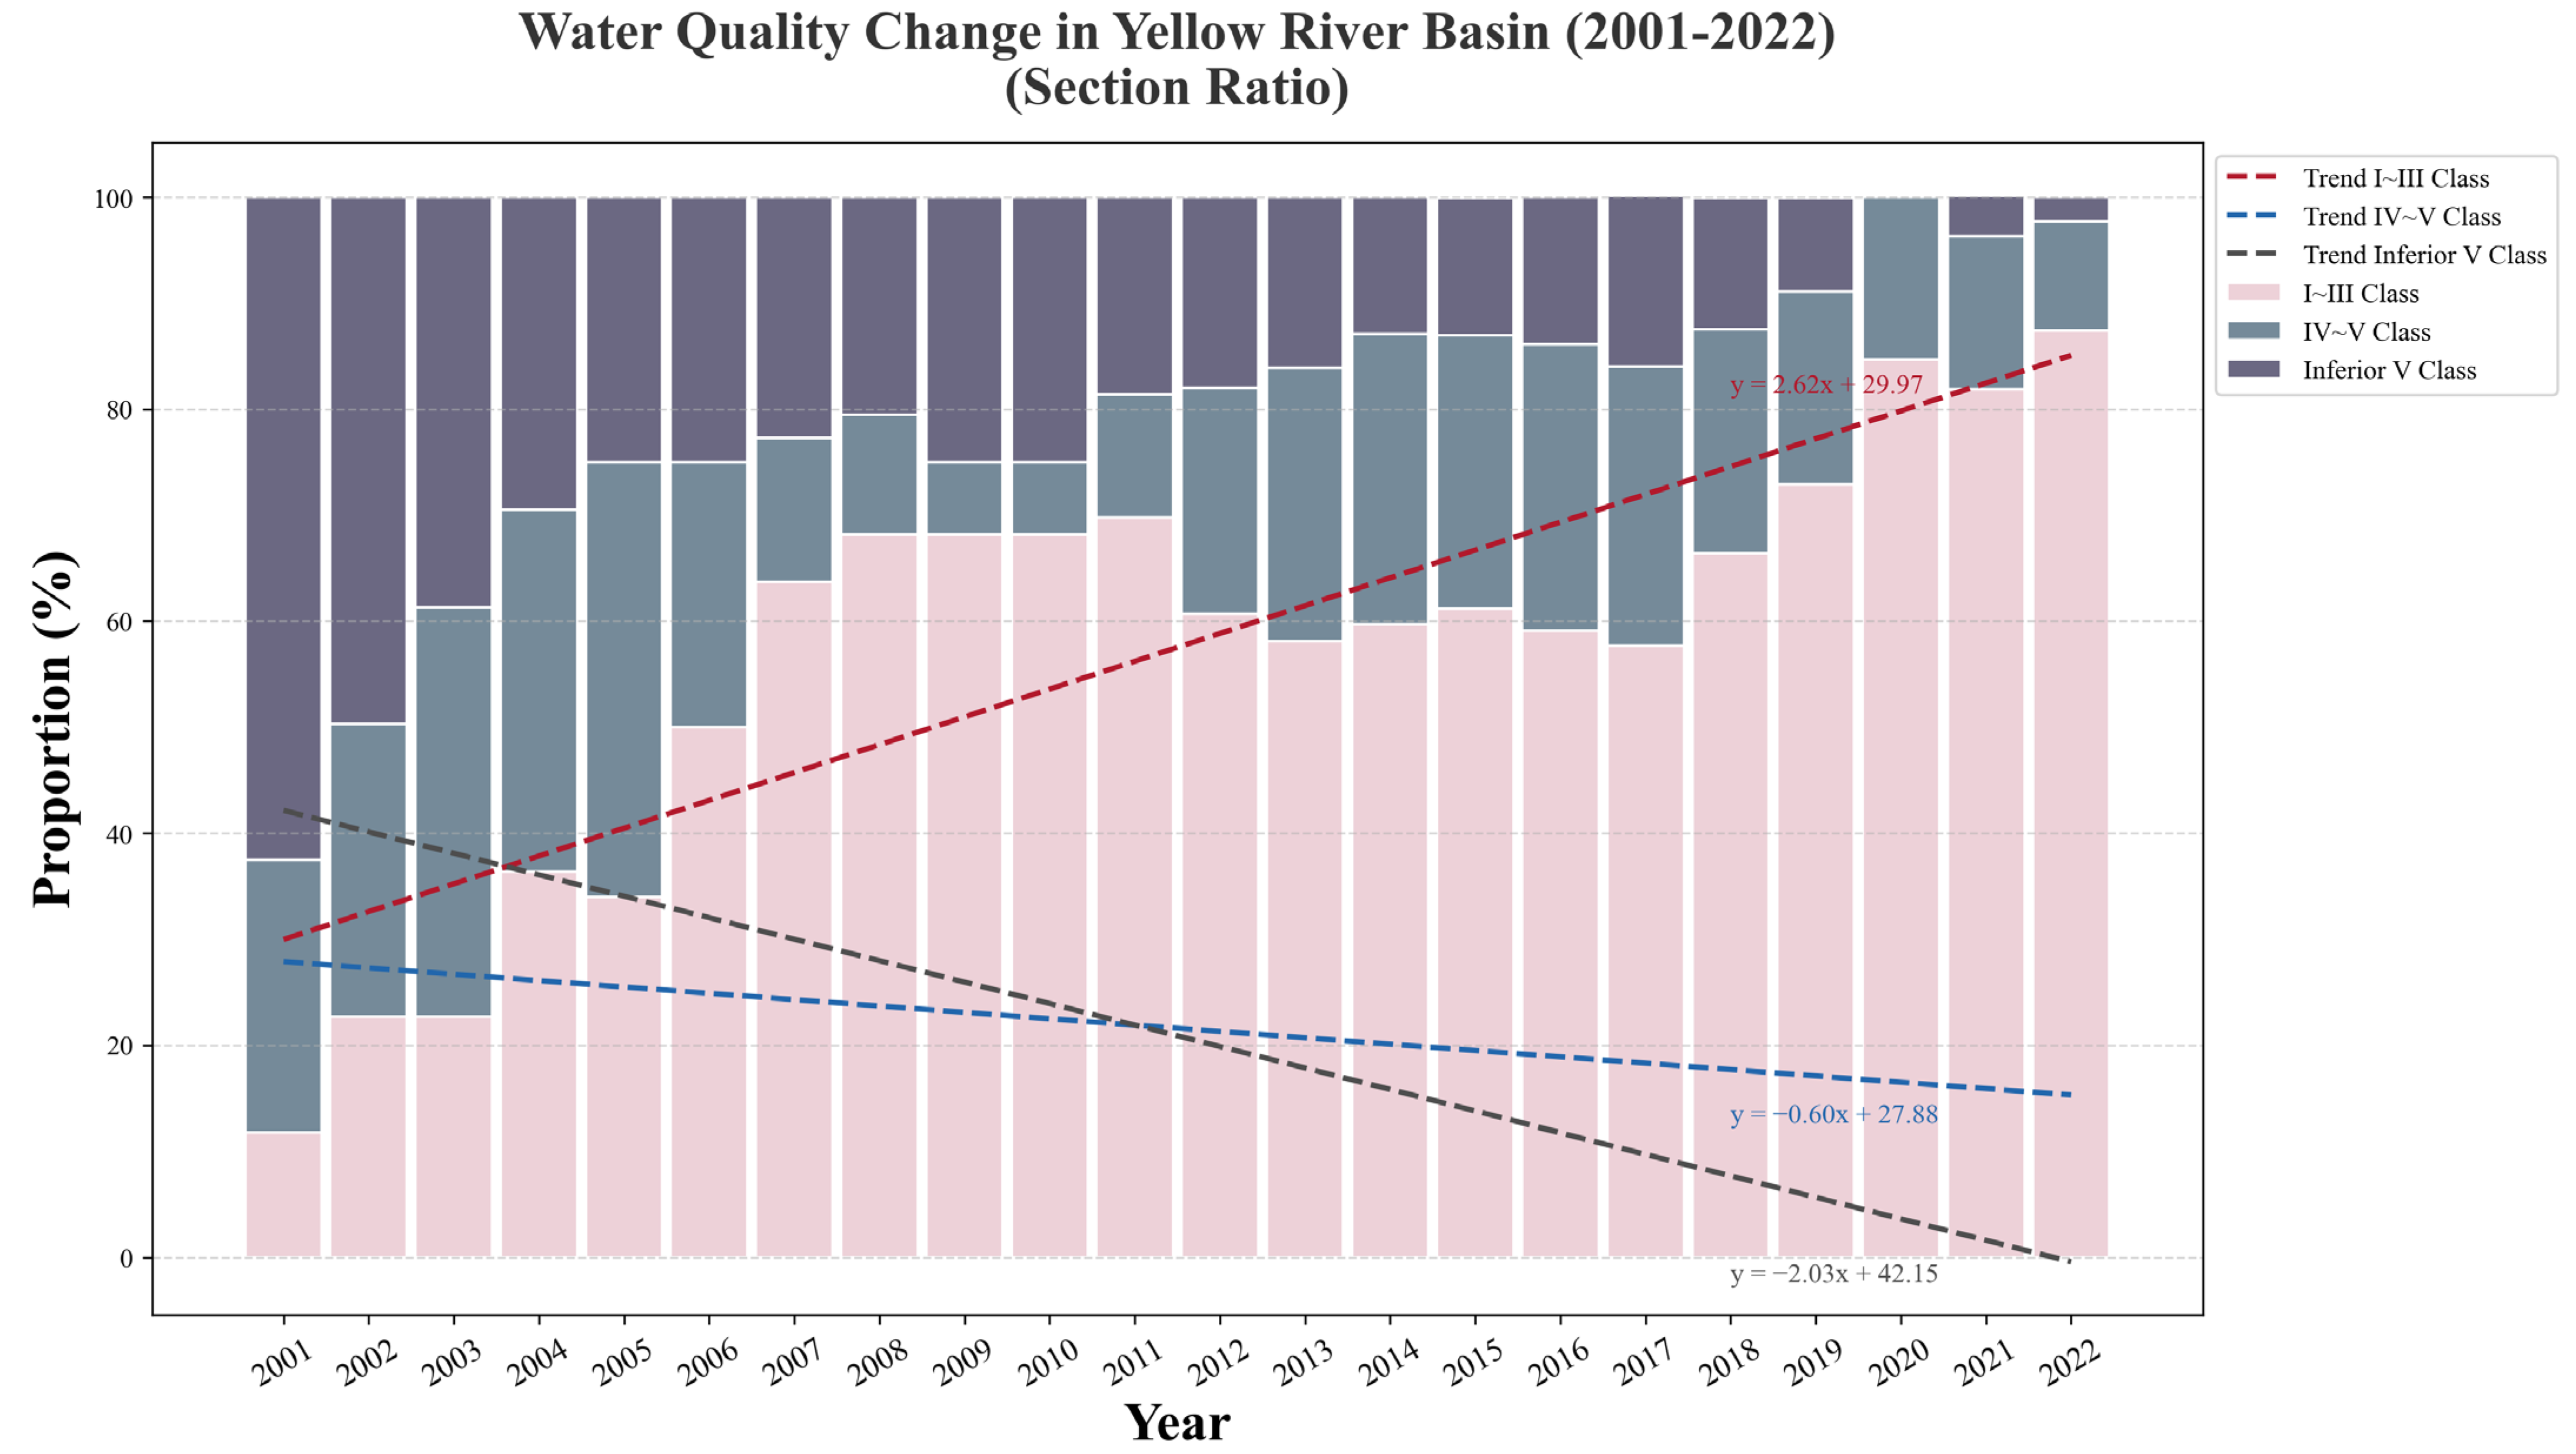
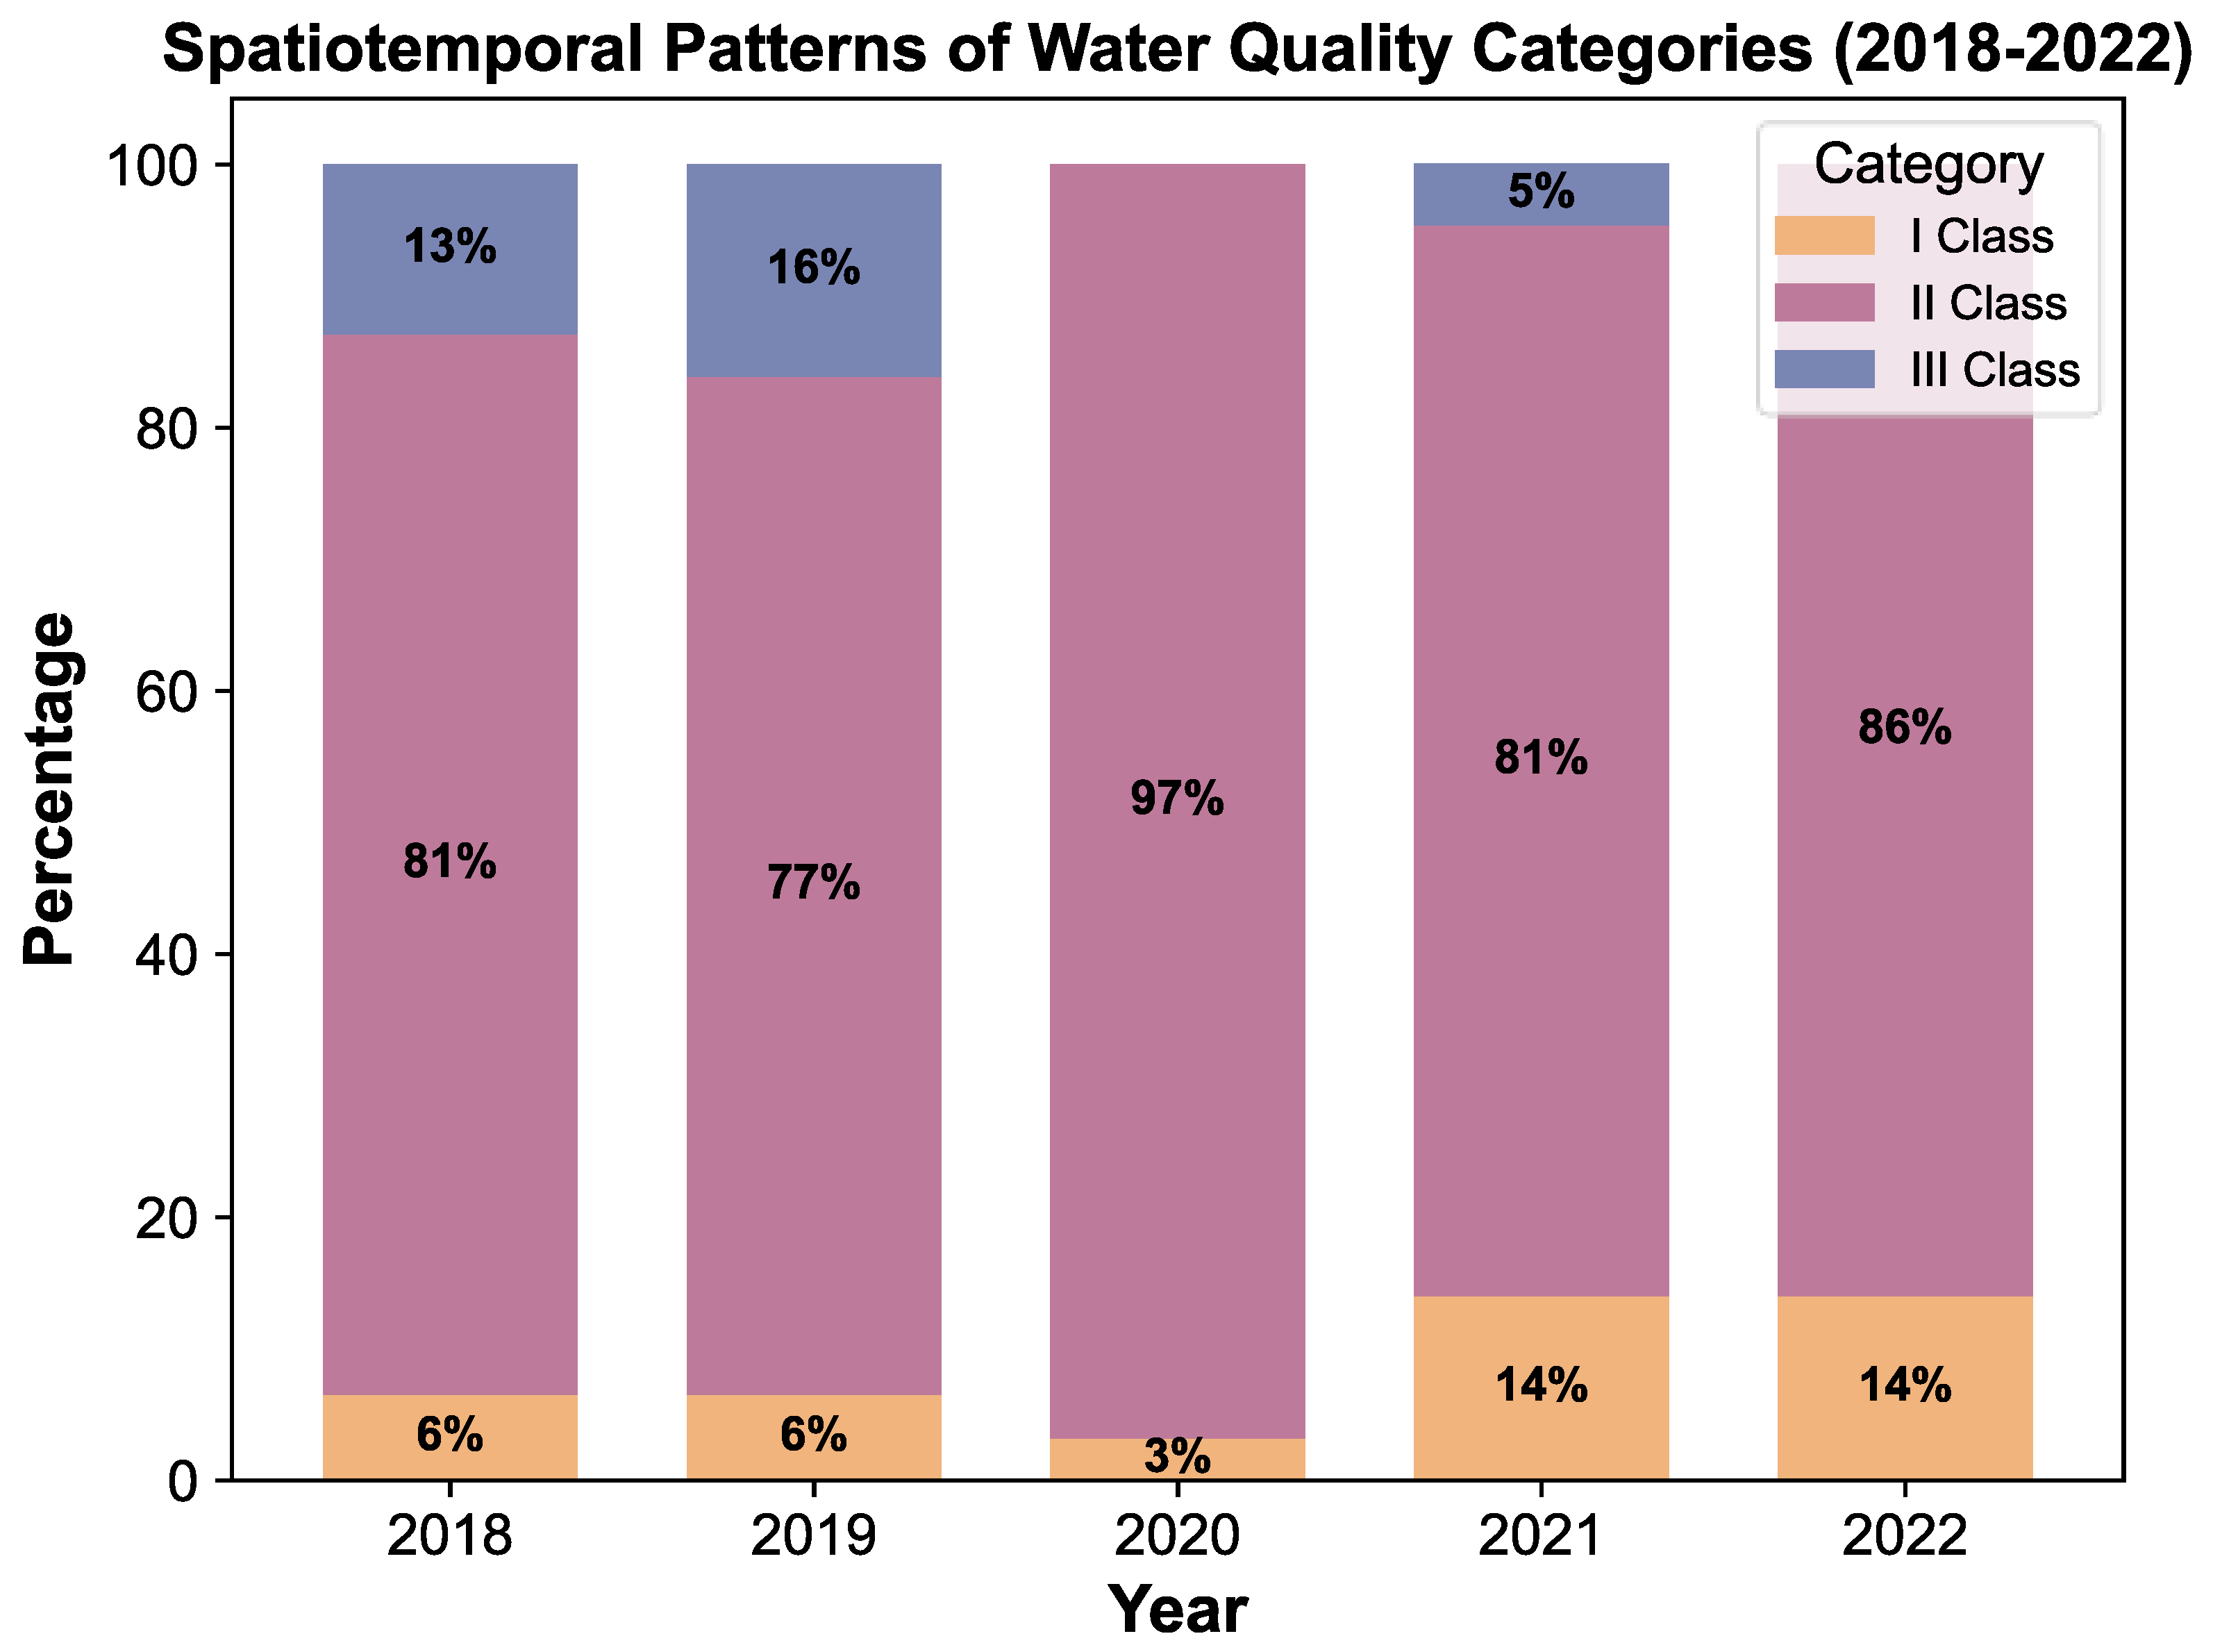
3.1.2. Classification of Overall Water Quality in the Yellow River Basin

Water quality is categorized into three classes to investigate the changes in overall water quality, which are Class I–III (good quality), Class IV–V (poor quality), and inferior Class V (very poor quality).
A radar chart is used to depict the river length ratio of different water quality classes from 1980 to 2020, with particular attention to key years (Figure 3). This chart provides an overview of the proportion of the river’s length that falls into each water quality category over the years. Based on data from the surveillance program, more than 80% of the river segments monitored met Class III water quality standards in 1980. Therefore, the water quality of the Yellow River’s mainstream was generally good at the time, except during the dry season in Lanzhou and Baotou, where some tributaries near large and medium-sized cities occasionally exceeded standards. By 1990 and 1995, the quality began to deteriorate, with an increase in segments classified as Class IV–V and inferior Class V. The year 2000 saw significant industrial development in the energy and chemical sectors, leading to increased water consumption and wastewater discharge. This period indicates a notable decline in water quality, with 32% of the water falling into inferior Class V. The year 2010 marked the lowest point in water quality, with approximately 16% of the water classified as inferior Class V, 25% as Class IV–V, and the remainder as Class I–III. During this period, 37.9% of the water at provincial boundaries was classified as inferior Class V, and 90.0% of main drinking water sources failed to meet standards. By the mid-2010s, the majority of the river length consistently fell into the Class I–III category. By 2020, there were improvements in water quality, with a significant reduction in segments classified as inferior Class V and Class IV–V.
A stacked bar graph illustrates the continuous changes in overall water quality from 2001 to 2022, depicted as section ratios (Figure 4). This figure illustrates the proportion of different water quality categories within specific sections of the river basin each year. Overall, the analysis using surveillance data from 2001 to 2022 indicates that the trend of water quality deterioration in the basin has been controlled in recent years, with overall water quality gradually improving. In 2001, the annual average proportion of water classified as inferior Class V quality in the basin was 56%, while only 12.2% of the water met Class I to III standards. By 2022, the water quality had notably improved, with 87.4% meeting Class I to III standards, 10.3% falling into Class IV to V, and only 2.3% classified as inferior Class V. Compared to 2001, this represents a significant 75.2% increase in the proportion of water with Class I to III quality, and a notable 53.7% decrease in water classified as inferior Class V quality. The figure also shows that from 2001 to 2005, there were substantial fluctuations in water quality, with a considerable portion of the water classified as Class IV–V and inferior Class V. However, starting from 2006, there is a visible trend toward improvement, with the proportion of water in the good quality range (Class I–III) steadily increasing.

3.2. Water Quality in the Yellow River Mainstream

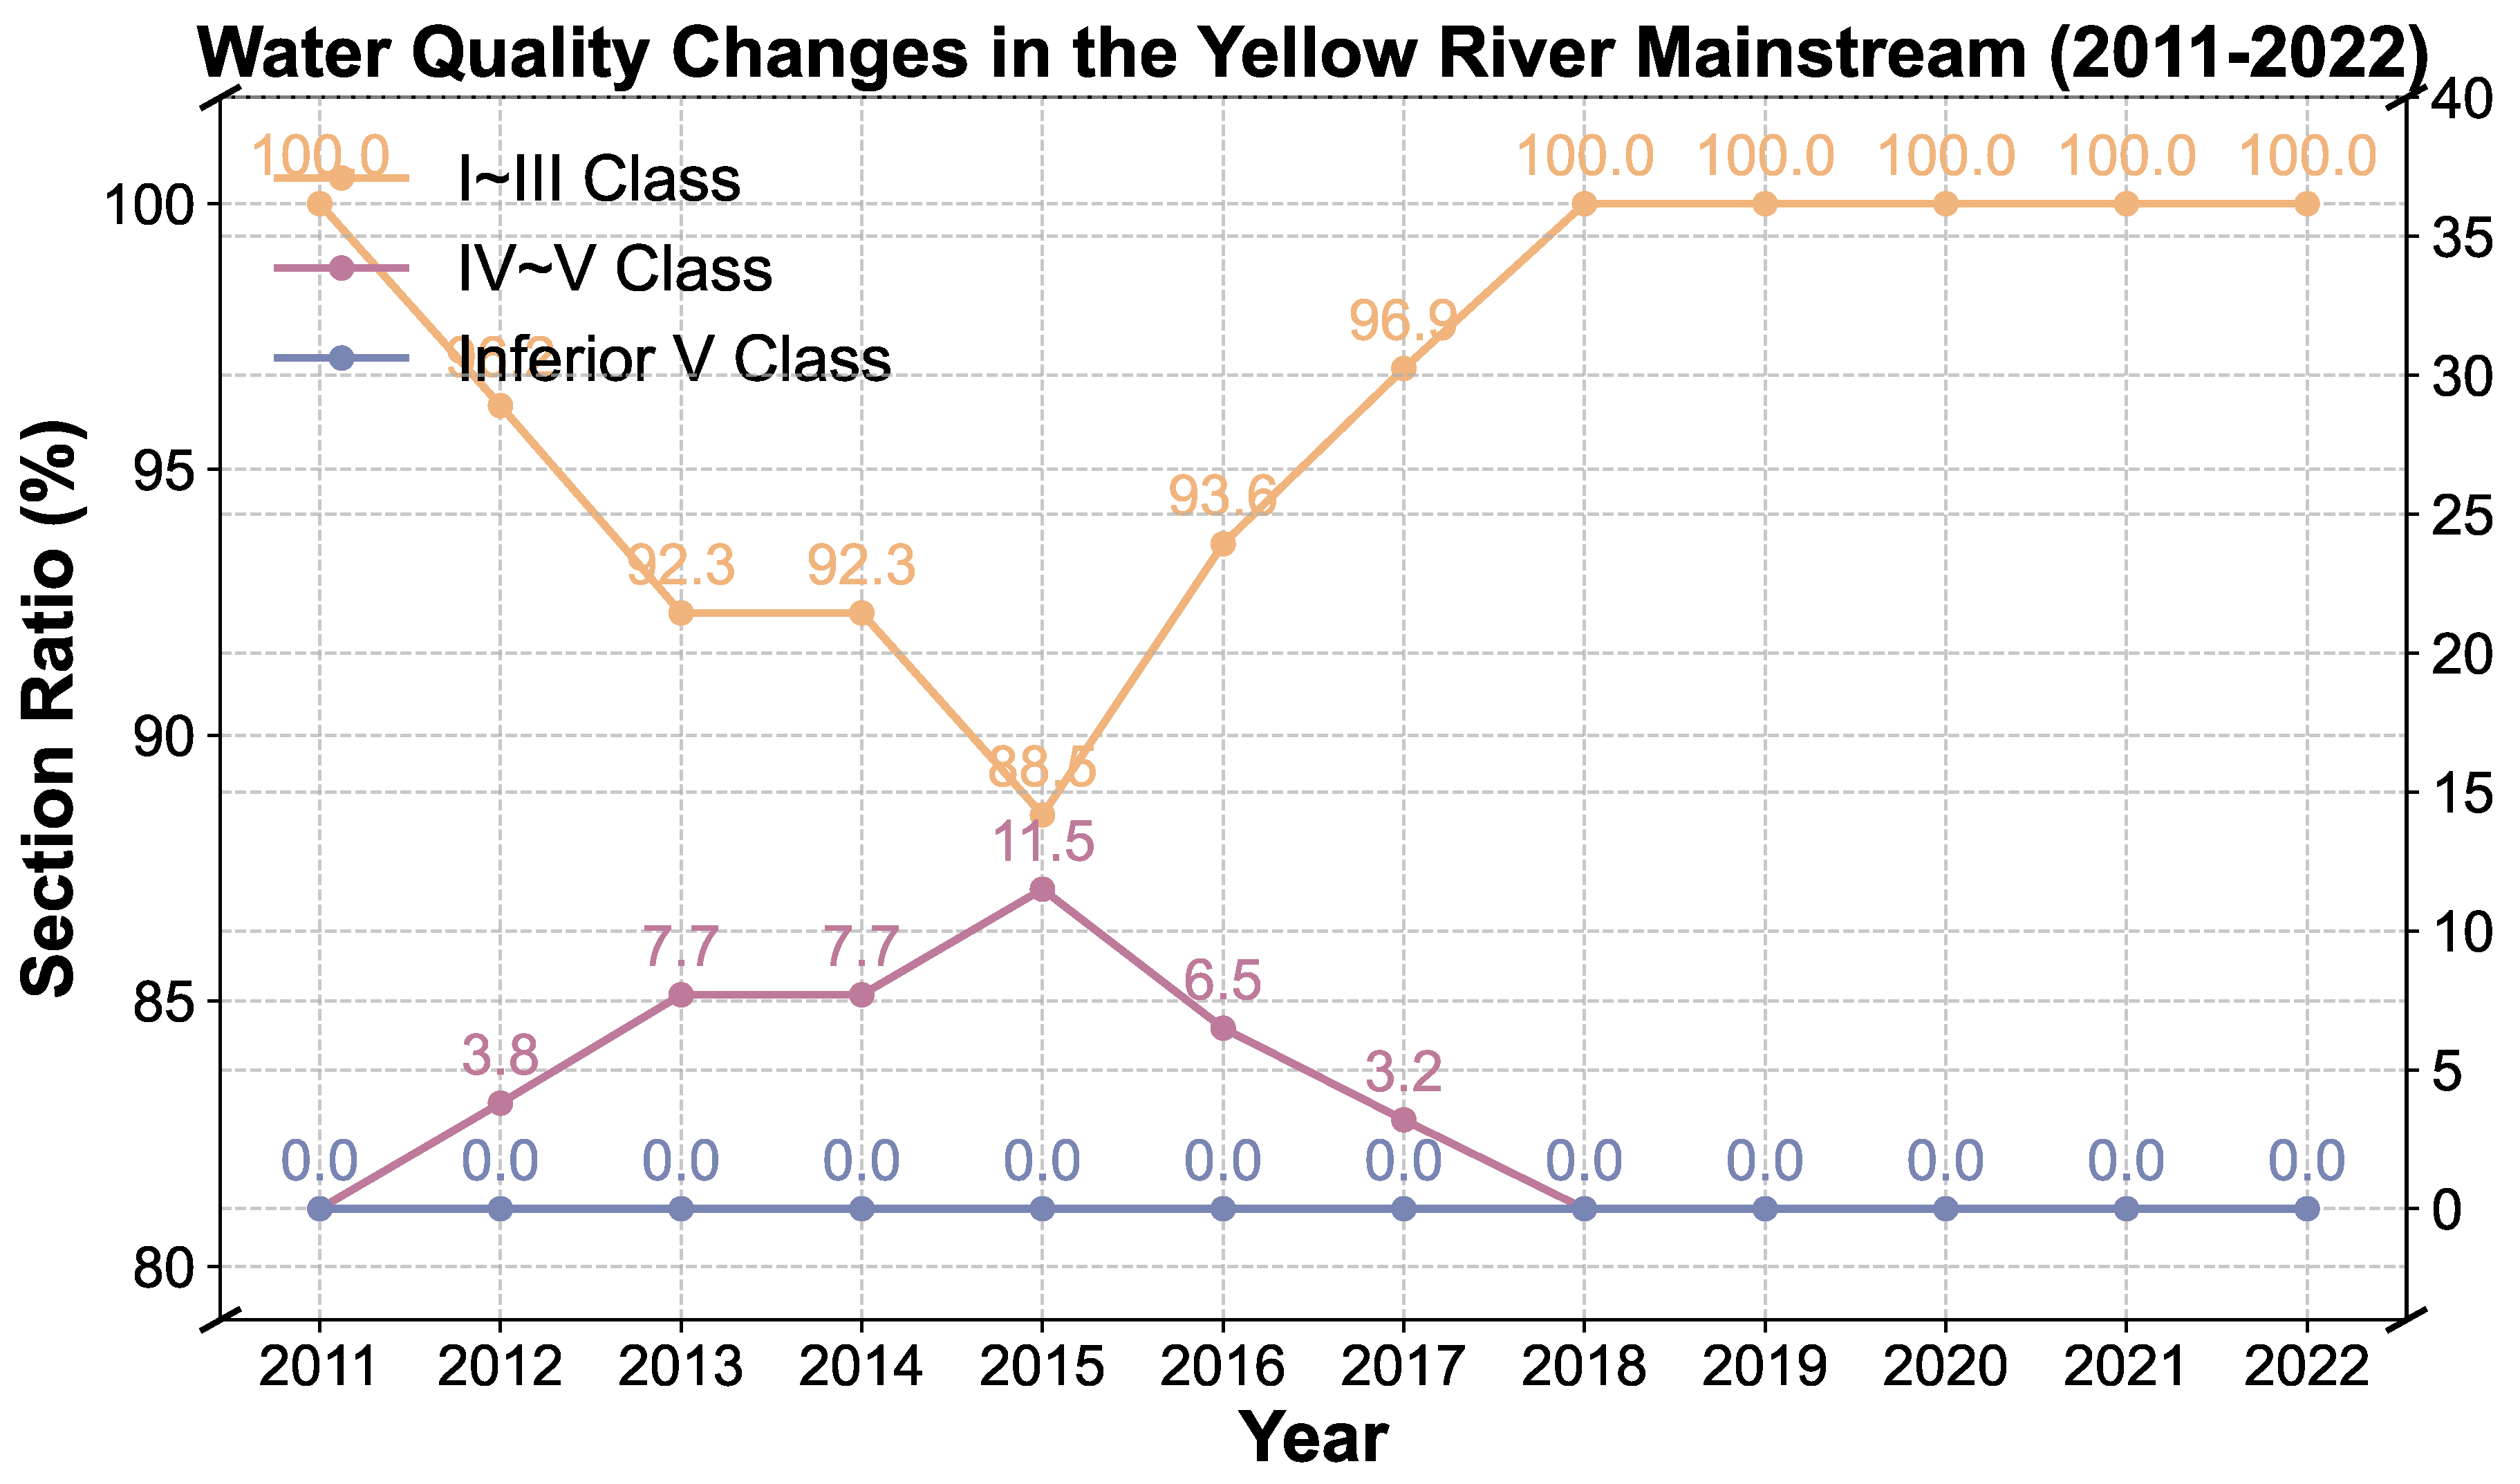
3.2.1. Classification of Overall Water Quality in the Yellow River Mainstream

Figure 5 and Figure 6 below provide insights into the water quality trends in the mainstream of the Yellow River from 2011 to 2022, highlighting key observations and patterns that reflect the mainstream’s environmental status.
The section ratio of various water quality classes over the years demonstrates a consistent trend of high water quality from 2011 to 2022 (Figure 5). Throughout this period, there was no instance of water being classified as inferior Class V quality in the mainstream. The mainstream generally maintained excellent water quality, with an average of 96.66% of the water classified as Class I to III and only 3.37% falling into Class IV to V. The year 2015 marked the lowest water quality, with 11.5% of the water in Class IV to V and 88.5% in Class I to III. Furthermore, the spatiotemporal distribution of water quality categories from 2018 to 2022 is visualized in Figure 6. Throughout this period, the mainstream consistently maintained Class I to III water quality, indicating a stable and positive trend. Notably, in both 2020 and 2022, the majority of the water quality was classified as Class II and above. In 2018, the distribution was 81% Class I, 13% Class II, and 6% Class III. By 2022, the quality had further improved, with 86% of the water in Class I, 14% in Class II, and none in Class III.

3.2.2. Pollutant Concentrations in the Yellow River Mainstream

A comparison of the concentrations of COD and NH3-N in the mainstream of the Yellow River between the years 2000 and 2018 was conducted and concluded significant improvements in water quality over this period (Figure 7).
The results reveal a substantial decline in COD levels by 2018 compared to 2000 (Figure 7a). The average COD concentration across primary water bodies, including Lanzhou (LZ), Shizuishan (SZS), Huajiangying (HJY), Tongguan (TG), Sanmenxia (SMX), and Huayuankou (HYK), was 12.81 mg/L in 2018. This represents a reduction of 21.91 mg/L or 63.10% compared to the levels observed in 2000. For instance, Lanzhou saw a decrease from 62.5 mg/L in 2000 to 9.91 mg/L in 2018, while Huayuankou’s COD concentration dropped from 42.2 mg/L to 12.76 mg/L. As for the changes in NH3-N concentrations at the same measured sites (Figure 7b), the average NH3-N concentration in 2018 was 1.59 mg/L, which is a decrease of 1.38 mg/L or 86.61% compared to 2000. Specific examples include Shizuishan, where NH3-N levels dropped from 1.50 mg/L in 2000 to 0.15 mg/L in 2018, and Tongguan, which saw a reduction from 2.47 mg/L to 0.20 mg/L.

3.3. Water Quality of Major Tributaries in the Yellow River

3.3.1. Classification of Overall Water Quality in the Yellow River Tributaries

According to a contemporaneous comparative analysis from 2011 to 2022, the water quality of the Yellow River tributaries has improved significantly from moderate pollution to good condition. Changes in the overall water quality in the tributaries feeding into the Yellow River were observed from 2011 to 2022 (Figure 8). On average, the proportion of water classified as Class I to III quality was 53.88%, while Class IV to V accounted for 28.32% and Class V comprised 17.77% of the total. Notably, in 2011, water quality was at its poorest, with approximately 62% of the water identified as Class V. However, by 2022, there was a remarkable improvement, with 85% of the water classified as Class I to III, 12.3% as Class IV to V, and only 2.7% as inferior Class V.

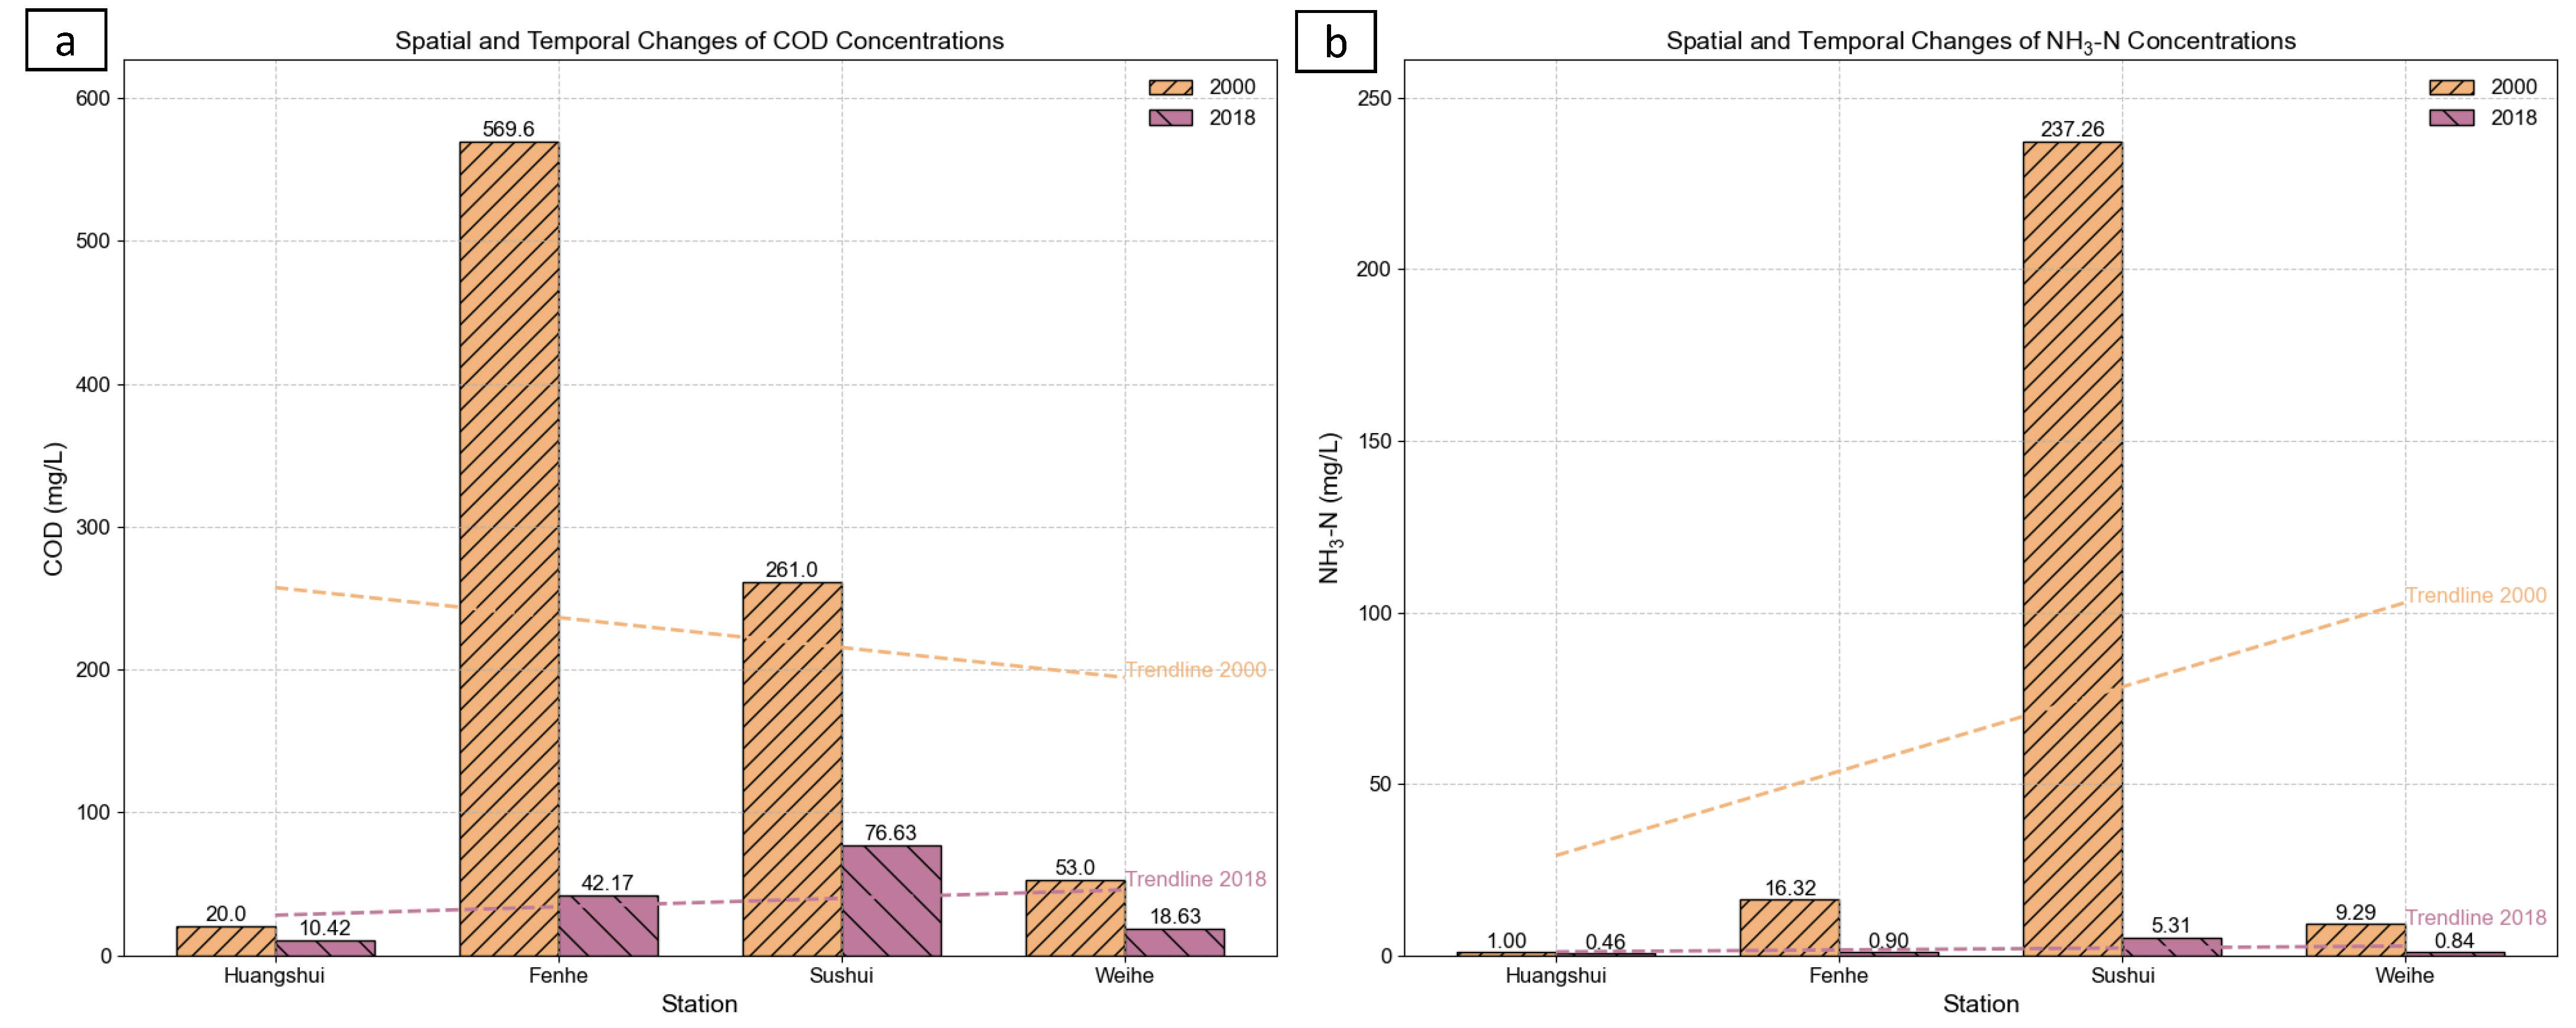
3.3.2. Pollutant Concentrations in the Yellow River Tributaries

A comparison of the concentrations of major pollutants in specific segments of the Yellow River tributaries between 2000 and 2018 was also conducted, showing similarly significant decreases in pollution levels during this period as observed in the mainstream.
Changes in COD concentrations at various measured sites along the Yellow River tributaries are shown in Figure 9. The data reveal a substantial decline in COD levels by 2018 compared to 2000. For example, the COD concentration at the Fen River west division decreased by 92.60%, from 569.6 mg/L in 2000 to 42.17 mg/L in 2018. Similarly, at the Sushui River Puzhou site, COD levels dropped from 261.0 mg/L to 76.63 mg/L, and at the Wei River suspension bridge, from 53.0 mg/L to 18.63 mg/L. Figure 9b depicts the changes in NH3-N concentrations at the same sites. The NH3-N concentration at Sushui River Puzhou was notably reduced by 97.76%, from 237.26 mg/L in 2000 to 5.31 mg/L in 2018. At the Fen River west division, NH3-N levels decreased from 16.32 mg/L to 0.90 mg/L, and at the Wei River suspension bridge, from 9.29 mg/L to 0.84 mg/L. Among the tributaries, the Huangshui site exhibited the least pollution in 2018, with COD levels dropping from 20.0 mg/L in 2000 to 10.42 mg/L and NH3-N levels decreasing from 1.00 mg/L to 0.46 mg/L.

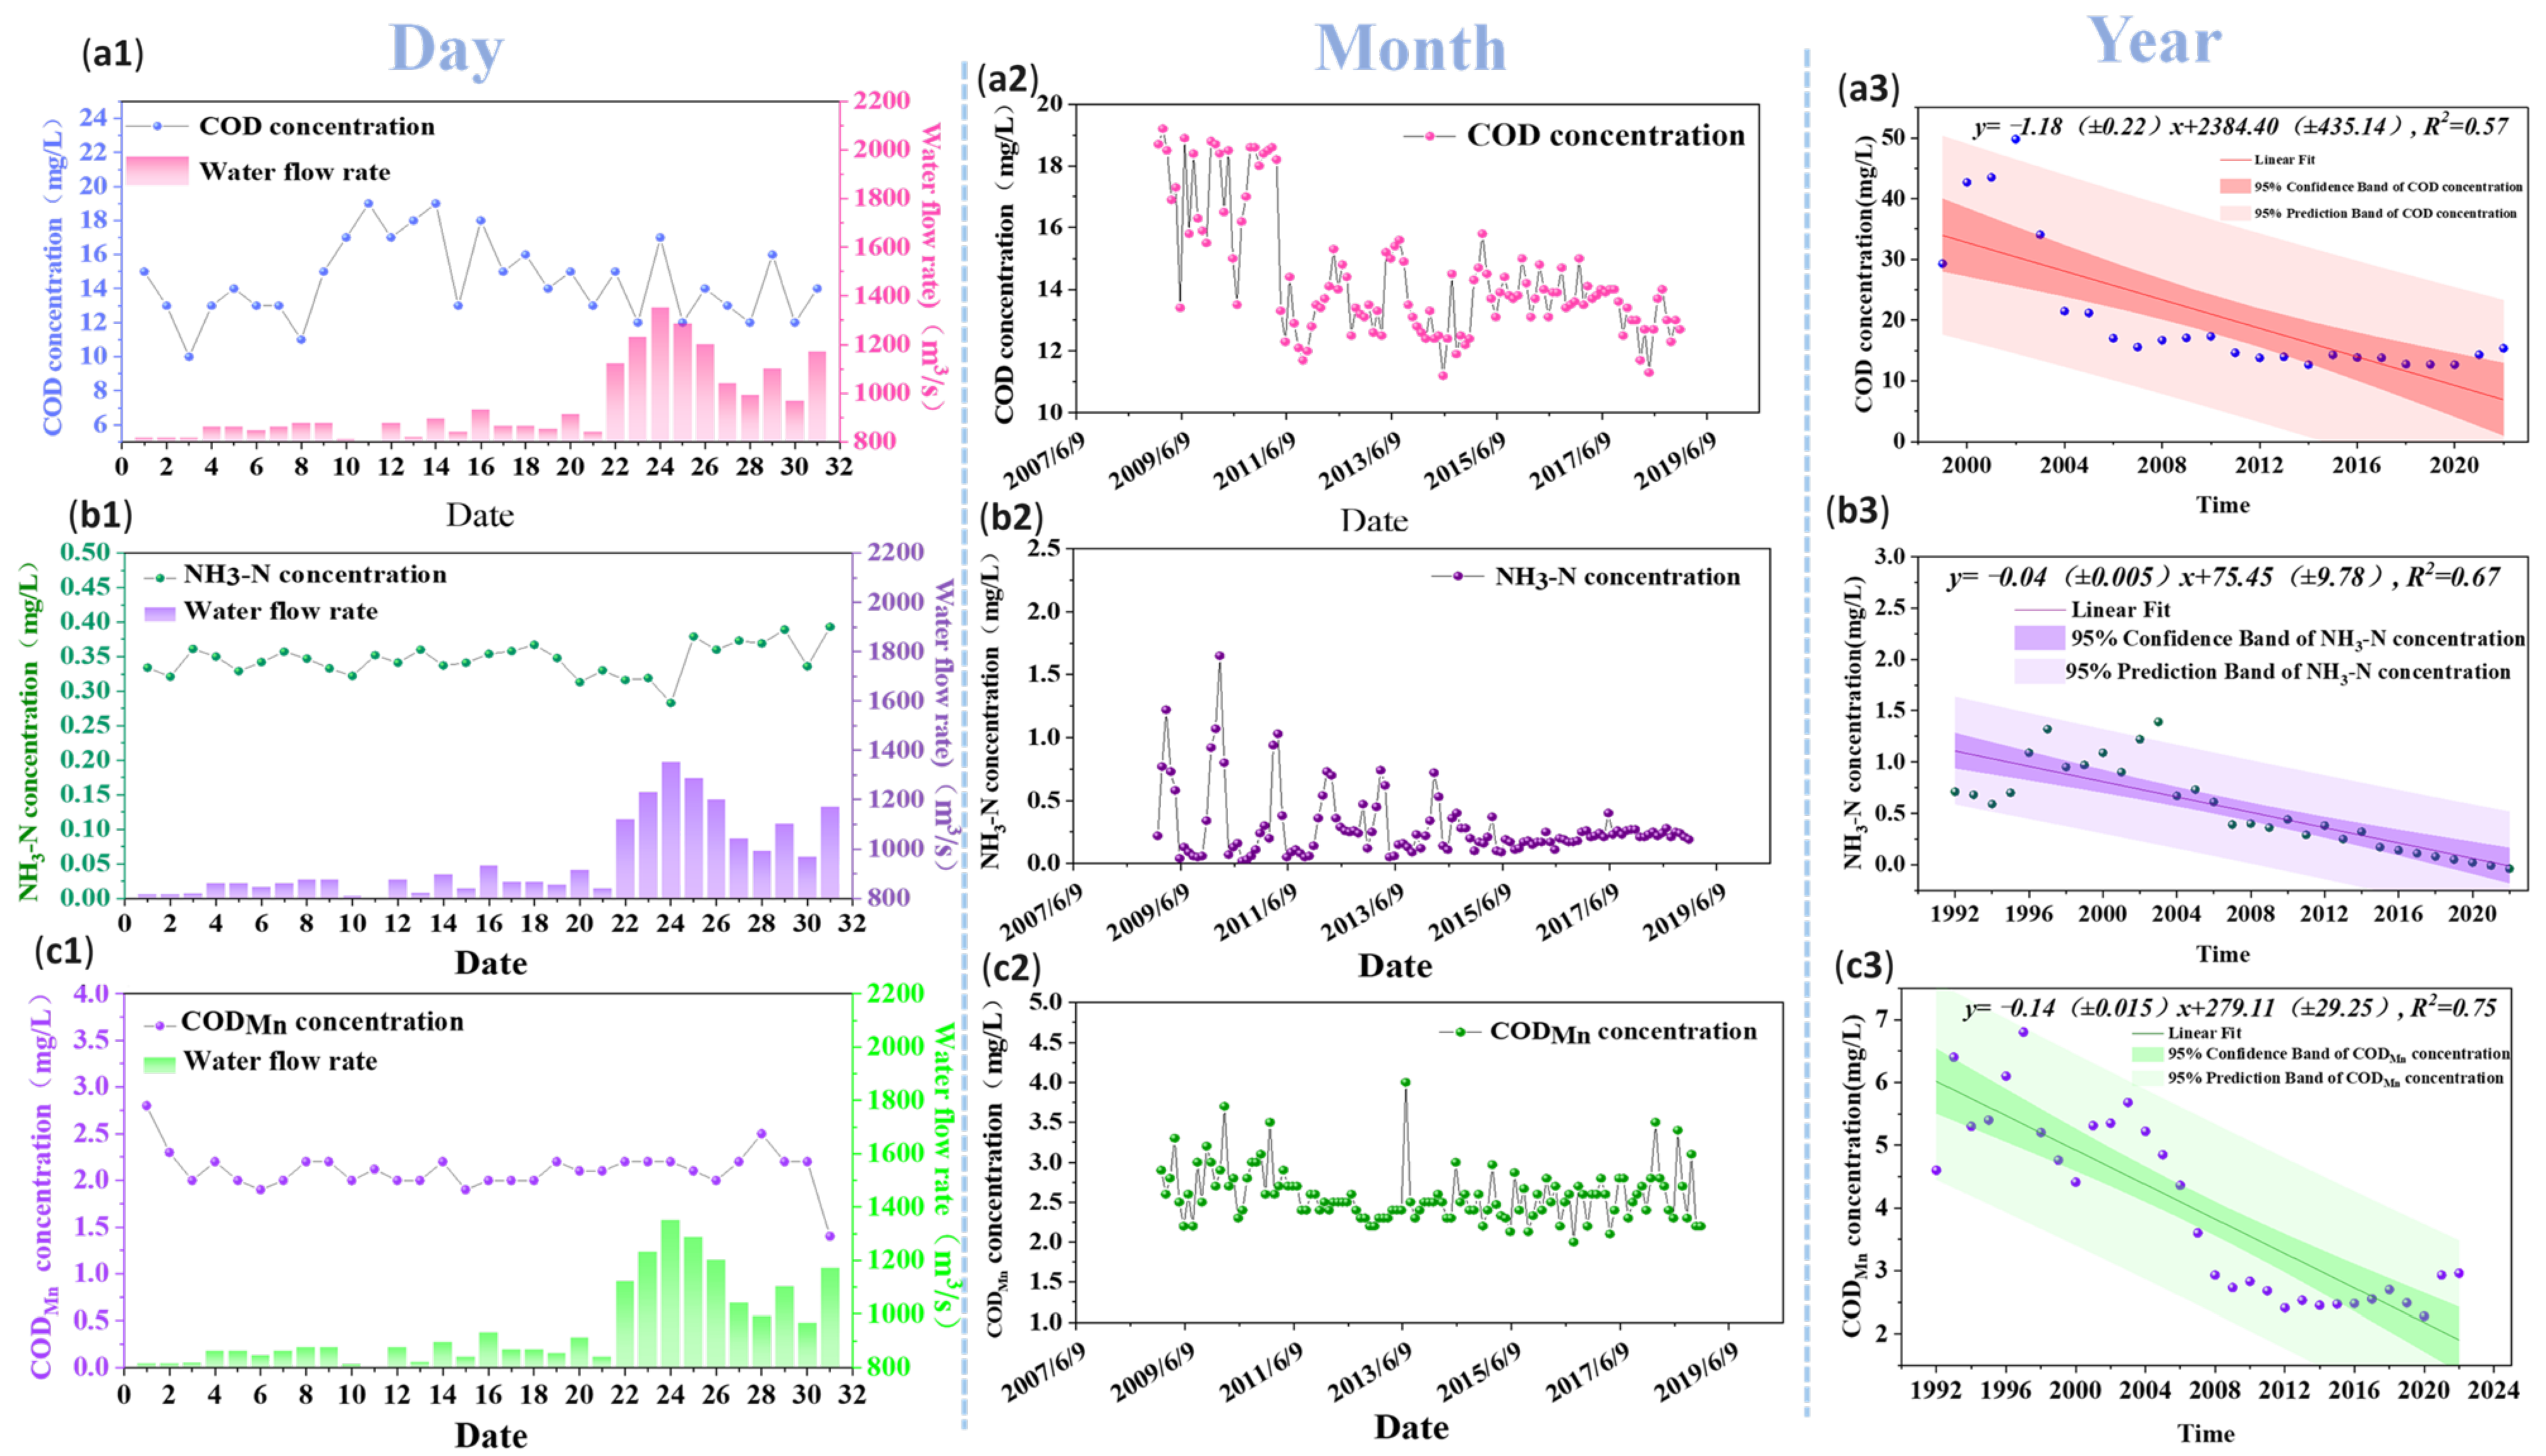
3.4. Variations in Water Quality in the Huayuankou Section

The time-dependent variations in primary pollutants’ concentrations in the Huayuankou section of the Yellow River were analyzed to highlight daily, monthly, and annual fluctuations in COD, NH3-N, and CODMn levels (Figure 10).
In 2020, from 1–31 March the average flow rate for COD was 947 m³/s and the average water temperature was approximately 7.9 °C (Figure 10a1). COD concentrations ranged from 10 to 19 mg/L, with an average of 14.45 mg/L. Throughout the month, the COD concentration was classified as Class II for 22 days and Class III for 9 days, with the highest frequency at 14.5 mg/L, indicating a near-normal distribution. Figure 10b1 illustrates the daily NH3-N concentrations, which varied between 0.283 and 0.393 mg/L, averaging 0.346 mg/L. All NH3-N measurements were within Class II standards for the entire month, following a normal distribution with the highest frequency at 0.34 mg/L. Figure 10c1 presents the daily CODMn concentrations, ranging from 1.4 to 2.8 mg/L, with an average of 2.11 mg/L. The CODMn concentration was classified as Class I for 18 days and Class II for 13 days, with the highest frequency at 2.2 mg/L.
The monthly water quality monitoring data from 2009 to 2018 in the Huayuankou section reveal significant intra-annual variations in pollutant concentrations. For example, in 2011, the COD concentration ranged from 12.7 to 18.6 mg/L, displaying notable seasonal patterns (Figure 10a2). During the wet season (July to October), the average COD concentration was 12.78 mg/L, while it increased to 15.43 mg/L in the dry season (November to February) and averaged 15.6 mg/L from March to June. After 2012, the COD concentrations remained relatively stable with less pronounced seasonal variations. Similarly, the NH3-N concentration in 2010 fluctuated between 0.02 and 1.65 mg/L (Figure 10b2). The average NH3-N concentration was 0.068 mg/L during the wet season, 0.585 mg/L during the dry season, and 0.663 mg/L from March to June. Notably, from 2009 to 2011, NH3-N concentrations exceeded standard limits for several months, but improvements were observed post-2012, with fluctuations decreasing and stabilizing from 2015 onwards. In contrast, the CODMn concentrations exhibited more stable intra-annual variations compared to COD and NH3-N levels (Figure 10c2). The peak fluctuation occurred in 2013, with concentrations ranging from 2.3 to 4 mg/L and an average of 2.53 mg/L. According to the national water quality standards (GB3838-2002), the water quality was classified as Class II.
The annual COD, NH3-N, and CODMn levels in the Huayuankou section reveal a downward trend in the concentrations of all pollutants over this period from 1992 to 2022 (Figure 10a3,b3,c3). COD levels peaked at 49.8 mg/L in 2002, NH3-N at 1.39 mg/L in 2003, and CODMn at 6.8 mg/L in 1997. Subsequently, the concentrations of these pollutants have decreased annually. In recent years, water quality has stabilized, with COD meeting Class I standards and NH3-N and CODMn meeting Class II standards based on the national water quality standards (GB3838-2002).

4. Discussion

4.1. Water Quality in the Yellow River Basin, Mainstream, and Tributaries

The trends shown in Figure 2 underscore the critical role of targeted regulatory interventions and environmental campaigns in shifting the Yellow River basin from a state of severe pollution to improved water quality [2]. The dramatic reduction in Class IV–V water quality categories, particularly after 2015, can be attributed to the comprehensive ‘Action Plan for Prevention and Control of Water Pollution’ launched in 2015 [15]. This national agenda enforced stringent controls on industrial wastewater discharge, significantly upgraded urban sewage treatment facilities, and promoted eco-friendly agricultural practices. These measures were particularly impactful in the mainstream sections, where the majority of urban and industrial centers are located. Concurrently, the stabilization in wastewater and pollutant discharges underscores the effectiveness of regulatory policies and technological advancements in environmental protection [42]. Nevertheless, the presence of centralized return water and sewage in agricultural irrigation further complicates water quality management [43]. The results show a small portion of water bodies classified as Class V, indicating the need for sophisticated and adaptable pollution control strategies. Figure 2 ultimately highlights the effectiveness of current water management strategies that balance economic growth and water quality, although some areas still lack enforcement. Figure 3 and Figure 4 further validate the success of pollution control initiatives, with a notable improvement in water quality categories from 2015 onward. The widespread adoption of advanced wastewater treatment technologies, driven by the 13th Five-Year Plan’s emphasis on environmental protection, played a crucial role in these advancements. In the mainstream, where population density and industrial activities are higher, these technologies were more effectively implemented, leading to consistently better water quality compared to the tributaries. In contrast, tributaries, often located in less urbanized regions, saw slower improvements due to challenges in infrastructure and enforcement. However, continuous monitoring and adaptive management are essential to maintain these improvements and address remaining Class V water.
A positive trend in the mainstream of the Yellow River from 2011 to 2022 is illustrated, with pollutant concentrations compared from 2000 to 2018 (Figure 5, Figure 6 and Figure 7). This underscores the success in maintaining high water quality, with no Class V water after 2018. The sustained improvement highlights effective targeted interventions, stringent regulations, and advanced wastewater treatment. The decrease in both COD and NH3-N levels demonstrates the impact of these measures. The high water quality standards are partly due to the relatively small number of sewage outlets in the mainstream, which are concentrated in large- and medium-sized cities with significant resource advantages. The consistent classification of the mainstream into higher water quality categories also reflects increased efforts to reduce pollution and efficiently manage water resources in key urban areas and resource-rich locations compared to the overall basin area.
Similarly, a positive trend in the Yellow River tributaries from 2011 to 2022 is also observed, along with a significant decrease in pollutant concentrations from 2000 to 2018 (Figure 8 and Figure 9). This demonstrates the success of interventions and regulatory efforts in reducing pollution. These advancements again underscore the substantial impact of sustained environmental efforts on enhancing the health and quality of these critical water systems. However, regional economic development, the distribution of water systems, and variations in river potential have led to the majority of sewage outlets being located in tributaries, significantly impacting water pollution management [44]. Consequently, pollution in certain water bodies remains severe due to the accumulation of heavy contaminants [32,45]. This results in some waters being consistently classified above Class III, with a small proportion as Class V.
According to the latest report from 2022, water quality in some tributaries was categorized as Class IV or V, with 12.3% classified as Class IV and 2.7% as Class V. Although these percentages are small, they highlight the significant disparity in water quality improvements between the mainstream and its tributaries. While the mainstream consistently achieves high water quality, with 100% of the water classified as Class I–III and the majority as Class II, the tributaries lag behind. This disparity results from concentrated pollution control efforts and advanced wastewater treatment technologies in the mainstream, particularly in key urban and resource-rich areas. In contrast, tributaries face more severe pollution due to regional economic development, numerous sewage outlets, and the accumulation of heavy contaminants, leading to some waters being consistently classified above Class III. Addressing this gap requires focused and localized pollution control strategies in the tributaries.
In addition to addressing industrial and domestic pollutants, nutrient pollution, particularly from agricultural runoff, has been a significant concern in the Yellow River basin. Excessive nutrient input, especially nitrogen and phosphorus, has the potential to cause eutrophication, leading to algal blooms and subsequent oxygen depletion in water bodies. While the mainstream has generally maintained higher water quality standards, some tributaries and localized areas continue to face the risk of eutrophication due to the accumulation of nutrients. This risk is exacerbated by the sediment transport dynamics in the basin, where sediments can bind with these nutrients and facilitate their downstream movement. Effective management strategies must therefore not only focus on reducing traditional pollutants but also on controlling nutrient loads and preventing eutrophication, particularly in vulnerable tributaries.

4.2. Water Quality in the Huayuankou Section

The significant improvement in water quality in the Huayuankou section, as illustrated in Figure 10, reflects the cumulative impact of targeted interventions implemented over the years. Since 2000, the enforcement of the “Special Campaign for River Pollution Source Management” and the “Four Cleanups” initiative has effectively curtailed pollution across the Yellow River basin [15]. In addition to these broader initiatives, specific steps have been taken in the Huayuankou section and other key monitoring stations to control pollution. For instance, local governments have implemented enhanced regulations, such as stricter controls on discharge outlets and management of non-point source pollution. These efforts have been particularly rigorous in zones with higher pollution levels, leading to substantial improvements in water quality. The Huayuankou section, for example, saw targeted measures like increased monitoring, localized clean-up campaigns, and advanced wastewater treatment installations, which have been instrumental in reducing pollutant concentrations to meet national water quality standards. These extra steps, especially in critical zones, have contributed significantly to the overall success of pollution control in the Yellow River basin. Notably, the introduction of the “Water Pollution Prevention and Control Action Plan” in 2015 led to stricter regulations on industrial discharge and significant enhancements in urban wastewater treatment facilities.
Given the complex hydrological conditions in the Huayuankou section, these measures were enforced with particular rigor. Local governments undertook additional efforts to manage pollution sources, including strengthening the regulation of discharge outlets and increasing both internal and non-point source pollution control. The successful implementation of these measures, combined with heightened public awareness, has resulted in sustained improvements even in areas previously classified as poor water quality zones. Between 2000 and 2018, the chemical oxygen demand (COD) concentration at this section decreased from 42.2 mg/L to 12.76 mg/L, while ammonia nitrogen (NH3-N) levels dropped from 1.50 mg/L to 0.15 mg/L. These data clearly demonstrate the significant impact of the implemented remediation measures.
Monthly data from 2009 to 2018 reveal significant seasonal variations, particularly in COD and NH3-N levels, with higher pollutant concentrations during the dry season due to hydrological conditions [46]. The warming and drying trends have reduced water flow, thereby concentrating pollutants and exacerbating water quality issues during low-flow periods. The post-2012 stabilization of COD levels suggests effective pollution control and improved wastewater treatment. Long-term trends from 1992 to 2022 highlight a substantial reduction in pollutant concentrations. The early 2000s experienced the highest pollutant levels due to industrial and agricultural pressures but sustained environmental efforts have led to a marked improvement. The overall improvement in water quality in the Huayuankou section can be attributed to enhanced wastewater treatment, stringent regulatory policies, targeted interventions in pollution hotspots, and effective hydrological management. Despite these successes, challenges remain, such as the presence of centralized return water and sewage in agricultural irrigation, which complicates water quality management [43]. Continuous monitoring and adaptive management are essential to sustain these gains and address emerging issues. Further analysis of pollutant levels in conjunction with hydrological data will provide deeper insights into the effectiveness of various interventions and is critical for refining future management strategies to ensure the long-term sustainability of water resources in the Yellow River basin.

5. Conclusions

The Yellow River basin has experienced significant changes in water quality over the past four decades. Initially, water quality was good, but industrialization, agricultural intensification, and urban expansion in the 1980s and 1990s led to severe pollution. Key pollutants, including COD, NH3-N, and CODMn, reached critical levels, resulting in widespread environmental degradation. Since 2000, effective pollution control measures and stringent regulations have significantly improved water quality. Enhanced water resource management and investments in wastewater treatment have led to notable improvements. Currently, COD levels meet Class I standards, while NH3-N and CODMn align with Class II standards according to national criteria.
Since 2000, stringent regulatory measures and enhanced water resource management have led to significant improvements across the basin. By 2022, COD levels in the mainstream met Class I standards, with average concentrations dropping by 63.1% from 34.8 mg/L in 2000 to 12.81 mg/L in 2018. NH3-N concentrations also saw a drastic reduction of 86.61%, from an average of 2.96 mg/L in 2000 to 0.40 mg/L in 2018. These improvements underscore the effectiveness of the pollution control initiatives implemented over the past two decades.
However, improvements are not uniform across the basin. The mainstream of the Yellow River exhibits relatively good water quality, but many tributaries continue to suffer from severe pollution, with some classified as Class V. For instance, in 2022, 85% of the water in tributaries was classified as Class I to III, 12.3% as Class IV, and only 2.7% as Class V. In contrast, the mainstream demonstrated much better quality, with all water classified as Class I–III and notably, 86% reaching Class II and 14% reaching Class I. Nevertheless, the Huayuankou section, a critical monitoring point, has shown a marked decline in key pollution indicators over the past three decades, reflecting the positive impact of sustained pollution control measures. Seasonal and daily variations in water quality parameters like COD, NH3-N, and CODMn often correlate with flow rates and temperature changes.
The Huayuankou section, a critical monitoring point, reflects these broader trends with a significant decline in key pollution indicators over the past three decades. The average COD concentration at Huayuankou dropped from 42.2 mg/L in 2000 to 12.76 mg/L in 2018, while NH3-N levels reduced from 1.50 mg/L to 0.15 mg/L over the same period.
These findings emphasize the need for continuous and adaptive management strategies to sustain and further improve water quality in the Yellow River basin. While significant progress has been made, persistent pollution in several tributaries highlights the necessity for ongoing efforts and targeted actions. Enhanced regulatory frameworks, improved wastewater treatment technologies, and robust community engagement are essential to address these challenges. Localized strategies tailored to specific conditions within the basin can enhance the effectiveness of pollution control measures. Continuous research, monitoring, and adaptive management are crucial to ensure the long-term sustainability of the Yellow River basin’s water environment, safeguarding it for future generations.

Supplementary Materials

The following supporting information can be downloaded at: https://www.mdpi.com/article/10.3390/w16172413/s1, Table S1. Environmental quality standard for surface water. Table S2. Test Result. Table S3. Testing Items, Methods, Instruments, and Detection Limits.

Author Contributions

Conceptualization, Z.Y., X.S. and L.Y.; methodology and visualization, Z.Y., X.S. and S.Y.; investigation, Z.Y., X.S. and Y.L.; writing—original draft preparation, Z.Y., X.S. and H.J.; writing—review and editing, L.Y. and S.Y. All authors have read and agreed to the published version of the manuscript.

Funding

This work was supported by the Outstanding Young Talents Science and Technology Foundation of Yellow River Conservancy Commission (Grant No. HQK-202320), the National Key Research and Development Program of China (Grant No. 2023YFC3206202), the Major Science and Technology Special Fund of Henan Province (Grant No. 201300311400), the Special Scientific Research Project of Yellow River Water Resources Protection Institute (Grant No. KYY- KYZX-2022-01), and the National Natural Science Foundation of China (Grant No. 51709126).

Data Availability Statement

The data presented in this study are available on request from the corresponding author. The data are not publicly available due to requirements of relevant regulatory agencies.

Conflicts of Interest

The authors declare no conflicts of interest.

References

  1. Xia, J.; Jiang, Q.; Deng, S.; Zhou, M.; Cheng, Y.; Li, Z.; Wang, Z. Morphological characteristics and evolution processes of sharp bends in the Lower Yellow River. Catena 2022, 210, 105936. [Google Scholar] [CrossRef]
  2. Chen, Y.P.; Fu, B.J.; Zhao, Y.; Wang, K.B.; Zhao, M.M.; Ma, J.F.; Wu, J.H.; Xu, C.; Liu, W.G.; Wang, H. Sustainable development in the Yellow River Basin: Issues and strategies. J. Clean. Prod. 2020, 263, 121223. [Google Scholar] [CrossRef]
  3. Yin, L.; Feng, X.; Fu, B.; Wang, S.; Wang, X.; Chen, Y.; Tao, F.; Hu, J. A coupled human-natural system analysis of water yield in the Yellow River basin, China. Sci. Total Environ. 2021, 762, 143141. [Google Scholar] [CrossRef]
  4. Wang, G.; Zhang, J.; Jin, J.; Weinberg, J.; Bao, Z.; Liu, C.; Liu, Y.; Yan, X.; Song, X.; Zhai, R. Impacts of climate change on water resources in the Yellow River basin and identification of global adaptation strategies. Mitig. Adapt. Strateg. Glob. Change 2017, 22, 67–83. [Google Scholar] [CrossRef]
  5. Feng, Y.; Zhu, A. Spatiotemporal differentiation and driving patterns of water utilization intensity in Yellow River Basin of China: Comprehensive perspective on the water quantity and quality. J. Clean. Prod. 2022, 369, 133395. [Google Scholar] [CrossRef]
  6. Chang, J.; Li, Y.; Yuan, M.; Wang, Y. Efficiency evaluation of hydropower station operation: A case study of Longyangxia station in the Yellow River, China. Energy 2017, 135, 23–31. [Google Scholar] [CrossRef]
  7. Si, Y.; Li, X.; Yin, D.; Liu, R.; Wei, J.; Huang, Y.; Li, T.; Liu, J.; Gu, S.; Wang, G.; et al. Evaluating and optimizing the operation of the hydropower system in the Upper Yellow River: A general LINGO-based integrated framework. PLoS ONE 2018, 13, e0191483. [Google Scholar] [CrossRef] [PubMed]
  8. Zhang, W.; Liang, W.; Gao, X.; Li, J.; Zhao, X. Trajectory in water scarcity and potential water savings benefits in the Yellow River basin. J. Hydrol. 2024, 633, 130998. [Google Scholar] [CrossRef]
  9. Zhang, Y.; Zhao, Z.; Fu, B.; Ma, R.; Yang, Y.; Lü, Y.; Wu, X. Identifying ecological security patterns based on the supply, demand and sensitivity of ecosystem service: A case study in the Yellow River Basin, China. J. Environ. Manag. 2022, 315, 115158. [Google Scholar] [CrossRef]
  10. Yu, S.-Y.; Li, W.-J.; Zhou, L.; Yu, X.; Zhang, Q.; Shen, Z. Human Disturbances Dominated the Unprecedentedly High Frequency of Yellow River Flood over the Last Millennium. Sci. Adv. 2023, 9, eadf8576. [Google Scholar] [CrossRef]
  11. Quan, J.; Xu, Y.; Ma, T.; Wilson, J.P.; Zhao, N.; Ni, Y. Improving surface water quality of the Yellow River Basin due to anthropogenic changes. Sci. Total Environ. 2022, 836, 155607. [Google Scholar] [CrossRef] [PubMed]
  12. Jiang, L.; Zuo, Q.; Ma, J.; Zhang, Z. Evaluation and prediction of the level of high-quality development: A case study of the Yellow River Basin, China. Ecol. Indic. 2021, 129, 107994. [Google Scholar] [CrossRef]
  13. Zhang, M.; Wang, X.; Liu, C.; Lu, J.; Qin, Y.; Mo, Y.; Xiao, P.; Liu, Y. Identification of the heavy metal pollution sources in the rhizosphere soil of farmland irrigated by the Yellow River using PMF analysis combined with multiple analysis methods—Using Zhongwei city, Ningxia, as an example. Environ. Sci. Pollut. Res. 2020, 27, 16203–16214. [Google Scholar] [CrossRef] [PubMed]
  14. Wu, N.; Liu, S.M.; Zhang, G.L.; Zhang, H.M. Anthropogenic impacts on nutrient variability in the lower Yellow River. Sci. Total Environ. 2021, 755, 142488. [Google Scholar] [CrossRef]
  15. Ministry of Ecology and Environment of People’s Republic of China, Action Plan for Prevention and Control of Water Pollution. Available online: https://english.mee.gov.cn/News_service/news_release/201504/t20150427_299595.shtml#:~:text=The%20action%20plan%20proposed%20that,level%2C%20the%20overexploitation%20of%20groundwater (accessed on 5 June 2024).
  16. Zhou, Y.; Ma, J.; Zhang, Y.; Qin, B.; Jeppesen, E.; Shi, K.; Brookes, J.D.; Spencer, R.G.M.; Zhu, G.; Gao, G. Improving water quality in China: Environmental investment pays dividends. Water Res. 2017, 118, 152–159. [Google Scholar] [CrossRef]
  17. Liu, S.; Qiu, Y.; Fu, R.; Liu, Y.; Suo, C. Identifying the water quality variation characteristics and their main driving factors from 2008 to 2020 in the Yellow River Basin, China. Environ. Sci. Pollut. Res. 2023, 30, 66753–66766. [Google Scholar] [CrossRef]
  18. Sun, X.; Zhou, Z.; Wang, Y. Water resource carrying capacity and obstacle factors in the Yellow River basin based on the RBF neural network model. Environ. Sci. Pollut. Res. 2023, 30, 22743–22759. [Google Scholar] [CrossRef]
  19. Liu, T.; Wang, F.; Michalski, G.; Xia, X.; Liu, S. Using 15N, 17O, and 18O to determine nitrate sources in the Yellow River, China. Environ. Sci. Technol. 2013, 47, 13412–13421. [Google Scholar] [CrossRef]
  20. Li, B.; Feng, Q.; Wang, X.; Li, Z.; Wang, F.; Zhao, C.; Yu, T.; Chen, W. Formation of the upper reaches of the Yellow River: Provenance evidence from the strata of the Yellow River sedimentary basin. Glob. Planet. Change 2023, 229, 104224. [Google Scholar] [CrossRef]
  21. Wu, Z.; Tian, G.; Xia, Q.; Hu, H.; Li, J. Connotation, calculation and influencing factors of the water-use rights benchmark price: A case study of agricultural water use in the Ningxia Yellow River irrigation area. Agric. Water Manag. 2023, 283, 108300. [Google Scholar] [CrossRef]
  22. Xu, Z.; Liu, M.; Guan, G.; Guo, X. Emergency intervention modes for ice jam events in large-scale water diversion projects. Hydrol. Res. 2023, 54, 1134–1151. [Google Scholar] [CrossRef]
  23. Wu, X.; Wei, Y.; Fu, B.; Wang, S.; Zhao, Y.; Moran, E.F. Evolution and Effects of the Social-Ecological System over a Millennium in China’s Loess Plateau. 2020. Available online: https://www.science.org/doi/full/10.1126/sciadv.abc0276 (accessed on 8 June 2024).
  24. Pan, B.; Hu, Z.; Wang, J.; Vandenberghe, J.; Hu, X.; Wen, Y.; Li, Q.; Cao, B. The approximate age of the planation surface and the incision of the Yellow River. Palaeogeogr. Palaeoclimatol. Palaeoecol. 2012, 356–357, 54–61. [Google Scholar] [CrossRef]
  25. Kong, D.; Miao, C.; Li, J.; Zheng, H. Full-stream erosion in the lower Yellow River: Feasibility, sustainability and opportunity. Sci. Total Environ. 2022, 807, 150810. [Google Scholar] [CrossRef]
  26. Zhou, Y.; Huang, H.Q.; Ran, L.; Shi, C.; Su, T. Hydrological controls on the evolution of the Yellow River Delta: An evaluation of the relationship since the Xiaolangdi Reservoir became fully operational. Hydrol. Process. 2018, 32, 3633–3649. [Google Scholar] [CrossRef]
  27. He, H.; Yu, Q.; Zhou, J.; Tian, Y.Q.; Chen, R.F. Modelling complex flood flow evolution in the middle Yellow River basin, China. J. Hydrol. 2008, 353, 76–92. [Google Scholar] [CrossRef]
  28. Gippel, C.; Jiang, X.; Zhang, D.; Cooling, M.; Kerr, G.; Close, P.; Jin, S.; Li, L.; Wang, Z.; Ma, Z.; et al. Environmental Flows Assessment for the Lower Yellow River. 2012. Available online: www.watercentre.org (accessed on 15 May 2024).
  29. Liu, W.; Shi, C.; Zhou, Y. Trends and attribution of runoff changes in the upper and middle reaches of the Yellow River in China. J. Hydro-Environ. Res. 2021, 37, 57–66. [Google Scholar] [CrossRef]
  30. Galler, J.J. Medium-and Long-Term Changes in Fluvial Discharge to the Sea: Medium-and Long-Term Changes in Fluvial Discharge to the Sea: The Yellow River Case Study the Yellow River Case Study. Master’s Thesis, William & Mary, Williamsburg, VA, USA, 1999. [Google Scholar] [CrossRef]
  31. Dai, Y.; Lu, F.; Ruan, B.; Song, X.; Du, Y.; Xu, Y. Decomposition of contribution to runoff changes and spatial differences of major tributaries in the middle reaches of the Yellow River based on the Budyko framework. Hydrol. Res. 2023, 54, 435–450. [Google Scholar] [CrossRef]
  32. Zhao, M.M.; Wang, S.M.; Chen, Y.P.; Wu, J.H.; Xue, L.G.; Fan, T.T. Pollution status of the Yellow River tributaries in middle and lower reaches. Sci. Total Environ. 2020, 722, 137861. [Google Scholar] [CrossRef]
  33. Wang, Z.C.; Zhang, S.X.; Mao, H.T.; Shen, J.W.; Guo, W.D. Analysis of Water and Sediment Characteristics of the Yellow River and Their Correlations. Pol. J. Environ. Stud. 2023, 32, 2909–2923. [Google Scholar] [CrossRef]
  34. Jin, F.; Yang, W.; Fu, J.; Li, Z. Effects of vegetation and climate on the changes of soil erosion in the Loess Plateau of China. Sci. Total Environ. 2021, 773, 145514. [Google Scholar] [CrossRef]
  35. Zhang, Y.; Chao, Y.; Fan, R.; Ren, F.; Qi, B.; Ji, K.; Xu, B. Spatial-temporal trends of rainfall erosivity and its implication for sustainable agriculture in the Wei River Basin of China. Agric. Water Manag. 2021, 245, 106557. [Google Scholar] [CrossRef]
  36. Storozum, M.J.; Mo, D.; Wang, H.; Ren, X.; Zhang, Y.; Kidder, T.R. Anthropogenic origins of a late Holocene, basin-wide unconformity in the middle reaches of the Yellow River, the Luoyang Basin, Henan Province, China. Quat. Res. 2017, 87, 423–441. [Google Scholar] [CrossRef]
  37. Lv, W.; Yang, H. Distribution of Phosphorus and Iron Species in the Sediments along the Path of Yellow River and Correlation of Contents of the Two Species. Source: J. Coast. Res. 2020, 104, 813–817. [Google Scholar] [CrossRef]
  38. van Maren, D.S.; Yang, M.; Wang, Z.B. Predicting the Morphodynamic Response of Silt-Laden Rivers to Water and Sediment Release from Reservoirs: Lower Yellow River, China. J. Hydraul. Eng. 2011, 137, 90–99. [Google Scholar] [CrossRef]
  39. Zhang, M.; Ping, J.; Mei, X.; Leng, W.; Li, H.; Zhao, J.; Liu, J. The trend of groundwater recharge in the secondary perched reaches of the Yellow River in the past 50 years. Front. Environ. Sci. 2023, 11, 1310181. [Google Scholar] [CrossRef]
  40. China National Environmental Monitoring Centre, National Surface Water Quality Automatic Monitoring Real-Time Database. Available online: https://szzdjc.cnemc.cn:8070/GJZ/Business/Publish/Main.html (accessed on 1 April 2024).
  41. GB 3838-2002; Environmental Quality Standards for Surface Water. Ministry of Ecology and Environment of People’s Republic of China: Beijing, China, 2002.
  42. Xu, Y.; Liu, S.; Wang, J. Impact of environmental regulation intensity on green innovation efficiency in the Yellow River Basin, China. J. Clean. Prod. 2022, 373, 133789. [Google Scholar] [CrossRef]
  43. Lu, C.; Ji, W.; Hou, M.; Ma, T.; Mao, J. Evaluation of efficiency and resilience of agricultural water resources system in the Yellow River Basin, China. Agric. Water Manag. 2022, 266, 107605. [Google Scholar] [CrossRef]
  44. Yu, J. Coordinated development of urban economy and total amount control of water environmental pollutants in the Yellow River basin. Arab. J. Geosci. 2021, 14, 658. [Google Scholar] [CrossRef]
  45. Du, H.; Ji, X.; Chuai, X. Spatial Differentiation and Influencing Factors of Water Pollution-Intensive Industries in the Yellow River Basin, China. Int. J. Environ. Res. Public Health 2022, 19, 497. [Google Scholar] [CrossRef]
  46. Liu, X.; Sheng, Y.; Liu, Q.; Li, Z. Suspended particulate matter affects the distribution and migration of heavy metals in the Yellow River. Sci. Total Environ. 2024, 912, 169537. [Google Scholar] [CrossRef]
Figure 1. Characteristics of the Yellow River basin.
Water 16 02413 g001
Figure 2. Water usage, wastewater discharge, and pollutant emissions in the Yellow River basin during 1980–2015. Water usage is plotted on left y axis; COD and NH3-N are plotted on right y axis.
Water 16 02413 g002
Figure 3. Changes in overall water quality in the Yellow River basin from 1980 to 2020.
Water 16 02413 g003
Figure 4. Changes in overall water quality in the Yellow River basin from 2001 to 2022.
Water 16 02413 g004
Figure 5. Changes in overall water quality in the Yellow River mainstream from 2011 to 2022.
Water 16 02413 g005
Figure 6. Classification of water quality in the Yellow River mainstream from 2018 to 2022.
Water 16 02413 g006
Figure 7. Changes in pollutant concentrations at the measured sites of the Yellow River mainstream in 2000 and 2018 with trendlines. (a) COD concentrations and (b) NH3-N concentrations.
Water 16 02413 g007
Figure 8. Changes in overall water quality in the Yellow River tributaries from 2011 to 2022.
Water 16 02413 g008
Figure 9. Changes in COD (a) and NH3-N (b) concentrations at the measured sites of the Yellow River tributaries.
Water 16 02413 g009
Figure 10. Time-dependent variation in primary pollutants’ concentrations daily, monthly and yearly. Daily changes in concentrations and corresponding flow rates in the Huayuankou section for (a1) COD, (b1) NH3-N, and (c1) CODMn along with their respective monthly (a2,b2,c2) and annual fluctuations (a3,b3,c3).
Water 16 02413 g010
Disclaimer/Publisher’s Note: The statements, opinions and data contained in all publications are solely those of the individual author(s) and contributor(s) and not of MDPI and/or the editor(s). MDPI and/or the editor(s) disclaim responsibility for any injury to people or property resulting from any ideas, methods, instructions or products referred to in the content.

