Article

Numerical Modeling of Hydrological Mechanisms and Instability for Multi-Layered Slopes

1
School of Civil Engineering, Sichuan Agricultural University, Chengdu 611830, China
2
Sichuan Higher Education Engineering Research Center for Disaster Prevention and Mitigation of Village Construction, Sichuan Agricultural University, Chengdu 611830, China
*
Author to whom correspondence should be addressed.
These authors contributed equally to this work.
Water 2024, 16(17), 2422; https://doi.org/10.3390/w16172422
Submission received: 12 August 2024 / Revised: 24 August 2024 / Accepted: 25 August 2024 / Published: 27 August 2024

Abstract

:
The process of rainwater infiltration into unsaturated multi-layered slopes is complex, making it extremely difficult to accurately predict slope behaviors. The hydrological mechanisms in multi-layered slopes could be significantly influenced by the varying hydraulic characteristics of different soils, thus influencing slope stability. A numerical model based on Hydrus 2D was constructed to investigate the hydrological mechanisms of multi-layered slopes under different slope inclinations and rainfall intensities. The results revealed hydraulic processes in response to rainfall in unsaturated multi-layered slopes, in which layered soils retard the advance of wetting fronts and affect seepage paths in the slope. The results also showed the characteristics of hydraulic parameters, including pore water pressure and moisture content, under different conditions, and explained the crucial factors at play in maintaining slope stability.

1. Introduction

Slope instability constitutes a serious threat of hazards to both lives and property throughout mountainous areas [1,2], particularly in regions with complex topographies and layered soil [3,4,5]. These natural disasters can be triggered by a multitude of variables [6,7,8], with rainfall being one of the most crucial [9,10,11]. Rainfall has triggered multiple volcanic and gravel landslides, covering large areas around Naples city and causing 160 deaths [12]. A rainfall-triggered landslide at the Izu Oshima volcano in Japan killed 35 people and caused extensive property damage [13]. Comprehending the hydrological response mechanisms of and stability changes in multi-layered slopes during rainfall is crucial for accurate forecasting prediction of shallow landslides and designation of mitigation measures to reduce the likelihood of catastrophic damage.
The soil characteristics on naturally formed slopes are usually spatially variable rather than homogeneous [14], influenced by rainfall, rock weathering, plant and animal activity, and other factors in the natural environment [15]. In certain instances, such as with air-fall pyroclastic deposits, strong vertical contrasts in texture occur because of the unique processes of formation, transport, and deposition, where coarser and finer materials frequently alternate within the stratigraphic layers [16]. In practice, these factors cause multiple layers of soil in the slope. Analyzing unsaturated slopes during seepage and their associated hydrological processes becomes more challenging due to the potential for localized water redistribution caused by the differing hydraulic properties of adjacent soil layers in heterogeneous and layered profiles [17,18,19,20]. Moreover, these contrasting properties can significantly affect soil suction, resulting in fluctuating stability conditions within the slope. In addition, these contrasting properties can substantially affect the local suction changes in the soil layers of the slopes, thus governing the stability of the slopes [21].
Several studies have investigated the impact of layered soil on the infiltration process in multi-layered slopes, as well as its role in potentially causing landslides [22,23,24,25]. Certain studies propose that in specific cases the presence of alternating layers of fine grains and coarse grains may result in the coarse layer acting as a capillary barrier, potentially impacting the moisture distribution [26,27,28]. The capillary barrier fails only when the water potential reaches a critical value [29,30], but this phenomenon is still complex in stratified soil profiles during rainfall infiltration, as it depends on the inclined angle and on the rainfall intensity [31,32]. Capillary barrier effects can cause water to accumulate at the soil layer interface, resulting in subsurface downslope flow [33,34]. The impact of this flow varies with rainfall intensity and duration and the hillslope shape. It can enhance slope drainage, improving stability, or cause moisture concentration, leading to local failure [15,35]. The pore water pressure and volumetric water content are important factors affecting the shear strength of unsaturated soils [36,37]. And the distribution of volumetric water content and pore water pressure by soil layered under different conditions (e.g., rainfall intensity and slope gradients) in multi-layered slopes is very different. The analysis of the stability of multi-layered slopes under rainfall is heterogeneous because capillary barriers may have a positive effect on slope stability by delaying the infiltration of rainwater to greater depths, or they may cause large localized accumulations of water that can affect localized instability.
Despite this, further research on how soil layered under rainfall affects the hydrological mechanisms of natural slopes is still lacking. Some researchers have found that an increase in inclination angles of the interface causes a more pronounced lateral distribution of moisture on slopes [21,38]. Other researchers have studied the infiltration and stability of three-layer slopes using numerical simulation methods, and the results found that the rainfall intensity is an important parameter affecting the stability of slopes, and the factor of safety of slopes decreases with the rainfall intensity [39,40]. However, many studies have focused on a single variable of inclined angle or rainfall intensity, and these studies do not adequately demonstrate the complexity of hydraulic mechanisms in multi-layered slopes. These limitations underscore the need for more comprehensive studies that account for the inclination angle of multi-layered slopes and the variable intensity of rainfall events. Despite advances in numerical modeling, significant gaps remain in our understanding of how these factors collectively influence slope stability.
This research aims to study hydrological mechanisms and slope instability in multi-layered slopes using HYDRUS. By investigating water content distribution and pore water pressure changes in slopes at different inclinations and different rainfall intensities, the results could explain how these factors affect slope stability. And they can provide some useful references for studying risk prevention for multi-layered slopes.

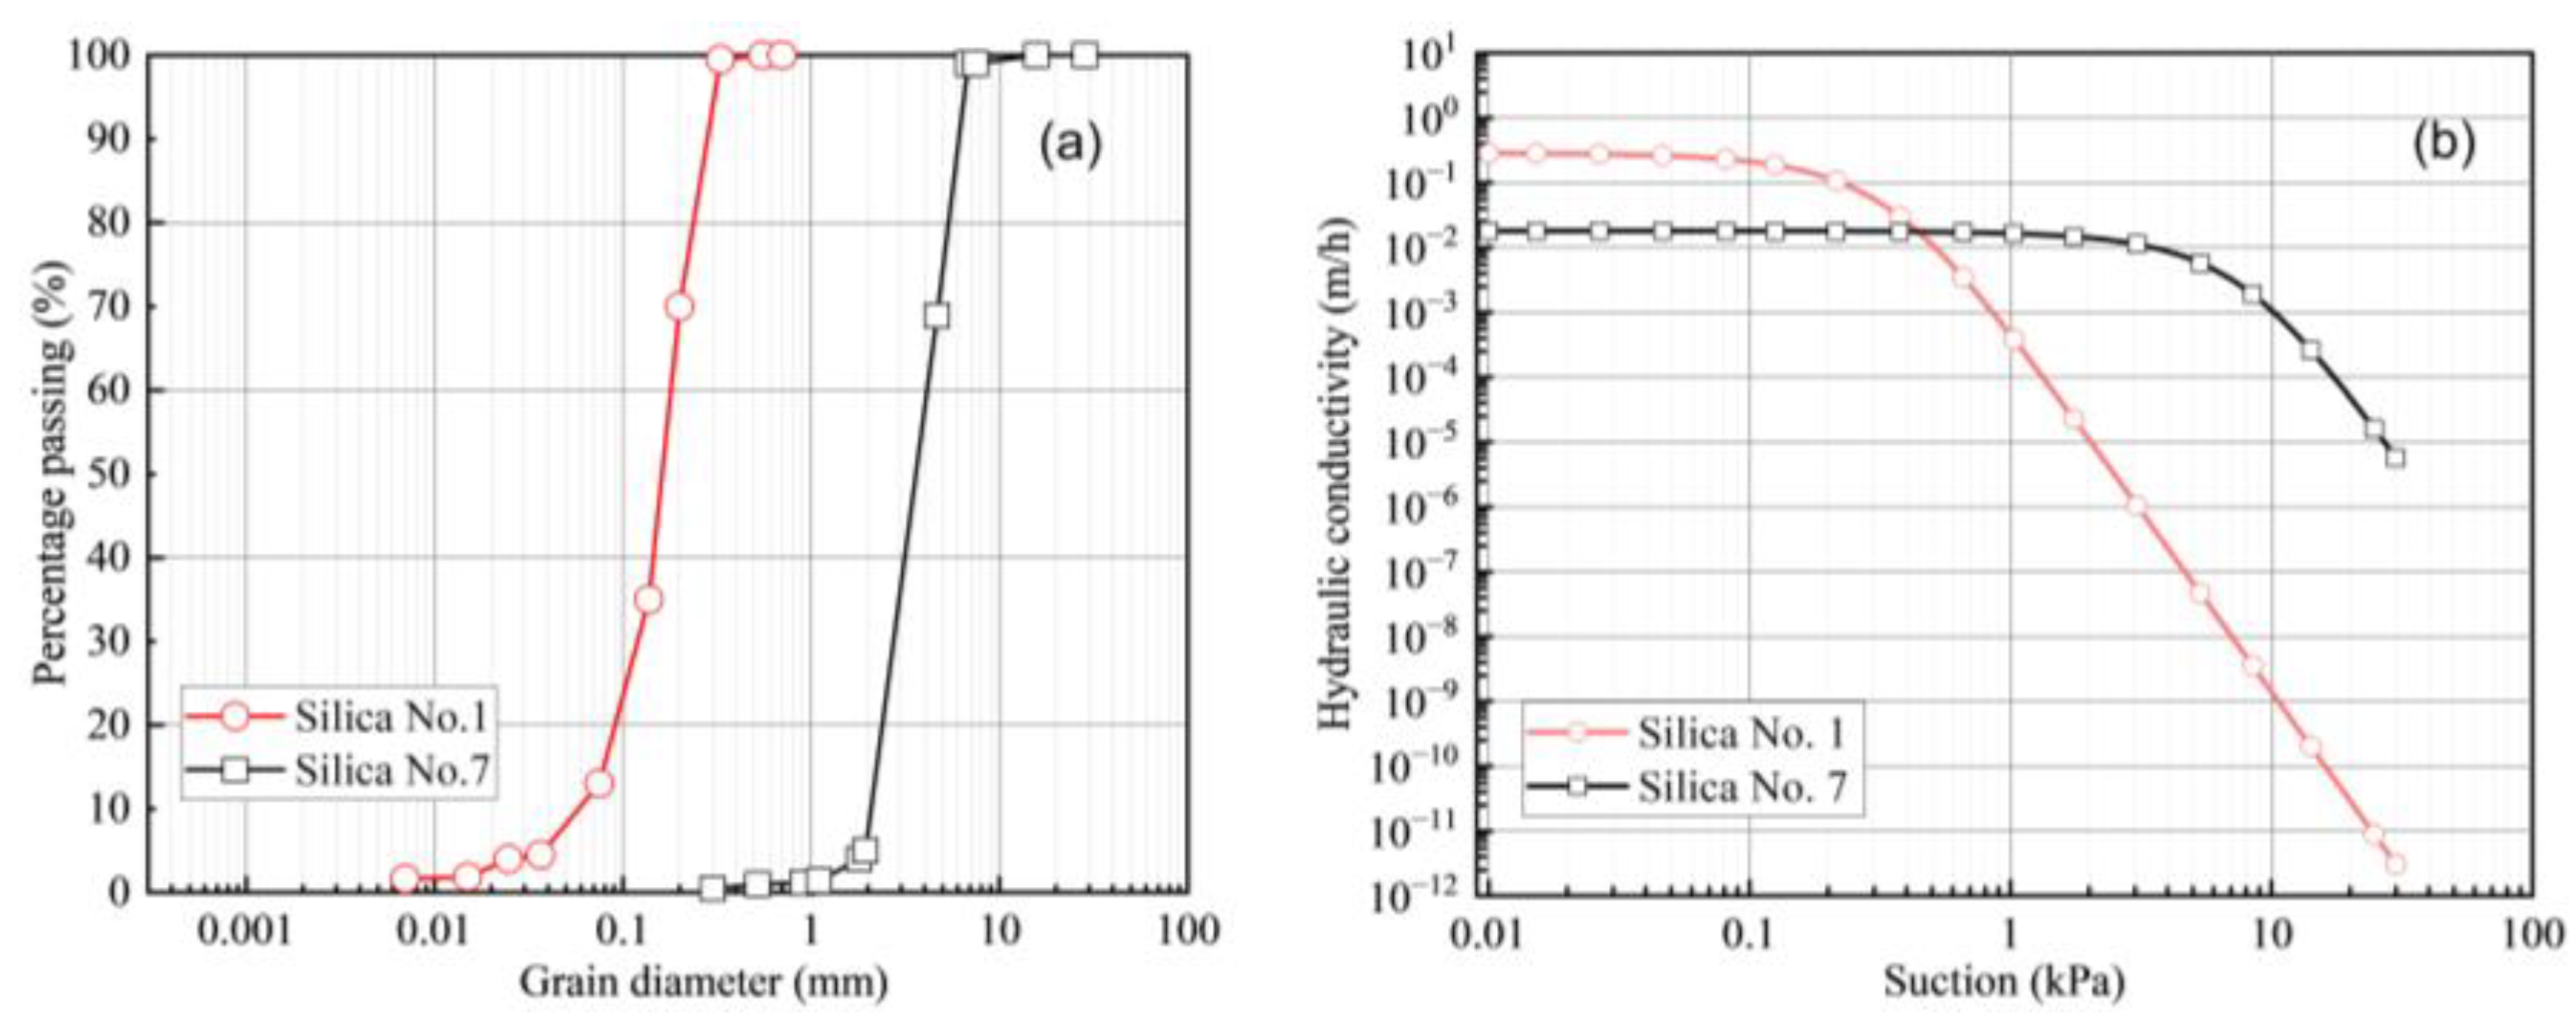
2. Material Properties

To investigate the hydrological mechanisms of multi-layered slopes during infiltration, a three-layer slope numerical model was created to be used under a variety of conditions. The dimensional design of the numerical model is based on previous physical experimental models [41]. The following section describes the main hydraulic and physical properties of the materials used for slope modeling.
This study involved a multi-layered slope model using two specific types of soil: Silica No. 7 (S7) and Silica No. 1 (S1). These soils were selected for their contrasting properties, which allowed for a detailed investigation of the interactions between different soil layers and their effects on slope stability. The hydraulic behavior under unsaturated conditions is expected to exhibit distinct characteristics, particularly regarding water retention capacity and unsaturated hydraulic conductivity. These differences are likely to significantly influence infiltration within a layered slope.
Table 1 provides an overview of the specific properties of S1 and S7 used in the numerical model. Sieve analyses were conducted in accordance with the JGS Geotechnical Society’s standard procedures. The unsaturated hydraulic characteristics were assessed using the variable head method. Figure 1a illustrates the grain size distribution of S1 and S7 in numerical model tests. Figure 1b illustrates the hydraulic conductivities of both fine and coarse soils within the slope.

3. Mathematical Modeling

3.1. The Numerical Simulation Model

The actual test conditions are simulated by setting the model domain, hydraulic model, initial boundary conditions, and grid nodes. In this study, a 45 cm × 70 cm soil slope with a slope angle of 45° and five observation points was set up within the slope. Observation points were used to record the changes in pore water pressure and volumetric water content at different positions in the slope (see Figure 2a). The modeled slopes consisted of two layers of 20 cm and one layer of 5 cm thick soil. An initial volumetric water content of 6% was used in all soil layers. The upper and lower layers represent finer and less permeable soils, while the middle layer represents coarser and more permeable soils. To gain a deeper understanding of the capillary barrier effect on the hydraulic mechanism, slopes at different inclinations were modeled. In this study, the mesh within the slope was refined to improve the reliability of the numerical simulation results. The global unit size is 1.1 cm, with a total of 3044 nodes and 5901 elements (see Figure 2b). The top of the soil slope is set as an atmospheric exchange boundary and the left side and bottom are set as impervious boundaries. Atmospheric boundaries can be used to model various rainfall intensities. The right side of the lower layer is set as a free drainage boundary, which helps to minimize the accumulation of large quantities of water at the bottom of the slope.

3.2. Simulation Parameter Setting

The hydraulic properties of the soil medium were assessed on the basis of experimental measurements and actual stratigraphic conditions. The hydraulic permeability coefficients assumed in the numerical model were obtained from experimental tests: coarse-grained soils K s = 2.8 × 10⁻² cm/s and fine-grained soils K s = 1.1 × 10⁻² cm/s. The soil parameters used for numerical simulation are shown in Table 2.

3.3. Hydraulic Model

The two-dimensional condition of unsaturated soils is the basis for the numerical simulations in this paper. Van Genuchthen–Mualem curves [42,43] were chosen to express the relation between the pressure head, moisture content, and relative hydraulic conductivity (as shown in Formulas (1)–(3)).
θ h = θ r + θ s θ r 1 + α h n m ,           for   h < 0 θ s ,                                                                 for   h 0
K h = K s S c l 1 1 S c 1 / m m 2
S c = θ θ r / θ s θ r
where θr and θs are the residual water content and saturated water content, respectively (cm3 × cm−3); the empirical parameters include α (cm−1), m, n, and l, with m = 1 − 1/n and l = 0.5 being appropriate for the majority of soils; and Ks denotes saturated hydraulic conductivities (cm × min−1).

3.4. Simulation Cases and Conditions

Test cases focused on different inclinations and rainfall intensities, which are the main factors that affect capillary barrier effects and slope instability. The general information is shown in Table 3.

4. Results and Analyses

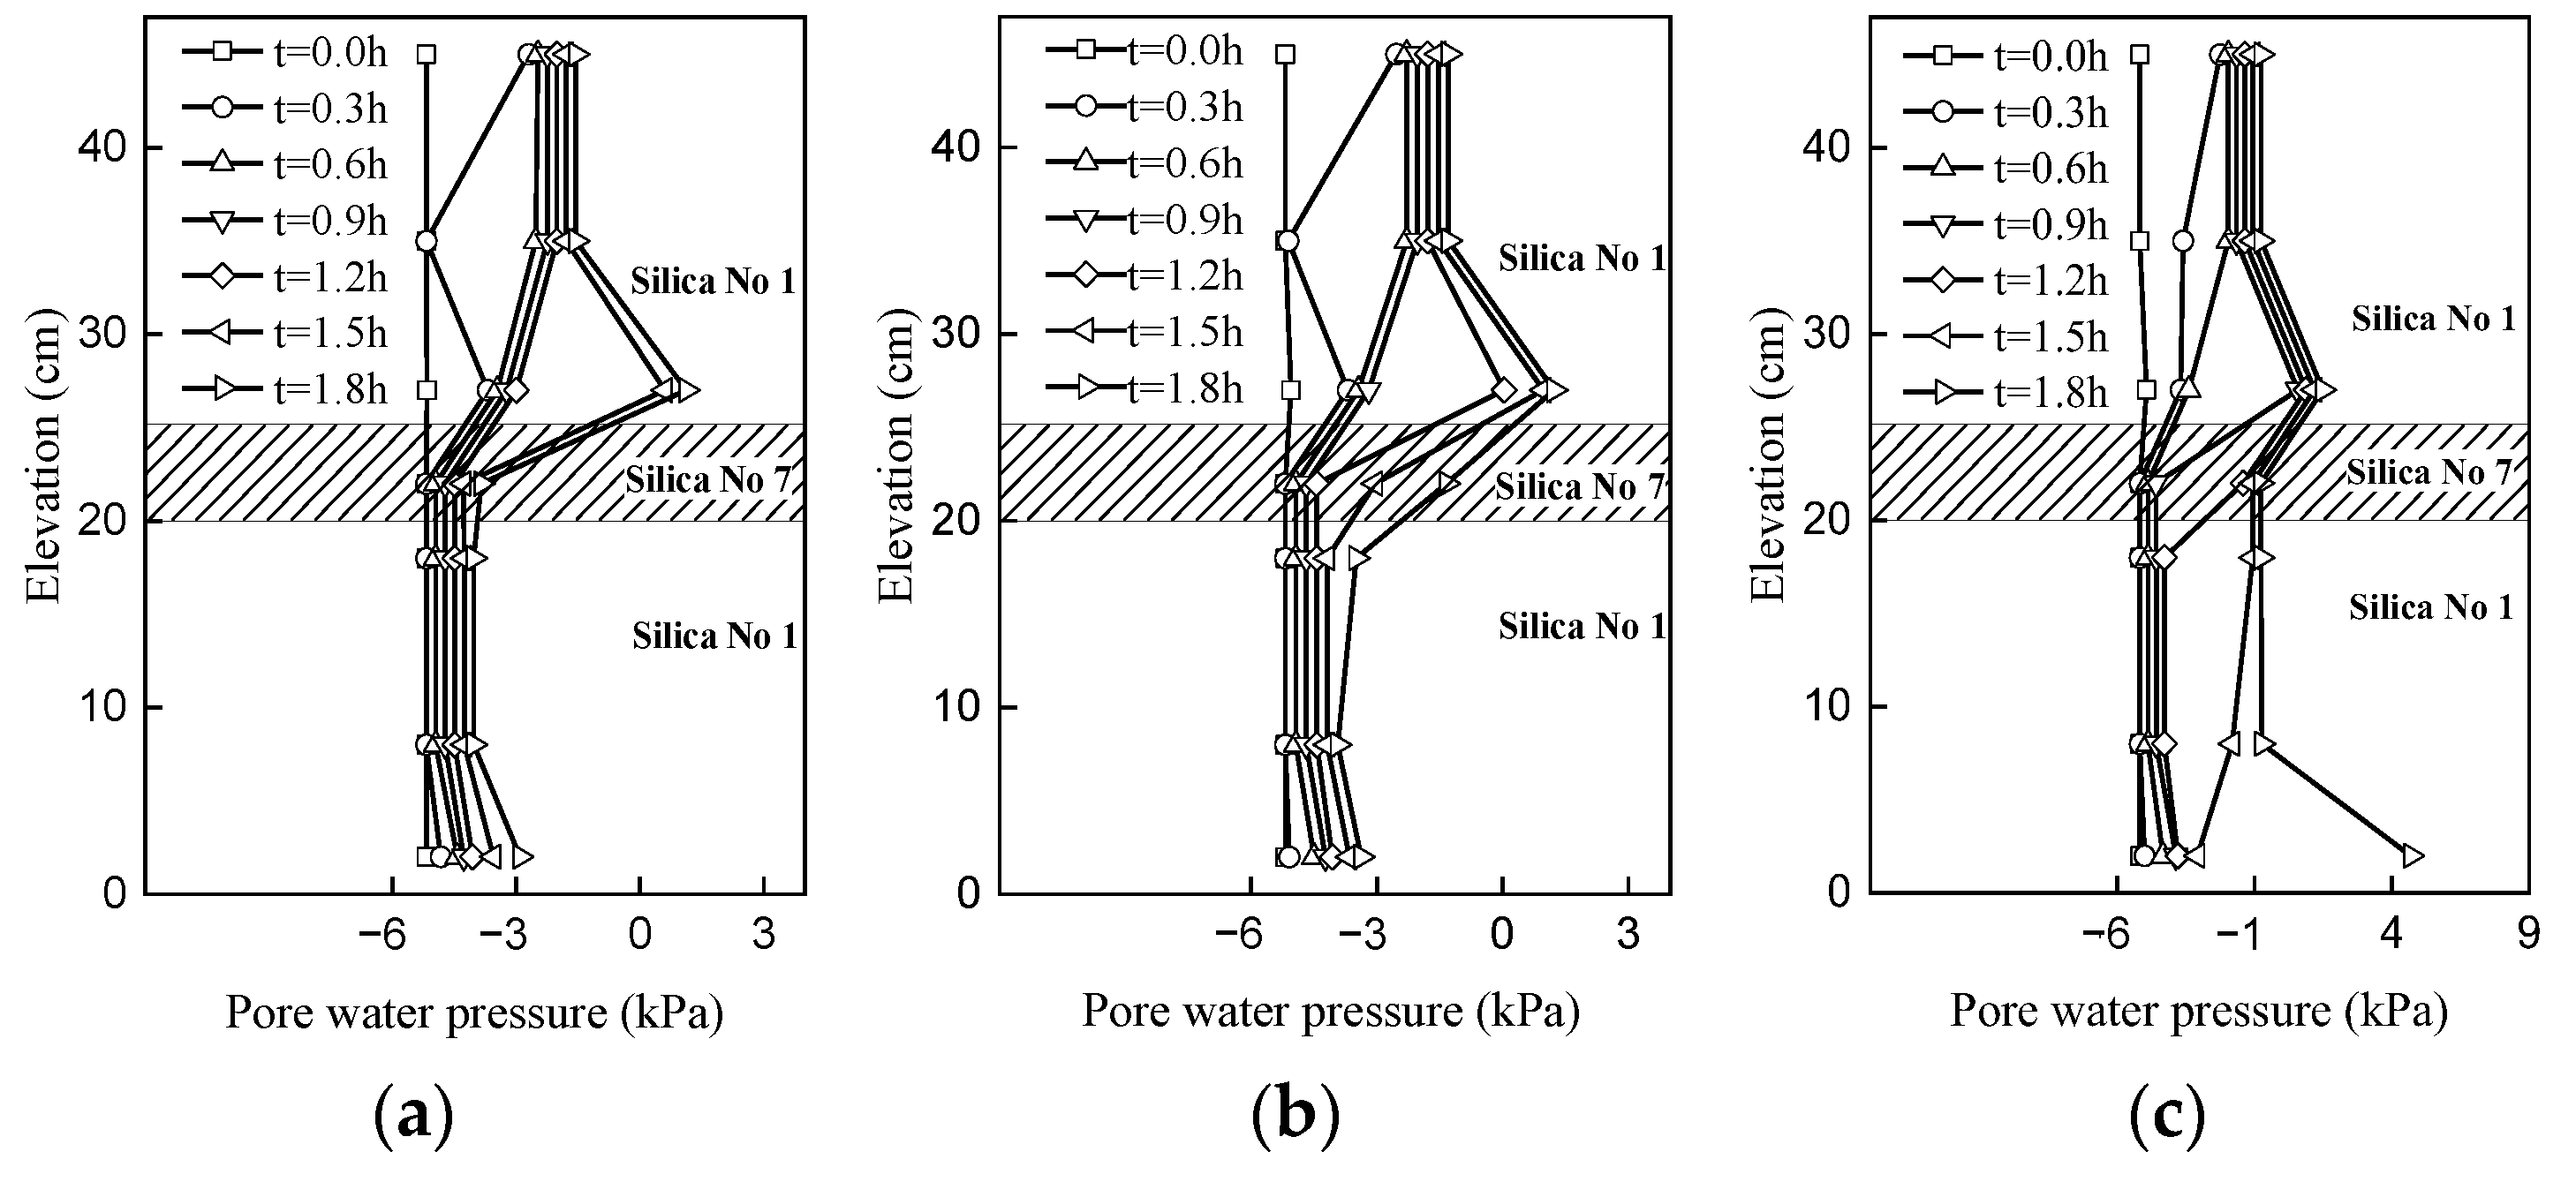
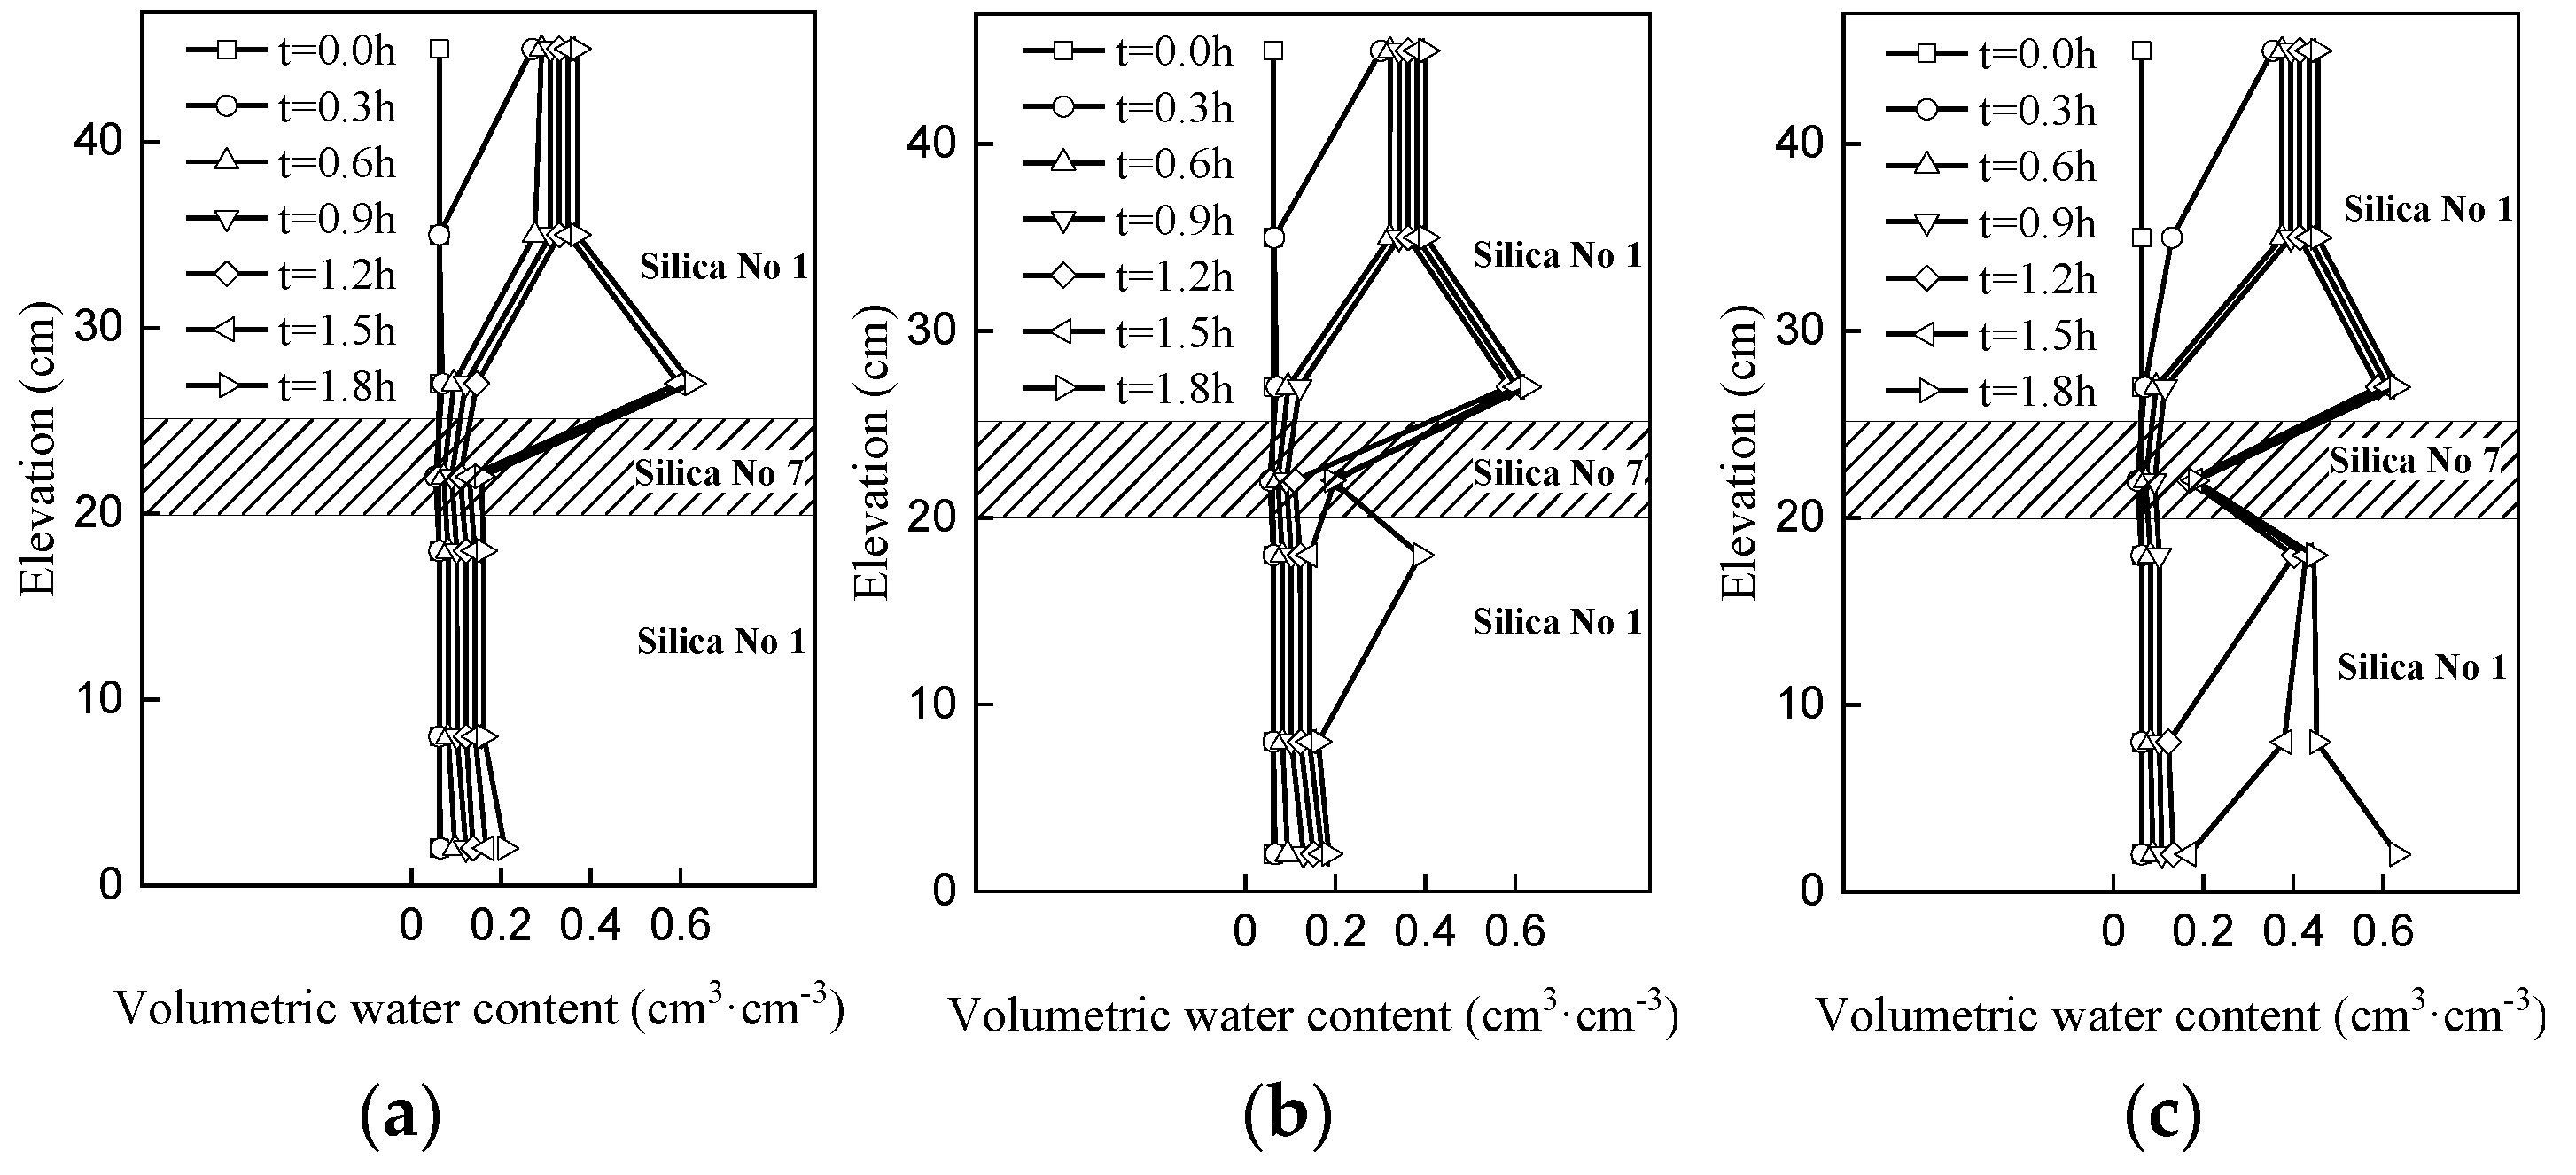
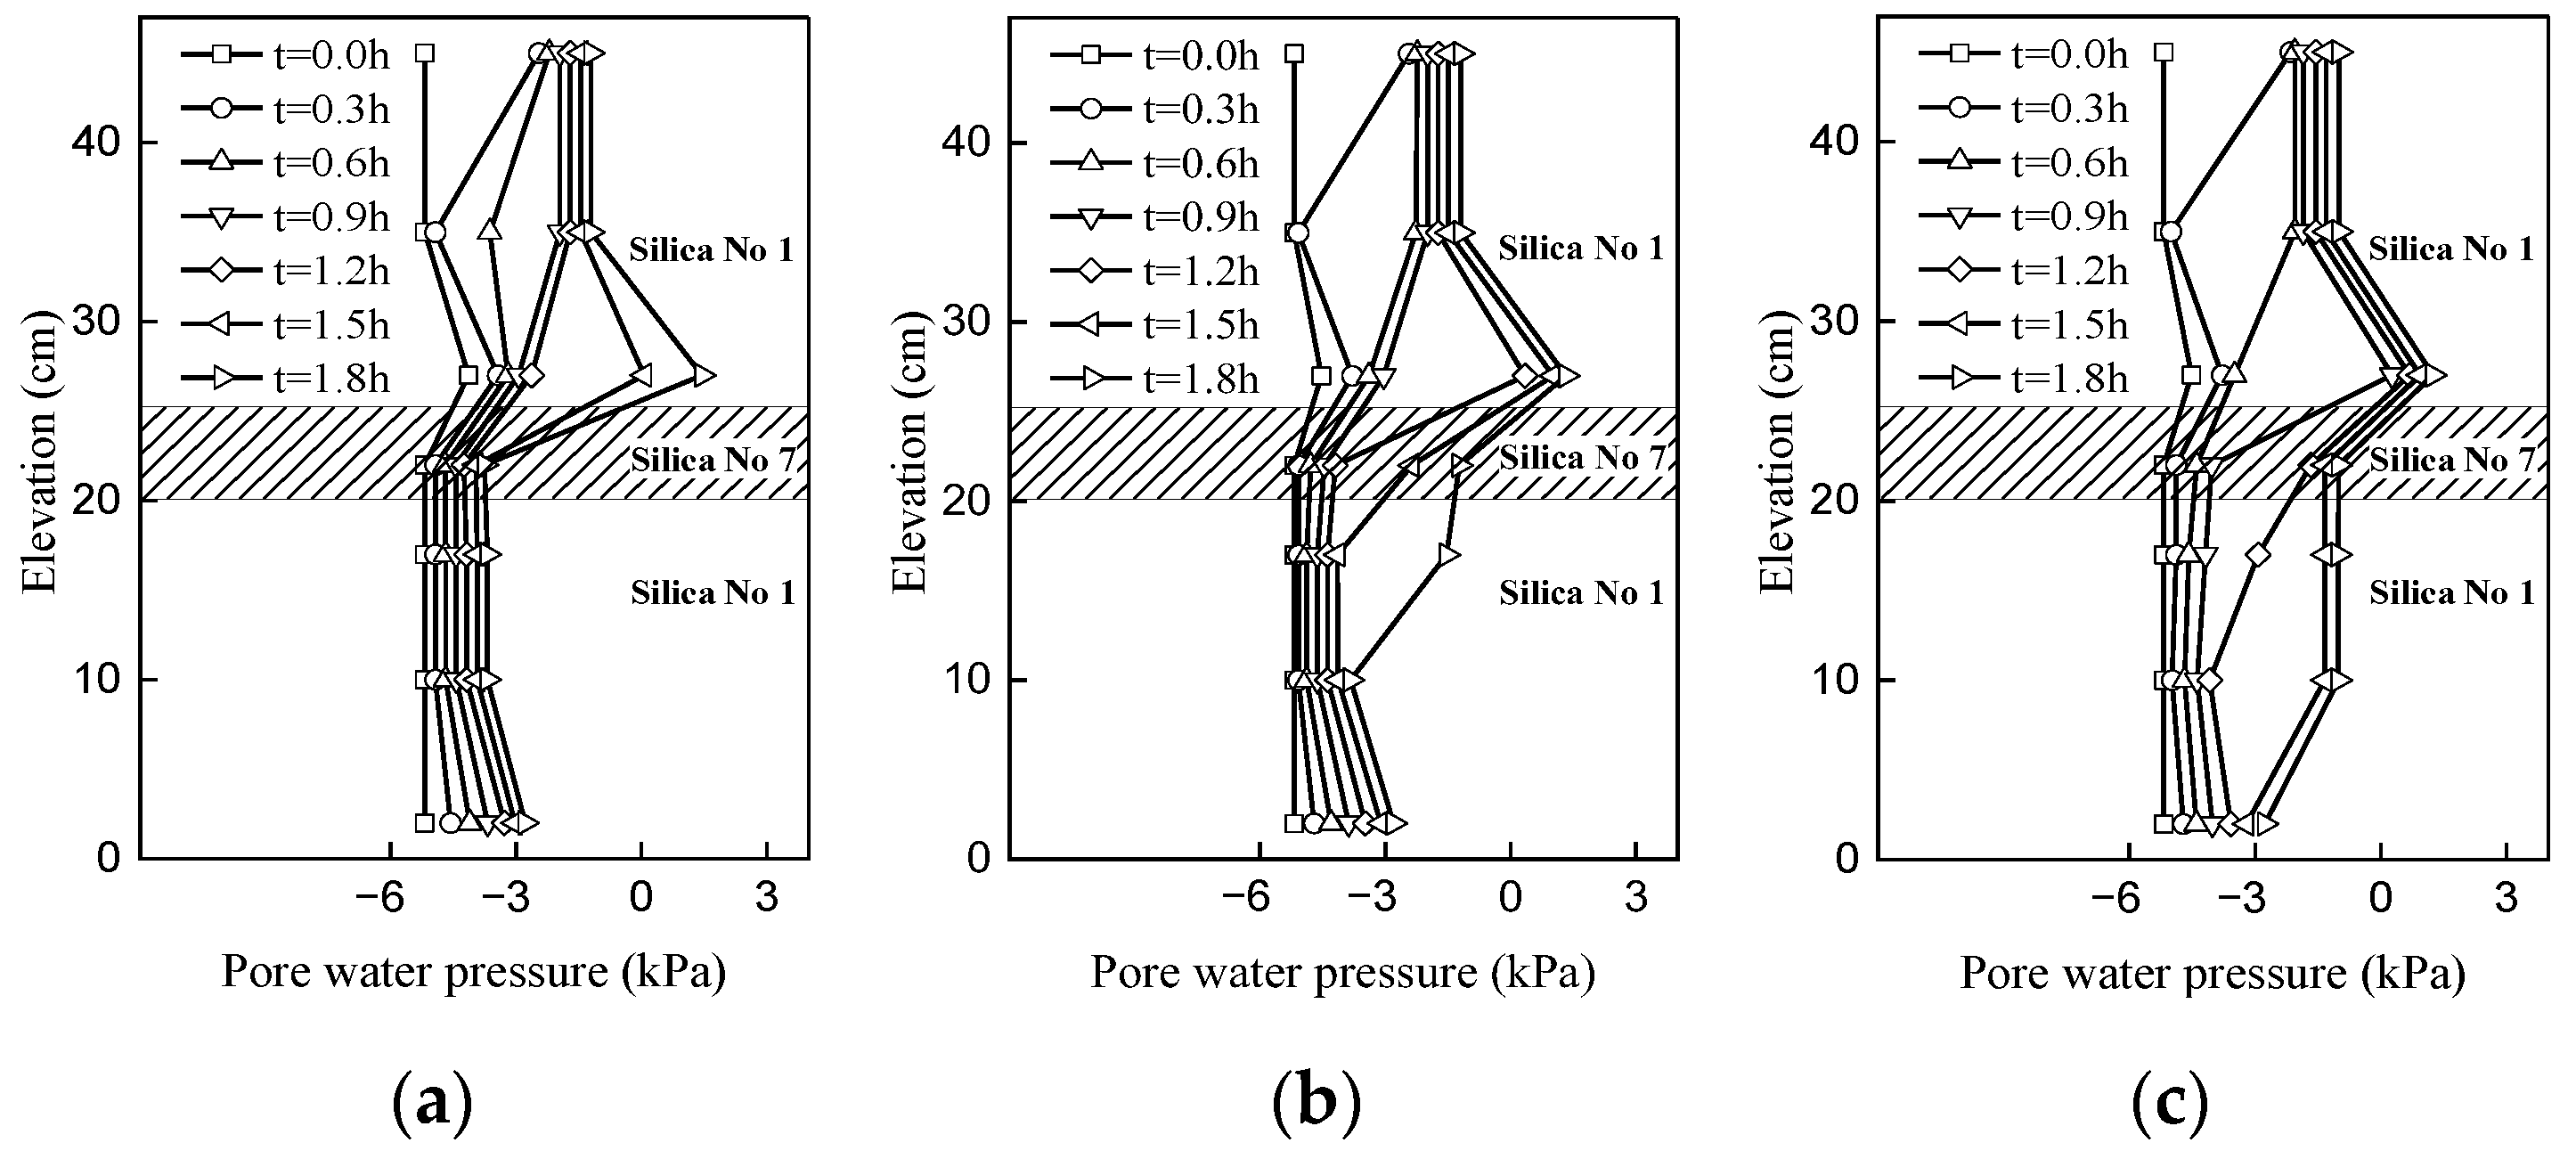
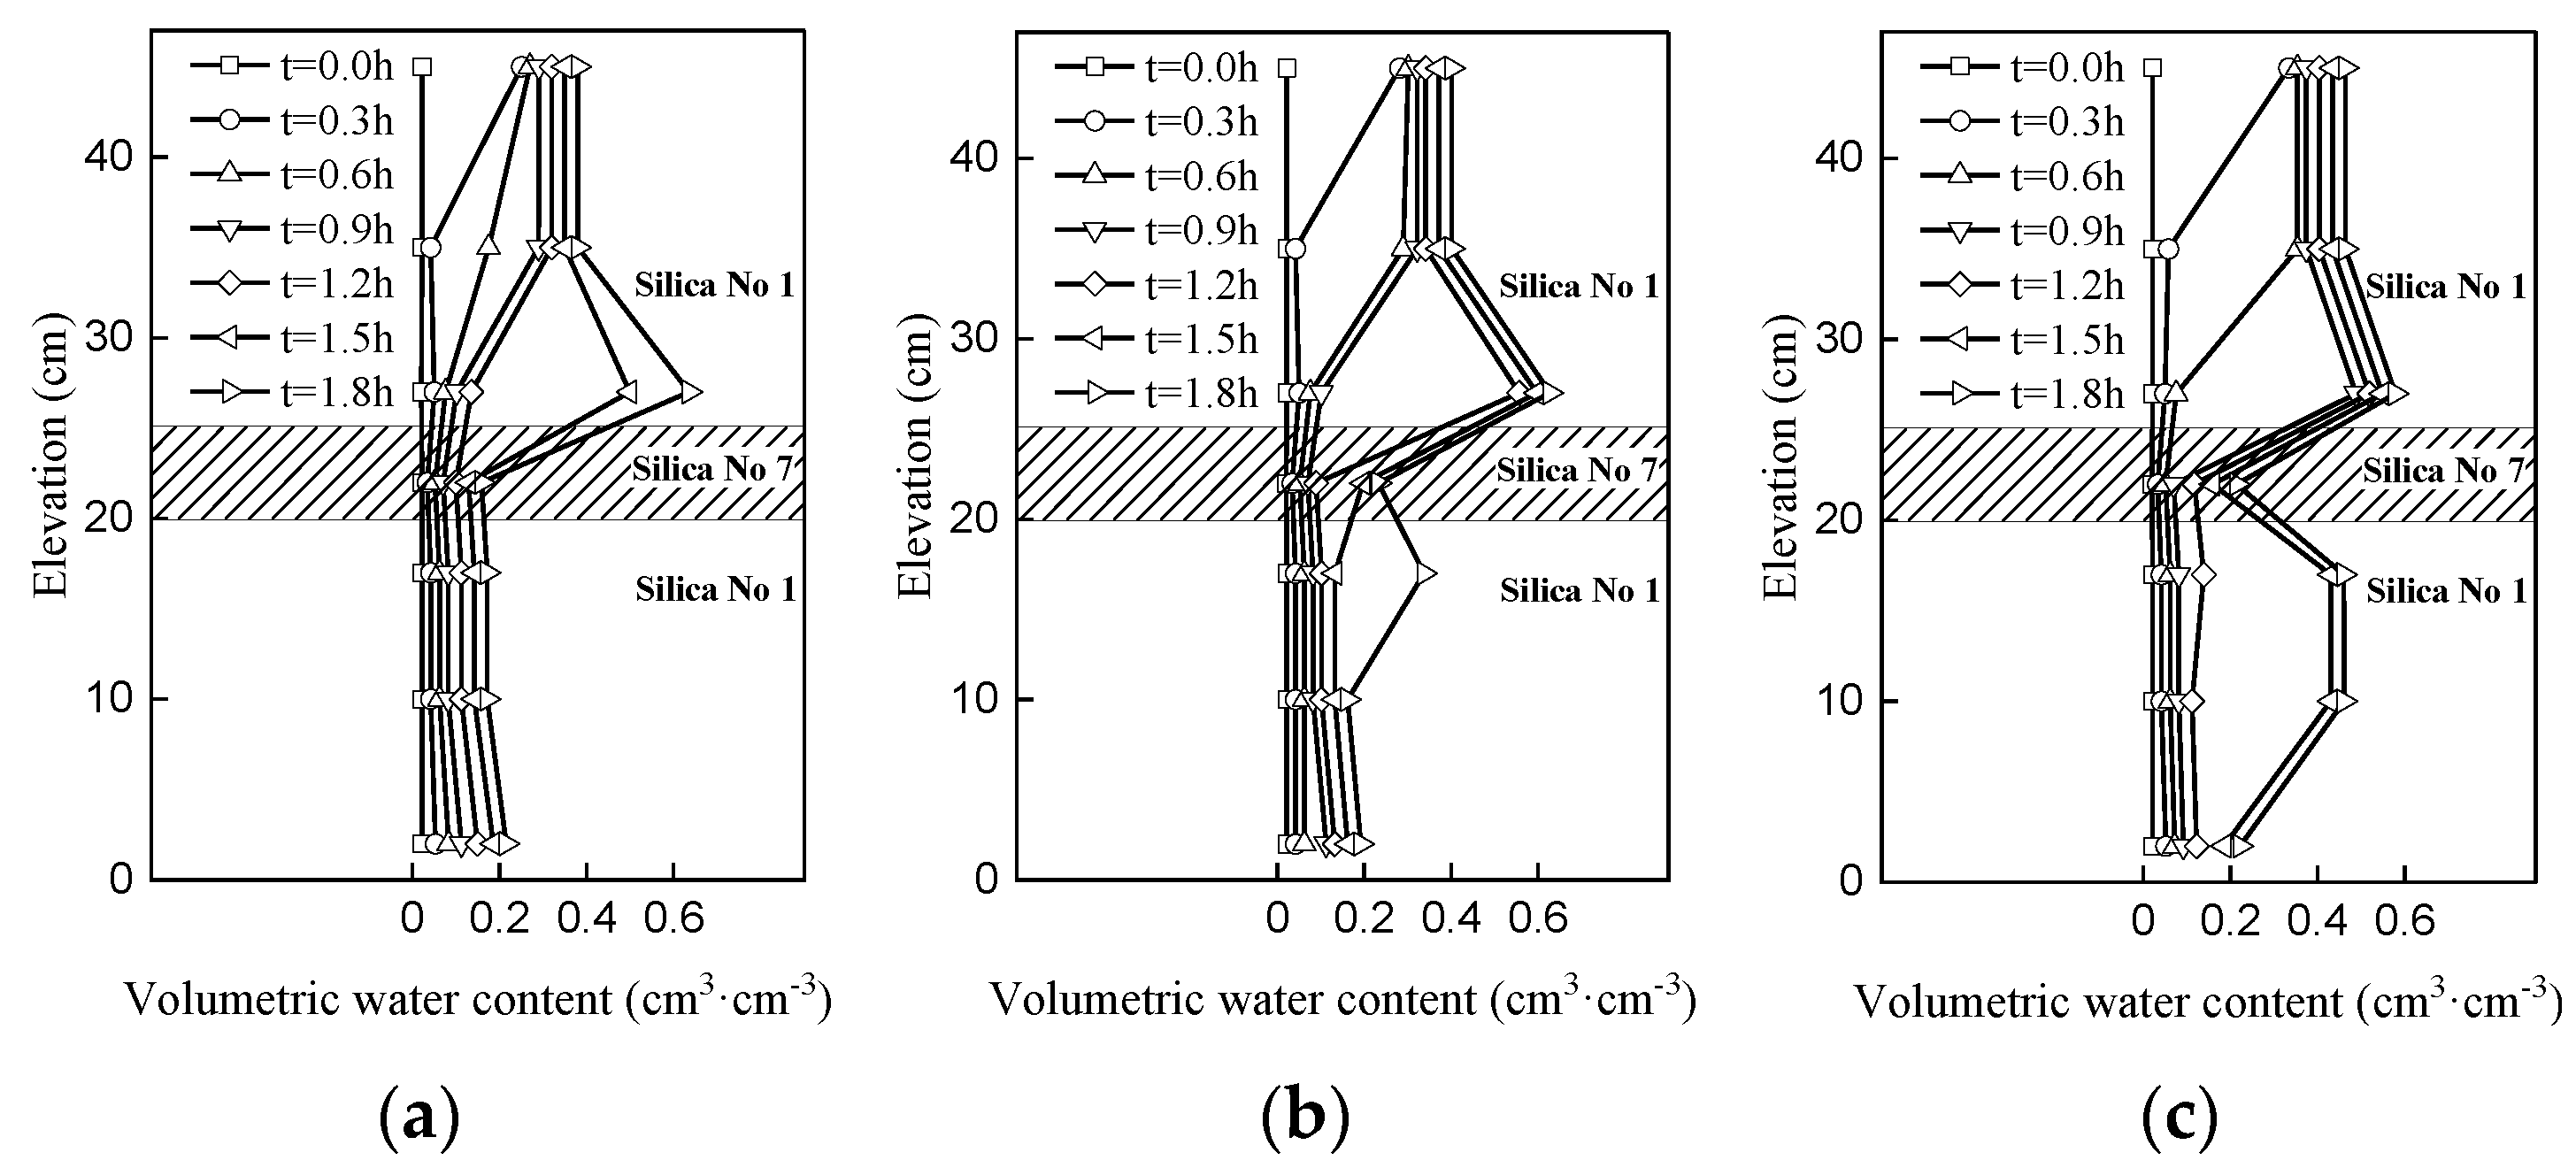
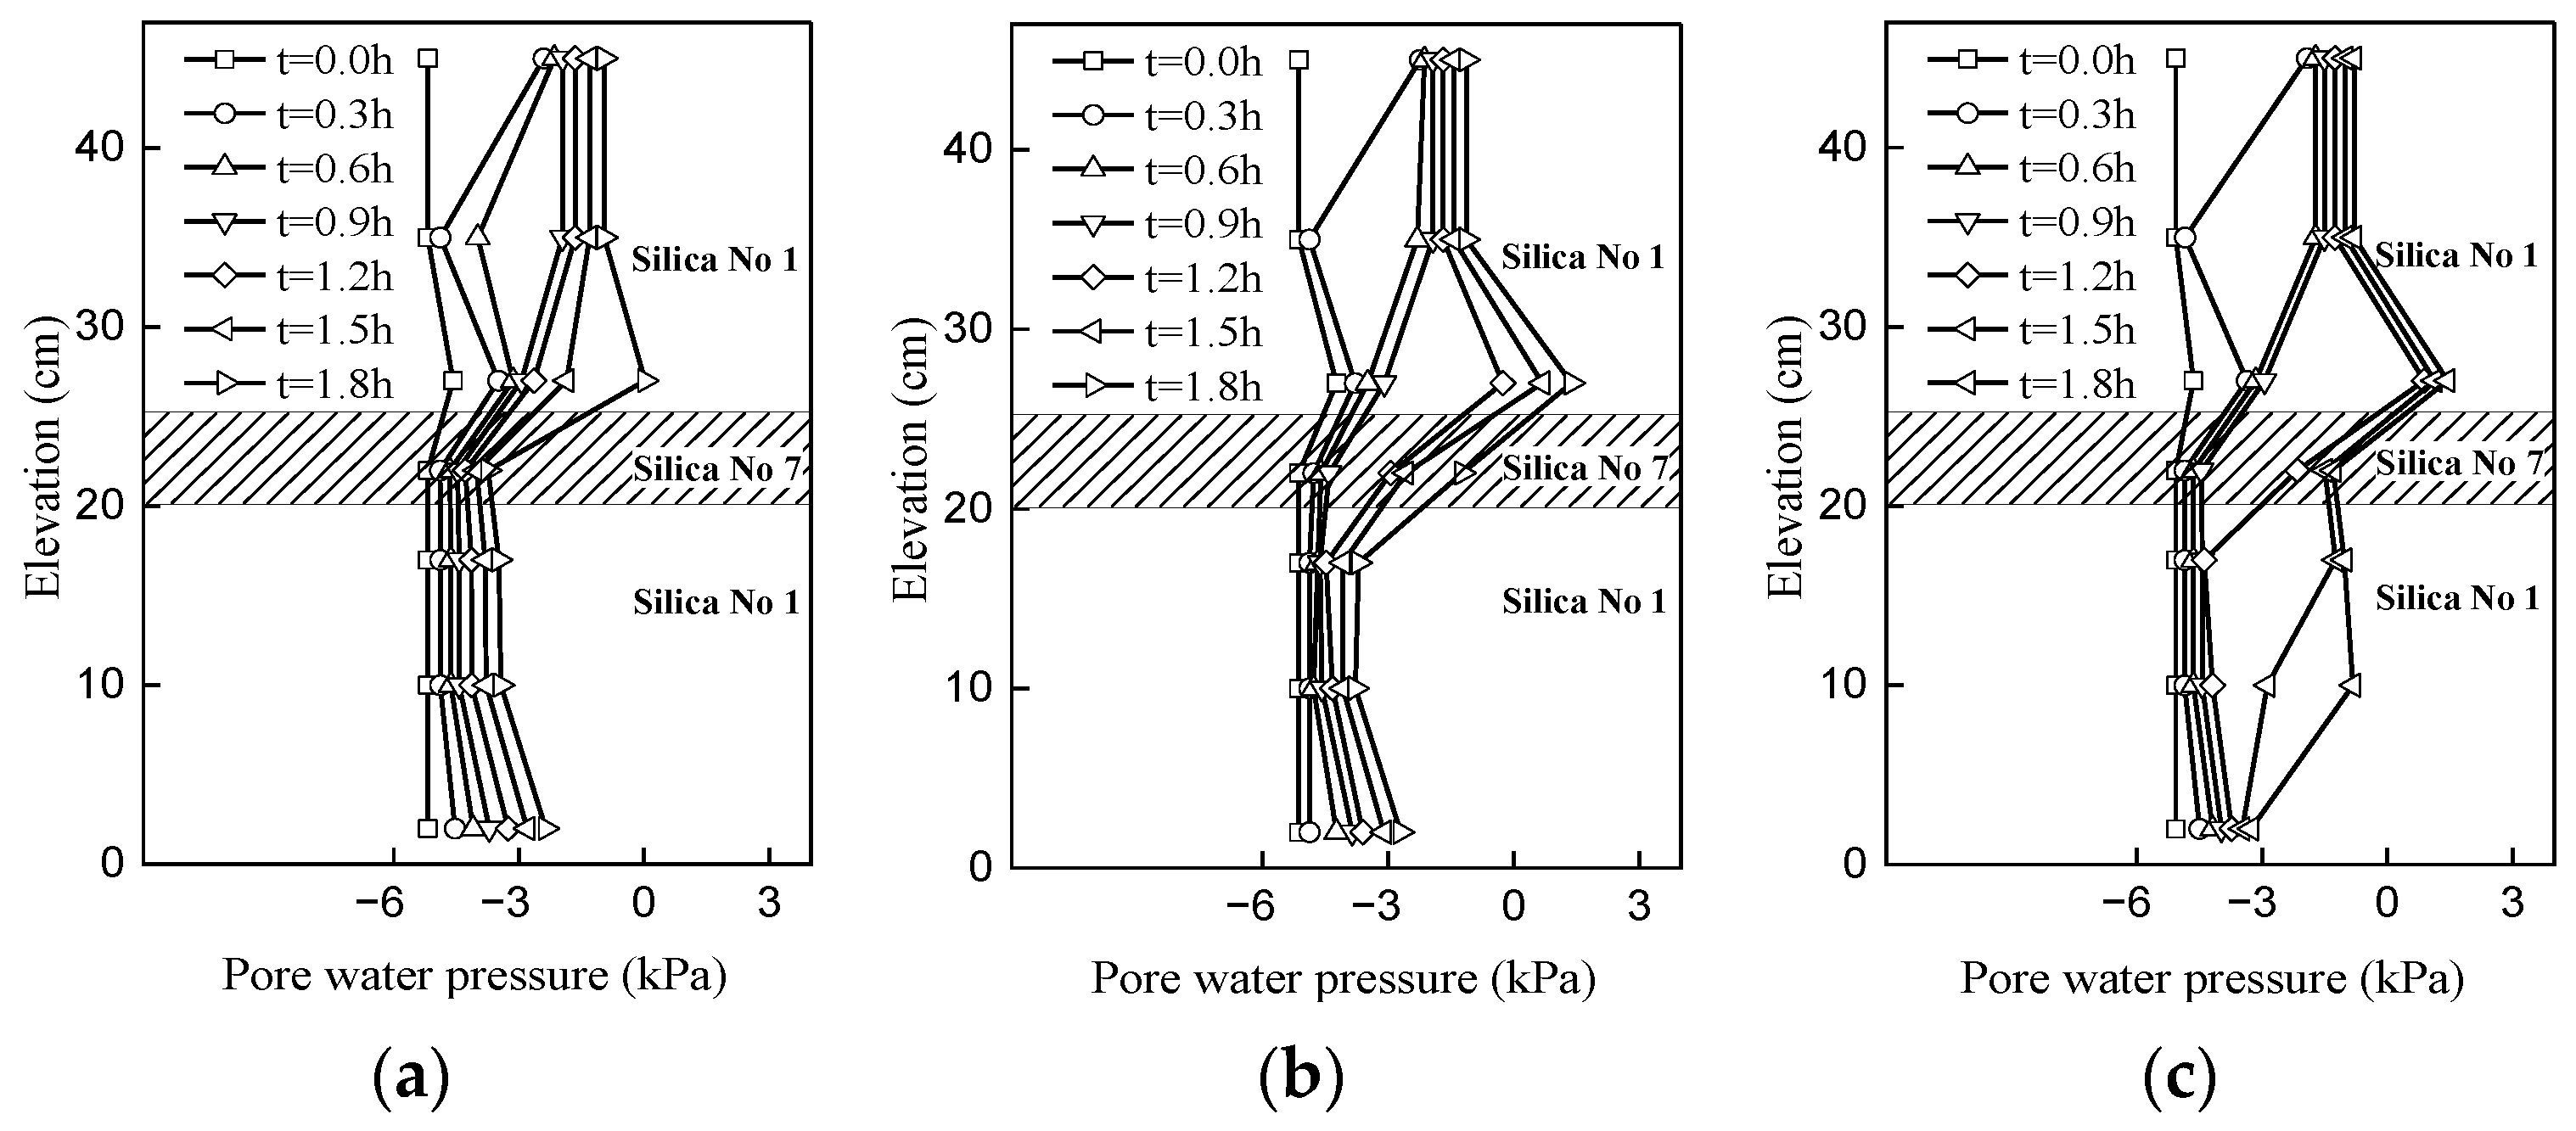
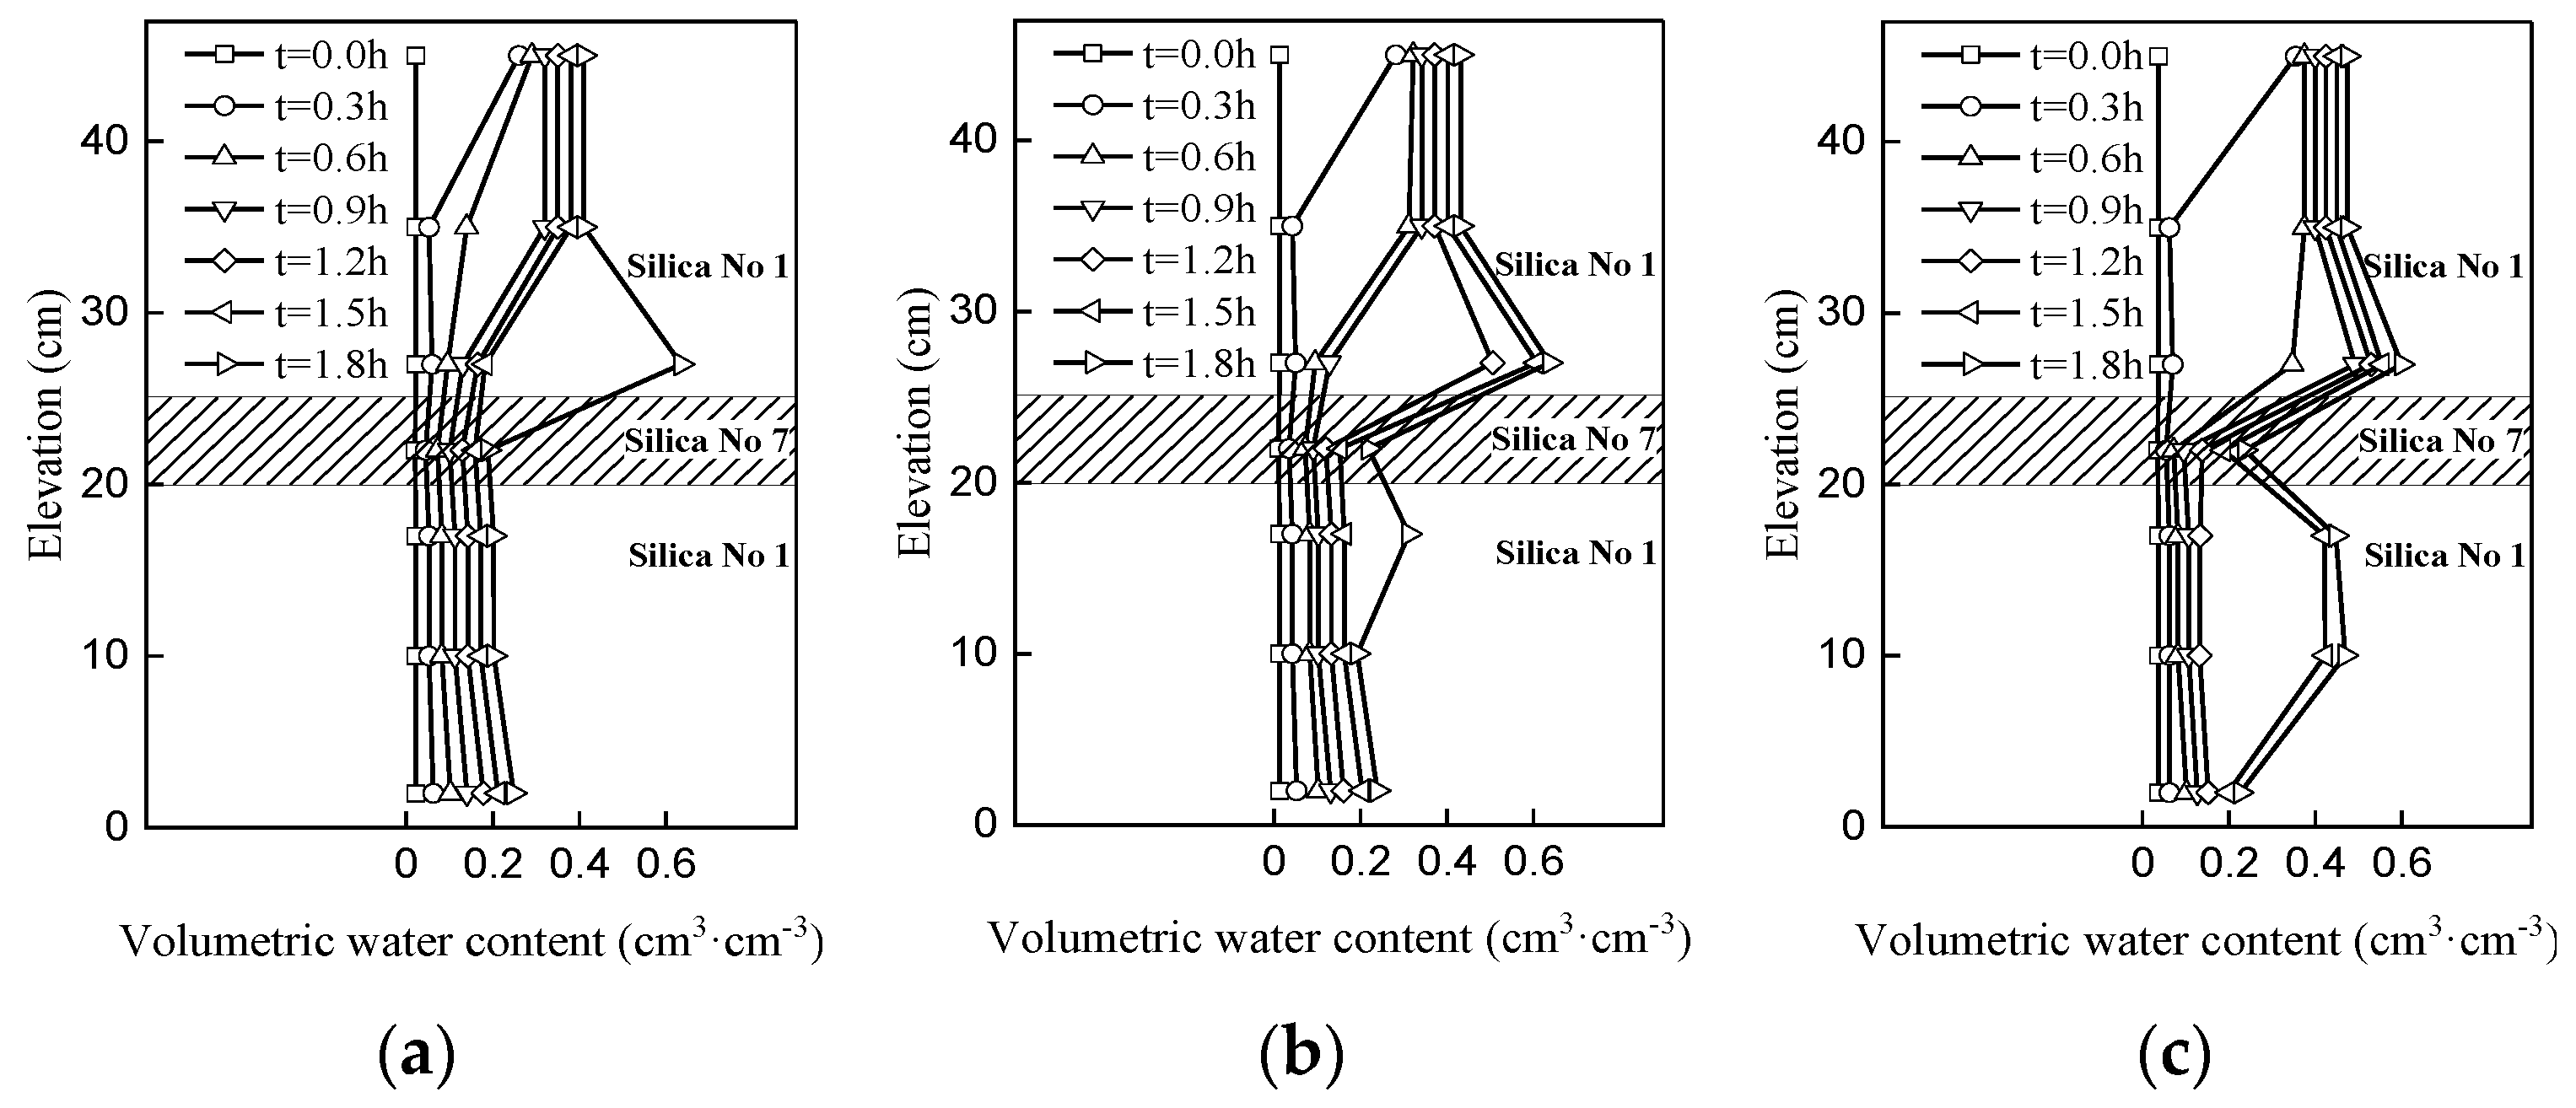
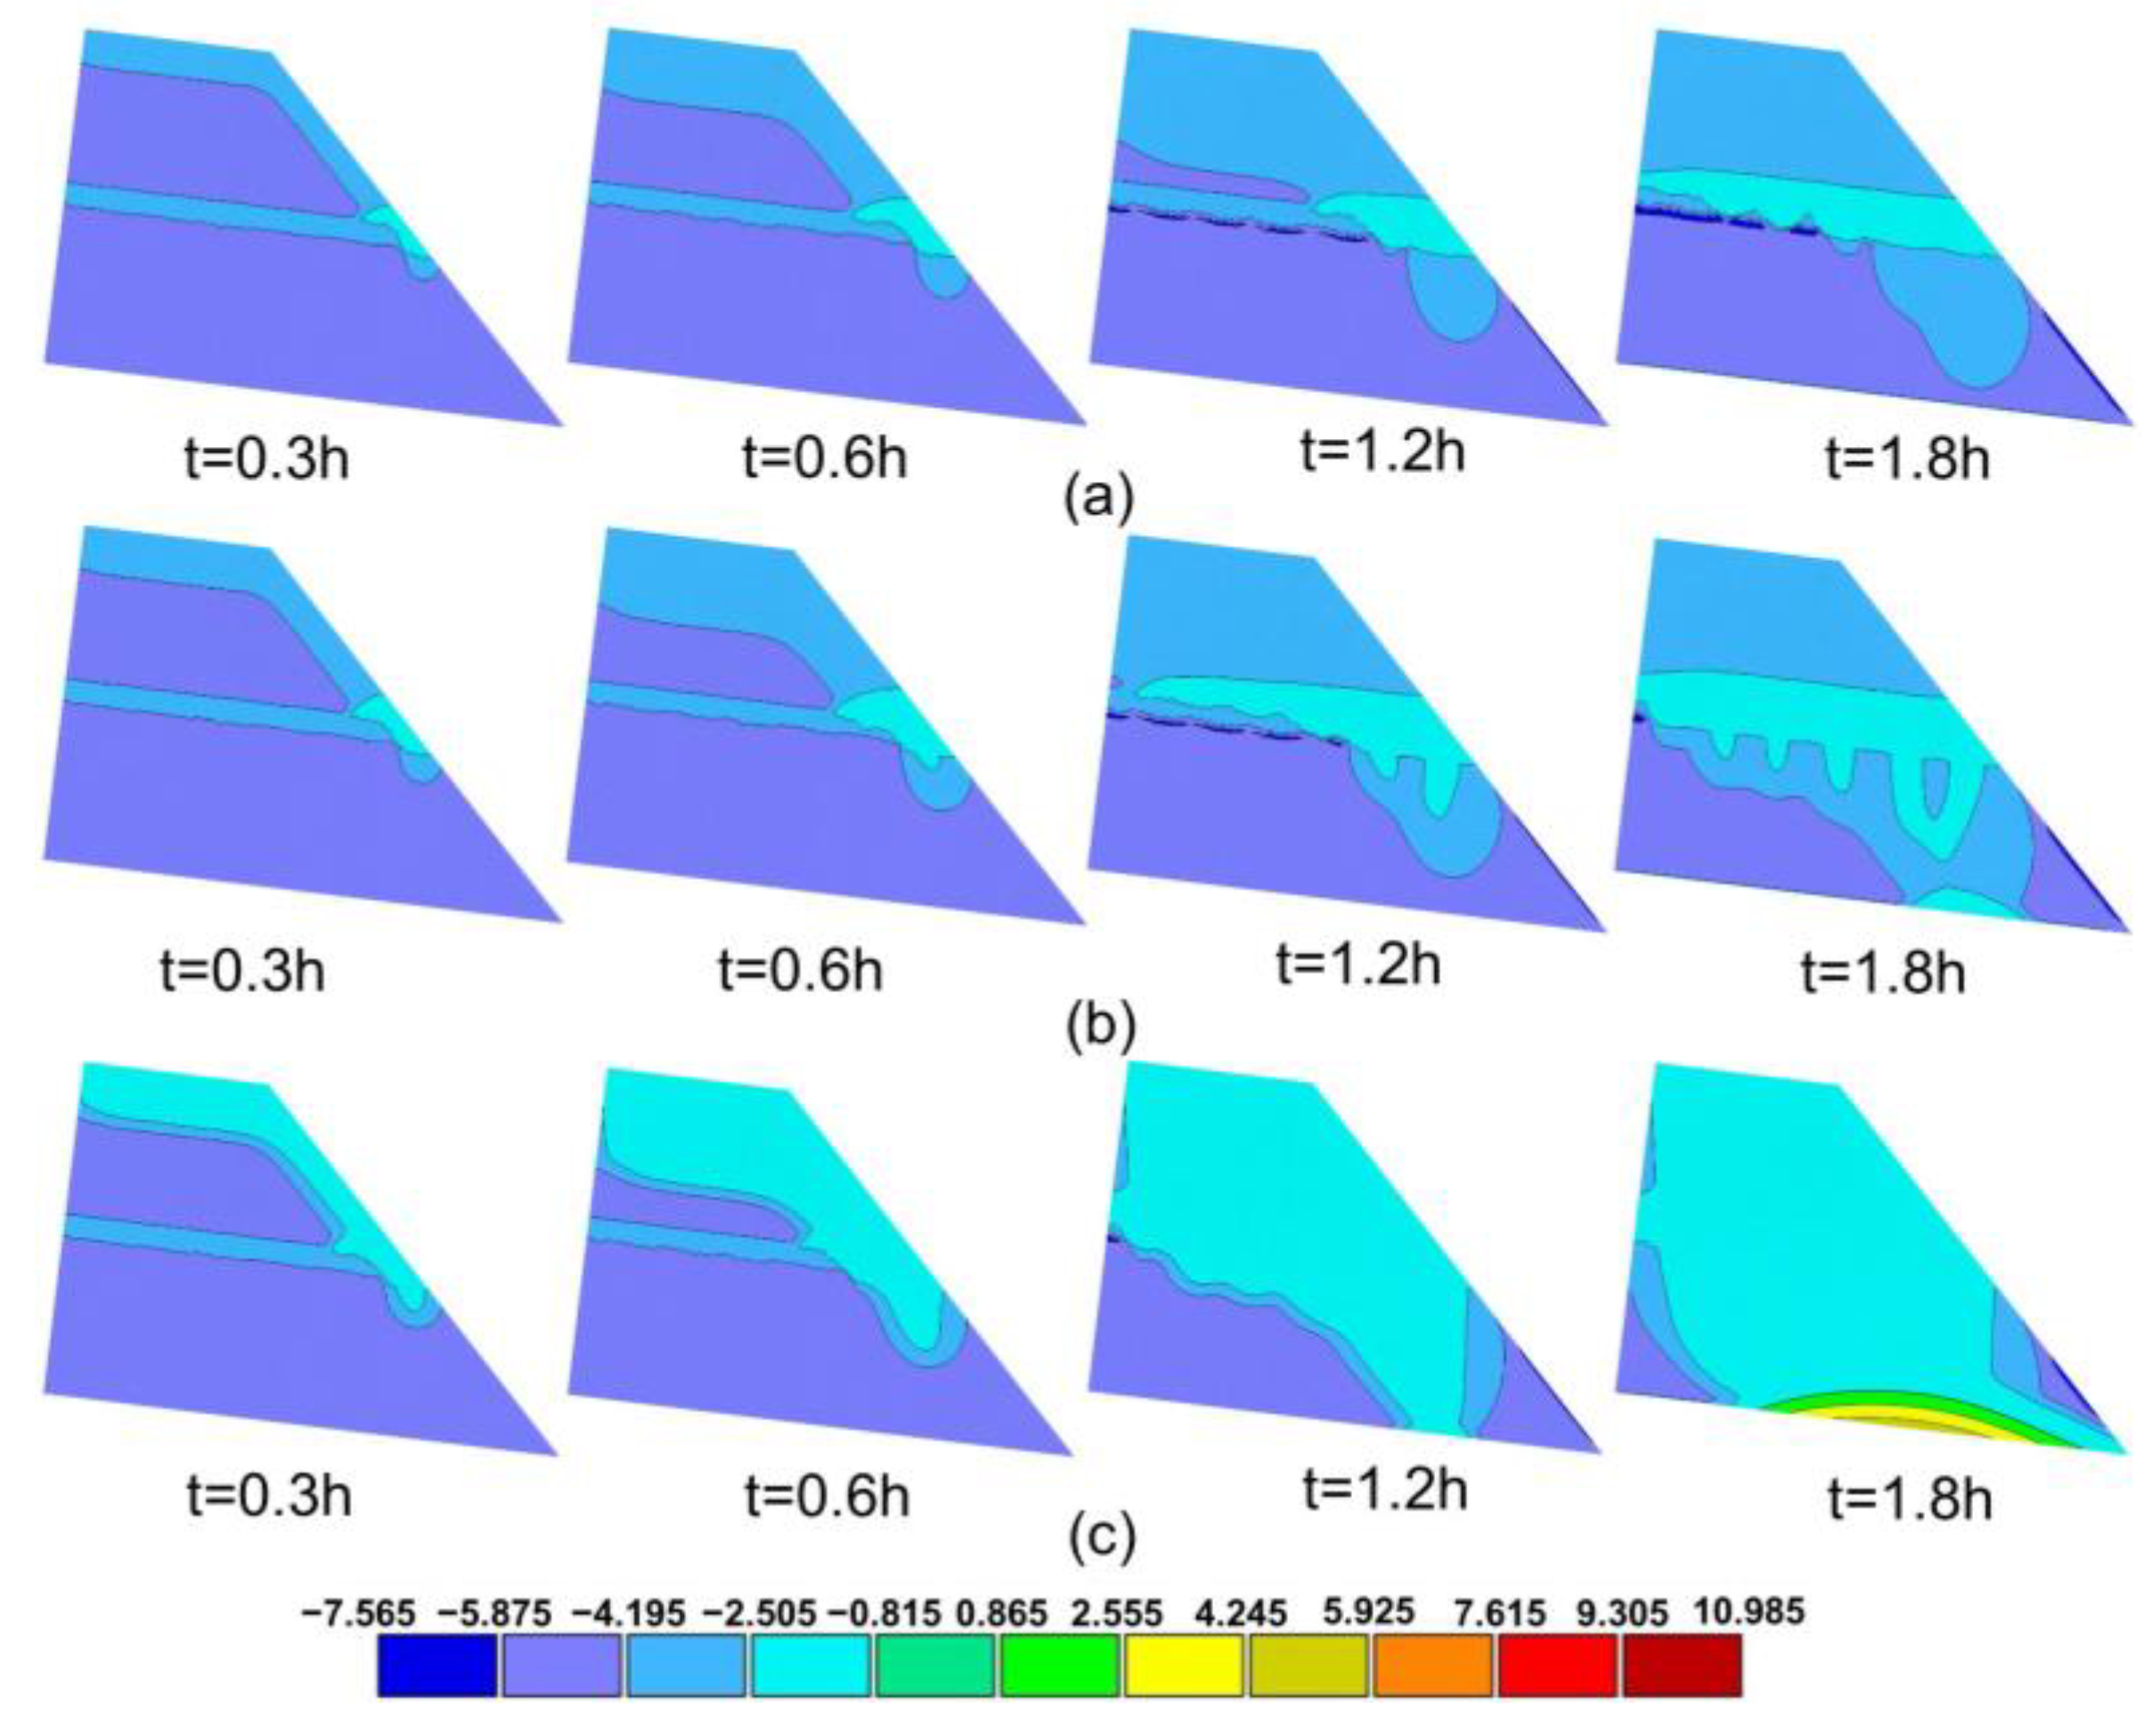
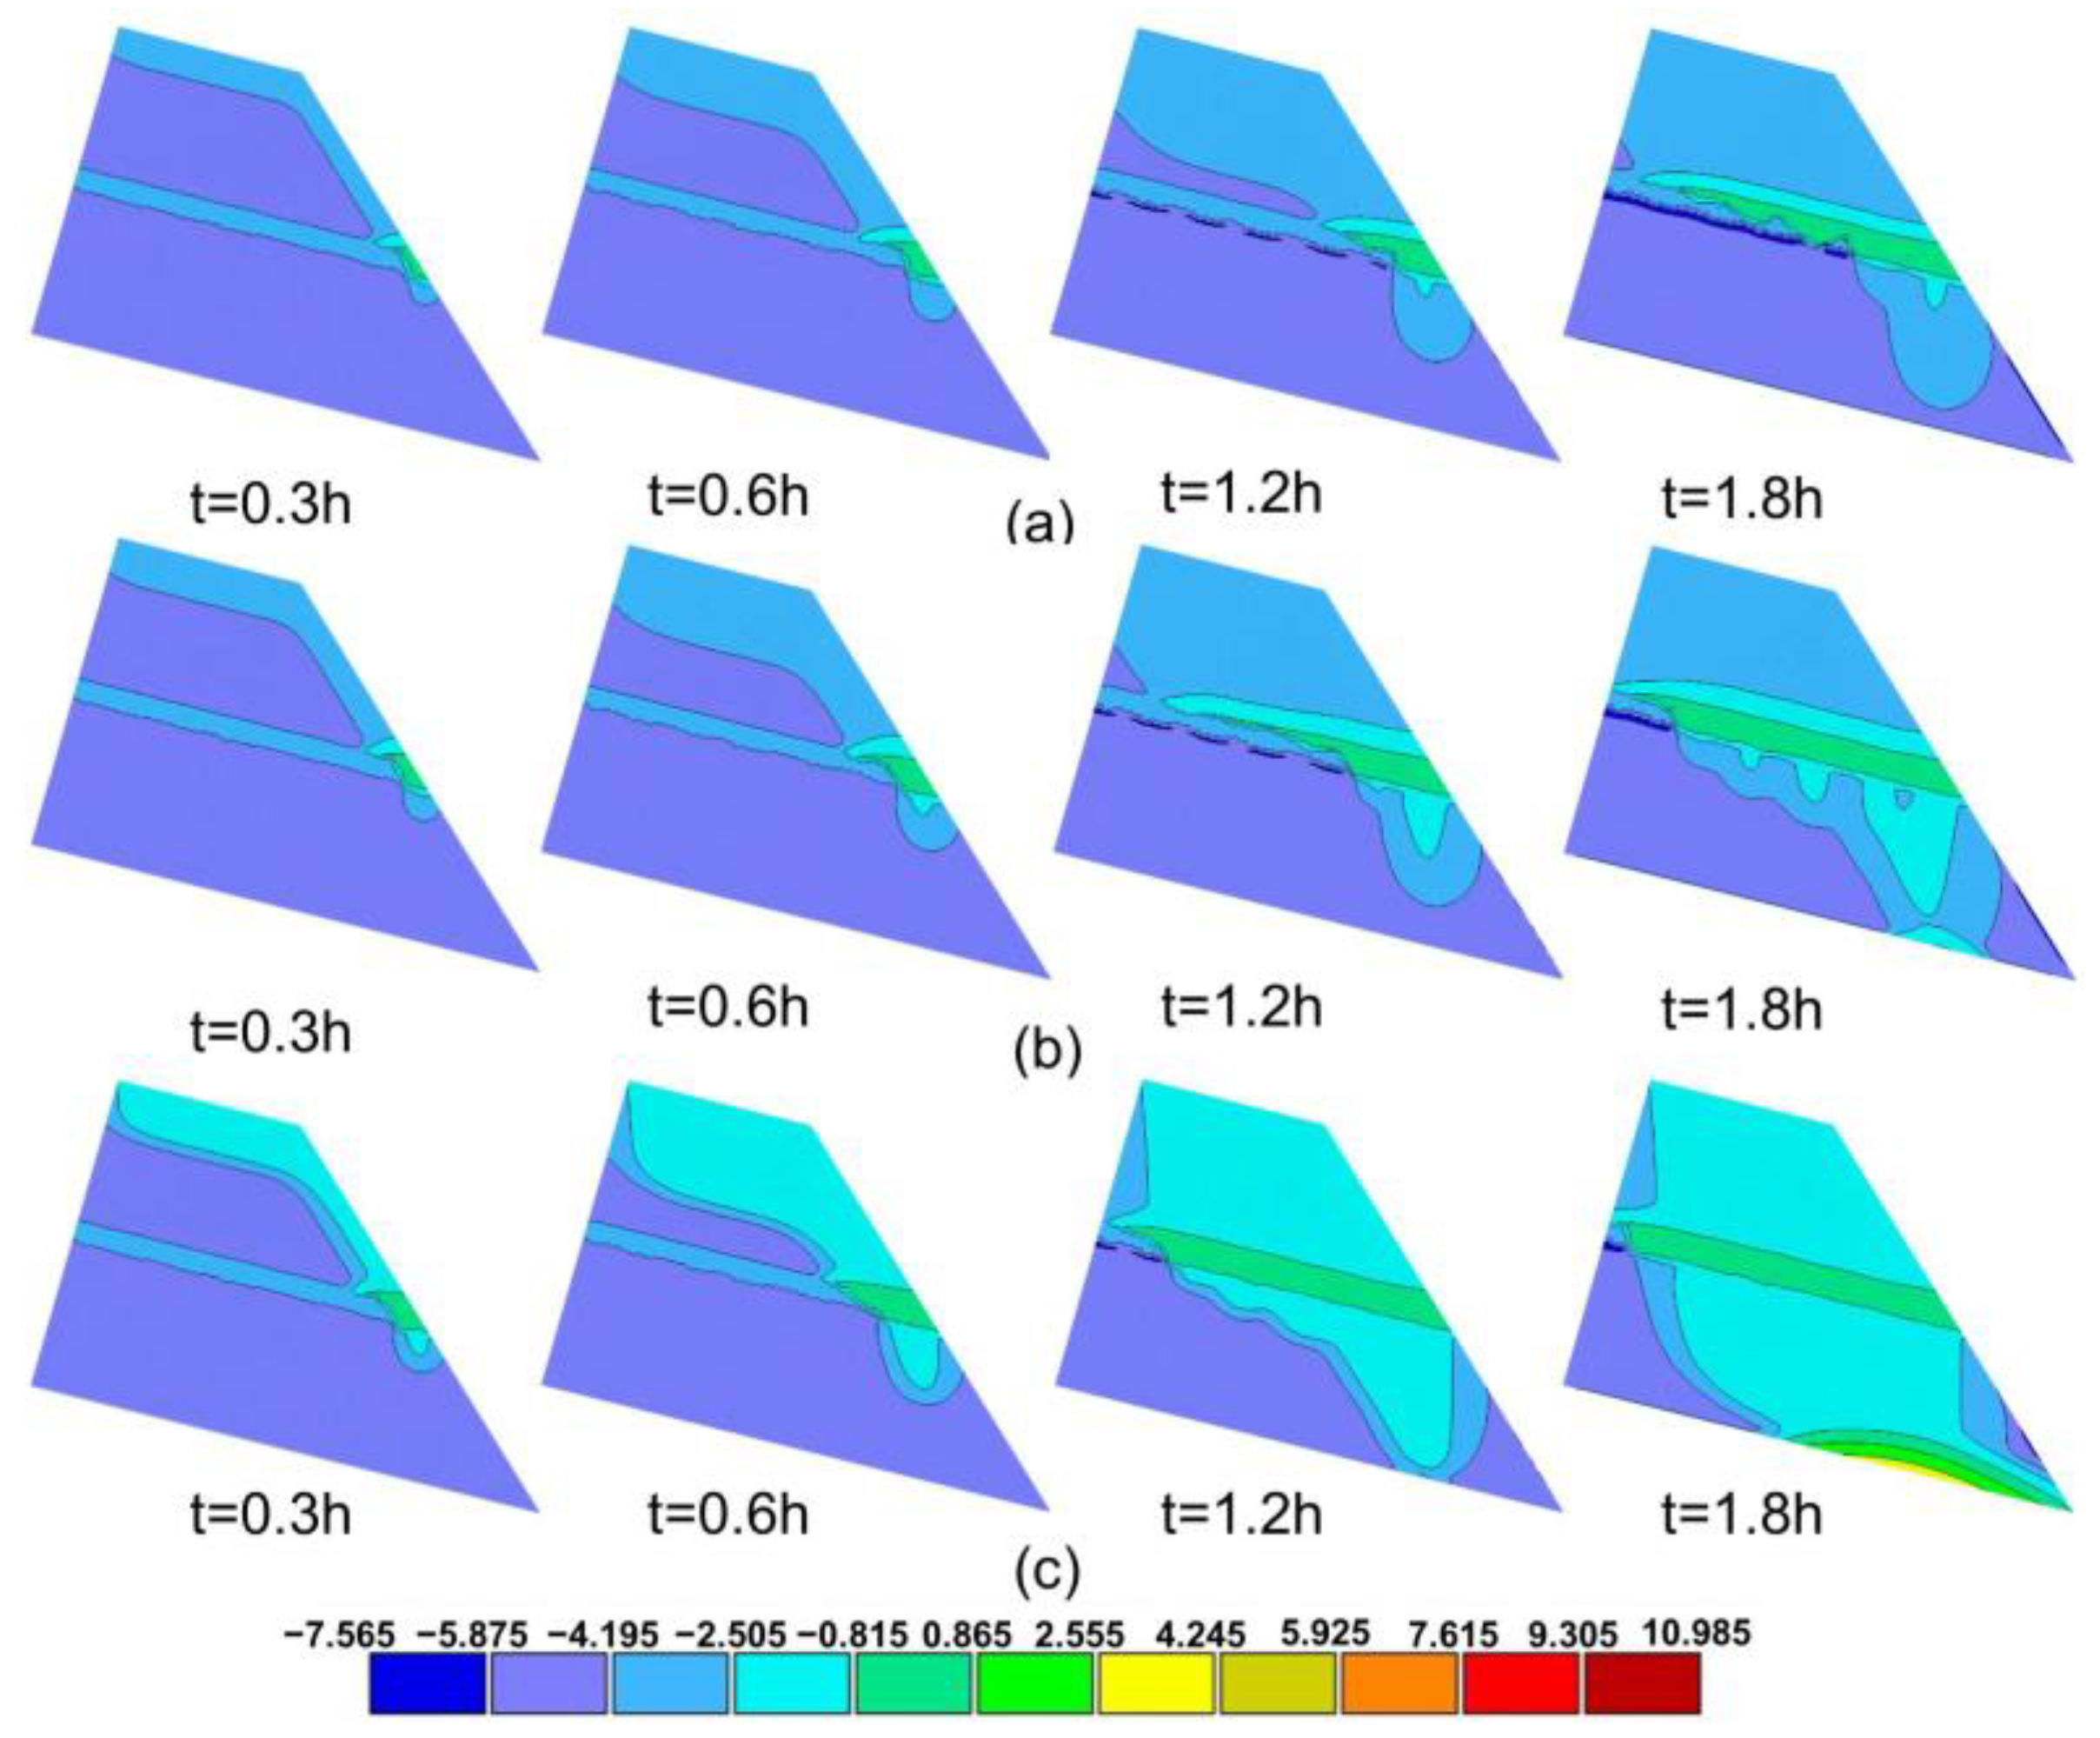
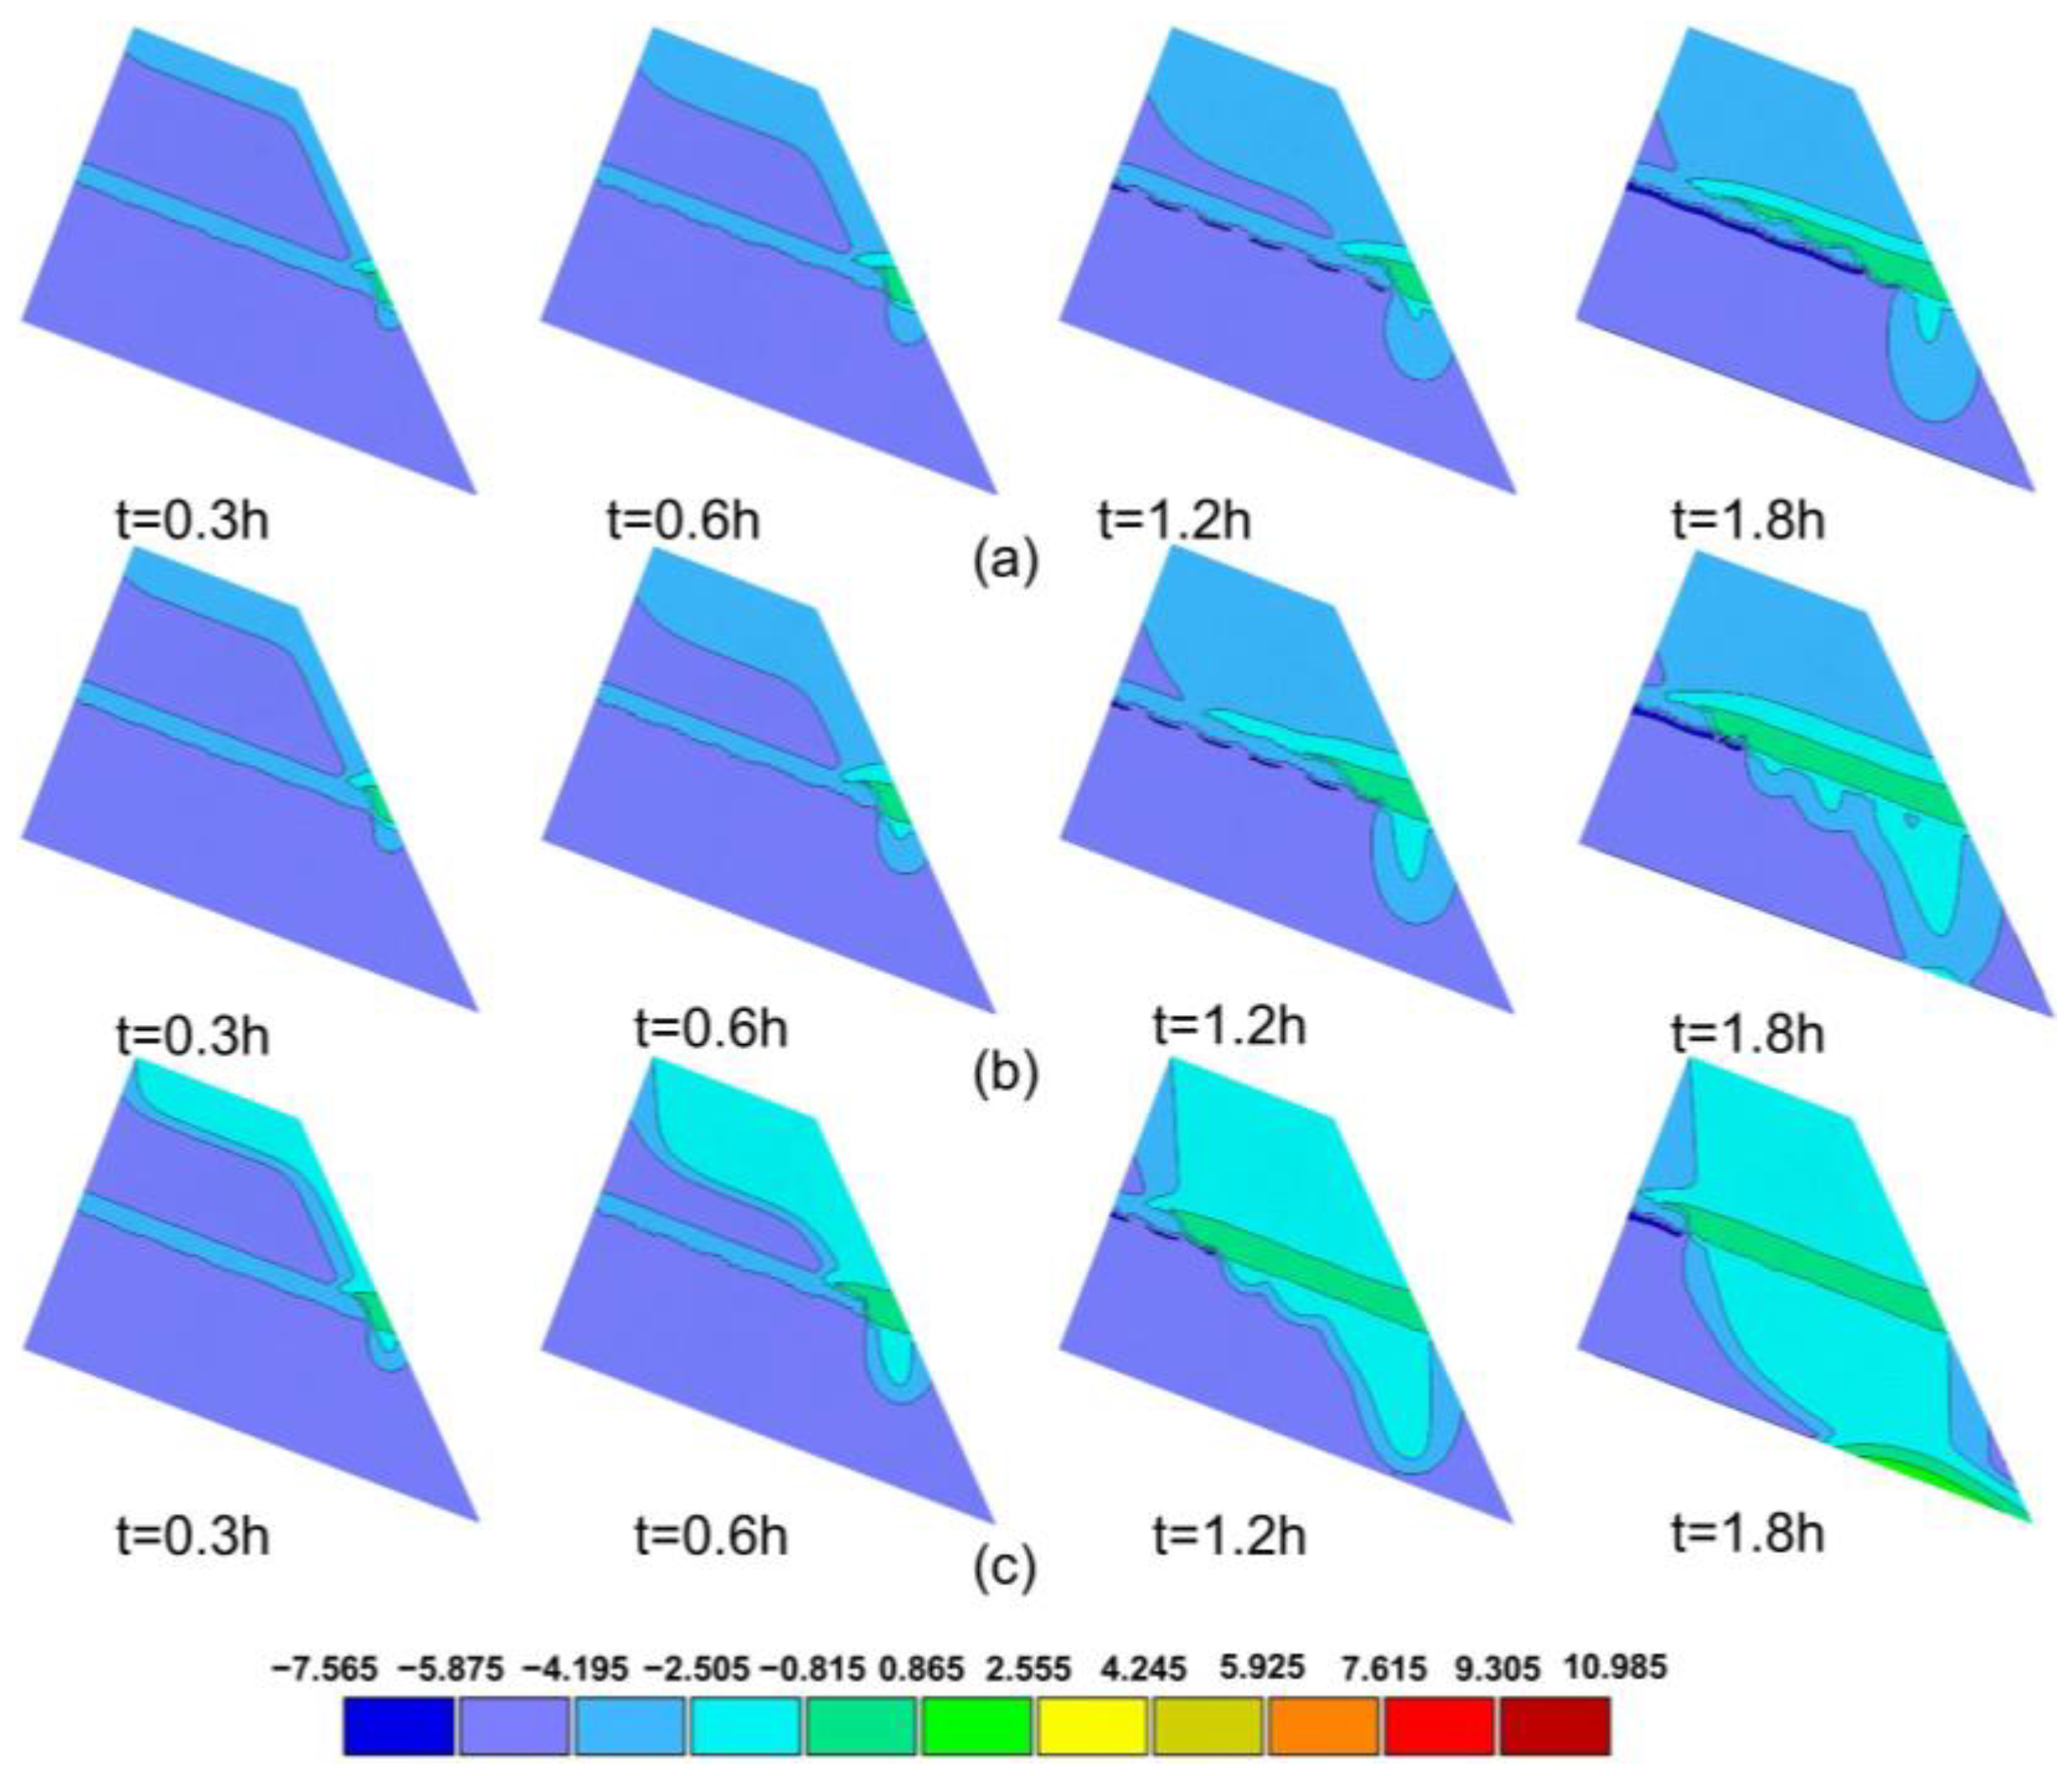
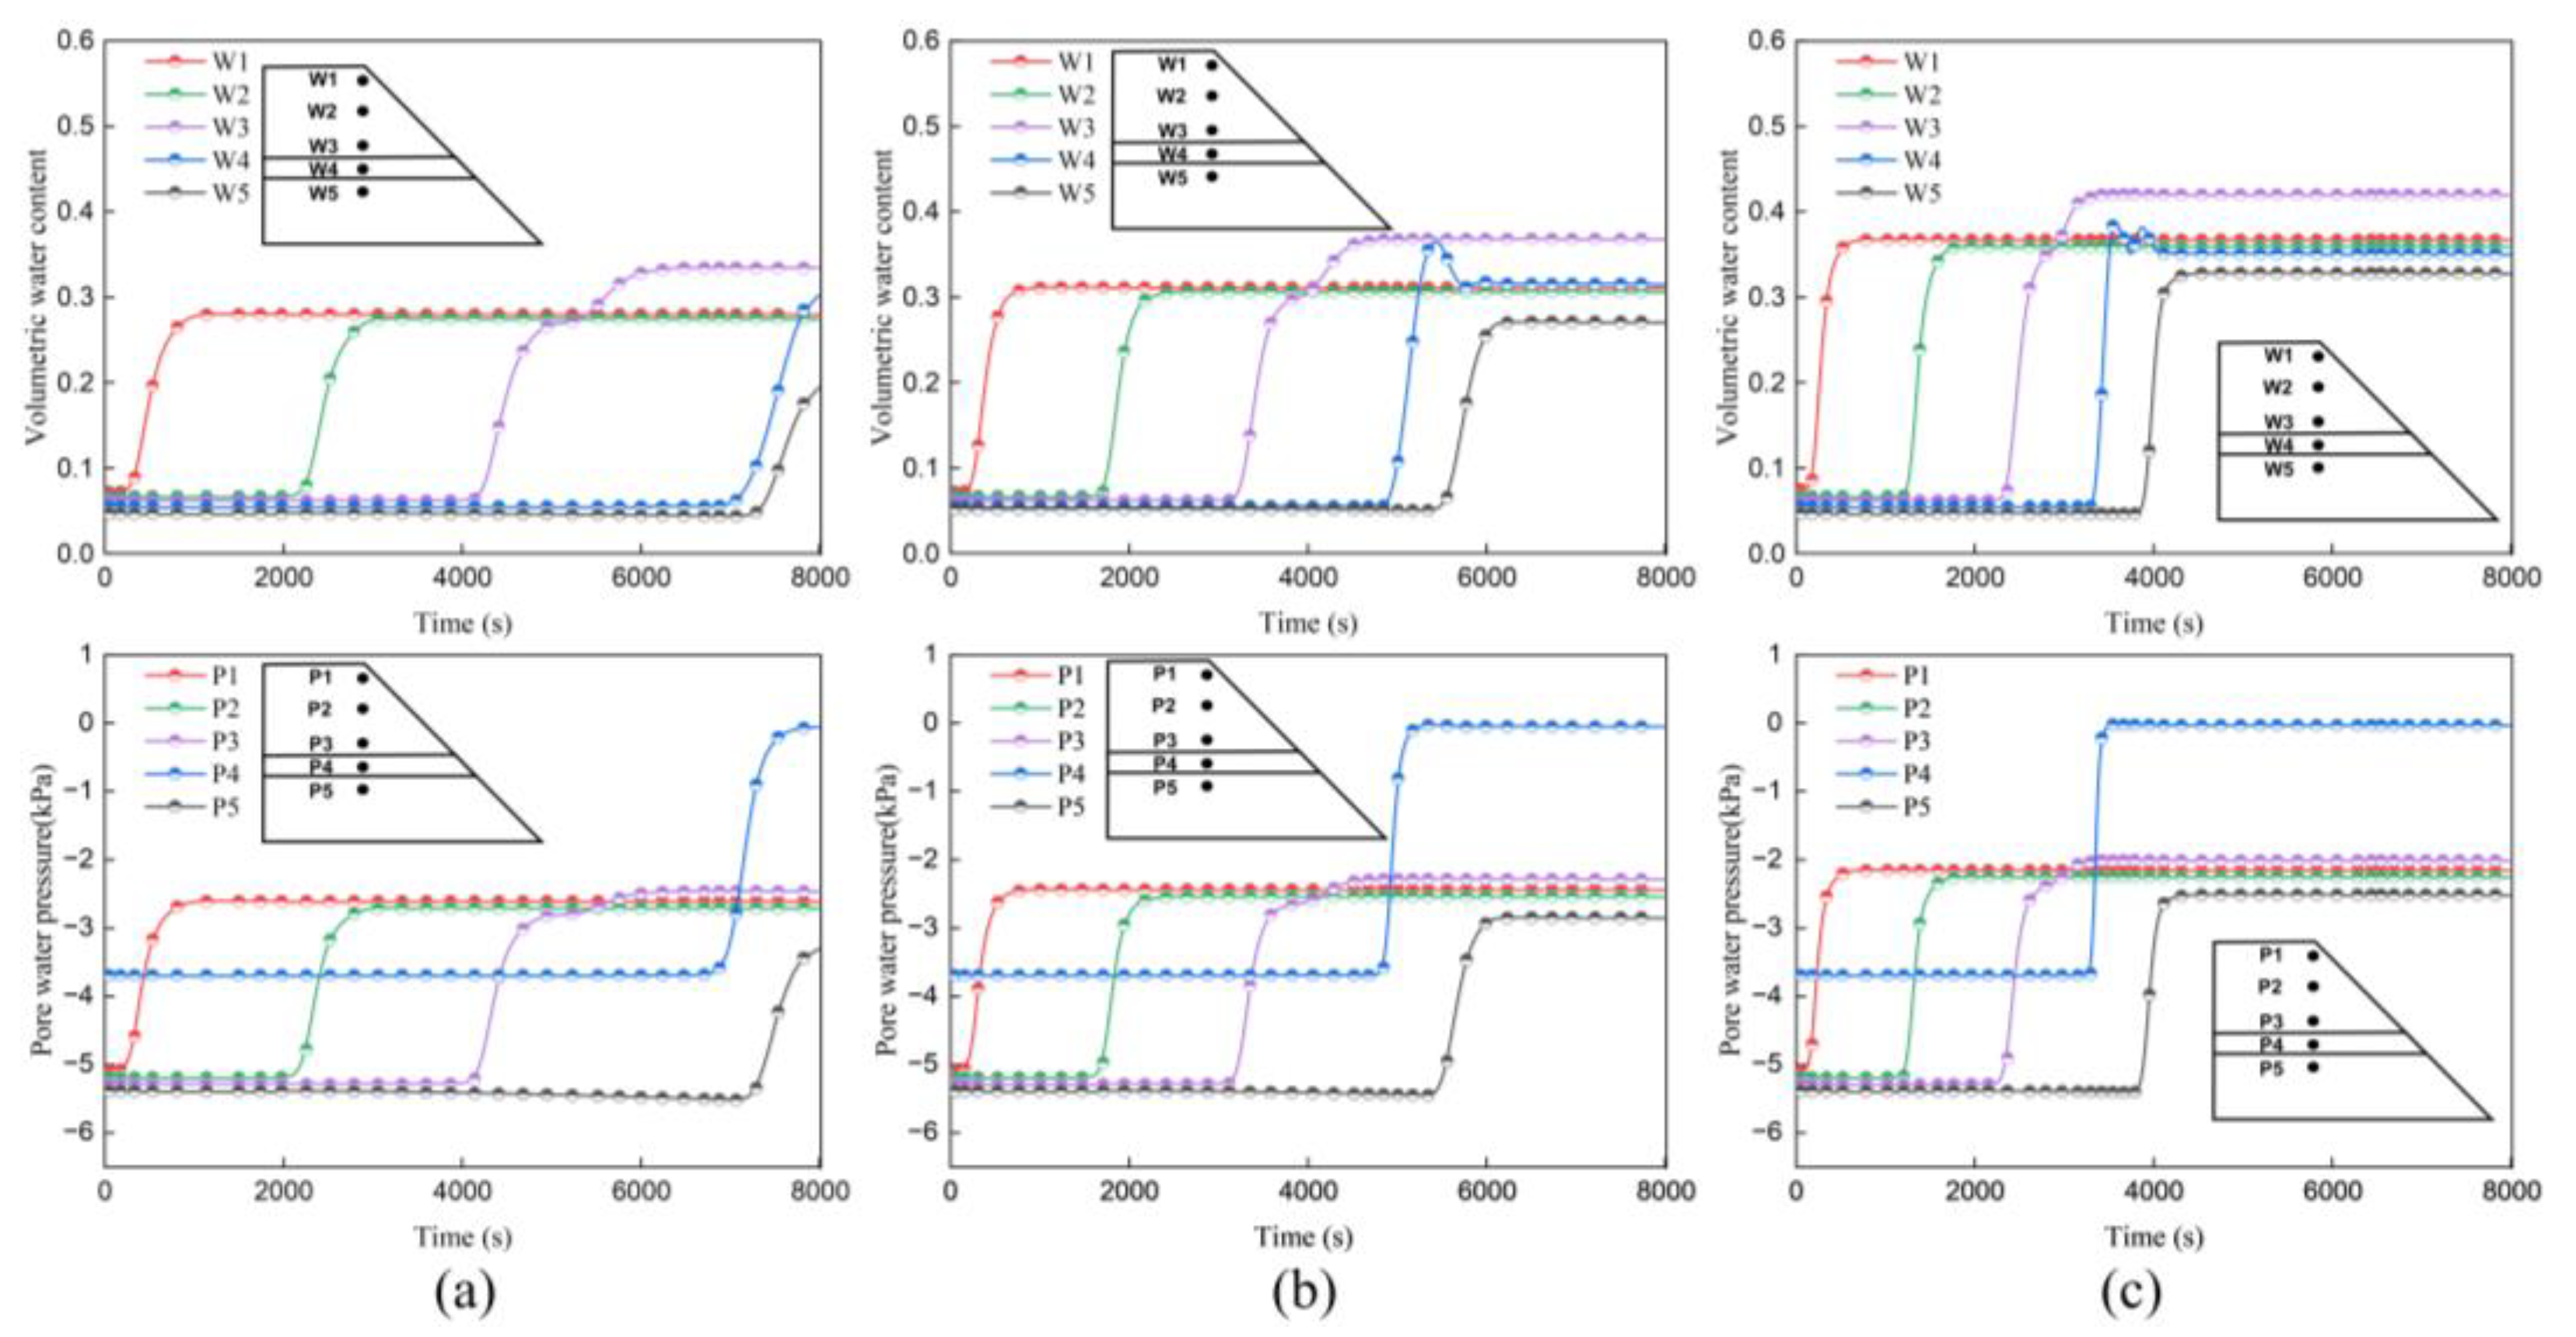
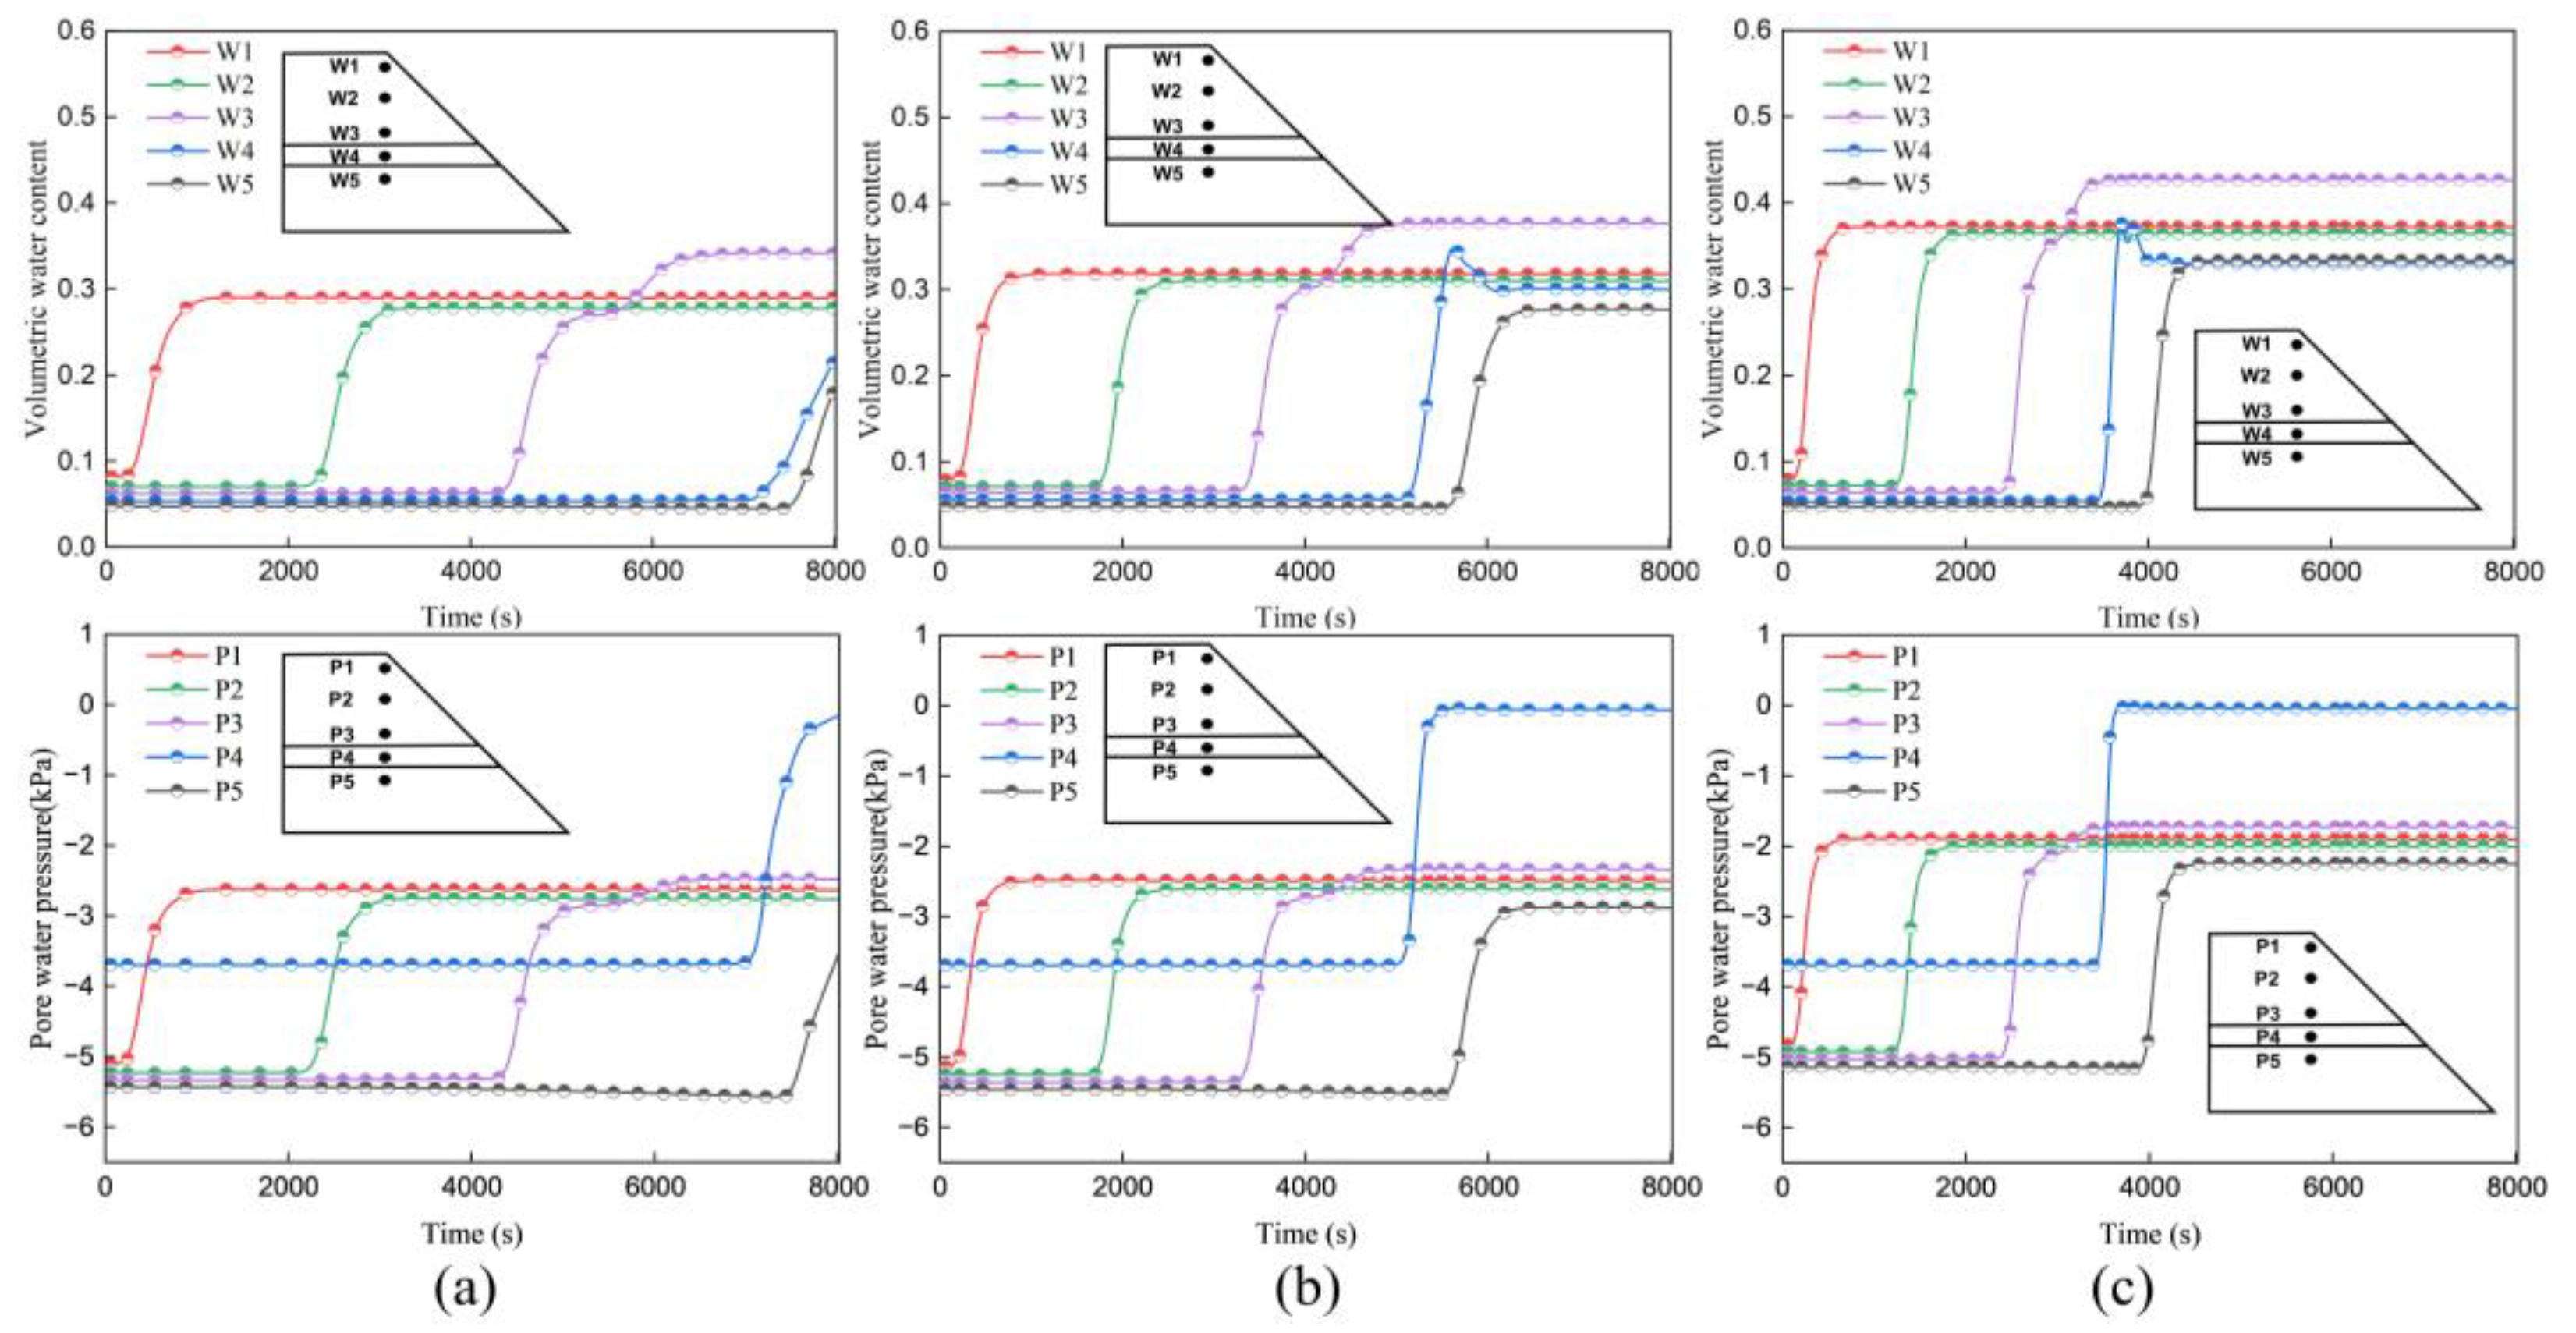
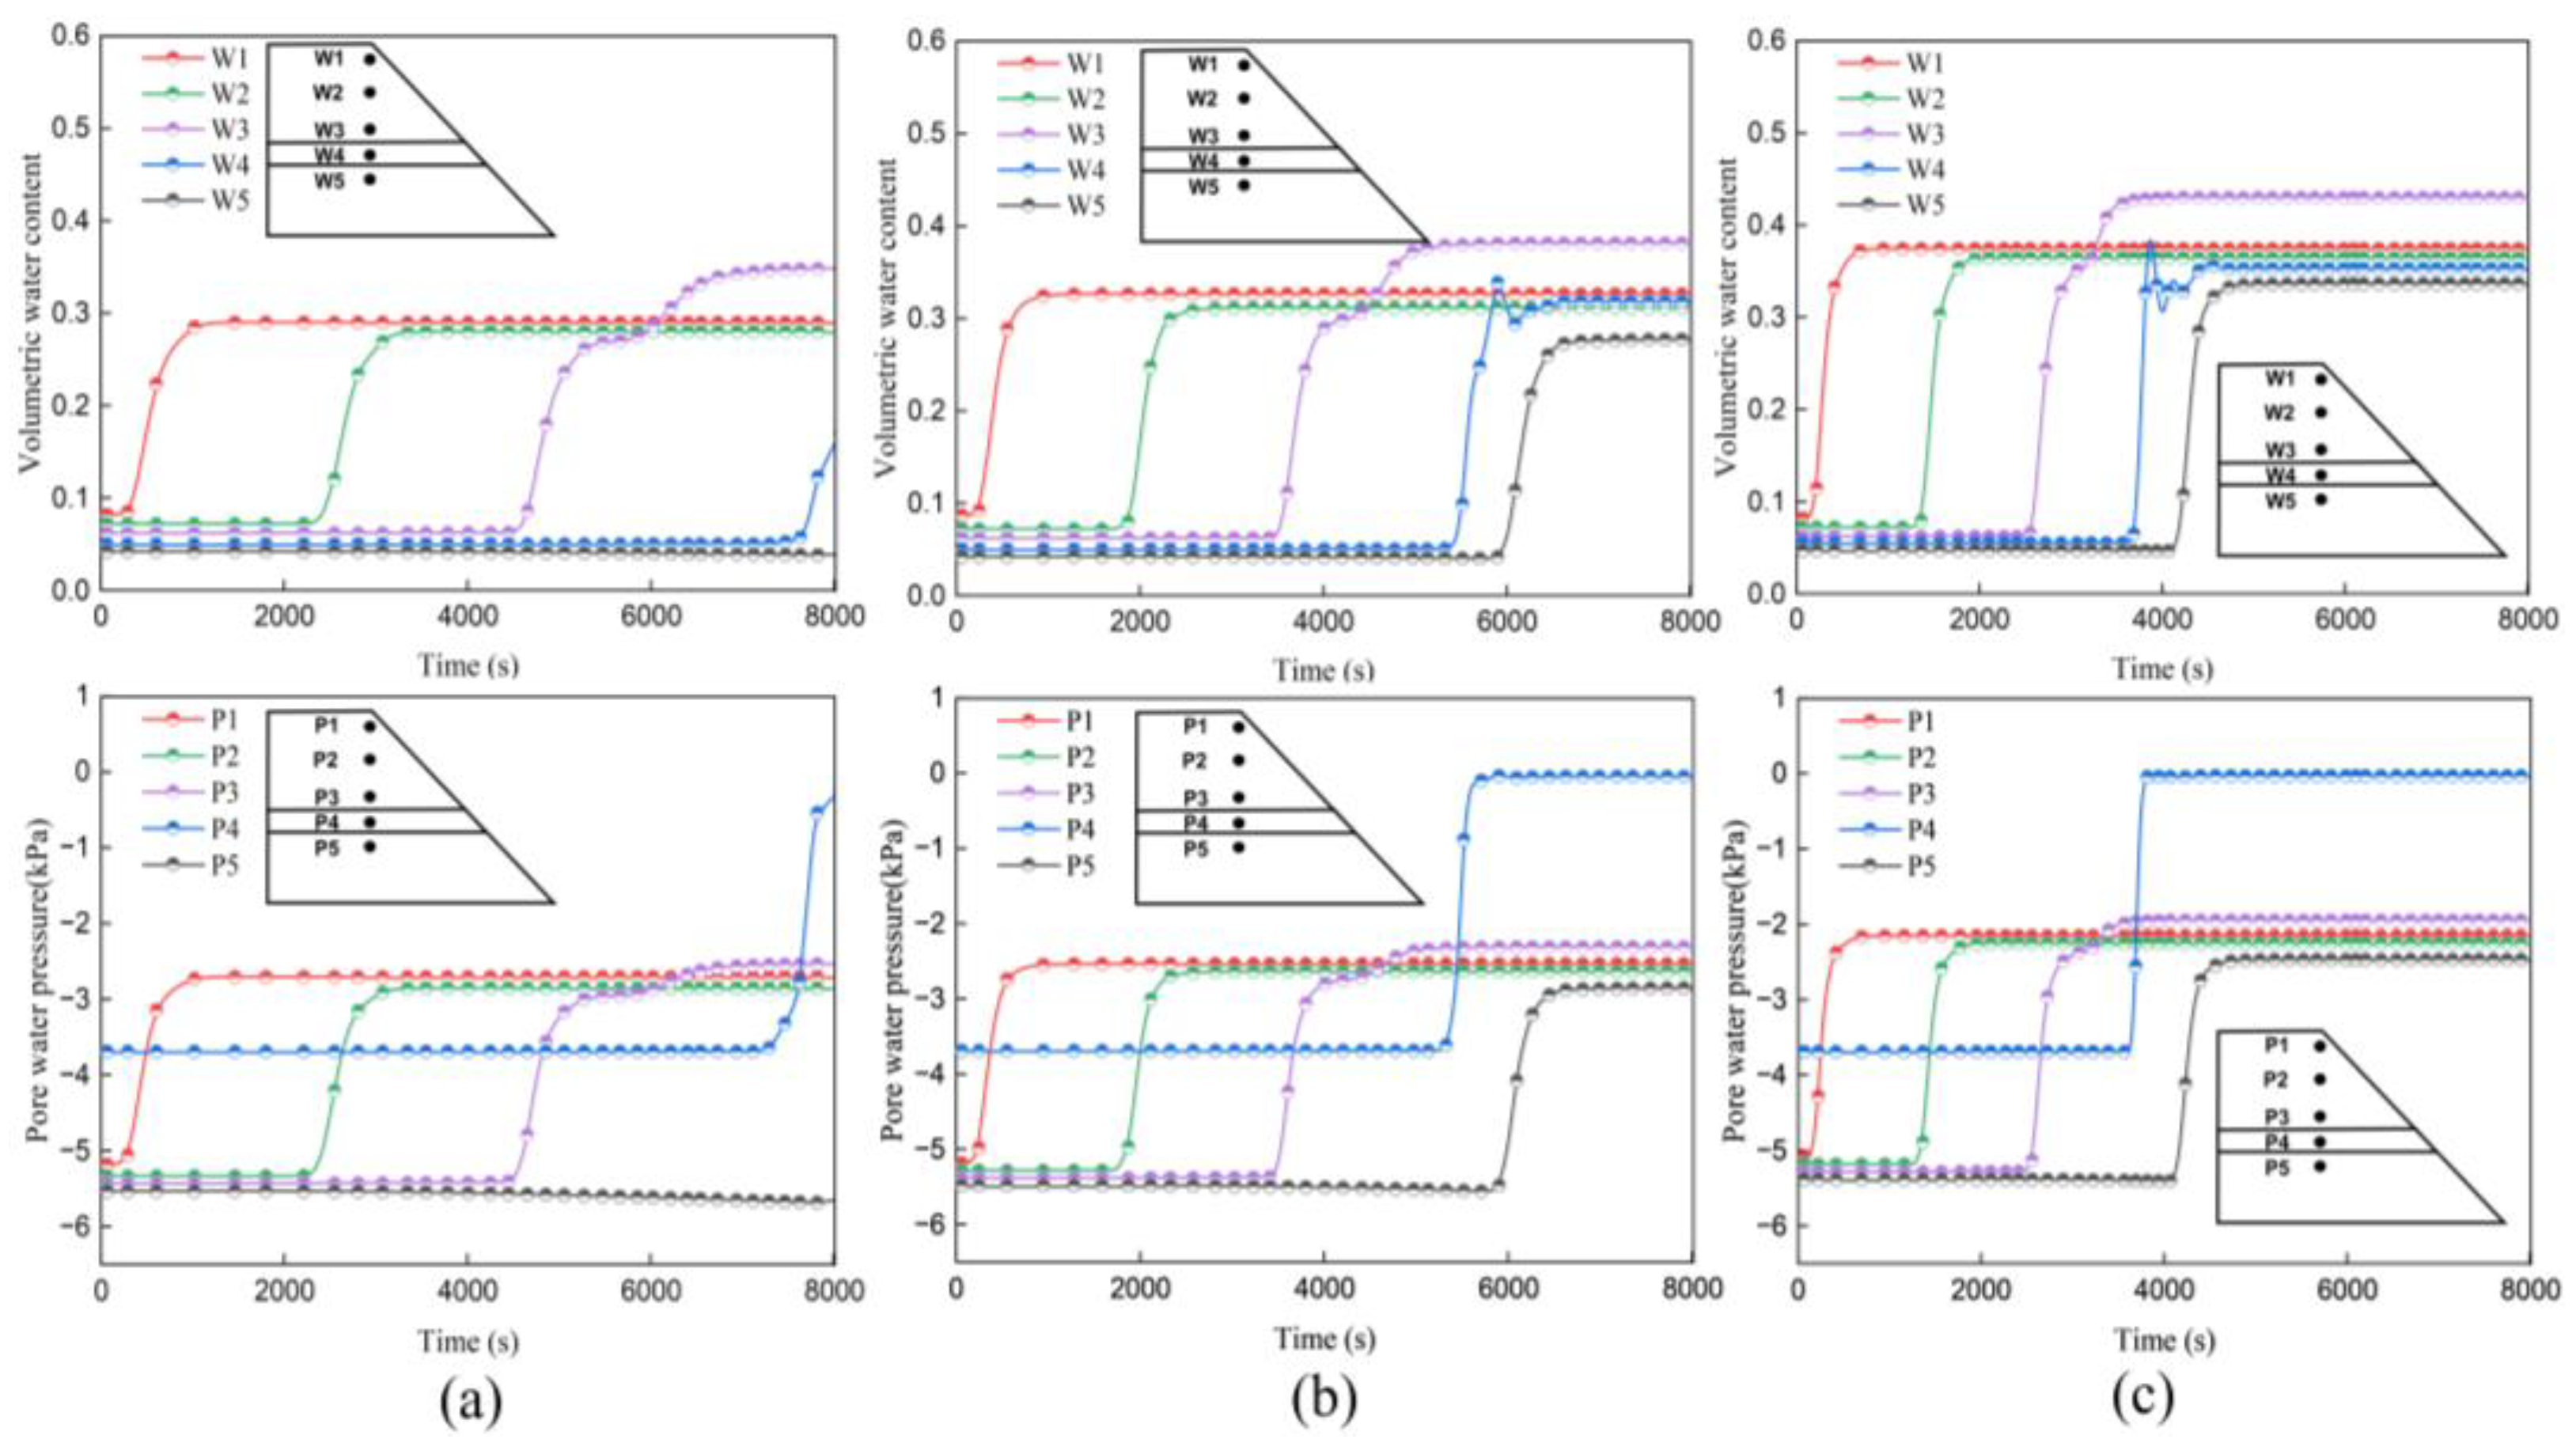
4.1. Profile Characterization of the Hydraulic Mechanisms

In this section, the rainwater infiltration process was simulated in multi-layered slopes at different rainfall intensities (30 mm/h, 45 mm/h, and 70 mm/h) and at different slope inclinations (7°, 15°, and 21°). Figure 3, Figure 4, Figure 5, Figure 6, Figure 7 and Figure 8 show the results for pore water pressure (PWP) and volumetric water content (VWC) at observation points in different cases and at different depths within the soil profile.
Figure 3 and Figure 4 show the PWP and VWC under different rainfall intensities at an inclination of 7°. During the two hours of precipitation, the VWC of the coarse-grained layer remained essentially constant at about 7% (see Figure 4a). Correspondingly, the pore water pressure at this location also remained at −5.8 kPa. (see Figure 3a). These results indicated that although rainfall wetted the overburden layer, the amount of water that infiltrated into the lower fine soil layer was negligible due to the blocking effect of capillaries. The highest water content zone in Figure 4 is in the upper fine soil layer at a depth of 25 cm, where the water content increases from 9% at 1.2 h to 51% at 1.5 h, a value that is much greater than in the rest of the slope. Further analysis showed that the water-holding capacity of the fine water layer was greatly increased due to the capillary barrier effect, resulting in excess water accumulating at the bottom of the fine layer. The pore water pressure is maximum at this location, up to 0.7 kPa.
At 1.8 h, a significant VWC increase could be observed in the coarse layer in case 4. In case 7, the increase in volumetric water content at this location at 1.2 h. This result suggests that rainwater infiltrated into the coarse layer under heavy rainfall conditions, which indicates that the capillary barrier effect failed, and the breakthrough occurred in this zone. And as rainfall intensity increased, the failure of the capillary barrier accelerated.
In addition, the results of the correlational analysis are illustrated in Figure 5 and Figure 6. The VWC at the bottom of the slope rose to 21% in 1.8 h (as shown in Figure 6c). Under the same rainfall intensity, the volumetric moisture content at the bottom at 1.8 h in case 7 (see Figure 4c) is much higher than that in case 8. This indicates that as the inclination increases, it takes longer for rainwater to reach the bottom of the slope.
From Figure 7a, it is evident that the PWP of the coarse layer remains relatively stable in case 3; with the increase in rainfall intensity, the PWP of the coarse layer gradually increases from −5.3 kPa at 0.9 h to −1.9 kPa at 1.8 h (as shown in Figure 7b), and it should be noted that the PWP of the coarse sand layer reaches −1.9 kPa earlier at 75 mm/h rainfall intensity, roughly at 1.5 h (see Figure 7c). Correspondingly, the VWC of the coarse sand layer also increases from 8% at 0.9 h to 23% at 1.8 h (see Figure 8b,c). At the end of the rainfall, the pore water pressure increases from −5.8 kPa at t = 0.3 h to 1.1 kPa (see Figure 7b), and the water content also increases from 8% at t = 0.3 h to 61% at t = 1.8 h (see Figure 8b). The VWC of the coarse layer does not show significant changes during this process, indicating that the capillary barrier is still effective and the infiltrating water is blocked above the interface.

4.2. Hydraulic Response in the Slope

Figure 9, Figure 10, Figure 11, Figure 12, Figure 13 and Figure 14 display the changes in VWC and PWP in the multi-layered slope as rainfall infiltrates.
At the beginning of the rainfall period, rainwater infiltration into the upper fine layer is approximately the same. Following the increase in the intensity of rainfall, the rate of infiltration of rainwater rises significantly. At 0.3 h, the wetting fronts for rainfall intensities of 75 mm/hour, 45 mm/hour, and 30 mm/hour were 9 cm, 7 cm, and 4 cm, respectively. With the prolongation of rainfall, the upper fine soil was gradually saturated, and the maximum water content was affected by the intensity of the rainfall; with 75 mm/h, 45 mm/h, and 30 mm/h rainfall intensity, the corresponding water content values were 41%, 34%, and 30%. The corresponding pore water pressures at saturation were, respectively, −0.7 kPa, −0.3 kPa, and 0.1 kPa. When the infiltration of rainwater reaches the interface of coarse and fine particles, the infiltration of rainwater is impeded, the capillary barrier effect starts to act, the maximum water content zone is above the interface, the zone is extended along the junction layer to the interior of the soil slope, and the capillary barrier is destroyed and rainwater begins to infiltrate into the lower fine layer when the PWP of the coarse soil layer grows to −1.7 kPa. The infiltration rates of rainwater in multi-layered slopes with different inclination angles are different. For the same rainfall intensity, the higher the inclination, the slower the infiltration rate of rainwater and the later the capillary barrier effect is destroyed.

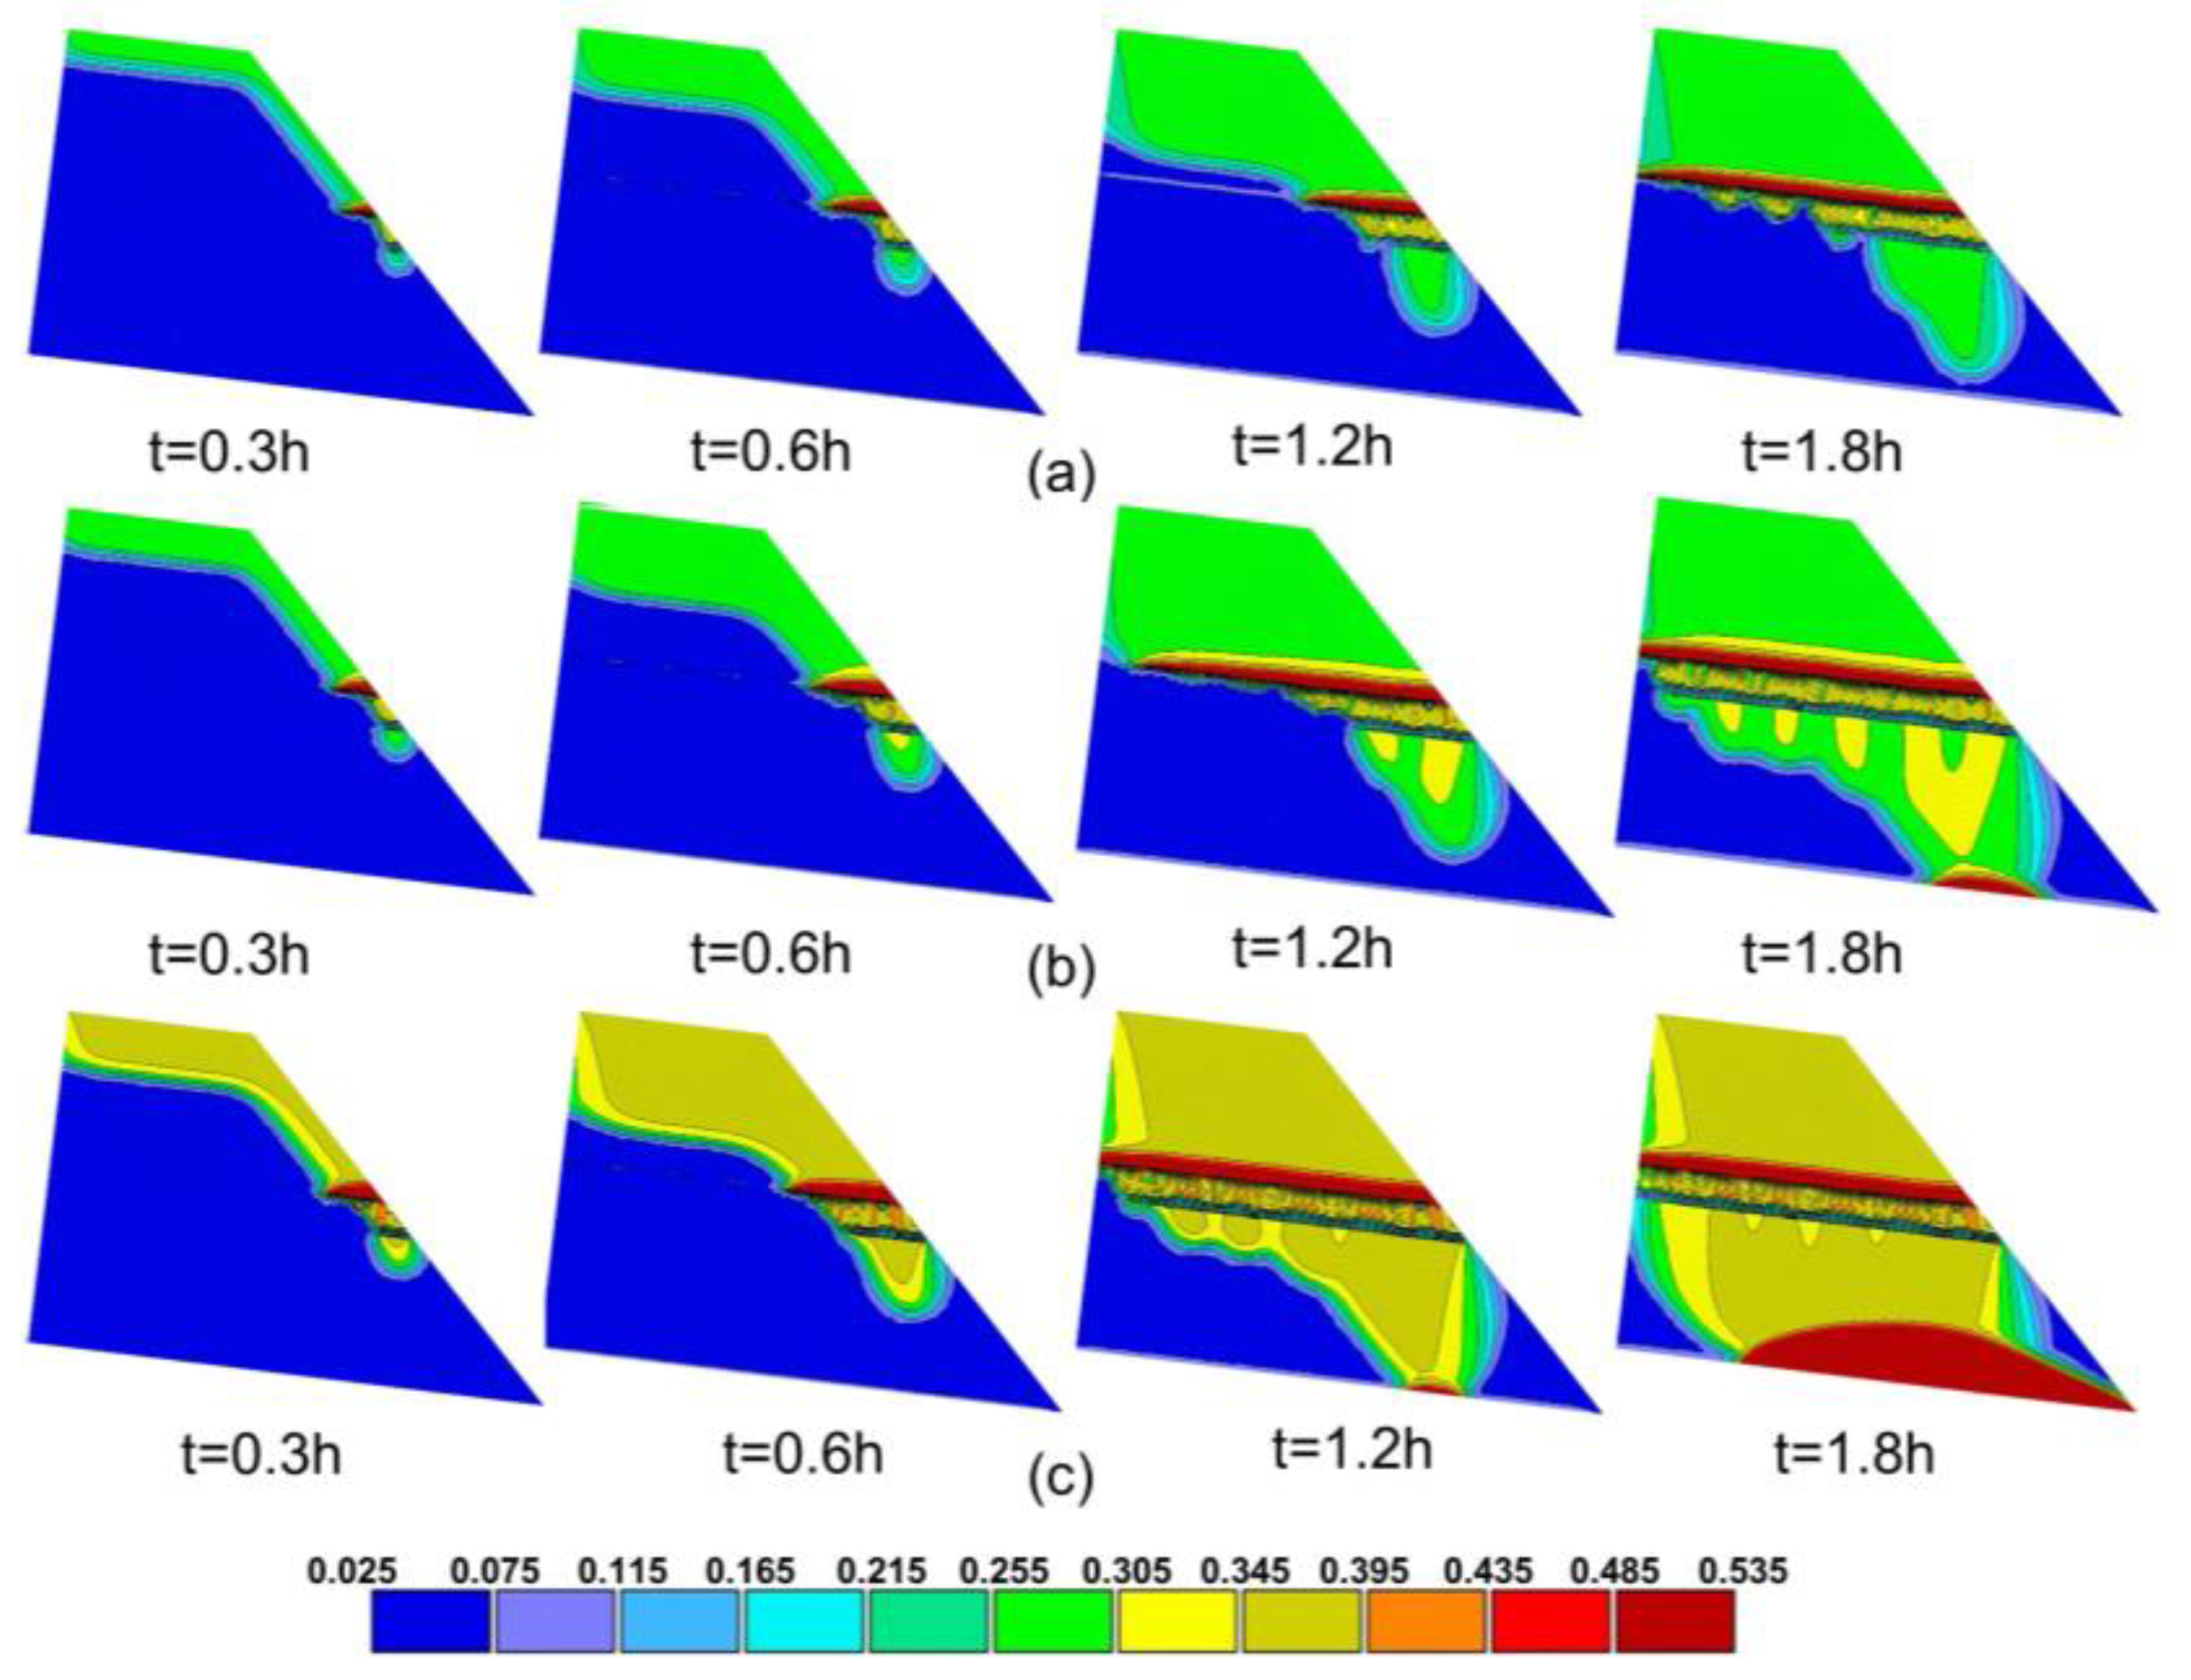
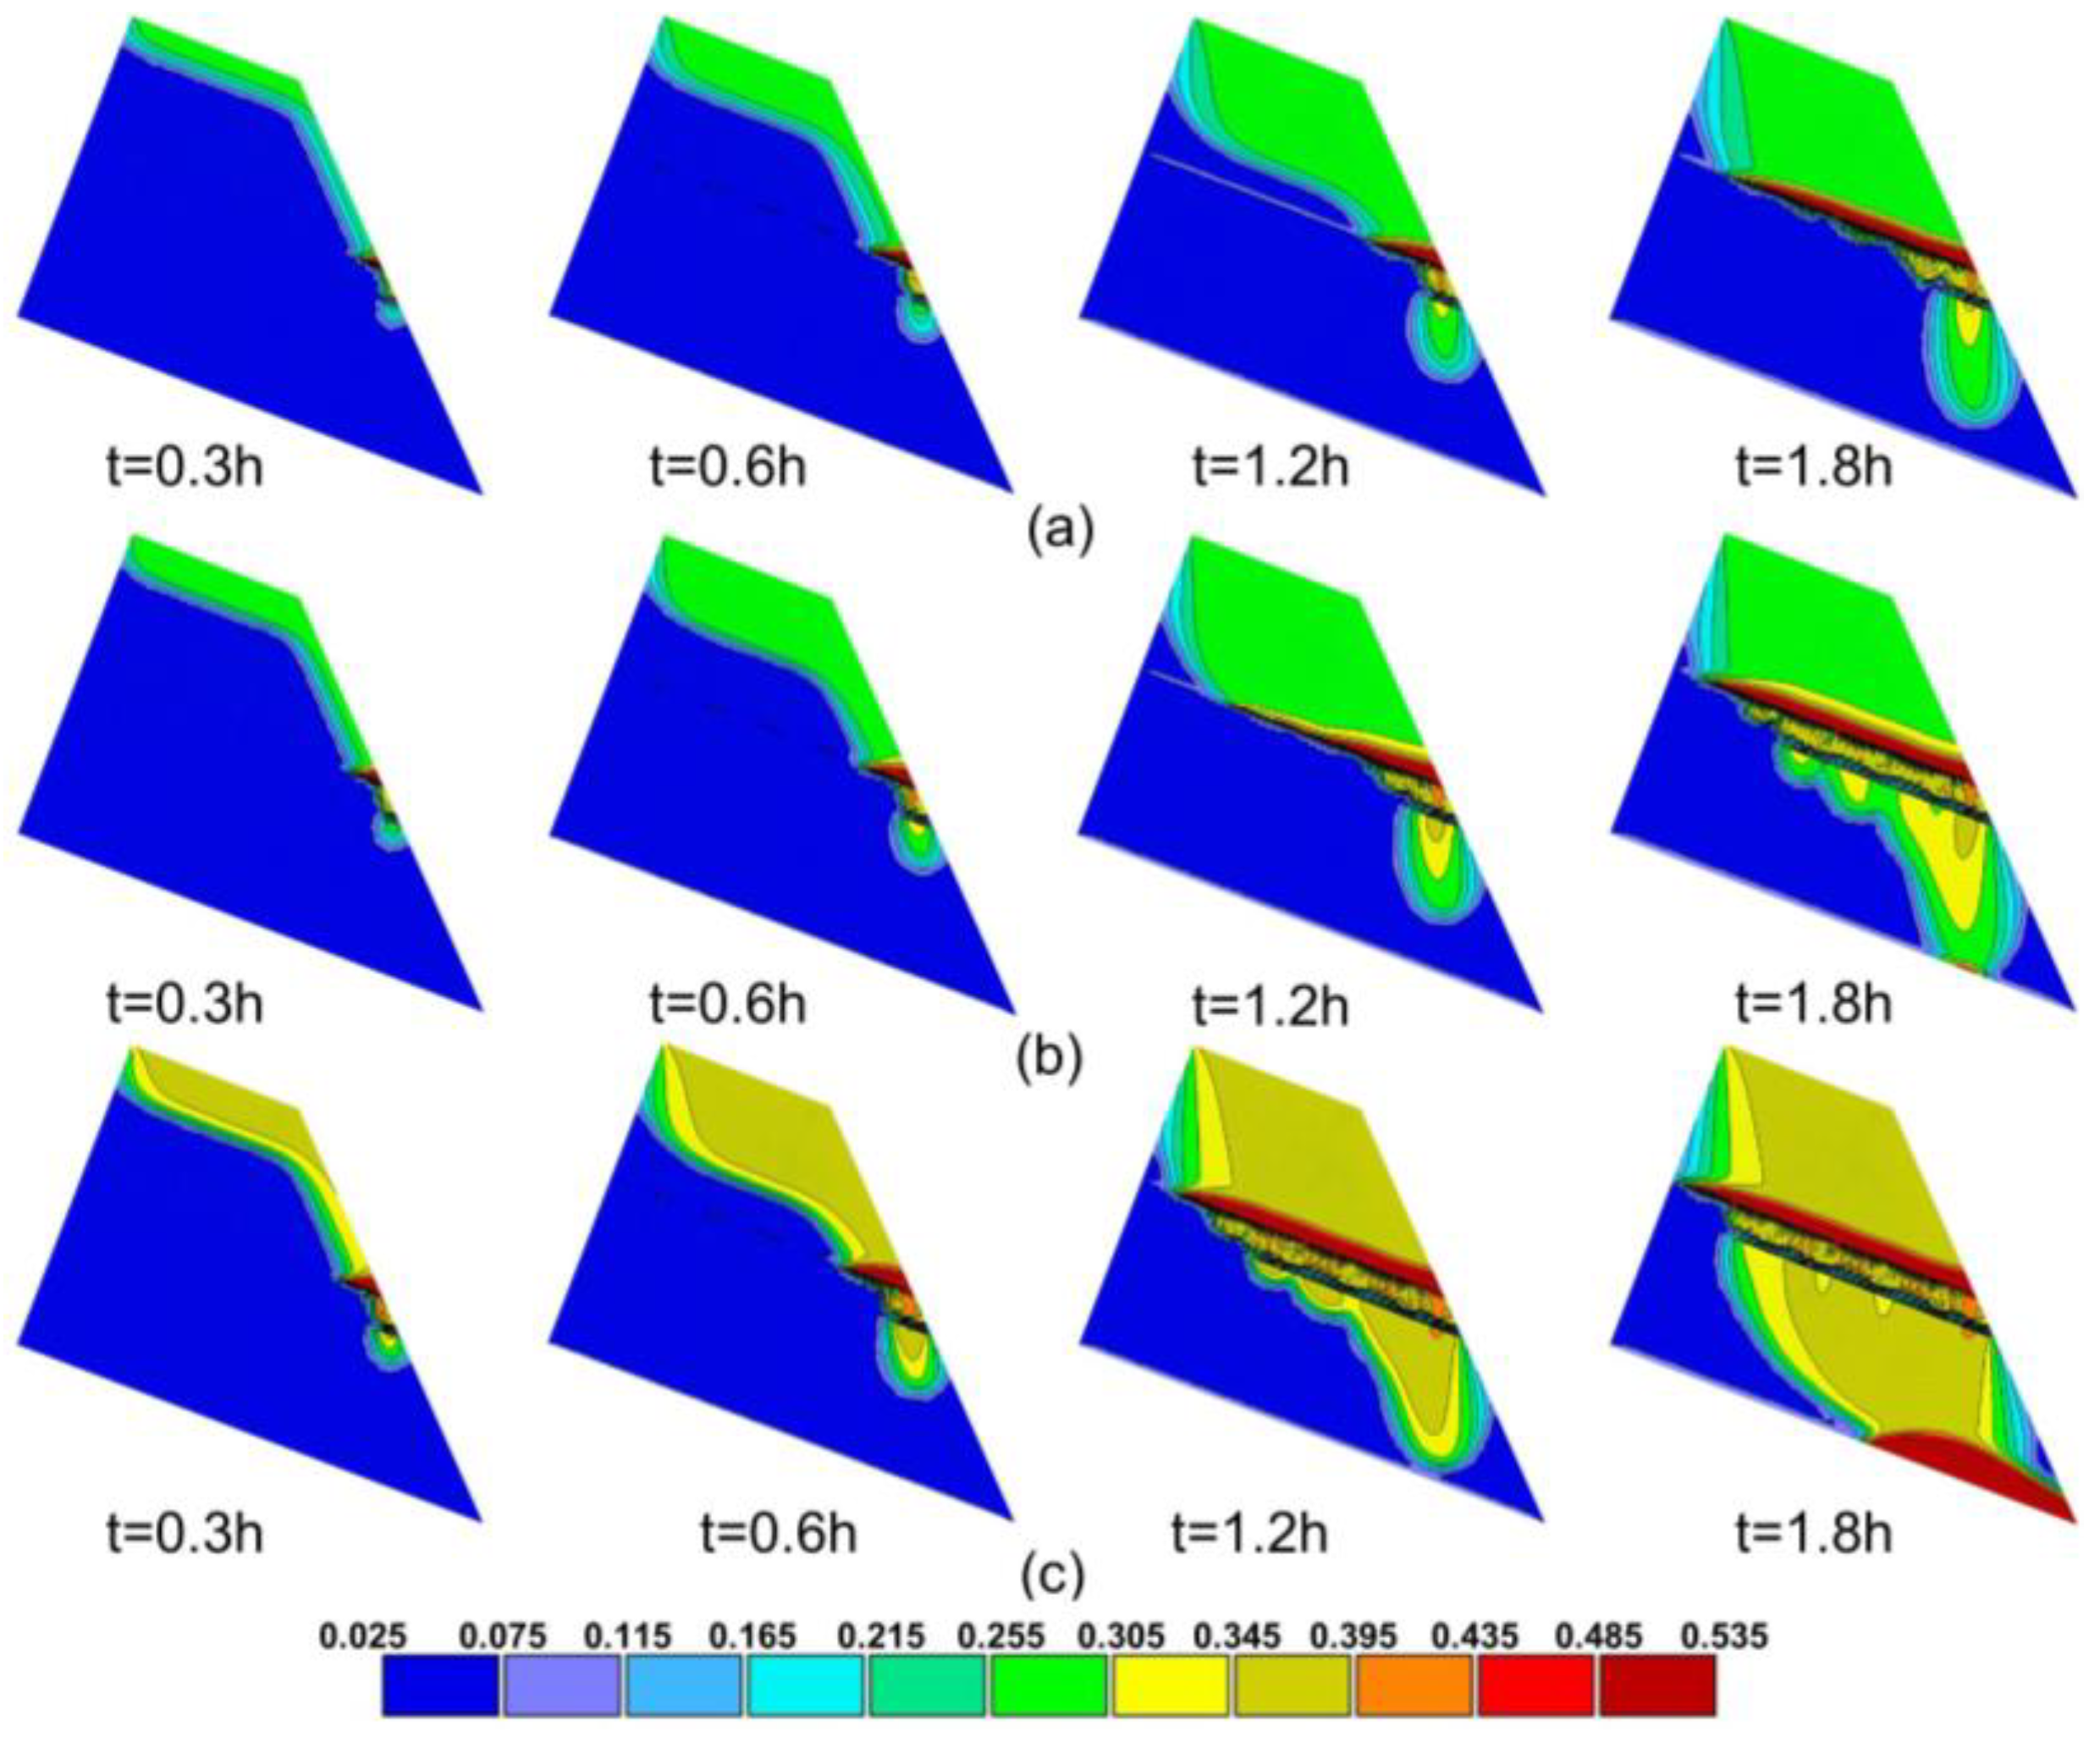
4.3. Infiltration Process in Multi-Layered Slope

Figure 15, Figure 16 and Figure 17 depict the variations in VWC and PWP with rainfall duration at each observation point. During the early stage of rainfall, the volumetric water content and pore water pressure at each observation point remained relatively constant. However, as rainfall continued, significant increases in VWC and PWP could be monitored at different depths in turn. Eventually, the VWC and PWP reached stable levels. By referring to Figure 15b, it is evident that the observation points W1 to W5 have maximum values of 31%, 31%, 38%, 37%, and 27%, respectively. In case 4, the rainfall infiltration wetting front sequentially reached observation points W1, W2, and W3. However, it took 5100 s for the rainfall infiltration wetting front to reach observation point W5 due to the capillary barrier effect. Subsequently, the volumetric water content at each observation point increased significantly until the capillary barrier effect failed, resulting in the water content reaching its maximum value.
Based on the information provided in Figure 17c, it is evident that as the intensity of rainfall increases, the wetting front arrives earlier at the same depth. Figure 15, Figure 16 and Figure 17 display that the increase in VWC at W3 is divided into two stages; one is a rapid increase which is related to the arrival of the wetting front, and the second stage is a slow increase related to the capillary barrier effect, where water accumulates at the bottom of the upper layer, and thus the VWC at W3 is higher than that at the other observation points. Figure 16 shows that the increase in PWP at W4 occurs slightly later than the increase in VWC. This phenomenon occurs because the capillary barrier works at the interface to block water above the coarse layer, resulting in the PWP increasing rapidly. The pressure distribution at the interface is continuous, and the PWP increase can be monitored at W4, which is the reason that the pore water pressure at W4 is higher than that at the other monitoring points.

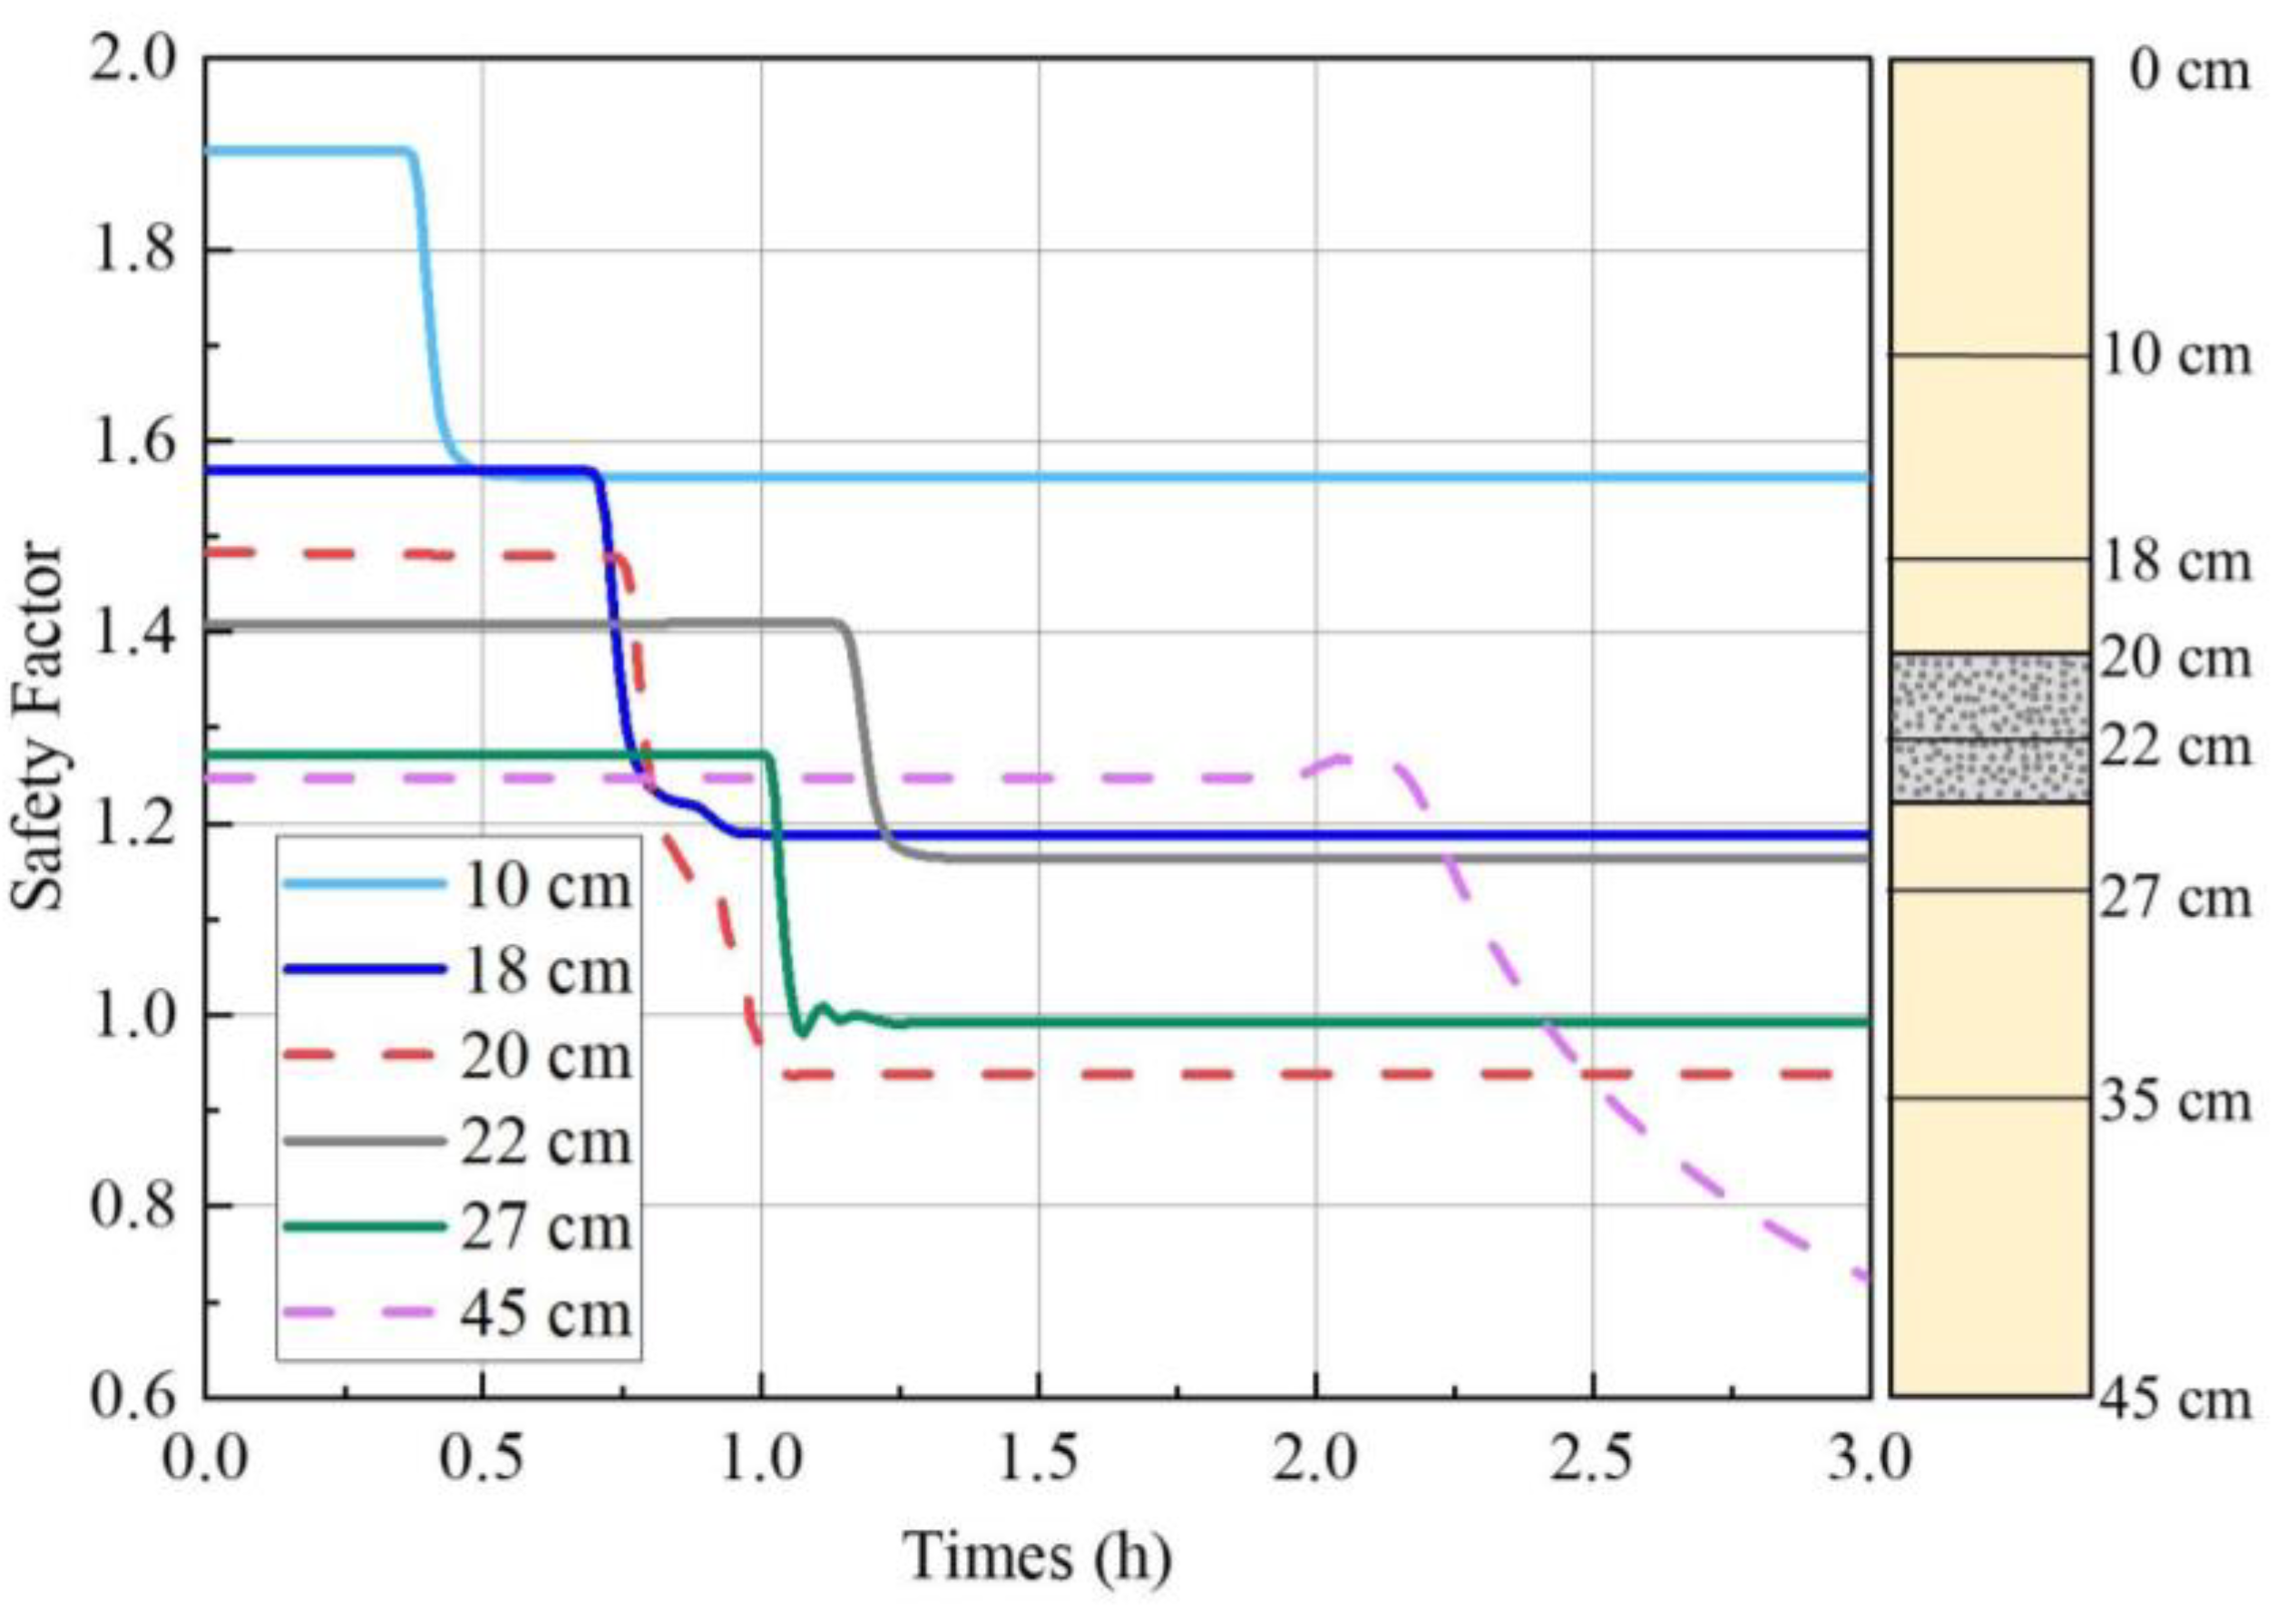
4.4. Slope Stability Analysis

The conventional slope stability approach can be enhanced to examine the stability of shallow slopes caused by rainfall in unsaturated circumstances by including the impact of suction stress on soil strength. The factor of safety (FOS) of unsaturated infinite slopes relies on integral of the Van Genuchthen–Mualem’s model [43] with the suction stress in unsaturated slopes. The suction stress can be calculated from the volumetric water content and pore water pressure with the following equations [44]:
σ s = u a u w   u a u w 0
σ s = u a u w 1 + α u a u w n n 1 / n u a u w 0
where α, n are empirical curve-fitting parameters related to unsaturated soil properties; α is the inverse of the air-entry pressure for water-saturated soil, n is the pore size distribution parameter, and ( u a u w ) is the matric suction.
The safety factor (FOS) for unsaturated slopes at depth Z below the surface under transient infiltration conditions at time t is given by the following equation [45,46,47]:
F O S = tan ϕ tan β + c σ s tan ϕ γ d + γ w θ Z sin β cos β
where ϕ is the angle of internal friction for effective stress, c is the soil cohesion for effective stress, γ d is the dry unit weight of the soil, γ w is the water unit weight, β is the slope angle, and Z is the depth of the soil.
Case 9 was selected for the multi-layered slope stability analysis as a typical case. Figure 18 shows the transient safety factor calculated for each observation point in the monitoring profile of the multi-layered slope. The higher initial FOS at the 10 cm and 18 cm depth locations is due to earth pressure, while the lower initial FOS at the 22 cm location is due to the fact that in addition to the earth pressure, it is also related to the effective cohesion of Silica No. 1, which is much lower than that of Silica No. 7. The decreases in the FOS at 10 cm and 18 cm after rainfall onset and then stagnation are due to the increases in the VWC and PWP of the soil due to the infiltrating water. At 0.78 h, the FOS at the interface began to sharply decrease to 1 at 0.98 h and the magnitude was much larger than that at all monitoring points except the bottom of the slope. An effect of the capillary barrier resulted in the accumulation of water at the interface, which led to a sharp increase in VWC and PWP at the bottom of the upper fine layer.
At 1.18 h, a reduction in the FOS was noticed at a depth of 27 cm. These reductions were mostly caused by the infiltration of rainfall. At a time of 1.9 h, a gradual decline in the FOS was detected at the lower observation location, indicating that precipitation was infiltrating the bottom of the slope. Due to the impermeable boundary condition at the bottom, the stability of the bottom was determined by the rise in the groundwater level. As the groundwater accumulated, the FOS gradually decreased. Eventually, the FOS dropped below 1, indicating instability at the bottom of the slope.
As previously mentioned, the existence of an intermediate coarse layer can significantly impact the alteration in pore water pressure during infiltration, as well as the distribution of water, thus affecting the factor of safety in localized areas and causing potential instability of multi-layered slopes in localized areas.
Rainfall intensities and slope inclined angle conditions are the key factors determining the seepage path and water distribution. In Figure 18, it can be seen that there is a significant decrease in the FOS at the interface compared to other areas, which means it can be considered a potentially hazardous surface. Given that the current numerical model was only tested in a simple scenario, it is logical to assume that if we were to apply it to a more complex slope shape or a steeper slope angle, the movement of water within the capillary barrier could have a detrimental impact on the interface, resulting in a sudden reduction in the local stability of the slope.

5. Conclusions

This paper presented the results of numerical model tests performed to study the hydrological mechanisms and slope stability of multi-layered slopes. Based on the results of this work, the following conclusions can be drawn:
The obtained results demonstrate that the underlying coarse layer significantly slowed the progression of the wetting front, causing water to accumulate in the overlying fine layer. The capillary barrier effect alters the seepage paths and the distribution of water content and pore water pressure within the multi-layered slopes, with higher pore water pressure and water content at the fine–coarse-grained layer contact.
Considering the differences in the inclined angles of the slopes (from 7 degrees to 21 degrees) and rainfall intensities (from 30 mm/h to 75 mm/h) in the tests, the results indicate that the presence of coarse layers in real slopes is highly likely to cause extensive downslope subsurface drainage and prevent saturation in the overlying finer layers.
In multi-layered slopes, slope failures are likely to occur at the junction of the upper fine layer and the underlying coarse soil layer. This is where the soil is expected to be most saturated and the factors that stabilize the soil are usually less effective compared to the surface soil. This phenomenon may account for the occurrence of exposed coarse particles in the origin regions of several landslides and why failure surfaces are frequently found at the base of the soil cover in simpler layered profiles.
These basic assumptions are applicable to idealized layered slopes that are uniform and continuous. In natural slopes with intricate shapes, the movement of water can be influenced by several factors such as complex morphologies, discontinuity in layers, and other small effects. These factors might cause the water flow to concentrate in some areas, potentially leading to failure in those specific locations. It should be noted that the relationship between permeability of the soils and rainfall intensity also influenced slope failure; further studies will focus on this aspect.

Author Contributions

Conceptualization, J.T.; methodology, J.T.; software, D.Z. and Z.M.; validation, S.Z., D.Z. and F.Z.; formal analysis, Z.M. and D.Z.; investigation, S.Z., X.Z. and J.M.; resources, J.T.; data curation, D.Z. and Z.M.; writing—original draft preparation, J.T. and Z.M.; writing—review and editing, J.T. and Z.M.; visualization, D.Z. and F.Z.; supervision, J.M. and X.Z.; project administration, J.T.; funding acquisition, J.T. All authors have read and agreed to the published version of the manuscript.

Funding

This research was funded by the National Natural Science Foundation of China (No. 42201079) and the Sichuan Province Natural Science Foundation (2024NSFSC0827).

Data Availability Statement

The data used to support the findings of this study are available from the corresponding author upon request.

Conflicts of Interest

The authors declare no conflicts of interest.

References

  1. Larsen, M. Rainfall-triggered landslides, anthropogenic hazards, and mitigation strategies. Adv. Geosci. 2008, 14, 147–153. [Google Scholar] [CrossRef]
  2. Zhang, J.; Tang, H.; Tan, Q.; Mao, M.; Zhou, B.; Zhang, Y. A generalized early warning criterion for the landslide risk assessment: Deformation probability index (DPI). Acta Geotech. 2024, 19, 2607–2627. [Google Scholar] [CrossRef]
  3. Olivares, L.; Picarelli, L. Shallow flowslides triggered by intense rainfalls on natural slopes covered by loose unsaturated pyroclastic soils. Géotechnique 2003, 53, 283–287. [Google Scholar] [CrossRef]
  4. Li, Y.; Xue, K.; Zhao, Y.; Wang, C.; Bi, J.; Wang, T.; Wang, S.; Zhang, B. Study on the stability and disaster mechanism of layered soil slopes under heavy rain. Bull. Eng. Geol. Environ. 2023, 82, 272. [Google Scholar] [CrossRef]
  5. Santoso, A.M.; Phoon, K.-K.; Quek, S.-T. Effects of soil spatial variability on rainfall-induced landslides. Comput. Struct. 2011, 89, 893–900. [Google Scholar] [CrossRef]
  6. Fang, K.; Fu, Y.; Tang, H.; Gao, T.; An, P.; Wu, Q. Landslide model tests with a miniature 2D principal stress (PS) sensor. J. Rock Mech. Geotech. Eng. 2024. [Google Scholar] [CrossRef]
  7. Zhang, J.; Lin, C.; Tang, H.; Wen, T.; Tannant, D.D.; Zhang, B. Input-parameter optimization using a SVR based ensemble model to predict landslide displacements in a reservoir area–A comparative study. Appl. Soft Comput. 2024, 150, 111107. [Google Scholar] [CrossRef]
  8. Fang, K.; Miao, M.; Tang, H.; Jia, S.; Dong, A.; An, P.; Zhang, B. Insights into the deformation and failure characteristic of a slope due to excavation through multi-field monitoring: A model test. Acta Geotech. 2023, 18, 1001–1024. [Google Scholar] [CrossRef]
  9. Fourie, A. Predicting rainfall-induced slope instability. Proc. Inst. Civ. Eng.-Geotech. Eng. 1996, 119, 211–218. [Google Scholar] [CrossRef]
  10. Fang, K.; Tang, H.; Li, C.; Su, X.; An, P.; Sun, S. Centrifuge modelling of landslides and landslide hazard mitigation: A review. Geosci. Front. 2023, 14, 101493. [Google Scholar] [CrossRef]
  11. Polemio, M.; Petrucci, O. Rainfall as a Landslide Triggering Factor an Overview of Recent International Research; Thomas Telford Ltd.: London, UK, 2000; pp. 1219–1226. [Google Scholar]
  12. Guida, D.; Romanzi, G.; Nocera, N.; Sorbino, G. A preliminary model for the landslides of May 1998 in Campania Region L. Cascini. Geotech. Hard Soil 2000, 3, 1623. [Google Scholar]
  13. Miyabuchi, Y.; Maeno, F.; Nakada, S. The October 16, 2013 rainfall-induced landslides and associated lahars at Izu Oshima Volcano, Japan. J. Volcanol. Geotherm. Res. 2015, 302, 242–256. [Google Scholar] [CrossRef]
  14. Yang, H.-Q.; Zhang, L. Bayesian back analysis of unsaturated hydraulic parameters for rainfall-induced slope failure: A review. Earth-Sci. Rev. 2024, 251, 104714. [Google Scholar] [CrossRef]
  15. Huang, M.; Lee Barbour, S.; Elshorbagy, A.; Zettl, J.D.; Cheng Si, B. Infiltration and drainage processes in multi-layered coarse soils. Can. J. Soil Sci. 2011, 91, 169–183. [Google Scholar] [CrossRef]
  16. Damiano, E. Effects of layering on triggering mechanisms of rainfall-induced landslides in unsaturated pyroclastic granular soils. Can. Geotech. J. 2019, 56, 1278–1290. [Google Scholar] [CrossRef]
  17. Ross, B. The diversion capacity of capillary barriers. Water Resour. Res. 1990, 26, 2625–2629. [Google Scholar] [CrossRef]
  18. Warrick, A.; Wierenga, P.; Pan, L. Downward water flow through sloping layers in the vadose zone: Analytical solutions for diversions. J. Hydrol. 1997, 192, 321–337. [Google Scholar] [CrossRef]
  19. Aubertin, M.; Cifuentes, E.; Apithy, S.; Bussière, B.; Molson, J.; Chapuis, R.P. Analyses of water diversion along inclined covers with capillary barrier effects. Can. Geotech. J. 2009, 46, 1146–1164. [Google Scholar] [CrossRef]
  20. Zhan, T.L.; Li, H.; Jia, G.; Chen, Y.; Fredlund, D. Physical and numerical study of lateral diversion by three-layer inclined capillary barrier covers under humid climatic conditions. Can. Geotech. J. 2014, 51, 1438–1448. [Google Scholar] [CrossRef]
  21. Mancarella, D.; Doglioni, A.; Simeone, V. On Capillary Barrier Effects And Debris Slide Triggering In Unsaturated Layered Covers. Eng. Geol. 2012, 147–148, 14–27. [Google Scholar] [CrossRef]
  22. Dou, Z.; Liu, Y.; Zhang, X.; Wang, Y.; Chen, Z.; Wang, J.; Zhou, Z.; Xiong, H. Influence of layer transition zone on rainfall-induced instability of multilayered slope. Lithosphere 2021, 2021, 2277284. [Google Scholar] [CrossRef]
  23. Junfeng, T. Physical Model Experiments on Water Infiltration and Failure Modes in Multi-Layered Slopes under Heavy Rainfall. Appl. Sci. 2020, 10, 3458. [Google Scholar] [CrossRef]
  24. Cho, S.E. Infiltration analysis to evaluate the surficial stability of two-layered slopes considering rainfall characteristics. Eng. Geol. 2009, 105, 32–43. [Google Scholar] [CrossRef]
  25. Mburu, J.W.; Li, A.-J.; Lin, H.-D.; Lu, C.-W. Investigations of unsaturated slopes subjected to rainfall infiltration using numerical approaches—A parametric study and comparative review. Sustainability 2022, 14, 14465. [Google Scholar] [CrossRef]
  26. Stormont, J.C.; Anderson, C.E. Capillary Barrier Effect from Underlying Coarser Soil Layer. J. Geotech. Geoenviron. Eng. 1999, 125, 641–648. [Google Scholar] [CrossRef]
  27. Parent, S.-É.; Cabral, A. Design of inclined covers with capillary barrier effect. Geotech. Geol. Eng. 2006, 24, 689–710. [Google Scholar] [CrossRef]
  28. Al-Mayahi, A.K.; Al-Ismaily, S.S.; Breitenstein, D.; Al-Busaidi, H.S.; Al-Maktoumi, A.K.; Lehmann, P.; Or, D.; Kacimov, A.R.; Fahrni, S.; Al-Shukaili, A.H. Soil water distribution and dynamics across prescribed capillary barriers under evaporating surfaces. Biosyst. Eng. 2023, 226, 55–70. [Google Scholar] [CrossRef]
  29. Stormont, J.C.; Morris, C.E. Method to estimate water storage capacity of capillary barriers. J. Geotech. Geoenviron. Eng. 1998, 124, 297–302. [Google Scholar] [CrossRef]
  30. Lima, M.J.; Azevedo, M.M.; Zornberg, J.G.; Palmeira, E.M. Capillary barriers incorporating non-woven geotextiles. Environ. Geotech. 2017, 5, 168–175. [Google Scholar] [CrossRef]
  31. Bussière, B.; Aubertin, M.; Chapuis, R.P. A laboratory set up to evaluate the hydraulic behavior of inclined capillary barriers. In Physical Modelling in Geotechnics; Routledge: London, UK, 2022; pp. 391–396. [Google Scholar]
  32. Aubertin, M.; Cifuentes, E.; Martin, V.; Apithy, S.; Bussière, B.; Molson, J.; Chapuis, R.P.; Maqsoud, A. An investigation of factors that influence the water diversion capacity of inclined covers with capillary barrier effects. In Unsaturated Soils 2006; ASCE: Reston, VA, USA, 2006; pp. 613–624. [Google Scholar]
  33. Hübner, R.; Günther, T.; Heller, K.; Noell, U.; Kleber, A. Impacts of a capillary barrier on infiltration and subsurface stormflow in layered slope deposits monitored with 3-D ERT and hydrometric measurements. Hydrol. Earth Syst. Sci. 2017, 21, 5181–5199. [Google Scholar] [CrossRef]
  34. Morris, C.E.; Stormont, J.C. Evaluation of numerical simulations of capillary barrier field tests. Geotech. Geol. Eng. 1998, 16, 201–213. [Google Scholar] [CrossRef]
  35. Capparelli, G.; Damiano, E.; Greco, R.; Olivares, L.; Spolverino, G. Physical modeling investigation of rainfall infiltration in steep layered volcanoclastic slopes. J. Hydrol. 2020, 580, 124199. [Google Scholar] [CrossRef]
  36. Fredlund, D.G.; Rahardjo, H. Soil Mechanics for Unsaturated Soils; John Wiley & Sons: Hoboken, NJ, USA, 1993. [Google Scholar]
  37. Fredlund, D.G.; Xing, A.; Fredlund, M.; Barbour, S. The relationship of the unsaturated soil shear strength to the soil-water characteristic curve. Can. Geotech. J. 1996, 33, 440–448. [Google Scholar] [CrossRef]
  38. Chen, R.; Liu, J.; Ng, C.W.; Chen, Z.K. Influence of slope angle on water flow in a three-layer capillary barrier soil cover under heavy rainfall. Soil Sci. Soc. Am. J. 2019, 83, 1637–1647. [Google Scholar] [CrossRef]
  39. Wang, Y.; Chai, J.; Cao, J.; Qin, Y.; Xu, Z.; Zhang, X. Effects of seepage on a three-layered slope and its stability analysis under rainfall conditions. Nat. Hazards 2020, 102, 1269–1278. [Google Scholar] [CrossRef]
  40. Junfeng, T.; Taro, U.; Shangning, T.; Dong, H.; Jiren, X. Water movement and deformation in unsaturated multi-layered slope under heavy rainfall. GEOMATE J. 2020, 19, 174–181. [Google Scholar] [CrossRef]
  41. Tang, J.; Uchimura, T.; Tao, S.; Toda, T. Water movement in unsaturated multi-layered slope under heavy rainfall conditions in wetting and dry process. Jpn. Geotech. Soc. Spec. Publ. 2020, 8, 303–310. [Google Scholar] [CrossRef]
  42. Mualem, Y. A new model for predicting the hydraulic conductivity of unsaturated porous media. Water Resour. Res. 1976, 12, 513–522. [Google Scholar] [CrossRef]
  43. Van Genuchten, M.T. A closed-form equation for predicting the hydraulic conductivity of unsaturated soils. Soil Sci. Soc. Am. J. 1980, 44, 892–898. [Google Scholar] [CrossRef]
  44. Oh, S.; Lu, N. Slope stability analysis under unsaturated conditions: Case studies of rainfall-induced failure of cut slopes. Eng. Geol. 2015, 184, 96–103. [Google Scholar] [CrossRef]
  45. Yang, Z.; Cai, H.; Shao, W.; Huang, D.; Uchimura, T.; Lei, X.; Tian, H.; Qiao, J. Clarifying the hydrological mechanisms and thresholds for rainfall-induced landslide: In situ monitoring of big data to unsaturated slope stability analysis. Bull. Eng. Geol. Environ. 2019, 78, 2139–2150. [Google Scholar] [CrossRef]
  46. Baum, R.L.; Godt, J.W.; Savage, W.Z. Estimating the timing and location of shallow rainfall-induced landslides using a model for transient, unsaturated infiltration. J. Geophys. Res. Earth Surf. 2010, 115, F03013. [Google Scholar] [CrossRef]
  47. Lu, N.; Godt, J.W. Hillslope Hydrology and Stability; Cambridge University Press: Cambridge, UK, 2013. [Google Scholar]
Figure 1. (a) Grain size distribution of soils in numerical model tests. (b) Unsaturated hydraulic conductivity of Silica No. 1 and Silica No. 7.
Water 16 02422 g001
Figure 2. (a) Numerical simulation model; (b) finite element distribution.
Water 16 02422 g002
Figure 3. Profile of pore water pressure along the depth in the slope. (a) Case 1; (b) case 4; (c) case 7.
Water 16 02422 g003
Figure 4. Profile of volumetric water content along the depth in the slope. (a) Case 1; (b) case 4; (c) case 7.
Water 16 02422 g004
Figure 5. Profile of pore water pressure along the depth in the slope. (a) Case 2; (b) case 5; (c) case 8.
Water 16 02422 g005
Figure 6. Profile of volumetric water content along the depth in the slope. (a) Case 2; (b) case 5; (c) case 8.
Water 16 02422 g006
Figure 7. Profile of pore water pressure along the depth in the slope. (a) Case 3; (b) case 6; (c) case 9.
Water 16 02422 g007
Figure 8. Profile of volumetric water content along the depth in the slope. (a) Case 3; (b) case 6; (c) case 9.
Water 16 02422 g008
Figure 9. Change in volumetric water content distribution with time in the numerical simulation. (a) Case 1; (b) case 4; (c) case 7.
Water 16 02422 g009
Figure 10. Change in pore water pressure with time in the numerical simulation. (a) Case 1; (b) case 4; (c) case 7.
Water 16 02422 g010
Figure 11. Change in volumetric water content distribution with time in the numerical simulation. (a) Case 2; (b) case 5; (c) case 8.
Water 16 02422 g011
Figure 12. Change in pore water pressure with time in the numerical simulation. (a) Case 2; (b) case 5; (c) case 8.
Water 16 02422 g012
Figure 13. Change in volumetric water content distribution with time in the numerical simulation. (a) Case 3; (b) case 6; (c) case 9.
Water 16 02422 g013
Figure 14. Change in pore water pressure with time in the numerical simulation. (a) Case 3; (b) case 6; (c) case 9.
Water 16 02422 g014
Figure 15. VWC and PWP as functions of time at each measurement point in the slope. (a) Case 1; (b) case 4; (c) case 7.
Water 16 02422 g015
Figure 16. VWC and PWP as functions of time at each measurement point in the slope. (a) Case 2; (b) case 5; (c) case 8.
Water 16 02422 g016
Figure 17. VWC and PWP as functions of time at each measurement point in the slope. (a) Case 3; (b) case 6; (c) case 9.
Water 16 02422 g017
Figure 18. Safety factor as a function of time at each observation point on a 21° slope (case 9).
Water 16 02422 g018
Table 1. Basic physical properties of soft soil samples.
DescriptionSilica No. 7Silica No. 1
Specific gravity Gs2.632.62
Gravel content (>4.75 mm; %)097.13
Sand content (%)87.312.86
Fine content (<0.075 mm; %)11.640
D50 (mm)0.1523.52
c (kPa)6.260.8
ϕ 37.79°41°
Table 2. The soil parameters used for numerical simulation.
MaterialsNameθr [−]θs [−]α [1/cm]n [−] K s [cm/h]
1S10.0010.4432.21.42100
2S70.010.530.414.0639
Table 3. General information for numerical simulations.
GroupExperimentSediment TypeNo. of LayersInclination (°)Rainfall Intensity
Group ICase 1Silica No. 7, Silica No. 13730 mm/h
Case 2Silica No. 7, Silica No. 131530 mm/h
Case 3Silica No. 7, Silica No. 132130 mm/h
Group IICase 4Silica No. 7, Silica No. 13745 mm/h
Case 5Silica No. 7, Silica No. 131545 mm/h
Case 6Silica No. 7, Silica No. 132145 mm/h
Group IIICase 7Silica No. 7, Silica No. 13775 mm/h
Case 8Silica No. 7, Silica No. 131575 mm/h
Case 9Silica No. 7, Silica No. 132175 mm/h
Disclaimer/Publisher’s Note: The statements, opinions and data contained in all publications are solely those of the individual author(s) and contributor(s) and not of MDPI and/or the editor(s). MDPI and/or the editor(s) disclaim responsibility for any injury to people or property resulting from any ideas, methods, instructions or products referred to in the content.

