Article

High-Efficiency Hydrogen Recovery from Corn Straw Hydrolysate Using Functional Bacteria and Negative Pressure with Microbial Electrolysis Cells

1
State Key Laboratory of Urban Water Resources and Environment, School of Environment, Harbin Institute of Technology, Harbin 150090, China
2
The Key Laboratory of Water and Sediment Sciences, Ministry of Education, College of Environmental Sciences and Engineering, Peking University, No. 5 Yiheyuan Road, Haidian District, Beijing 100871, China
3
Department of Air Protection, Faculty of Energy and Environmental Engineering, Silesian University of Technology, Konarskiego 22B, 44-100 Gliwice, Poland
*
Authors to whom correspondence should be addressed.
Water 2024, 16(17), 2423; https://doi.org/10.3390/w16172423
Submission received: 29 July 2024 / Revised: 18 August 2024 / Accepted: 21 August 2024 / Published: 27 August 2024

Abstract

:
This study attempts to overcome the challenges associated with the degradation of complex organic substances like corn straw hydrolysate in hydrogen recovery by strategically enriching functional microbial communities in single-chamber cubic microbial electrolysis cells (MECs). We applied negative pressure, using acetate or xylose as electron donors, to mitigate the hydrogen sink issues caused by methanogens. This innovative method significantly enhanced MEC performance. MECs enriched with xylose demonstrated superior performance, achieving a hydrogen production rate 3.5 times higher than that achieved by those enriched with acetate. Under negative pressure, hydrogen production in N-XyHy10 reached 0.912 ± 0.08 LH2/L MEC/D, which was 6.7 times higher than in the passive-pressure MECs (XyHy10). This advancement also resulted in substantial increases in current density (73%), energy efficiency (800%), and overall energy efficiency (540%) compared with MECs operated under passive pressure with 10% hydrolysate feed. The enrichment of polysaccharide-degrading bacteria such as Citrobacter and Pseudomonas under negative pressure underscores the potential for their industrial application in harnessing complex organic substrates for bioenergy production in single-chamber MECs. This is a promising approach to scaling up bioenergy recovery processes. The findings of this research study contribute significantly to the field by demonstrating the efficacy of negative pressure in enhancing microbial activity and energy recovery, thereby offering a promising strategy for improving bioenergy production efficiency in industries.

1. Introduction

As the world population multiplies continuously, some crucial issues, such as global warming, energy, and water crises, rise proportionally. A total of 86% of global energy consumption depends on fossil fuels; particularly, 95% of transport depends on oil [1]. However, fossil fuels are non-sustainable resources that will run out eventually. Moreover, the use of fossil fuels is directly linked to global warming and its effects on human health and on the ecosystems of this planet. This has triggered researchers to find renewable alternatives to meet our growing energy demand. Hydrogen exhibits the best potential as an alternative energy carrier with clean, sustainable, and renewable energy sources, and it has the highest energy content, 120–146 MJ/kg for H2, compared with other possible biofuels, such as gasoline, at 44 MJ/kg, and methane, at 50 MJ/kg [2].
While the conventional wastewater treatment process is energy-consuming, the organic compounds in wastewater can help in bioenergy production, wastewater surveillance, and the recovery of value-added byproducts, because wastewater contains a high amount of energy [3,4]. We need a technology in which biodegradable organic compounds can be oxidized by microorganisms and generate direct energy in the form of gas (H2). Biological H2 production offers carbon neutrality, high energy recovery, low external energy demand, and renewable H2. It can be achieved in three major ways: photosynthesis, fermentation, and microbial electrolysis cells. Photosynthetic H2 production would be the ultimate source of H2, because it uses direct sunlight as the energy source. But it requires advanced genetic engineering to couple an oxygen-tolerant hydrogenase to the photosynthetic electron transport chain. Dark fermentation offers a high H2 production rate, but most of its electron/energy is directed to other organic products, which causes low H2 recovery [5].
The microbial electrolysis cell (MEC) is an efficient biohydrogen-producing technology which produces completely clean and sustainable energy from renewable biomass (organic waste) and wastewater. The advantages of MECs over other conventional methods of H2 production (photo fermentation, dark fermentation, water bio-photolysis, and water electrolysis) are multifold. MECs require a much lower energy input, 0.6–1 kWh/m3-H2, to produce H2, in comparison to the typical energy requirement of 4.5–50.6 kWh/m3-H2 for water electrolysis. The maximum energy and thermal energy yields in MECs are ten times those of water electrolysis [6,7]. The theoretical hydrogen yield is three times higher in MECs (12 mol H2 mol−1-glucose) compared with dark fermentation (4 mol H2 mol−1-glucose). The reported H2 recovery rate of MECs is 67–91%, equivalent to 8–11 mol H2 mol−1-glucose, in contrast to only 2.5 mol H2 mol−1-glucose (~20% of the 12 mol of H2) for dark fermentation [5,8].
Hydrogen production using microorganisms has a major advantage, in that it can use a wide range of organic waste as the substrate, simultaneously reducing the cost of the bioprocess operation and helping in the bioremediation of waste. Lignocellulosic waste, such as corn straw, wheat straw, and wood residue, is the most abundant biomass on this planet. It mainly consists of polymers (e.g., cellulose, hemicellulose, and lignin), which are recalcitrant materials required to make raw material accessible to hydrolytic enzymes and microorganisms. The main methods adopted to break these polymers down are chemical decomposition, chemical photocatalytic degradation, enzymatic degradation, and hydrothermal degradation. Due to lack of stability in the enzymatic process and the hazardous byproducts of the chemical pretreatment process, hydrothermal pretreatment can be one of the most effective processes to degrade these polymers [9,10]. Hydrothermal pretreatment usually leads to the partial breakdown of lignin and hemicellulose-derived sugars. During the pretreatment, various unwanted byproducts (e.g., phenolic compounds, furan aldehyde, and aliphatic acid) also contain hydrolysates, which inhibits both fermentative microorganisms and cellulose-degrading enzymes. Hydrolysates are common in organic wastewater in the lignocellulosic waste industry. Hydrolysates from the hydrothermal treatment of lignocellulosic materials like corn/rice straw contain a high proportion of polysaccharides such as cellulose, hemicellulose, and lignin, but an elevated concentration of hydrolysates can be toxic due to unwanted inhibitors, so it must be treated or diluted so that it can be used as a useful fuel for hydrogen production by MECs [11]. In systems where polysaccharides are used as the substrate, hydrolysis and fermentation steps are needed to degrade complex molecules to simple molecules that can be easily degraded by anode-respiring bacteria (ARB) by developing a syntrophic interaction between fermentative bacteria and ARB, allowing for the efficient utilization of complex organic matter in MECs [12,13]. To achieve this goal, the use of monosaccharides e.g., xylose, as electron donors for the enrichment of microorganisms can develop a syntrophic interaction in systems that can utilize hydrolysates as the sole carbon source in MECs and increase the reduction of protons for biohydrogen production [14,15].
However, the main bottleneck of all MECs is undesired H2 sinks/recycling, such as hydrogenotrophic methanogenesis in MECs, which can scavenge 4 mol of H2 to produce 1 mol of CH4 (4H2 + CO2 = CH4 + 2H2O) [16,17], the direct oxidation of H2 by exoelectrogens, and acetate utilization by homoacetogens (CO2 + 4H2 = CH3COOH + 2H2O). Conventionally, MECs have always included membranes, such as proton exchange membranes (PEMs), anion exchange membranes (AEMs), nanofiber-reinforced composite proton exchange membranes (NFE-PEMs), forward osmosis membranes, bipolar membranes, and modified mosaic membranes, to prevent hydrogen sinks [6]. In addition, many other methods have been used to prevent hydrogen recycling in single-cell MECs, including chemical inhibitors, low-pH operation, reduced hydraulic retention time, ultraviolet irradiation, exposure to O2, optimized reactor design, and rapid separation of H2 from MECs [18,19,20]. Among these approaches, the rapid separation of H2 seems to be the most promising method to inhibit methanogenesis. Although a few recent works focused on this approach, this is still a new and promising method that needs further investigation. Experiments have used only the simplest electron donor (acetate). Thus, it is still not certain whether this method could be promising for complex electron donors (e.g., lignocellulosic wastes). Moreover, the impact of negative pressure with different substrates on the biofilm composition and its electrochemical behavior is still unknown.
This work aimed to improve biohydrogen production from hydrolysate under rapid H2 separation by using vacuum pressure to prevent H2 recycling in single-chamber MECs. Moreover, the impact of enriching MECs with simple or complex substrates to utilize the hydrolysate as a sole carbon source at different concentrations under negative pressure was studied. In addition, its impact on H2 recovery, current density, Coulombic efficiency, total energy efficiency, microbial diversity, and electrochemical activities was studied.

2. Materials and Methods

2.1. Reactor Configuration and Operation

Single-chamber cubic microbial electrolysis cells (MECs) made of Plexiglas with a working volume of 25 mL (L: 40 mm × Φ: 30 mm) were used in this investigation [21]. The carbon fiber brush (Φ: 30 mm × L: 25 mm) was used as the anode, and Pt/C-coated carbon cloth (7 cm2) was employed as the cathode. The anodes were pretreated by soaking in absolute acetone for 24 h to remove surface impurities and then heated to 450 °C for 30 min in a muffle oven (KLS-1200X; Hefei Kejing Material Technology Co., Ltd., Hefei, China) [22]. Cathodes were prepared with one-sided-wet-proofed carbon cloth (B1B30WP; 30% wet proofing; E-Tek DivisionSM, Guagdong, China), which was coated with 0.5 mg/cm2 of platinum catalyst (Hesen, Shanghai, China) and Nafion (5%) binder on the water-facing side [23]. The air-facing side of the cathodes was sealed with a Plexiglas plate (thickness: 5 mm) to prevent oxygen intrusion [24]. The produced gases were extracted by two different modes: rapid gas harvesting mode by using vacuum (negative-pressure mode (N)) and spontaneous gas release mode (passive mode). Gas outlets were directly connected to the gas bag in passive mode, while gas outlets were connected to the gas bag through a peristaltic pump (BT100-1L; Langer pPump Co., Ltd., Hebei, China) at 50 rpm to harvest gases in negative-pressure mode (Figure 1). The anodes and cathodes of the MECs were connected with power supply (DC power output of 0–12 V and AC input of 220 V ± 20%; Shanghai Fudan Tianxin Science and Education Instrument Co., Ltd., Shanghai, China) via copper wires, and the output of electrical signals across the 10 Ω resistance was obtained by a data acquisition board (PISO-813; ICI DAS Co., Ltd., Taiwan, China) every 30 min throughout the experiment. The duration of every batch cycle was 24 h. All the experiments were performed with an applied voltage of 0.8 V at 30 °C in duplicate.
The hydrolysate was the waste liquid from corn stover after hydrothermal treatment (collected from Suihua, Heilongjiang Province, China) [25] (see Supplementary Materials for detailed treatment protocol and main contents). To illustrate the impact of enrichment by different substrates on hydrolysate degradation for hydrogen evolution, acetate or xylose was supplied as an electron donor during MEC enrichment period for 25 days with domestic wastewater (50%, v/v, was the volume of wastewater to the volume of growth medium; collected from Harbin Institute of Technology, Harbin, China) as inoculum. The MECs were subsequently fed hydrolysate at different concentrations in negative-pressure mode or passive mode (Table S1). The growth medium consisted of 50 mM phosphate buffer (KCl at 0.13 g/L, NaH2PO4•2H2O at 3.32 g/L, Na2HPO4•12H2O at 10.32 g/L, and NH4Cl at 0.31 g/L), 5 mL/L vitamin solution, 12.5 mL/L trace mineral solution [26], and 1.5 g/L acetate (COD of 1350 ± 20 mg/L) or 1 g/L xylose (COD of 1250 ± 20 mg/L) (Figure S1). The raw hydrolysate was diluted with 50 mM PBS to 10% (COD of 1550 ± 50 mg/L), 50% (COD of 8000 ± 150 mg/L), and 90% (COD of 14,400 ± 220 mg/L) as substrates (Hy10, Hy50, and Hy90, respectively) for all MECs in steady state.

2.2. Bioelectrochemical Characteristics and Wastewater Analyses

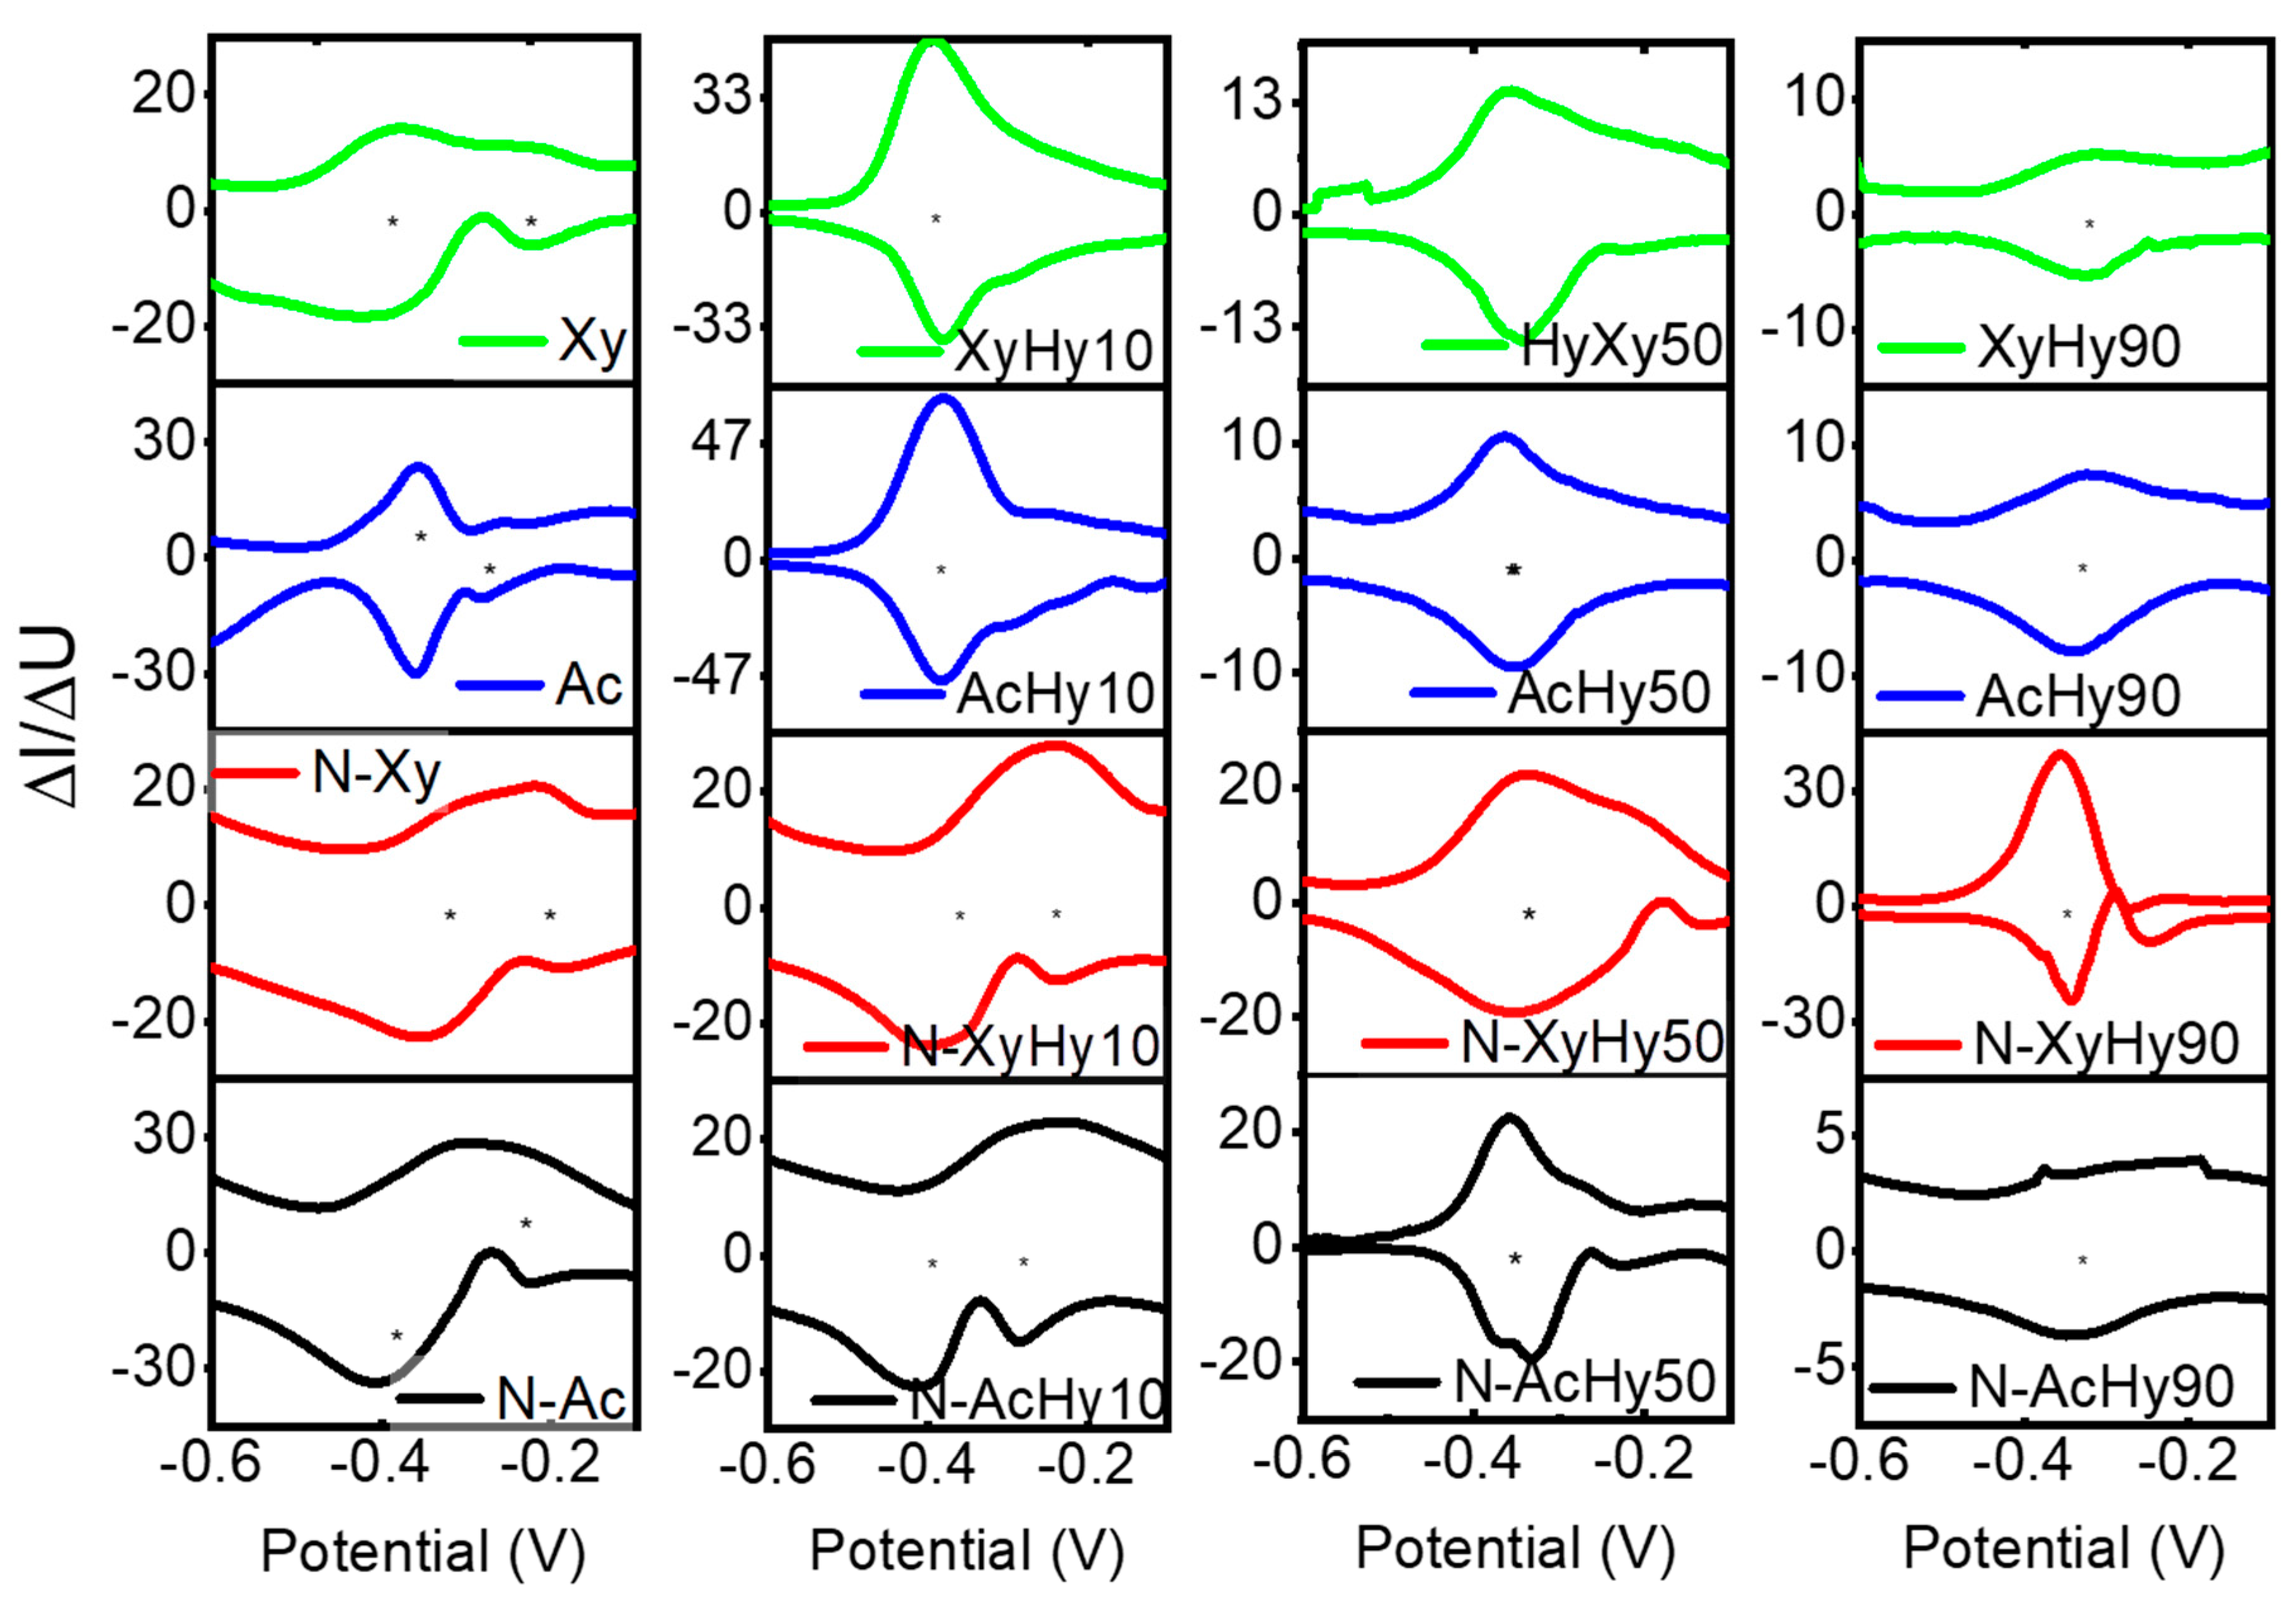
Bioelectrochemical analyses were performed after the current density reached the steady state for more than 10 cycles during each stage (Figure S1). The biofilm was analyzed by staircase cyclic voltammetry (CV) (PMC2000A; Advanced Measurement Technology, Richfield, WI, USA) in a three-electrode configuration with the anode as the working electrode, a Pt plate (1 cm × 1 cm) as the counter electrode, and the saturated calomel electrode (SCE; +241.5 mV vs. standard hydrogen electrode (SHE)) as the reference electrode under turnover conditions (N2-saturated substrate as electrolyte) from −0.8 V to 0.4 V at a scan rate of 1 mV/s. The first derivative of CV (DCV) was calculated by plotting the slope of 20 CV data points against the electrode potential (∆I/∆U) to determine the potential formal potential for extracellular electron transfer [27].
The COD was analyzed at the beginning (influent) and end (effluent) of each batch cycle via HACH vials (TNTplus COD Reagent; HACH Company, Ames, IA, USA) and a spectrophotometer (DR/3900; HACH Co.) according to the manufacturer’s instructions. The produced gas was collected in gas bags, the total volume of gas was measured by using a gas-tight syringe, and the total H2 and CH4 contents were analyzed by Gas Chromatography (7890B; Agilent Ins., Santa Clara, CA, USA) with helium (>99.999%) as the carrier gas with a thermal conductive detector. All the data were recorded in an average of duplicate reactors.

2.3. Biofilm Community Analysis

Biofilms were sampled from the anode for pyrosequencing before changing or increasing the concentration of the substrate (after more than 15 repeated batch cycles with each substrate) (Figure S1) and were also sampled from the cathode at the end of the experiment. To evaluate the homogeneity of the microbial community, samples were taken from different locations on the anode or cathode. DNA extraction was performed by using an E.Z.N.ATM Mag-Bind Soil DNA Kit (Omega Bio-Tech, Norcross, GA, USA), according to the manufacturer’s guidelines. The V4-V5 regions of the 16s rRNA gene were amplified by using barcode primers ArBa515F (5′-GTGCCAGCMGCCGCGGTAA-3′) and Arch806R (GGACTACVSGGGTATCTAAT-3′), which cover all of the bacterial and archaeal taxa [20,28]. IlluminaMiseq was performed by Sangon Biotech (Shanghai, China). The raw sequences were deposited in the NCBI Sequence Read Archive under the accession No. PRJNA1072156.

2.4. Calculations

In this investigation, the current density (j, Am−2) was calculated on the basis of the projected cathode area. To evaluate the performance of the MECs, coulombic efficiency ( C E , %), cathodic gas recovery ( r cat , %) (gas recovered at the cathode which is produced by the current), and overall gas recovery ( R g a s , %) were calculated by Equations (1)–(3) [8].
C E   = n c n COD
r cat = n gas / n c
R g a s = C E × r c a t
where n c = t = 0 t I Δ t /F, I (A) is the current output from the MEC, Δ t is the data sampling time (0.5 h), and F is Faraday’s constant (96,485 C/mol e ). n C O D (gCOD L−1) is the total COD consumption in a batch cycle by using an O2 half-reaction ( Δ C O D / 16 ) ( ¼ O 2 + H + + e = 1 / 2 H 2 O ); n g a s represents the total moles of H2 and CH4 produced in the MECs calculated with n m o l = P V R T , where P is the atmospheric pressure (1 atm), V is the volume of produced gas (L), T is the temperature (K), and R is the gas constant 0.08206 L-atm/K-mol [19]. Energy efficiency based on input energy ( η E , %) and consumed substrate ( η s , %) and overall energy efficiency ( η E + S , %) were calculated with Equations (4)–(6).
η E = W g a s / W E
η s = W g a s / W S
η E + S = W g a s / ( W E + W S )
where W g a s is the energy content of gas produced in the MECs, which is calculated with W g a s = n H 2 Δ H H 2 + n C H 4 Δ H C H 4 ( n H 2 and n C H 4 are the moles of H2 and CH4, respectively; Δ H H 2 = 285,830 J / m o l and Δ H C H 4 = 891,000 J / m o l ). W E is the energy consumed during MEC operation by the applied voltage and vacuum pump ( W E = 1 n ( I E a p Δ t I 2 R e x Δ t + W P )); E a p is the applied voltage (0.8 V), and R e x is the external resistance (10 Ω) in this study; W P is the power consumed by the vacuum pump ( W P = 0.024 (kWh m−3 H2) × V(m3)) [20]. W S is energy consumption of the substrate ( W S = Δ H S n s ), n s represents the moles consumed by the substrate (based on COD removal) during a batch, and Δ H S is the substrate heat value ( 14 , 700 J / g C O D ).

3. Results

3.1. MEC Performance with Different Enrichment Substrates in Passive Mode

The MECs were enriched with acetate or xylose to evaluate the performance of MECs with hydrolysate as the sole carbon source. The performance of the MECs was evaluated in terms of energy efficiency, H2 production rate, and biogas recovery rate. Since acetate is the simplest, nonfermentable, and ideal electron donor for anode-respiring bacteria (ARB), the overall performance of acetate-enriched MECs (Ac) was greater than that of xylose-enriched MECs (Xy) during enrichment (startup). However, after the substrate was changed to hydrolysate, the overall performance of the MECs enriched with xylose was significantly superior to that of the other MECs.
As CH4 is also a source of bioenergy, energy efficiency ( η ) is determined by the biogas (H2 + CH4) evolution in MECs. There was no major difference in energy efficiency based on electricity input ( η E ) observed during enrichment and for Hy10 or Hy50 fed under passive pressure (Figure 2a). Under passive pressure, the highest η E related to biogas was observed as 313.36 ± 6.1% for XyHy90, where AcHy90 stopped producing any gas. Moreover, the highest η E related to H2 evolution against hydrolysate was 21.63 ± 6.48% for XyHy10, which was 3.5 times higher than AcHy10 (Figure 2a). Conversely, energy efficiency based on the consumed substrate ( η s ) and overall energy efficiency ( η E + S ) were decreased in all MECs as the hydrolysate concentration increased from Hy10 to Hy90 (Figure 2b,c). However, the xylose-enriched MECs were more efficient than the acetate-enriched MECs.
The maximum current density obtained by Ac was 10.85 ± 0.63 Am−2, which continuously decreased with the increase in hydrolysate concentration, from 9.46 ± 1.5 Am−2 for AcHy-10 to 2.29 ± 0.39 Am−2 for AcHy-90 (Figure 3a). On the other hand, no adverse effects of hydrolysate were detected at the current densities of Xy and XyHy-10 (7.56 ± 1.46 Am−2 for Xy and 7.68 ± 0.79 Am−2 for XyHy-10). Similar to current density, C E of Ac (92.75 ± 1.5%) decreased by 18% for AcHy-10, whereas Xy decreased by 10% for XyHy-10 (from 79.75 ± 2.82 to 71.88 ± 2.53%), which was also similar to most of the previous scaled-up MECs. Indeed, Wang et al. (2021) achieved a 0.71 L/L-D hydrogen production rate by using hydrolysate in stacked bioelectrode MECs [29]. As a result of enrichment with xylose, XyHy10 showed a 3.4 times higher hydrogen production rate than AcHy10, with an average hydrogen production rate of 0.135 ± 0.014 LH2L−1D−1 (referred to as L/L-D henceforth), which decreased to 0.0014 L/L-D for Hy90 (Figure 3b). However, the CH4 production rate was continuously increased from 0.0167 LCH4/L-D to 0.278 LCH4/L-D from Xy to XyHy90, respectively. On the other hand, the acetate-enriched MECs produced neither H2 nor CH4 with Hy90 feed (AcHy90). XyHy10 showed similar performance in r cat and R g a s with the values of 12.74 ± 1.01 and 10.92 ± 1.34%, which were 4 times and 2.6 times higher than those of AcHy10, respectively (Figure 3c,d). However, CD and C E were lower in Xy and XyHy10 compared with Ac and AcHy10, while HPR, r cat , and R g a s were higher in XyHy10 than in AcHy10 (Figure 3). These results indicate that xylose-enriched MECs could utilize the hydrolysate properly as the sole carbon source (substrate) at low concentrations (10%). When the concentration of the hydrolysate increased to 50% and 90%, the performance of the MECs decreased. The overall energy efficiency ( η E + S ) became negligible.
CV and DPV were performed to investigate the behavior and electrochemical activities of bioanode with different substrates. A typical sigmoidal CV (Figure 4) was obtained as indicative of catalytic oxidation of the substrate by the biofilm and electron transfer to the electrode. Compared with Ac and AcHy10, the catalytic current densities were lower in Xy and XyHy10 (10.29 and 16.70, and 8.59 and 13.64 Am−2, respectively). On the other hand, the catalytic current densities of XyHy50 and XyHy90 were higher than those of AcHy50 and AcHy90. The electroactive sites of the biofilm were further characterized by DCV (Figure 5). The maxima in the derivative curve were observed at −355 and −328 mV for Ac and Xy, respectively. When the substrate was changed to hydrolysate, a similar redox center was observed for the electrochemical reaction of both MEC types (Xy-enriched or Ac-enriched). The electroactive site of both MEC types shifted to 385 ± 4, 356 ± 2, and 323 ± 3 mV for Hy10, -50, and -90, respectively (Table S2). This result indicates that hydrolysate formed a similar redox center for the electrochemical reaction of the biofilm and hydrolysate oxidation.

3.2. MEC Performance under Negative Pressure

Negative pressure showed a strong significance in the overall performance of the MECs. The energy efficiency ( η ) was determined by biogas (H2 + CH4) evolution in the MECs. The energy efficiency based on the electricity input ( η E ) was always higher in negative-pressure MECs and the highest in the xylose-enriched MECs (Figure 2a). The highest η E related to H2 evolution was observed as 173.15 ± 5.08% in N-XyHy10, which was eight times that of XyHy10, while the highest η E related to biogas was 505.34 ± 12.28%, achieved in N-XyHy90. Energy efficiency based on the consumed substrate ( η s ) decreased in all MECs with the substrate concentration increase from Hy10 to Hy90 (Figure 2b). However, negative pressure achieved higher η s than passive pressure, where N-XyHy10 achieved the highest efficiency of 97.67 ± 4.42%, which was five times greater than that of XyHy10 (18.23 ± 1.72%). Similar to η E , the overall energy efficiency ( η E + S ) of the MECs was always higher under negative pressure at different substrate concentrations. Similar to the above results, the xylose-enriched MECs played a significant role in utilizing hydrolysate as a substrate, with the highest efficiency of 68.28 ± 4.26% for N-XyHy10 under negative pressure, which was 540% of that of XyHy10.
Similarly, negative pressure enhanced the H2 production rate by approximately three times for both substrates (acetate and xylose) during enrichment with negligible CH4 (Figure 3b). This result is consistent with a previously published study, which used only acetate as a substrate [19]. In this study, the hydrogen production rate increased by 6.7 times in N-XyHy10 (0.912 ± 0.08 L H2/L MEC/D) compared with the value of 0.135 ± 0.01 L/L-D for XyHy10, which is higher than the results of most previous studies by other researchers who used complex organic substrates [30,31,32]. Xylose enrichment also showed to have a significant role in enhancing the H2 production rate against hydrolysate as substrate under negative pressure. N-XyHy10 produced 150% more H2 than N-AcHy10. After the concentration of Hy increased to 50 and 90%, the H2 production rate became negligible under passive pressure, while the average H2 production rates of N-XyHy50 and N-XyHy90 were 0.67 ± 0.08 and 0.36 ± 0.08 L/L-D, respectively. Meanwhile, negative pressure was unable to inhibit complete methanogenesis in long-term operation at high concentrations of the hydrolysate. However, as CH4 can also be considered biogas, negative pressure harvested 6–10 times more CH4 than passive pressure (Figure 3b).
The negative-pressure mode showed a strong positive correlation with current density in the xylose-enriched MECs. The average max. current density of N-Xy (11.12 ± 0.44 Am−2) was 47% higher than that of Xy (7.56 ± 1.46 Am−2), and that difference increased to 72.53% with the value of 13.25 ± 1.2 Am−2 for N-XyHy10 and 7.68 ± 0.79 Am−2 for XyHy10, while there was no significant effect of negative pressure on current density in the acetate-enriched MECs. This result is consistent with the study reported by H. Feng et al., according to whom negative pressure did not cause significant changes in current density in the acetate-fed MECs [20], while the xylose-enriched MECs showed significant changes in this study. Moreover, Lu Lu et al. reported a significant effect of negative pressure on current density for acetate-fed MECs [19], which is different from this study, perhaps due to different configurations of the cathodes (gas diffusion cathodes were used by Lu et al., while submersed cathodes were used in this study) [13]. COD removal was slightly higher in the negative-pressure MECs (94–97%) compared with passive pressure (87–91%) in the enrichment stage. Like CD, after the substrate was changed to hydrolysate, there was no significant effect of negative pressure on the acetate-enriched MECs, while a significant effect of negative pressure was observed in the xylose-enriched MECs. N-XyHy10 showed a higher COD removal rate of 84 ± 3% compared with XyHy10 (76.19 ± 2%) against the hydrolysate, which continued to decrease with the increase in the COD loading rate. Conversely, negative pressure did not show any positive effect on C E . However, it slightly varied with substrate complexity, and a simple substrate (acetate) obtained higher C E (Figure 3a). Moreover, negative pressure did not have a considerable effect on C E .
In addition, r cat and R g a s also showed similar trends to the gas production rate. Negative pressure was observed to cause higher r cat throughout the study with values of 81–84%, while only 29–32% was obtained under passive pressure during enrichment. For Hy feed, the highest r cat was observed as 95.84 ± 4.93% for N-XyHy10, which was similar to that of N-XyHy90, but compared with cathodic electron recovery based on H2, 85.99 ± 3.69 was the highest for N-XyHy10, which was seven times greater than that r cat based on H2 for XyHy90 (Figure 3c). R g a s decreased with higher COD loading. However, the negative-pressure MECs obtained two–three times (67–77% for negative pressure and 24–31% for passive pressure) greater R g a s than passive-pressure MECs during enrichment. On the other hand, when the substrate changed to Hy, the highest R g a s observed for N-XyHy10 (65.01 ± 3.53%) was six times that of XyHy10 (10.92 ± 1.33%). These results demonstrate that negative pressure played a significant role in inhibiting H2 scavengers but did not inhibit COD scavengers at high COD loadings.
These results demonstrate that negative pressure not only enhanced the hydrogen production rate but also made the MECs more energy-efficient, and the biofilm enriched with xylose performed best against the hydrolysate as an electron donor. The lower performance at high substrate concentration could be explained by higher fermentative activity on the anode biofilm, as high concentrations of hydrolysate contain high amounts of inhibitor, and the biofouling of the cathode (Figure S4) in long-term operation at high COD loading. In terms of hydrogen recovery and energy efficiency, negative pressure showed higher catalytic current on the bioanode than passive pressure. As shown in Figure 4a, the catalytic current was much higher in the negative-pressure MECs during enrichment (18.5 ± 1.5 Am−2 in negative-pressure MECs and 10 ± 1 Am−2 in passive-pressure MECs), demonstrating that negative pressure enhanced the performance of electroactive bacteria and increased the electron transfer rate. It decreased continuously in the acetate-enriched MECs with the increase in hydrolysate concentration (Figure 4b–d). However, the xylose-enriched MECs maintained the highest catalytic current at each hydrolysate concentration.
The electrochemically active sites were observed by the DCVs of the biofilms (Figure 5). No significant changes in negative pressure were observed in the MECs. The dominant electrochemically negative sites with potentials of −383 and −355 mV were observed in the DCV curves of N-Ac and Ac, respectively, and −315 and −327 mV were observed for N-Xy and Xy, respectively (Table S2). However, when the substrate was changed to hydrolysate, the formal potentials of −360, −337, and −346 mV were detected in N-XyHy10, -50, and -90, respectively, while −388 ± 7.5, −355 ± 1.5, and −324 ± 3.6 mV were detected for the other MECs with Hy10, -50 and -90 feed, respectively. These results clearly indicate that the electrochemical activity of the anode biofilm was mainly dependent on the substrate. However. negative pressure played a significant role in accelerating the performance of anode biofilm electroactivity.

3.3. Microbial Community Analysis

The composition of the microbial community was analyzed by the MiSeq sequencing of the bacterial and archaeal communities in the acetate- or xylose-fed biofilms during enrichment and after the substrate was changed to Hy at each concentration (Hy10, -50, and -90) under negative or passive pressure (Figure 6). We also analyzed the microbial community on the cathode at the end of the experiment, using a similar tool (IlluminaMiseq of 16s rRNA) of anode biofilm. The operational taxonomic units (OTUs) of the anodic biofilm increased simultaneously with the concentration of substrate under negative pressure (Table S3). The total numbers of obtained OTUs were 306 and 360 at enrichment, which increased simultaneously to 763 and 829 for Hy90 feed in N-Ac and N-Xy, respectively, while passive pressure did not result in a simultaneous increase in the number of OTUs with the increase in substrate concentration. The ACE index and Chao1 index also increased with the increase in substrate concentration (Table S3), which was caused by the growth of microbial COD scavengers on the anode biofilm, which increased biodiversity.
At the phylum level (Figure S2a), all the anodic biofilms presented three major taxa, which were dominated by Proteobacteria with relative abundances of 51.89 and 56.59% for acetate-enriched anodes Ac and N-Ac, respectively, and 77.5 and 72.98% for xylose-enriched anodes Xy and N-Xy, respectively, as electroactive bacteria, followed by fermentative bacteria Bacteroidetes (12–16%) and Firmicutes (8–27%) during enrichment [33]. With respect to the Hy concentration, the average relative abundance of Proteobacteria decreased (4–20%), whereas the abundances of fermentative bacteria increased to 38–48% and 16–28% for Firmicutes and Bacteroidetes, respectively, at the end of the experiment (Hy90 feed). However, we observed the presence of Euryarchaeota in negative-pressure-applied MECs, with an average relative abundance of 10% from the beginning to the end of the experiment.
At the class level (Figure S2b), the majority of sequences were divided into 17 classes throughout this study. Gammaproteobacteria dominated the electroactive class found in all anode biofilms at enrichment (68–71% for xylose-enriched biofilms and 43–47% for acetate-enriched biofilms) and for Hy10 feed (between 38 and 47% abundance for each biofilm). When the concentration of Hy increased to 50%, the abundance decreased to 7.53% for N-AcHy50, 27.56% for N-XyHy50, 3.04% for AcHy50, and 14.46% for XyHy50 and became negligible in Hy90-fed biofilms. Gammaproteobacteria, Clostridia, and Bacteroidia were present in all the biofilm samples. When the Hy concentration increased above Hy10, some new classes appeared (Candidatus, Saccharibacteria, Bacilli, and Synergistia), and the abundance of unknown classes increased from 20% for Hy50 feed to 40% for Hy90 feed.
The abundance of the microbial community at the genus level is shown in Figure 6. According to the enrichment substrate, the microbial community presented different groups of clusters, with Ac-fed Acinetobacter, Pseudomonas, and Citrobacter dominating the anode biofilm. These bacteria are involved in extracellular electron transfer to the anode, and during the bioelectrolytic reaction, they are found at the cathode. In the Xy-enriched MECs, Citrobacter dominated, with average relative abundances of 52.38% and 46.21% for Xy and N-Xy, respectively. Citrobacter was previously reported as an electroactive bacteria in glucose-fed MFCs or polysaccharide-enriched bioanodes, which can oxidize polysaccharides and produce exoelectrogens that transfer electrons directly to the anode surface as well as act like fermentative bacteria for biohydrogen production [34,35]. However, electroactive bacteria were present on the anode biofilms of the Ac-fed MECs, e.g., Acinetobacter (10.14 and 14.48%), Pseudomonas (23.28 and 11.18%), and Citrobacter (7.67 and 08.33%) were found on Ac and N-Ac bioanodes, respectively. Methanobrevibacter, which is a typical hydrogenotrophic methanogen, was found on the negative-pressure MEC anode, with relative abundances of 10.33 and 2.84% for N-Ac and N-Xy, respectively, while no methanogens were found on the passive-pressure MEC anode (Ac and Xy). Surprisingly, negligible methane production was detected in N-Ac and N-Xy, but methane production was detected in Ac and Xy with the production rates of 28 and 17 mL of CH4/L D, respectively (Figure 2a). Since methane production was negligible under negative pressure, the role of Methanobrevibacter in anode biofilms needs more investigation in the future. However, negative pressure efficiently harvested H2 to prevent H2 consumption by methanogens on the anode biofilm.
After the substrate was changed from acetate or xylose to hydrolysate, the relative abundance of the microbial community slightly changed with the concentration of hydrolysate. The dominant polysaccharide-degrading exoelectrogenic genera [17,36], such as Acinetobacter (10.35, 6.6, 3.87, and 14.25% for N-AcHy10, N-XyHy10, AcHy10, and XyHy10, respectively), Pseudomonas (23.23, 17.51, 16.71, and 8.49% for N-AcHy10, N-XyHy10, AcHy10, and XyHy10, respectively), and Citrobacter (6.23, 12.52, 19.76, and 8.61% for N-AcHy10, N-XyHy10, AcHy10, and XyHy10, respectively), were found as common genera of the Hy10-fed MECs. These bacteria vanished from the anode biofilm as the hydrolysate concentration increased to 50 and 90%. The group of “unclassified” genera increased in relative abundance from 4–17% in the Hy10-fed MECs to 36–46% in the Hy50- and Hy90-fed MECs. However, the fermentative genera Dysgonomonas and Bacteroides both shifted in abundance with the increase in substrate concentration. Dysgonomonas was present during enrichment with a relative abundance of 3–8% and was present in Hy50-fed MECs with an abundance of 2–5%, whereas Bacteroides was present in the Hy10-fed MECs with an abundance of 2–4%, which increased to 4–16% in the Hy90-fed MECs. Both genera have been reported to be carbohydrate catabolic fermentative bacteria [37]. There was no significant effect of negative pressure on microbial community composition.

4. Conclusions

This study demonstrates that enriching MECs with xylose significantly enhances their performance compared with acetate, particularly when hydrolysate is the sole carbon source. Xylose-enriched MECs (XyHy) achieved superior energy efficiency, hydrogen production, and biogas recovery rates. Notably, under passive pressure, XyHy90 exhibited the highest energy efficiency, 313.36%, while AcHy90 failed to produce gas. At low hydrolysate concentrations (Hy10), xylose enrichment led to a hydrogen production rate 3.4 times higher than that of acetate enrichment. The application of negative pressure further amplified these benefits, with N-XyHy10 showing a hydrogen production rate 6.7 times greater and total energy efficiency that was 540% higher than that under passive pressure. Negative pressure also increased microbial diversity and effectively prevented methanogenesis, enhancing hydrogen recovery. This work highlights the advantages of using xylose and negative pressure in MECs for improved biohydrogen production. Future research should address challenges related to higher hydrolysate concentrations and optimize operational parameters for long-term stability.

Supplementary Materials

The following supporting information can be downloaded at: https://www.mdpi.com/article/10.3390/w16172423/s1, Figure S1: Operational phases of this study from enrichment to hydrolysate fed at different concentrations (10, 50, and 90%) and its biofilm sampling time and bioelectrochemical analysis periods, Figure S2: Microbial community abundance of anode biofilm at phylum level (a) and at class level (b), Figure S3: Microbial community abundance of cathodic biofilm at genus level (a), class level (b), and phylum level (c). Cathodic biofilm samples were collected at the end of this experiment, Figure S4: LSV of Pt/C cathode to show the effect of biofouling on current in three different periods: before the start of the operation (black line), at 30 days of operation (red lines), and at the end of the operation (blue line), Table S1: Operational phases of this study, Table S2: Electrochemical active sites in DCV curves of anodic biofilm, Table S3 Illumina sequencing analysis for species richness and diversity analyses of anode biofilms.

Author Contributions

R.S.Y.: Conceptualization; Methodology; Writing—original draft; and Formal analysis. W.H.: Visualization, Investigation, and Supervision. D.L.: Conceptualization and Methodology. C.L.: Software and Validation. Y.Y.: Validation. K.A.: Validation Y.F.: Supervision and Project administration. All authors have read and agreed to the published version of the manuscript.

Funding

This work was supported by National Key Research, and the research was also supported by Fundamental Research Funds for the Central Universities (RFCU5710010122); Natural Science Foundation of Heilongjiang Province—Outstanding Youth Foundation (YQ2022E033); National Natural Science Foundation Youth Fund (No. 42207257); State Key Laboratory of Urban Water Resource and Environment (Harbin Institute of Technology) (Nos. 2022TS07, ES202224, and ES202310); China Postdoctoral Science Foundation (2022M710952 and 2023T160170); Heilongjiang Postdoctoral Science Foundation (LBH-Z22179); and Fundamental Research Funds for Postdoctoral fellow (Harbin Institute of Technology). The authors also acknowledge the support of the Innovation Team in Key Areas of the Ministry of Science and the Heilongjang Touyan Team.

Data Availability Statement

The raw gene sequences of microbial community were deposited in the NCBI sequence read archive under accession No. PRJNA1072156.

Conflicts of Interest

The authors declare that they have no known competing financial interests or personal relationships that could have appeared to influence the work reported in this paper.

References

  1. Kadier, A.; Kalil, M.S.; Abdeshahian, P.; Chandrasekhar, K.; Mohamed, A.; Azman, N.F.; Logroño, W.; Simayi, Y.; Hamid, A.A. Recent advances and emerging challenges in microbial electrolysis cells (MECs) for microbial production of hydrogen and value-added chemicals. Renew. Sustain. Energy Rev. 2016, 61, 501–525. [Google Scholar] [CrossRef]
  2. Kadier, A.; Simayi, Y.; Kalil, M.S.; Abdeshahian, P.; Hamid, A.A. A review of the substrates used in microbial electrolysis cells (MECs) for producing sustainable and clean hydrogen gas. Renew. Energy 2014, 71, 466–472. [Google Scholar] [CrossRef]
  3. Reynolds, L.J.; Sala-Comorera, L.; Khan, M.F.; Martin, N.A.; Whitty, M.; Stephens, J.H.; Nolan, T.M.; Joyce, E.; Fletcher, N.F.; Murphy, C.D. Coprostanol as a population biomarker for SARS-CoV-2 wastewater surveillance studies. Water 2022, 14, 225. [Google Scholar] [CrossRef]
  4. Gautam, R.; Nayak, J.K.; Ress, N.V.; Steinberger-Wilckens, R.; Ghosh, U.K. Bio-hydrogen production through microbial electrolysis cell: Structural components and influencing factors. Chem. Eng. J. 2023, 455, 140535. [Google Scholar] [CrossRef]
  5. Lee, H.-S.; Vermaas, W.F.; Rittmann, B.E. Biological hydrogen production: Prospects and challenges. Trends Biotechnol. 2010, 28, 262–271. [Google Scholar] [CrossRef] [PubMed]
  6. Shabani, M.; Younesi, H.; Pontié, M.; Rahimpour, A.; Rahimnejad, M.; Zinatizadeh, A.A. A critical review on recent proton exchange membranes applied in microbial fuel cells for renewable energy recovery. J. Clean. Prod. 2020, 264, 121446. [Google Scholar] [CrossRef]
  7. Rousseau, R.; Etcheverry, L.; Roubaud, E.; Basséguy, R.; Délia, M.-L.; Bergel, A. Microbial electrolysis cell (MEC): Strengths, weaknesses and research needs from electrochemical engineering standpoint. Appl. Energy 2020, 257, 113938. [Google Scholar] [CrossRef]
  8. Liang, D.; Zhang, L.; He, W.; Li, C.; Liu, J.; Liu, S.; Lee, H.-S.; Feng, Y. Efficient hydrogen recovery with CoP-NF as cathode in microbial electrolysis cells. Appl. Energy 2020, 264, 114700. [Google Scholar] [CrossRef]
  9. Son, H.; Seo, H.; Han, S.; Kim, S.M.; Khan, M.F.; Sung, H.J.; Kang, S.-H.; Kim, K.-J.; Kim, Y.H. Extra disulfide and ionic salt bridge improves the thermostability of lignin peroxidase H8 under acidic condition. Enzym. Microb. Technol. 2021, 148, 109803. [Google Scholar] [CrossRef]
  10. Li, P.; Yang, C.; Jiang, Z.; Jin, Y.; Wu, W. Lignocellulose pretreatment by deep eutectic solvents and related technologies: A review. J. Bioresour. Bioprod. 2023, 8, 33–44. [Google Scholar] [CrossRef]
  11. Li, Z.; Yu, Y.; Sun, J.; Li, D.; Huang, Y.; Feng, Y. Effect of Extractives on Digestibility of Cellulose in Corn Stover with Liquid Hot Water Pretreatment. BioResources 2015, 11, 54–70. [Google Scholar] [CrossRef]
  12. Ullery, M.L.; Logan, B.E. Anode acclimation methods and their impact on microbial electrolysis cells treating fermentation effluent. Int. J. Hydrogen Energy 2015, 40, 6782–6791. [Google Scholar] [CrossRef]
  13. Lu, L.; Ren, Z.J. Microbial electrolysis cells for waste biorefinery: A state of the art review. Bioresour. Technol. 2016, 215, 254–264. [Google Scholar] [CrossRef] [PubMed]
  14. Rathinam, N.K.; Bibra, M.; Salem, D.R.; Sani, R.K. Thermophiles for biohydrogen production in microbial electrolytic cells. Bioresour. Technol. 2019, 277, 171–178. [Google Scholar] [CrossRef]
  15. Yan, D.; Yang, X.; Yuan, W. Electricity and H2 generation from hemicellulose by sequential fermentation and microbial fuel/electrolysis cell. J. Power Sources 2015, 289, 26–33. [Google Scholar] [CrossRef]
  16. Lee, H.S.; Torres, C.I.; Rittmann, B.E. Effects of Substrate Diffusion and Anode Potential on Kinetic Parameters for Anode-Respiring Bacteria. Environ. Sci. Technol. 2009, 43, 7571–7577. [Google Scholar] [CrossRef]
  17. Lu, L.; Xing, D.; Ren, N.; Logan, B.E. Syntrophic interactions drive the hydrogen production from glucose at low temperature in microbial electrolysis cells. Bioresour. Technol. 2012, 124, 68–76. [Google Scholar] [CrossRef] [PubMed]
  18. Kadier, A.; Kalil, M.S.; Chandrasekhar, K.; Mohanakrishna, G.; Saratale, G.D.; Saratale, R.G.; Kumar, G.; Pugazhendhi, A.; Sivagurunathan, P. Surpassing the current limitations of high purity H2 production in microbial electrolysis cell (MECs): Strategies for inhibiting growth of methanogens. Bioelectrochemistry 2018, 119, 211–219. [Google Scholar] [CrossRef]
  19. Lu, L.; Hou, D.; Wang, X.; Jassby, D.; Ren, Z.J. Active H2 Harvesting Prevents Methanogenesis in Microbial Electrolysis Cells. Environ. Sci. Technol. Lett. 2016, 3, 286–290. [Google Scholar] [CrossRef]
  20. Feng, H.J.; Huang, L.J.; Wang, M.Z.; Xu, Y.F.; Shen, D.S.; Li, N.; Chen, T.; Guo, K. An effective method for hydrogen production in a single-chamber microbial electrolysis by negative pressure control. Int. J. Hydrogen Energy 2018, 43, 17556–17561. [Google Scholar] [CrossRef]
  21. Li, D.; Liu, J.; Wang, H.; Qu, Y.; Feng, Y. Effect of long-term operation on stability and electrochemical response under water pressure for activated carbon cathodes in microbial fuel cells. Chem. Eng. J. 2016, 299, 314–319. [Google Scholar] [CrossRef]
  22. Feng, Y.; Yang, Q.; Wang, X.; Logan, B.E. Treatment of carbon fiber brush anodes for improving power generation in air–cathode microbial fuel cells. J. Power Sources 2010, 195, 1841–1844. [Google Scholar] [CrossRef]
  23. Middaugh, J.; Cheng, S.; Liu, W.; Wagner, R. How to Make Cathodes with a Diffusion Layer for Single-Chamber Microbial Fuel Cells. Available online: https://scholar.google.com/scholar?hl=en&as_sdt=0%2C5&q=23.%09Middaugh%2C+J.%3B+Cheng%2C+S.%3B+Liu%2C+W.%3B+Wagner%2C+R.+How+to+make+cathodes+with+a+diffusion+layer+for+single-chamber+microbial+fuel+cells.+Journal+2006.&btnG= (accessed on 20 August 2024).
  24. Borgwardt, L.; Højgaard, L.; Carstensen, H.; Laursen, H.; Nowak, M.; Thomsen, C.; Schmiegelow, K. Power densities using different cathode catalysts (Pt and CoTMPP) and polymer binders (nafion and PTFE) in single chamber microbial fuel cells. Environ. Sci. Technol. 2006, 40, 364–369. [Google Scholar] [CrossRef]
  25. Zhu, L.; Xu, H.; Yin, X.; Wang, S. H2SO4 assisted hydrothermal conversion of biomass with solid acid catalysis to produce aviation fuel precursors. iScience 2023, 26, 108249. [Google Scholar] [CrossRef] [PubMed]
  26. Cheng, S.; Xing, D.; Call, D.F.; Logan, B.E. Direct Biological Conversion of Electrical Current into Methane by Electromethanogenesis. Environ. Sci. Technol. 2009, 43, 3953–3958. [Google Scholar] [CrossRef]
  27. Guo, W.; Ying, X.; Zhao, N.; Yu, S.; Zhang, X.; Feng, H.; Zhang, Y.; Yu, H. Interspecies electron transfer between Geobacter and denitrifying bacteria for nitrogen removal in bioelectrochemical system. Chem. Eng. J. 2023, 455, 139821. [Google Scholar] [CrossRef]
  28. He, P.; Han, W.; Shao, L.; Lü, F. One-step production of C6–C8 carboxylates by mixed culture solely grown on CO. Biotechnol. Biofuels 2018, 11, 4. [Google Scholar] [CrossRef] [PubMed]
  29. Wang, L.; Long, F.; Liang, D.; Xiao, X.; Liu, H. Hydrogen production from lignocellulosic hydrolysate in an up-scaled microbial electrolysis cell with stacked bio-electrodes. Bioresour. Technol. 2021, 320, 124314. [Google Scholar] [CrossRef]
  30. Gil-Carrera, L.; Escapa, A.; Carracedo, B.; Morán, A.; Gómez, X. Performance of a semi-pilot tubular microbial electrolysis cell (MEC) under several hydraulic retention times and applied voltages. Bioresour. Technol. 2013, 146, 63–69. [Google Scholar] [CrossRef]
  31. Baeza, J.A.; Martínez-Miró, À.; Guerrero, J.; Ruiz, Y.; Guisasola, A. Bioelectrochemical hydrogen production from urban wastewater on a pilot scale. J. Power Sources 2017, 356, 500–509. [Google Scholar] [CrossRef]
  32. Cotterill, S.; Dolfing, J.; Jones, C.; Curtis, T.; Heidrich, E. Low temperature domestic wastewater treatment in a microbial electrolysis cell with 1 m2 anodes: Towards system scale-up. Fuel Cells 2017, 17, 584–592. [Google Scholar] [CrossRef]
  33. Liang, D.; He, W.; Li, C.; Yu, Y.; Zhang, Z.; Ren, N.; Feng, Y. Bidirectional electron transfer biofilm assisted complete bioelectrochemical denitrification process. Chem. Eng. J. 2019, 375, 121960. [Google Scholar] [CrossRef]
  34. Deng, L.; Ngo, H.H.; Guo, W.; Chang, S.W.; Nguyen, D.D.; Pandey, A.; Varjani, S.; Hoang, N.B. Recent advances in circular bioeconomy based clean technologies for sustainable environment. J. Water Process Eng. 2022, 46, 102534. [Google Scholar] [CrossRef]
  35. Lakshmidevi, R.; Muthukumar, K. Biohydrogen Production from Enzymatically Digested Cotton Stalks Using Citrobacter freundii. J. Inst. Eng. (India) Ser. E 2023, 104, 11–18. [Google Scholar] [CrossRef]
  36. Khan, M.F.; Murphy, C.D. Application of microbial biofilms in biocatalysis and biodegradation. In Enzymes for Pollutant Degradation; Springer: Berlin/Heidelberg, Germany, 2022; pp. 93–118. [Google Scholar] [CrossRef]
  37. Cheng, S.; Xing, D.; Logan, B.E. Electricity generation of single-chamber microbial fuel cells at low temperatures. Biosens. Bioelectron. 2011, 26, 1913–1917. [Google Scholar] [CrossRef] [PubMed]
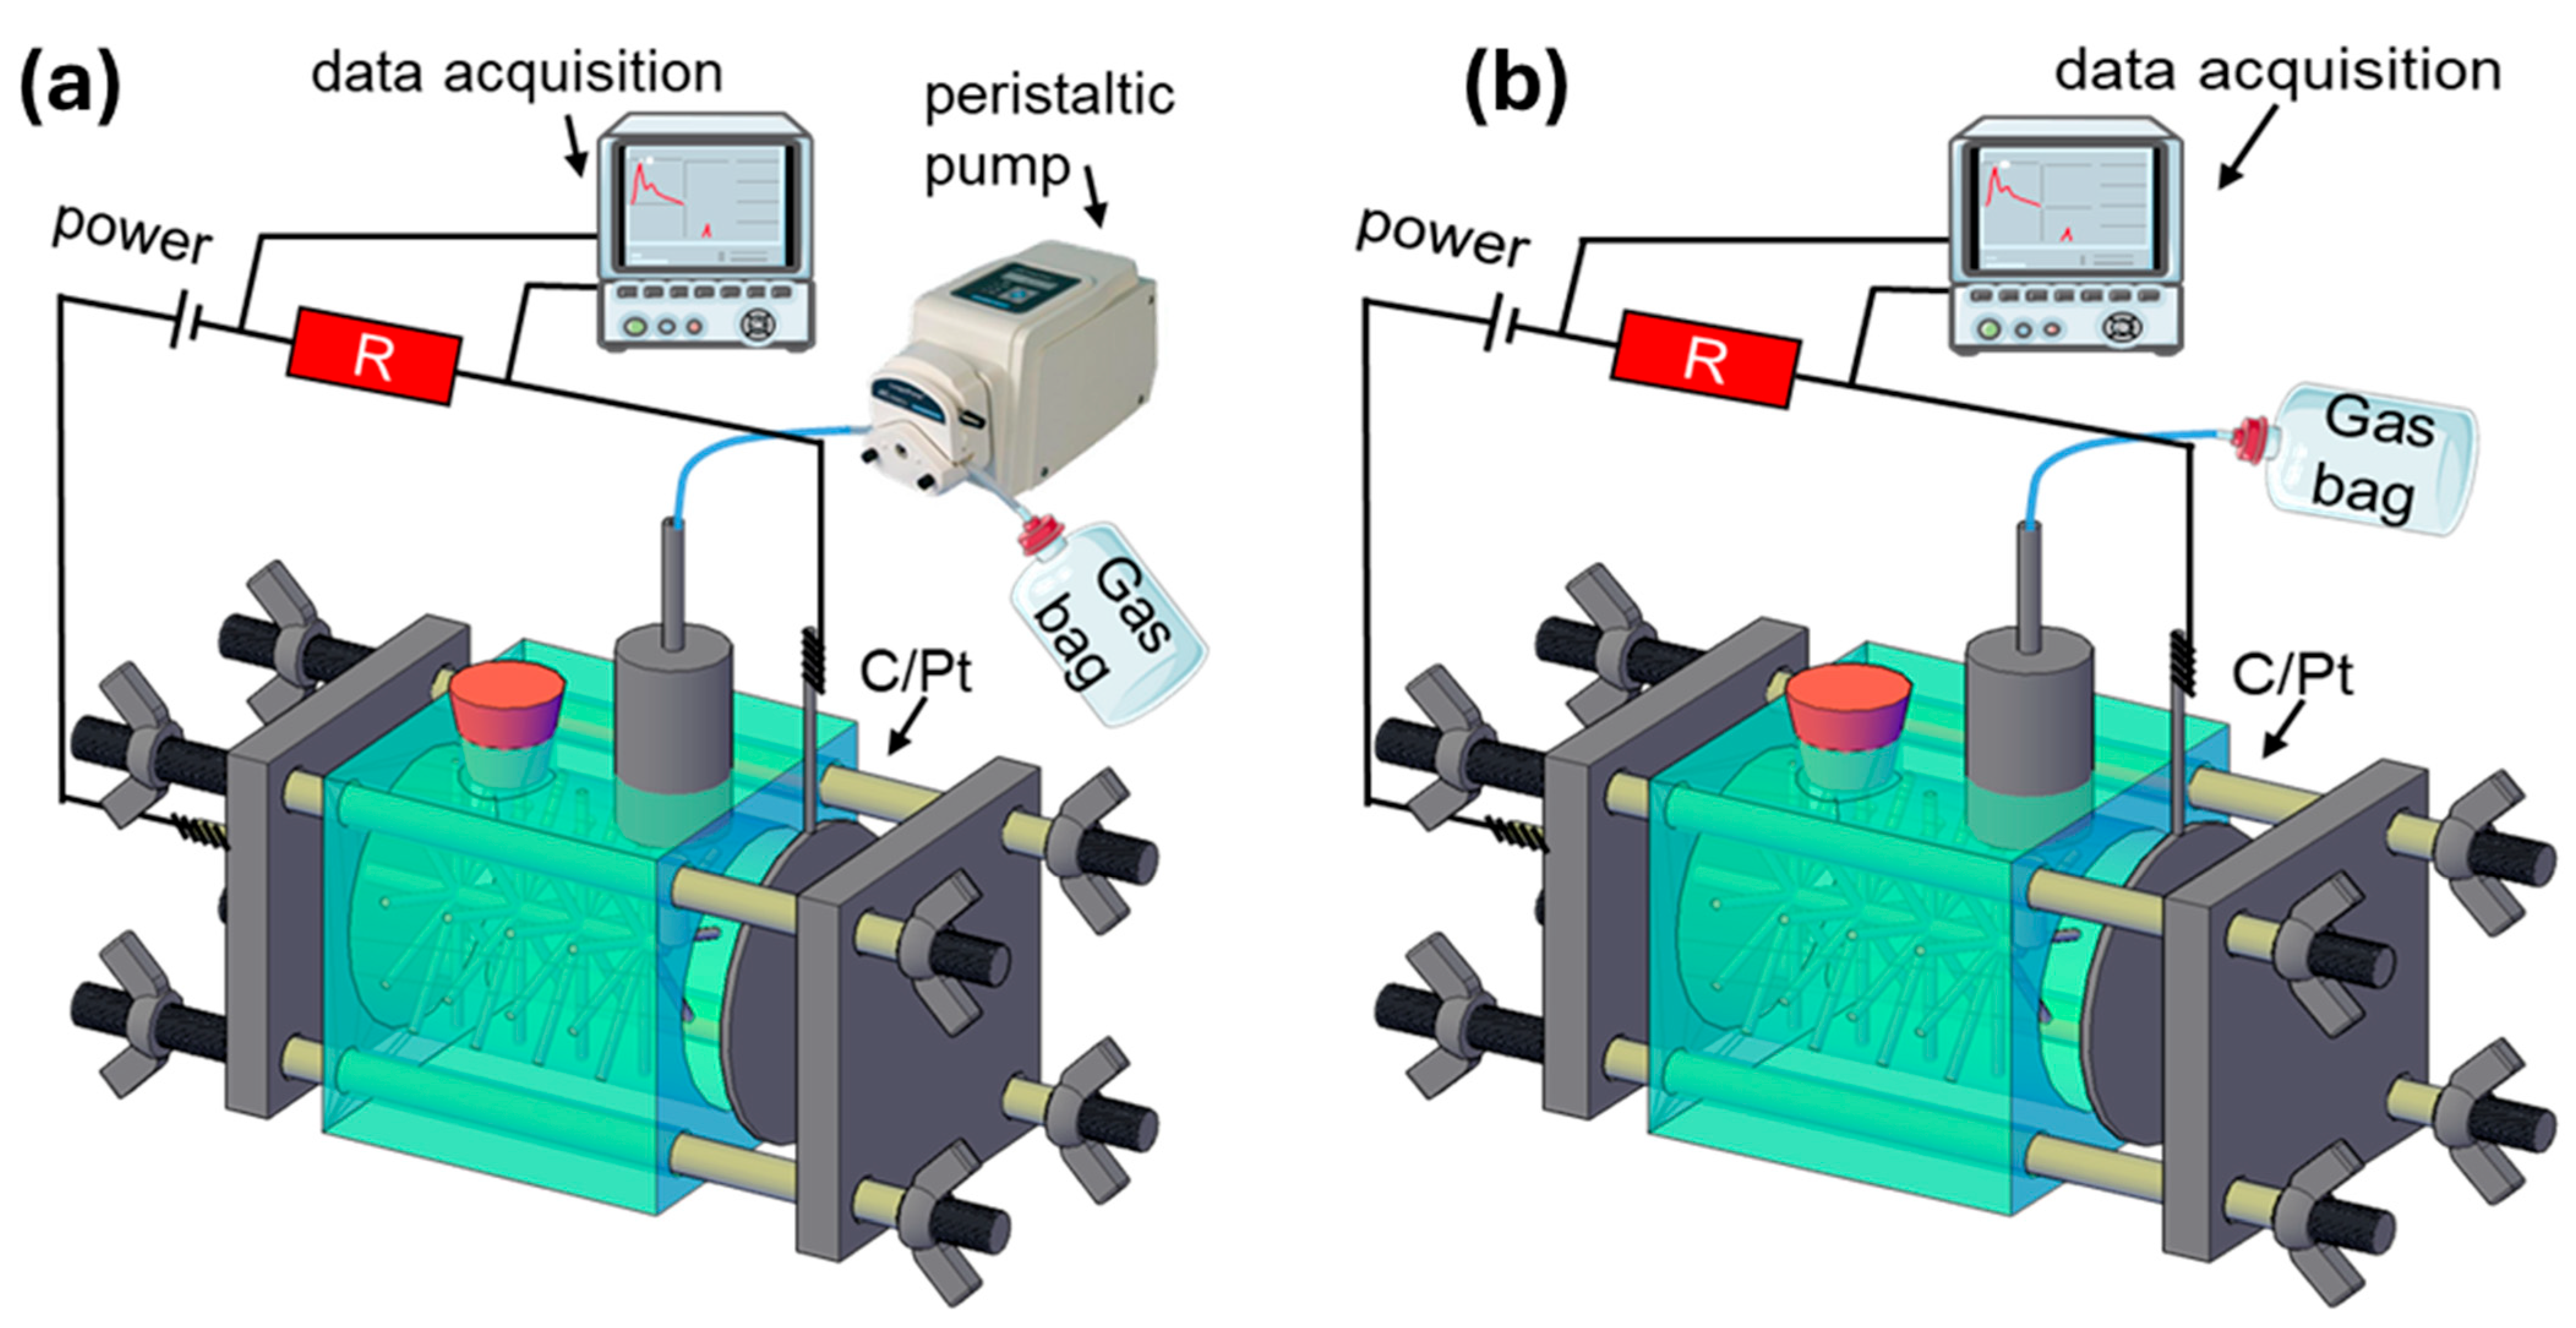
Figure 1. Schematic diagram of (a) active-pressure MEC and (b) passive-pressure MEC.
Water 16 02423 g001
Figure 2. Energy efficiency of MECs (CH4 and H2) based on consumed electrical energy (a) and based on consumed substrate (b) and overall energy efficiency (c) of MECs.
Water 16 02423 g002
Figure 3. (a) Coulombic efficiency and maximum current density; (b) total biogas production rate, including methane and hydrogen; (c) cathodic gas recovery, including cathodic H2 ( r cat −CH4) and CH4 (rCAT−H2) recovery; and (d) total gas recovery ( R g a s ; combination of total CH4 recovery ( R C H 4 ) and total H2 recovery ( R H 2 ) ) of startup for Hy90-fed MECs.
Water 16 02423 g003
Figure 4. Voltammograms of matured anode biofilm at scan rate of 1 mV/s (a) during enrichment and in (b) Hy10-fed, (c) Hy50-fed, and (d) Hy90-fed MECs.
Water 16 02423 g004
Figure 5. Derivative of CV of electrochemical active site in MECs from enrichment to Hy90.
Water 16 02423 g005
Figure 6. Relative abundances of anode biofilms at genus level at each substrate concentration. Relative abundances less than 2% were classified into the “others” group.
Water 16 02423 g006
Disclaimer/Publisher’s Note: The statements, opinions and data contained in all publications are solely those of the individual author(s) and contributor(s) and not of MDPI and/or the editor(s). MDPI and/or the editor(s) disclaim responsibility for any injury to people or property resulting from any ideas, methods, instructions or products referred to in the content.