Article

Hydrodynamic Model of the Area of the Żelazny Most Mining Waste Storage Facility to Reconstruct the Migration of Saline Groundwater

Institute of Geological Sciences, University of Wrocław, 50-204 Wrocław, Poland
*
Author to whom correspondence should be addressed.
Water 2024, 16(17), 2431; https://doi.org/10.3390/w16172431
Submission received: 19 July 2024 / Revised: 20 August 2024 / Accepted: 26 August 2024 / Published: 28 August 2024
(This article belongs to the Special Issue Groundwater Monitoring, Assessment and Modelling)

Abstract

:
This paper presents the construction of a numerical three-dimensional model of the area of the Żelazny Most Mining Waste Storage Facility (MWSF). In the study area, the difficult geological conditions associated with glaciotectonics are accompanied by a complex hydrotechnical system of sediment deposition and sedimentary water drainage. In order to effectively reflect the water flow paths, a detailed schematization was carried out, using 700,000 boreholes and more than 300 hydrogeological cross-sections. In addition, numerous drainage sections, streams, and ditches were included to reliably assess the amount of saline water entering the underlying aquifers. This research was supported by magnetic resonance sounding (MRS) studies of the reservoir’s sediments. The MWSF is currently being expanded, so the work primarily focuses on illustrating changes in the hydrodynamic field resulting from the inclusion of the new southern section. Models of similar facilities have been implemented before, but in the current one, the combination of meticulous analysis of the hydro-structural system, the water balance, a significant amount of data, the size of the facility, and the use of an unstructured discretization grid in the calculations is undoubtedly innovative and will be an important contribution to the development of analogous solutions around the world.

1. Introduction

The issue of industrial waste storage facilities and their impact on the environment is extremely important and will continue to be a problem that hydrogeologists will face for many years to come. An excellent overview of the evolution of copper tailings management can be found in the comprehensive work of Cacciuttolo and Atencio [1], which examines the past, present, and future of copper mine tailings governance in Chile as one of the leading mining countries in the world. Such an approach can be found in relation to mine waste management in China [2]. However, quite similar problems are encountered in Poland, where the mining industry is also of great economic importance and, unfortunately, there are ongoing struggles with the waste it produces.
The issues of post-flotation waste storage facilities are of interest to researchers and specialists from various fields. These are problems related to water management in the closure of such facilities [3,4], sustainable development principles for the disposal of mining and mineral processing wastes [5,6], mine tailings dams characteristics [7], and the recovery of rare earth elements from mining tailings [8,9]. The spectrum of geochemical research evaluating the impact of uncontrolled landfill on the surrounding groundwater quality [10,11] is usually different than that for post-mining waste, where the origin is known. However, the conceptual model of leachate migration in Quaternary aquifers may be quite similar.
Various aspects of the numerical modeling of tailings storage facilities can be found in the literature, such as the extremely valuable 3D numerical modeling of tailings dam breaches [12,13]. Palmer [14] briefly presented methods to predict the filterability of a tailings stream with changes in the mineralogy, while Do et al. [15] focused on the pond filling operation process. Typically, in the case of smaller landfills, the local model is structurally simplified, as in the case of the Enyimba landfill site in Aba, Nigeria, where MODFLOW modeling was used to understand groundwater quality and arsenic contamination spread [16]. The FEFLOW model, based on triangular finite-element meshes to simulate, e.g., the transport of ammonia nitrogen, is equally well used [17]. Migrating pollutants may enter watercourses, so it is usually necessary to model groundwater and surface water interaction [18], as is also the case with the currently examined problem.
Considering the Żelazny Most Mining Waste Storage Facility (MWSF), previous endeavors to model both the entire facility and selected sections of its surroundings have been undertaken. Existing models either have been developed for water balance and transport assessments but in a more generalized manner [19,20,21,22,23,24], or have utilized layer schematization tailored to geo-engineering specifications [25], thus posing challenges in verification. Furthermore, the facility’s impact on the hydrodynamics of the system has been incorporated into the regional model of the entire KGHM area [26,27]. The accumulated experience in constructing models for the Żelazny Most MWSF suggests that with advancements in geoinformation techniques, more accurate forecasts can be attained. Additionally, the unstructured grid (USG) method presents new opportunities, allowing for the assessment of hydrodynamic changes around the reservoir following the construction of the southern section and, consequently, the projection of changes in the movement directions of saline waters. The USG method was developed in 2013 [28] to increase the flexibility in grid design, for example, to focus the resolution along rivers and dams or around wells, and it was applied in MODFLOW code. According to recent research carried out as part of this project, it was determined that in the Żelazny Most MWSF, the chloride concentration is, on average, 36,220 mg Cl/dm3, and the sulfate concentration is, on average, 3233 mg SO4/dm3. A significant part of these polluted seeping waters is captured by ring drainage, but some of it flows into groundwater and then appears in surface streams.
The novelty of this research is the exact reconstruction of the landfill’s shape and the influence of its parameters on the model, not only the influence of its boundary conditions, as is most often practiced. A schematization for complex hydrogeological conditions using data from thousands of boreholes and hundreds of cross-sections is also presented. The accuracy of the numerical model was improved by using an unstructured grid, which is unique for large hydrogeological models. Considering that this case concerns one of the largest hydrotechnical facilities in the world, the work is even more unique.
There have also been no model studies related to the expansion of such a large facility by adding a new section with new protection features, which were included in the model.

2. Material and Methods

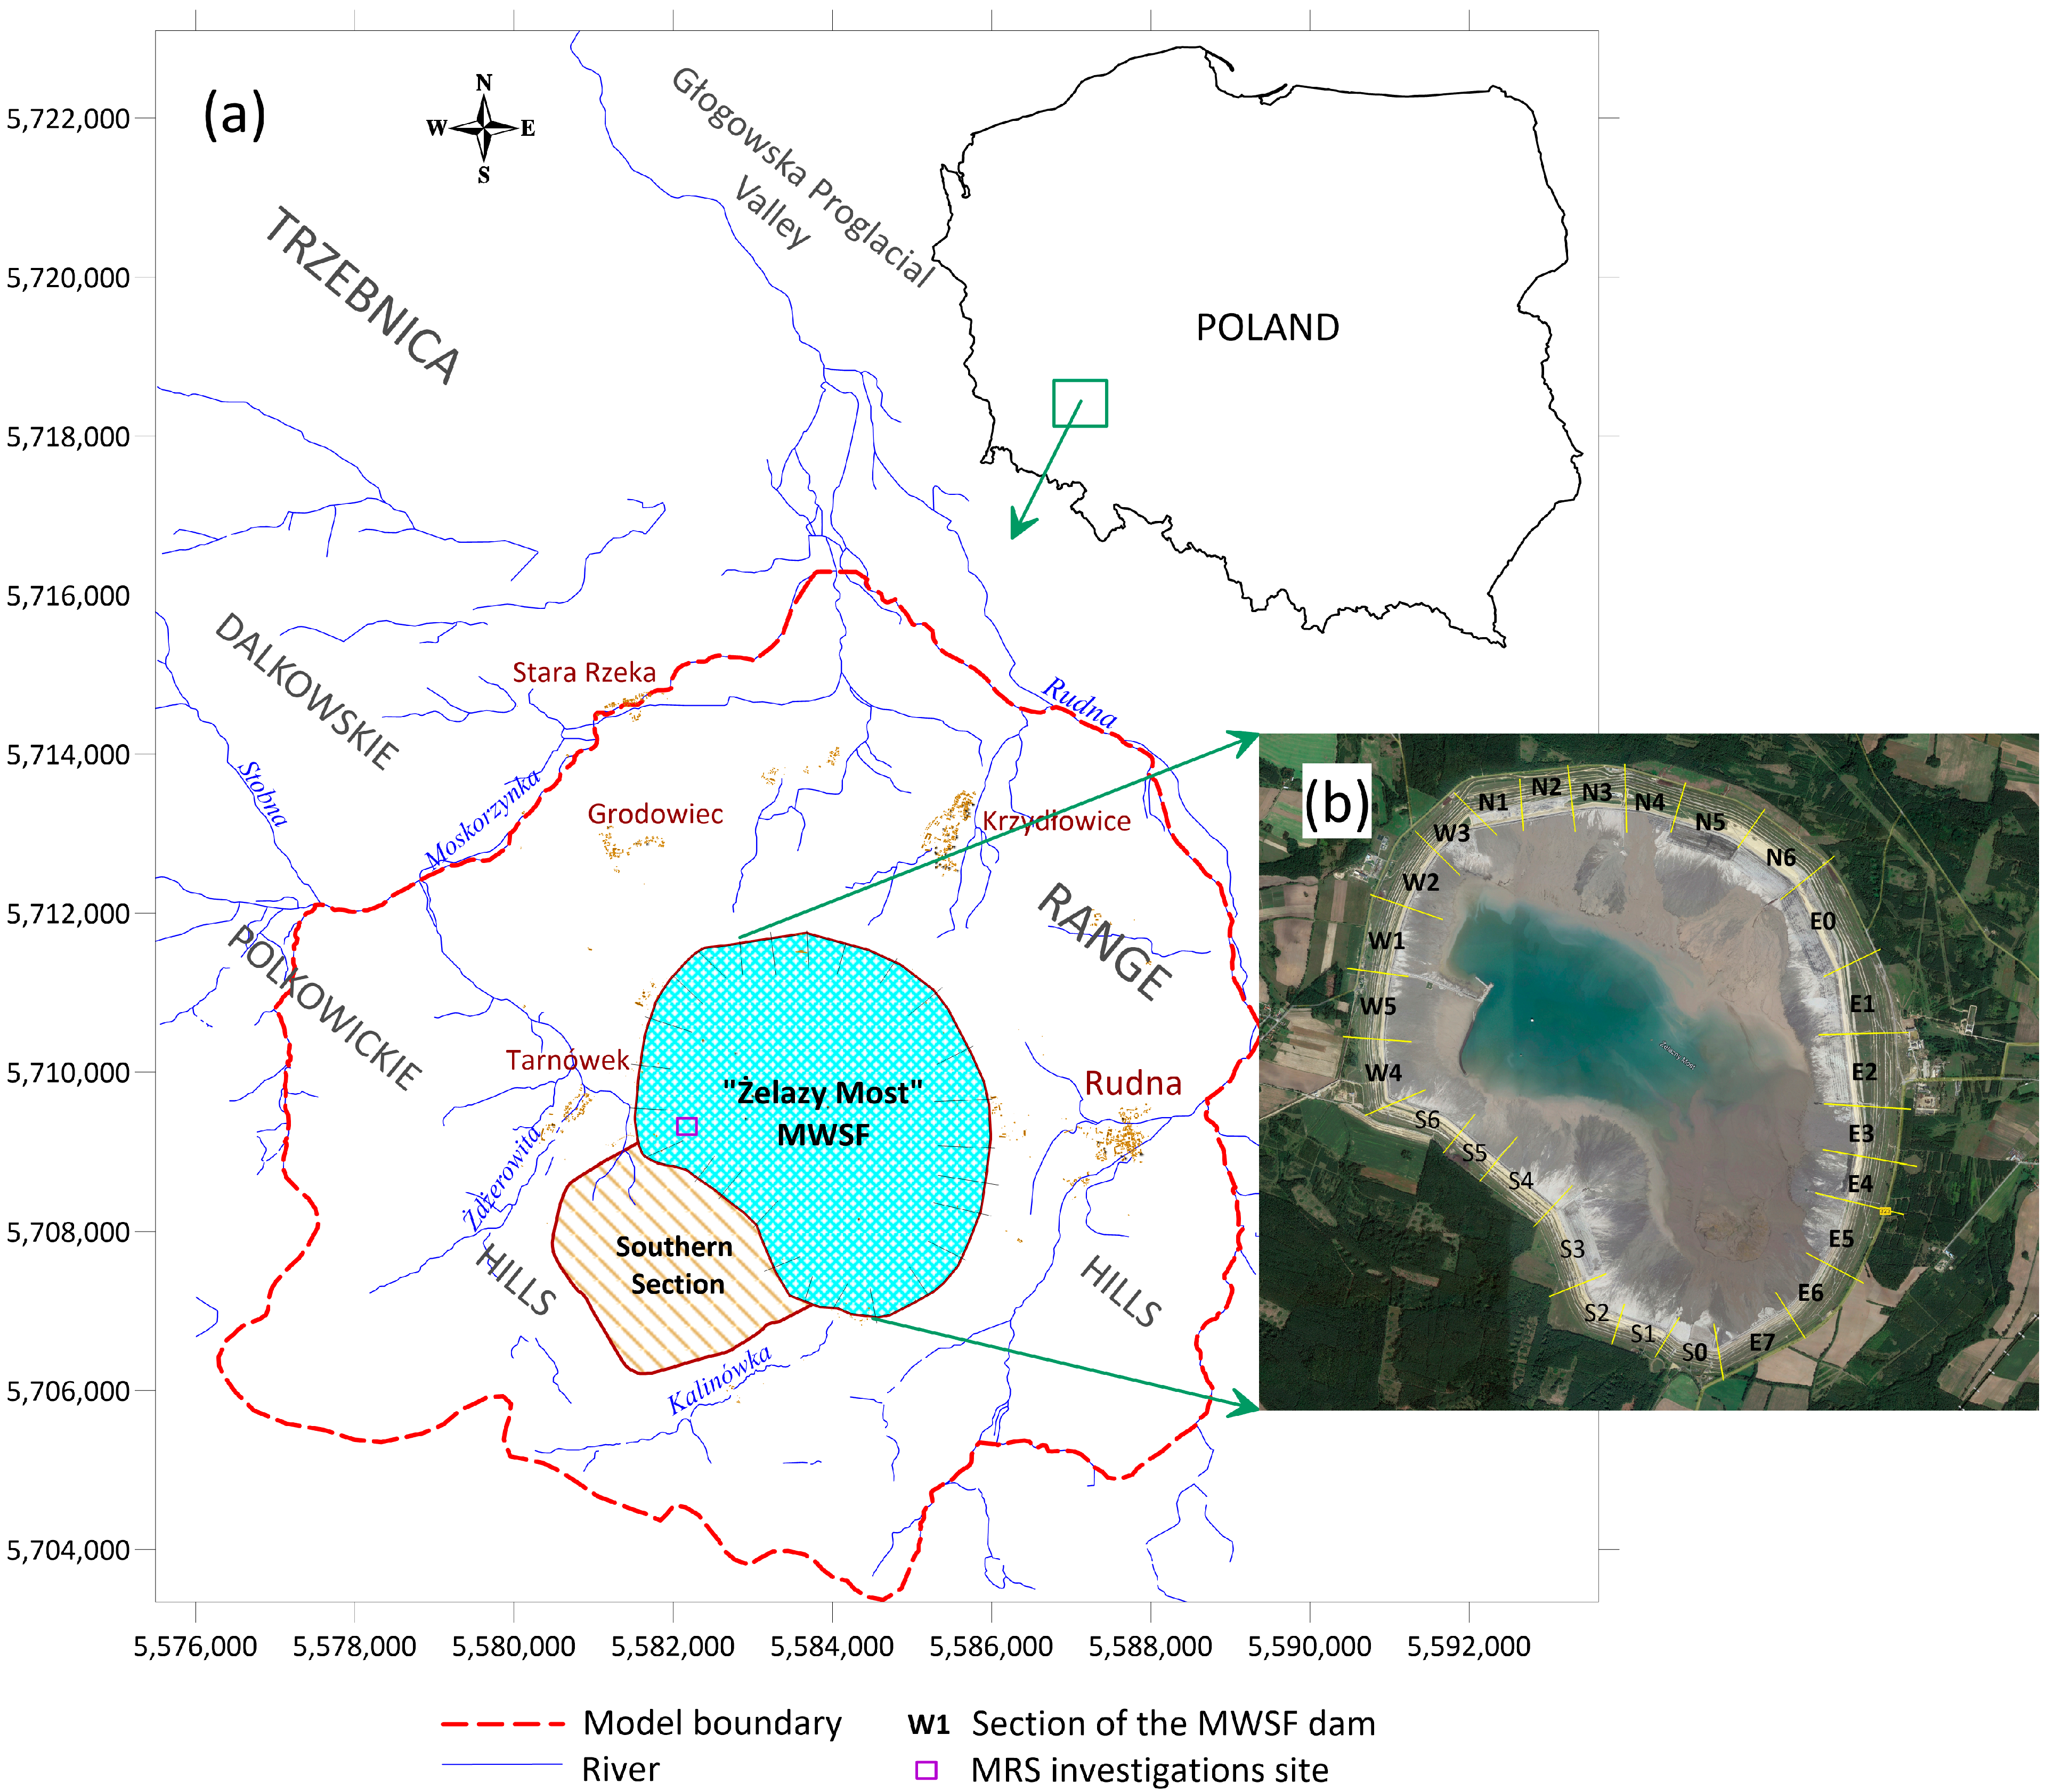
2.1. Study Area and the MWSF Characteristics

The MWSF is situated in southwestern Poland within the Dolnośląskie Voivodeship, spanning across three communes: 9.18 km² in the Rudna commune, 5.23 km² in the Polkowice commune, and 1.26 km² in the Grębocice commune. Positioned approximately 1.0 km eastward from the dam of the MWSF lies the town of Rudna, (Figure 1), which, like other localities, has made great progress thanks to the functioning of the copper industry. The MWSF belongs to one of the world’s largest copper mining companies, KGHM Polska Miedź S.A. The project was established within the national UWPP 1992 geographic coordinate system.
In accordance with the physico-geographical delineation, the area in question falls within the Trzebnica Range macroregion, specifically within the Dalkowskie Hills mesoregion (Figure 1). This mesoregion encompasses various microregions, including the Polkowickie Hills where the waste storage facility is located. The Dalkowskie Hills are bordered to the north by the Głogowska Proglacial Valley mesoregion and to the south by the Lubińska Upland.
The landscape of the region is characterized by hilly terrain, featuring distinct complexes of terminal moraines stacked atop one another and interspersed with numerous depressions, predominantly oriented in the east–west direction. The Żelazny Most MWSF is situated in a natural depression within the Dalkowskie Hills, which formed as a terminal moraine during the Central Polish Glaciation. Initially, the tailings storage site was positioned in a bowl-shaped depression previously occupied by the Kalinówka river valley, which became isolated and sealed off following the construction of the storage facility. South of the reservoir lies a range of hills rising over 200 m a.s.l., constituting an elevated terminal moraine. Conversely, to the north, the landfill is bordered by lower hill ranges, with elevations ranging from approximately 138 to 150 m a.s.l., representing glacitectonic deformations of Neogenic sediments.
Quaternary water-bearing formations are commonly found in surface-exposed or partially covered sandy, gravelly, and silty layers, as well as in deep interglacial and subglacial layers. These sediments form two aquifers. The first aquifer primarily consists of Holocene alluvial sediments, while the second is found in Pleistocene fluvio-glacial deposits. In the deeper substratum of the landfill, there is a Neogene, so-called over-coal aquifer (Pliocene, Upper Miocene), composed of sands of large granulometric diversity with an admixture of clays and gravels developed in the form of lenses. It is isolated from the Quaternary aquifers by a package of clay sediments. In the study area, there are also deeper Neogene aquifers associated with the deposition of Middle and Lower Miocene sand formations, as well as Oligocene sands and gravels. However, they have no hydrodynamic connection with the polluted waters of the site.
Construction of the Żelazny Most facility commenced in 1974, with operational activities and expansions ongoing since 1977. The total length of the dams encompassing the MWSF on all sides measures 14.3 km. A central water reservoir is present within the facility. Over time, the fundamental parameters of the reservoir undergo changes due to the continuous process of waste deposition and slope formation.
As of 2018, the total area of the Żelazny Most MWSF reached 15.32 km2. During that year, the basin area expanded by 0.4 km2, with its volume increasing by 1.4 million cubic meters, and the damming ordinate rising by 1.96 m. The accumulated waste volume within the facility also steadily increased, reaching 630 million cubic meters by December 2018, representing an increase of 18.0 million cubic meters since 2017.

2.2. Data Preparation

To establish a hydrogeological representation of the study area, a comprehensive database was meticulously crafted. This database primarily drew upon geological and hydrogeological data sourced from the KGHM-SyZeM geological database. The data have been collected and supplemented by the mine services for many years. We obtained 11,770 values of hydraulic conductivity based on geological information and individual lithological descriptions, with these values derived from the permeability classes for unconsolidated sediments given in the relevant literature sources [29]. Priority was given to data obtained from pumping tests, which were incorporated into the database alongside literature-derived information. In total, 136,067 hydraulic conductivity values were compiled and utilized for the hydrogeological schematization. The data from pumping tests pertained to 65 drainage wells and 14 piezometers sourced from the SyZeM database. Additionally, external data sources, such as the Central Hydrogeological Data Bank (Bank HYDRO), provided hydraulic conductivity values for 23 hydrogeological boreholes.
This meticulously constructed database covered 170,000 boreholes and served as a foundational tool for hydrogeological schematization, facilitating data entry and export functionalities. It enabled the aggregation of individual boreholes into hydrogeological layers, the calculation of their average (weighted) hydraulic conductivity values, the determination of the top and bottom positions of the model layers, and the subsequent depiction of the layer thicknesses.
The interpolation of the collated point data was conducted utilizing SURFER 17.1 software through the kriging method. Subsequently, the outcomes were imported into the discretization grid of the modeling program. The top and hydraulic conductivity values of the third layer were documented based on 1218 points with geological information, while for the fourth layer, this information was derived from 1236 points. The values for the fifth layer were established from 7774 points. Additionally, the bottom of the model was determined at 551 individual points within the model area and its immediate borders.
The variation in the hydraulic conductivity of sediments within the Żelazny Most MWSF is clearly visible in Figure 2, which compares the results of three series of sampling from different profiles. The red line shows the average value of the hydraulic conductivity determinations, indicating that in the central part, it is within the range of 1 × 10⁻⁹–1 × 10⁻⁸ m/s, while in the marginal zones, the values are much higher, ranging from 1 × 10⁻⁷ m/s to 1 × 10⁻⁶ m/s.

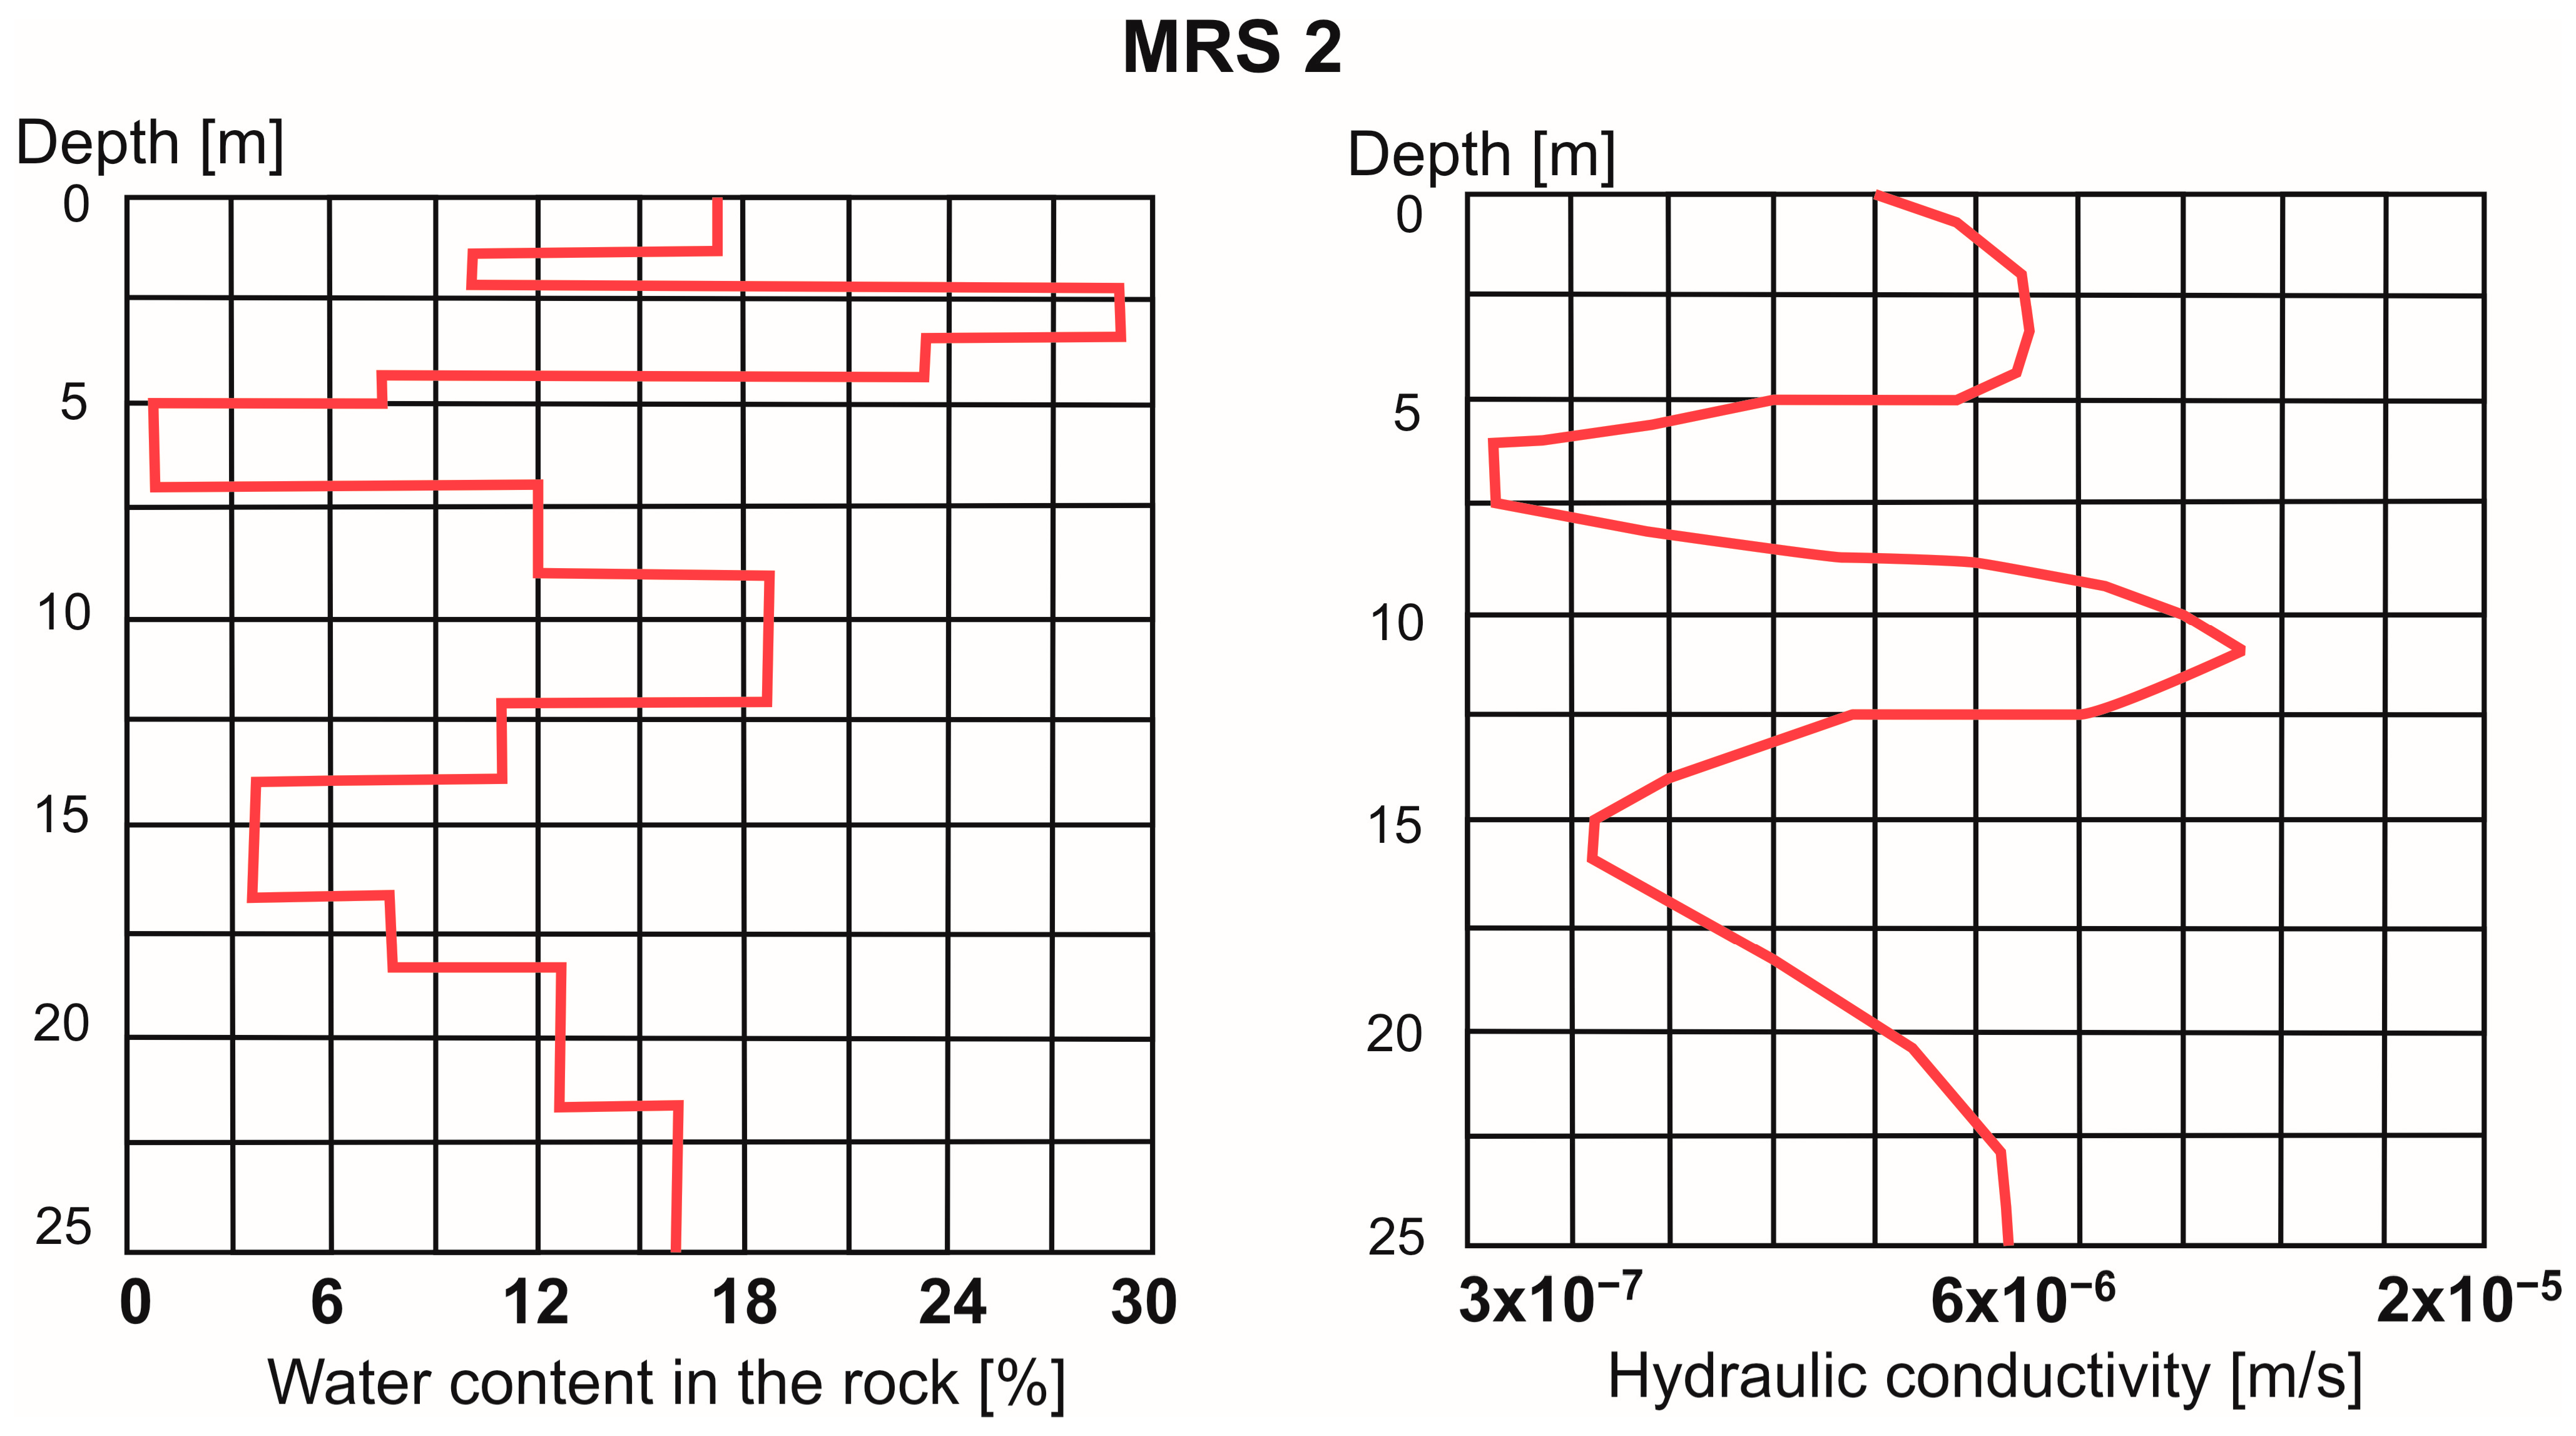
2.3. Assessment of the Hydraulic Conductivity of Tailings Using the MRS Method

The hydrogeological conditions of tailings were defined based on the results of archival studies, which were supplemented by the results of geophysical surveys (MRS—magnetic resonance sounding) (Figure 1), allowing for the identification of the groundwater environment up to 25–50 m deep. A commercial version of the MRS appliance called NUMIS LITE by Iris Instrument (Orléans, France) was used in the fieldwork. A more complete description of the MRS technique and the determination of hydrodynamic parameters using MRS measurements is given in [31,32,33,34,35].
The simulation of the river network in the model was based on geodetic measurements and the terrain model made in the project and supported by data on the permeability of the bottom sediments [36]. Throughout the project, data on the flow rates in the surface watercourses were gathered. These data were sourced from observations conducted by the Institute of Meteorology and Water Management (IMGW) and hydrological studies undertaken as part of groundwater monitoring by KGHM. Long-term measurements spanning from 2000 to 2019 facilitated the estimation of groundwater runoff. Only water gauge points enclosing catchments entirely within the model area and boasting the longest observation periods were utilized in the analysis.
The recharge flux was determined as a percentage of the mean annual rainfall, ranging from 0 to 25 percent, depending on the sub-soil permeability. To ascertain groundwater recharge, the Hydrographic Map of Poland, 1:50,000, was employed. This map delineates the soil permeability conditions across six classes, each associated with an appropriate infiltration index. Precipitation data were gathered from the Rudna and Polkowice Dolne measuring stations operated by IMGW. However, these stations did not provide continuous observations. Thus, to reflect the current conditions, the average precipitation recorded at the Rudna station during the periods of 2011–2014 and 2019–2020 was utilized for the recharge assessment. Precipitation data were downloaded from the IMGW server [37]. Ultimately, considering the range of available data and the positioning of the measurement points relative to the model area, an average precipitation value of 549 mm for the entire area was employed for the calculations.

2.4. Model Schematization

The 370 geological and hydrogeological cross-sections were utilized to distinguish the model layers. An illustration demonstrating the implementation of this procedure within a segment of the research area is depicted in Figure 3. The final hydrogeological schematization for the developed model was segmented into five layers, aligning with the model grid as follows: 1, 2—layers simulating the MWSF (both the same thickness); 3—the first (shallow) aquifer; (4)—insulating layer; 5—second aquifer. Layers 1–2 were simulated according to the sediment loading schedule, while the remaining layers were based on the presented aggregation of parameters. The first modeled aquifer’s thickness ranges from several meters to approximately 80 m within the model boundaries and up to 45 m within the reservoir boundaries. Its southern and western extents typically manifest the lowest thickness values. Layer 4 acts as a separating layer between modeled aquifers 3 and 5. Its thickness within the reservoir area generally does not exceed 20 m, reaching approximately 40 m in certain locations at the western and northeastern limits of the post-flotation sediment range. The thicknesses of the model layers are shown in Figure 4.
The use of such a large number of cross-sections in the schematization can be considered a fairly new approach because, usually, the model structure is interpolated directly from point data in the boreholes.
The spatial distributions of the hydraulic conductivity of the third and fifth layers of the hydrogeological model are presented in Figure 5.

3. Results and Discussion
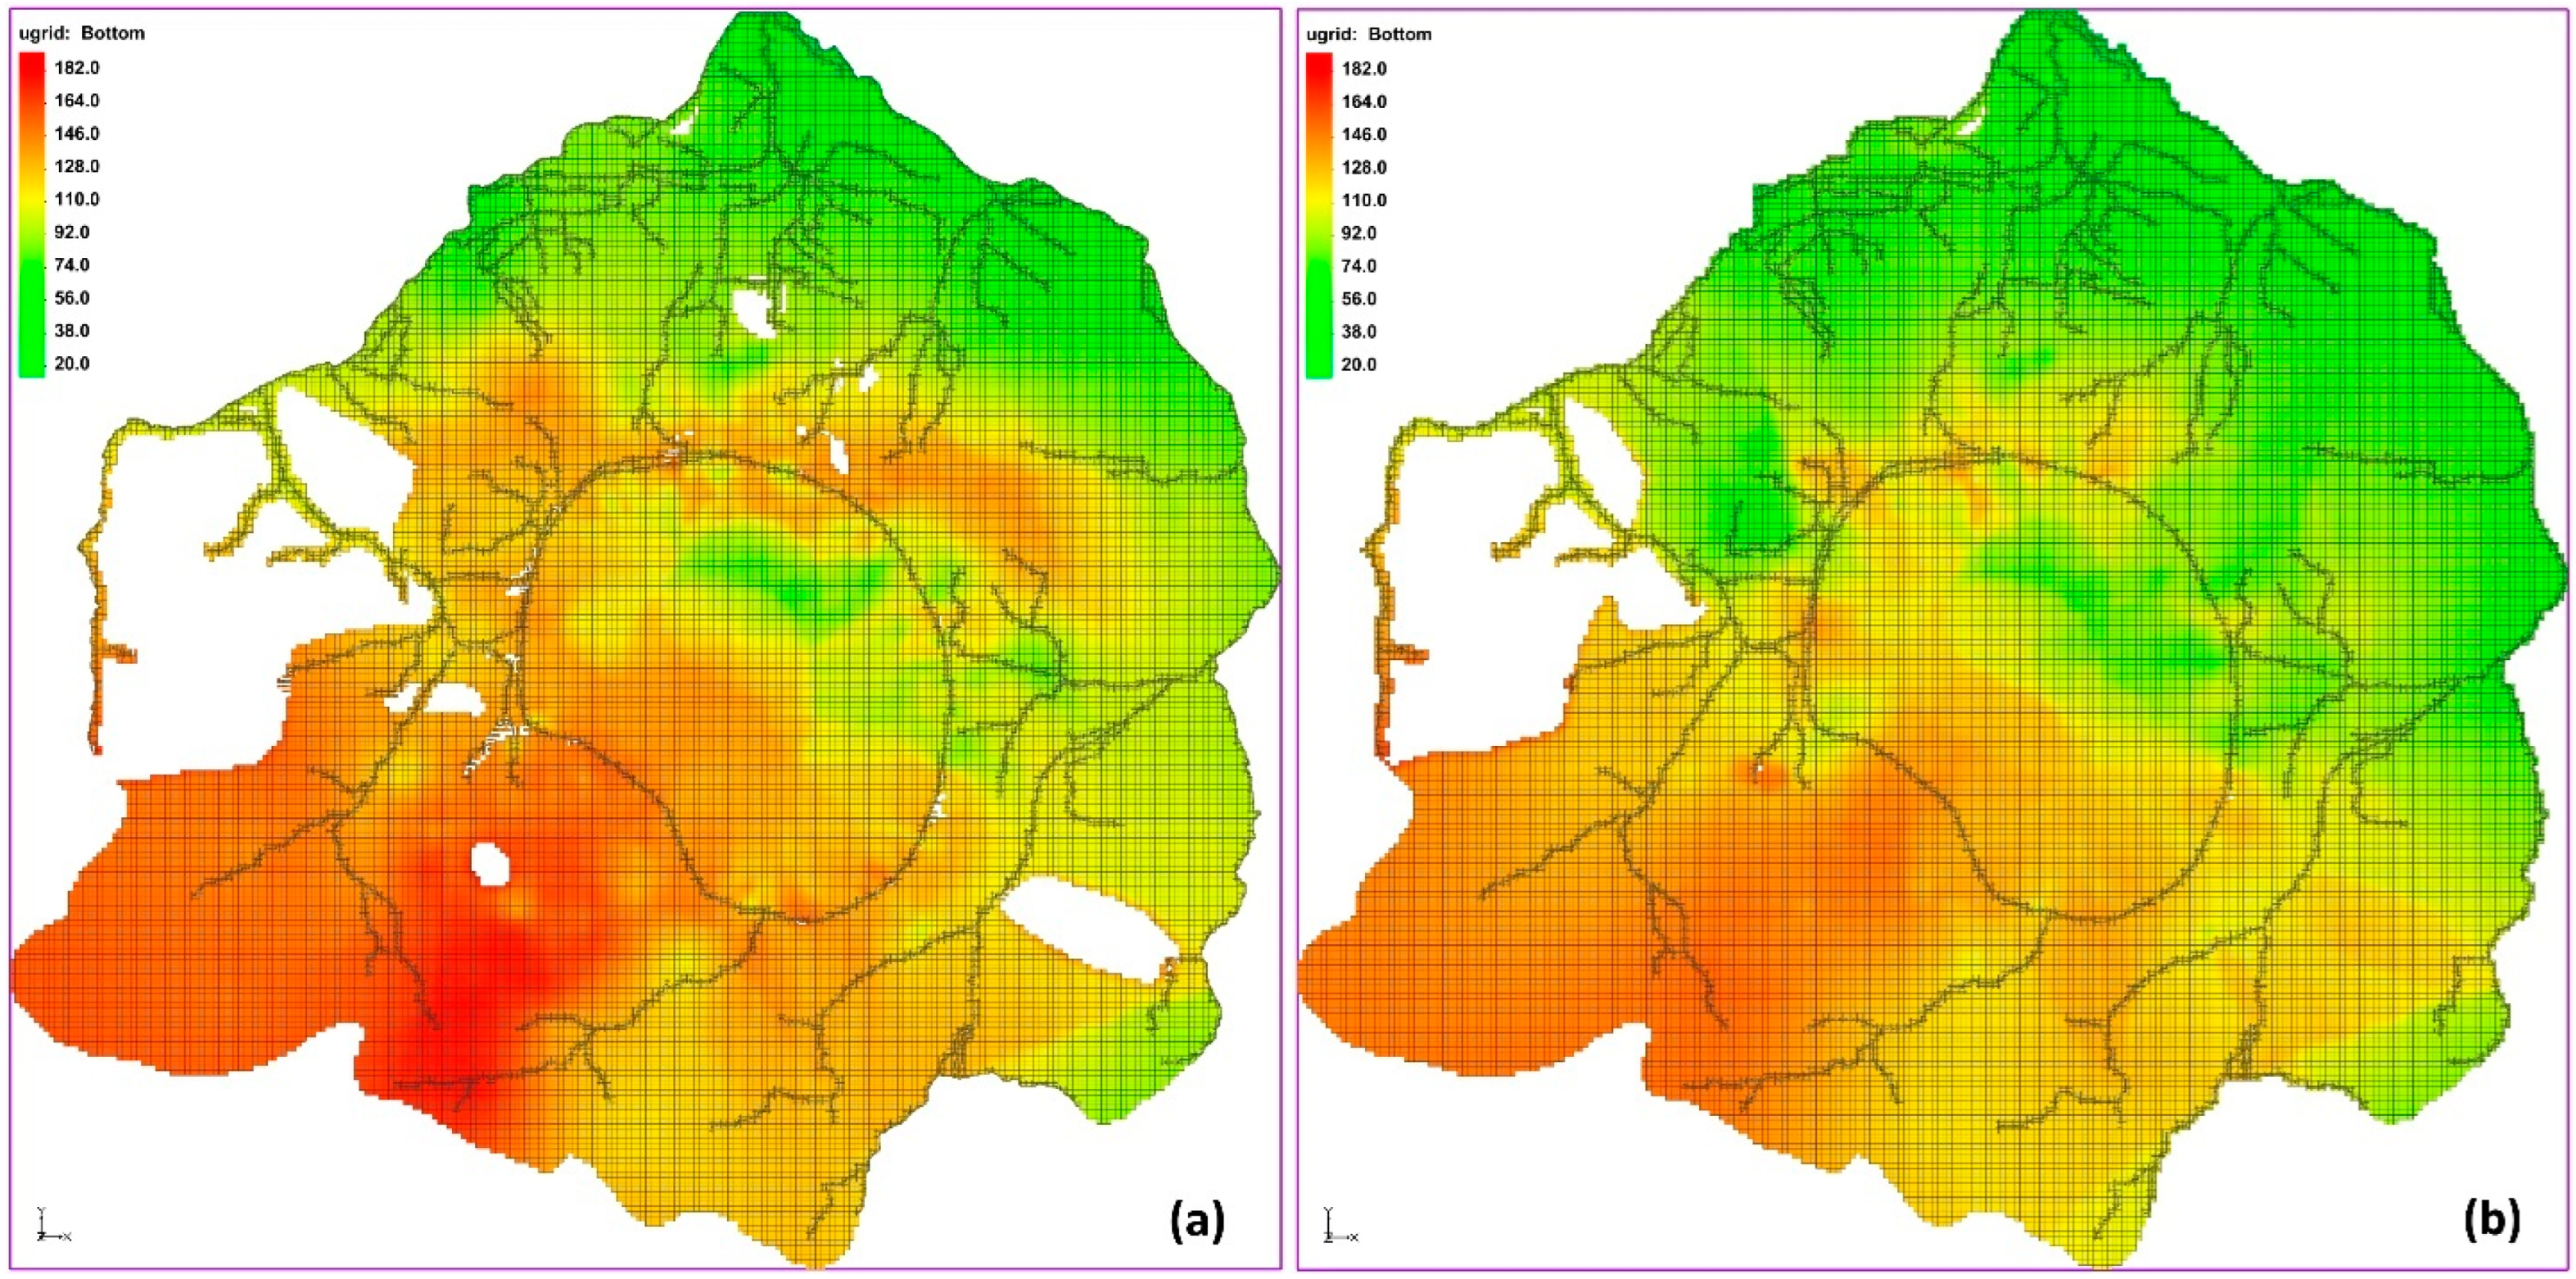
3.1. Model Grid

A discretization grid serves as the framework onto which data regarding aquifers, separating layers, their parameters, and boundary conditions are mapped. The discretization of the study area utilized a square grid with a variable cell size, aligning with the latest assumptions of the USG-MODFLOW [28] for calculation procedures based on a flexible grid structure.
For the majority of the modeled area, the basic block dimensions were set to 50 × 50 m. However, in river valleys, these dimensions were halved to 25 × 25 m, while blocks measuring 12.5 × 12.5 m were employed in the vicinity of watercourses (Figure 6). The active portion of the model, delimited by the adopted boundaries, spans an area of 110.156 km², with an average width (WE) ranging from 12 to 12.5 km and a length (NS) spanning from 12.5 to 13.0 km. Inactive blocks were designated in the regions of the confirmed absence of the layer, as well as in all layers beyond the model boundaries.
The density of the computational nodes adopted in the model facilitated the mapping of locally significant hydraulic gradients and parameter variability, enabling the analysis of hydrodynamic changes within the simulated impact zone of the landfill.

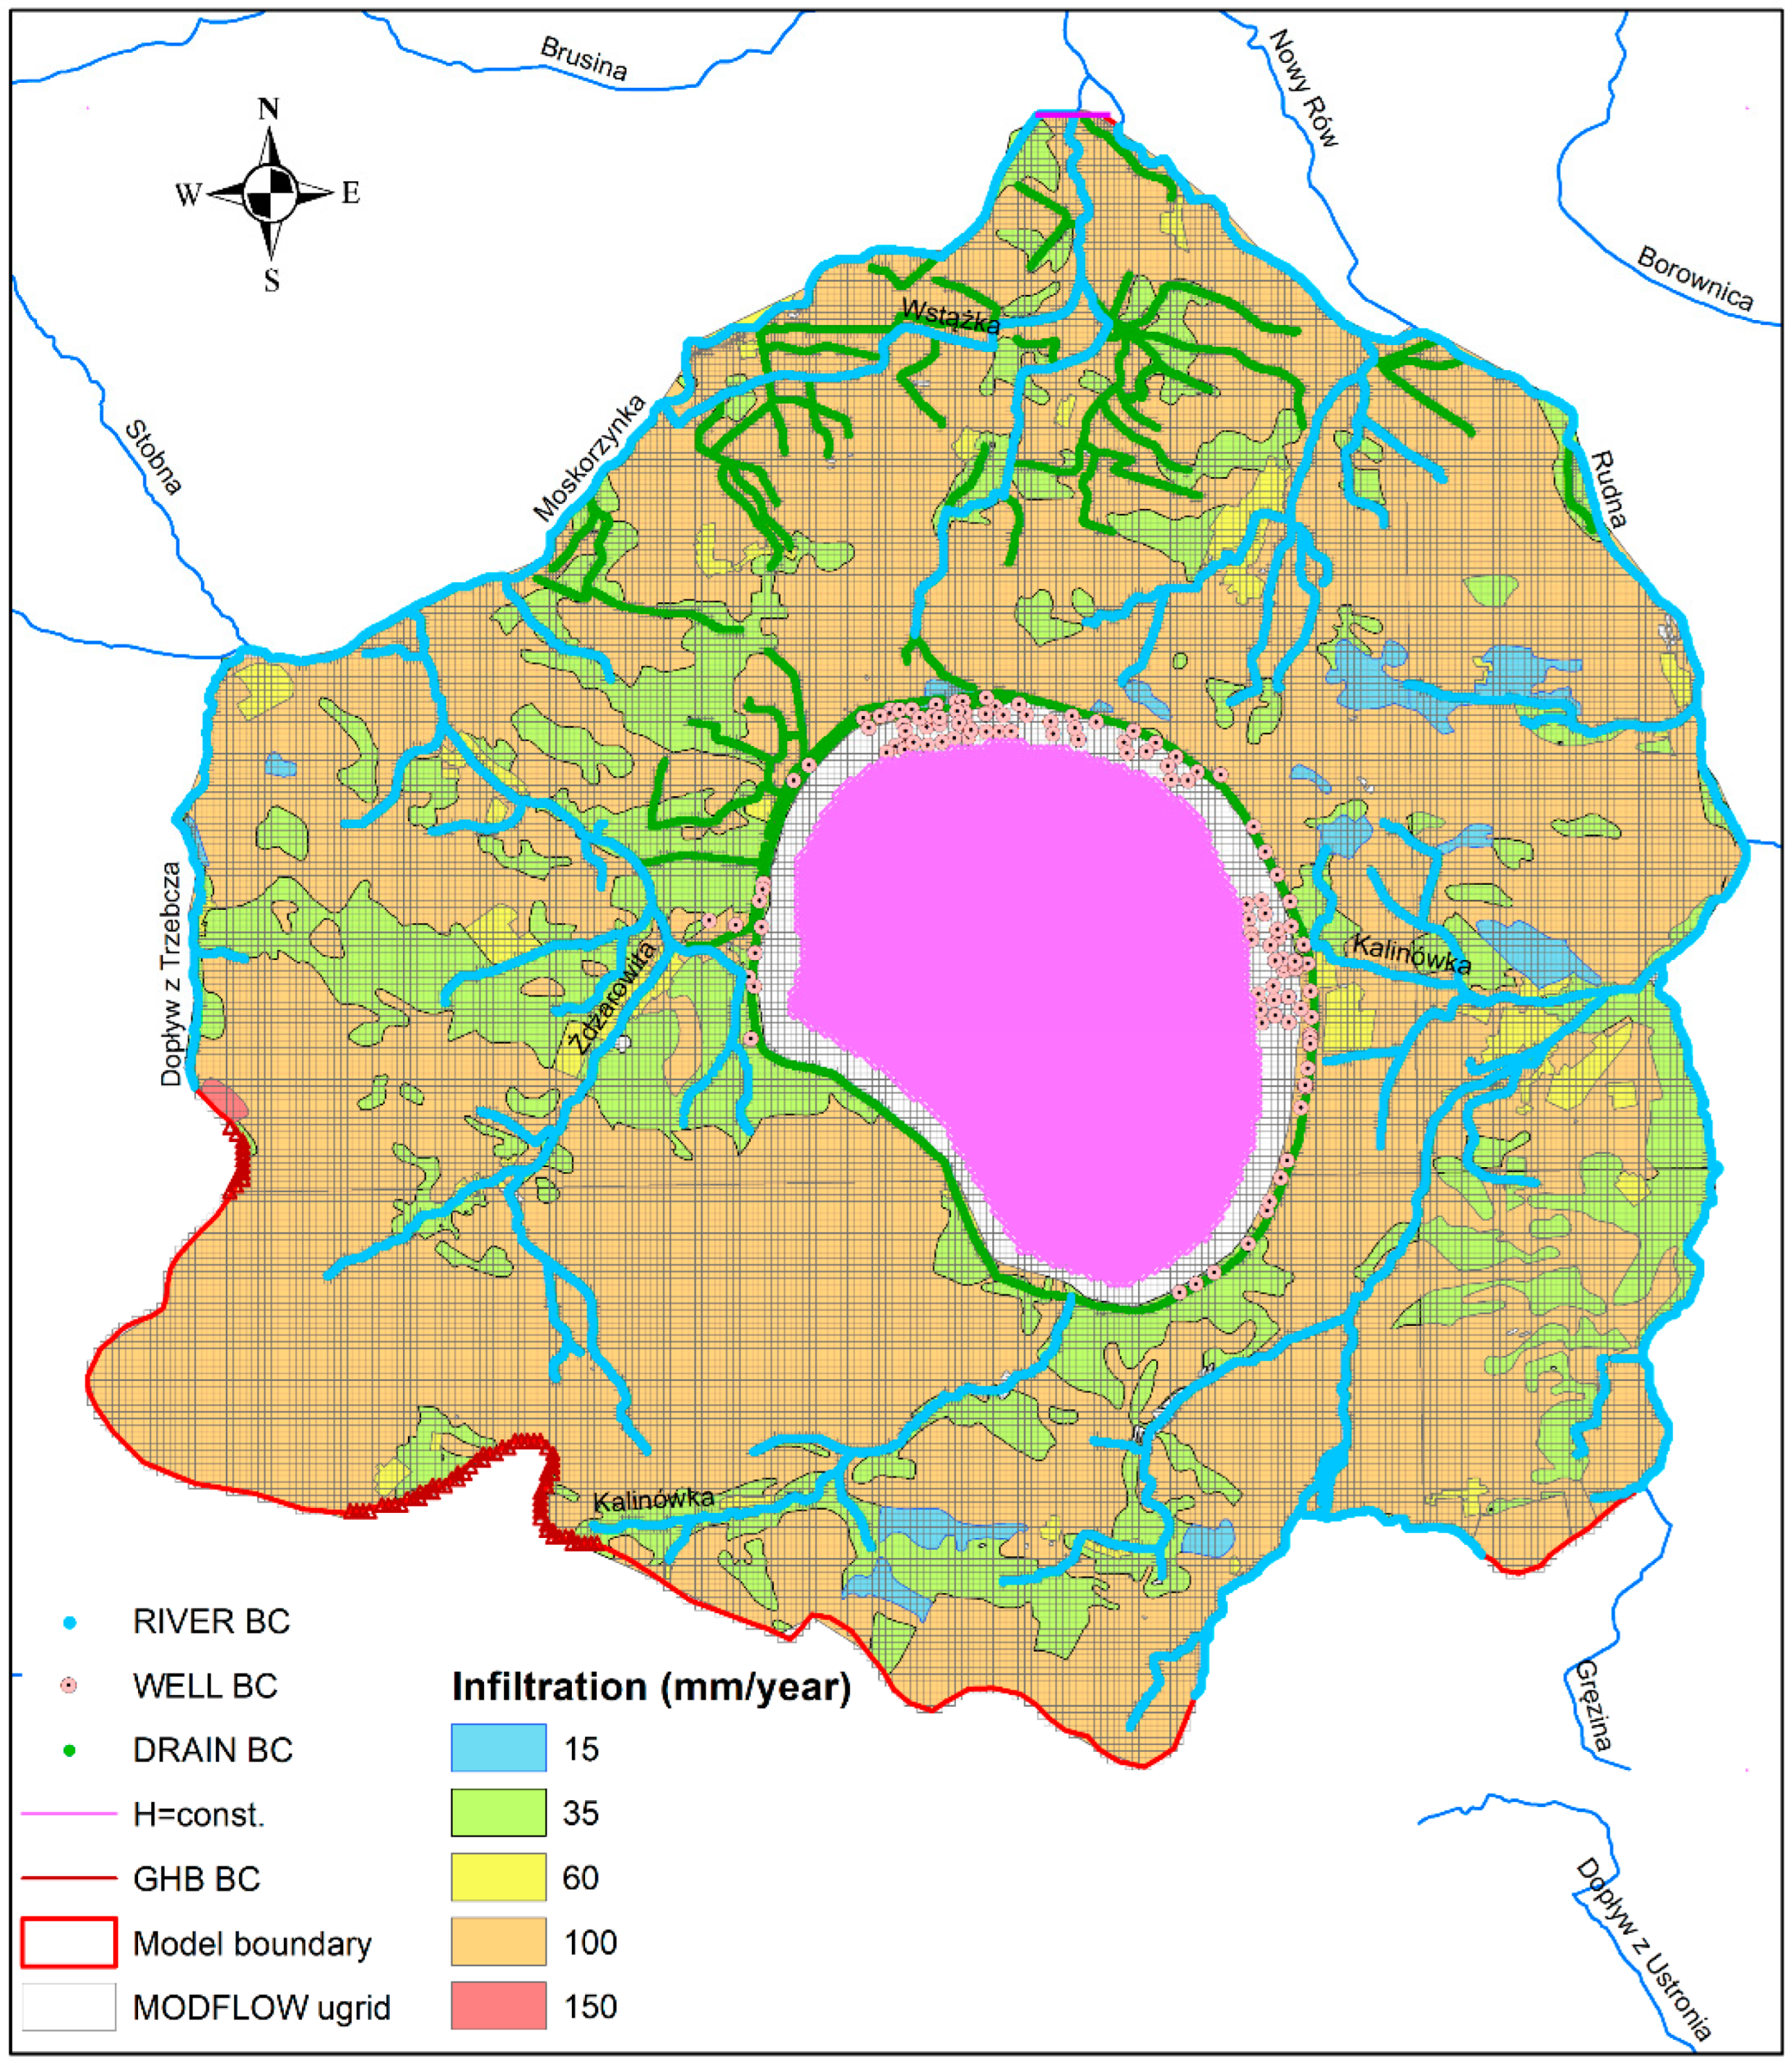
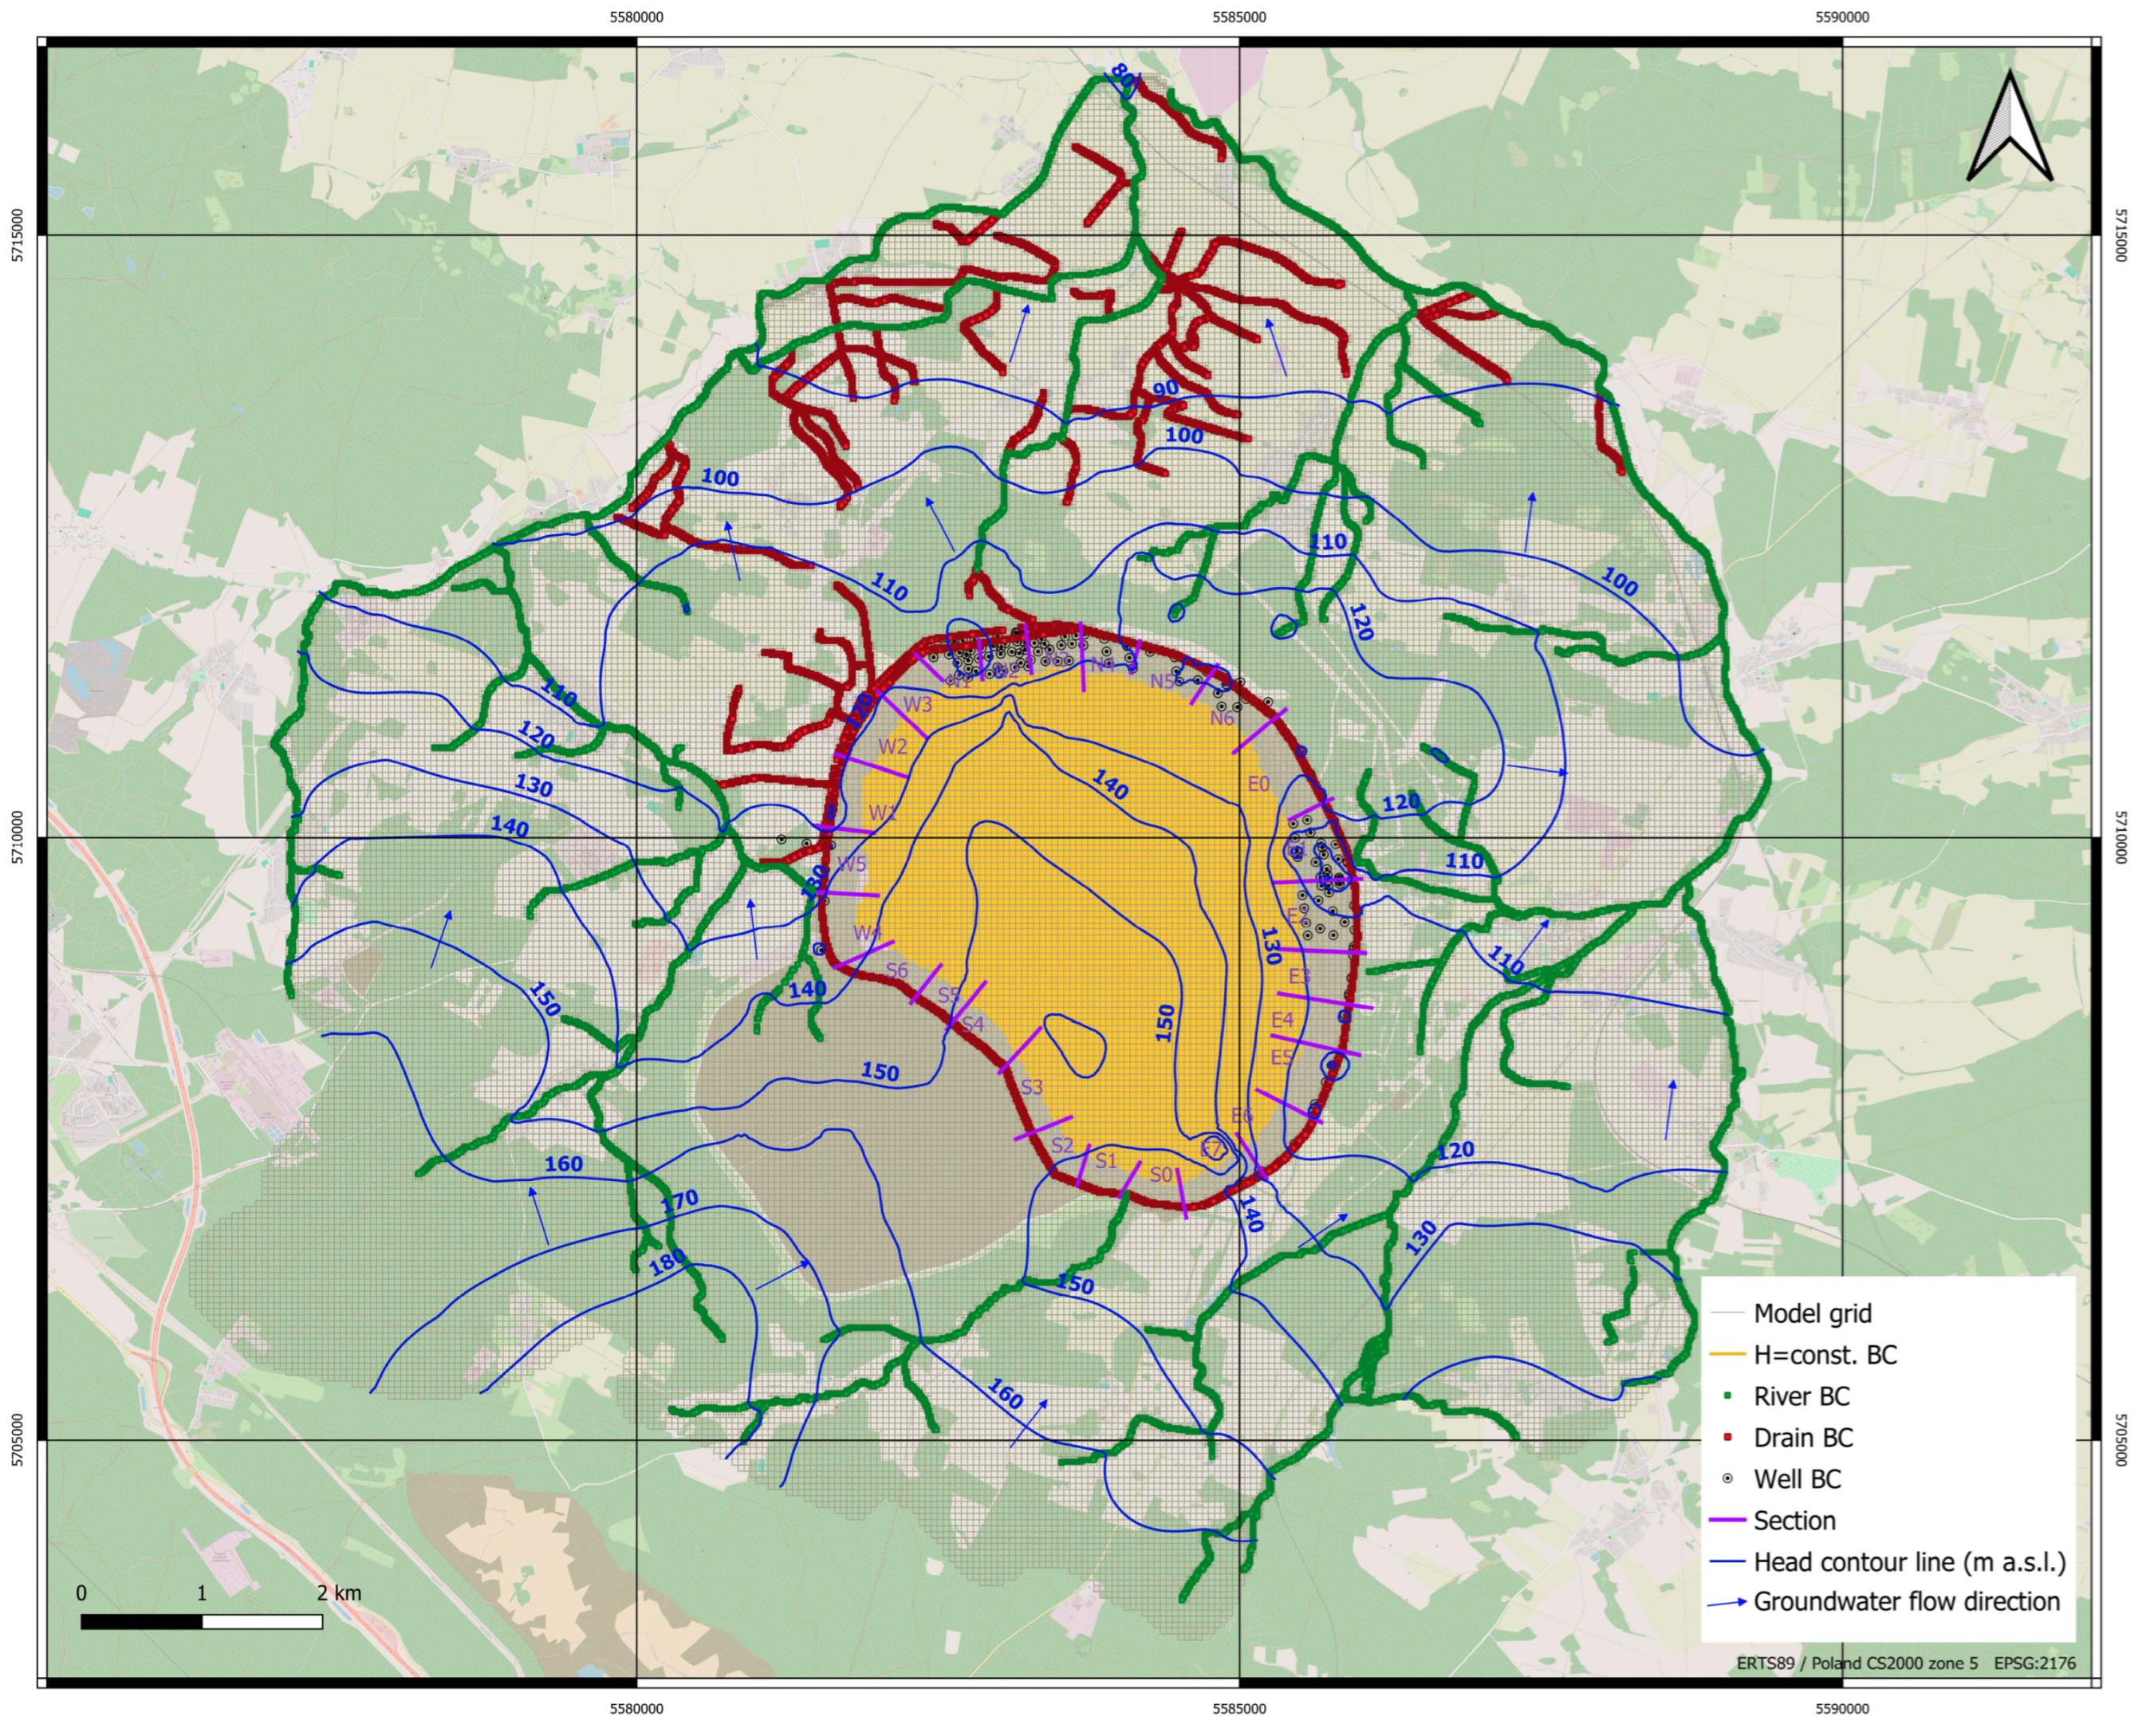
3.2. Model Structure and Boundary Conditions

Based on data regarding the top and bottom elevations of aquifers, the structure of the numerical model was developed. Integration was achieved using several dozen files with Lidar data, covering an area with a digital terrain model (DTM) resolution of 10 m. The conversion process of the DTM and subsequent layers into the grid was carried out using ArcGIS 10.8 software to ensure topological control over the arrangement of distinct layers, resulting in the final representation of the hydrostructural system. The presented configuration of the bottom of layers 2 and 3 indicates that the elevation consistently increases from north to south, rising from 20–40 m a.s.l. to 160–80 m a.s.l. (Figure 6).
The subsequent stage involved introducing boundary conditions and parameters into the model. The boundary conditions of the first, second, and third types were delineated (Figure 7), corresponding to various modules of the MODFLOW program responsible for representing different aspects of groundwater inflow, recharge, and drainage.
The external boundary conditions are associated with permanent structural or hydraulic boundaries, such as groundwater divides, surface watercourses, and reservoirs. The initial hydraulic head conditions were established in alignment with the recorded measurements of boreholes and piezometric contour maps derived from the hydrogeological model.
Boundary conditions of the first type, where hydraulic head (H) remains constant, were established in the aquifers along their outer northern boundary. This condition represents groundwater outflow over a relatively small section of the boundary across the river valley. For areas not covered by other conditions, fragments of the study area had boundary conditions of the second type (Q = 0), indicating no flow. Vertical drainage wells were replicated using the second type of boundary condition (Q = const.). Furthermore, the second type of boundary condition (Q = const.) was applied to represent permanent recharge. This condition involved assigning constant values to the highest active layer within the designated region (Figure 7). The modeled area was divided into five zones based on the prepared lithological map of subsurface formations, each exhibiting varying rock permeability. Consequently, the initial estimates of the effective infiltration values ranged from 15 mm/a to 150 mm/a across these zones.
Boundary conditions of the third type Q = f(H) (GHB) were incorporated into aquifers (layers 3 and 5) along the southern border of the area to account for the potential lateral groundwater inflow. Additionally, boundary conditions of the third type, Q = f(H) (RIVER), were employed to simulate the influence of surface water on groundwater drainage. This condition facilitated the replication of rivers and their tributaries.
Moreover, the third type of boundary conditions (DRAIN) was utilized to model the system of ring drains around the landfill and the upper sections of rivers and small watercourses/ditches, particularly in the immediate vicinity of the facility. This enabled the accurate estimation of water discharge percolating from the reservoir and the drainage role of numerous small watercourses.

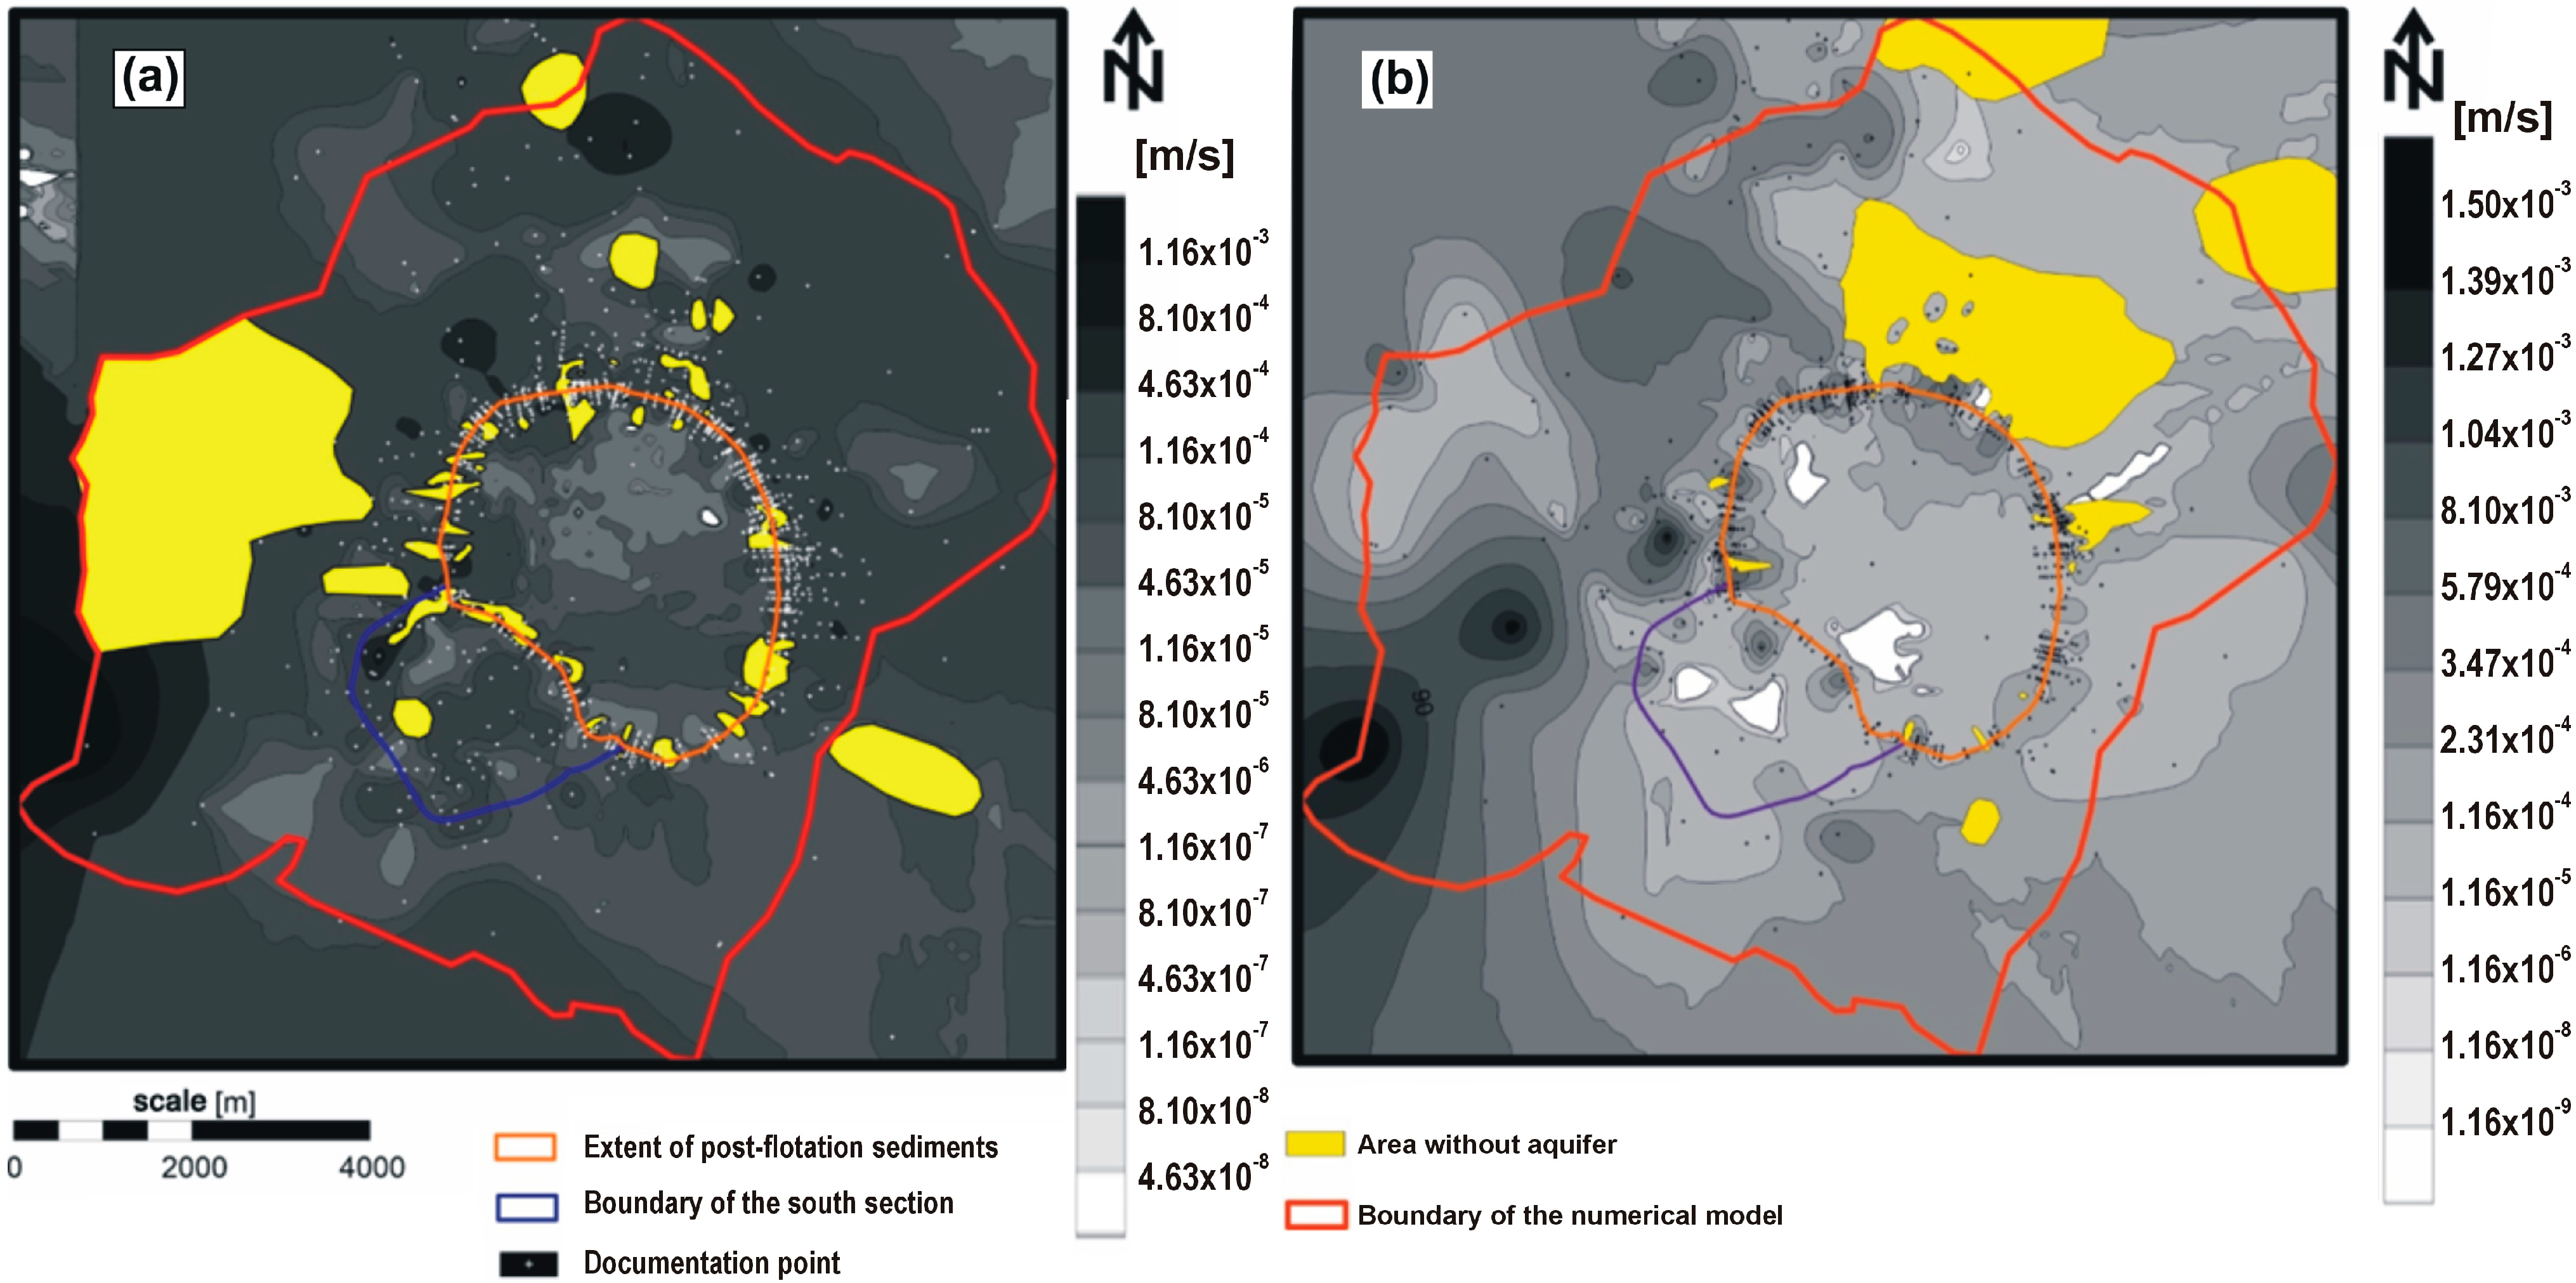
3.3. Hydraulic Conductivity of Tailings

The hydraulic conductivity of the tailings obtained by MRS studies was about 10−6 m/s. Overlays of rocks with lower filtration parameters (10−7 m/s) and low porosity (ca. 1–3%) appeared at depths of 5–7 and 14–16 m (Figure 8). Throughout the entire sounding profile, the variation in K ranged from 10−5 m/s to 10−7 m/s, making it possible to classify the tailings as poorly permeable to semipermeable soils.
The MRS results show that the filtration parameters of the tailings sediments are an order of magnitude higher than those in previous infiltration studies [30], when values of K in the range of 10−8–10−9 m/s were recorded.

3.4. Model Calibration and Verification

The calibration process was intended to match the numerical model to field observations. The calibration was performed for the hydrodynamic state average for 2019, taking into account both measurements of the hydraulic heights and the measurable balance elements. Expert corrections were made through trial and error in such a way that after several hundred model runs, the heads were adjusted to the values measured in piezometers (Figure 9). The calculations for the fourth main layer accurately reflect the hydrodynamic situation in the forelands. As with the second layer, the discrepancies increased within the reservoir itself and the slopes. The average absolute error within the foreground was up to 2.5 m.
The obtained results were additionally verified in terms of a detailed identification of the inflows to the drainage systems in individual foregrounds of the reservoir (Figure 1). Due to the scale of mapping, the annular drainage, supporting drainage, dam foot drainage, and ditches were treated together, divided into individual foregrounds. Very good compliance was obtained, as the total drainage value of just over 20,000 m3/d differed only by approximately 3% compared to the calculations, as shown in Table 1.

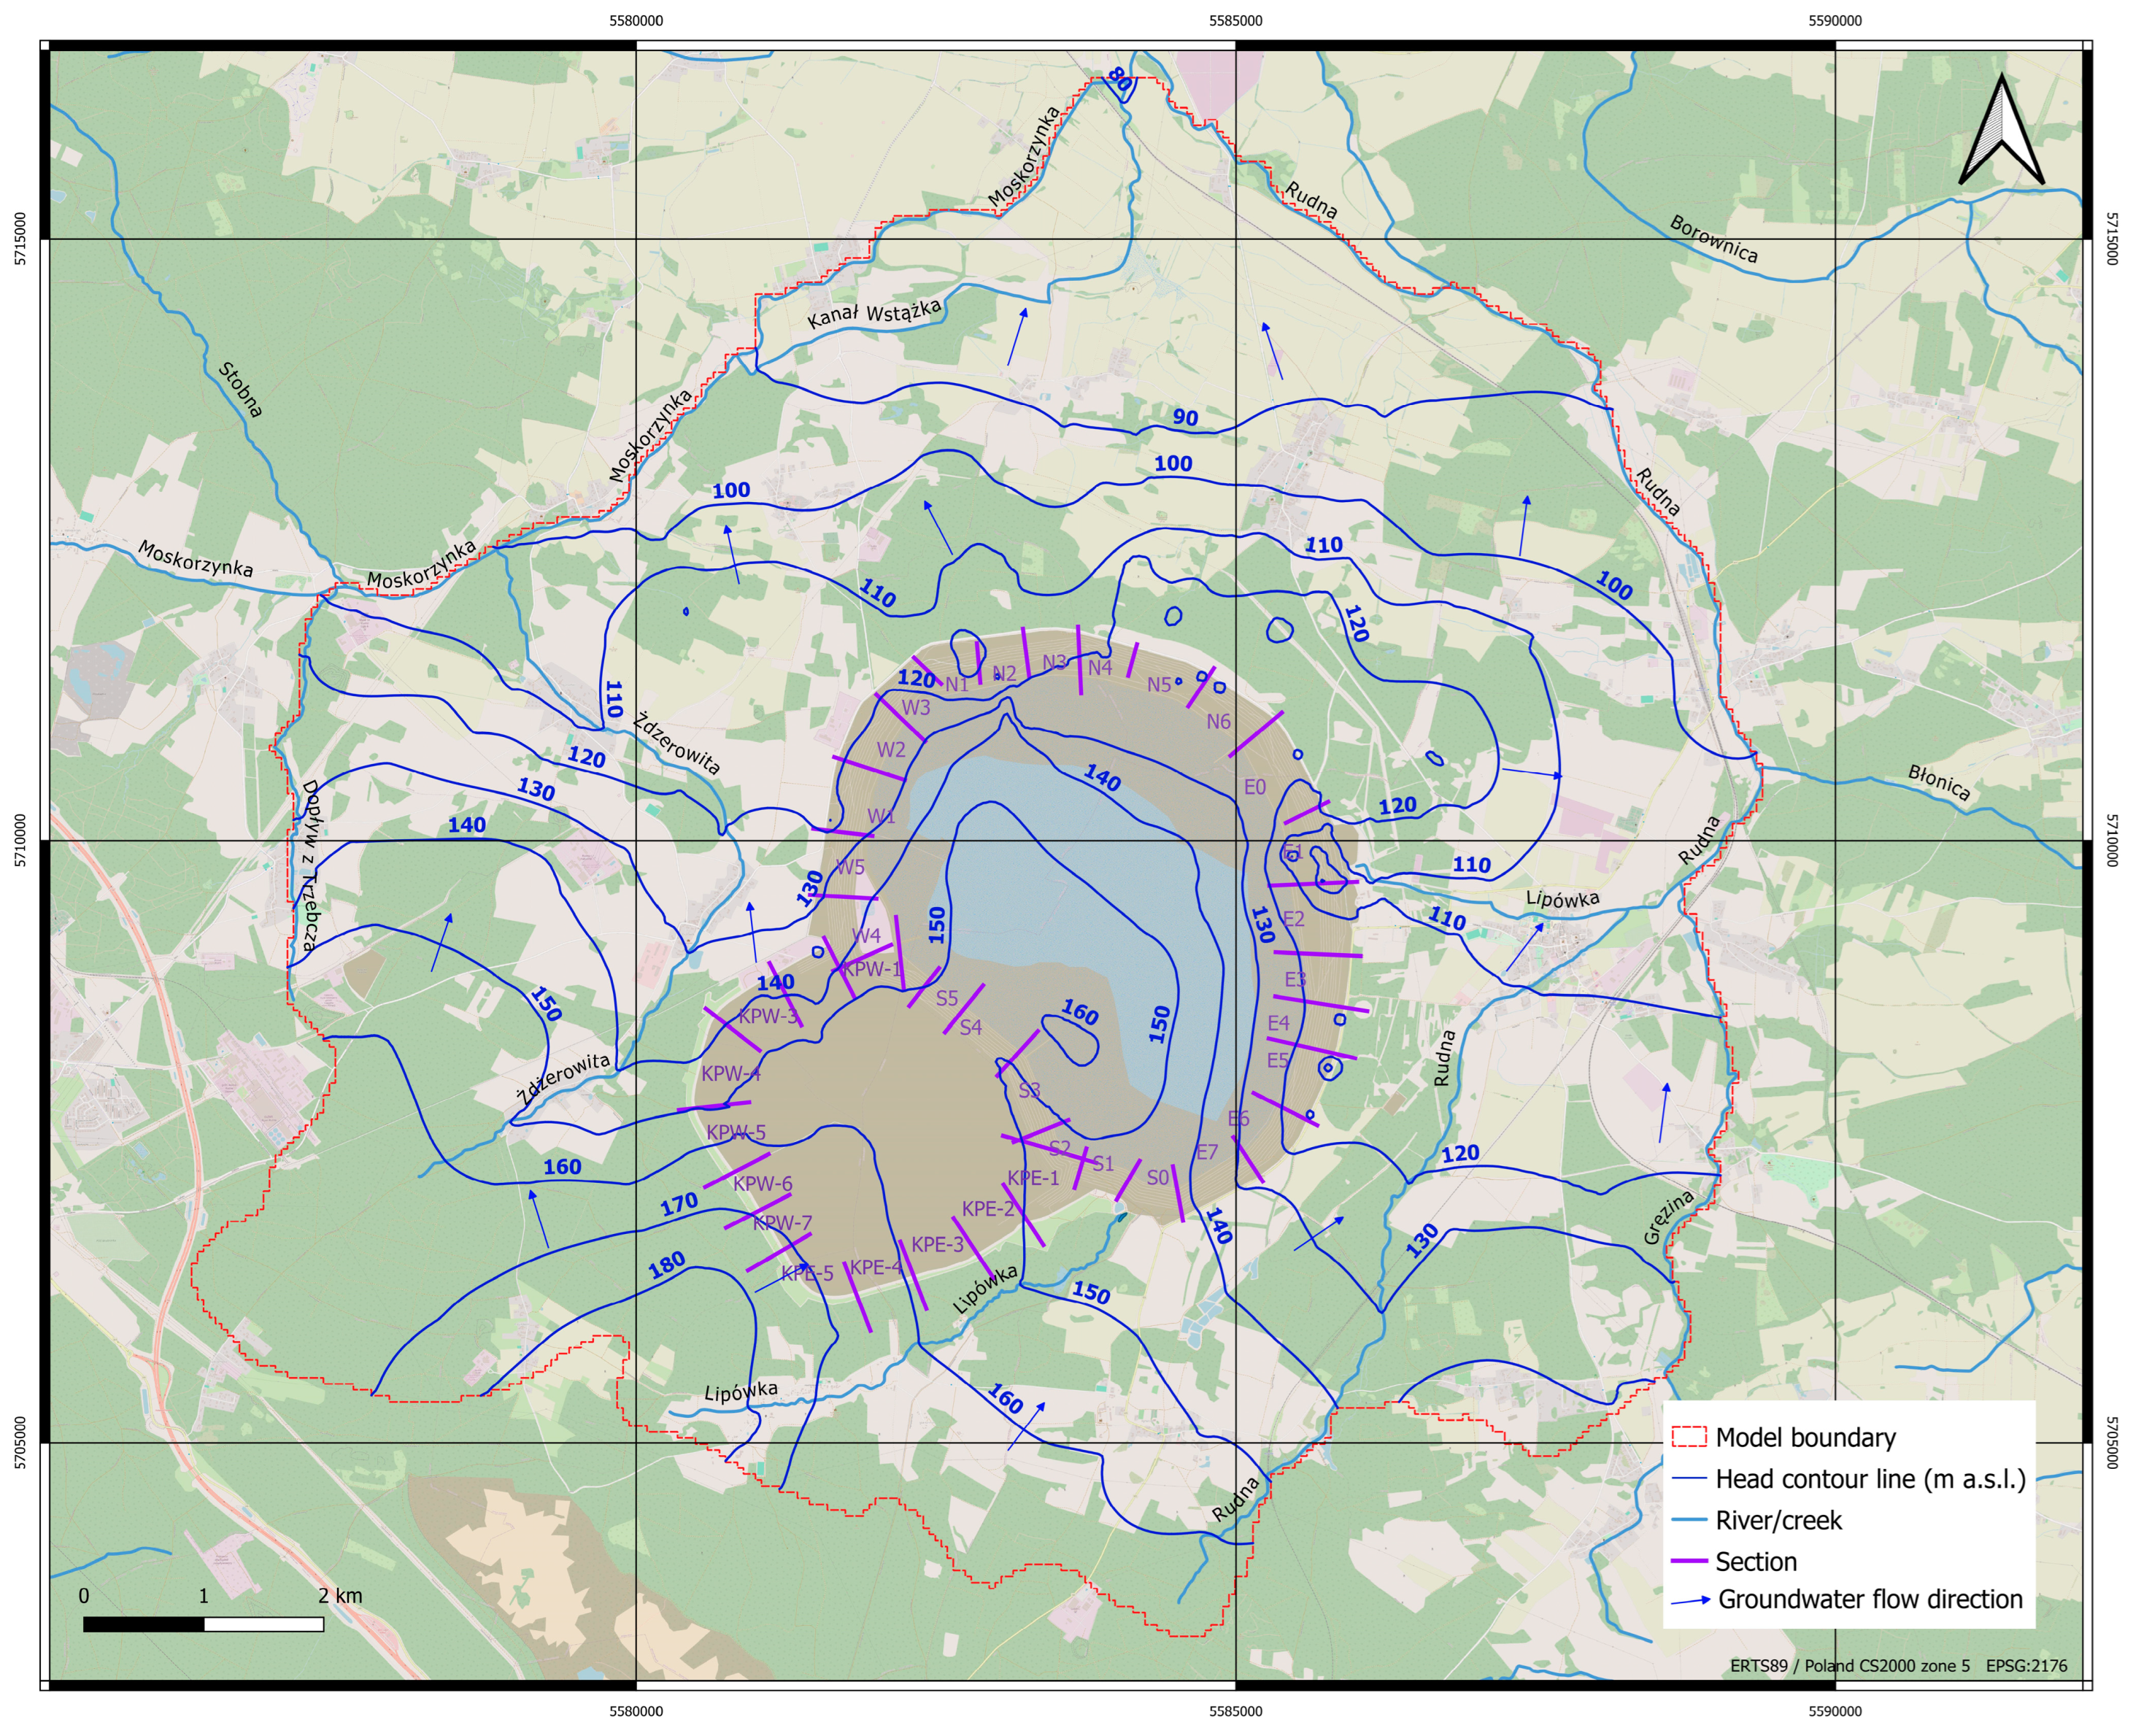
3.5. Hydrodynamic Forecasts on the Model

Following the initiation of the model, certain cells, particularly in layer 3, experienced desiccation due to the lowering of the water table below the layer’s bottom. This phenomenon predominantly occurred in areas lacking piezometers, suggesting a potentially greater discontinuity within the upper aquifer compared to the initially developed hydrogeological model. After calibration, the shapes of the water table in the model layers exhibit significant similarity. Generally, a dominant north-westward direction of groundwater flow is observed beneath the reservoir. However, in the central region, the water level within the landfill notably influences the hydrodynamic system (Figure 10). Hydraulic heads in this area range between 150 m a.s.l. and 170 m a.s.l., resulting in a radial divergent flow of water streams. While a portion of the saline water is intercepted by the drainage system surrounding the reservoir, a substantial amount migrates to its foreground according to the hydraulic gradients.
At this stage of the project, the primary focus was on illustrating changes in the hydrodynamic field resulting from the inclusion of the southern section [39]. Significant changes in the hydraulic gradients and flow directions are anticipated, which will consequently impact the future movement of saline water from the landfill (Figure 10 vs. Figure 11). The forecast for the water table level in the second aquifer (layer 5 of the model) for 2026 indicates that, akin to the situation in 2019, groundwater filtration from the facility will occur primarily through the first sand–gravel aquifer and the deeper second aquifer, predominantly toward the northwest and east, and partially to the north and northeast (Figure 11). Piezometric contour lines in the second aquifer exceed 160 m a.s.l. beneath the main facility and the southern section. In the vicinity of the MWSF foreground, the water table ranges from 110 m a.s.l. to 130 m a.s.l. Moving further south, the hydraulic heads increase, with levels around the southern section ranging from 135 m a.s.l. to 170 m a.s.l. As depicted on the map, the Żdżerowita, Kalinówka, and Rudna Rivers serve as the primary groundwater drainage outlets in this region, leading to the influx of saline waters into various sections of these watercourses.
In the literature, we could find many examples of hydrodynamic modeling and contaminant migration in the environment of tailings ponds. Compared to the model presented in this article, the models shown in the literature are characterized by a different hydrogeological schematization [40,41], the size of the pond, the way the parameters are introduced and their distribution [41], and the purpose of the study. Typically, the facilities are smaller. In many cases, the simulations focus on the occurrence of failure or its probability [42]. No case in the literature has encountered a geological database as rich and as meticulously analyzed as that of the Żelazny Most area. Even with the very significant size of the reservoirs, an incomparably smaller amount of data on the geological boreholes was available. A similar site (area of 18.8 km2), located in Kazakhstan, was analyzed in [43], but they did not reflect directly on the model of seepage through tailings. Some of the layers were reflected with a constant thickness. In addition, they had 18 point measurements of the water table. An interesting example of a solution in MODFLOW can also be found in [44], which was aimed at a groundwater depletion in representative aquifers of Greece. Although it was decided to simplify the model schematization by using a single layer and a single value of hydraulic conductivity, a number of scenarios were carried out to assess the zones of groundwater depletion.

4. Conclusions

The primary objective of the Żelazny Most MWSF is to efficiently gather the waste produced during the copper ore flotation process, serving as an essential component within the copper production chain. This facility is subject to rigorous environmental and technical monitoring, yielding a substantial dataset, including information concerning groundwater dynamics. With the addition of the southern section, significant changes in the hydraulic gradients and flow patterns are anticipated, influencing the migration of saline waters from the landfill. Nevertheless, comprehensive technical measures are envisaged to mitigate such effects. It is hoped that these complex issues can be accurately replicated in the recently developed model, facilitating better understanding and management in the future.
The development of the numerical filtration model represents a novel approach to mapping the hydrostructural system in the Żelazny Most region. Implementing the model in such complex environmental conditions allows for the use of these experiences in research on other such facilities. A total of 170,000 boreholes were utilized, over 300 geological cross-sections were analyzed, and numerous drainage sections were mapped with their specific parameters. All these data were incorporated into an unstructured grid, significantly enhancing the precision of the project, which involves one of the world’s largest tailings storage facilities.
The construction of the numerical model was founded upon a wealth of collected materials and their interpretations pertaining to the aquifer system within the designated region. These resources were further enriched by the findings from field research conducted at earlier stages of the project. All available data were meticulously integrated to establish a comprehensive hydrogeological model, serving as the foundation for the subsequent development of the numerical model.
The outcomes are very promising, with the simulated groundwater table demonstrating compliance with field measurements. Predominant flow patterns were observed in the north and northwest directions, indicating a discernible influence of the Mining Waste Storage Facility (MWSF) on the hydrodynamic system and natural outflow directions.
While the developed model successfully met the calibration requirements and demonstrated a satisfactory degree of resemblance to the actual hydrological system, its intricate nature resulted in a significantly slow computational performance. Running a transport model to effectively simulate chloride migration based on proven modules [45,46,47] can be difficult. However, it is considered that the constructed model is already fully functional and can constitute a good basis for further investigations regarding planned changes to the facility.
This article demonstrates that by combining the analysis of multiple water balance elements and collected environmental data, a detailed hydrogeological schematization can be effectively achieved. This approach yields accurate results for a hydrogeological model using an irregular discretization grid, even in large and complex cases, such as the Żelazny Most MWSF.

Author Contributions

Conceptualization, J.G.; methodology, J.G., M.W., and S.B.; software, J.G. and M.W.; formal analysis, J.G., M.W., and S.B.; investigation, J.G., M.W., S.S., S.B., M.M., and T.O.; data curation, J.G., M.W., M.M, T.O., and R.T.; writing—original draft, J.G., M.W., S.S., and S.B.; writing—review and editing, J.G.; visualization, J.G., M.W., S.B., and T.O.; supervision, J.G., S.S., and M.W.; project administration, S.S. and S.B.; funding acquisition, S.S., S.B., and M.M. All authors have read and agreed to the published version of the manuscript.

Funding

As part of many years of cooperation with KGHM Polska Miedź S.A., and thanks to funding from the NCBiR, CuBR project (CuBR-IV/04/NCBR/2019), it was possible to conduct this research.

Data Availability Statement

The raw data supporting the conclusions of this article will be made available by the authors on request.

Acknowledgments

We would like to thank the management and the hydrogeological service of the Żelazny Most MWSF for their fruitful collaboration. We acknowledge the anonymous reviewers that contributed to the improvement of the manuscript.

Conflicts of Interest

The authors declare no conflicts of interest.

References

  1. Cacciuttolo, C.; Atencio, E. Past, Present, and Future of Copper Mine Tailings Governance in Chile (1905–2022): A Review in One of the Leading Mining Countries in the World. Int. J. Environ. Res. Public Health 2022, 19, 13060. [Google Scholar] [CrossRef] [PubMed]
  2. Wu, D. Solutions for Surface Disposal of Mine Tailings BT—Mine Waste Management in China: Recent Development; Wu, D., Ed.; Springer: Singapore, 2020; ISBN 978-981-32-9216-1. [Google Scholar]
  3. Cacciuttolo, C.; Tabra, K. Water Management in the Closure of Tailings Storage Facilities. In Proceedings of the 10th International Conference on Acid Rock Drainage and IMWA Conference, Santiago, Chile, 12 April 2015. [Google Scholar]
  4. East, D.; Fernandez, R. Managing Water to Minimize Risk in Tailings Storage Facility Design, Construction, and Operation. Mine Water Environ. 2021, 40, 36–41. [Google Scholar] [CrossRef]
  5. Franks, D.M.; Boger, D.V.; Côte, C.M.; Mulligan, D.R. Sustainable development principles for the disposal of mining and mineral processing wastes. Resour. Policy 2011, 36, 114–122. [Google Scholar] [CrossRef]
  6. Schoenberger, E. Environmentally sustainable mining: The case of tailings storage facilities. Resour. Policy 2016, 49, 119–128. [Google Scholar] [CrossRef]
  7. Kossoff, D.; Dubbin, W.; Alfredsson, M.; Edwards, S.; Macklin, M.; Hudson-Edwards, K.A. Mine tailings dams: Characteristics, failure, environmental impacts, and remediation. J. Appl. Geochem. 2014, 51, 229–245. [Google Scholar] [CrossRef]
  8. Echeverry-Vargas, L.; Ocampo-Carmona, L.M. Recovery of Rare Earth Elements from Mining Tailings: A Case Study for Generating Wealth from Waste. Minerals 2022, 12, 948. [Google Scholar] [CrossRef]
  9. Jouini, M.; Royer-Lavallée, A.; Pabst, T.; Chung, E.; Kim, R.; Cheong, Y.-W.; Neculita, C.M. Sustainable Production of Rare Earth Elements from Mine Waste and Geoethics. Minerals 2022, 12, 809. [Google Scholar] [CrossRef]
  10. Ringle Raja, S.; Balamurali, K.; Eunice, S. Evaluating groundwater contamination: An examination of a municipal solid waste dump yard in southern India’s Manchester City. Resour. Conserv. Recycl. Adv. 2023, 20, 200196. [Google Scholar] [CrossRef]
  11. Han, D.; Tong, X.; Currell, M.; Cao, G.; Jin, M.; Tong, C. Evaluation of the impact of an uncontrolled landfill on surrounding groundwater quality, Zhoukou, China. J. Geochem. Explor. 2014, 136, 24–39. [Google Scholar] [CrossRef]
  12. Mahdi, A.; Shakibaeinia, A.; Dibike, Y.B. Numerical modelling of oil-sands tailings dam breach runout and overland flow. Sci. Total Environ. 2020, 703, 134568. [Google Scholar] [CrossRef]
  13. Wang, K.; Yang, P.; Yu, G.; Yang, C.; Zhu, L. 3D Numerical Modelling of Tailings Dam Breach Run Out Flow over Complex Terrain: A Multidisciplinary Procedure. Water 2020, 12, 2538. [Google Scholar] [CrossRef]
  14. Palmer, J. Simulation of Tailings Filtration Performance. In Proceedings of the 23rd International Conference on Paste, Thickened and Filtered Tailings; Quelopana, H., Ed.; Gecamin Publications: Santiago, Chile, 2020. [Google Scholar] [CrossRef]
  15. Do, T.M.; Laue, J.; Mattsson, H.; Jia, Q. Numerical Analysis of an Upstream Tailings Dam Subjected to Pond Filling Rates. Appl. Sci. 2021, 11, 6044. [Google Scholar] [CrossRef]
  16. Ubechu, B.O.; Opara, A.I.; Onyekuru, S.O.; Ikechukwu, C.C.; Ofoh, I.J.; Okechukwu, S.I.; Nwokeabia, C.N.; Iwuoha, P.O.; Ajaegbu, E.E. Hydrogeological assessment and contaminant transport modelling of Enyimba landfill site in Aba, Nigeria. Water Pract. Technol. 2024, 19, 2108–2124. [Google Scholar] [CrossRef]
  17. Juanting, N.; Litang, H.; Menglin, Z. Transport of ammonia nitrogen for groundwater pollution control in an informal low-permeability landfill site. Hydrol. Res. 2022, 53, 370–384. [Google Scholar] [CrossRef]
  18. Ntona, M.M.; Busico, G.; Mastrocicco, M.; Kazakis, N. Modeling groundwater and surface water interaction: An overview of current status and future challenges. Sci. Total Environ. 2022, 846, 157355. [Google Scholar] [CrossRef]
  19. Czaban, S.; Dąbrowski, A. Impact of Industrial Tailings Pond on Surface Water; American Science Press: Stevenson Ranch, CA, USA, 2007; Volume 1, pp. 133–140. ISBN 978-0976885382. [Google Scholar]
  20. Czaban, S.; Fialkiewicz, W.; Kabala, C. Potential Impact of Tailings Pond on Crop and Forest Production. In Proceedings of the Third IASTED International Conference on Environmental Modelling and Simulation, Honolulu, HI, USA, 20–22 August 2007; pp. 103–108. [Google Scholar]
  21. Duda, R.; Witczak, S. Stały model hydrogeologiczny rejonu zbiornika Żelazny Most jako podstawowe narzędzie do oceny oddziaływania na środowisko i sposobów ochrony wód podziemnych. In Współczesne Problemy Hydrogeologii; Poprawski, L., Bocheńska, T., Eds.; Wydawnictwo Sudety: Wrocław, Poland, 1993; pp. 197–204. [Google Scholar]
  22. Duda, R.; Witczak, S. Modeling of the transport of contaminants from the Żelazny Most flotation tailings dam. Gospod. Surowcami Miner. 2003, 19, 69–88. [Google Scholar]
  23. Witczak, S.; Duda, R.; Szklarczyk, T.; Foryciarz, K. Kompleksowa Ocena Oddziaływania Składowiska ”Żelazny Most” na Wody Podziemne i Powierzchniowe do 2000 Roku Wraz z Uaktualnioną Koncepcją Ochrony Wód; Zakład Hydrogeologii i Ochrony Wód, AGH Kraków: Krakow, Poland, 2002. [Google Scholar]
  24. Gurwin, J.; Wąsik, M. Analiza skuteczności pracy bariery hydraulicznej na przedpolu składowiska osadów poflotacyjnych na podstawie badań modelowych. Górnictwo Odkryw. 2018, 2, 76–84. [Google Scholar]
  25. Świdziński, W.; Maciejewski, S.; Świtała, B.; Walter, A. Kompleksowa Ocena Oddziaływania obiektu unieszkodliwiania odpadów wydobywczych (OUOW) „Żelazny Most” na wody podziemne i powierzchniowe wraz z uaktualnioną koncepcją ochrony wód; IBW PAN—BMT ARGOSS: Gdańsk, Poland, 2018. [Google Scholar]
  26. Staśko, S.; Gurwin, J.; Wcisło, M.; Modelska, M.; Kryza, H.; Kryza, J.; Olichwer, T.; Buczyński, S.; Tarka, R.; Wąsik, M.; et al. Model koncepcyjny systemu hydrogeologicznego obszaru oddziaływania Lubińsko Głogowskiego Obszaru Miedzionośnego (LGOM). Biul. PIG 2012, 451, 203–211. [Google Scholar]
  27. Gurwin, J.; Wcisło, M.; Staśko, S.; Tarka, R. Numerical hydrogeological model of copper mine deposits of KGHM Polska Miedź S.A. In Innovation in the Copper Industry; Czopek, M., Greń, P., Wojciechowicz, A., Eds.; Wyd. Nauk. FNCE: Poznań, Poland, 2022; pp. 140–150. ISBN 978-83-67138-50-5. [Google Scholar]
  28. Panday, S.; Langevin, C.D.; Niswonger, R.G.; Ibaraki, M.; Hughes, J.D. MODFLOW–USG Version 1: An Unstructured Grid Version of MODFLOW for Simulating Groundwater Flow and Tightly Coupled Processes Using a Control Volume Finite-Difference Formulation: U.S. Geological Survey Techniques and Methods; USGS: Reston, VA, USA, 2013; 66p. [Google Scholar] [CrossRef]
  29. Fetter, C.W.; Kreamer, D. Applied Hydrogeology, 5th ed.; Waveland Press: Long Grove, IL, USA, 2021. [Google Scholar]
  30. Werno, M. Uszczelnienie Czaszy Składowiska. Ocena Możliwości Kontynuowania procesu Uszczelniania Czaszy Składowiska żelazny Most Przez Odpady Drobnoziarniste; KGHM Cuprum Sp. z o.o.—CBR: Wrocław, Poland, 2006. [Google Scholar]
  31. Legchenko, A.; Valla, P. A review of the basic principles for proton magnetic resonance sounding measurements. J. Appl. Geophys. 2002, 50, 3–19. [Google Scholar] [CrossRef]
  32. Legchenko, A.; Baltassat, J.M.; Bobachev, A.; Martin, C.; Robain, H.; Vouillamoz, J.M. Magnetic resonance sounding applied to aquifer characterization. Ground Water 2004, 42, 363–373. [Google Scholar] [CrossRef]
  33. Roy, J.; Lubczyński, M. The magnetic resonance sounding technique and its use for groundwater investigations. Hydrogeol. J. 2003, 11, 455–465. [Google Scholar] [CrossRef]
  34. Mohnke, O.; Yaramanci, U. Pore size distributions and hydraulic conductivities of rocks derived from Magnetic Resonance Sounding relaxation data using multi-exponential decay time inversion. J. Appl. Geophys. 2008, 66, 73–81. [Google Scholar] [CrossRef]
  35. Buczyński, S.; Olichwer, T.; Wcisło, M.; Tarka, R. Assessment of groundwater parameters with the use of magnetic resonance in Poland. Carpathian J. Earth Environ. Sci. 2017, 12, 121–130. [Google Scholar]
  36. Gurwin, J.; Wąsik, M. Parametr przesączania osadów korytowych w badaniach zlewni rzeki Rudnej. In Problemy Hydrogeologiczne Południowo-Zachodniej Polski; Dolnośląskie Wyd. Edukacyjne: Wrocław, Poland, 1996; pp. 263–270. [Google Scholar]
  37. Available online: https://danepubliczne.imgw.pl/ (accessed on 20 June 2020).
  38. Kalisz, M.; Worsa-Kozak, M.; Barańska – Buslik, A.; Cygan, S.; Czmiel, J.; Dziedziak, T.; Jastrzębski, J.; Konsencjusz, D.; Markiewicz, A.; Merta, A.; et al. Dokumentacja Hydrogeologiczna Rejonu Składowiska Żelazny Most; KGHM Cuprum Sp. z o.o.—CBR: Wrocław, Poland, 2009. [Google Scholar]
  39. Włostowski, J.; Gregosiewicz, R.; Bentkowski, A.; Chmielewski, W.; Żuk, J.; Makowski, K.; Mirowska, A.; Szklarz, K.; Gontarz, Ż.; Skrzypczyk, A.; et al. Dokumentacja Hydrogeologiczna Określająca Warunki Hydrogeologiczne w Związku z Zamierzonym Wykonaniem Przedsięwzięcia Mogącego Negatywnie Oddziaływać na Wody Podziemne w Rejonie Projektowanej Kwatery Południowej Obiektu Unieszkodliwiania Odpadów Wydobywczych „Żelazny Most”; SEGI-AT: Warszawa, Poland, 2012. [Google Scholar]
  40. He, Y.; Li, B.; Zhang, K.; Li, Z.; Chen, Y.; Ye, W. Experimental and Numerical Study on Heavy Metal Contaminant Migration and Retention Behavior of Engineered Barrier in Tailings Pond. Environ. Pollut. 2019, 252, 1010–1018. [Google Scholar] [CrossRef] [PubMed]
  41. Lima, V.H.S.; Moura, J.P.; Pissarra, T.C.T.; do Valle Junior, R.F.; de Melo, M.M.A.P.; Valera, C.A.; De Melo, M.C.; Fernandes, L.F.S.; Da Costa, A.M.; Pacheco, F.A.L. Groundwater flow and transport of metals under deposits of mine tailings: A case study in Brumadinho, Minas Gerais, Brazil. Case Stud. Chem. Environ. Eng. 2024, 9, 100690. [Google Scholar] [CrossRef]
  42. Elango, L.; Brindha, K.; Kalpana, L.; Faby Sunny, R.N.; Nair, R. Murugan Groundwater flow and radionuclide decay-chain transport modelling around a proposed uranium tailings pond in India. Hydrogeol. J. 2012, 20, 797–812. [Google Scholar] [CrossRef]
  43. Muratkhanov, D.; Mirlas, V.; Anker, Y.; Miroshnichenko, O.; Smolyar, V.; Rakhimov, T.; Sotnikov, Y.; Rakhimova, V. Heavy Metal Groundwater Transport Mitigation from an Ore Enrichment Plant Tailing at Kazakhstan’s Balkhash Lake. Sustainability 2024, 16, 6816. [Google Scholar] [CrossRef]
  44. Kazakis, N.; Karakatsanis, D.; Ntona, M.M.; Polydoropoulos, K.; Zavridou, E.; Voudouri, K.A.; Busico, G.; Kalaitzidou, K.; Patsialis, T.; Perdikaki, M.; et al. Groundwater Depletion. Are Environmentally Friendly Energy Recharge Dams a Solution? Water 2024, 16, 1541. [Google Scholar] [CrossRef]
  45. Panday, S. USG-Transport Version 1.4.0: The Block-Centered Transport Process for MODFLOW-USG. GSI Environ. 2019. Available online: http://www.gsi-net.com/en/software/free-software/USG-Transport.html (accessed on 10 December 2021).
  46. Zheng, C. MT3D, A Modular Three-Dimensional Transport Model for Simulation of Advection, Dispersion and Chemical Reactions of Contaminants in Groundwater Systems; Report to the U.S. Environmental Protection Agency; Robert S. Kerr Environmental Research Laboratory: Ada, OK, USA, 1990. [Google Scholar]
  47. Zheng, C.; Wang, P. MT3DMS A Modular Three-Dimensional Multispecies Transport Model Dimensional Multispecies Transport Model; U.S. Army Corps of Engineers: Washington, DC, USA, 1999; pp. 20314–21000. [Google Scholar]
Figure 1. Location map of Żelazny Most Mining Waste Storage Facility (a), with satellite image (b).
Water 16 02431 g001
Figure 2. The variation in the hydraulic conductivity of sediments within the Żelazny Most landfill, specifically in the cross-section transitioning from the western dam to the eastern dam [30] (with permission from KGHM company).
Water 16 02431 g002
Figure 3. Hydrogeological schematization on an exemplary XIXaS cross-section from the hydrogeological documentation [38] (with permission from KGHM company), along with schematic lines of the available geological cross-sections against the range of the numerical model.
Water 16 02431 g003
Figure 4. Thickness maps of the layers of the hydrogeological model.
Water 16 02431 g004
Figure 5. Spatial distribution of the hydraulic conductivity of the 3rd (a) and 5th (b) layers of the hydrogeological model.
Water 16 02431 g005
Figure 6. Maps of the bottom of layer 2 (a) and layer 3 (b) in the model grid.
Water 16 02431 g006
Figure 7. Discretization grid with introduced boundary conditions.
Water 16 02431 g007
Figure 8. Results of MRS studies.
Water 16 02431 g008
Figure 9. Computed vs. observed head values.
Water 16 02431 g009
Figure 10. Head contour map according to calibration state for 2019.
Water 16 02431 g010
Figure 11. Head contour map from model forecast simulation for 2026.
Water 16 02431 g011
Table 1. Comparison of inflows to the MWSF drainage elements, with model results for 2019.
SectionDam Foot Drainage, Supporting and Additional—2019 (m3/d)Annular Drainage—2019 (m3/d)Trenches (m3/d)Sum (m3/d)Simulated on the Model (m3/d)
S0381214068506751
S1559812140
S20812140
S30812140
S40812140
S50611140
S60638140
W15948510734683654
W27943107
W30459107
W4280313107
W58382107
N10424028792528
N204240
N31082960
N402960
N5367950
N604990
E029133025068606533
E10696250
E20794250
E30428250
E437942250
E514753250
E623239250
E755261250
SUM148015,067350920,05619,466
Disclaimer/Publisher’s Note: The statements, opinions and data contained in all publications are solely those of the individual author(s) and contributor(s) and not of MDPI and/or the editor(s). MDPI and/or the editor(s) disclaim responsibility for any injury to people or property resulting from any ideas, methods, instructions or products referred to in the content.

