Article

Continuous Wavelet Transform Analysis of Climate Variability, Resiliency, and Restoration Strategies in Mesohaline Tidal Creeks

by
Andrew C. Muller
1,*,
Keaghan A. Muller
2 and
Diana L. Muller
3
1
Department of Ocean and Atmospheric Sciences, United States Naval Academy, Annapolis, MD 21402, USA
2
Department of Geography and Geosciences, Salisbury University, Salisbury, MD 21801, USA
3
Maelstrom Inc., Annapolis, MD 21403, USA
*
Author to whom correspondence should be addressed.
Water 2024, 16(17), 2433; https://doi.org/10.3390/w16172433
Submission received: 28 July 2024 / Revised: 24 August 2024 / Accepted: 27 August 2024 / Published: 28 August 2024
(This article belongs to the Section Water and Climate Change)

Abstract

:
This research article employs the continuous wavelet transform analysis to identify the climatological effects among various water quality parameters to identify the successfulness of upland stream restoration on the receiving mesohaline tidal creeks. Estuaries and their corresponding tidal creeks have been impacted by human anthropogenic influences for decades, allowing a variety of restoration practices to be implemented in upland streams. In the face of climate variability and continuous human development pressures, this research performs statistical analysis and a wavelet coherence on, before, and after stream restoration for water quality changes in Chesapeake Bay’s tidal tributaries in the Lower Western Shore to identify if the restoration strategies have been effective in the mesohaline tidal creeks. Statistical analysis showed that currently, the receiving tidal basins are not seeing the required positive improvements in water quality after years of upland stream restoration. Compounding this is the fact climate variability cannot be ignored. Results indicate that the North Atlantic Oscillation (NAO) has significant wavelet coherence with bottom dissolved oxygen, precipitation, and nutrients. This suggests that current restoration efforts may not be able to keep up with climate variability, and other techniques (restoration or policies) may need to be implemented.

1. Introduction

Estuaries are natural transition zones between terrestrial and marine environments that host a wealth of biodiversity, ecosystem services, and critical economic benefits for their surrounding population. However, over the last five decades, estuarine ecosystems have been facing significant challenges due to climate change and human activities, resulting in deteriorating water quality and diminished habitat suitability [1,2,3]. Primary challenges to the resilience of estuaries worldwide include excessive nutrient pollution, known as eutrophication, especially in the form of nitrogen, phosphorus, and sediment contamination [4]. These inputs to estuarine systems stem from poor agricultural practices, urban expansion, and wastewater discharges. This pollution can lead to detrimental consequences, such as harmful algal blooms, loss of submerged aquatic vegetation (SAV), the emergence of dead zones, and disruptions in the ecosystem’s equilibrium, leading to reductions in ecosystem services performed by organisms within the estuary [5,6,7].
Furthermore, rising sea levels, increasing temperatures, and shifts in precipitation patterns associated with climate change have the potential to impact these estuaries profoundly. Rising sea levels threaten low-lying coastal areas, resulting in changes in the hydraulic functions of streams and estuarine dynamics [8], while changes in temperature and weather patterns can affect aquatic habitats and species [9]. These changes may also exacerbate nutrient and sediment inputs into the estuary, fostering spatial growth and temporal extensions of dead zones and resulting in habitat loss [10]. While dead zones are growing in the open ocean, the coastal ocean is experiencing even faster rates of hypoxia [11]. Furthermore, population growth within sub-watersheds increases the demand for resources, land development, and agriculture, straining estuarine ecosystems and water quality. The Chesapeake Bay system, with its shallow water and numerous tributaries, is not exempt from these challenges, which endanger its ability to withstand and recover from various environmental, economic, and social stressors. The Bay’s resiliency to these problems is crucial for habitat sustainability and the region’s economy [12,13,14]. Several studies have documented the importance of tidal creeks as significant sources of nutrient and sediment pollution to their receiving estuary [15,16,17]. Muller and Muller went as far as to suggest that tidal creeks can act as nodal point pollutant sources while creating a sustainability map for the South River sub-estuary of the Chesapeake Bay.
Studies on the ecological effects of hypoxic (low dissolved oxygen and anoxic (no oxygen)) conditions in the bottom waters of the Chesapeake Bay suggest that low dissolved oxygen levels can cause increased vulnerability to mortality of juvenile finfish and that disruptions to the food web may be more significant in the small tributaries of the Bay [18,19,20,21]. Other studies have highlighted the importance of inter-annual climate variations, such as the El Nino-Southern Oscillation (ENSO) and the North Atlantic Oscillation (NAO), on the weather, circulation patterns, and intensity of stratification leading to increased hypoxic events in the Chesapeake Bay [22,23].
To address declining water quality and habitat loss in the Chesapeake Bay, the Chesapeake Bay Program was established in 1983 through a partnership involving the states of Maryland, Virginia, Pennsylvania, the District of Columbia, and the United States Environmental Protection Agency (USEPA). This collaboration facilitated multi-state coordination of water quality monitoring and has led to the development of several agreements to protect fisheries and implement nutrient management plans. Numerous water quality metrics have been developed for various segments of the Bay based on habitat sustainability and the type of environment, such as open water, migratory fish, and deep channel environments. The USEPA Chesapeake Bay Program defines a healthy open channel environment, such as small tributaries and tidal creeks, at 5 mg/L of dissolved oxygen, while less than 2 mg/L is defined as hypoxic and unhealthy. Dissolved oxygen at 0.2 mg/L, where hydrogen sulfide is produced, is defined as anoxia [24]. Another critical metric is water clarity, defined as the penetration of downwelling light. This is important to support healthy SAV acreage in the Bay and its surrounding tributaries. SAV is an essential habitat for juvenile fish and delivers oxygen to the water column. A value of 1 m is considered healthy for most of the tributaries of the Bay [25,26]. A pivotal aspect of the program focuses on establishing Total Maximum Daily Loads (TMDLs) for the Bay’s pollutants, such as nitrogen, phosphorus, and sediment. TMDLs set specific limits on these pollutants to meet water quality standards. Following this, each state in the Chesapeake Bay watershed must formulate and execute Watershed Implementation Plans. These plans outline strategies for reducing pollution runoff into the Bay and its tributaries, which is crucial in achieving pollutant reduction goals. The Chesapeake Bay Program emphasizes diverse restoration initiatives, encompassing reforestation, wetland restoration, oyster reef restoration, and promoting best management practices for agriculture. These endeavors are designed to improve the Chesapeake Bay region’s water quality and habitat conditions.
In recent years, upland stream restoration projects have emerged as potential solutions, addressing pollution sources, stabilizing streambanks, and promoting natural filtration processes. The upland stream restoration techniques aim to improve water quality, enhance aquatic habitat, and restore streams’ ecological health [27,28]. One of the predominant practices in the Chesapeake Bay area is the construction of Restorative Stormwater Conveyance Systems (RSCs). These projects aim to address severely incised streams resulting from significant, long-term erosion by reconnecting the stream to its adjacent floodplain. This process creates pools and rifles, diversifying habitats while improving water flow. The goal is to emulate natural stream conditions. This process slows down stormwater during intense events and may enhance aquatic life. Incorporating woody debris, boulders, or other in-stream structures further creates habitats for fish and macroinvertebrates, which are crucial to healthy stream ecosystems [29,30,31,32,33]. Implementing stormwater management practices, such as rain gardens, swales, and permeable pavement, reduces the volume and velocity of stormwater runoff, prevents erosion, and minimizes stream pollution. This is essential as many sub-watersheds have 30% or more significant impervious surface percentages [34]. While numerous studies have attempted to measure the effectiveness of various upland stream restoration projects within the Chesapeake Bay system, these efforts have often focused on the streams themselves, primarily assessing sediment and nutrient reductions below the project. Before-and-after restoration studies have also been conducted [35,36,37]. However, very few studies have extended their scope to include downstream segments of the stream or the receiving estuary. More importantly, the TMDL is specifically designed to improve the estuary’s water quality; therefore, after a decade of intense upland stream restoration efforts, it is critical to document the estuarine response to these multimillion-dollar projects, especially in the face of climate change. Major water quality metrics typically utilized by the Chesapeake Bay program, as well as other regions to assess the health and resiliency of the Bay, include dissolved oxygen, water clarity, total suspended solids, and nutrients. For this reason, this analysis focuses on those metrics. Similarly, since ENSO and NAO have also been previously documented to affect the regional climate in this area, those indices were also used in this study.
The Continuous Wavelet Transform is a relatively new time series spectral technique that decomposes a continuous signal into its component frequencies, similar to the Fourier Transform. The main advantage of using wavelets is that, unlike Fourier analysis, stationarity of the data is not required. More importantly, wavelets open the time domain, allowing for the resolution of energy shifts between frequencies in time, making this tool suitable for analyzing nonlinear systems [38]. More importantly, wavelet coherence analysis is a statistical tool that identifies coherence and phase shifts in time between two signals and can be considered a correlation analysis between signals that vary as waves in time and space. Given that climatic fluctuation along with water quality parameters all act as waves, making this an ideal tool to analyze the relationships between each of these variables. Other studies have successfully used this analysis to study climate variability and the effects on hydrology and water quality, as well as relationships between various water quality elements and tides [39,40,41].

2. Materials and Methods

2.1. Study Area

The Lower Western Shore of Chesapeake Bay, MD., was chosen because it is an excellent natural laboratory for studying upland stream restoration management outcomes on the health and resiliency of the receiving estuary. The Lower Western Shore consists of small tributaries of the Chesapeake Bay that contain numerous tidal creeks, where several upland restoration projects have been completed over the last decade. Several more projects are underway, and many are in the planning stages. These tributaries are in Anne Arundel County, MD., and include the Magothy, Severn, South, Rhode, and West Rivers. The capital city of Annapolis sits on the Severn River, while the South, Rhode, and West Rivers are south of Annapolis. The Magothy River is the tributary directly north of Annapolis (Figure 1).

2.2. Sampling Locations and Procedures

Water quality samples were collected weekly to bi-weekly within tidal creeks of the South and Severn Rivers, which were associated with significantly completed RSC projects during the Chesapeake monitoring periods of May–October for 2010–2022. Reduced sampling occurred during the 2020 and 2021 seasons due to COVID-19. Water quality metrics for the creeks included temperature, salinity, pH, dissolved oxygen, and water clarity. This study focused mainly on bottom dissolved oxygen and water clarity, as they are considered critical metrics for the sustainability of Chesapeake Bay. All water quality samples were collected using YSI (Yellow Springs, CO, USA.) Sondes, and water clarity was assessed using a calibrated Secchi disk. All procedures followed strict USEPA Chesapeake Bay Program protocols (https://www.chesapeakebay.net/what/programs/quality-assurance accessed on 20 May 2024. Data for the Severn and South Rivers can be found at The Alliance for the Chesapeake Bay’s Monitoring Cooperative site: https://www.chesapeakemonitoringcoop.org/ (accessed on 20 May 2024). Data for stations WT6.1-8.2 were collected by The Maryland State Department of Natural Resources on a monthly basis and accessed through the Chesapeake Bay Programs’ Data Hub https://datahub.chesapeakebay.net/WaterQuality (accessed on 20 May 2024). Table 1 contains the locations of the sample sites. MS1, located at the mouth of the South River, was utilized as a control site. Figure 2 illustrates the locations of the restoration sites and the sampling.
Sites and Table 2 provide information on the restoration sites. Climatological data were used for the wavelet analysis, including the El Nino-Southern Oscillation Index (ENSO Nino 3.4) and North Atlantic Oscillation Index (NAO). Climatological data was accessed from the NOAA site from NOAA’s data hub at: (https://www.cpc.ncep.noaa.gov/data/, accessed on 20 May 2024). Historical precipitation data was extracted from the United States Naval Academy, Annapolis, and can be found at the KNAK weather state site: https://mesonet.agron.iastate.edu/sites/site.php?station=NAK&network=MD_ASOS (accessed on 20 May 2024).

2.3. Statistical and Wavelet Analysis

Statistical analyses, in the form of hypothesis testing, were conducted using the Mann–Whitney U Test, also known as the Wilcoxon Rank Sum t-test, with a significance level (alpha) set at 0.05. This analytical approach tests whether to accept or reject the null hypothesis for each sampling site (Equations (1) and (2)). For this study, the null hypothesis tested was that there is no significant statistical difference in bottom dissolved oxygen and Secchi depth before and after restoration occurred. This ensures a robust evaluation of the impact of upland stream restoration projects on water quality within the Chesapeake Bay system. Box plots were created for each station using Sigma Plot 12.5 to assess the pre- and post-restoration results. To determine if there were climatological effects, a continuous wavelet analysis using the Morse wavelet was performed using data for WT 8.1, which is the same site as MS 2 in the South River.
U 1 = n 1 n 2 + n 1 n 1 + 1 2 R 1
U 2 = n 1 n 2 + n 2 n 2 + 1 2 R 2
where
  • U1 and U2 are the U statistic values used for hypothesis testing;
  • n1 and n2 are the sample numbers per group;
  • R1 and R2 are the rank sums of each group.
In this study, an analytical Morse wavelet transform (Equation (3)) was first used to decompose climatic and water quality signals into their respective time-frequency domains. The Morse wavelet is a tool that has been successfully used to decompose geophysical signals [42]. The generalized calculation to determine wavelet coefficients can be found in Equation (4) [43]. Then, a wavelet coherence (Equation (5)) between various signals, such as NAO and precipitation, or NAO and bottom dissolved oxygen, was performed to evaluate climatological effects on water quality variables [44,45,46]. The phase angle between signals can be calculated using Equation (6). All wavelet analysis was performed using MATLAB 2021a.
Ψ β γ ω = U ω a β , γ ω β e ω γ
where
  • Ψβγ(ω) = mother wavelet function;
  • U(ω) = Heaviside step function (unit step);
  • αβ, γ = normalizing constant;
  • γ = a constant that controls the symmetry of the wavelet. A γ = 3 is used for the Morse Wavelet;
  • β = time-bandwidth product, which controls the shape of the wavelet.
W n x s = δ t s n = 1 ^ N X n ^ ψ o ( n ^ n ) δ t s
where
  • δ t s = the normalization constant;
  • s = wavelet scale;
  • n = inverse time scale/reversed time index;
  • δ t = constant time interval;
  • ψ o = nondimensional wavelet coefficient;
  • X n ^ = the time series (where n ^ = integer time stamps (1, 2, 3 … N).
R 2 x , y = s [ W x , y ] 2 s W , x X s [ W y ]
where
  • W n x y = W n x W n y * = cross wavelet spectrum between the signals X n and y n ;
  • W n y * = The complex conjugate of W n y ;
  • S = smoothing operator.
Phase Lag:
ϕ n s = t a n 1 I S a 1 W n x y ( s ) R S a 1 W n x y s
where
  • ϕ n ( s ) = phase angle;
  • I and R are the imaginary and real parts.

3. Results

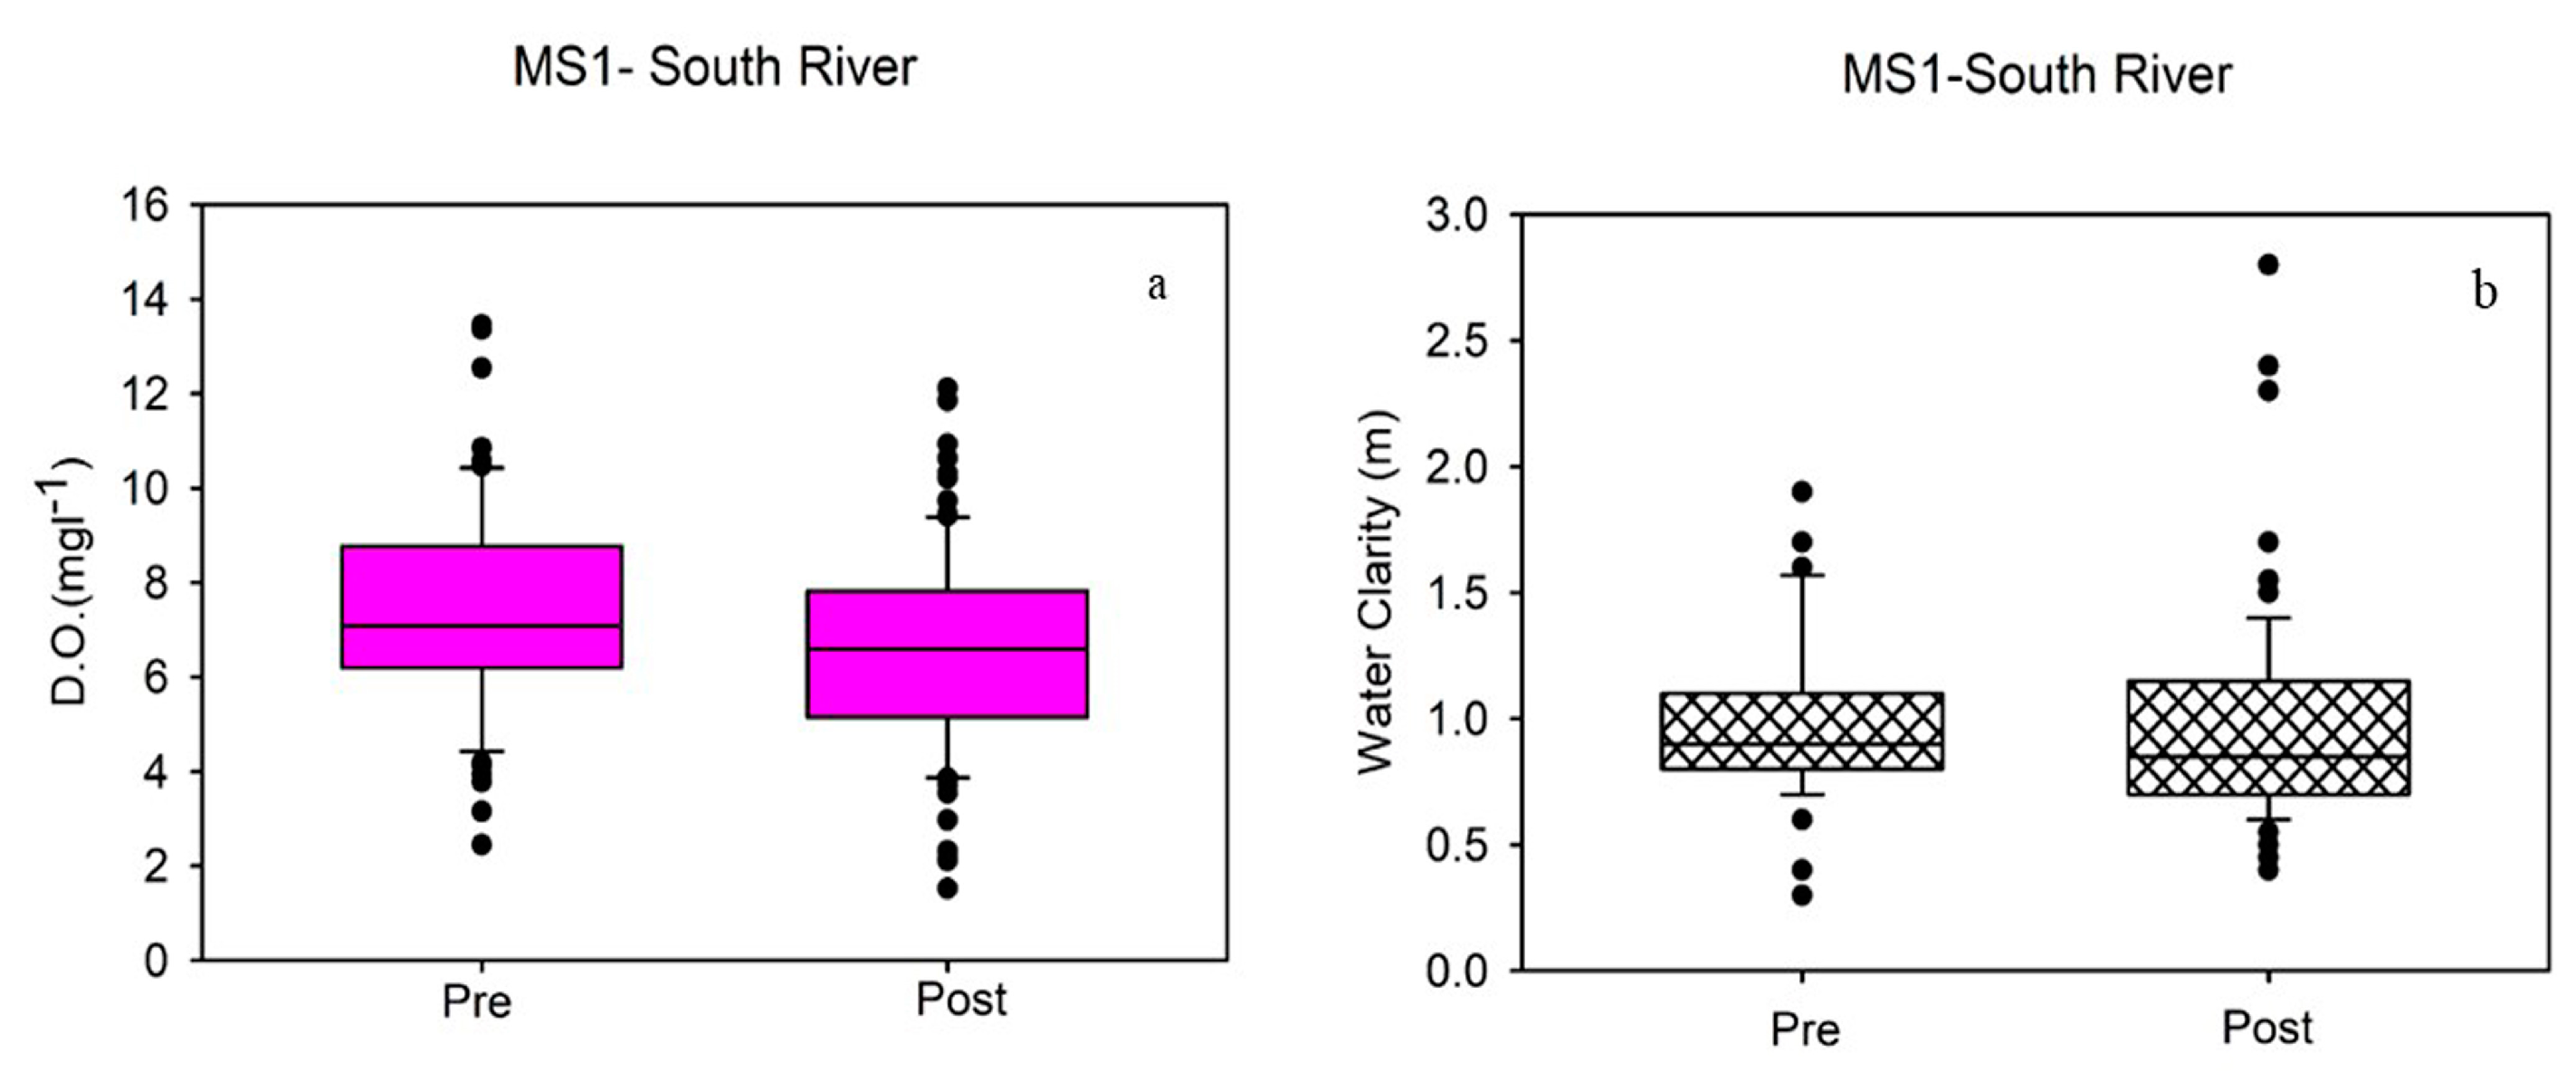
3.1. Pre vs. Post Restoration Water Quality

Bottom dissolved oxygen results for Broad Creek, South River, first revealed a non-normal distribution based on the Shapiro–Wilk Normality Test. Pre-restoration median values were 3.4 mg/L, while post-restoration values were 3.7 mg/L (n = 153). The t-test revealed that the differences were not significant, and thus, the null hypothesis must be accepted (T = 4270.500, p = 0.308). Furthermore, the median values for pre- and post-restoration in this creek were below the 5 mg/L criteria established by the Chesapeake Bay Program (Figure 3a). Also noteworthy was that dissolved oxygen median values at the 25th percentile were very low. The water clarity in this creek, measured by Secchi depth, again failed the normality test. The median Secchi depths were 0.6 m and 0.4 m for pre- and post-restoration water clarity, signifying that water clarity did not meet the basic standard of 1 m for pre- or post-restoration. The t-test revealed that post-restoration Secchi depths were significantly worse than the pre-restoration median, with an n = 153, T = 5691, and p ≤ 0.001. Figure 3b illustrates the box plot for water clarity in Broad Creek.
Church Creek had the most restoration projects in the South River. Median bottom dissolved oxygen values were 4.9 and 3.6 mg/L, respectively, for pre and post-restoration. The normality test failed, and the Mann–Whitney U T-Statistic = 2451.500, T = 6095.500, p = 0.110 (Figure 4a).
Since the difference in the median values between pre-treatment and post-treatment groups was not significant enough to exclude the possibility that the difference was due to random sampling variability, the null hypothesis was accepted. It is also important to note that these values fell below the healthy dissolved oxygen metric of 5 mg/L. Even more significant was that at the 25th percentile, the bottom dissolved oxygen values were just above 2 mg/L, which is nearly hypoxic. Water clarity results indicated the pre and post-restoration values were at 0.6 m, as shown in Figure 4b. As a result, the t-test indicated that the null hypothesis must be accepted (n = 161).
Located at the mouth of the South River is site MS1 (Main Stem 1). This site was chosen as a control station as there were no restoration projects in its vicinity to influence bottom dissolved oxygen or water clarity. The year 2015 divides the time between pre- and post-restoration conditions. Results for bottom dissolved oxygen revealed that both the normality and equal variance tests passed, indicating mean values of 7.3 and 8.5 mg/L for pre and post-restoration conditions (Figure 5a). The t-test results signified that post-site conditions were significantly lower than pre-conditions, but both were above the standard, indicative of healthy conditions.
Water clarity results can be seen in Figure 5b, which shows that median Secchi depths were 0.9 and 0.85 m, respectively, for pre vs. post-conditions. In this case, the data for this site failed the normality test, and the median values were not significant according to the t-test (n = 175). Median values of water clarity were close to the 1 m metric used to indicate sustainable conditions.
Saltworks Creek is in the Severn River, which contains a major completed upland restoration RSC. Results for bottom dissolved oxygen revealed that the normality test (Shapiro–Wilk) failed (p < 0.050). Median values for pre-restoration were 1.9 mg/L, while for restoration, they were 3.9 mg/L (Figure 6a). The Mann–Whitney U Statistic = 1326.500, T = 3811.500, n = 149 (p ≤ 0.001). Post-dissolved oxygen was significantly higher than pre-restoration median values. However, both were still far below the sustainable value of 5 mg/L. Secchi depth values for Saltworks Creek were non-normally distributed, and the t-test indicated that the null hypothesis should be accepted as the median values were 0.73 for pre-restoration and 0.70 for post-restoration (Figure 6b). Both values were below the sustainable criteria (Figure 6a,b).
The Rhode River is shallower than the other Lower-Western Shore tributaries and tends to have sustainable bottom dissolved oxygen. As a result, water clarity and total suspended solids (TSS) were examined instead. Results indicated that the water clarity data was non-normally distributed, and the median values were not significantly different (n = 78) (Figure 7a). TSS results also indicated non-normality. Pre-restoration TSS median values were 11.4 mg/L, while post-restoration values were 13.3 mg/L. The t-test results determined that the null hypothesis should be rejected as post-restoration TSS values were significantly higher than pre-restoration values (Figure 7b).

3.2. Long-Term Trends of Dissolved Oxygen and Water Clarity in the Magothy and Severn Rivers

Long-term trends were evaluated in the Magothy and Severn Rivers at the Maryland Department of Natural Resources long-term monitoring sites WT6.1 and WT7.1, respectively, for bottom dissolved oxygen and water clarity from 1985 to 2023. Figure 8 illustrates the bottom dissolved anomaly calculated for each month for the Magothy River. The anomaly was the mean monthly values minus 5 mg/L, representing the sustainable D.O. level. Results showed that historically, May and August were below the sustainable level. In 2023, May, July, and September were below the long-term average levels. A significant storm occurred in August of 2023, causing D.O. values to be unusually high for that month.
Secchi measurement anomalies were calculated similarly to D.O. anomalies, but the 1 m depth requirement was used instead. The results indicated that water clarity tended to be below the sustainable level for the measuring season. For the 2023 season, only May appeared to be at the sustainable level, as June and October were well below the long-term average, which was already below the sustainable level (Figure 9).
Long-term trends for the Severn River were extracted from site WT7.1, located near the center of the river, and illustrate similar patterns to the Magothy River. Mean long-term averages covering 1985 to 2023 showed inferior bottom dissolved oxygen values from May to September. In 2023, lower-than-usual bottom dissolved oxygen occurred, while very hypoxic values were reported in July and September. June and August experienced values above the long-term mean. In the Severn River in August of 2023, very high bottom dissolved oxygen values were likely caused by the significant storm event (Figure 10).
Severn River’s long-term Secchi depth values illustrate below sustainable levels during the monitoring season. Values for 2023 looked very good as they were mostly higher than the long-term trend but showed significantly lower values in August and September (Figure 11). Long-term values for both Magothy and Severn Rivers clearly showed cyclical behavior and lacked a trend toward improvement.

3.3. Wavelet Analysis

Long-term patterns of bottom dissolved oxygen and water clarity from the Magothy and Severn Rivers suggest that these parameters are cyclical and likely non-stationary. This is consistent with other researchers’ findings on the importance of non-linearities in water quality data [47,48]. Consequently, we utilized the Morse continuous wavelet analysis and wavelet coherence analysis to investigate further the cyclical and non-stationary water quality indexes with climate variability. Twenty years of continuous monthly water quality data were investigated from the mid-river station WT8.1 in the South River tributary from 2000 to 2019. Water quality data includes monthly ESNO, NAO, bottom dissolved oxygen index (BDOI), surface total phosphorous, surface total nitrogen, TSS, water clarity, surface temperature, and precipitation. To properly evaluate wavelet coherences, water quality parameters were transformed into their respective anomalies by subtracting monthly values from the 20-year mean. Several studies have pointed to the effects of the North Atlantic Oscillation (NAO) on the U.S. East Coast weather patterns, especially in terms of temperature and precipitation. A positive NAO phase typically correlates with higher temperatures and precipitation along the U.S. East Coast, especially during winter. However, this can occur in spring and summer time as well [49,50,51]. This study investigated whether these relationships extend into the watershed level.
A time series comparison between NAO and precipitation and their wavelet coherence analysis was performed using MATLAB 2021b. Along with this, a comparative time series of ENSO and precipitation, together with their wavelet coherence analysis, was also performed. The results are shown in Figure 12. Both time series plots indicated non-stationarity as the amplitudes of these parameters changed with time. Furthermore, the plots illustrate that time lags between parameters existed. The wavelet coherence analysis not only picked these features out but also displayed the periodicities in which these parameters were coherent or not coherent, as well as the type of coherence and lags. In this analysis, the color indicates a level of coherence within various periodicities over time, while the arrows indicate phase relationships between the two signals. Arrows pointed directly to the right indicate a positive coherence, and arrows to the left show an antiphase relationship. Arrows pointing up/down or at an angle demonstrate phase lags between the signals. The white dashed lines represent the cone of influence. Data at or beyond this cone are not reliable. The wavelet coherence between NAO and precipitation identified two significant periodicities over the last twenty years, illustrating non-stationary effects.
The first occurs around yearly time scales. This is an antiphase relationship that lasted for a short time period, mostly around 2011–2012. More interesting is the two-year periodicity over a longer time period that was in phase. This strong in-phase coherence at two-to-three-year periodicities was consistent with positive phase NAO, causing increases in temperature and precipitation by affecting wind patterns and storm frontogenesis [52,53]. A third weaker antiphase signal was also detected at the 6-month periodicity but was mainly restricted to 2006–2007. ENSO and precipitation anomalies also displayed non-stationary traits; however, the wavelet coherence was weak at best. Angular arrows illustrate a π/2 phase lag.
Given that NAO had the stronger signal with precipitation, wavelet coherences were performed with NAO and four other water quality parameters. These parameters include bottom dissolved oxygen index (BDOI), total phosphorus, surface temperature, and total nitrogen anomalies. Figure 13A,B illustrates the time series coherence between NAO and bottom dissolved oxygen A strong antiphase coherence existed between NAO and bottom dissolved oxygen at the 2–4-year periodicity between 2009 and 2016 and slightly weaker in phase coherence at the 0.5–1-year periodicity around 2013–2016. The strong antiphase coherence between NAO and bottom dissolved oxygen is essential as it suggests that a strong positive NAO phase leads to decreases in bottom dissolved oxygen. Another weaker phase coherence appeared at the same periodicity but earlier in the time series (2006–2009).
The time series plots of NAO and surface temperature (Figure 13C) suggest that an increasing trend in temperature anomalies existed starting around 2010. Wavelet coherence between NAO and surface temperature (Figure 13D) showed a strong in-phase periodicity around the 0.5–1-year period in 2015–2018. A weaker in-phase relationship with NAO leading temperature also existed near the beginning of the time series with an annual periodicity.
A weak in-phase coherence was detected between NAO and total phosphorus with a πι/2-time lag centered around the 2-year periodicity between 2010 and 2015 (Figure 14). The antiphase relationship with bottom dissolved oxygen and the weaker in-phase coherence with total phosphorus was most likely linked to NAO’s influence on temperature and precipitation. A positive coherence exists between total nitrogen and NAO towards the end of the 20-year sampling period with an 8 to 1-year periodicity.
Further, wavelet coherences were investigated between surface temperature and bottom dissolved oxygen, precipitation and Secchi depth, precipitation and TSS, and TSS and Secchi depth (Figure 15). The wavelet coherence analysis between surface temperature and bottom dissolved oxygen was performed mainly as a proof of concept for interpreting the results. Surface temperature has a robust antiphase correlation with bottom dissolved oxygen, as it should. This substantial correlation occurred between the 0.5 and 2-year periodicities for the entire length of the time series record. Precipitation and water clarity, as measured by Secchi depth, illustrated an antiphase coherence between the 0.5 and 1-year period at the beginning and end of the time series, whereas precipitation and TSS showed an in-phase coherence near the end of the time series between 0.5 and 2-year periodicities. Also apparent was a weaker phase coherence between the 1 and 2-year periodicity around 2005–2007. Each of the in-phase coherences displayed a π/2-time lag between the signals. TSS and Secchi measurements had an antiphase relationship between 0.5 and 2-year periodicities throughout much of the time series.
The coherence pattern between precipitation and TSS, as well as TSS and Secchi, seems to make sense since as precipitation increases, so should TSS, and as TSS increases, Secchi depths should go down as the water clarity decreases.

4. Discussion

4.1. Restoration Effectiveness and Resiliency

The investigation into the effectiveness of current completed upland restoration projects, mainly in the form of regenerative stormwater conveyance systems (RSCs) on mesohaline tidal creeks of the Chesapeake Bay, has revealed important insights into the current sustainability and resiliency of the Chesapeake Bay, as well as the potential future for the Bays resiliency in the face of climate change. Statistical analysis of bottom dissolved oxygen and water clarity before and after restoration highlights the complicated nature of restoring a complex ecosystem. Pre-restoration measurements of bottom dissolved oxygen and water clarity in the South and Severn Rivers are consistent with previous studies that show worsening conditions within the tidal creeks and the main thalweg of these rivers as you move upriver toward their headwaters, hence the sustainable conditions at station MS1 vs. Church Creek, and Broad Creek. Furthermore, these previous studies also revealed that the cycle of seasonal hypoxia begins in May and can continue into October. This cycle starts in the up-river creeks and moves downstream towards the mouth [17,54]. Some recent studies on the resiliency and sustainability of the Chesapeake Bay report moderate but spatially inconsistent improvement in water quality, mainly in the effectiveness of reducing nutrient loading [55,56,57]. Another study reports that through modeling efforts, continued nutrient reductions should outweigh climate effects in Bay water quality recovery [58]. However, this has not yet occurred in the Lower Western Shore, Maryland of the Chesapeake Bay. Statistical tests of pre vs. post-water quality conditions indicated that for bottom dissolved oxygen, values for most sites near upland restoration projects showed no improvement. The only site that did show significant improvement was the Saltworks Creek site in the Severn River. This site has one of the most extended post-restoration times, so we may be seeing the beginning of some long-term effects of nutrient reduction. However, more likely, this was due to data collected right after a significant storm skewing the results. Long-term trends from WT6.1 and WT7.1 located in the Magothy and Severn Rivers, respectively, highlight cyclical hypoxia, with conditions in 2023 worse during some months during the summer and fall lower than the long-term averages, which were already at or near hypoxic levels.
Water clarity also shows signs of cyclical behavior with little to no signs of improvement in most sites. While the Severn River has Secchi depth values that are near sustainable in the middle of the river, Saltworks Creek downstream from a major RSC project showed no significant difference between pre and post-median values. Broad Creek near the headwaters of the South River is the only creek site to show significantly decreased water clarity post-restoration. The values were also below the sustainable level of 1 m in this location and in instances in 2023 where the Secchi depth was well below long-term averages. The Rhode River illustrated a lack of significant differences in water clarity and a slight increase in TSS despite an upland restoration project close to this site. These results are critically important because total suspended solids and water clarity affect submerged aquatic vegetation’s distribution and sustainability. SAV is considered a sentinel species and a key indicator of Chesapeake Bay’s resiliency and sustainability. While some areas of the Bay have seen improvements in SAV acreage, the Bay continues to display large spatial recovery differences and cyclical growth and decay patterns [59]. The Lower-Western Shore tributaries are experiencing difficulties reaching metrics set by the State of Maryland and USEPA. The Magothy, Severn, and South Rivers all have below-ideal levels of SAV acreage, and locations are restricted to localized areas. For instance, the Severn River SAV is located mainly around the edges of Round Bay, close to the center of the river. In the South River, SAV is almost exclusively in Selby Bay near the mouth of the river. The West and Rhode Rivers have not had SAV in over a decade: https://www.vims.edu/research/units/programs/sav/access/maps/ (accessed on 20 May 2024).
While it is clear that current upland restoration efforts have yet to yield significant improvements in bottom dissolved oxygen and water clarity in the small tributaries of the Lower Western Shore of the Chesapeake Bay, there are most likely several reasons for this lack of improvement. One possibility is that there has not been enough time for these sites to recover fully from restoration or that a critical threshold in the number of restored streams has not yet been met. The Bay’s resiliency and restoration face complex factors that may impede its progress, including continued urban expansion and climate change [60], especially since many of these projects are built to accommodate 1–2 inch rain events. However, with potential rising temperatures and increased variability in precipitation anomalies [61], these projects may be unable to keep up with these changes. Another potential factor impeding improvements could be the restoration projects themselves. Some studies have reported increases in organic matter exportation from terrestrial sources into Chesapeake Bay. More importantly, since many upland restoration projects restore marsh environments and tend to use organic matter to help filtration, tributaries may be experiencing increases in chromophoric dissolved organic matter (CDOM) in downstream environments. This is critical because if CDOM exportation is increasing either due to climate effects or restoration efforts, we may not see any improvement in water clarity and thus SAV since CDOM blocks light penetration [62,63,64,65]. A recent study of the spatial heterogeneity of CDOM in the South River sub-estuary [66] reported high concentrations of CDOM in the rivers’ tidal creeks, especially near the river’s headwaters, including Broad and Church Creeks. They also noted that CDOM concentrations were much higher than total suspended sediment concentrations in Church Creek and that CDOM plays a critical role in diminished water clarity rather than TSS. As a result, CDOM exportation before and after upland restoration should be further investigated. Two other potential reasons why these small tributaries have yet to respond positively to their upland stream restoration projects include the possibility that these projects often remove mature trees to construct the baffles, resulting in the loss of the tree canopy. As a result, the water heats up, which could lead to lower oxygen concentrations being delivered to the receiving estuary. Finally, very little effort has been made to decrease the percentage of impervious surfaces in these areas, with construction likely to continue to outpace restoration projects.

4.2. Climatological Effects

The wavelet coherence analysis suggests that NAO displays some coherence with water quality variables and may exhibit some control based on changes in temperature and precipitation. Specifically, the NAO has significant coherence with bottom dissolved oxygen, temperature, precipitation, and nutrients. This is critical to understanding how the upland restoration projects will respond to climate changes, especially if increased temperatures will affect NAO variability and precipitation patterns. Not surprisingly, there is a powerful antiphase relationship between surface temperature and bottom dissolved oxygen, precipitation and Secchi, and nutrient releases. ENSO did not appear to have a strong effect at the watershed level. This may suggest that the system is now responsive to climate variability rather than nutrient reduction. The results of this study are consistent with other studies and highlight the need to continue investigating long-term water quality at the sub-watershed level, including modeling studies.
Given that studies suggest climate variability will majorly impact the Chesapeake Bay [67], it is critical to continue to see if modifications to TMDLs or the size and nature of upland restoration projects need to be updated and changed. On a more positive note, it is worth mentioning that while the Chesapeake Bay has not yet fully realized its TMDL goals along with substantial improvements in water quality related to these upland restoration projects, the Chesapeake Bay has not become any worse at this time despite climate changes. This suggests that Chesapeake Bay is somewhat resilient, and there is much hope that restoration efforts can offset climate impacts. Some potential solutions to help expedite restoration efforts should include redesigning newly constructed projects to withstand 3 to 5-inch rain events coupled with reductions in impervious surfaces or stricter building codes aimed at reducing these problems.

5. Conclusions

While progress has been made over the last decades in some areas of the Chesapeake Bay, this has yet to be realized in the small tributaries and their tidal creeks of the Lower-Western Shore. The Bay continues to face challenges related to poorly controlled development due to increasing population and climate change. Further complications impeding the Bay’s recovery include funding, regulatory compliance, and the political will of a multi-state jurisdiction. More studies are needed downstream from restoration sites in the estuarine sequence to gauge the success of upland stream restoration projects in truly meeting TMDL goals. Another limiting factor may be the exportation of CDOM to downstream estuarine environments due to climate change of specific restoration projects. This must also be explored in more detail. A CDOM TMDL may be necessary to meet water clarity and, ultimately, SAV goals. This study illustrated the effectiveness of combining traditional statistical techniques with wavelet coherence analysis in order to investigate the relative importance of restoration projects in the face of climate change. Finally, this highlights the importance of studying the small tidal creeks in relation to water quality improvement in Chesapeake Bay as a whole, especially since the population mainly lives in these sub-watersheds. For future studies, more work on the effect of these projects on downstream temperatures and climate change is needed. A more complex multivariate analysis, such as principle component analysis or even self-organizing maps, would also be beneficial for future studies.

Author Contributions

Conceptualization, A.C.M., K.A.M., and D.L.M.; methodology, A.C.M., D.L.M., and K.A.M.; software, A.C.M., K.A.M., and D.L.M.; validation, D.L.M.; Formal analysis, A.C.M. and K.A.M.; resources, K.A.M., D.L.M., and A.C.M.; data curation, A.C.M.; writing—original draft preparation, A.C.M.; writing—review and editing, D.L.M.; visualization, D.L.M. and A.C.M.; supervision, A.C.M. All authors have read and agreed to the published version of the manuscript.

Funding

This research received no external funding.

Data Availability Statement

Data is available on the EPA Chesapeake Bay Program Data Hub website at: https://datahub.chesapeakebay.net/ (accessed on 20 May 2024).

Acknowledgments

The authors would like to acknowledge our patience and dedication to each other in the research and writing of this document.

Conflicts of Interest

The authors declare no conflicts of interest. Author Diana L. Muller was employed by the company Maelstrom Inc. The remaining authors declare that the research was conducted in the absence of any commercial or financial relationships that could be construed as a potential conflict of interest.

References

  1. Chilton, D.; Hamilton, D.P.; Nagelkerken, I.; Cook, P.; Hipsey, M.R.; Reid, R.; Sheaves, M.; Waltham, N.J.; Brookes, J. Environmental Flow Requirements of Estuaries: Providing Resilience to Current and Future Climate and Direct Anthropogenic Changes. Front. Environ. Sci. 2021, 9, 764218. [Google Scholar] [CrossRef]
  2. Altieri, A.H.; Gedan, K.B. Climate change and dead zones. Glob. Chang. Biol. 2015, 21, 1395–1406. [Google Scholar] [CrossRef] [PubMed]
  3. Kennish, M.J. Environmental threats and environmental future of estuaries. Environ. Conserv. 2002, 29, 78–107. [Google Scholar] [CrossRef]
  4. Sukdeo, P.; Pillay, S.; Ballabh, H. Long-term deterioration of water quality of the Mvoti Estuary, KwaZulu-Natal, South Africa. Curr. Sci. 2014, 106, 739–743. [Google Scholar]
  5. Dybas, C.L. Dead Zones Spreading in World Oceans. BioScience 2005, 55, 552–557. [Google Scholar] [CrossRef]
  6. Llansó, R.J. Effects of hypoxia on estuarine benthos: The lower Rappahannock River (Chesapeake Bay), a case study. Estuar. Coast. Shelf Sci. 1992, 35, 491–515. [Google Scholar] [CrossRef]
  7. Breitburg, D.; Levin, L.A.; Oschlies, A.; Grégoire, M.; Chavez, F.P.; Conley, D.J.; Garçon, V.; Gilbert, D.; Gutiérrez, D.; Isensee, K.; et al. Declining oxygen in the global ocean and coastal waters. Science 2018, 359, eaam7240. [Google Scholar] [CrossRef]
  8. Khojasteh, D.; Glamore, W.; Heimhuber, V.; Felder, S. Sea level rise impacts on estuarine dynamics: A review. Sci. Total Environ. 2021, 780, 146470. [Google Scholar] [CrossRef]
  9. Madeira, D.; Narciso, L.; Cabral, H.N.; Vinagre, C. Thermal tolerance and potential impacts of climate change on coastal and estuarine organisms. J. Sea Res. 2012, 70, 32–41. [Google Scholar] [CrossRef]
  10. Duvall, M.S.; Jarvis, B.M.; Wan, Y. Impacts of climate change on estuarine stratification and implications for hypoxia within a shallow subtropical system. Estuar. Coast. Shelf Sci. 2022, 279, 108146. [Google Scholar] [CrossRef]
  11. Gilbert, D.; Rabalais, N.N.; Díaz, R.J.; Zhang, J. Evidence for greater oxygen decline rates in the coastal ocean than in the open ocean. Biogeosciences 2010, 7, 2283–2296. [Google Scholar] [CrossRef]
  12. Testa, J.M.; Clark, J.B.; Dennison, W.C.; Donovan, E.C.; Fisher, A.W.; Ni, W.; Parker, M.; Scavia, D.; Spitzer, S.E.; Waldrop, A.M.; et al. Ecological Forecasting and the Science of Hypoxia in Chesapeake Bay. BioScience 2017, 67, 614–626. [Google Scholar] [CrossRef]
  13. Murphy, R.R.; Kemp, W.M.; Ball, W.P. Long-Term Trends in Chesapeake Bay Seasonal Hypoxia, Stratification, and Nutrient Loading. Estuaries Coasts 2011, 34, 1293–1309. [Google Scholar] [CrossRef]
  14. Orth, R.J.; Williams, M.R.; Marion, S.R.; Wilcox, D.J.; Carruthers, T.J.B.; Moore, K.A.; Kemp, W.M.; Dennison, W.C.; Rybicki, N.; Bergstrom, P.; et al. Long-Term Trends in Submersed Aquatic Vegetation (SAV) in Chesapeake Bay, USA, Related to Water Quality. Estuaries Coasts 2010, 33, 1144–1163. [Google Scholar] [CrossRef]
  15. Sanger, D.; Blair, A.; DiDonato, G.; Washburn, T.; Jones, S.; Riekerk, G.; Wirth, E.; Stewart, J.; White, D.; Vandiver, L.; et al. Impacts of Coastal Development on the Ecology of Tidal Creek Ecosystems of the US Southeast Including Consequences to Humans. Estuaries Coasts 2013, 38, 49–66. [Google Scholar] [CrossRef] [PubMed]
  16. Wessel, M.R.; Leverone, J.R.; Beck, M.W.; Sherwood, E.T.; Hecker, J.; West, S.; Janicki, A. Developing a Water Quality Assessment Framework for Southwest Florida Tidal Creeks. Estuaries Coasts 2022, 45, 17–37. [Google Scholar] [CrossRef]
  17. Muller, A.; Muller, D. Analysis of nodal point pollution, variability, and sustainability in mesohaline tidal creeks. Mar. Pollut. Bull. 2014, 85, 204–213. [Google Scholar] [CrossRef]
  18. Diaz, R.J.; Neubauer, R.; Schaffner, L.; Pihl, L.; Baden, S. Continuous monitoring of dissolved oxygen in an estuary experiencing periodic hypoxia and the effect of hypoxia on macrobenthos and fish. In Marine Coastal Eutrophication; Elsevier: Amsterdam, The Netherlands, 1992; pp. 1055–1068. [Google Scholar]
  19. Breitburg, D.L.; Loher, T.; Pacey, C.A.; Gerstein, A. Varying effects of low dissolved oxygen on trophic interactions in an estuarine food web. Ecol. Monogr. 1997, 67, 489–507. [Google Scholar] [CrossRef]
  20. Breitburg, D.L.; Adamack, A.; Rose, K.A.; Kolesar, S.E.; Decker, B.; Purcell, J.E.; Keister, J.E.; Cowan, J.H. The pattern and influence of low dissolved oxygen in the Patuxent River, a seasonally hypoxic estuary. Estuaries 2003, 26, 280–297. [Google Scholar] [CrossRef]
  21. Jeppesen, R.; Rodriguez, M.; Rinde, J.; Haskins, J.; Hughes, B.; Mehner, L.; Wasson, K. Effects of hypoxia on fish survival and oyster growth in a highly eutrophic estuary. Estuaries Coasts 2018, 41, 89–98. [Google Scholar] [CrossRef]
  22. Muller, A.C.; Muller, D.L. Forecasting future estuarine hypoxia using a wavelet based neural network model. Ocean Model. 2015, 96, 314–323. [Google Scholar] [CrossRef]
  23. Scully, M.E. The Importance of Climate Variability to Wind-Driven Modulation of Hypoxia in Chesapeake Bay. J. Phys. Oceanogr. 2010, 40, 1435–1440. [Google Scholar] [CrossRef]
  24. Zhang, Q.; Tango, P.J.; Murphy, R.R.; Forsyth, M.K.; Tian, R.; Keisman, J.; Trentacoste, E.M. Chesapeake Bay Dissolved Oxygen Criterion Attainment Deficit: Three Decades of Temporal and Spatial Patterns. Front. Mar. Sci. 2018, 5, 422. [Google Scholar] [CrossRef]
  25. Eisemann, E.R.; Thomas, C.C.; Balazik, M.T.; Acevedo-Acevedo, D.; Altman, S. Environmental Factors Affecting Coastal and Estuarine Submerged Aquatic Vegetation (SAV); US Army Engineer Research and Development Center, Environmental Laboratory: Vicksburg, MI, USA, 2021. [Google Scholar]
  26. Tango, P.J.; Batiuk, R.A. Deriving Chesapeake Bay water quality standards. JAWRA J. Am. Water Resour. Assoc. 2013, 49, 1007–1024. [Google Scholar] [CrossRef]
  27. Veríssimo, H.; Lane, M.; Patrício, J.; Gamito, S.; Marques, J.C. Trends in water quality and subtidal benthic communities in a temperate estuary: Is the response to restoration efforts hidden by climate variability and the Estuarine Quality Paradox? Ecol. Indic. 2013, 24, 56–67. [Google Scholar] [CrossRef]
  28. Cizek Adrienne, R.; Hunt William, F.; Winston Ryan, J.; Lauffer Matthew, S. Hydrologic Performance of Regenerative Stormwater Conveyance in the North Carolina Coastal Plain. J. Environ. Eng. 2017, 143, 05017003. [Google Scholar] [CrossRef]
  29. Buchholz, G. Design Considerations for Regenerative Stormwater Conveyances: What Defines Success? NC State University Libraries: Raleigh, NC, USA, 2017. [Google Scholar]
  30. Koryto, K.M.; Hunt, W.F.; Page, J.L. Hydrologic and water quality performance of regenerative stormwater conveyance installed to stabilize an eroded outfall. Ecol. Eng. 2017, 108, 263–276. [Google Scholar] [CrossRef]
  31. Hayes, K.A. Regenerative Stormwater Conveyance: Design Implications of an Urban Case Demonstration in Baltimore, Maryland. Master’s Thesis, University of Maryland, College Park, MD, USA, 2016. [Google Scholar]
  32. Duan, S.; Mayer, P.M.; Kaushal, S.S.; Wessel, B.M.; Johnson, T. Regenerative stormwater conveyance (RSC) for reducing nutrients in urban stormwater runoff depends upon carbon quantity and quality. Sci. Total Environ. 2019, 652, 134–146. [Google Scholar] [CrossRef] [PubMed]
  33. Williams, M.R.; Bhatt, G.; Filoso, S.; Yactayo, G. Stream Restoration Performance and Its Contribution to the Chesapeake Bay TMDL: Challenges Posed by Climate Change in Urban Areas. Estuaries Coasts 2017, 40, 1227–1246. [Google Scholar] [CrossRef]
  34. Wohl, E.; Lane, S.N.; Wilcox, A.C. The science and practice of river restoration. Water Resour. Res. 2015, 51, 5974–5997. [Google Scholar] [CrossRef]
  35. Filoso, S.; Smith, S.M.C.; Williams, M.R.; Palmer, M.A. The Efficacy of Constructed Stream-Wetland Complexes at Reducing the Flux of Suspended Solids to Chesapeake Bay. Environ. Sci. Technol. 2015, 49, 8986–8994. [Google Scholar] [CrossRef]
  36. Thompson, J.; Pelc, C.E.; Brogan, W.R.; Jordan, T.E. The multiscale effects of stream restoration on water quality. Ecol. Eng. 2018, 124, 7–18. [Google Scholar] [CrossRef]
  37. Cizek, A.R.; Johnson, J.P.; Birgand, F.; Hunt, W.F.; McLaughlin, R.A. Insights from using in-situ ultraviolet–visible spectroscopy to assess nitrogen treatment and subsurface dynamics in a regenerative stormwater conveyance (RSC) system. J. Environ. Manag. 2019, 252, 109656. [Google Scholar] [CrossRef]
  38. Sleziak, P.; Hlavčová, K.; Szolgay, J. Advantages of a time series analysis using wavelet transform as compared with a fourier analysis. Slovak J. Civ. Eng. 2015, 23, 30–36. [Google Scholar] [CrossRef]
  39. Kang, S.; Lin, H. Wavelet analysis of hydrological and water quality signals in an agricultural watershed. J. Hydrol. 2007, 338, 1–14. [Google Scholar] [CrossRef]
  40. Hao, Y.; Lu, J. Teleconnection between climate oscillations and riverine nutrient dynamics in Southeast China based on wavelet analysis. Environ. Sci. Pollut. Res. 2021, 28, 41807–41820. [Google Scholar] [CrossRef] [PubMed]
  41. Hidayat, M.N.; Wafdan, R.; Ramli, M.; Muchlisin, Z.A.; Rizal, S. Patterns and wavelet coherence analysis of tidal dynamics and chlorophyll a concentration. Glob. J. Environ. Sci. Manag. 2024, 10, 987–1004. [Google Scholar] [CrossRef]
  42. Martinez-Ríos, E.A.; Bustamante-Bello, R.; Navarro-Tuch, S.; Perez-Meana, H. Applications of the Generalized Morse Wavelets: A Review. IEEE Access 2023, 11, 667–688. [Google Scholar] [CrossRef]
  43. Torrence, C.; Compo, G.P. A practical guide to wavelet analysis. Bull. Am. Meteorol. Soc. 1998, 79, 61–78. [Google Scholar] [CrossRef]
  44. Labat, D. Recent advances in wavelet analyses: Part 1. A review of concepts. J. Hydrol. 2005, 314, 275–288. [Google Scholar] [CrossRef]
  45. Lilly, J.M. Element analysis: A wavelet-based method for analysing time-localized events in noisy time series. Proc. R. Soc. A Math. Phys. Eng. Sci. 2017, 473, 20160776. [Google Scholar] [CrossRef]
  46. Grinsted, A.; Moore, J.C.; Jevrejeva, S. Application of the cross wavelet transform and wavelet coherence to geophysical time series. Nonlinear Process. Geophys. 2004, 11, 561–566. [Google Scholar] [CrossRef]
  47. Beck, M.W.; Hagy, J.D. Adaptation of a Weighted Regression Approach to Evaluate Water Quality Trends in an Estuary. Environ. Model. Assess. 2015, 20, 637–655. [Google Scholar] [CrossRef]
  48. Wang, S.; Peng, H.; Liang, S. Prediction of estuarine water quality using interpretable machine learning approach. J. Hydrol. 2022, 605, 127320. [Google Scholar] [CrossRef]
  49. Wallace, J.M.; Gutzler, D.S. Teleconnections in the Geopotential Height Field during the Northern Hemisphere Winter. Mon. Weather. Rev. 1981, 109, 784–812. [Google Scholar] [CrossRef]
  50. Bradbury, J.A.; Keim, B.D.; Wake, C.P. U.S. East Coast Trough Indices at 500 hPa and New England Winter Climate Variability. J. Clim. 2002, 15, 3509–3517. [Google Scholar] [CrossRef]
  51. Manthos, Z.H.; Pegion, K.V.; Dirmeyer, P.A.; Stan, C. The relationship between surface weather over North America and the Mid-Latitude Seasonal Oscillation. Dyn. Atmos. Ocean. 2022, 99, 101314. [Google Scholar] [CrossRef]
  52. Giesen, S. Exploring the Influence of Climate Modes on Extremes Related to Atmospheric Fronts Along the Eastern United States. Master’s Thesis, The Florida State University, Tallahassee, FL, USA, 2023. [Google Scholar]
  53. Sorooshian, A.; Corral, A.F.; Braun, R.A.; Cairns, B.; Crosbie, E.; Ferrare, R.; Hair, J.; Kleb, M.M.; Hossein Mardi, A.; Maring, H. Atmospheric research over the western North Atlantic Ocean region and North American East Coast: A review of past work and challenges ahead. J. Geophys. Res. Atmos. 2020, 125, e2019JD031626. [Google Scholar] [CrossRef]
  54. Muller, A.C.; Muller, D.L.; Muller, A. Resolving spatiotemporal characteristics of the seasonal hypoxia cycle in shallow estuarine environments of the Severn River and South River, MD, Chesapeake Bay, USA. Heliyon 2016, 2, e00157. [Google Scholar] [CrossRef] [PubMed]
  55. Fisher, T.R.; Fox, R.J.; Gustafson, A.B.; Koontz, E.; Lepori-Bui, M.; Lewis, J. Localized water quality improvement in the Choptank estuary, a tributary of Chesapeake Bay. Estuaries Coasts 2021, 44, 1274–1293. [Google Scholar] [CrossRef]
  56. Zhang, Q.; Murphy, R.R.; Tian, R.; Forsyth, M.K.; Trentacoste, E.M.; Keisman, J.; Tango, P.J. Chesapeake Bay’s water quality condition has been recovering: Insights from a multimetric indicator assessment of thirty years of tidal monitoring data EPA Public Access. Sci. Total Environ. 2018, 637, 1617–1625. [Google Scholar] [CrossRef] [PubMed]
  57. Murphy, R.R.; Keisman, J.; Harcum, J.; Karrh, R.R.; Lane, M.; Perry, E.S.; Zhang, Q. Nutrient Improvements in Chesapeake Bay: Direct Effect of Load Reductions and Implications for Coastal Management. Environ. Sci. Technol. 2022, 56, 260–270. [Google Scholar] [CrossRef] [PubMed]
  58. Irby, I.D.; Friedrichs, M.A. Evaluating confidence in the impact of regulatory nutrient reduction on Chesapeake Bay water quality. Estuaries Coasts 2019, 42, 16–32. [Google Scholar] [CrossRef]
  59. Orth, R.J.; Dennison, W.C.; Lefcheck, J.S.; Gurbisz, C.; Hannam, M.; Keisman, J.; Landry, J.B.; Moore, K.A.; Murphy, R.R.; Patrick, C.J.; et al. Submersed Aquatic Vegetation in Chesapeake Bay: Sentinel Species in a Changing World. BioScience 2017, 67, 698–712. [Google Scholar] [CrossRef]
  60. Carey, J. The complex case of Chesapeake Bay restoration. Proc. Natl. Acad. Sci. USA 2021, 118, e2108734118. [Google Scholar] [CrossRef]
  61. Najjar, R.G.; Pyke, C.R.; Adams, M.B.; Breitburg, D.; Hershner, C.; Kemp, M.; Howarth, R.; Mulholland, M.R.; Paolisso, M.; Secor, D.; et al. Potential climate-change impacts on the Chesapeake Bay. Estuar. Coast. Shelf Sci. 2010, 86, 1–20. [Google Scholar] [CrossRef]
  62. Tzortziou, M.; Neale, P.; Megonigal, P.; Lee Pow Jackson, C.; Butterworth, M. Spatial gradients in dissolved carbon due to tidal marsh outwelling into a Chesapeake Bay estuary. Mar. Ecol. Prog. Ser. 2011, 426, 41–56. [Google Scholar] [CrossRef]
  63. Chen, Z.; Doering, P.H.; Ashton, M.; Orlando, B.A. Mixing Behavior of Colored Dissolved Organic Matter and Its Potential Ecological Implication in the Caloosahatchee River Estuary, Florida. Estuaries Coasts 2015, 38, 1706–1718. [Google Scholar] [CrossRef]
  64. Zhang, Q.; Blomquist, J.D. Watershed export of fine sediment, organic carbon, and chlorophyll-a to Chesapeake Bay: Spatial and temporal patterns in 1984–2016. Sci. Total Environ. 2018, 619–620, 1066–1078. [Google Scholar] [CrossRef]
  65. Clark, J.B.; Long, W.; Hood, R.R. A Comprehensive Estuarine Dissolved Organic Carbon Budget Using an Enhanced Biogeochemical Model. J. Geophys. Res. Biogeosciences 2020, 125, e2019JG005442. [Google Scholar] [CrossRef]
  66. Muller, A.C.; Muller, D.L. Spatial Heterogeneity of CDOM, Optical Brighteners, and Oils in Mesohaline Tidal Creeks Using Self-Organizing Maps. Water 2022, 14, 2533. [Google Scholar] [CrossRef]
  67. St.Laurent, K.A.; Coles, V.J.; Hood, R.R. Climate Extremes and Variability Surrounding Chesapeake Bay: Past, Present, and Future. JAWRA J. Am. Water Resour. Assoc. 2022, 58, 826–854. [Google Scholar] [CrossRef]
Figure 1. Study area location. The bold coastline represents the Lower Western Shore of Chesapeake Bay.
Water 16 02433 g001
Figure 2. Location of Long-term monitoring sites and restoration sites.
Water 16 02433 g002
Figure 3. Box plots of pre vs. post-restoration for (a) bottom dissolved oxygen in and (b) water clarity in Broad Creek, South River.
Water 16 02433 g003
Figure 4. Church Creek, South River Pre vs. post box plots for (a) bottom dissolved oxygen and (b) water clarity.
Water 16 02433 g004
Figure 5. Box plots of (a) bottom dissolved oxygen and (b) water clarity pre vs. post-restoration for MS1.
Water 16 02433 g005
Figure 6. Box plots of pre- and post-restoration for (a) bottom dissolved oxygen and (b) water clarity for Saltworks Creek, Severn River.
Water 16 02433 g006
Figure 7. Box plot results of (a) Secchi depth and (b) TSS in the Rhode River.
Water 16 02433 g007
Figure 8. Long-term trends of bottom dissolved oxygen at station WT6.1, Magothy River.
Water 16 02433 g008
Figure 9. Long-term trends of water clarity at station WT6.1, Magothy River.
Water 16 02433 g009
Figure 10. Long-term trends of bottom dissolved oxygen at station WT7.1, Severn River.
Water 16 02433 g010
Figure 11. Long-term trends of water clarity at station WT7.1, Severn River.
Water 16 02433 g011
Figure 12. (A): Time series plot of NAO and precipitation anomaly, (B): Wavelet coherence between NAO and precipitation anomaly, (C): Time series plot of ENSO and precipitation anomaly, (D): Wavelet coherence of ENSO and precipitation anomaly. Data is from station WT 8,1, South River.
Water 16 02433 g012
Figure 13. (A). Time-series plot of NAO and BDOI Index, (B). Wavelet coherence plot for NAO and BDOI, (C). Time-series of NAO and surface temperature index (STI), and (D). wavelet coherence plot for NAO and Surface temperature index in the South River.
Water 16 02433 g013
Figure 14. (a). Time-series plot of NAO and total surface Phosphorus Index (TSPT), (b). Wavelet coherence plot for NAO and TSPI, (c). Time-series of NAO and total surface Nitrogen index (TSNI), and (d). wavelet coherence plot for NAO and TSNI in the South River.
Water 16 02433 g014
Figure 15. Wavelet coherence analysis: (A) surface temperature and bottom dissolved oxygen anomaly, (B) Precipitation and Secchi disk anomaly, (C) Precipitation and TSS, and (D) TSS and Secchi anomaly.
Water 16 02433 g015
Table 1. Long-Term Water-Quality Monitoring Sites.
StationLocation DescriptionLatitudeLongitude
WT 6.1Middle Section of Magothy River39.0751−76.475
WT 7.1Middle Section of Severn River39.0068−76.5046
WT 8.1Middle Section of South River38.9493−76.5464
WT 8.2Rhode River38.8834−76.533
MS 1Mouth of South River38.89568−76.4736
SLTSaltworks Creek, Severn River39.0085−76.5319
BROBroad Creek, South River38.97287−76.5762
CHRChurch Creek, South River38.9639−76.5381
Table 2. Upland Stream Restoration Sites.
SiteLatitudeLongitudeSite DescriptionYear Completed
AHC38.972−76.537Annapolis Harbour Center, Church Creek2016
WIL38.966−76.539Wilelinor Drive, Church Creek2014
PBR38.96−76.572Preserve at Broad Creek2015
CW38.968−76.568Camp Woodland, Broad Creek2016
HOC38.976−76.563Heritage office complex2021
ACP238.98−76.565Annapolis Corporate Park 22016
BC238.98−76.563Broad Creek Headwaters 22019
BC138.98−76.561Broad Creek Headwaters 12018
ACP138.979−76.559Annapolis Corporate Park 12016
HPF38.966−76.544Homeport Farms2005
KH38.931−76.614Killarney House2018
HSG38.923−76.625Homestead Gardens2013
SD39.008−76.533Severn Drive2012
HHB38.048−76.568Herald Harbor Bonaparte2017
BHT39.051−76.574Buttonhead trail2016
ME39.054−76.638Millersville Elementary2012
CBP38.993−76.536Cabin branch pond2013
CC39.02−76.508Chase Creek2015
WIN39.018−76.51Winchester on Severn 2018
CD39.018−76.509Circle Drive2020
MC38.8815−76.5436Rhode River2016
SV39.095−76.474Magothy River, Severn RD.2010
HP39.102−76.454Magothy River, Heilman Property2019
CSC239.05−76.448Magothy River, Cape St. Claire2020
MB39.073−76.522Magothy River, Manhattan Beach2012
CFCF39.036−76.440Magothy River, Cape St. Claire Fire Station2019
CSC139.040−76.438Magothy River, Cape St. Claire2019
WL39.031−76.432Magothy River, Woods Landing Outfall2019
DC39.031−76.438Magothy River, Delso Court Outfall2019
Disclaimer/Publisher’s Note: The statements, opinions and data contained in all publications are solely those of the individual author(s) and contributor(s) and not of MDPI and/or the editor(s). MDPI and/or the editor(s) disclaim responsibility for any injury to people or property resulting from any ideas, methods, instructions or products referred to in the content.

