Article

Effects of Formulated Pellet Feed or Live Fish Food on the Intestinal and Aquaculture Water Microbial Communities in Goldfish, Carassius auratus

by
Yi Huang
1,
Qiang Huang
1,
Zhiqiu Huang
1,2 and
Yuhang Hong
1,2,*
1
Key Laboratory of Application of Ecology and Environmental Protection in Plateau Wetland of Sichuan, Xichang University, Xichang 415000, China
2
Key Laboratory of Animal Disease Detection and Prevention in Panxi District, Xichang University, Xichang 415000, China
*
Author to whom correspondence should be addressed.
Water 2024, 16(17), 2486; https://doi.org/10.3390/w16172486
Submission received: 31 July 2024 / Revised: 24 August 2024 / Accepted: 25 August 2024 / Published: 1 September 2024
(This article belongs to the Section Biodiversity and Functionality of Aquatic Ecosystems)

Abstract

:
This study investigates the impact of different diets on fish growth and bacterial community structure present in the intestine of goldfish (Carassius auratus) and their aquaculture water under recirculating water conditions. We assumed that different types of diet would form different intestinal microbiota that may affect host growth. Using Illumina MiSeq high-throughput sequencing, we analyzed bacterial communities in goldfish fed with formulated pellet feed, Tubifex worms (Limnodrilus hoffmeisteri), and an alternating diet of both. Over a 14-day feeding trial, no significant differences in juvenile goldfish growth were observed between groups. After 7 days, diet changes significantly influenced the abundance and diversity of intestinal bacteria, with the alternating diet notably enhancing bacterial diversity in both the intestines and water. However, these differences in bacterial diversity decreased by day 14. The results indicate that diet type affects microbial community diversity in the intestines and water of goldfish, and that goldfish intestines maintain a stable core bacterial community structure. This highlights the potential for optimizing diet types to enhance microbial health and stability in aquaculture systems and, in addition, provides an important scientific basis for alternative diets in goldfish aquaculture in the industry.

1. Introduction

Microorganisms are ubiquitous in aquatic environments and colonize various internal and external fish tissues such as intestines, gills, and skin. These microbial communities are mostly symbiotic and play a crucial role in the health and development of their fish hosts [1]. For example, Lactobacillus and Bifidobacterium species, commonly found in the fish gut, are known to contribute to nutrient metabolism and enhance immune response [2,3]. Aeromonas species, although often associated with pathogenicity, can also be part of the normal microbiota, playing roles in maintaining microbial balance [4]. The composition of these microbial communities can shift significantly in response to changes in environmental conditions and diet [5]. Extensive research has highlighted the vital functions of gut microbiota in supporting fundamental physiological processes such as nutrient metabolism [6], immune response [7], and disease resistance [8] in both humans and animals.
Advancements in molecular biology and the advent of next-generation sequencing (NGS) technologies, including high-throughput sequencing, have revolutionized our understanding of these complex microbial ecosystems [9]. Next-generation sequencing refers to a suite of advanced sequencing technologies that enable rapid and comprehensive analysis of DNA and RNA, allowing for the simultaneous sequencing of millions of fragments. These technologies are now routinely applied in environmental microbiology and aquaculture for genomic and transcriptomic studies. They help elucidate the regulatory mechanisms underlying biological processes and identify new biomarkers for population structure and phylogenetic studies. Next-generation sequencing has been successfully applied in a wide range of aquatic organisms, from well-established model organisms like zebrafish to numerous non-model marine and freshwater species, enhancing our understanding of their genetic diversity and adaptive strategies [10].
China’s leadership in global aquaculture is well-established, with its production volumes significantly surpassing those from wild fisheries [11]. However, the industry faces major challenges such as the overexploitation of marine resources and the escalating costs of conventional feeds like fishmeal, which is a primary protein source [12]. These issues underscore the urgent need for sustainable and cost-effective alternative feeds, for example, from insects [13]. In this context, insects such as the black soldier fly (Hermetia illucens) have emerged as a promising alternative due to their high protein content, rapid reproductive cycle, strong environmental resilience, and lower production costs [14]. Studies have shown that lipid-enriched larvae from the black soldier fly can replace up to 50% of fishmeal in diets for species like rainbow trout (Oncorhynchus mykiss) without compromising growth performance [15,16]. In addition, Tubifex worms, Limnodrilus hoffmeisteri, often referred to as sludge worms, serve as an intriguing example of live feed used in aquaculture due to their numerous beneficial attributes and their role in the diet of many fish species, particularly in fish larvae cultivation [17].
Ornamental fish culture, which emphasizes aesthetic attributes such as color and form over growth performance, faces unique challenges in feed formulation. Unlike feeds for consumption fish, ornamental fish feeds must balance attractiveness with nutritional content to maintain the health and vibrancy of the fish [18,19]. However, some reports point out that fresh live diets have issues with seasonal supply differences, limited sources, and fast deterioration of water quality. Compared to feeding with formulated pellet feed, the immunity of red carp fed with a fresh live diet (Tubifex worms, L. hoffmeisteri) has declined [20]. Given the underdevelopment of specialized feeds for many ornamental species, there is a significant opportunity to innovate in this area. The impact of diet on the gut microbiota has been extensively studied across various fish species using techniques like denaturing gradient gel electrophoresis (DGGE), fluorescence in situ hybridization (FISH), and high-throughput sequencing. However, there is a dearth of research focusing specifically on ornamental fishes like goldfish (Carassius auratus), which are highly valued in China for their diversity and historical significance in aquaculture [21]. Tubifex worms, a type of annelid commonly used as feed in ornamental fish breeding due to their availability and rapid reproduction, represent a traditional feed whose effects on microbial communities are not well understood.
This study aims to fill this gap by investigating the effects of different types of feed, including traditional and alternative options, on the growth performance and microbial communities of goldfish and their aquaculture environments. By leveraging high-throughput sequencing, we seek to understand how these feeds influence the microbial dynamics in environments where goldfish that have been acclimatized to artificial feeds are intermittently fed Tubifex worms. This research not only contributes to our basic understanding of microbial interactions in aquatic systems but also aids in the development of more sustainable aquaculture practices.

2. Materials and Methods

2.1. Goldfish and Housing

The current study was carried out in 2020 at Xichang University, Xichang, China. The juvenile goldfish used in this experiment were obtained from the aquaculture laboratory at Xichang College, with an average body length of 5.23 ± 1.35 cm. They were housed in recirculating aquaria indoors, measuring 60 cm × 45 cm × 55 cm. The fish were acclimatized for over 7 days with 24-h aeration and a 12:12 light–dark cycle. Throughout the cultivation period, the temperature in the aquaria was maintained at 26–28 °C, pH levels at 7.2–7.6, dissolved oxygen at 6.8–7.5 mg/L, ammonia levels below 0.5 mg/L, and nitrite levels below 0.1 mg/L. These conditions were chosen to simulate an ideal environment for the goldfish, minimizing stress and potential confounding factors that could affect the results of the experiment [22].

2.2. Experimental Diets

The specialized pellet feed for juvenile goldfish was procured from Xiamen Shenyang Limited Company. Tubifex worms were sourced from a local aquatic market. The proximate composition of the pellet feed and the Tubifex worms was determined before feeding test. The moisture content in the diets was evaluated by calculating the mass loss after vacuum drying, according to a national standard [23]. The crude protein was detected according to a national standard [24], by using the Kjeldahl method [25]. The crude fat was assessed according to a national standard [26], by using the Soxhlet extraction method [27]. The results were as follows: in granulated feed, the moisture content was 9.3%, crude protein 48.2%, and crude fat 6.6%. The Tubifex worms, after drying, contained 64.83% crude protein and 22.2% crude fat.

2.3. Feeding Trials

Before the start of the trials, the fish were made to fast for one day [28]. Only male fish were used for the current study to avoid any sex differences. They were then divided into three groups. Group A continued with the specialized pellet feed used during the juvenile stage, Group B was switched to fresh Tubifex worms, and Group C was subjected to alternating feeding: alternating daily between pellet feed and Tubifex worms (one day with pellet feed and the other day with Tubifex worms). To ensure consistency across the groups, each group was housed in two identical parallel aquaria, with six fish per tank, under the same environmental conditions (e.g., water temperature, pH, and light cycle). Feeding was conducted twice daily, at 7:00 a.m. and 5:00 p.m., with the feed quantity set at 4% of the fish body weight to standardize intake. After feeding, leftover feed and feces were promptly removed to maintain water quality and minimize variables that could affect the results.

2.4. Growth Performance and Sample Collection

After 14 days feeding, growth performance in each group was evaluated by calculating the average weight gain [29,30]. The average weight growth rate = (Final weight − Initial weight)/Initial weight.
Intestinal Samples: Fish intestines were collected on Day 7 and Day 14 of the experiment. For each collection, three fish were randomly selected from each tank and samples were pooled as one replicate to avoid individual differences. For each group, duplicate samples were used. The collection was performed on a sterile workbench. Fish were surface sterilized with 75% ethanol and rinsed twice with sterile saline. The entire intestines were then extracted, and the contents were squeezed into sterile 1.5 mL centrifuge tubes, which were immediately placed in a −20 °C freezer.
Water Samples: At each sampling point, 2 L of water from each aquarium was collected in sterile containers. The water samples were filtered through 1.2 μm and then through 0.22 μm sterile alternating cellulose ester membranes. The samples were stored at −80 °C for further use.
To better describe each sample, we used a combination of several abbreviation letters. For example, ‘7 d’ for samples collected at day 7, ‘14 d’ for samples collected at day 14, ‘F’ for feces from gut, ‘S’ for sample of water, ‘A/B/C’ for different diet groups with the number that follows indicating the replicate.

2.5. DNA Extraction and High-Throughput Sequencing

Intestinal content DNA was extracted using the QIAamp DNA Stool Mini Kit (Qiagen, Hilden, Germany). Water sample DNA was extracted using the E.Z.N.A. Water DNA Kit (Omega Bio-Tek, Norcross, GA, USA). The concentration and quality of DNA were assessed using a Nanodrop spectrophotometer and 1% agarose gel electrophoresis, respectively. The V3–V4 regions of the 16S rRNA gene were amplified using general primers 338-forward (5′-ACTCCTACGGGAGGCAGCA-3′) and 806-reverse (5′-GGACTACHVGGGTWTCTAAT-3′). Polymerase chain reaction (PCR) amplification was performed using Q5 High-Fidelity DNA Polymerase (New England Biolabs, Ipswich, MA, USA), and the products were verified via 2% agarose gel electrophoresis and purified using a gel extraction kit (Axygen, Glendale, AZ, USA). Sequencing was conducted on the Illumina HiSeq PE-150 platform.

2.6. Data Processing and Analysis

The paired-end reads were quality-filtered and merged using FLASH software (version 1.2.11). Chimeric sequences were identified and removed. Operational Taxonomic Units (OTUs) were clustered using a 97% similarity cutoff with the UCLUST algorithm, and taxonomic assignment was performed against the GreenGenes database using QIIME software (version 2). The OTU table was rarefied, and alpha diversity indices (Chao1, ACE, Simpson, and Shannon) for each group were calculated. A higher Chao1 or ACE index indicates higher richness, and a higher Simpson or Shannon index indicates higher community diversity [31]. Next, the non-metric Multidimensional Scaling (nMDS) method was conducted based on both weighted and unweighted UniFrac matrices to analyze the beta diversity. To analyze the differences in sequence abundance of various taxa at the phylum and genus levels between groups, we used the Metastats statistical algorithm [32] integrated within the Mothur software package (1.30.2). This involved performing pairwise comparison tests on the sequence counts for each sample. Statistical analysis of the data was conducted using the SPSS V22.0 software. An analysis of variance (ANOVA) with a multiple-comparison Duncan test was performed to determine the significance of the results. A p-value less than 0.05 was considered statistically significant.

3. Results

3.1. Growth Performance of Goldfish

After 14 days of the experiment, there were no significant differences (p > 0.05) in the average growth rates among the three groups of goldfish, indicating that the type of feed did not significantly affect the growth of juvenile goldfish over the experimental period.

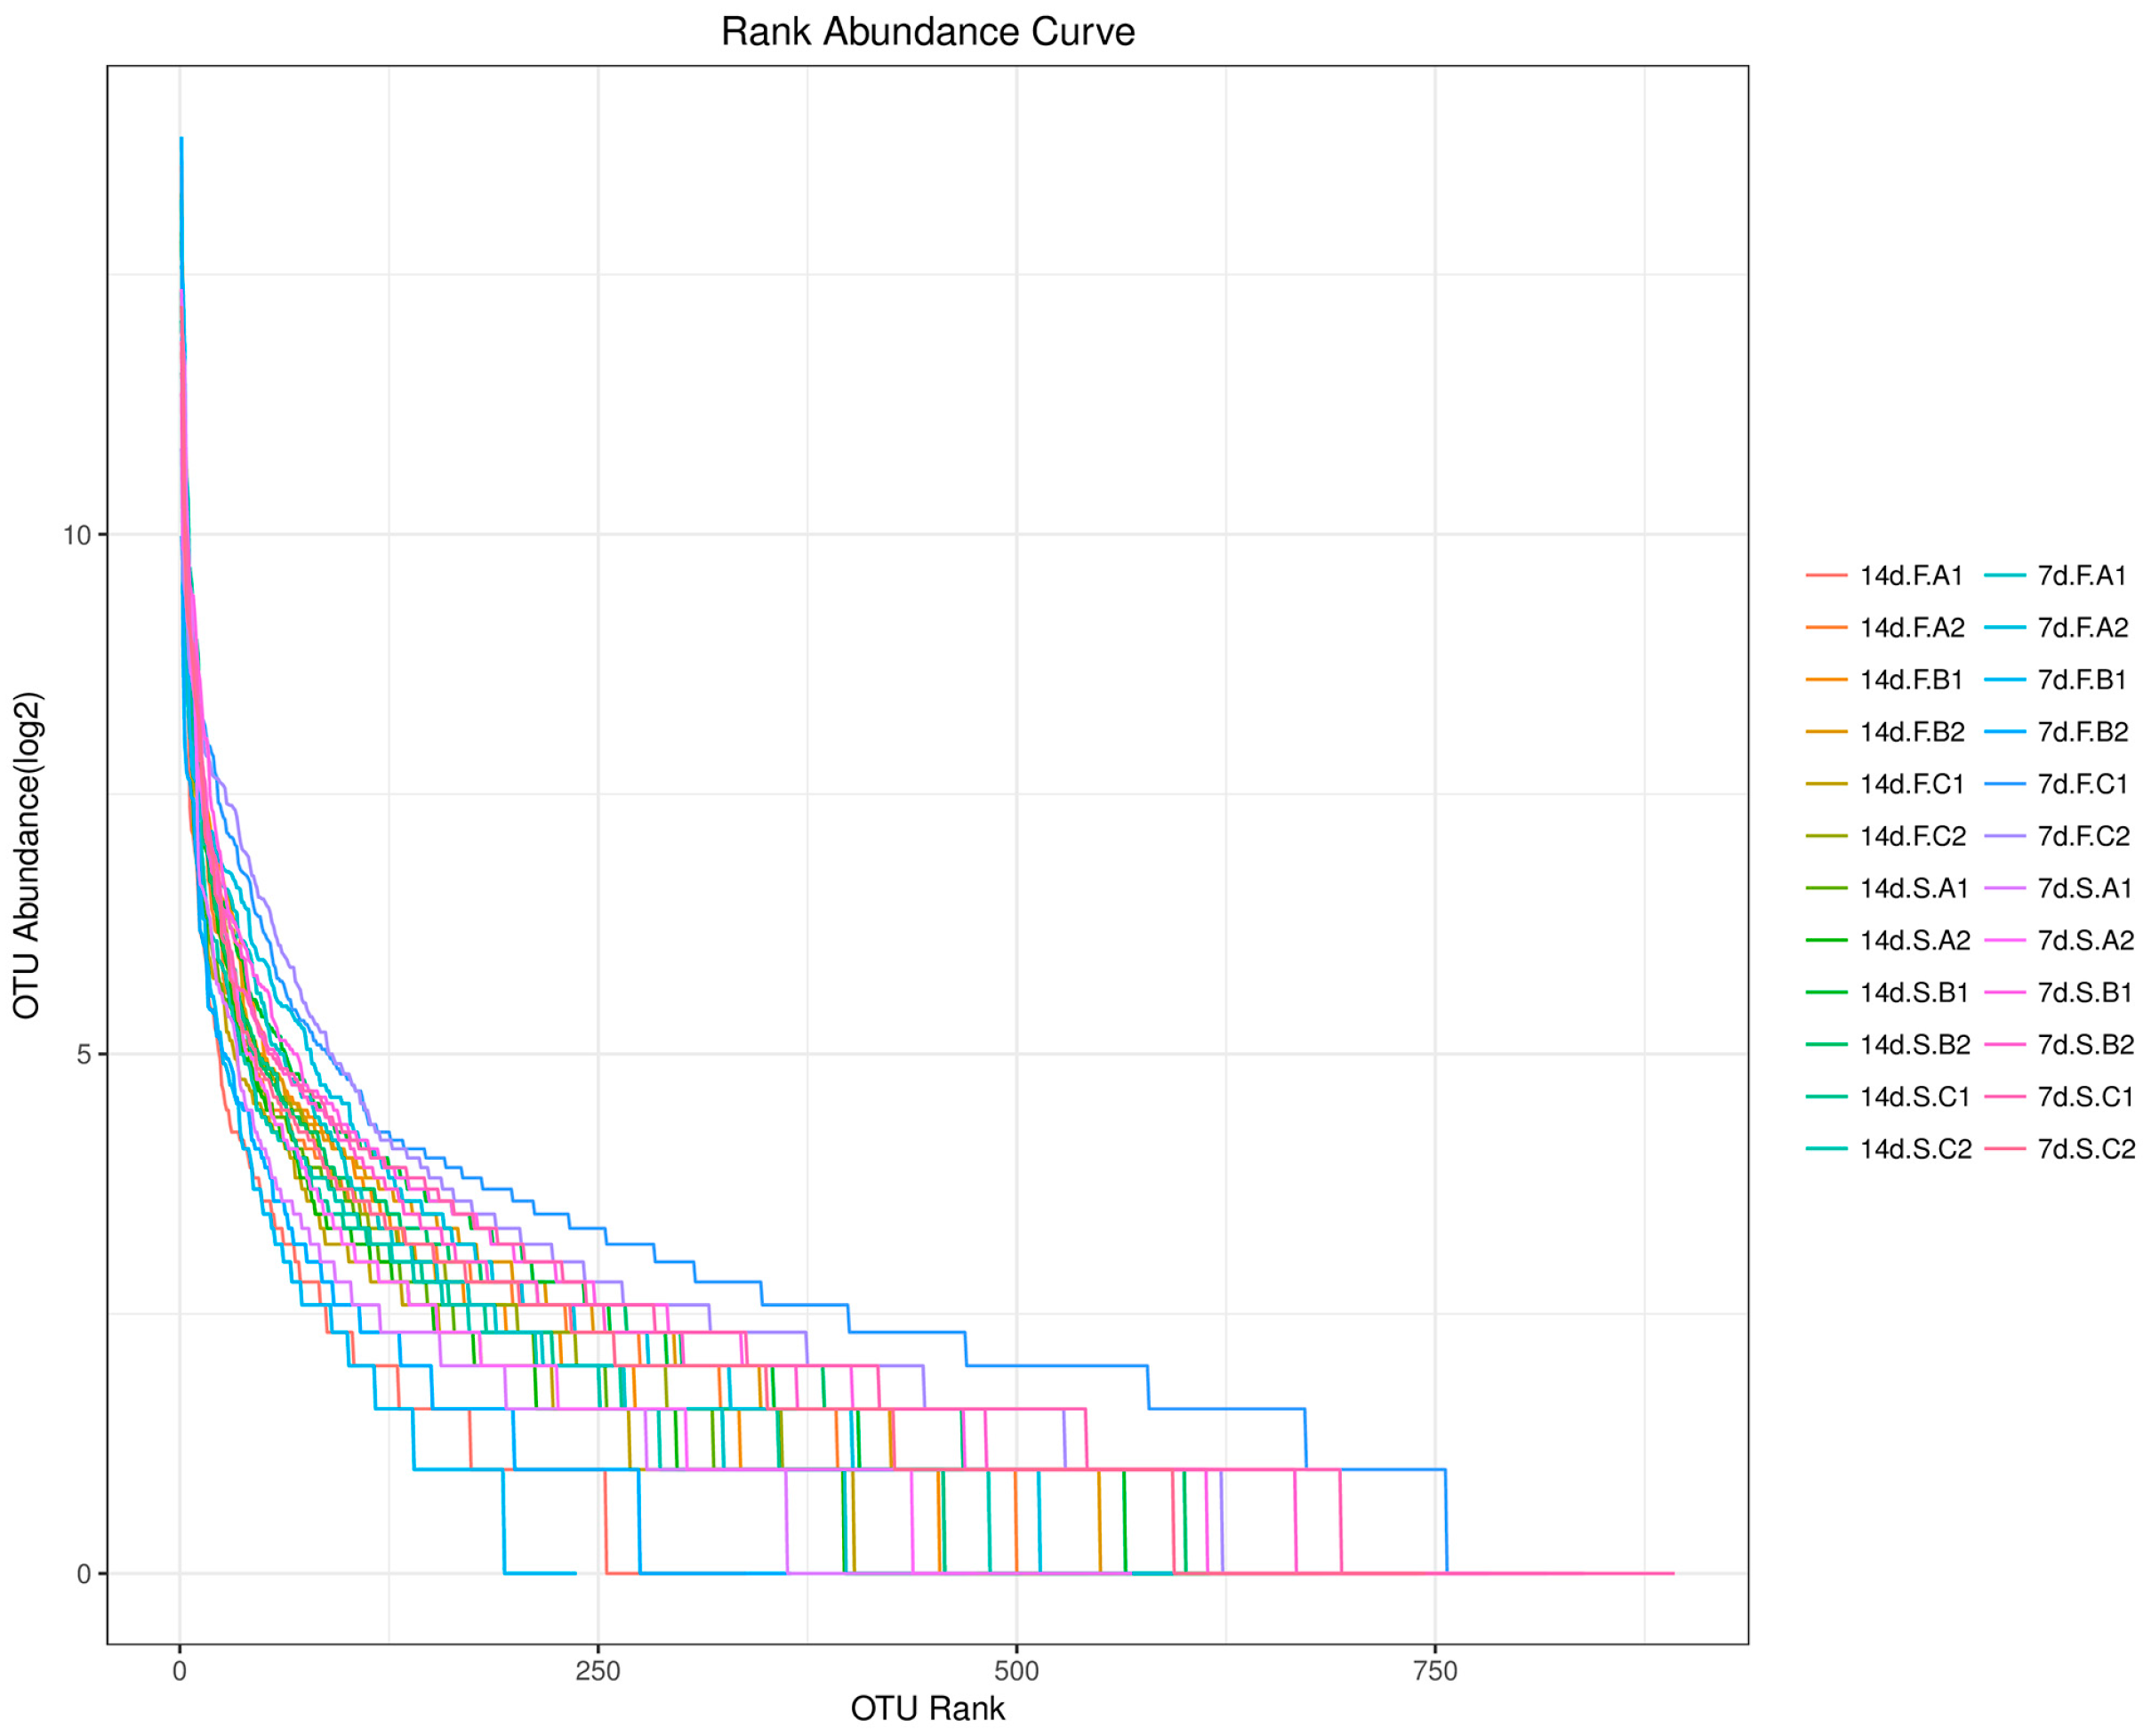
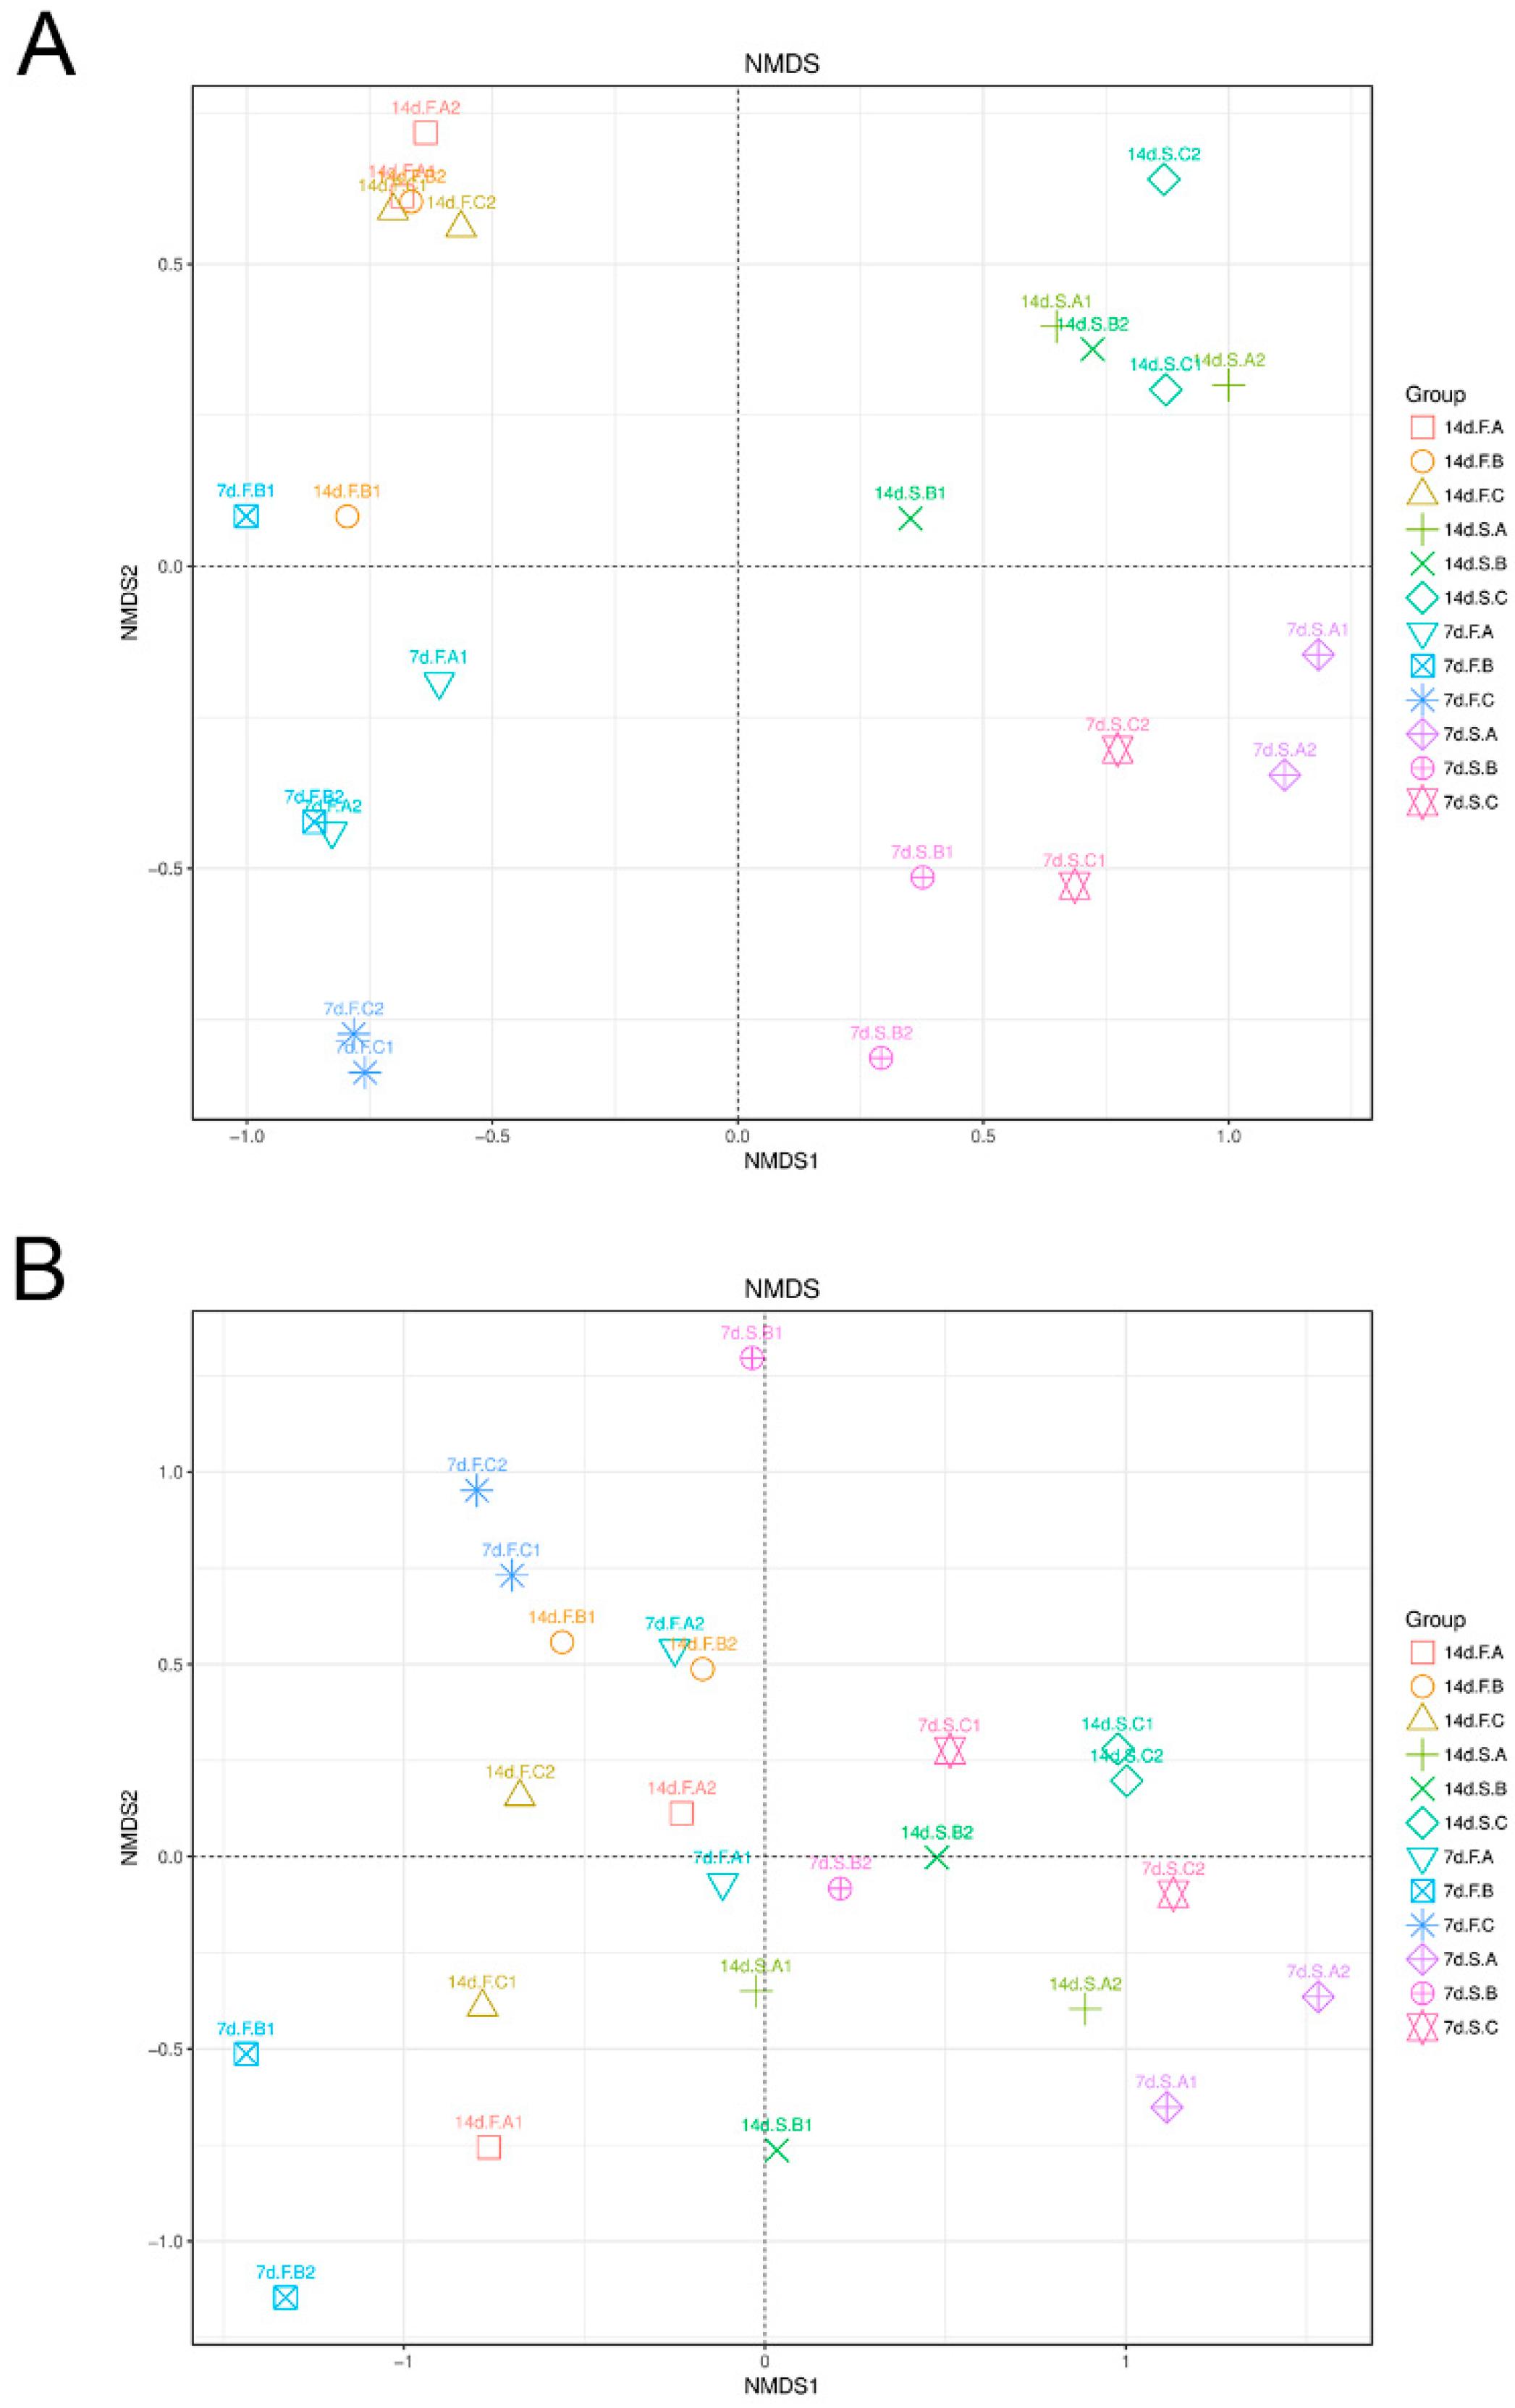
3.2. Impact of Different Feeds on the Bacterial Communities in the Goldfish Intestines and Aquaculture Water

After quality control and processing, a total of 883,417 sequences were obtained, ranging in length between 400–450 bp. Based on a 97% similarity threshold, these sequences were clustered into 63,015 OTUs, with the number of OTUs per sample ranging from 1119 to 4008. The Specaccum species accumulation curves showed a plateau as the sample size increased, indicating that the sample volume was sufficient to reflect differences in community diversity (Figure 1). The majority of sample abundance rank curves were elongated and flattened, suggesting high uniformity in community OTU differences (Figure 2).
The NMDS analysis showed that after 7 d of diet change, the microbiota structure of goldfish intestine in each group varied, but after 14 d they clustered together again. A similar trend could be found in the microbiota structure of water samples during the experiment. In addition, the composition of the intestinal bacterial community is very different from in the water samples (Figure 3).
As shown in Figure 4, at the phylum level, the intestinal bacteria abundance was highest in Proteobacteria for the pellet feed group (Group A) and alternating feed group (Group B) after 7 days, accounting for 46.90 ± 12.59% and 67.75 ± 9.40%, respectively, while in the Tubifex group (Group C), Firmicutes was predominant, accounting for 54.15 ± 14.78%. By day 14, the bacterial communities in the Tubifex group also predominantly consisted of Proteobacteria. In the aquaculture water, the Tubifex group initially showed a predominance of Proteobacteria at 57.55 ± 10.96%, but, by day 14, Actinobacteria became dominant at 52.19 ± 9.97%, with no significant difference from the feed group (Figure 4A). At the genus level, the intestinal bacteria in the pellet feed group were primarily Clavibacter with 38.95 ± 12.23% at day 7, whereas the other two groups showed much lower percentages; however, by day 14, all groups predominantly had Cetobacterium and Flavobacterium (Figure 4B).
Metastats results indicated that on day 7, there were significant differences between the Tubifex and pellet feed groups at 3 phyla and 22 genera levels, and between the alternating and pellet feed groups at 4 phyla and 21 genera levels. By day 14, these differences were reduced to 0 phyla and 10 genera for the Tubifex group and 1 phylum and 6 genera for the alternating group when compared to the pellet feed group. A similar pattern of reduced differences over time was observed in water samples (Table 1).
Intestinal Bacterial Diversity: On day 7, the Chao1, ACE, and Shannon indices in the Tubifex group showed a decrease, with no significant difference compared to the pellet feed group. However, the alternating feed group showed a significant increase in these indices compared to the Tubifex group (Table 2). By day 14, there were no significant differences in any indices among the groups.
Water Bacterial Diversity: On day 7, all indices in the Tubifex group were significantly higher than those in the pellet feed group, with no significant difference from the alternating feed group. However, by day 14, apart from the significantly lower Simpson index in the pellet feed group and the significantly higher Shannon index in the Tubifex group compared to the other groups, other indices showed no significant differences between the groups (Table 3).

4. Discussion

The intestinal microbiota is often referred to as a “second organ” of animals or a “second genome” of the host [33]. A substantial body of research has demonstrated that the gut microbiota plays a crucial role in the host health [34,35]. In the early developmental stages of teleost fish, nutrition comes solely from the yolk sac. At this stage, the intestine is not fully differentiated, but the digestive system is already in contact with the aquatic environment, which largely influences the initial microbial community structure. As the yolk sac is absorbed and external feeding begins, the digestive system matures and its microbial community structure is shaped by both the environment and the diet [29,36]. Our experiment is the first to apply second-generation high-throughput sequencing technology to explore how different feeding conditions affect microbial community structure in the intestines of goldfish.
Over a 14-day period, our results show no significant differences in growth among groups, which may be due to the short duration of the experiment. Nevertheless, significant changes were observed in the microbial community characteristics of both the intestines and aquaculture water. The predominance of intestinal microbiota shifted from Proteobacteria to Firmicutes. This shift highlights the adaptability of the goldfish intestinal microbiota and its capacity to respond rapidly to dietary inputs. The result is in line with findings in other fish species such as zebrafish [37], cat fish [38], grass carp [39], snow trout [40], sea bass [41], and grouper [42], which show dominance of Proteobacteria, Bacteroidetes, Actinobacteria, and Firmicutes. Interestingly, the Tubifex group in aquaculture water was initially dominated by Proteobacteria and later by Actinobacteria, similar to the feed group. The alternating feed group, however, was dominated by Clostridia, followed by Proteobacteria and Bacteroidetes. It has been reported that Proteobacteria are the predominant group in recirculating aquaculture systems and can reflect the health condition of the water and the animals, playing a crucial role in maintaining the stability of the aquaculture system [43]. Furthermore, Actinobacteria are known for their significant role in the biodegradation and recycling of materials and are a major external bacterial group in aquatic systems and fish digestive tracts [44].
Our results show that, whether in the intestines or in the water, the core microbial community consists mainly of Proteobacteria and Actinobacteria, indicating a relatively stable microbial community structure. The similarity in microbial community structure between the water and the intestines of goldfish and its concurrent change with dietary shifts suggests that the intestinal microbiome is closely connected to the external environment throughout the growth process and these influence each other. A study from Kim et al. demonstrated that gut microbial community in fish was more strongly shaped by host habitat rather than host taxonomy or trophic level [45], supporting our conclusion. However, by 14-day feeding, the abundance of Proteobacteria decreased while Actinobacteria and Bacteroidetes increased significantly, especially Bacteroidetes, which became the most pronounced group. Bacteroidetes play a key role as primary consumers of dissolved organic matter in aquatic environments and their abundance is significantly higher in healthy water bodies compared to those with disease occurrences [46]. This could imply that dietary changes leading to an increase in Bacteroidetes might enhance the overall health and stability of aquatic ecosystems by promoting cleaner and more disease-resistant conditions.
According to the results of alpha diversity, after changing the feed type, there are significant changes in the diversity of the microbiota in both the intestines of goldfish and the water. The alternating feed group showed the most significant changes, with all diversity indices significantly increasing. This indicates that interval feeding may increase the microbial diversity in the intestines of goldfish, which could potentially benefit their growth and health. However, by day 14 of feeding, the diversity differences between groups were not significant. Wong et al. [47] found that, in the cultivation of rainbow trout, the feed formulation using different feed ingredients has a significant impact on their growth and yield but has less effect on the diversity of intestinal microbiota. They believe that rainbow trout have a relatively stable core microbial community in their intestines, and changes in feed do not significantly affect it. This unknown core microbial community may be common to most aquatic species. Another study on sea bass (Dicentrarchus labrax) showed that replacing 15% of protein in a vegetal formulation with insect proteins led to a significantly higher growth performance, whereas no significant effect on gut microbiota was found [48]. Our results are consistent with their conclusions and further confirm that the intestinal microbial community of goldfish is adaptive and responds to changes in feed; at the same time, it also possesses strong stability for maintaining its core physiological and biochemical functions.
While the sample size in the present study was chosen for practical reasons, including resource constraints, it is acknowledged as a limitation of the study. A smaller sample size may reduce the statistical power of the analysis and limit the generalizability of the findings. However, pooling of intestines from three individuals for each sample somewhat mitigated this limitation in our study. In addition, it is important to acknowledge that several external factors may have influenced the results. For example, although we carefully controlled water temperature, pH, and other quality parameters, fluctuations in these environmental conditions or undetected variables could have affected microbial community dynamics. In addition, the methods used for handling and maintaining the fish, such as acclimatization procedures and feeding routines, may also influence microbial community structure. Therefore, considering these external factors and their potential impact on the results is essential for a comprehensive understanding of the findings.
In summary, the observed changes in microbial community structure and diversity in both the intestines of goldfish and their surrounding water reflect a dynamic response to dietary variations. These dietary changes significantly impact the microbial communities, influencing both the internal and external environments of the fish and contributing to ecological stability. The dominant groups at the genus level exhibited trends similar to those observed at the phylum level, underscoring the significant effect of diet on microbial community structure. It suggests that the core intestinal microbiota will be stabilized within a short period of diet change and that an alternative diet with Tubifex worms, L. hoffmeisteri, is practicable for goldfish aquaculture. These findings provide valuable insights into the interactions between diet and microbial ecology in aquaculture settings. Future research should focus on several key areas to build on these findings. Long-term studies are needed to assess the durability of microbiota changes and their long-term effects on fish health and growth. Investigating the interactions between diet, microbial diversity, and specific health outcomes in goldfish could provide further insights into how dietary adjustments can improve aquaculture practices. Additionally, exploring the impact of alternative feeds on other aquatic species and their microbial communities could broaden the applicability of these findings across different aquaculture systems.

Author Contributions

Conceptualization, Y.H. (Yuhang Hong); Methodology, Y.H. (Yi Huang); Software, Q.H.; Validation, Z.H.; Formal analysis, Y.H. (Yi Huang); Investigation, Q.H.; Resources, Q.H.; Writing—original draft, Y.H. (Yi Huang); Writing—review & editing, Y.H. (Yuhang Hong); Project administration, Z.H.; Funding acquisition, Z.H. and Y.H. (Yuhang Hong). All authors have read and agreed to the published version of the manuscript.

Funding

This study was financially supported by the National Natural Science Foundation of China (Grant No. 31960740) and General Science Research Program in Sichuan Province (Grant No. 18ZA0433).

Institutional Review Board Statement

The animal study protocol was approved by the Animal Bioethics Committee at Xichang University, China (Approving No. XCC20230603003). The authors declare that they have no known competing financial interests or personal relationships that could have appeared to influence the work reported in this paper.

Data Availability Statement

Data will be made available on request.

Conflicts of Interest

The authors declare no conflict of interest.

References

  1. Banerjee, G.; Ray, A.K. Bacterial symbiosis in the fish gut and its role in health and metabolism. Symbiosis 2017, 72, 1–11. [Google Scholar] [CrossRef]
  2. Vlková, E.; Kalous, L.; Bunešová, V.; Rylková, K.; Světlíková, R.; Rada, V. Occurrence of bifidobacteria and lactobacilli in digestive tract of some freshwater fishes. Biologia 2012, 67, 411–416. [Google Scholar] [CrossRef]
  3. Ringø, E.; Harikrishnan, R.; Soltani, M.; Ghosh, K. The Effect of Gut Microbiota and Probiotics on Metabolism in Fish and Shrimp. Animals 2022, 12, 3016. [Google Scholar] [CrossRef] [PubMed]
  4. Hayatgheib, N.; Moreau, E.; Calvez, S.; Lepelletier, D.; Pouliquen, H. A review of functional feeds and the control of Aeromonas infections in freshwater fish. Aquac. Int. 2020, 28, 1083–1123. [Google Scholar] [CrossRef]
  5. Nguyen, J.; Lara-Gutiérrez, J.; Stocker, R. Environmental fluctuations and their effects on microbial communities, populations and individuals. FEMS Microbiol. Rev. 2021, 45, fuaa068. [Google Scholar] [CrossRef]
  6. Yadav, M.; Verma, M.K.; Chauhan, N.S. A review of metabolic potential of human gut microbiome in human nutrition. Arch. Microbiol. 2018, 200, 203–217. [Google Scholar] [CrossRef]
  7. Ahern, P.; Faith, J.; Gordon, J. Mining the Human Gut Microbiota for Effector Strains that Shape the Immune System. Immunity 2014, 40, 815–823. [Google Scholar] [CrossRef]
  8. Philipp, E.; Moran, N.A. The gut microbiota of insects—Diversity in structure and function. FEMS Microbiol. Rev. 2013, 37, 699–735. [Google Scholar]
  9. Finotello, F.; Mastrorilli, E.; Di Camillo, B. Measuring the diversity of the human microbiota with targeted next-generation sequencing. Brief. Bioinform. 2018, 19, 679–692. [Google Scholar] [CrossRef]
  10. Ghanbari, M.; Kneifel, W.; Domig, K.J. A new view of the fish gut microbiome: Advances from next-generation sequencing. Aquaculture 2015, 448, 464–475. [Google Scholar] [CrossRef]
  11. Henry, M.; Gasco, L.; Piccolo, G.; Fountoulaki, E. Review on the use of insects in the diet of farmed fish: Past and future. Anim. Feed Sci. Technol. 2015, 203, 1–22. [Google Scholar] [CrossRef]
  12. Gasco, L.; Gai, F.; Maricchiolo, G.; Genovese, L.; Ragonese, S.; Bottari, T.; Caruso, G. Fishmeal Alternative Protein Sources for Aquaculture Feeds. In Feeds for the Aquaculture Sector: Current Situation and Alternative Sources; Gasco, L., Gai, F., Maricchiolo, G., Genovese, L., Ragonese, S., Bottari, T., Caruso, G., Eds.; Springer International Publishing: Cham, Switzerland, 2018; pp. 1–28. [Google Scholar]
  13. Luthada-Raswiswi, R.; Mukaratirwa, S.; O’Brien, G. Animal Protein Sources as a Substitute for Fishmeal in Aquaculture Diets: A Systematic Review and Meta-Analysis. Appl. Sci. 2021, 11, 3854. [Google Scholar] [CrossRef]
  14. Lu, S.; Taethaisong, N.; Meethip, W.; Surakhunthod, J.; Sinpru, B.; Sroichak, T.; Archa, P.; Thongpea, S.; Paengkoum, S.; Purba, R.A.; et al. Nutritional Composition of Black Soldier Fly Larvae (Hermetia illucens L.) and Its Potential Uses as Alternative Protein Sources in Animal Diets: A Review. Insects 2022, 13, 831. [Google Scholar] [CrossRef]
  15. Melenchón, F.; Larrán, A.M.; de Mercado, E.; Hidalgo, M.C.; Cardenete, G.; Barroso, F.G.; Fabrikov, D.; Lourenço, H.M.; Pessoa, M.F.; Tomás-Almenar, C. Potential use of black soldier fly (Hermetia illucens) and mealworm (Tenebrio molitor) insectmeals in diets for rainbow trout (Oncorhynchus mykiss). Aquac. Nutr. 2021, 27, 491–505. [Google Scholar] [CrossRef]
  16. Sealey, W.; Gaylord, G.; Barrows, F.; Tomberlin, J.; McGuire, M.; Ross, C.; St-Hilaire, S. Sensory Analysis of Rainbow Trout, Oncorhynchus mykiss, Fed Enriched Black Soldier Fly Prepupae, Hermetia illucens. J. World Aquac. Soc. 2011, 42, 1–134. [Google Scholar] [CrossRef]
  17. Mandall, R.N.; Kar, S.; Chakrabarti, P.P.; Chattopadhyay, D.N.; Paul, B.N.; Adhikari, S.; Maity, J.; Pillai, B.R. Production of tubifex—A new dimension of aquaculture in feeding juvenile fish. Aquac. Asia Mag. 2018, 22, 19–22. [Google Scholar]
  18. Lim, L.C.; Dhert, P.; Sorgeloos, P. Recent developments in the application of live feeds in the freshwater ornamental fish culture. Aquaculture 2003, 227, 319–331. [Google Scholar] [CrossRef]
  19. Hoseinifar, S.H.; Maradonna, F.; Faheem, M.; Harikrishnan, R.; Devi, G.; Ringø, E.; Van Doan, H.; Ashouri, G.; Gioacchini, G.; Carnevali, O. Sustainable Ornamental Fish Aquaculture: The Implication of Microbial Feed Additives. Animals 2023, 13, 1583. [Google Scholar] [CrossRef]
  20. Gao, L.; Zhang, P.; Wang, W.; Wen, H.; Zhang, Y. Effects of artificial compound feed and fresh food on growth and immunity of red carp, Carassius auratus. Sci. Fish Farming 2013, 4, 71–72. [Google Scholar]
  21. Chen, D.; Zhang, Q.; Tang, W.; Huang, Z.; Wang, G.; Wang, Y.; Shi, J.; Xu, H.; Lin, L.; Li, Z.; et al. The evolutionary origin and domestication history of goldfish (Carassius auratus). Proc. Natl. Acad. Sci. USA 2020, 117, 29775–29785. [Google Scholar] [CrossRef]
  22. Brown, C.; Wolfenden, D.; Sneddon, L. Goldfish (Carassius auratus). In Companion Animal Care and Welfare; Wiley: Hoboken, NJ, USA, 2018; pp. 467–478. [Google Scholar]
  23. The Ministry of Agriculture of the People’s Republic of China. Determination of moisture in feedstuffs. In PRC National Standard; China Standards Press: Beijing, China, 2014. [Google Scholar]
  24. The Ministry of Agriculture of the People’s Republic of China. Determination of crude protein in feeds-Kjeldahl method. In PRC National Standard; China Standards Press: Beijing, China, 2018. [Google Scholar]
  25. Kirk, P.L. Kjeldahl method for total nitrogen. Anal. Chem. 1950, 22, 354–358. [Google Scholar] [CrossRef]
  26. The Ministry of Agriculture of the People’s Republic of China. Determination of crude fat in feeds. In PRC National Standard; China Standards Press: Beijing, China, 2006. [Google Scholar]
  27. Luque de Castro, M.D.; Priego-Capote, F. Soxhlet extraction: Past and present panacea. J. Chromatogr. A 2010, 1217, 2383–2389. [Google Scholar] [CrossRef] [PubMed]
  28. Tian, X.; Qin, J.G. A single phase of food deprivation provoked compensatory growth in barramundi Lates calcarifer. Aquaculture 2003, 224, 169–179. [Google Scholar] [CrossRef]
  29. Zhang, Y.; Wen, B.; Meng, L.-J.; Gao, J.-Z.; Chen, Z.-Z. Dynamic changes of gut microbiota of discus fish (Symphysodon haraldi) at different feeding stages. Aquaculture 2021, 531, 735912. [Google Scholar] [CrossRef]
  30. McCormick, M.I.; Molony, B.W. Effects of feeding history on the growth characteristics of a reef fish at settlement. Mar. Biol. 1992, 114, 165–173. [Google Scholar] [CrossRef]
  31. Li, Z.; Zhou, J.; Liang, H.; Ye, L.; Lan, L.; Lu, F.; Wang, Q.; Lei, T.; Yang, X.; Cui, P.; et al. Differences in Alpha Diversity of Gut Microbiota in Neurological Diseases. Front. Neurosci. 2022, 16, 879318. [Google Scholar] [CrossRef]
  32. White, J.R.; Nagarajan, N.; Pop, M. Statistical Methods for Detecting Differentially Abundant Features in Clinical Metagenomic Samples. PLoS Comput. Biol. 2009, 5, e1000352. [Google Scholar] [CrossRef]
  33. Sommer, F.; Bäckhed, F. The gut microbiota—Masters of host development and physiology. Nat. Rev. Microbiol. 2013, 11, 227–238. [Google Scholar] [CrossRef] [PubMed]
  34. Li, X.; Yan, Q.; Xie, S.; Hu, W.; Yu, Y.; Hu, Z. Gut Microbiota Contributes to the Growth of Fast-Growing Transgenic Common Carp (Cyprinus carpio L.). PLoS ONE 2013, 8, e64577. [Google Scholar] [CrossRef]
  35. Marchesi, J.; Adams, D.; Fava, F.; Hermes, G.; Hirschfield, G.; Hold, G.; Quraishi, M.N.; Kinross, J.; Smidt, H.; Tuohy, K.; et al. The gut microbiota and host health: A new clinical frontier. Gut 2015, 65, 330. [Google Scholar] [CrossRef]
  36. Hamlin, H.; Hunt von Herbing, I.; Kling, L.J. Histological and morphological evaluations of digestive tract and associated organs of haddock throughout post-hatching ontogeny. J. Fish Biol. 2005, 57, 716–732. [Google Scholar]
  37. Semova, I.; Carten, J.D.; Stombaugh, J.; Mackey, L.C.; Knight, R.; Farber, S.A.; Rawls, J.F. Microbiota Regulate Intestinal Absorption and Metabolism of Fatty Acids in the Zebrafish. Cell Host Microbe 2012, 12, 277–288. [Google Scholar] [CrossRef] [PubMed]
  38. Bledsoe, J.; C Peterson, B.; Swanson, K.; Small, B. Ontogenetic Characterization of the Intestinal Microbiota of Channel Catfish through 16S rRNA Gene Sequencing Reveals Insights on Temporal Shifts and the Influence of Environmental Microbes. PLoS ONE 2016, 11, e0166379. [Google Scholar] [CrossRef] [PubMed]
  39. Gang, Y.; Qing, J.S.; Hongzhong, C.; Chungen, W.; Baoqing, H.; Mo, P.; Liusheng, P.; Jianguo, Y.; Lifeng, L. Changes in microbiota along the intestine of grass carp (Ctenopharyngodon idella): Community, interspecific interactions, and functions. Aquaculture 2019, 498, 151–161. [Google Scholar]
  40. Ghanbari, M.; Shahraki, H.; Kneifel, W.; Domig, K. A first insight into the intestinal microbiota of snow trout (Schizothorax zarudnyi). Symbiosis 2017, 72, 183–193. [Google Scholar] [CrossRef]
  41. Carda Diéguez, M.; Mira, A.; Fouz, B. Pyrosequencing survey of intestinal microbiota diversity in cultured sea bass (Dicentrarchus labrax) fed functional diets. FEMS Microbiol. Ecol. 2014, 87, 451–459. [Google Scholar] [CrossRef] [PubMed]
  42. Ma, C.; Chen, C.; Jia, L.; He, X.; Zhang, B. Comparison of the intestinal microbiota composition and function in healthy and diseased Yunlong Grouper. AMB Express 2019, 9, 187. [Google Scholar] [CrossRef] [PubMed]
  43. Lahav, O.; Massada, I.B.; Yackoubov, D.; Zelikson, R.; Mozes, N.; Tal, Y.; Tarre, S. Quantification of anammox activity in a denitrification reactor for a recirculating aquaculture system. Aquaculture 2009, 288, 76–82. [Google Scholar] [CrossRef]
  44. Butbunchu, N.; Pathom-Aree, W. Actinobacteria as Promising Candidate for Polylactic Acid Type Bioplastic Degradation. Front. Microbiol. 2019, 10, 2834. [Google Scholar] [CrossRef]
  45. Kim, P.S.; Shin, N.-R.; Lee, J.-B.; Kim, M.-S.; Whon, T.W.; Hyun, D.-W.; Yun, J.-H.; Jung, M.-J.; Kim, J.Y.; Bae, J.-W. Host habitat is the major determinant of the gut microbiome of fish. Microbiome 2021, 9, 166. [Google Scholar] [CrossRef]
  46. Cottrell, M.T.; Kirchman, D.L. Natural assemblages of marine proteobacteria and members of the Cytophaga-Flavobacter cluster consuming low- and high-molecular-weight dissolved organic matter. Appl. Environ. Microbiol. 2000, 66, 1692–1697. [Google Scholar] [CrossRef] [PubMed]
  47. Sandi, W.; Thomas, W.; Steven, S.; John, D.; Frederic, B.; P Brett, K.; Timothy, W.; Wiens, G.D.; Kevin, S.; Rawls, J.F. Aquacultured rainbow trout (Oncorhynchus mykiss) possess a large core intestinal microbiota that is resistant to variation in diet and rearing density. Appl. Environ. Microbiol. 2013, 79, 4974–4984. [Google Scholar]
  48. Pérez-Pascual, D.; Estellé, J.; Dutto, G.; Rodde, C.; Bernardet, J.-F.; Marchand, Y.; Duchaud, E.; Przybyla, C.; Ghigo, J.-M. Growth Performance and Adaptability of European Sea Bass (Dicentrarchus labrax) Gut Microbiota to Alternative Diets Free of Fish Products. Microorganisms 2020, 8, 1346. [Google Scholar] [CrossRef] [PubMed]
Figure 1. Species accumulation curves of OTUs. The horizontal coordinate is the sample size, the vertical coordinate is the number of species (OTU) observed with 100 (default) samples taken at this sample size, the black solid line is the median line, the blue shading reflects the confidence interval (95%) of the curve, and the box plot reflects the numerical distribution of the observed species.
Water 16 02486 g001
Figure 2. Rank abundance curve of OTUs. Note: 7 d = samples collected at day 7; 14 d = samples collected at day 14. F = feces in gut; S = sample of water; A = diet group; B = Tubifex worms group; C = alternating feed group; the number at the end indicates the replicate number. The horizontal coordinate is the serial number of OTU in order of abundance. The ordinate is the value of abundance/mean of each OTU in this sample/group after Log2 logarithmic conversion (Log10 conversion, percentage conversion or no conversion); Each polyline represents a sample/group, and the length of the polyline on the horizontal axis reflects the number of OTUs with that abundance in that sample/group. The flatness of the line reflects the evenness of community composition.
Water 16 02486 g002
Figure 3. Effects of diet change on diversity of the bacteria in gut of Carassius auratus and the water. The plots are based on non-metric Multidimensional Scaling (nMDS) and the shorter distance between each point represents more similarity of structures of microbial communities between or within groups. Panel (A): Unweighted UniFrac; Panel (B): Weighted UniFrac. Note: 7 d = samples collected at day 7; 14 d = samples collected at day 14. F = feces in gut; S = sample of water; A = pellet diet group; B = Tubifex worms group; C = alternating feed group; the number at the end indicates the replicate number.
Water 16 02486 g003
Figure 4. Effects of different diet type on the composition and abundance of bacteria in gut of Carassius auratus and the water. Panel (A): at phylum level; Panel (B): at genus level. Note: 7 d = samples collected at day 7; 14 d = samples collected at day 14. F = feces in gut; S = sample of water; A = pellet diet group; B = Tubifex worms group; C = alternating feed group; the number at the end indicates the replicate number.
Water 16 02486 g004
Table 1. Results from Metastats assay between each group.
GroupTimeNumbers of Taxon with Significant Difference
PhylumGenus
FA vs. FB7 d322
FA vs. FC421
SA vs. SB516
SA vs. SC29
FA vs. FB14 d010
FA vs. FC16
SA vs. SB09
SA vs. SC06
Note: F = feces in gut; S = sample of water; A = pellet diet group; B = Tubifex worms group; C = alternating feed group.
Table 2. Variation of diversity index of intestinal microbiota in each group.
GroupTimeSimpsonChao1ACEShannon
FA7 d0.83 ± 0.09 a568.55 ± 61.05 ab576.86 ± 64.82 ab5.13 ± 0.69 abc
FB0.60 ± 0.19 a336.54 ± 82.34 a349.43 ± 84.35 a2.75 ± 0.47 a
FC0.98 ± 0.00 a774.56 ± 63.98 b776.05 ± 61.74 b7.28 ± 0.20 c
FA14 d0.74 ± 0.16 a525.55 ± 145.04 ab542.32 ± 138.20 ab3.90 ± 1.22 ab
FB0.92 ± 0.01 a678.61 ± 75.11 ab696.85 ± 73.33 b5.49 ± 0.15 bc
FC0.78 ± 0.09 a583.06 ± 112.24 ab593.15 ± 104.88 ab4.23 ± 0.66 ab
Note: Different alphabet in a column indicates significant difference between each two groups (p < 0.05). F = feces in gut; A = pellet diet group; B = Tubifex worms group; C = alternating feed group.
Table 3. Variation of diversity index of water microbiota in each group.
GroupTimeSimpsonChao1ACEShannon
SA7 d0.88 ± 0.00 a592.18 ± 40.40 a605.80 ± 55.92 a4.53 ± 0.24 a
SB0.95 ± 0.01 c899.11 ± 19.88 b923.45 ± 25.70 b6.25 ± 0.23 b
SC0.92 ± 0.02 abc917.24 ± 105.83 b935.57 ± 93.58 b5.80 ± 0.45 b
SA14 d0.81 ± 0.01 d540.69 ± 103.69 a550.98 ± 113.98 a4.28 ± 0.09 a
SB0.93 ± 0.01 bc757.05 ± 55.57 ab777.58 ± 44.07 ab5.80 ± 0.02 b
SC0.90 ± 0.01 ab623.58 ± 119.62 ab625.90 ± 114.36 a4.90 ± 0.19 a
Note: Different alphabet in a column indicates significant difference between each two groups (p < 0.05). S = sample of water; A = pellet diet group; B = Tubifex worms group; C = alternating feed group.
Disclaimer/Publisher’s Note: The statements, opinions and data contained in all publications are solely those of the individual author(s) and contributor(s) and not of MDPI and/or the editor(s). MDPI and/or the editor(s) disclaim responsibility for any injury to people or property resulting from any ideas, methods, instructions or products referred to in the content.

