
Comprehending Spatial Distribution and Controlling Mechanisms of Groundwater in Topical Coastal Aquifers of Southern China Based on Hydrochemical Evaluations
 , and
, and
Abstract
:1. Introduction
2. Materials and Methods
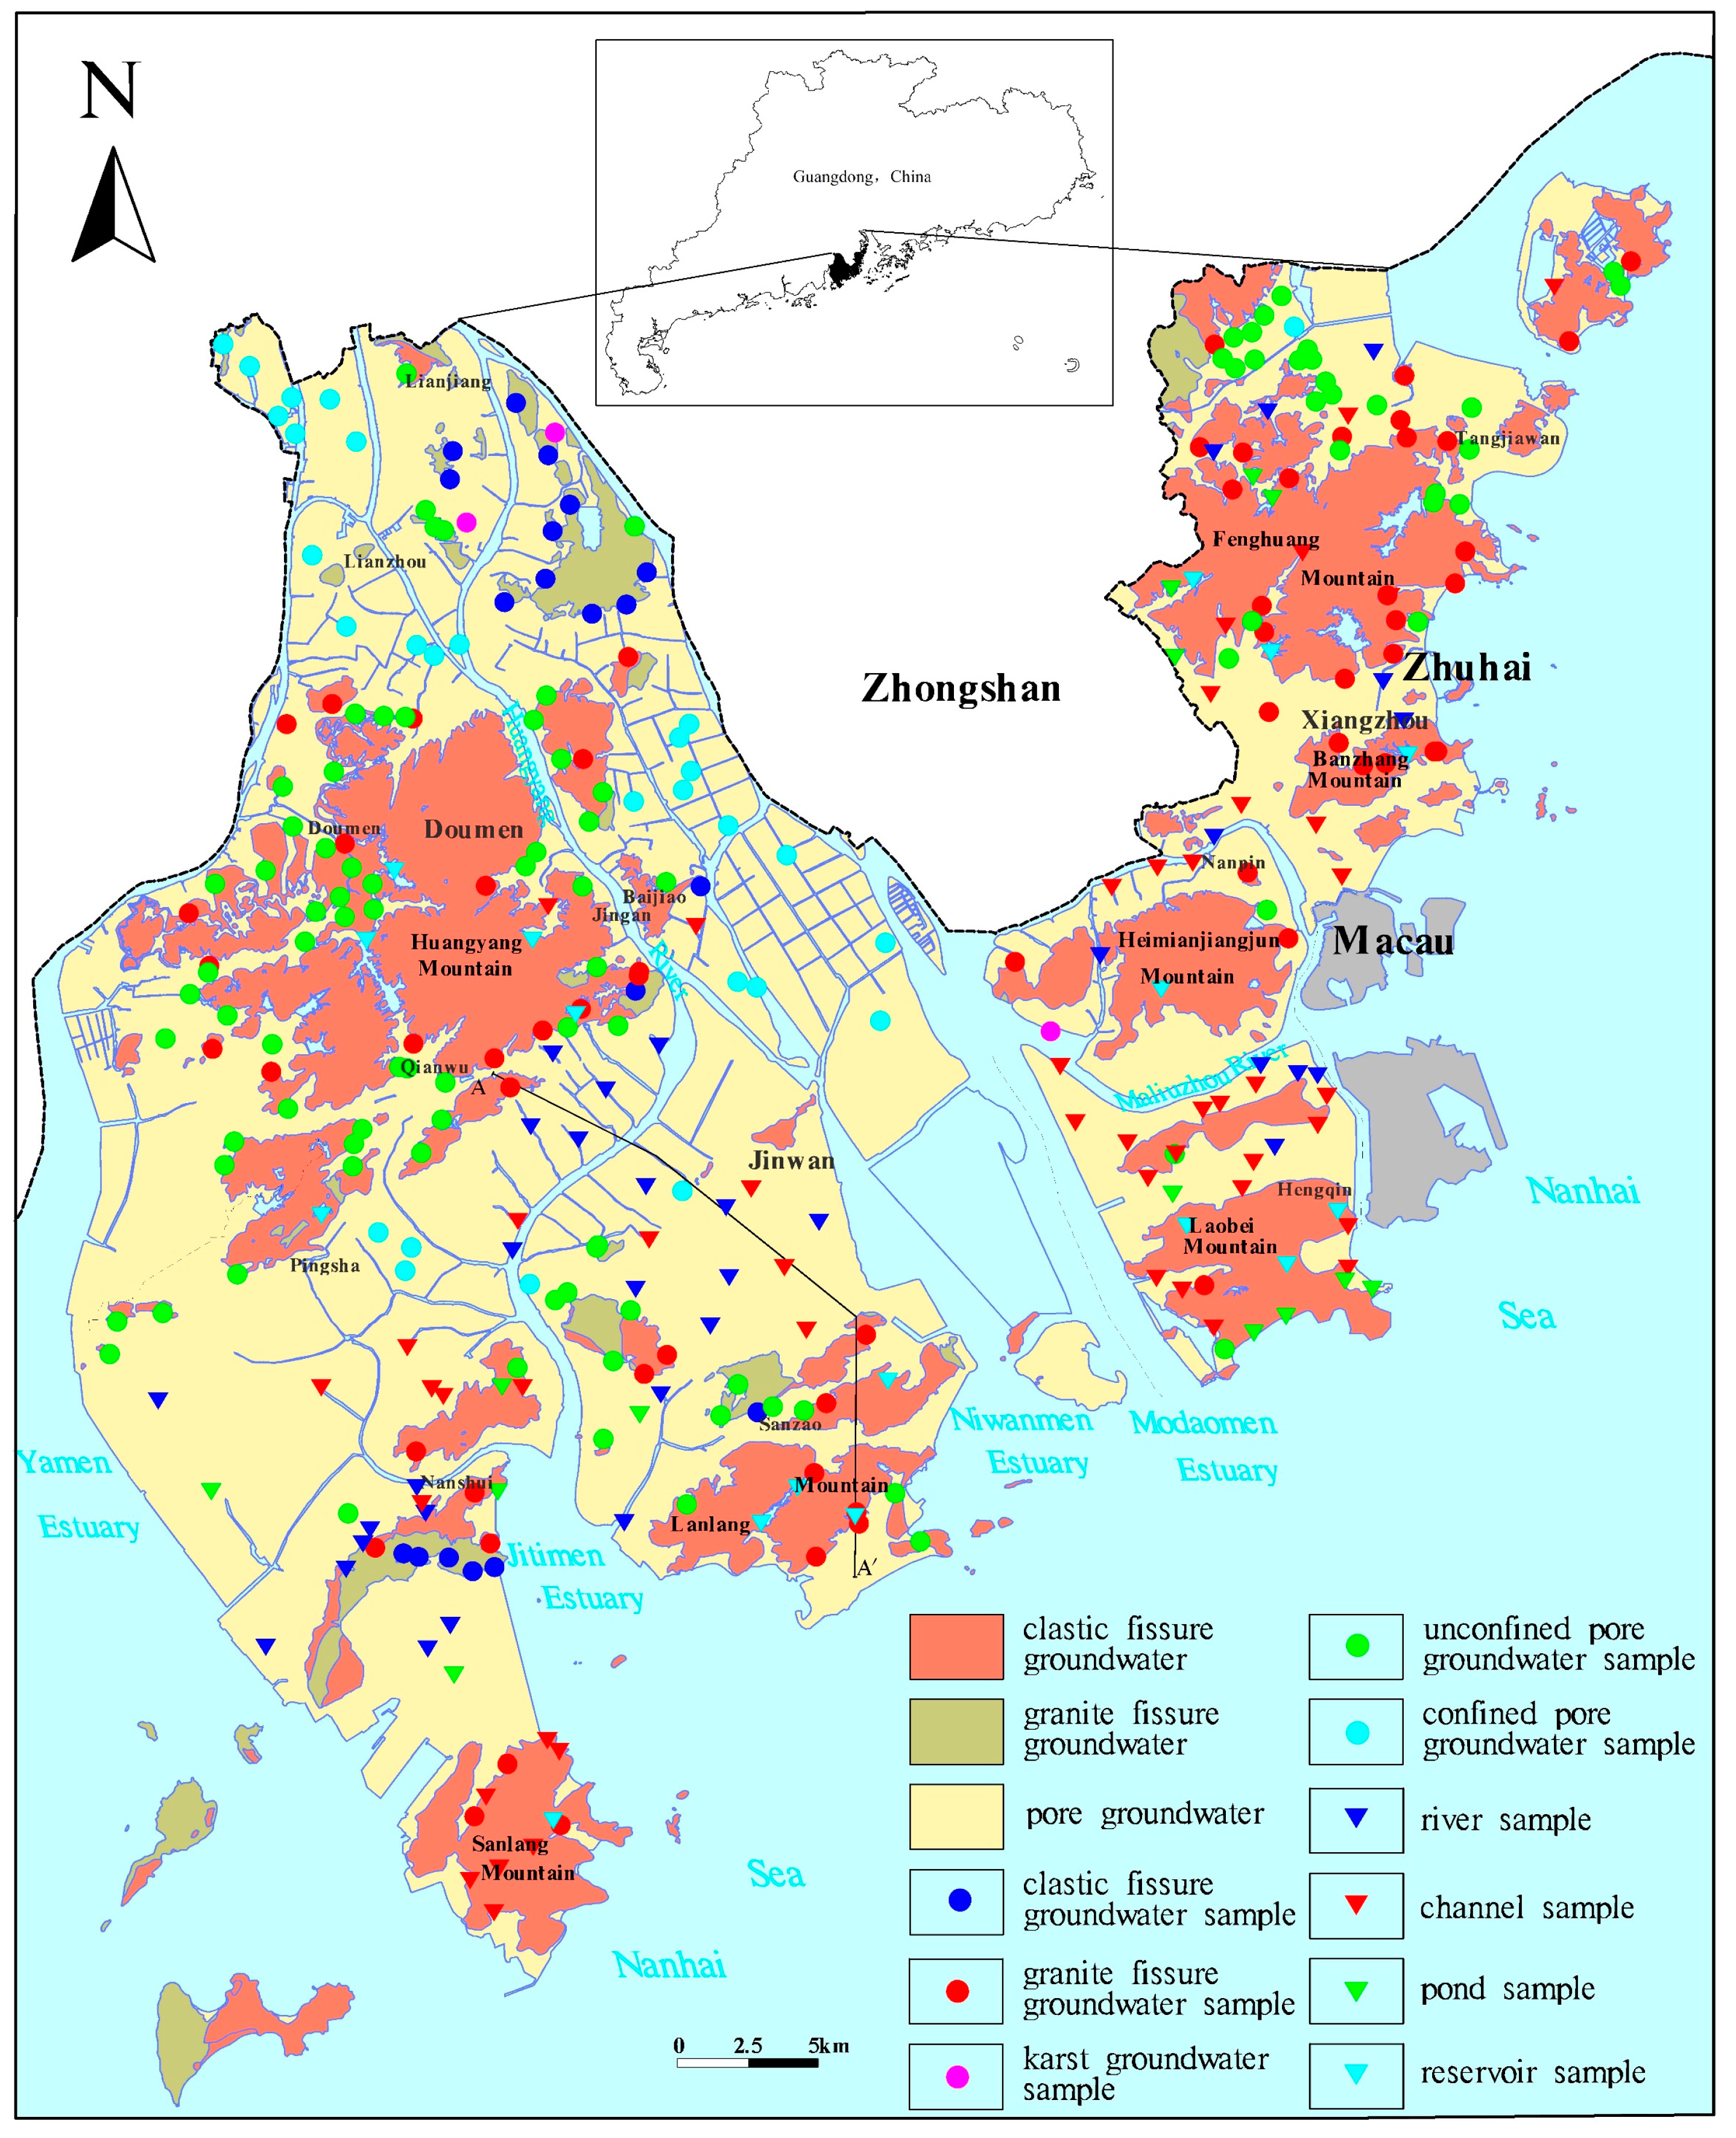
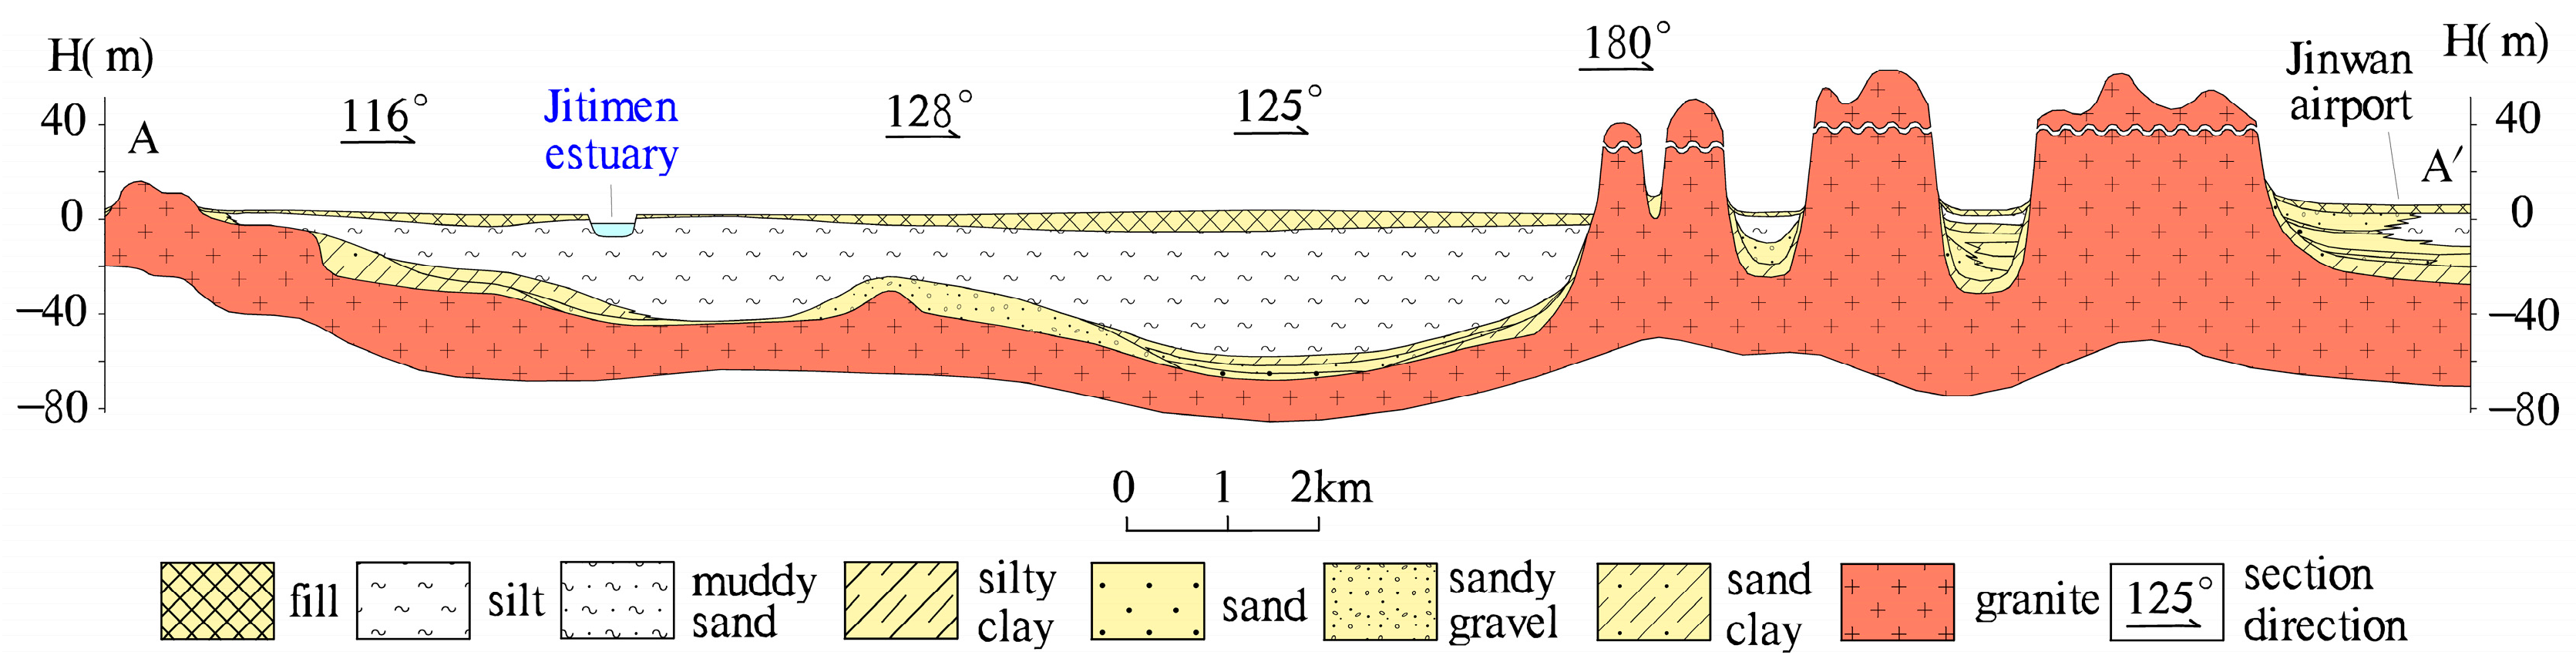
2.1. Study Area
2.2. Sampling and Testing
3. Results
3.1. Hydrochemical Characteristics
3.2. Water Chemical Types
4. Discussion
4.1. Spatial Patterns of the Main Chemical Components
4.2. Mechanism and Influencing Factors of Groundwater Hydrochemical Formation
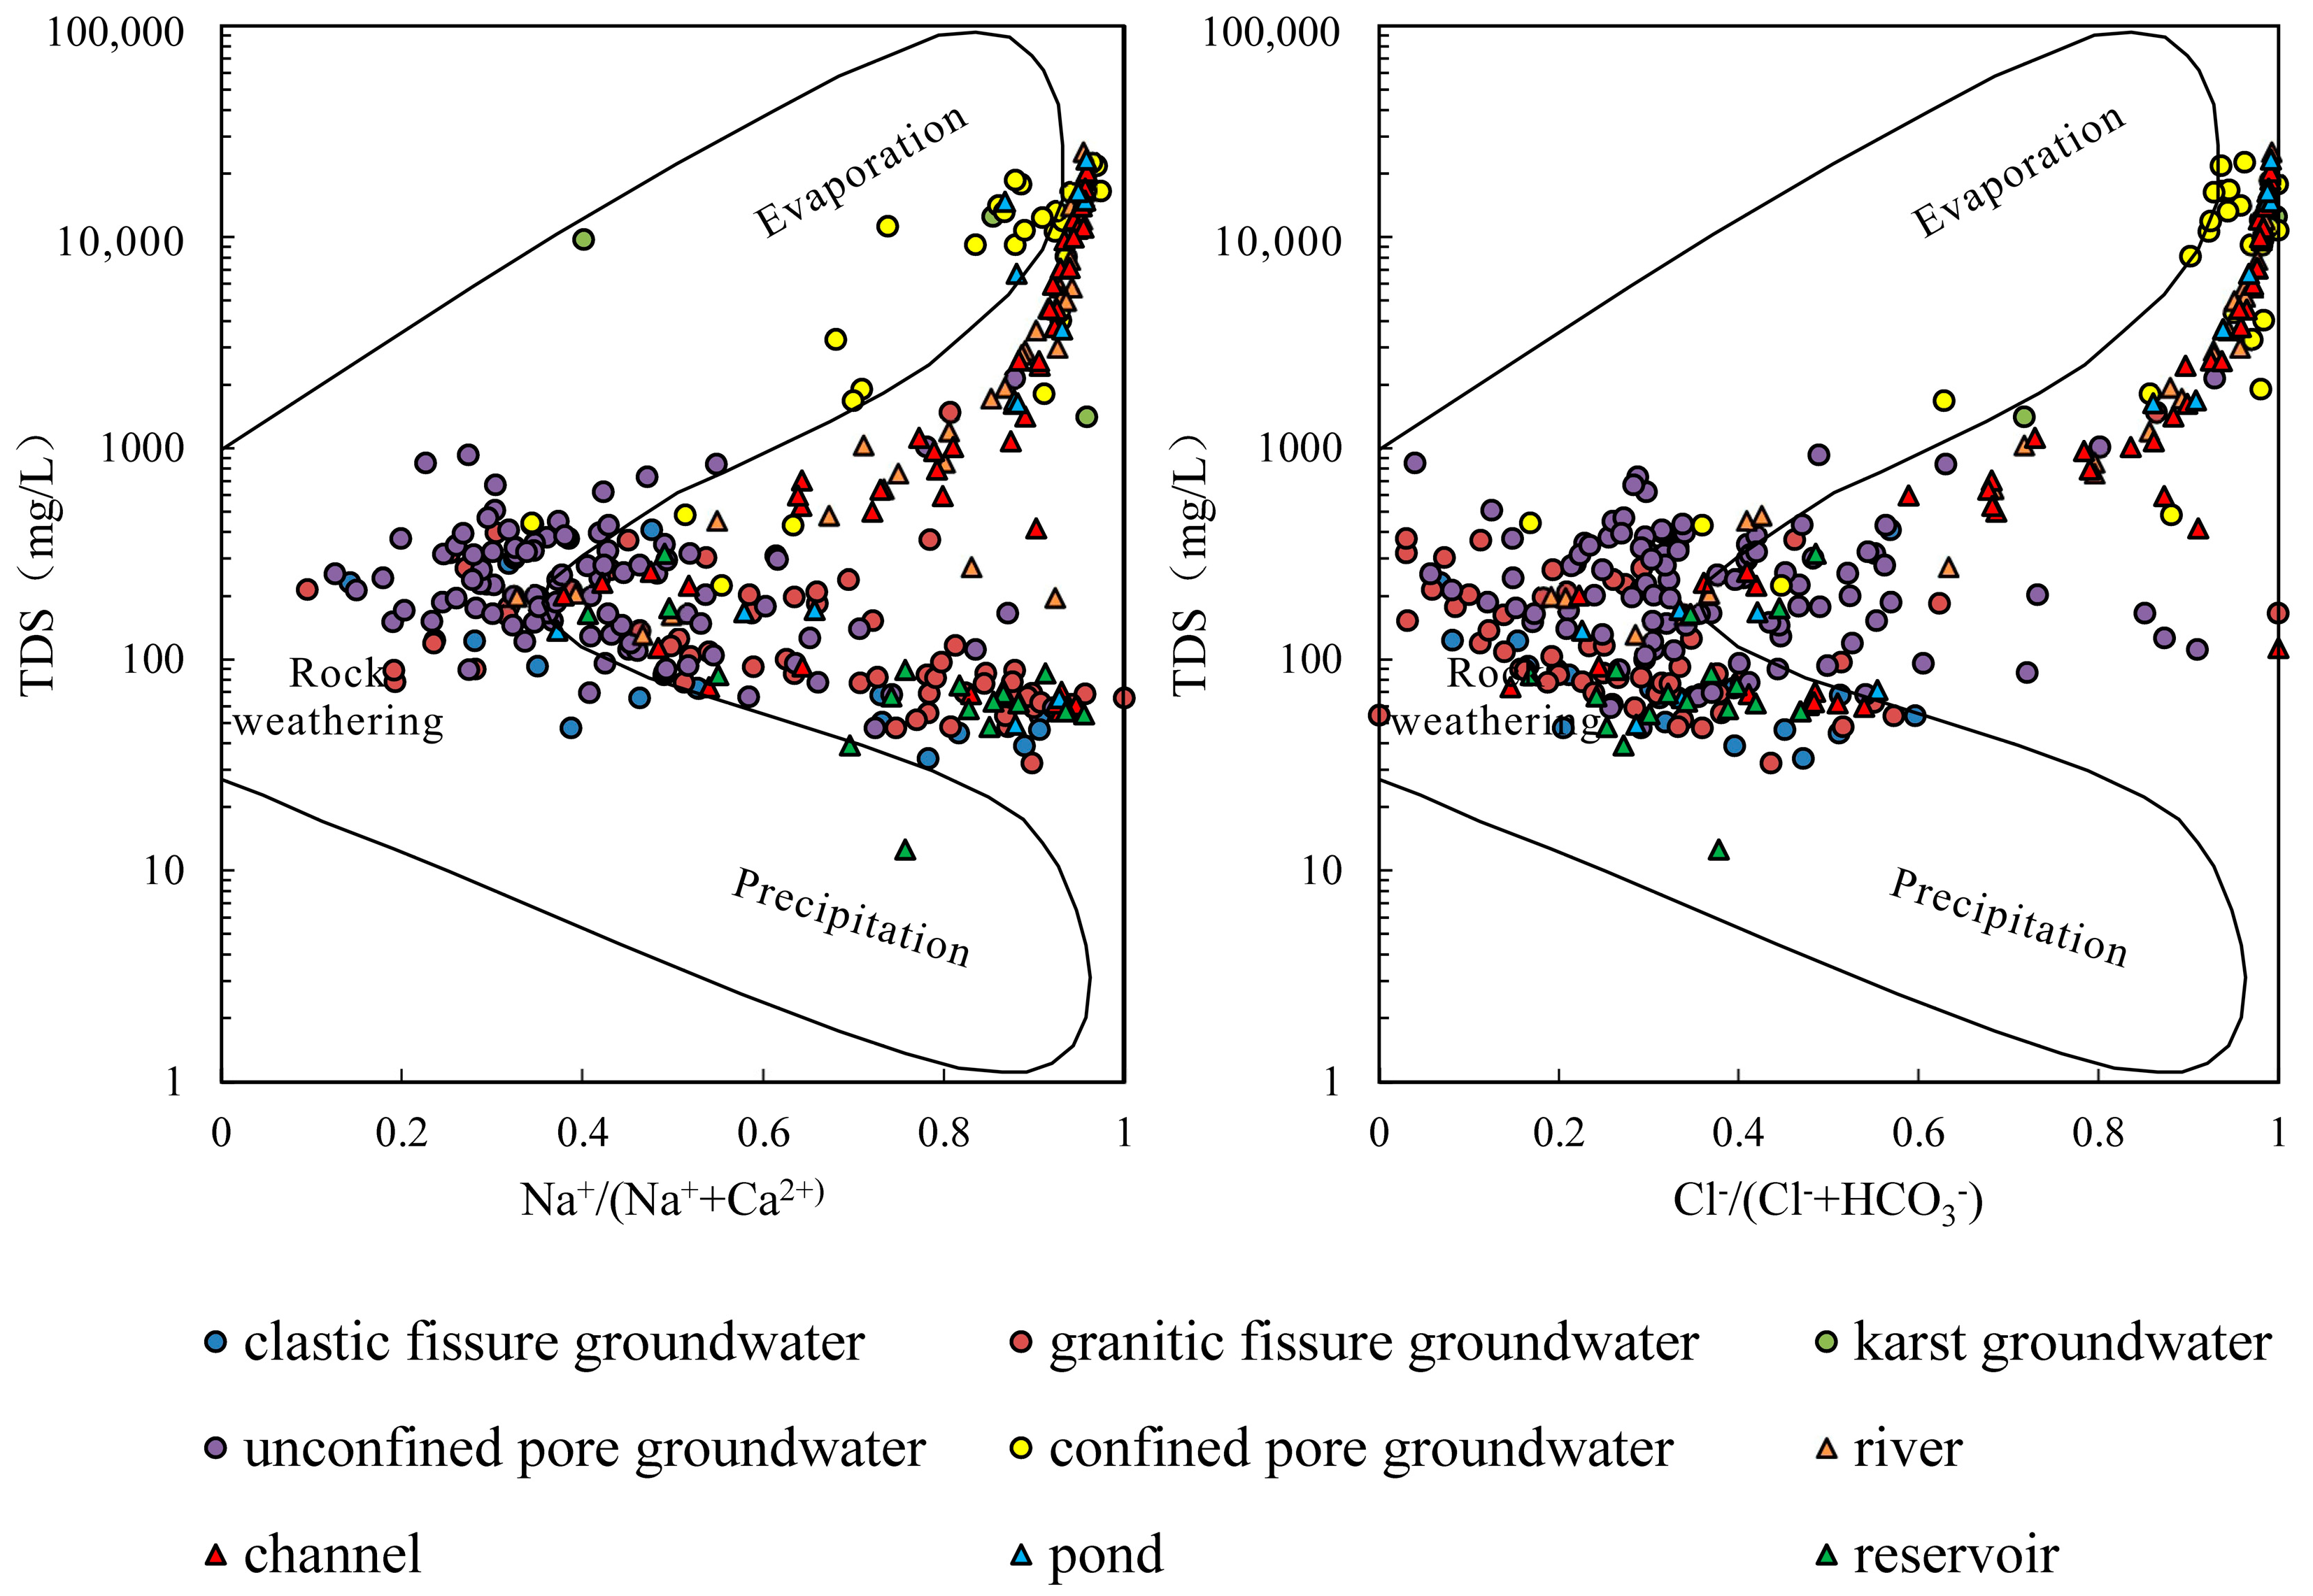
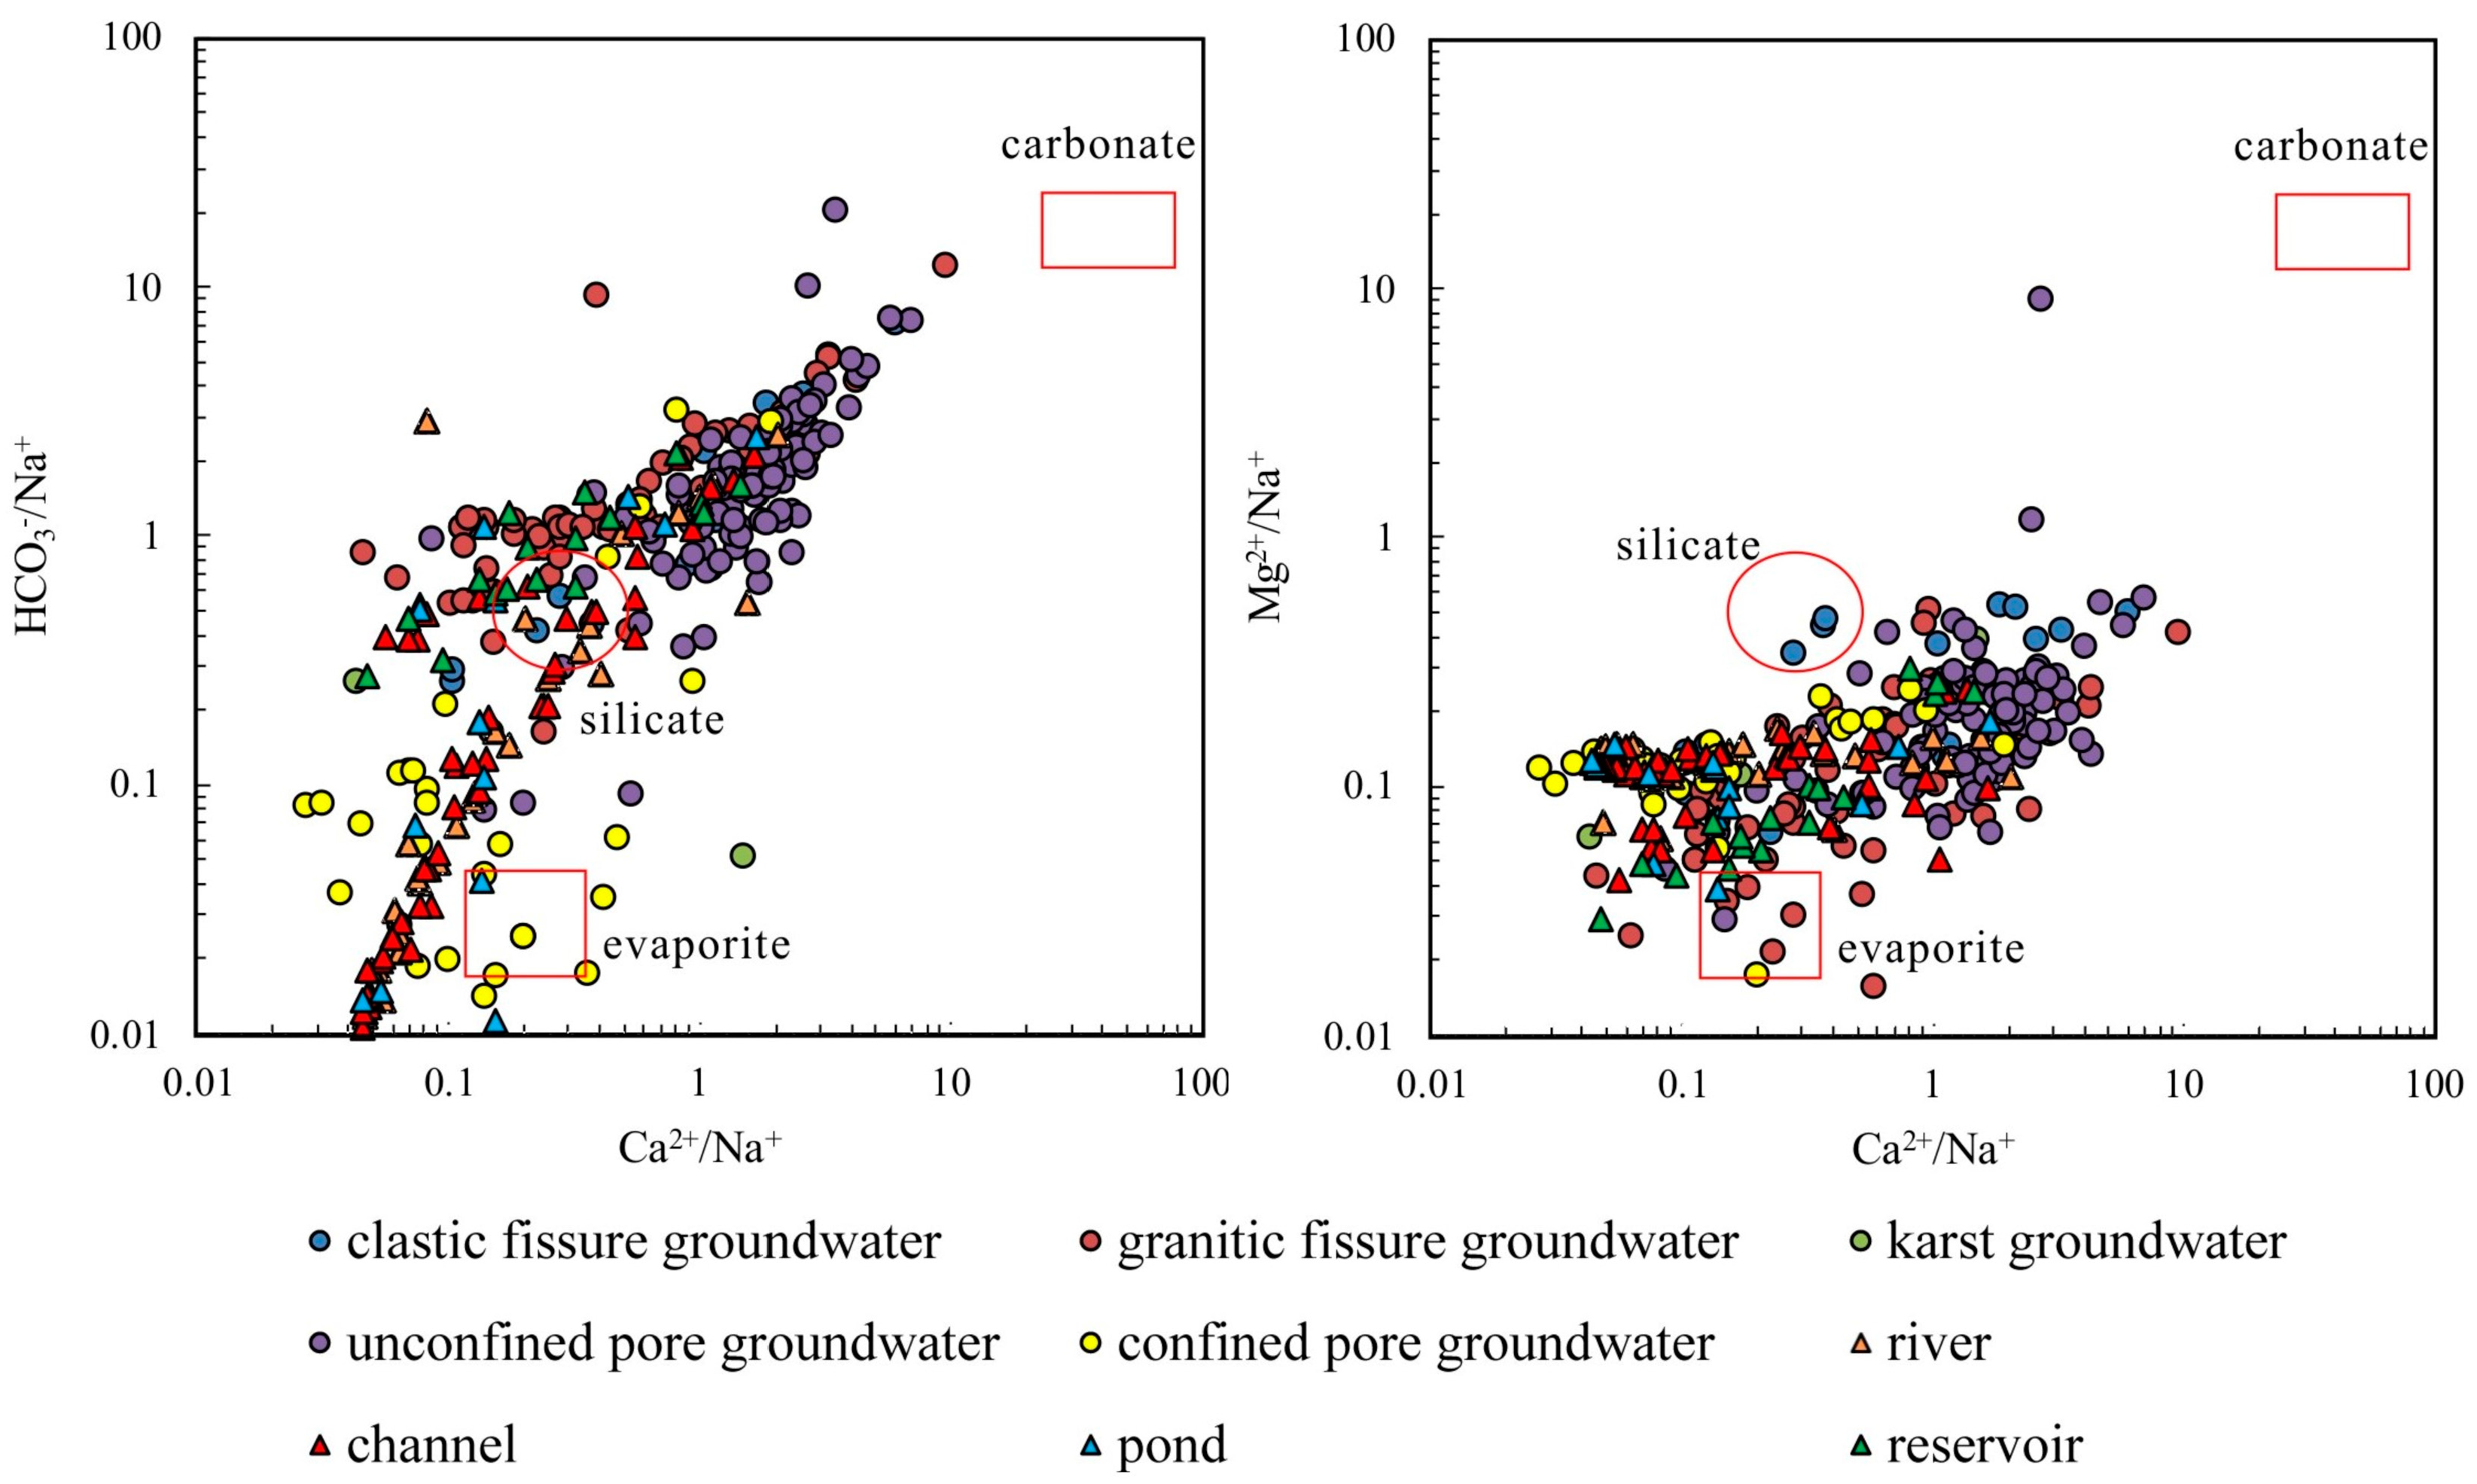
4.2.1. Rock Weathering
4.2.2. Ion Ratios
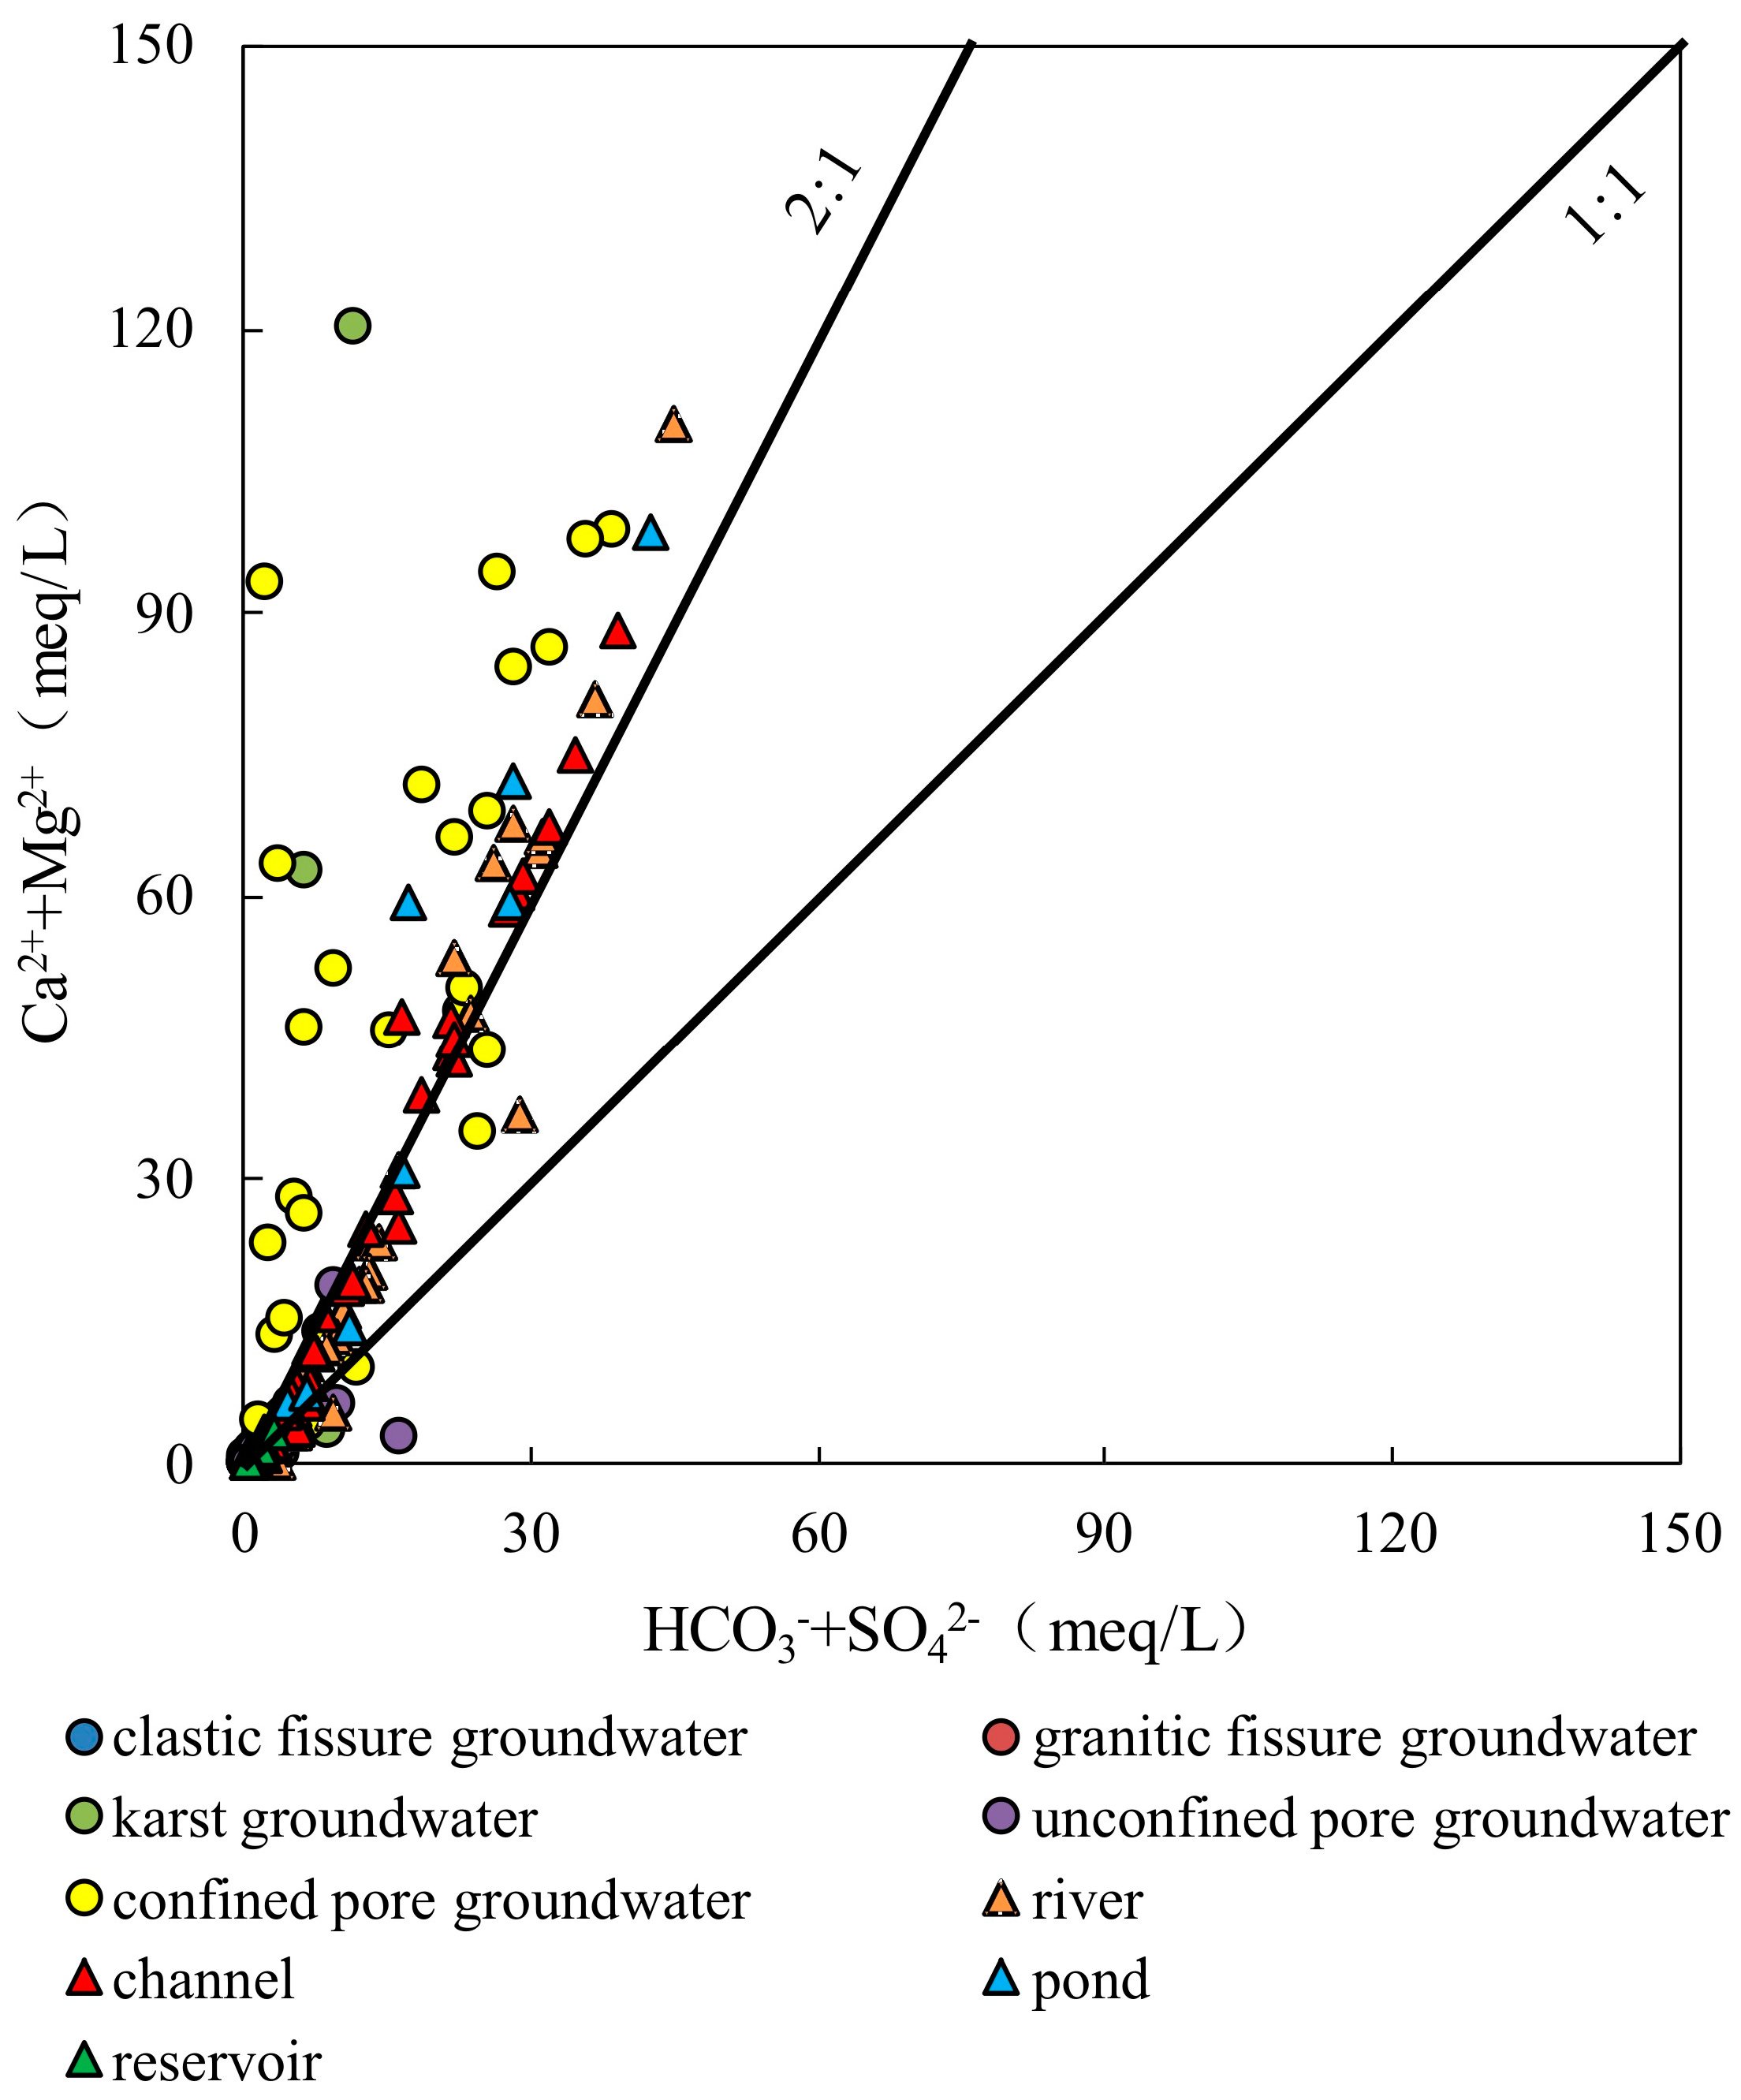
4.2.3. Cation Exchange
4.2.4. Impact of Human Activities
5. Conclusions
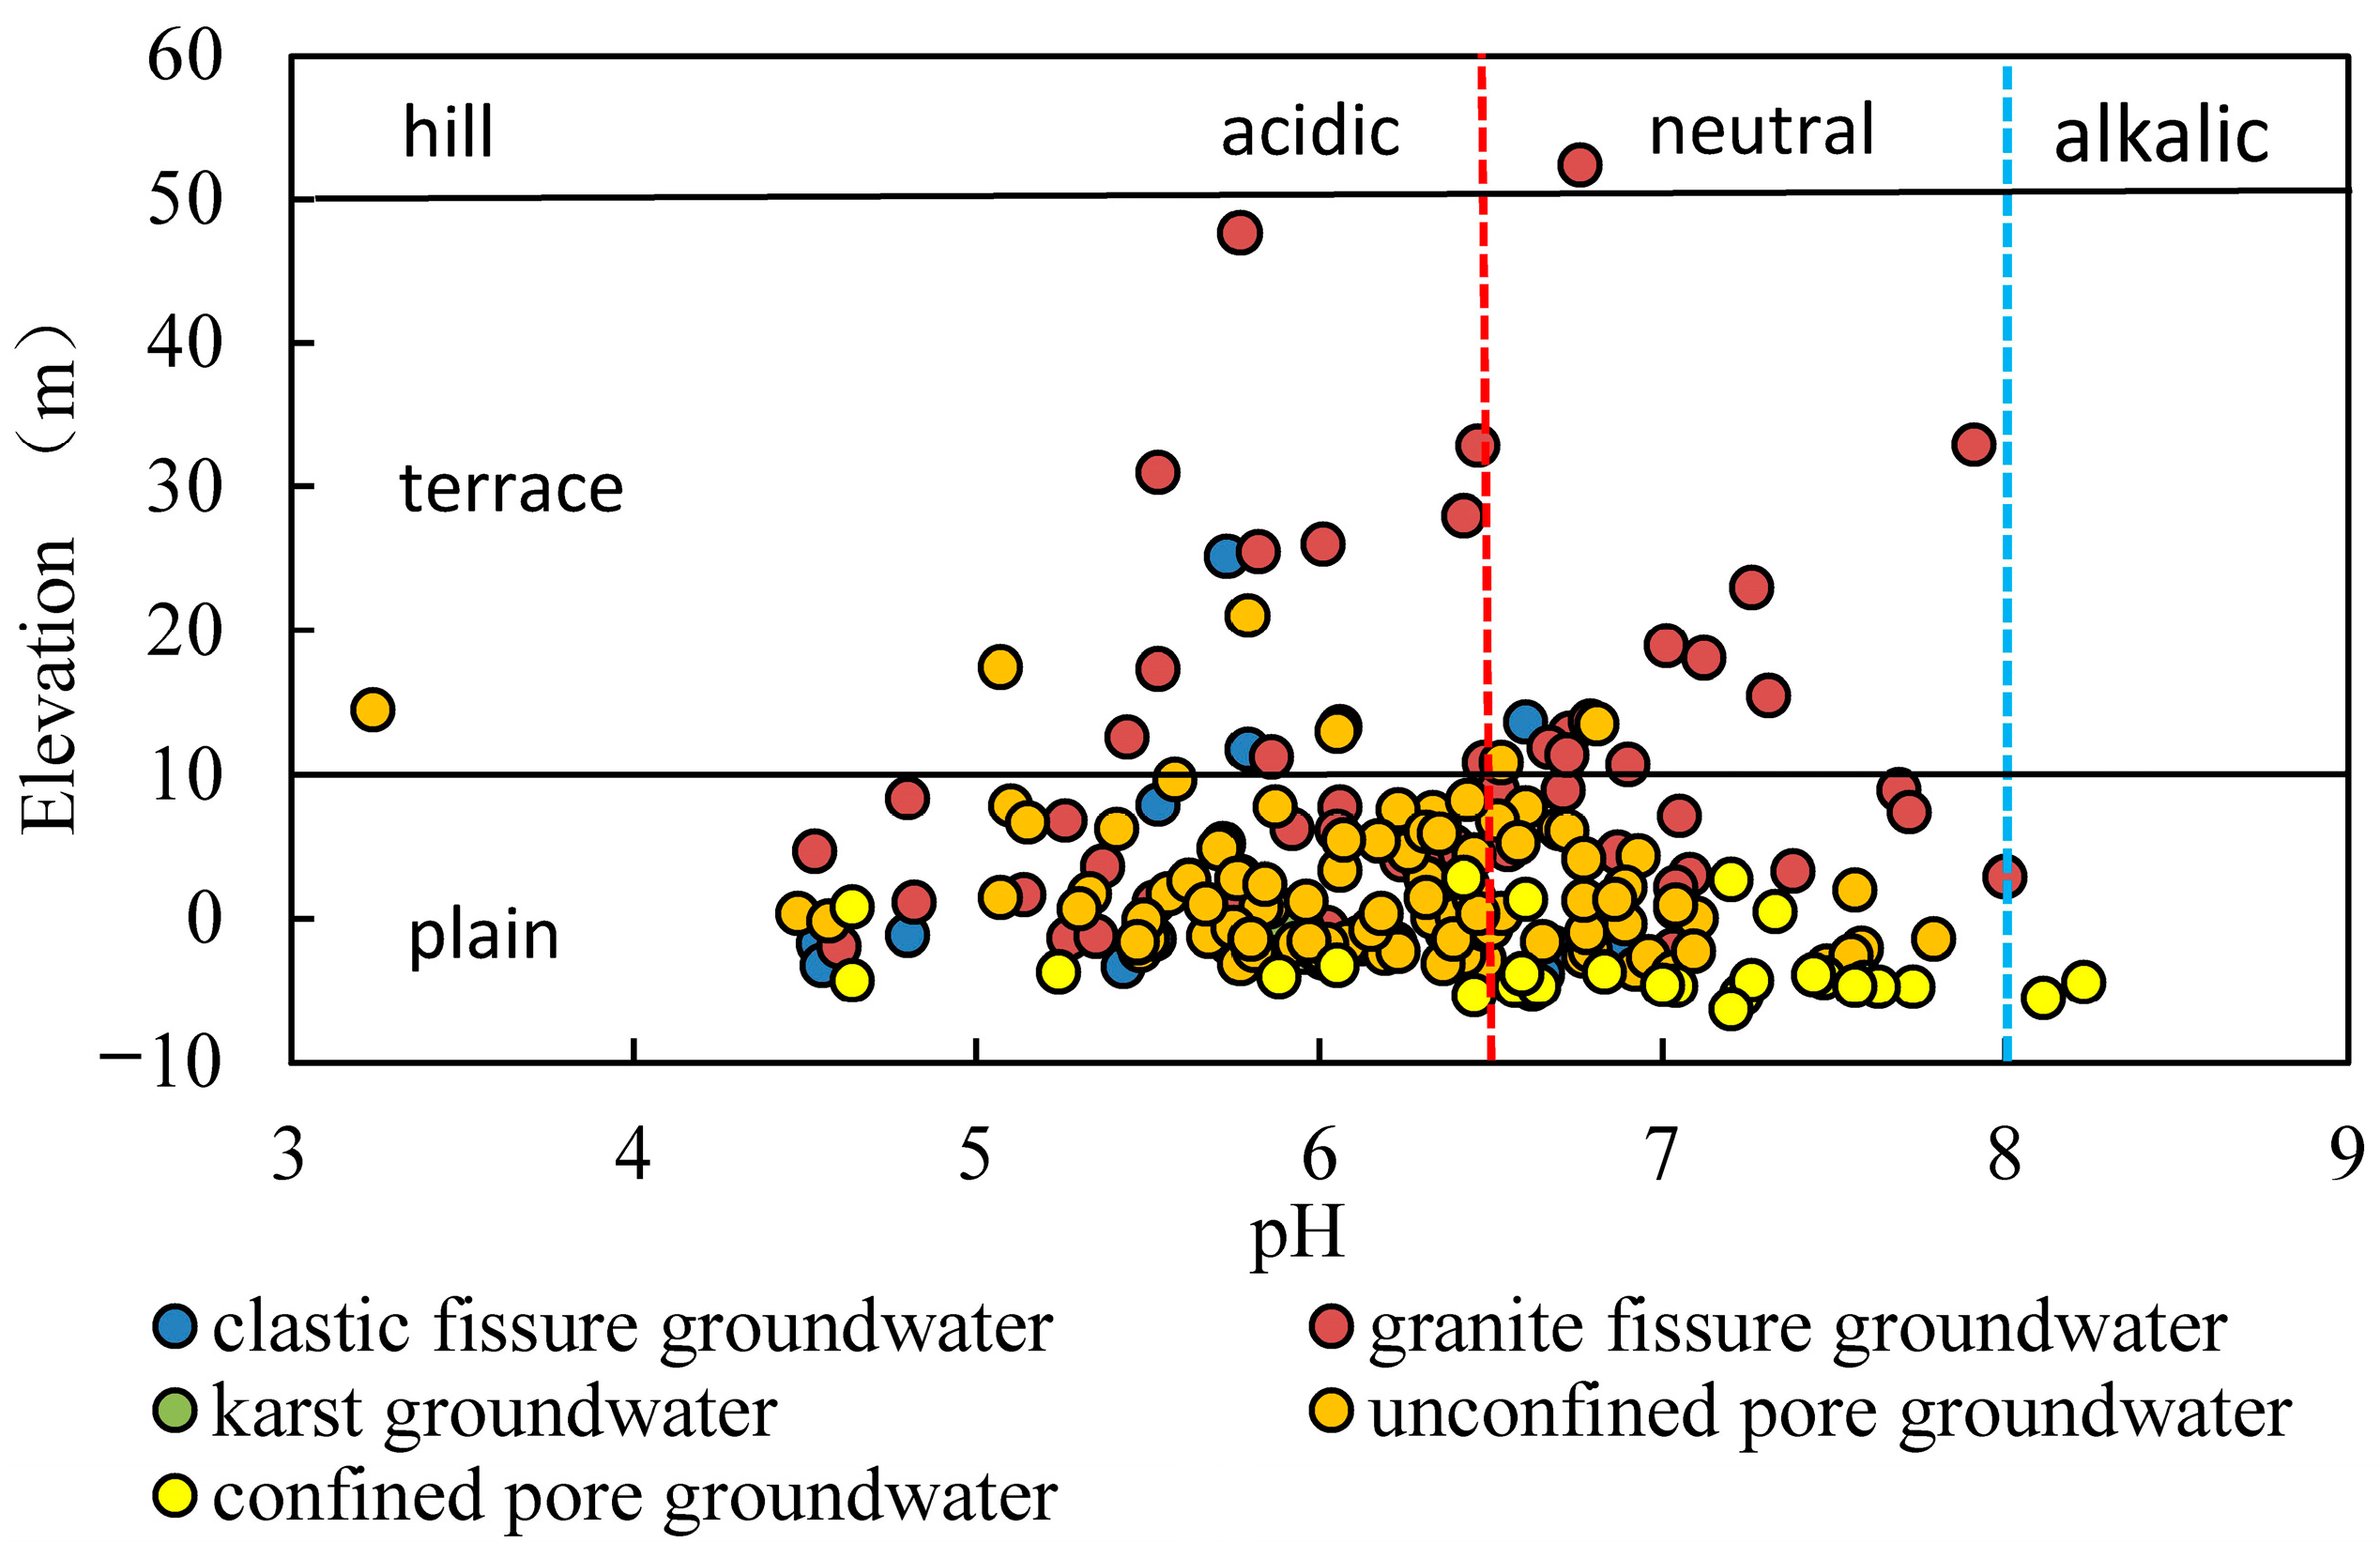
- (1)
- The pH of groundwater in the study area ranges from 3.24 to 8.23, with most of the groundwater being slightly acidic. The pH of surface water ranges from 5.35 to 9.86, with most of it being weakly alkaline. The acidity in the groundwater is linked to acidic atmospheric precipitation, an acidic unsaturated zone, the oxidation of sulphide minerals and tidal action.
- (2)
- The cations in groundwater are dominated by Na+ and Ca2+, with mean concentrations of 457.7 mg/L and 67.93 mg/L, respectively. The anions are dominated by Cl− and HCO3−, with mean concentrations of 909.9 mg/L and 154.84 mg/L, respectively. The groundwater chemical types are predominantly mixed, followed by Ca-Mg-HCO3 type. Surface water samples are predominantly of the Na-Cl-SO4 type.
- (3)
- The spatial patterns of major anions and cations in groundwater are closely related to landform and aquifer type. The main chemical components of confine pore groundwater and karst groundwater in coastal plain areas are significantly higher compared to those in hilly plateau areas.
- (4)
- The samples from rivers, canals, lakes, ponds, confined pore groundwater and karst groundwater are strongly influenced by the dissolution of rock salts, evaporation and concentration, and reverse cation exchange. Unconfined pore groundwater, clastic fissure groundwater, granite fissure groundwater and reservoir water are controlled by the dissolution of carbonate, sulphate and silicate, along with positive cation exchange.
- (5)
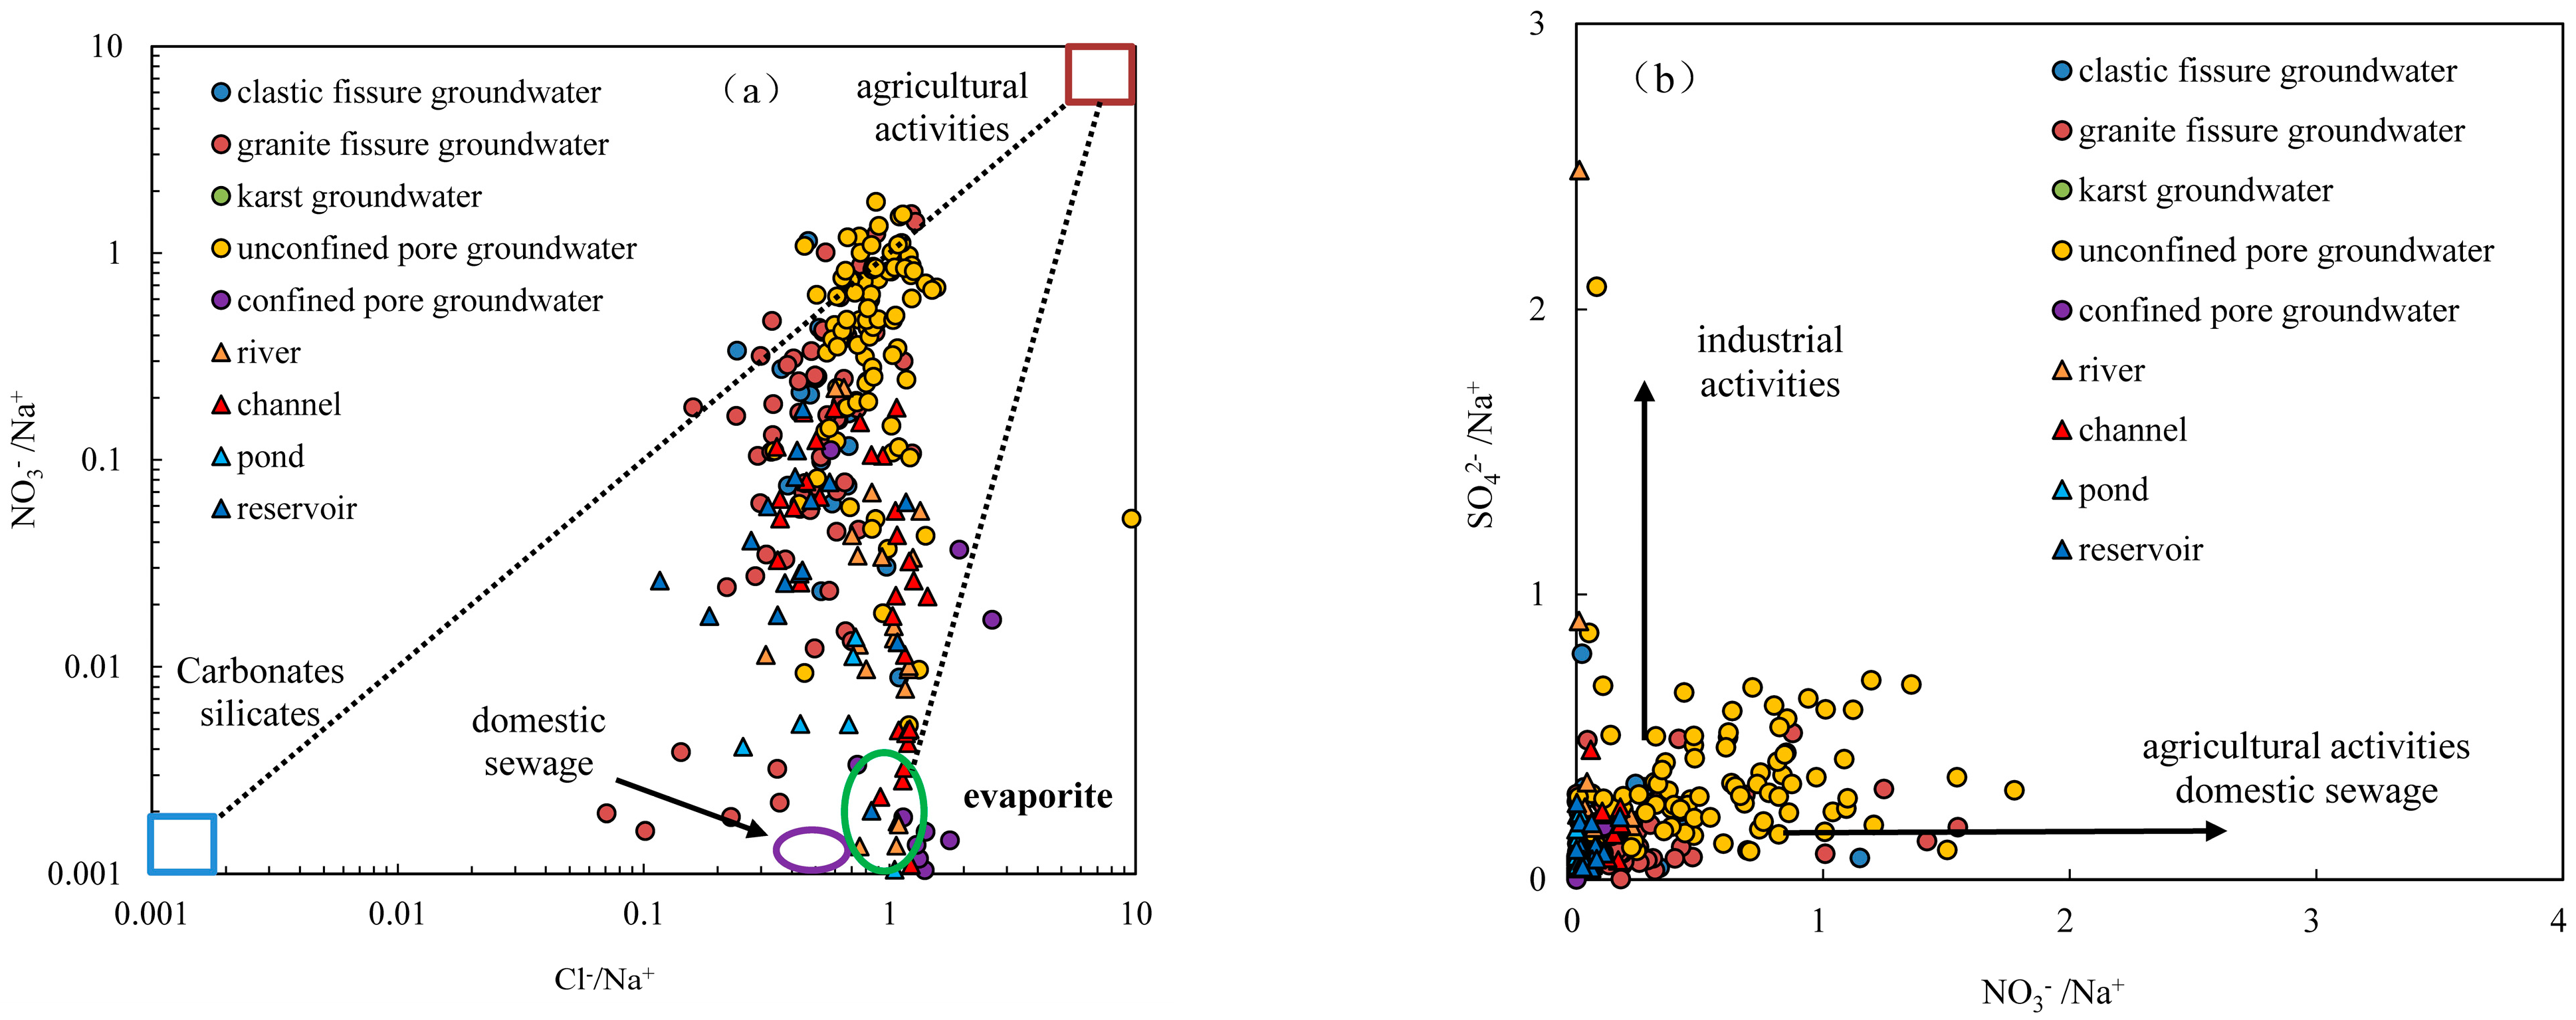
- The nitrate concentration in groundwater ranges from 0.02 to 162 mg/L with a mean of 17.46 mg/L. Nitrate in groundwater primarily originates from atmospheric precipitation and human activities. Nitrate in clastic pore fissure groundwater, granite fissure groundwater and pore unconfined groundwater primarily originates from atmospheric precipitation, agricultural activities on slope farmland and forest land. Nitrate in pore confined groundwater and karst water primarily originates from domestic sewage and mariculture wastewater.
Author Contributions
Funding
Data Availability Statement
Conflicts of Interest
References
- Subhankar, G.; Madan, K.J. Hydrogeochemical characterization of groundwater and critical assessment of its quality in a coastal basin. Environ. Dev. Sustain. 2023. [Google Scholar] [CrossRef]
- Adimalla, N.; Dhakate, R.; Kasarla, A.; Taloor, A.K. Appraisal of groundwater quality for drinking and irrigation purposes in central Telangana, India. Groundw. Sustain. Dev. 2020, 10, 100334. [Google Scholar] [CrossRef]
- Salehi, S.; Chizari, M.; Sadighi, H.; Bijani, M. Assessment of agricultural groundwater users in Iran: A cultural environmental bias. Hydrogeol. J. 2018, 26, 285–295. [Google Scholar] [CrossRef]
- Subrata, H.; Madan, K.J. Hydrogeologic and geochemical investigations in a coastal basin of West Bengal. Arab. J. Geosci. 2023, 16, 420. [Google Scholar] [CrossRef]
- Han, D.; Kohfahl, C.; Song, X.; Xiao, G.; Yang, J. Geochemical and isotopic evidence for palaeo-seawater intrusion into the south coast aquifer of Laizhou Bay, China. Appl. Geochem. 2011, 26, 863–883. [Google Scholar] [CrossRef]
- Angelaki, A.; Dionysidis, A.; Sihag, P.; Golia, E.E. Assessment of Contamination Management Caused by Copper and Zinc Cations Leaching and Their Impact on the Hydraulic Properties of a Sandy and a Loamy Clay Soil. Land 2022, 11, 290. [Google Scholar] [CrossRef]
- Pavlovskiy, I.; Selle, B. Integrating hydrogeochemical, hydrogeological, and environmental tracer data to understand groundwater flow for a karstified aquifer system. Groundwater 2015, 53, 156–165. [Google Scholar] [CrossRef] [PubMed]
- Li, P.; Tian, R.; Xue, C.; Wu, J. Progress, opportunities and key fields for groundwater quality research under the impacts of human activities in China with a special focus on western China. Environ. Sci. Pollut. Res. 2017, 24, 13224–13234. [Google Scholar] [CrossRef]
- Tian, X.; Fei, Y.H.; Zhang, Z.J.; Li, Y.S.; Dun, Y.; Guo, C.Y. Analysis on hydrochemical characteristics of groundwater in strongly exploited area in Hutuo River Plain. J. Groundw. Sci. Eng. 2017, 5, 130–139. [Google Scholar] [CrossRef]
- Zhang, T.; He, J.; Li, J.J.; Cao, Y.T.; Gong, L.; Liu, J.W.; Bian, C.; Cai, Y.M. Major ionic features and possible controls in the groundwater in the Hamatong River basin. Environ. Sci. 2018, 39, 4981–4990. [Google Scholar] [CrossRef]
- Gai, J.B.; Yan, B.Z.; Fan, C.B.; Tuo, Y.P.; Ma, M.M. Hydrochemical Evolution Process and Mechanism of Groundwater in the Hutuo River Alluvial Fan, North China. Water 2024, 16, 2229. [Google Scholar] [CrossRef]
- Jiang, W.J.; Wang, G.C.; Sheng, Y.Z.; Shi, Z.M.; Zhang, H. Isotopes in groundwater (2H, 18O, 14C) revealed the climate and groundwater recharge in the Northern China. Sci. Total Environ. 2019, 666, 298–307. [Google Scholar] [CrossRef]
- Wu, Y.; Luo, Z.H.; Luo, W.; Ma, T.; Wang, Y.X. Multiple isotope geochemistry and hydrochemical monitoring of karst water in a rapidly urbanized region. J. Contam. Hydrol. 2018, 218, 44–58. [Google Scholar] [CrossRef]
- Li, X.H.; Zhang, Y.L.; Wang, R.; Li, Z.H. Hydrochemical characteristics and formation mechanism of groundwater in Hohhot basin. South-North Water Transf. Water Sci. Technol. 2018, 16, 136–145. [Google Scholar]
- Ning, H.; Jiang, W.J.; Sheng, Y.Z.; Wang, K.L.; Chen, S.M.; Zhang, Z.; Liu, F.T. Comprehensive evaluation of nitrogen contamination in water ecosystems of the Miyun reservoir watershed, northern China: Distribution, source apportionment and risk assessment. Environ. Geochem. Health 2024, 46, 278. [Google Scholar] [CrossRef] [PubMed]
- Jiang, W.J.; Sheng, Y.Z.; Wang, G.C.; Shi, Z.M.; Liu, F.T.; Zhang, J.; Chen, D.L. Cl, Br, B, Li, and noble gases isotopes to study the origin and evolution of deep groundwater in sedimentary basins, a review. Environ. Chem. Lett. 2022, 20, 1497–1528. [Google Scholar] [CrossRef]
- Cheng, Y.; Wang, Y.; Zhou, Y.Z.; Gu, T. Status and sources of heavy metal/metalloid pollution in the groundwater system of Zhuhai City. Bull. Mineral. Petrol. Geochem. 2019, 38, 595–603. [Google Scholar] [CrossRef]
- Zhao, X.F.; Chen, F.J.; Chen, J.Y.; Tang, C.Y.; Luo, Y.L.; Jia, G.D. Using nitrogen isotope to identify the sources of nitrate contamination in urban groundwater—A case study in Zhuhai City. Hydrogeol. Eng. Geol. 2008, 3, 87–92. [Google Scholar] [CrossRef]
- Yao, P. Distribution and origin of manganese in groundwater in the eest Zhuhai coastal zone. Groundwater 2015, 37, 1–3. [Google Scholar]
- Wang, S.; Yan, X.X.; Jie, J.; Yang, T.L.; Wu, J.Z.; Wang, H.S. Analysis on factors affecting ground settlement in plain area of Pearl River Delta. Chin. J. Geol. Hazard Control 2019, 30, 98–104. [Google Scholar] [CrossRef]
- Xie, X.M.; Wang, S.; Li, M.; Zhou, Z.Z.; Wu, L.X. Present situation and cause analysis of land subsidence in Pearl River Delta. West-China Explor. Eng. 2021, 33, 8–10. [Google Scholar]
- Wei, F.Y. Groundwater quality evaluation of emergency water supply in Zhuhai City. Groundwater 2014, 36, 126–128. [Google Scholar]
- Chen, Y.M.; Gao, Z.P.; Chen, Z.L.; Li, W.; Wang, Q.; Ma, X.M.; Guo, H.M. Distribution characteristics and genesis of strontium-bearing mineral water in Tailai Basin. Geol. China 2019, 46, 1–11. [Google Scholar] [CrossRef]
- Chen, W.; Wu, Y.; Zhang, H.X.; Liu, H.Q. Hydrochemical Characteristics and Formation Mechanism of Groundwater in the Western Region of Hepu Basin, Beihai City. Environ. Sci. 2024, 45, 194–206. [Google Scholar] [CrossRef]
- Bello, M.; Ketchemen-Tandia, B.; Nlend, B.; Huneau, F.; Fouepe, A.; Fantong, W.Y.; Boum-Nkot, S.N.; Garel, E.; Celle-Jeanton, H. Shallow groundwater quality evolution after 20 years of exploitation in the southern Lake Chad: Hydrochemistry and stable isotopes survey in the far north of Cameroon. Environ. Earth Sci. 2019, 78, 474. [Google Scholar] [CrossRef]
- He, J.; Xiao, P.; Xu, K.; Peng, K. Hydrogeochemical process of groundwater in western margin of Jianghan plain. Yangtze River 2018, 49, 6–10. [Google Scholar] [CrossRef]
- He, J.; Li, Y.Y.; Zeng, M.; Wu, P.; Chen, C.; Zhao, X.W. Characteristics of Distribution and Genetic Mechanism of Acidic Groundwater in Zhuhai City. South China Geol. 2024, 40, 404–412. [Google Scholar]
- Zhou, X.; Zhang, H.; Zhao, L.; Shen, Y.; Yan, X.; Ou, Y.C.; Huang, X.X. A preliminary analysis of the formation of the weak acidic groundwater in Beihai, Guangxi. Acta Geol. Sin. 2007, 81, 850–856. [Google Scholar]
- Zhang, H.X.; Yu, S.W.; Zhang, Y.P.; Chen, W.; Li, Q.H.; Liu, H.Q.; Zhang, Q.Y. Spatial-temporal distribution, genesis and environmental impact of the shallow groundwater pH values in the Fangchenggang, Guangxi. Geol. China 2022, 49, 822–833. [Google Scholar] [CrossRef]
- Naik, M.R.; Mahanty, B.; Sahoo, S.K.; Jha, V.N.; Sahoo, N.K. Assessment of groundwater geochemistry using multivariate water quality index and potential health risk in industrial belt of central Odisha, India. Environ. Pollut. 2022, 303, 119161. [Google Scholar] [CrossRef]
- Podgorski, J.; Araya, D.; Berg, M. Geogenic manganese and iron in groundwater of Southeast Asia and Bangladesh-machine learning spatial prediction modeling and comparison with arsenic. Sci. Total Environ. 2022, 833, 155131. [Google Scholar] [CrossRef] [PubMed]
- Gao, Z.P.; Weng, H.C.; Guo, H.M. Unraveling influences of nitrogen cycling on arsenic enrichment in groundwater from the Hetao Basin using geochemical and multi-isotopic approaches. J. Hydrol. 2021, 595, 125981. [Google Scholar] [CrossRef]
- Yu, H.T.; Ma, T.; Deng, Y.M.; Du, Y.; Shen, S.; Lu, Z.J. Hydrochemical characteristics of shallow groundwater in eastern Jianghan Plain. Earth Sci. 2017, 42, 685–692. [Google Scholar] [CrossRef]
- Shen, B.B.; Wu, J.L.; Jilili, A.; Saparov, A.S.; Isanova, G. Hydrochemical and Isotopic Characteristics of the Lake Balkhash Catchment, Kazakhstan. Environ. Sci. 2020, 41, 173–182. [Google Scholar] [CrossRef]
- Xu, J.; He, J.T.; Peng, C.; Zeng, Y. Characteristics and genesis of NO3 type water in shallow groundwater in Liujiang Basin. Environ. Sci. 2018, 39, 4142–4149. [Google Scholar] [CrossRef]
- Zhang, Y.; Guo, C.Q.; Zhu, Y.G.; Yu, S. Chemical characteristics of groundwater and material sources analysis in Buckwheat Field, Yunnan Province. Environ. Sci. 2019, 40, 2686–2695. [Google Scholar] [CrossRef]
- Wei, X.; Zhou, J.L.; Nai, W.H.; Zeng, Y.Y.; Bin, F. Hydrochemical characteristics and evolution of groundwater in the Kashgar delta area in Xinjiang. Environ. Sci. 2019, 40, 4042–4051. [Google Scholar] [CrossRef]
- Gibbs, R.J. Mechanisms controlling world water chemistry. Science 1970, 170, 1088–1090. [Google Scholar] [CrossRef]
- Su, C.T.; Yang, Y.; Nie, F.Y.; Zou, S.Z.; Zhao, G.S.; Luo, F.; Huang, Q.B.; Ba, J.J.; Li, X.P.; Liang, J.P. Hydrochemical characteristics and formation mechanism of strontium-rich groundwater in Xintian County, Hunan Province. Geoscience 2018, 32, 554–564. [Google Scholar] [CrossRef]
- Liu, J.T.; Cai, W.T.; Cao, Y.T.; Cai, Y.M.; Bian, C.; Yong-Gao, L.; Chen, Y.M. Hydrochemical characteristics of groundwater and the origin in alluvial-proluvial fan of Qinhe River. Environ. Sci. 2018, 39, 5428–5439. [Google Scholar] [CrossRef]
- Liu, S.T.; Zhang, D.; Li, Y.H.; Yang, J.M.; Jia, B.J. Water sources and factors controlling hydro-chemical compositions in the Yiluo River basin. Environ. Sci. 2020, 41, 1184–1196. [Google Scholar] [CrossRef]
- Gaillardet, J.; Dupré, B.; Louvat, P.; Allègre, C.J. Global silicate weathering and CO2 consumption rates deduced from the chemistry of large rivers. Chem. Geol. 1999, 159, 3–30. [Google Scholar] [CrossRef]
- Lin, C.Y.; Sun, Z.X.; Gao, B.; Hua, E.X.; Zhang, H.Y.; Yang, F.; Gao, Y.; Jiang, W.B.; Jiang, X.Y. Hydrochemical characteristics and formation mechanism of groundwater in Lhasa area, China. Earth Sci. Front. 2021, 28, 49–58. [Google Scholar] [CrossRef]
- Liu, J.; Hao, Y.; Gao, Z.; Wang, M.; Liu, M.; Wang, Z.; Wang, S. Determining the factors controlling the chemical composition of groundwater using multivariate statistics and geochemical methods in the Xiqu coal mine, North China. Environ. Earth Sci. 2019, 78, 1–11. [Google Scholar] [CrossRef]
- Zhang, J.W.; Liang, X.; Jin, M.; Ma, T.; Deng, Y.M.; Ma, B. Identifying the groundwater flow systems in a condensed river-network interfluve between the Han River and Yangtze River (China) using hydrogeochemical indicators. Hydrogeol. J. 2019, 27, 2415–2430. [Google Scholar] [CrossRef]
- Vaiphei, S.P.; Kurakalva, R.M. Hydrochemical characteristics and nitrate health risk assessment of groundwater through seasonal variations from an intensive agricultural region of upper Krishna River basin, Telangana, India. Ecotoxicol. Environ. Saf. 2021, 213, 112073. [Google Scholar] [CrossRef] [PubMed]
- Liu, J.; Peng, Y.; Li, C.; Gao, Z.; Chen, S. Characterization of the hydrochemistry of water resources of the Weibei Plain, Northern China, as well as an assessment of the risk of high groundwater nitrate levels to human health. Environ. Pollut. 2021, 268, 115947. [Google Scholar] [CrossRef]
- Panno, S.V.; Hackley, K.C.; Hwang, H.H.; Greenberg, S.E.; Krapac, I.G.; Landsberger, S.; O′Kelly, D.J. Characterization and Identification of Na-Cl Sources in Ground Water. Groundwater 2006, 44, 176–187. [Google Scholar] [CrossRef]
- Lv, X.L.; Liu, J.T.; Han, Z.T.; Zhu, L.; Zhang, Y.X. Geochemical characteristics and driving factors of NO3-type groundwater in the rapidly urbanizing Pearl River Delta. Environ. Sci. 2021, 42, 4761–4771. [Google Scholar] [CrossRef]


| Groundwater Type | pH | EC | K+ | Na+ | Ca2+ | Mg2+ | Cl− | SO42− | HCO3− | TDS | |
|---|---|---|---|---|---|---|---|---|---|---|---|
| μs/cm | mg/L | mg/L | mg/L | mg/L | mg/L | mg/L | mg/L | mg/L | |||
| Clastic fissure groundwater | max | 6.86 | 726.7 | 14.60 | 61.80 | 66.70 | 13.00 | 92.90 | 83.30 | 219.0 | 190.0 |
| min | 4.54 | 31.1 | 0.65 | 3.92 | 0.46 | 0.58 | 2.36 | 1.76 | 6.30 | 3.78 | |
| avg | 5.86 | 178.2 | 4.62 | 12.94 | 16.33 | 3.32 | 14.77 | 13.84 | 61.30 | 54.46 | |
| std | 0.70 | 203.5 | 3.93 | 14.19 | 21.24 | 3.07 | 23.45 | 19.93 | 67.85 | 63.23 | |
| cv | 0.12 | 1.14 | 0.85 | 1.10 | 1.30 | 0.92 | 1.59 | 1.44 | 1.11 | 1.16 | |
| Granite fissure groundwater | max | 8.00 | 3135 | 55.60 | 463.0 | 96.20 | 8.14 | 745.0 | 60.30 | 291.0 | 1480 |
| min | 4.53 | 29.7 | <0.07 | 3.80 | <0.02 | 0.21 | <0.06 | <0.1 | <0.5 | 32.20 | |
| avg | 6.29 | 231.9 | 5.98 | 23.20 | 14.68 | 1.93 | 24.26 | 11.31 | 75.15 | 158.9 | |
| std | 0.79 | 409.0 | 7.38 | 58.23 | 19.87 | 1.66 | 93.50 | 13.93 | 74.06 | 194.0 | |
| cv | 0.13 | 1.76 | 1.24 | 2.51 | 1.35 | 0.86 | 3.85 | 1.23 | 0.99 | 1.22 | |
| Karst groundwater | max | 7.04 | 22,550 | 97.20 | 3670 | 1580 | 495.0 | 7240 | 420.0 | 339.0 | 12,500 |
| min | 5.88 | 2632 | 22.80 | 494 | 18.50 | 32.20 | 500.0 | 150.0 | 25.30 | 1400 | |
| avg | 6.29 | 14,067 | 57.53 | 1795 | 714.2 | 318.4 | 4500 | 283.7 | 177.43 | 7860 | |
| std | 0.65 | 10,282 | 37.44 | 1664 | 794.5 | 250.1 | 3542 | 135.0 | 157.06 | 5769 | |
| cv | 0.10 | 0.73 | 0.65 | 0.93 | 1.11 | 0.79 | 0.79 | 0.48 | 0.89 | 0.73 | |
| Unconfined pore groundwater | max | 7.79 | 3928 | 66.40 | 658.0 | 119.0 | 198.0 | 1070 | 172.0 | 973.0 | 2140 |
| min | 3.24 | 39.8 | 1.38 | 3.98 | 0.45 | 0.29 | 3.16 | 1.89 | 4.76 | 47.30 | |
| avg | 6.18 | 486.7 | 13.97 | 33.48 | 35.37 | 7.42 | 52.13 | 30.15 | 125.05 | 289.0 | |
| std | 0.71 | 501.0 | 11.63 | 70.95 | 23.99 | 20.48 | 121.26 | 23.58 | 132.66 | 267.2 | |
| cv | 0.11 | 1.03 | 0.83 | 2.12 | 0.68 | 2.76 | 2.33 | 0.78 | 1.06 | 0.92 | |
| Confined pore groundwater | max | 8.23 | 40,450 | 294.0 | 7920 | 814.0 | 1020 | 13,800 | 1380 | 1580 | 22,500 |
| min | 4.64 | 454.5 | 8.16 | 15.30 | 10.70 | 3.91 | 41.20 | 3.92 | <0.5 | 224.0 | |
| avg | 6.86 | 18,475 | 117.06 | 2974 | 259.5 | 381.9 | 5918 | 310.8 | 486.6 | 9801 | |
| std | 0.90 | 12,983 | 80.81 | 2330 | 194.6 | 320.3 | 4344 | 407.0 | 478.9 | 6799 | |
| cv | 0.13 | 0.70 | 0.69 | 0.78 | 0.75 | 0.84 | 0.73 | 1.31 | 0.98 | 0.69 |
| Surface Water Type | pH | EC | K+ | Na+ | Ca2+ | Mg2+ | Cl− | SO42− | HCO3− | TDS | |
|---|---|---|---|---|---|---|---|---|---|---|---|
| μs/cm | mg/L | mg/L | mg/L | mg/L | mg/L | mg/L | mg/L | mg/L | |||
| River | max | 9.86 | 40,070 | 306.00 | 7700 | 316.0 | 1130 | 13,700 | 2020 | 267.0 | 25,300 |
| min | 6.02 | 2.50 | 2.23 | 10.60 | 0.76 | 0.68 | 10.70 | 12.40 | 31.70 | 131.0 | |
| avg | 7.12 | 10,234 | 89.46 | 1803 | 104.92 | 233.8 | 3082 | 511.9 | 162.8 | 5925 | |
| std | 0.76 | 11,551 | 89.55 | 2135 | 77.77 | 290.8 | 3690 | 543.1 | 48.86 | 6810 | |
| cv | 0.11 | 1.13 | 1.00 | 1.18 | 0.74 | 1.24 | 1.20 | 1.06 | 0.30 | 1.15 | |
| Channel | max | 9.42 | 34,640 | 273.00 | 6980 | 263.0 | 900 | 10,100 | 1750 | 304.0 | 20,400 |
| min | 5.35 | 5.30 | 2.63 | 8.73 | 0.75 | 0.67 | 4.72 | 3.54 | <0.5 | 56.70 | |
| avg | 6.67 | 7847 | 76.50 | 1498 | 85.60 | 189.7 | 2457 | 396.2 | 135.7 | 4472 | |
| std | 0.67 | 10,004 | 86.39 | 2045 | 77.60 | 261.0 | 3239 | 513.9 | 70.62 | 5859 | |
| cv | 0.10 | 1.27 | 1.13 | 1.37 | 0.91 | 1.38 | 1.32 | 1.30 | 0.52 | 1.31 | |
| Pond | max | 8.01 | 37,850 | 305.00 | 7650 | 565.0 | 1010 | 11,900 | 1920 | 214.0 | 23,200 |
| min | 6.24 | 53.2 | 5.54 | 8.25 | 0.99 | 0.33 | 5.53 | 3.86 | 23.80 | 48.90 | |
| avg | 6.95 | 10,967 | 88.93 | 1820 | 123.54 | 228.0 | 3167 | 453.7 | 126.9 | 5961 | |
| std | 0.49 | 13,385 | 104.13 | 2489 | 160.84 | 328.6 | 4244 | 605.5 | 68.96 | 7887 | |
| cv | 0.07 | 1.22 | 1.17 | 1.37 | 1.30 | 1.44 | 1.34 | 1.33 | 0.54 | 1.32 | |
| Reservoir | max | 8.61 | 823.6 | 32.60 | 46.60 | 42.00 | 12.70 | 83.90 | 38.80 | 153.0 | 316.0 |
| min | 5.63 | 29.9 | 2.04 | 4.50 | 0.78 | 0.35 | 3.08 | 2.17 | 14.20 | 12.60 | |
| avg | 6.92 | 140.3 | 10.64 | 15.91 | 7.39 | 2.23 | 14.53 | 8.20 | 39.83 | 89.38 | |
| std | 0.74 | 202.8 | 9.17 | 10.00 | 11.73 | 3.19 | 20.38 | 10.07 | 37.66 | 70.83 | |
| cv | 0.11 | 1.45 | 0.86 | 0.63 | 1.59 | 1.43 | 1.40 | 1.23 | 0.95 | 0.79 |
Disclaimer/Publisher’s Note: The statements, opinions and data contained in all publications are solely those of the individual author(s) and contributor(s) and not of MDPI and/or the editor(s). MDPI and/or the editor(s) disclaim responsibility for any injury to people or property resulting from any ideas, methods, instructions or products referred to in the content. |
© 2024 by the authors. Licensee MDPI, Basel, Switzerland. This article is an open access article distributed under the terms and conditions of the Creative Commons Attribution (CC BY) license (https://creativecommons.org/licenses/by/4.0/).
Share and Cite
He, J.; Wu, P.; Li, Y.; Zeng, M.; Chen, C.; Jakada, H.; Zhao, X. Comprehending Spatial Distribution and Controlling Mechanisms of Groundwater in Topical Coastal Aquifers of Southern China Based on Hydrochemical Evaluations. Water 2024, 16, 2502. https://doi.org/10.3390/w16172502
He J, Wu P, Li Y, Zeng M, Chen C, Jakada H, Zhao X. Comprehending Spatial Distribution and Controlling Mechanisms of Groundwater in Topical Coastal Aquifers of Southern China Based on Hydrochemical Evaluations. Water. 2024; 16(17):2502. https://doi.org/10.3390/w16172502
Chicago/Turabian StyleHe, Jun, Pan Wu, Yiyong Li, Min Zeng, Chen Chen, Hamza Jakada, and Xinwen Zhao. 2024. "Comprehending Spatial Distribution and Controlling Mechanisms of Groundwater in Topical Coastal Aquifers of Southern China Based on Hydrochemical Evaluations" Water 16, no. 17: 2502. https://doi.org/10.3390/w16172502