Abstract
In recent years, extreme climate events have shown to be occurring more frequently. As a highly populated area in central China, the Jialing River Basin (JRB) should be more deeply explored for its patterns and associations with climatic factors. In this study, based on the daily precipitation and atmospheric temperature datasets from 29 meteorological stations in JRB and its vicinity from 1960 to 2020, 10 extreme indices (6 extreme precipitation indices and 4 extreme temperature indices) were calculated. The spatial and temporal variations of extreme precipitation and atmospheric temperature were analyzed using Mann–Kendall analysis, to explore the correlation between the atmospheric circulation patterns and extreme indices from linear and nonlinear perspectives via Pearson correlation analysis and wavelet coherence analysis (WTC), respectively. Results revealed that among the six selected extreme precipitation indices, the Continuous Dry Days (CDD) and Continuous Wetness Days (CWD) showed a decreasing trend, and the extreme precipitation tended to be shorter in calendar time, while the other four extreme precipitation indices showed an increasing trend, and the intensity of precipitation and rainfall in the JRB were frequent. As for the four extreme temperature indices, except for TN10p, which showed a significant decreasing trend, the other three indices showed a significant increasing trend, and the number of low-temperature days in JRB decreased significantly, the duration of high temperature increased, and the basin was warming continuously. Spatially, the spatial variation of extreme precipitation indices is more obvious, with decreasing stations mostly located in the western and northern regions, and increasing stations mostly located in the southern and northeastern regions, which makes the precipitation more regionalized. Linearly, most of the stations in the extreme atmospheric temperature index, except TN10p, show an increasing trend and the significance is more obvious. Except for the Southern Oscillation Index (SOI), other atmospheric circulation patterns have linear correlations with the extreme indices, and the Arctic Oscillation (AO) has the strongest significance with the CDD. Nonlinearly, NINO3.4, Pacific Decadal Oscillation (PDO), and SOI are not the main circulation patterns dominating the changes of TN90p, and average daily precipitation intensity (SDII), maximum daily precipitation amount (RX1day), and maximum precipitation in 5 days (Rx5day) were most clearly associated with atmospheric circulation patterns. This also confirms that atmospheric circulation patterns and climate tend not to have a single linear relationship, but are governed by more complex response mechanisms. This study aims to help the relevant decision-making authorities to cope with the more frequent extreme climate events in JRB, and also provides a reference for predicting flood, drought and waterlogging risks.
1. Introduction
Since the beginning of the 21st century, climate change has caused more extreme weather and climate events (e.g., droughts, cold, and floods), posing a great threat to infrastructure, economy, and people’s physical and mental health [1,2]. For example, Taiwan has experienced a 40-year spring drought, with hydrologic droughts showing a stronger correlation than agricultural droughts, posing a serious challenge to Taiwan’s water security [3]. In 2016, an extreme cold snap in China caused a drop in SAT of more than 10 °C [4]. In British Columbia (BC), Canada, a huge scale devastating flood in November 2021 left more than 20,000 residents homeless and killed countless livestock [5]. Extreme precipitation and temperature have contributed to these, and their severity and frequency continue to increase, making it particularly important to explore extreme climate variability and its drivers globally or within a given region [6,7]. The intensity, seasonality, and duration of precipitation greatly affect the hydrological quality of watersheds and lead to various natural disasters [8,9,10,11]. Extreme rainfall in watersheds in the Loess Plateau region exacerbate the effect of hydrologic connectivity on road erosion [12]. Studies on extreme atmospheric temperatures have shown that changes in their frequency and intensity have serious impacts on social and ecological systems [13]. Extreme cold temperatures in the South African region led to haze over industrial areas [14]. Extreme heat in the Pacific Northwest of the United States resulted in at least 600 deaths and more than 3500 heat stress-related illnesses [15]. Numerous studies have shown that El Niño affects precipitation [16,17]. Therefore, it is necessary to continuously monitor the Atmospheric circulation factor more in depth and designate appropriate measures to minimize the harm caused by them.
Changes in atmospheric circulation patterns are directly responsible for the magnitude of water vapor transport fluxes, which are important drivers of the global water cycle and temperature fluctuations [18]. A study utilizing a global semi-resolved model, which draws on the pseudo-global warming (PGW) experimental framework to reveal the impacts of multi-scale system interactions on extreme precipitation in a changing climate, showed that the atmospheric circulation influences the intensity and coverage of extreme precipitation in China [19]. A research work on the influence of atmospheric circulation patterns on precipitation changes showed that the Atlantic Multi-year Intergenerational Oscillation (AMO), the EI Nino-Southern Oscillation (ENSO), the East Asian Summer Monsoon (EASM), and the Indian Ocean Dipole (IOD) are the main teleconnectors affecting the dynamics of the Standardized Precipitation Index (SPI) in China [20]. The Arctic Oscillation (AO) influences extreme cold climate in eastern and northern areas of the country on one hand, and remotely links (in summer) extreme warm climate in northeastern and southern regions on the other [21]. The above studies coincidentally emphasize the importance of atmospheric circulation patterns. The sudden transition of the North Atlantic Oscillation (NAO) from a positive to a negative direction led to a sudden decrease in the temperature of the stratosphere in the upper North Atlantic [22]. There was a linear correlation reported to be between some indices of atmospheric circulation and winter temperatures on the Korean Peninsula [23]. A study conducted in Western Europe emphasized the complexity of non-stationary interactions between runoff and atmospheric circulation and the prominent role of the North Atlantic Oscillation (NAO) in the circulation [24]. Overall, atmospheric circulation patterns have some teleconnections to extreme climate in various regions of the globe, and its influence should be of more concern in densely populated areas.
The Jialing River is one of the most serious erosion areas in the upper reaches of the Yangtze River, as well as one of the highly populated areas, which feeds more than 40 million people. Because of its complex hydrological characteristics (many river seizure phenomena, etc.) and important research value (a vital water supply source for the Three Gorges Dam Project), it has attracted extensive attention from many scholars [25,26,27,28]. The spatial and temporal changes of landuse in this basin will affect the regional water cycle process. Researchers have used the CMIP6 dataset to predict the extreme precipitation in the Jialing River Basin, and the results show that extreme precipitation in the basin will most probably be on an upward trend in the next 80 years, while the frequency of precipitation is decreasing and the intensity is increasing [29]. Extreme precipitation can lead to rapid increases in river flows, and JRB has faced and will face significant flooding threats both historically and in the future [30]. The water temperature of the Jialing River has varied at different time scales, and although a number of factors contribute to this outcome, long-term atmospheric warming is the dominant factor underlying the increasing water temperature [31]. Climate change affects the spatial and temporal trends of hydroclimate, and meteorological forecasts of the basin using the EasyDHM hydrological model found that the average temperature of the basin will increase in the next 90 years, and the runoff volume of the Jialing River basin is likely to increase [32]. Apparently, the above studies all point to the consistent conclusion that extreme precipitation and atmospheric temperature are shown to occur more frequently in the Jialing River Basin, aligned with the global trends.
Although some studies on precipitation structure or temperature variations have been conducted in the JRB, these works seldom consider the influence of large-scale climate factors, while related studies only analyze from a single linear perspective and lack the non-linear perspective to explore atmospheric circulation patterns on extremes circulation patterns. Therefore, in this study, the precipitation and temperature at JRB and nearby stations were investigated over a period of 60 years. Mann–Kendall analysis (MK), Pearson’s correlation, and wavelet coherence analysis (WTC) were applied to reveal the spatial and temporal trends and distribution characteristics of the extreme precipitation and temperature days in the region. Moreover, the relationship between atmospheric circulation patterns and extreme climate is analyzed from two perspectives: linear and nonlinear. The aim is to help relevant decision makers to formulate better soil and water conservation policies and water resource management measures, to cope with harsher extreme climate conditions in order to reduce the risks of floods, droughts, landslides, etc., and to better manage the river.
2. Materials and Methods
2.1. Study Area
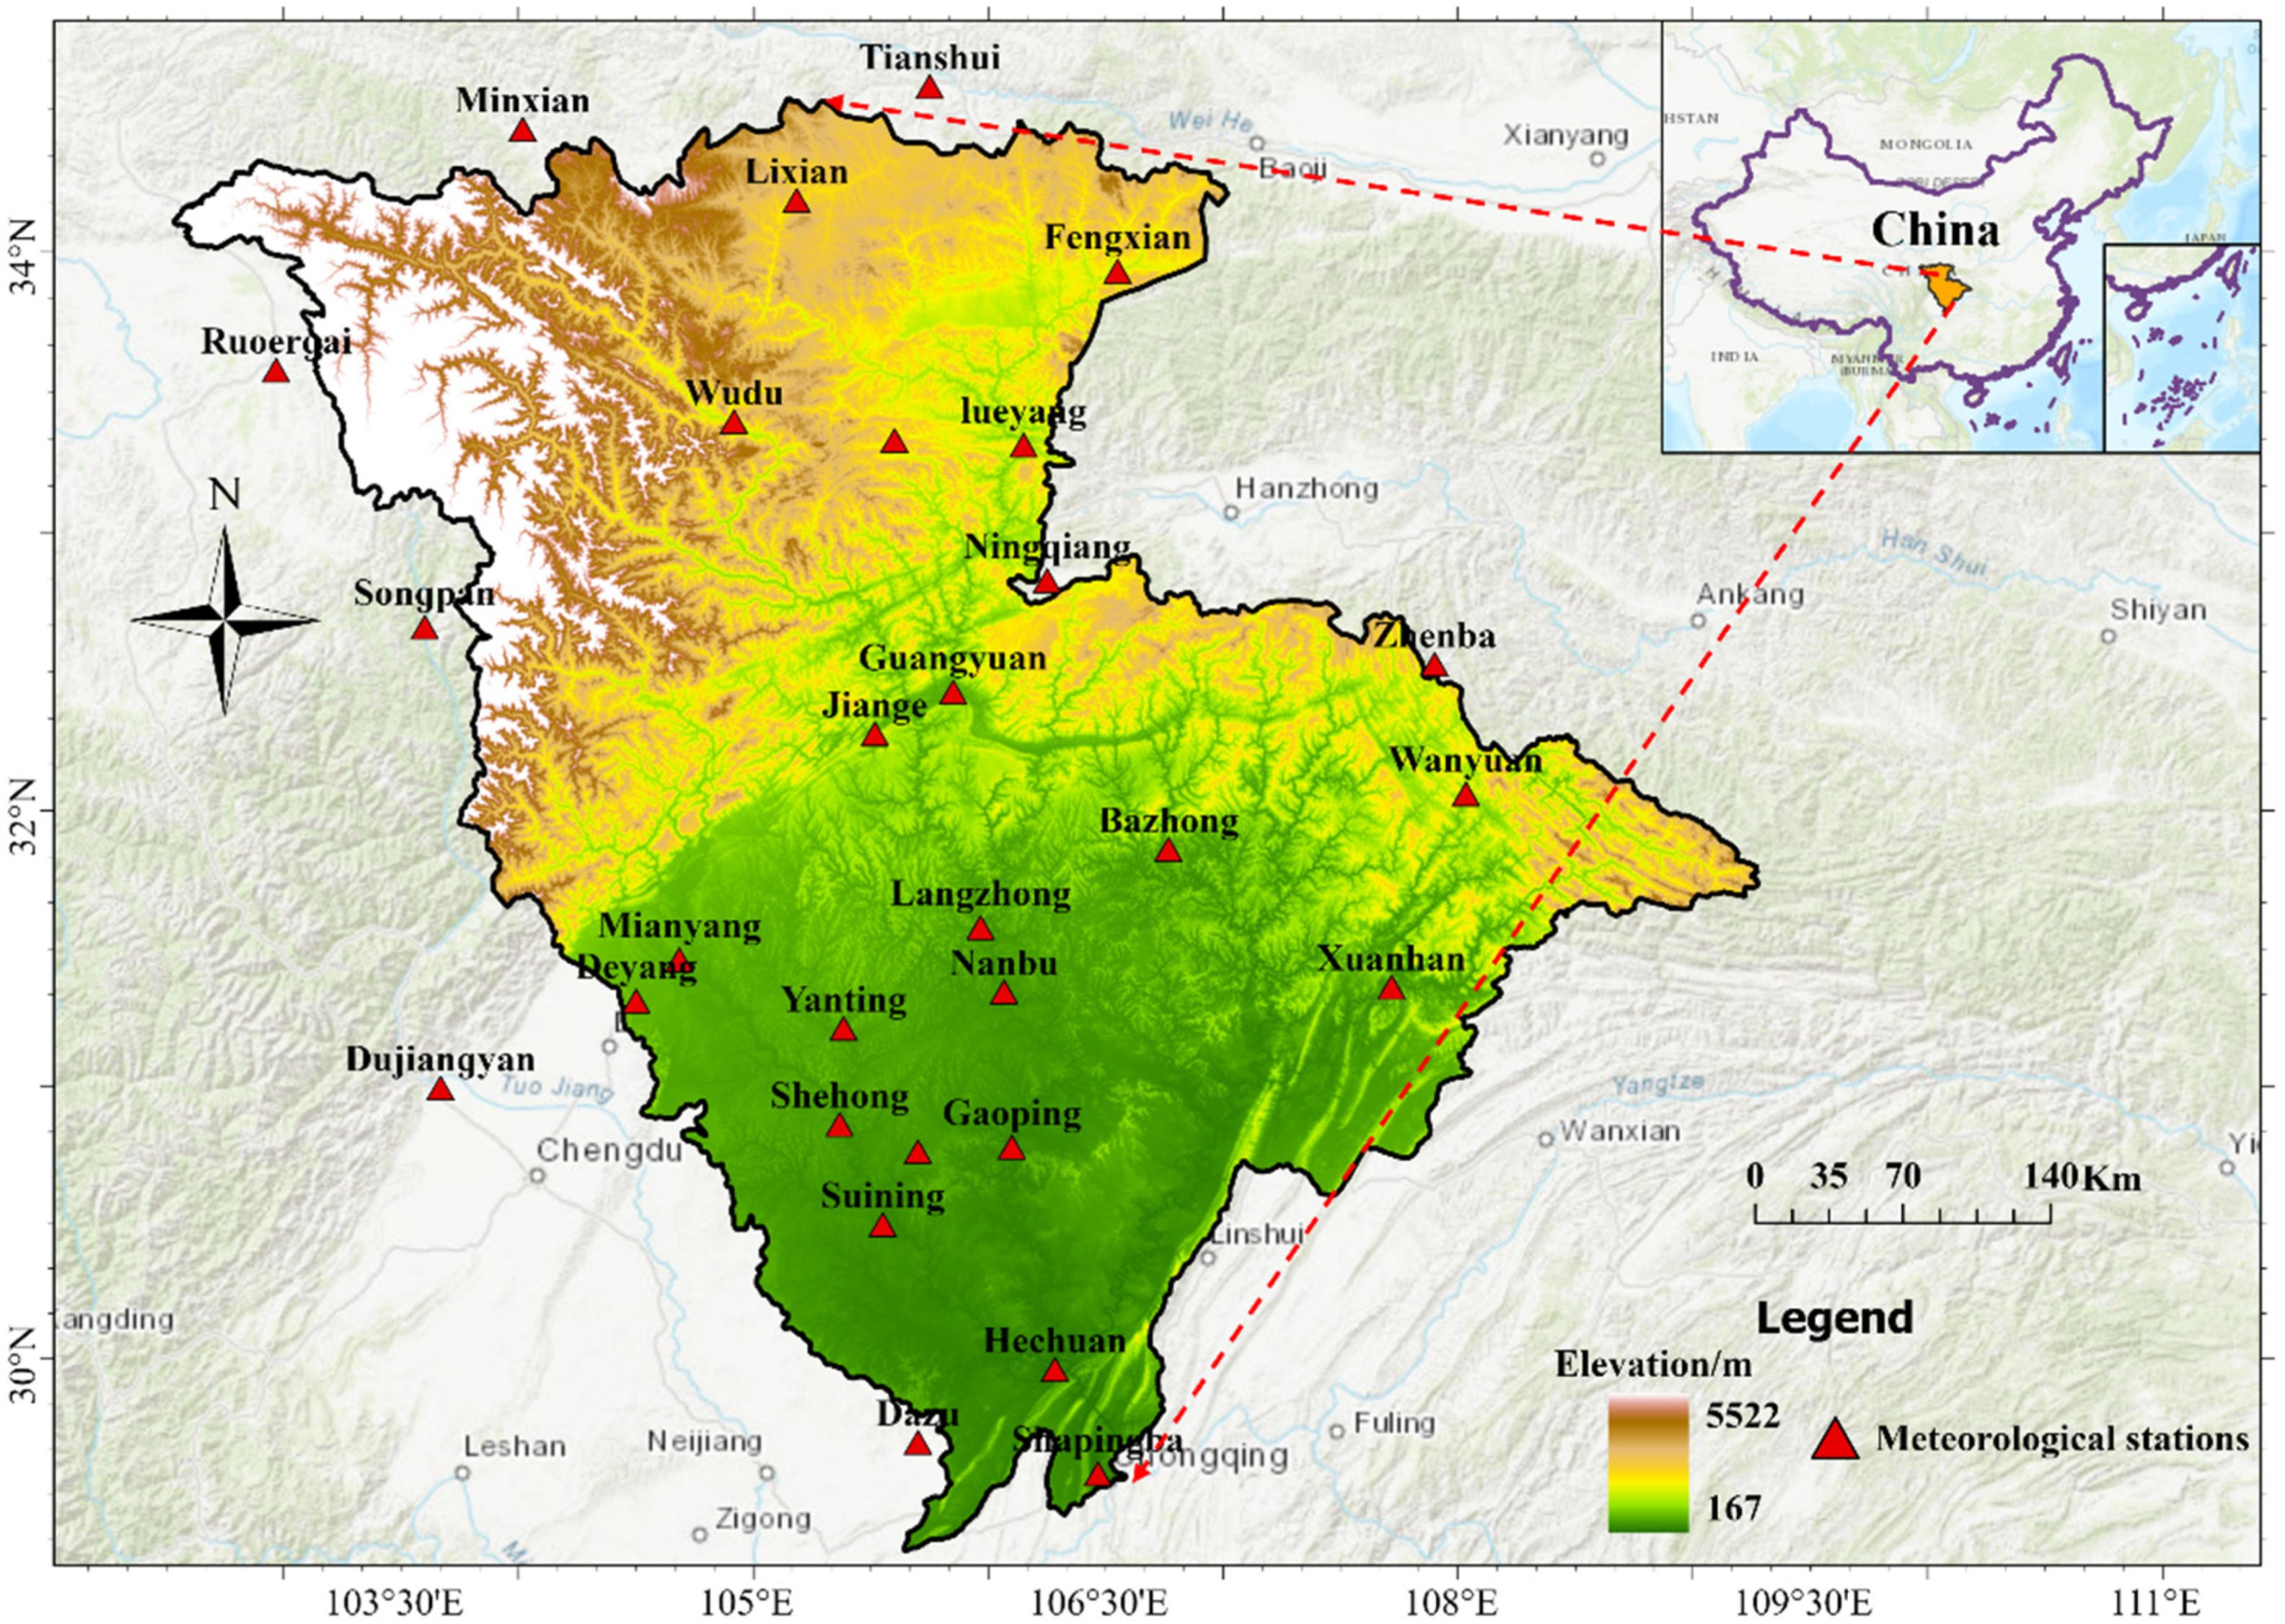
Located in central China and originating from the Qinling Mountains, Jialing River is a first-class tributary of the upper reaches of the Yangtze River, with its main stream and tributaries spreading across Sichuan, Gansu, Chongqing, Shaanxi and other provinces and cities. The total length of the main stream is 1345 km, with a drop of 2300 m and an average drop of 2.05‰. The total watershed area is 160,000 km2 (Figure 1) [33]. The topography of the JRB is characterized by an overall high in the north and low in the south, and it can be divided into the northwestern alpine plateau area, the northern low and middle mountainous area, the central basin and hilly area, and the southeastern parallel ridge and valley and other types of topography. The region belongs to the subtropical monsoon climate zone, which is mainly affected by the southeast monsoon, southwest monsoon and topographic factors. The average annual temperature in the upper reaches of the Jialing River ranges from 11 to 16 degrees Celsius, while the middle and lower reaches of the river are relatively warmer, with average annual temperatures ranging from 16 to 18 degrees Celsius. Precipitation in the basin is unevenly distributed, decreasing from southeast to northwest, with the average multi-year precipitation in the upper reaches of the river below 1000 mm and above 1000 mm in the middle and lower reaches. The overall multi-year average precipitation is 935.2 mm, with more concentrated precipitation in summer, especially from June to September, accounting for 66% of the annual precipitation.
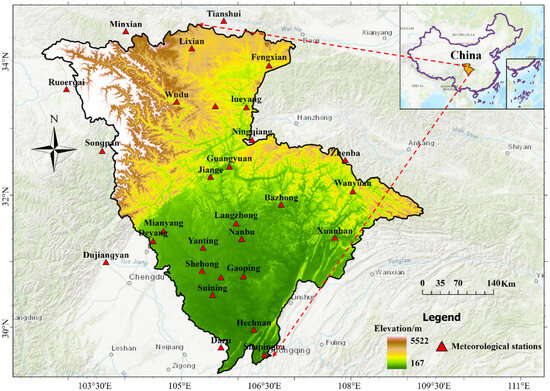
Figure 1.
Overview and Distribution of Meteorological Stations in the JRB.
2.2. Data
The precipitation and temperature data used in this study were obtained from the China Meteorological Science Data Sharing Service Platform (http://data.cma.cn/, visited on 21 March 2024). This study employed the inverse distance weight (IDW) spatial interpolation method to analyze the spatial distribution of the precipitation and temperature in JRB. The IDW interpolation method generates a raster grid, and the values of each cell are calculated by averaging the data values from neighboring stations [34]. In the data preprocessing stage, the interpolation method was employed to fill in the very few missing values and excluded the stations with severely missing data. Table 1 shows the basic information of the meteorological stations. A total of 29 meteorological stations in JRB and its vicinity were selected after the final screening for precipitation and maximum/minimum temperatures from 1960 to 2020.

Table 1.
Meteorological stations’ information for JRB.
2.3. Extreme Precipitation and Extreme Temperature Index Descriptions and Definitions
Extreme precipitation indices and extreme atmospheric temperature indices are widely used in extreme climate assessment and prediction studies [35]. In this work, we selected 10 indices (Table 2) with extreme climate indices, including 6 precipitation and 4 atmospheric temperature indices, for exploring the spatial and temporal characteristics of extreme climate in the JRB. RX1day and Rx5day were chosen in the reason that extreme precipitation can be analyzed in terms of both short and long calendar time. “RclimDex V1.9” (based on R language) was used to calculate all indices (http://etccdi.pacificclimate.org/, accessed on 21 March 2024) and it can calculate 27 extreme climate indices [36].
Table 2.
Definition of 10 extreme climate indices used.
2.4. Atmospheric Circulation Index
In this study, from the 27 core extreme climate indices recommended by the Meteorological Commission of the World Meteorological Organization (WMO), five representative climate indices were selected for exploring the response of general circulation indices (GCIs) to climate extremes, taking into account the studies of others and the climatic conditions of JRB [37]. The details are shown in Table 3. These include the Arctic Oscillation (AO), the Pacific Interdecadal Oscillation (PDO), the North Atlantic Oscillation (NAO), Niňo 3.4, and the Southern Oscillation Index (SOI). Monthly data were obtained from the Earth System Research Laboratory (ESRL) (https://psl.noaa.gov/data/climateindices/list/, accessed on 21 March 2024) and computed to obtain annual data, selected to be complete with no missing values.
Table 3.
Definition of Atmospheric Circulation Index.
2.5. Mann–Kendall (M-K) Trend Method
The M-K trend method is a commonly used nonparametric statistical method for detecting trend changes in time series data [38]. The method is based on the comparison of rank sums and does not require assumptions about the distribution of the data, and is often used as the most general and applicable method for studying the time trends of extreme climate. The M-K trend method determines the trend characteristics of extreme precipitation indicators by calculating the statistical variable S, variance Var(S) to derive the value of the normal statistical variable Z.
The principle is as follows: for the sequence Xt (t = 1,2,3 … n), the statistical variable S:
where: and are the corresponding years of data and sgn is the sign function.
The expectation and variance of S are calculated as follows:
where: is the variance.
From this, a standardized test statistic Z can be constructed as:
The three commonly used significance test alpha values are 0.05, 0.01, and 0.001, which correspond to passing the 95%, 99%, and 99.9% significance tests, at which point the absolute value of the Z-value is greater than 1.96, 2.576, and 3.291, respectively.
2.6. Correlation Analysis
2.6.1. Pearson Correlation Analysis
Pearson correlation analysis is a statistical method used to measure the strength and direction of the linear relationship between two continuous variables [39,40]. It usually focuses on the correlation coefficient r between two variables, which takes the range of [−1, 1], and indicates positive correlation when r > 0, negative correlation when r < 0, and no correlation when r = 0. The calculation formula is:
where denotes the covariance of X and Y, and and denote the standard deviation of X and Y.
2.6.2. Wavelet Coherence Analysis (WTC)
WTC analysis is used to study the coherence between non-stationary time series [41]. WTC is realized by decomposing the time series into wavelet coefficients and then calculating the coherence between the wavelet coefficients, which can reveal the coherence between two time series over time and frequency, and the principle is as follows:
For the time series x(t), its wavelet power spectrum is:
Crossed wavelet power spectrum for any two time series x(t) and y(t):
The WTC coherence coefficient is defined as:
where: is the coherence coefficient with a maximum value of 1. is the scaling parameter; τ is the time translation parameter; is the wavelet transform coefficients of the sequence x(t); is the complex conjugate of the wavelet transform coefficients of the sequence X(0); S is the smoothing operator.
In this study, the WTC method is used to explore the nonlinear correlation between extreme indices and atmospheric circulation patterns.
3. Result and Discussion
3.1. Interannual Trends in Extreme Precipitation and Atmospheric Temperature in JRB
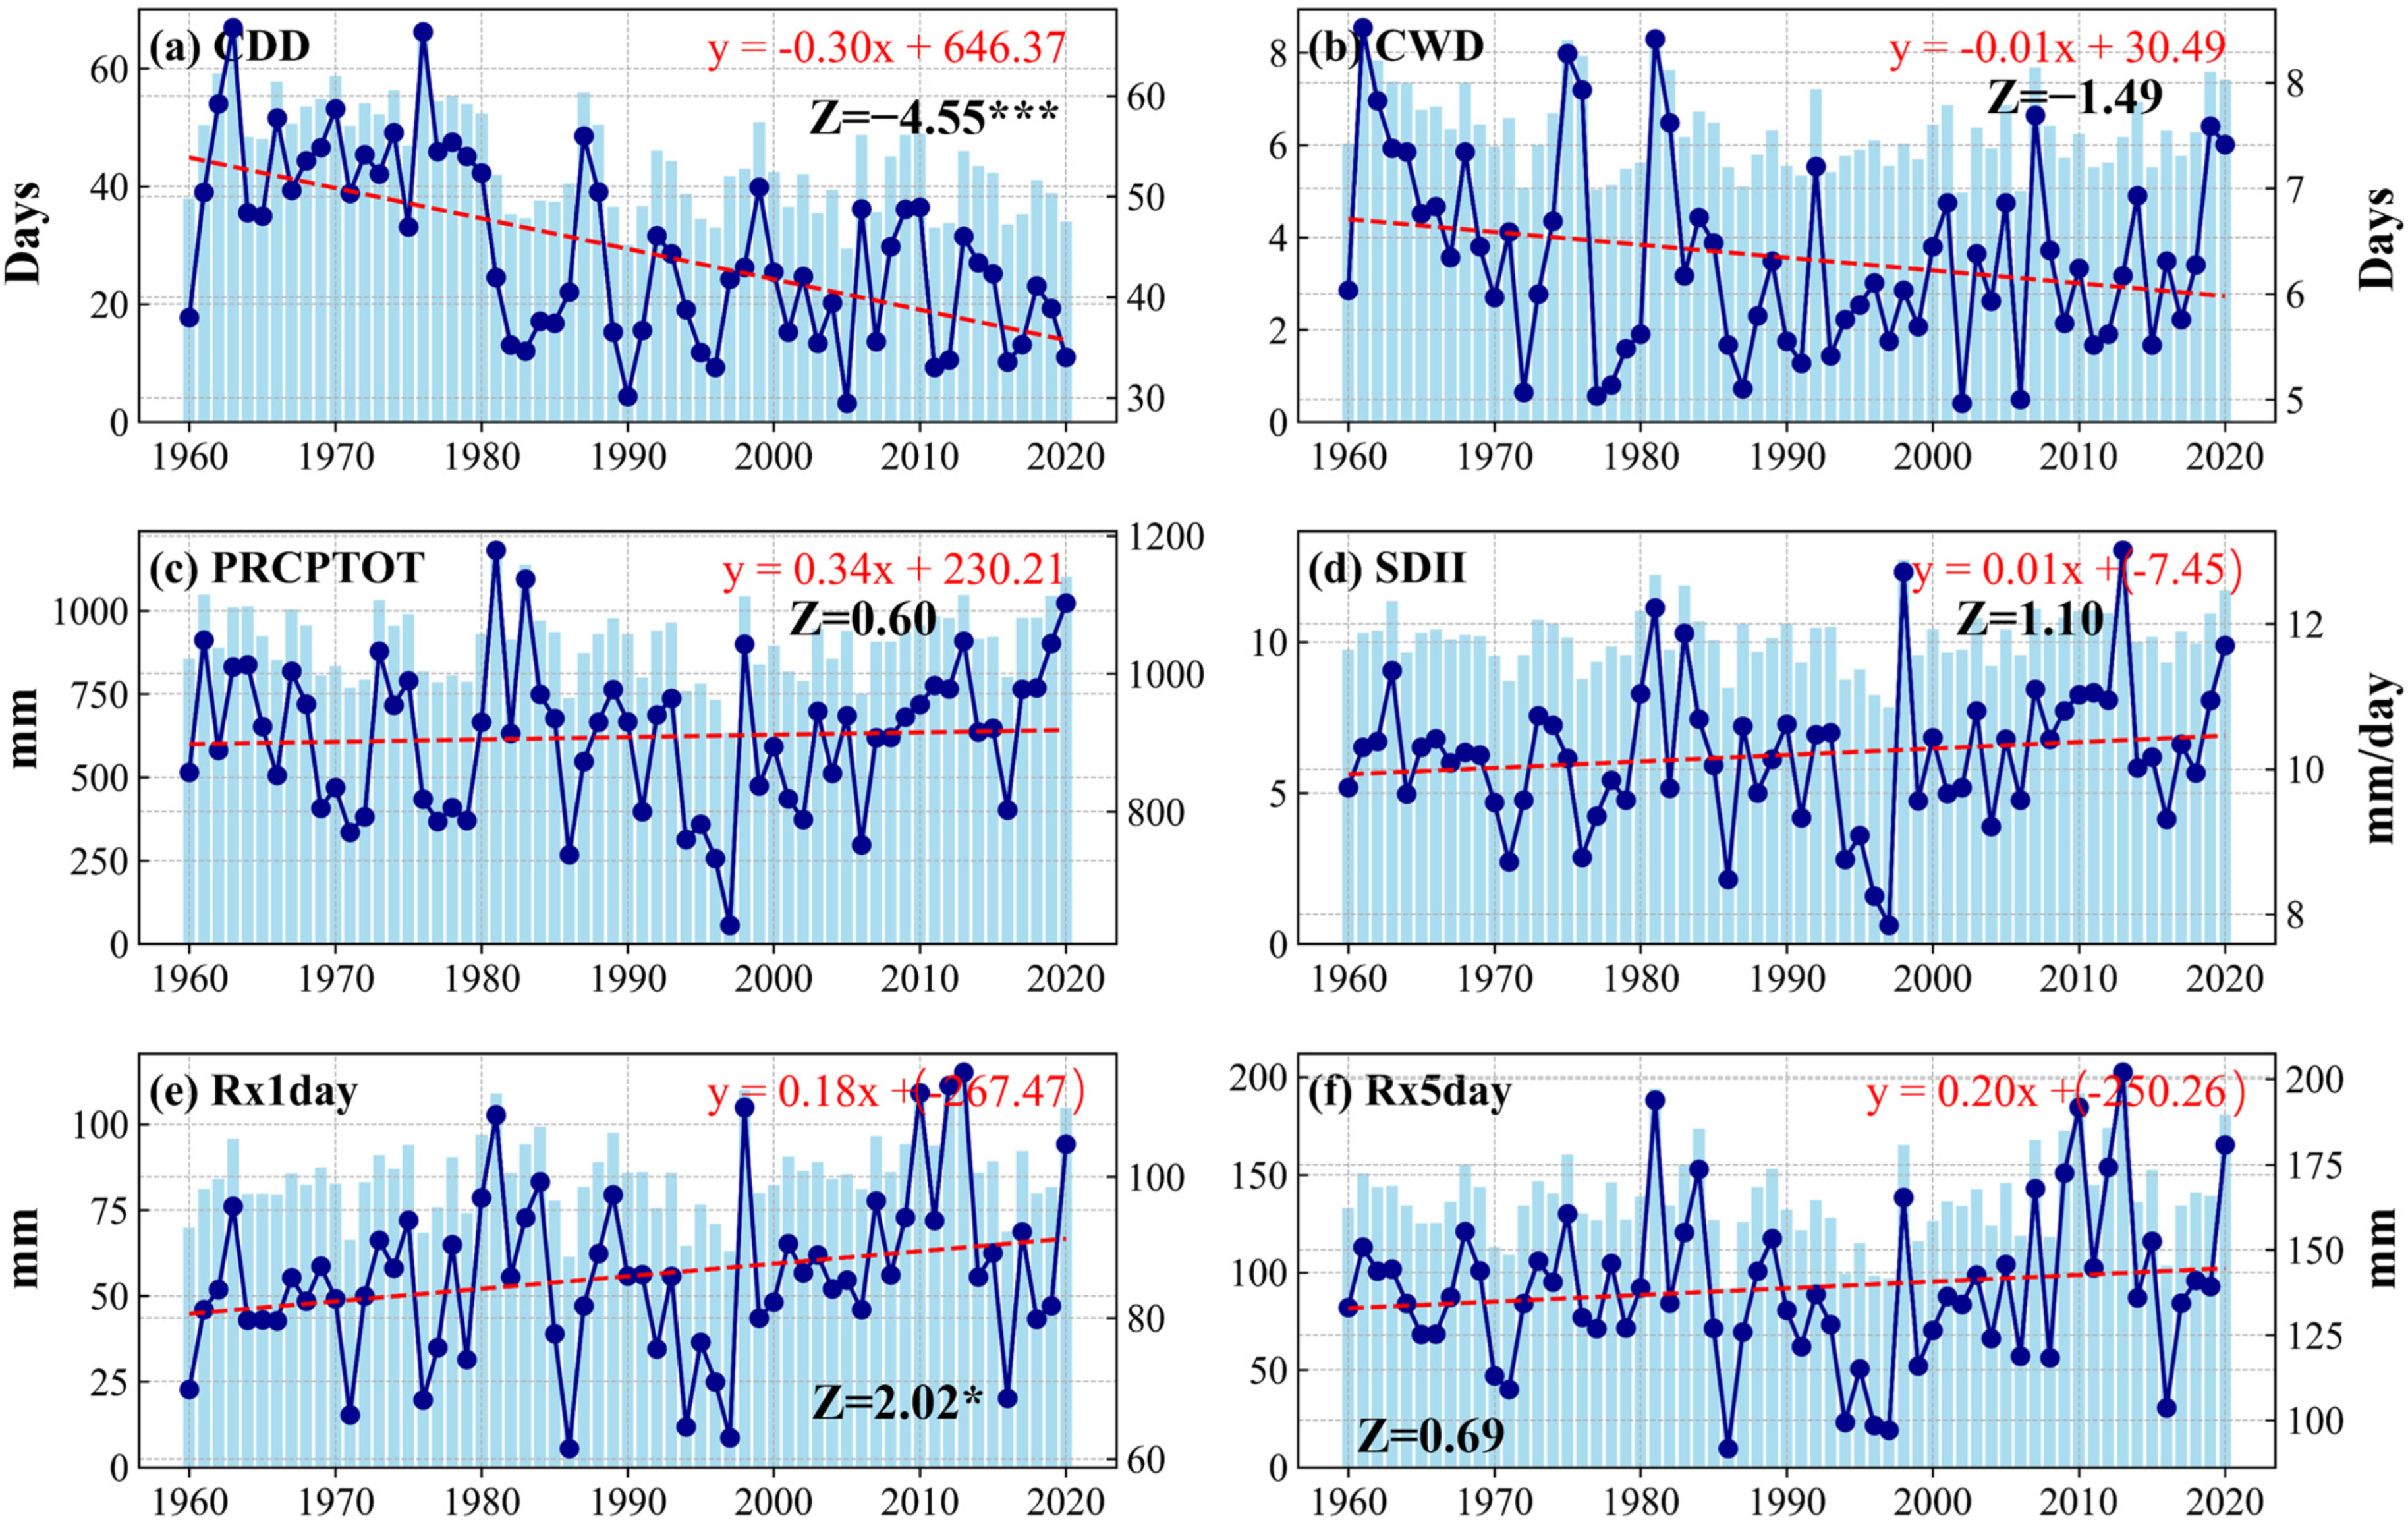
Figure 2 shows the interannual trends of the six extreme precipitation indices for JRB from 1960 to 2020 (10a for decade). During the 60-year period, all indices showed increasing trends over the years except CDD and CWD. CDD showed a significant decreasing trend at a rate of 3.0 days/10a, which passed the significance test of 99.9% (p < 0.001). It was highest in 1963 at 66.76 days and lowest in 2005 at 29.45 days, with a significant difference between the highest and lowest. CWD was highest in 1961 at 8.52 days and lowest in 1972 at 5.07 days, and generally declined at a rate of 0.1 day/10a, with the most pronounced downward trend from 1974 to 1977. The upward trend of PRCPTOT is not significant (at a rate of 3.4 mm/10a), with the maximum value occurring in 1982 (1179.3 mm).
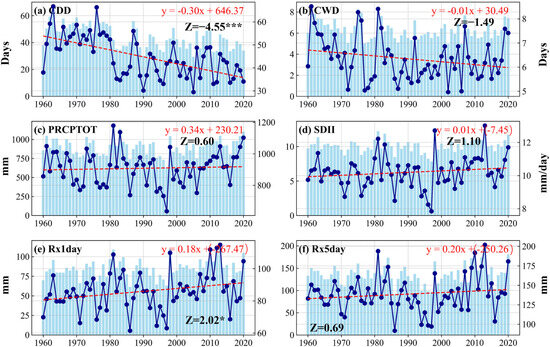
Figure 2.
The interannual variation of extreme precipitation indices in the Jialing River Basin over the past 60 years (“*” and “***” represent the significance levels at p < 0.05, and p < 0.001, respectively).
The fluctuation over the years is significant, with a large range, and the lowest value in 1997 was only 635.24 mm. The intensity of precipitation showed an increasing trend over the years with a rate of 0.1 mm/10a, reaching a maximum value of 13.02 mm/day in 2013, which is a significant difference compared to 8.48 mm/day in 1966. The maximum daily precipitation had a significant increasing trend with a rate of 1.8 mm/10a. It passed the 95% significance test (p < 0.05) and reached a maximum value of 114.76 mm in 2013, which is nearly double the minimum value of 64.59 mm in 1964. In contrast, the increasing trend of 5-day maximum precipitation is not significant with a rate of 2 mm/10a. It is noteworthy that the Rx5day maximum of 201.99 mm in 2013 was followed by a minimum of 103.71 mm in 2016, with a plunge of close to 100 mm occurring in just three years. Overall, the volatility of all extreme precipitation indices in the JRB is high, the number of consecutive dry days becomes less, the amount of rainfall over short calendar periods increases, and the total effective precipitation in the basin does not change significantly (not much difference in the variation of rainfall totals). It also shows that due to the rise in precipitation intensity, the rainfall occurring in the JRB tends to be more intense with a short calendar time, which exacerbates the hazards associated with extreme precipitation.
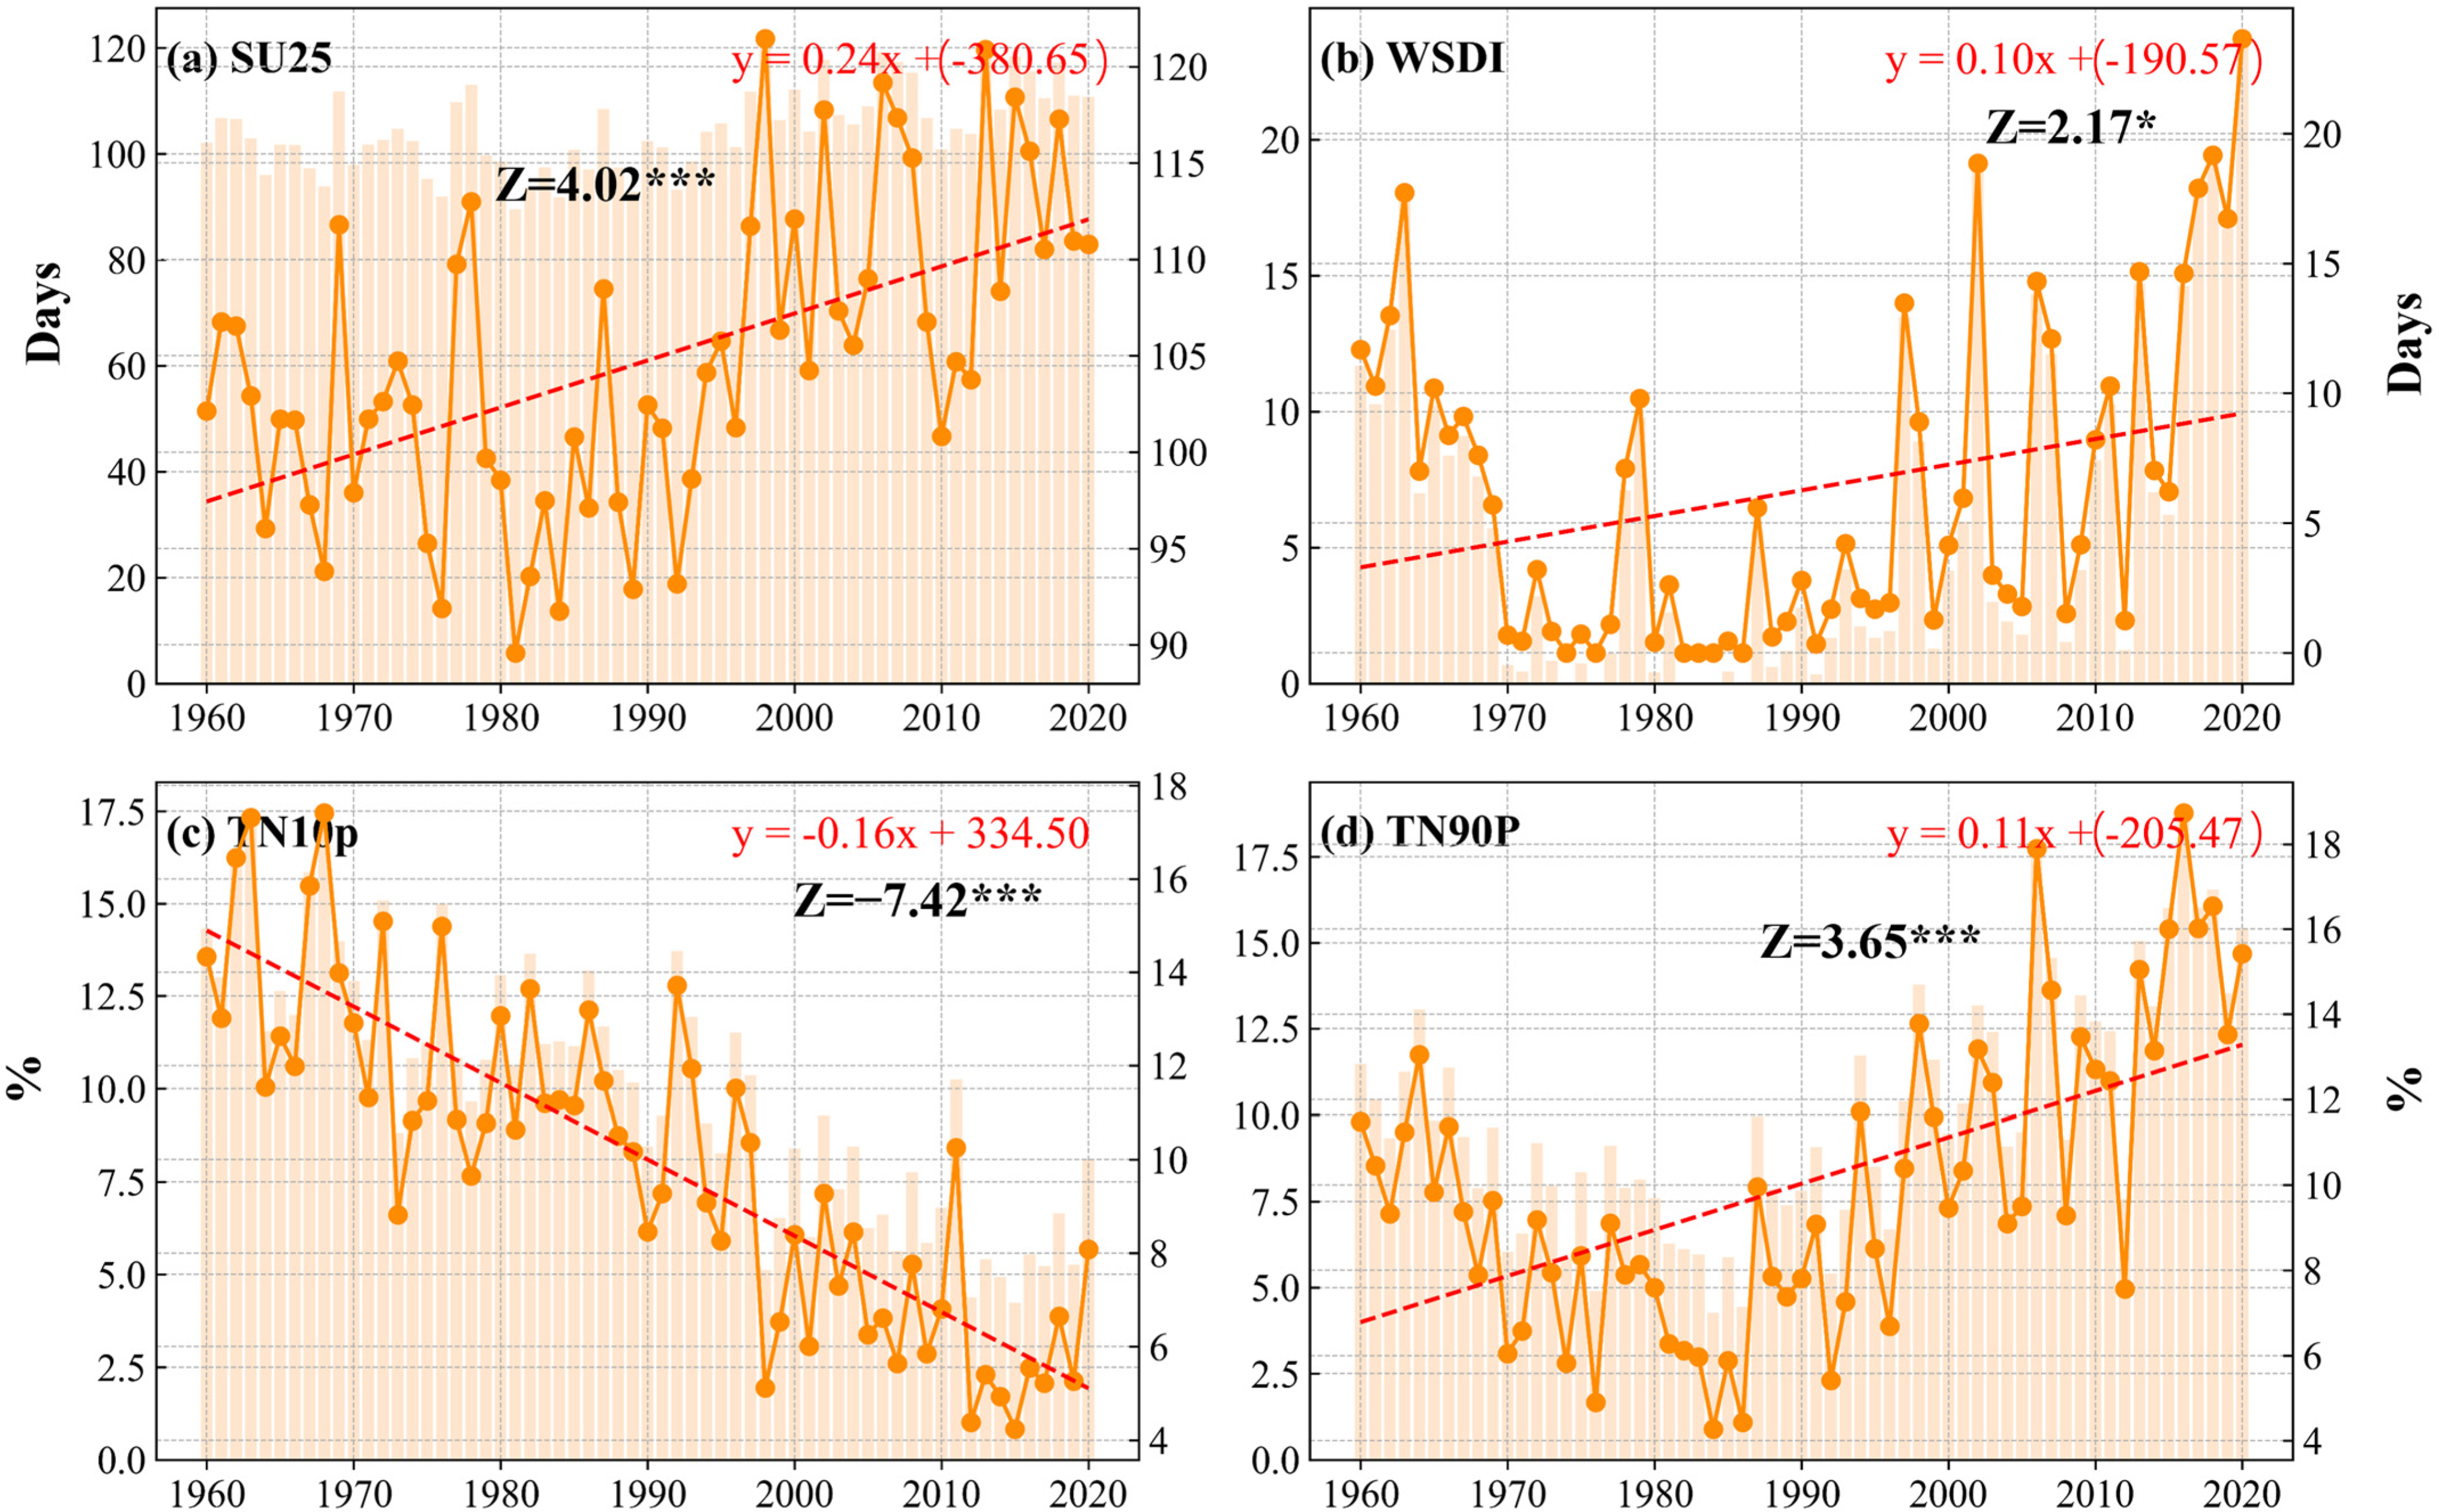
In contrast, there is a significant upward/downward trend in all extreme atmospheric temperature indices (Figure 3). Meanwhile, the volatility of all extreme atmospheric temperature indices of JRB is also significant. SU25 increased at a rate of 2.4 days/10a, reaching a maximum value of 120.90 day in 2013. More than one third of the years (42 years) of SU25 values were greater than 100 days, which passed the test of significance of 99.9% (p < 0.001). WSDI increased at a rate of 1.0 day/10a, reaching a maximum value of 23.66 days in 2020, especially in the last five years, which showed a higher value. The WSDI increased at a rate of 1.0day/10a, reaching a maximum value of 23.66 days in 2020, especially in the last 5 years when it showed a higher value (the lowest value in the 5-year period was 14.70 days). It passed the 95% significance test (p < 0.05), and the only one of the four indices, TN10p, showed a significant decrease with a rate of 1.6%/10a, which passed the 99.9% significance test (p < 0.001). A maximum value of 17.42% occurred in 1968, which reached a four-fold numerical difference from the minimum value of 4.24% in 2015, especially since TN10p values have been smaller in recent years. Correspondingly, TN90p showed an increasing trend at a rate of 1.1%/10a, which also passed the significance test of 99.9% (p < 0.001). It reached a maximum value of 18.74% in 2016 this is a huge difference from 2.06% in 1969. The significant trends in the indices illustrate that the total number of days with high temperatures (SU25), the number of consecutive days with high temperatures (WSDI), and the number of days with warm nights (TN90p) have continued to increase, and this rise has been more pronounced in recent years in particular, which suggests that extreme high temperature days can be widespread in the JRB and that the watershed is continuing to warm.
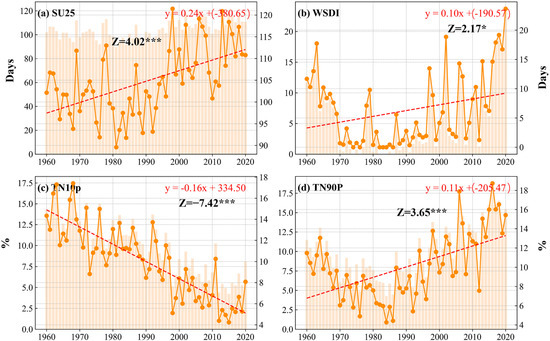
Figure 3.
The interannual variation of extreme atmospheric temperature indices in the Jiangling River Basin from 1960–2020 (“*” and “***” represent the significance levels at p < 0.05 and p < 0.001, respectively).
All extreme atmospheric temperature indices are significant (Figure 4), and the trends indicate that the number of high temperature days (SU25) and the duration of high temperatures (WSDI) are increasing significantly, while the number of continuously wet days (CWD) has been trending downward for many years (Figure 3b), so that the decline in the extreme precipitation index, CWD, during the period when precipitation was not occurring may have exacerbated the severity of the extreme high temperatures in that period. Other related studies have also illustrated that atmospheric temperatures in the watershed are increasing from year to year [42,43]. Climatic drought is defined as drought caused by climatic factors (prolonged warming of temperatures and reduced precipitation) [44]. Meanwhile, the elevation of other extreme precipitation indices in the JRB (Figure 2a−f) allows for an increase in extreme hydrologic, this insignificance is accompanied by a decline in CWD and continued warming of the watershed, which in turn renders changes in precipitation insignificant. This is confirmed by the results of a stratified climate assessment at JRB through the entire basin and three sub-basins, where climatic droughts are more pronounced than hydrological droughts on large-scale trends, the cause of which is dominated by precipitation, while total annual precipitation has fluctuated little over the years [45]. In recent years, the JRB extreme index tends to fit its upward/downward trend at a high level, then we can reasonably infer that in the future extreme climate will cause even worse impacts, a study predicted the precipitation in JRB by inputting meteorological data into the MIKE model, and it can also be foreseen that the total precipitation in the basin will change insignificantly but fluctuate significantly in the next two decades. This great discrepancy is bound to cause highly destructive precipitation [46].
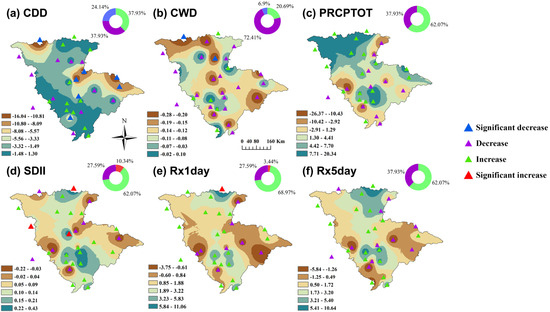
Figure 4.
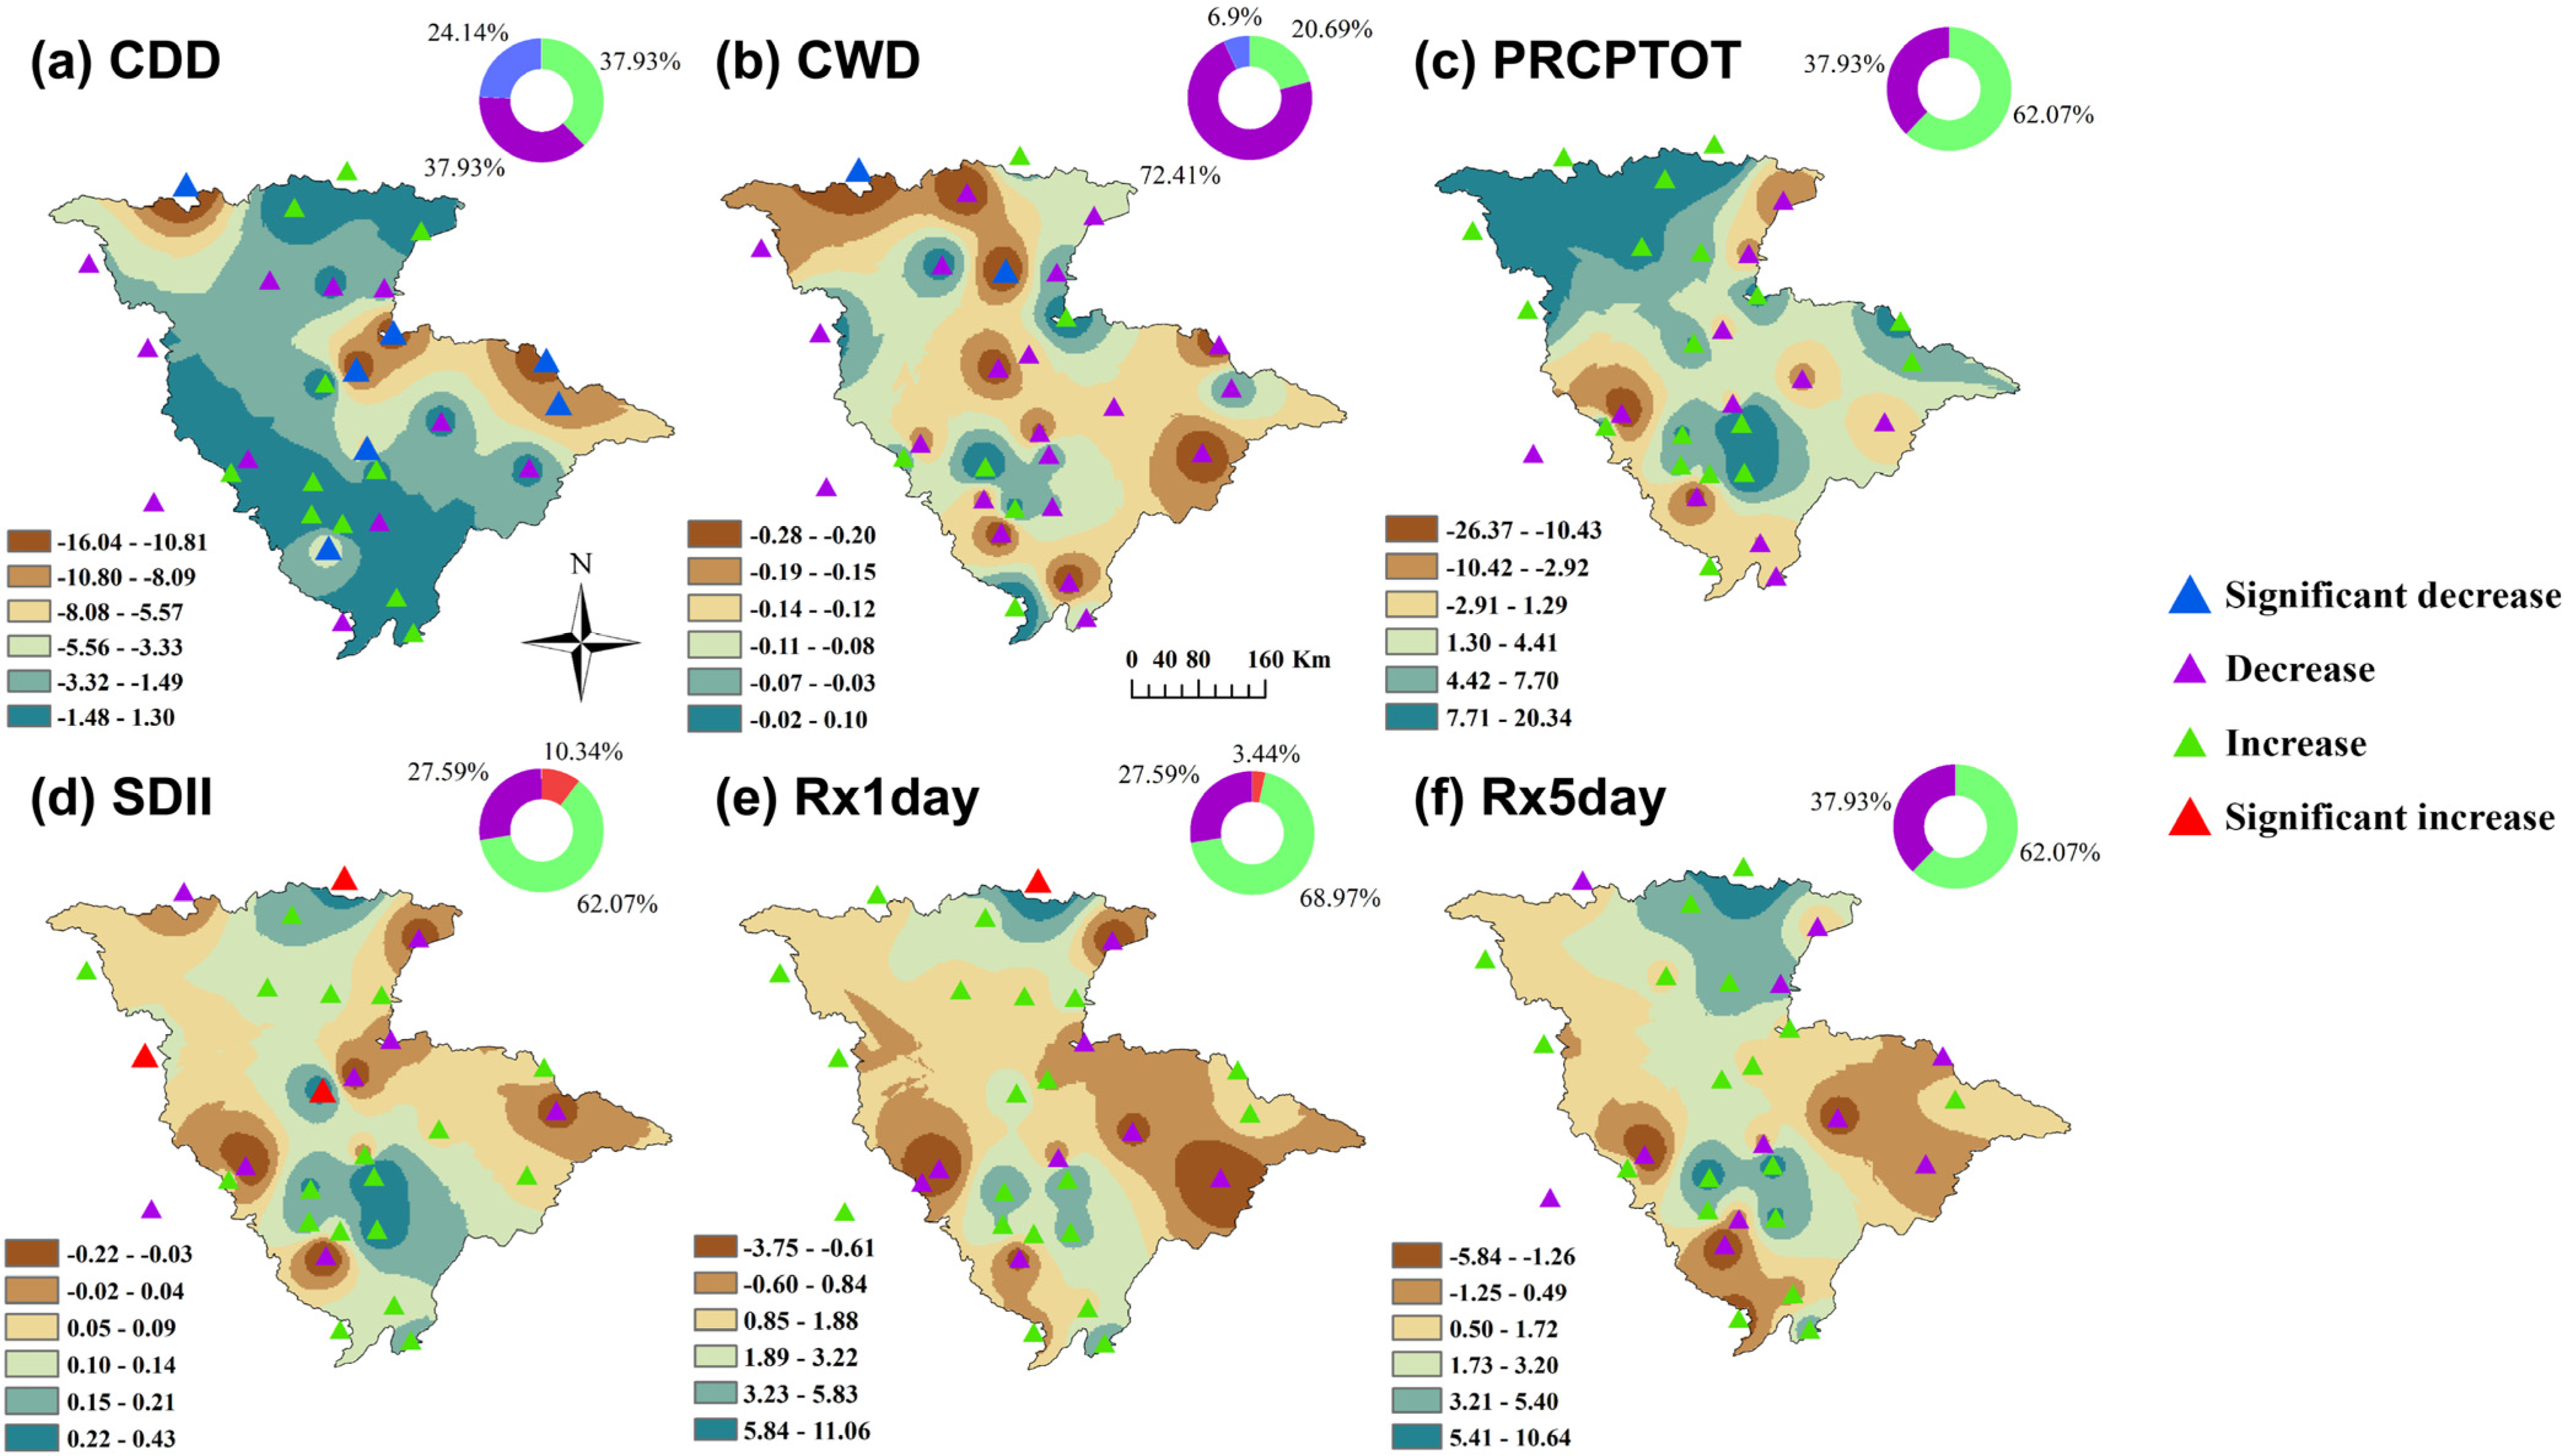
The spatial distribution of the annual trend of extreme precipitation index in the Jialing River Basin from 1960 to 2020 (Triangles outside the domain indicate stations in the vicinity of JRB, the color of the ring represents the ratio of different trend stations).
3.2. Characterization of Spatial and Trend Changes in Extreme Precipitation and Atmospheric Temperature in JRB
Figure 4 shows the trend and spatial distribution of extreme precipitation indices at 29 meteorological stations over 60 years in JRB. Overall, most of the stations for CDD and CWD showed decreasing trends, while most of the stations for all the remaining indices showed increasing trends, but a relatively small percentage of stations showed significant increasing trends. For CDD, about two-thirds of the sites (18, 62.07%) showed a decreasing trend, with 7 sites (24.14%) showing a significant decreasing trend that passed the 95% significance test (p < 0.05). Moreover, 11 sites showed a non-significant upward trend (37.93%), and there were no sites with a significant upward trend. Sites with upward trends were mainly located in the northeastern and southern regions of JRB, and sites with significant downward trends were mainly located in the northwestern and central regions. Similarly, the majority of sites in CWD (23, 79.31%) showed a decreasing trend, with 21 sites (72.41%) showing a non-significant decreasing trend, but the number of sites with a significant decreasing trend (relative to CDD) decreased from 7 (24.14%) to 2 (6.90%). Six sites showed an increasing trend, again with no significantly increasing sites. Significantly decreasing sites are concentrated in the northern region, with increasing sites located mostly in the northeast and southwest. PRCTOT does not show significant upward/declining trends in sites, with 18 (62.07%) showing an upward trend, and the rest of the sites showing declines, with upward-trending sites located mostly in the north and southwest regions, with fewer in the east, and no decreasing trends in the northwest region. Twenty-one (72.41%) of the SDII sites showed an upward trend, with 18 sites showing a non-significant upward trend, as did PRCTOT, but three (10.34%) significant upward-trending sites appeared (p < 0.05). The rest of the sites showed decreasing trends and again did not have significant decreasing sites. The sites showing increasing trends on Rx1day and Rx5day were more evenly distributed with 20 (68.97%) and 18 (62.07%) sites showing non-significant increasing trends, but the number of sites with significant increasing trends was reduced from 1 (3.44%) to 0, and the rest of the sites with decreasing trends. Neither Rx1day nor Rx5day showed significantly decreasing sites, with the former having no decreasing-trend sites in the north-western region, while both showed the characteristic of more pronounced changes in the central region.
For all the extreme atmospheric temperature indices, most of the stations of the indices except TN10p showed an increasing trend, and the significance trend was more obvious than that of the extreme precipitation indices (Figure 5). In total, 20 stations (68.97%) of SU25 showed a significant upward trend (p < 0.05), which accounted for 83.33% of the total number of upward-trending stations (24 stations), and there were no stations with a decreasing trend. For WSDI, the number of sites with significant upward trend decreased from 20 to 14 (48.27%), and correspondingly 11 sites (37.93%) showed non-significant upward trend. Meanwhile, four sites (13.79%) with decreasing trends were observed, of which two sites (6.90%) showed significant decreasing trends (p < 0.05), located in the central and northwestern regions, respectively. As for TN10p, all sites showed a decreasing trend, of which 28 sites (96.55%) showed a significant decreasing trend. In contrast, TN90p showed a significant upward trend at 21 sites (72.42%), which accounted for 80.77% of all upward-trending sites, and only three (10.34%) non-significantly downward-trending sites appeared, located in the southern region.
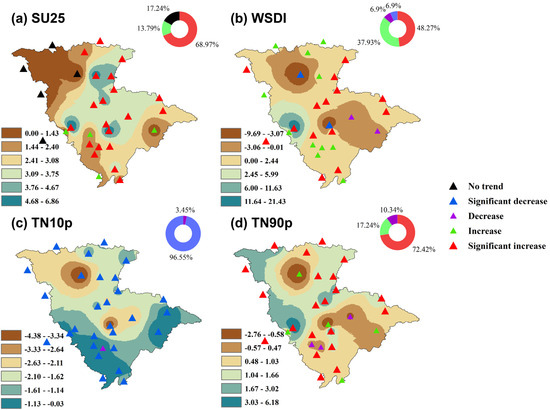
Figure 5.
The spatial distribution of the annual trend of extreme atmospheric temperature index in the Jialing River Basin from 1960 to 2020 (Triangles outside the domain indicate stations in the vicinity of JRB, the color of the ring represents the ratio of different trend stations).
We find from our results that extreme temperature indices tend to be more spatially oriented towards a single upward/downward trend (compared to extreme precipitation indices), which confirms that temperature change tends to be large-scale, unlike rainfall which has a strong regional pattern. The JRB SU25 index has the spatial characteristic of being highest in the northern part of the basin and lowest in the western part (Figure 5a). Although some scholars estimated the reference evapotranspiration of JRB through the CROPWAT model, which is the same as the SU25 index in this paper, they show the same spatial distribution characteristics, and it is obvious that the significant increase in this index induces the increase of evapotranspiration rate in this region [47]. Through the spatial distribution results of extreme indices, Rx1day, Rx5day and PRCTOP show significant decreasing trends at several stations in the northwest and northeast regions (Figure 4c,e,f). The impacts of such extreme precipitation are also reflected in landuse. In a study of the impacts of land use change on watershed climate in the same region, it was found that three of the sub-watersheds in the JRB (Shehong, Luyang, and Fengtan) had significantly larger land use change dynamics than the other sub-watersheds. It is noteworthy that these three sub-basins are also located in the northwest and northeast regions, and it is clear that climate change directly contributes to the allocation of water resources to the land and the methods of growing crops, which in turn changes land use. This is also highly consistent with the findings of this paper, where changes in extreme precipitation indices are more pronounced in the northwest and northeast regions of the basin [48].
3.3. Linear Correlation between Extreme Climate and Atmospheric Circulation in the JRB
In this study, the associations between the 10 extreme indices two by two and between them and atmospheric circulation patterns were analyzed separately using the Pearson correlation method. The results showed (Figure 6) that CDD had an extremely significant positive correlation with TN10p, with a correlation coefficient of r = 0.53, which passed 99.9% of the hypothesis test (p < 0.001). CWD also showed an extremely significant positive correlation with PRCPTOP, with correlation coefficients of 0.47 and 0.34, respectively (p < 0.001), and showed an even more significant negative correlation with SU25 (r = −0.31, p < 0.01), and a significant positive correlation with SDII (r = 0.24, p < 0.05). PRCPTOP, on the other hand, showed extremely significant positive correlations with SDII, Rx1day, and Rx5day (r = 0.83, r = 0.69, r = 0.74, p < 0.001). SDII also showed extremely significant positive correlations with Rx1day and Rx5day (r = 0.829, r = 0.809, p < 0.001), and significant positive correlations with WSDI showed a significant positive correlation (r = 0.225, p < 0.05). Rx1day and Rx5day indicated an extremely significant positive correlation (r = 0.877, p < 0.001). Su25 showed an extremely significant correlation with all three, WSDI, TN90p and TN10p, with the first two reflecting an extremely significant positive correlation (r = 0.56, r = 0.74, p < 0.001), while the opposite was true for TN10p, which showed a highly significant negative correlation (r = −0.61, p < 0.001). WSDI showed a highly significant positive correlation with TN90p (r = 0.747, p < 0.001). And TN10p showed an extremely significant negative correlation with Tn90p (r = −0.572, p < 0.001). It is worth noting that the increase in the number of hot days over the years in JRB correspond to the significant rise in WSDI and TN90p. From the results of the analysis, we confirm that there is often a correlation between two of the extreme indices, and therefore our combination of these extreme indices appears to be more reliable when analyzing extreme climate in the JRB.

Figure 6.
Pearson correlation analysis of extreme indices in the Jialing River Basin from 1960 to 2020. (“*”, “**”, and “***” represent the significance levels at p < 0.05, p < 0.01, and p < 0.001, respectively, the size of the circle corresponds to the size of the correlation coefficient).
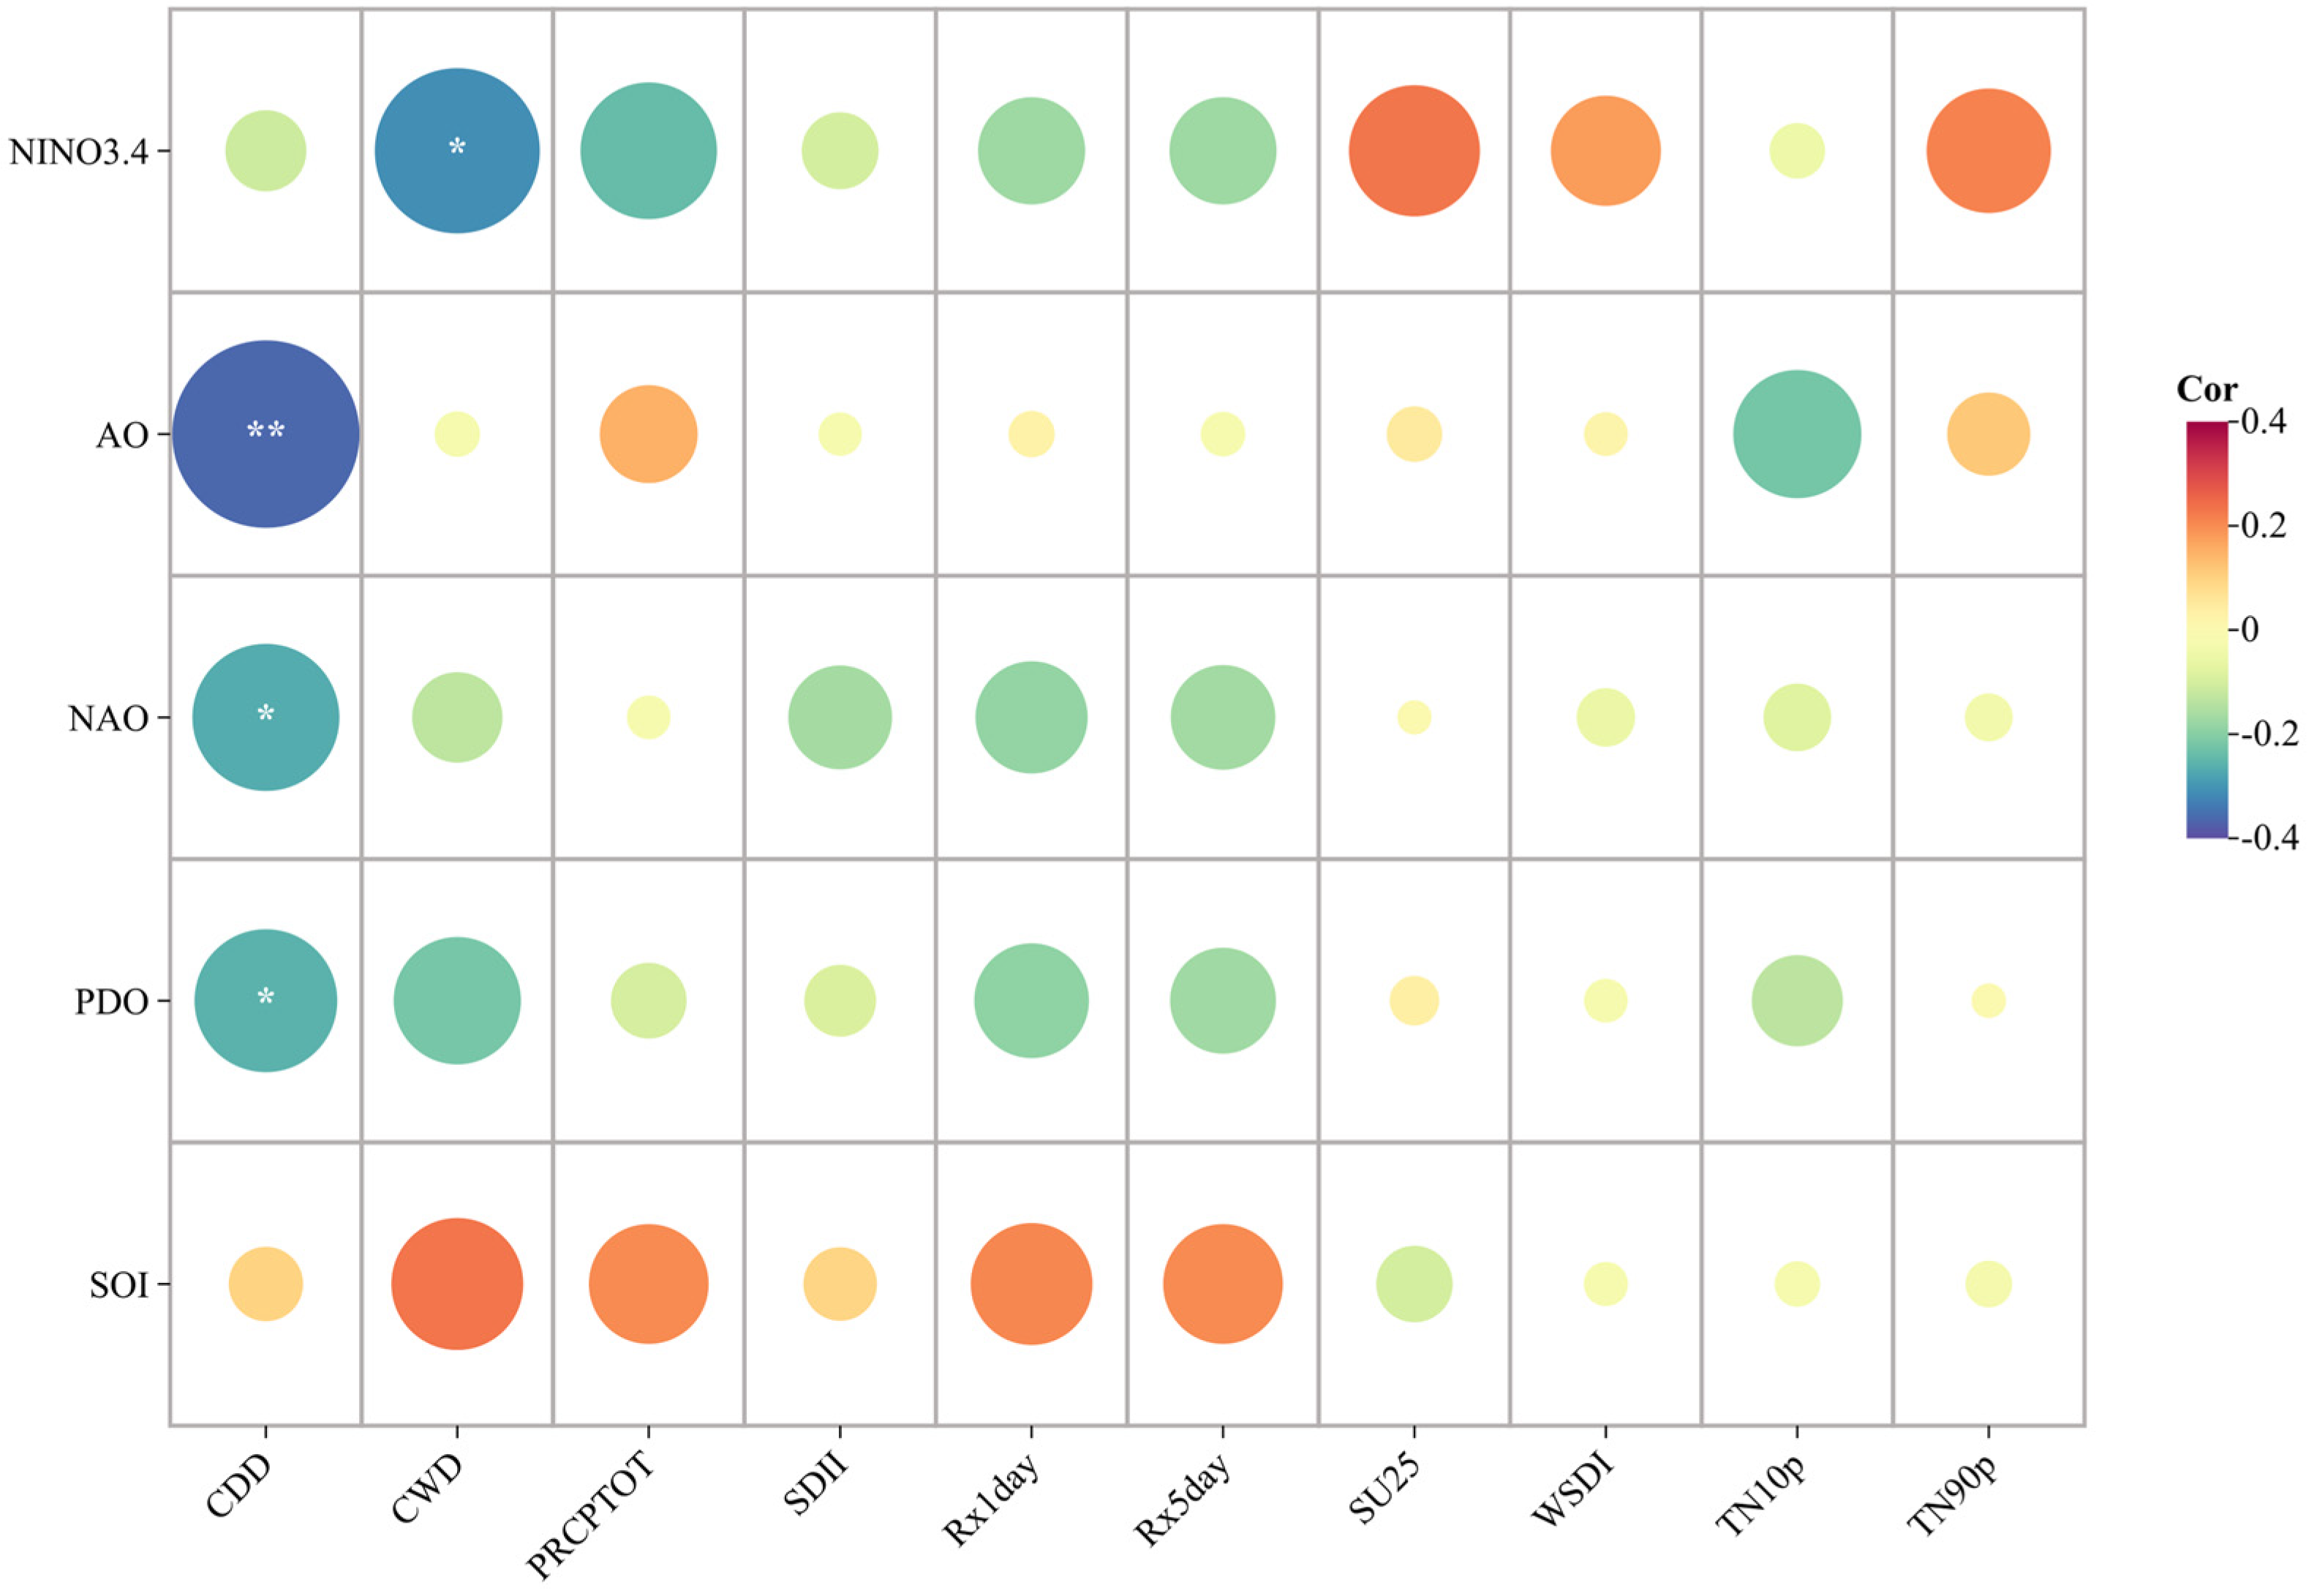
Figure 7 shows the Pearson’s correlation coefficients between the extreme indices and the atmospheric circulation patterns, and the results show that AO, NAO and PDO are all significantly negatively correlated with the extreme precipitation index CDD, with AO showing a more significant negative correlation with CDD (r = −0.365, p < 0.01). We found that NAO showed negative correlations with all the other extreme indices (although most correlations are weak) except for SU25, which showed a non-significant positive correlation. In addition, NINO3.4 also showed a significant negative correlation with CWD (r = −0.312, p < 0.05). However, we note that SOI did not exhibit significant correlation with all extreme indices, but unlike NAO and PDO, it showed positive correlation with the majority of the indices (except with SU25 and WSDI, which showed negative correlation) but the correlation was not significant. Overall, AO, NAO, PDO, and NINO3.4 all showed linear relationships with the extreme indices, which influenced more the timing of rainfall intervals in the JRB, while the SOI had less of an impact in the basin. Related studies have also confirmed that the SOI has a high degree of uncertainty, and that the impacts on East Asian climate often have complex teleconnection mechanisms and do not exhibit a single linear relationship [49]. The Pearson correlation between AO and CDD is the most significant, and we have found some reasons for this in previous studies, which is due to the enhanced teleconnection relationship of AO to rainy seasons after 1980 its most pronounced in the winter season, and when the AO is stronger, large-scale rainfall occurs in China, along with an increase in atmospheric temperature [50,51].
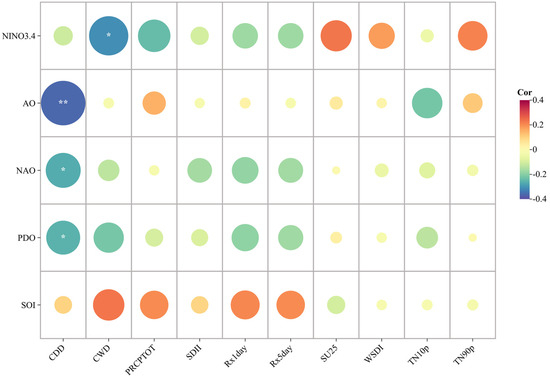
Figure 7.
Pearson correlation analysis of extreme indices and atmospheric circulation patterns in the Jialing River Basin from 1960 to 2020. (“*” and “**” represent the significance levels at p < 0.05, p < 0.01, the size of the circle corresponds to the size of the correlation coefficient).
3.4. Nonlinear Correlation between Extreme Climate Index and Atmospheric Circulation in JRB
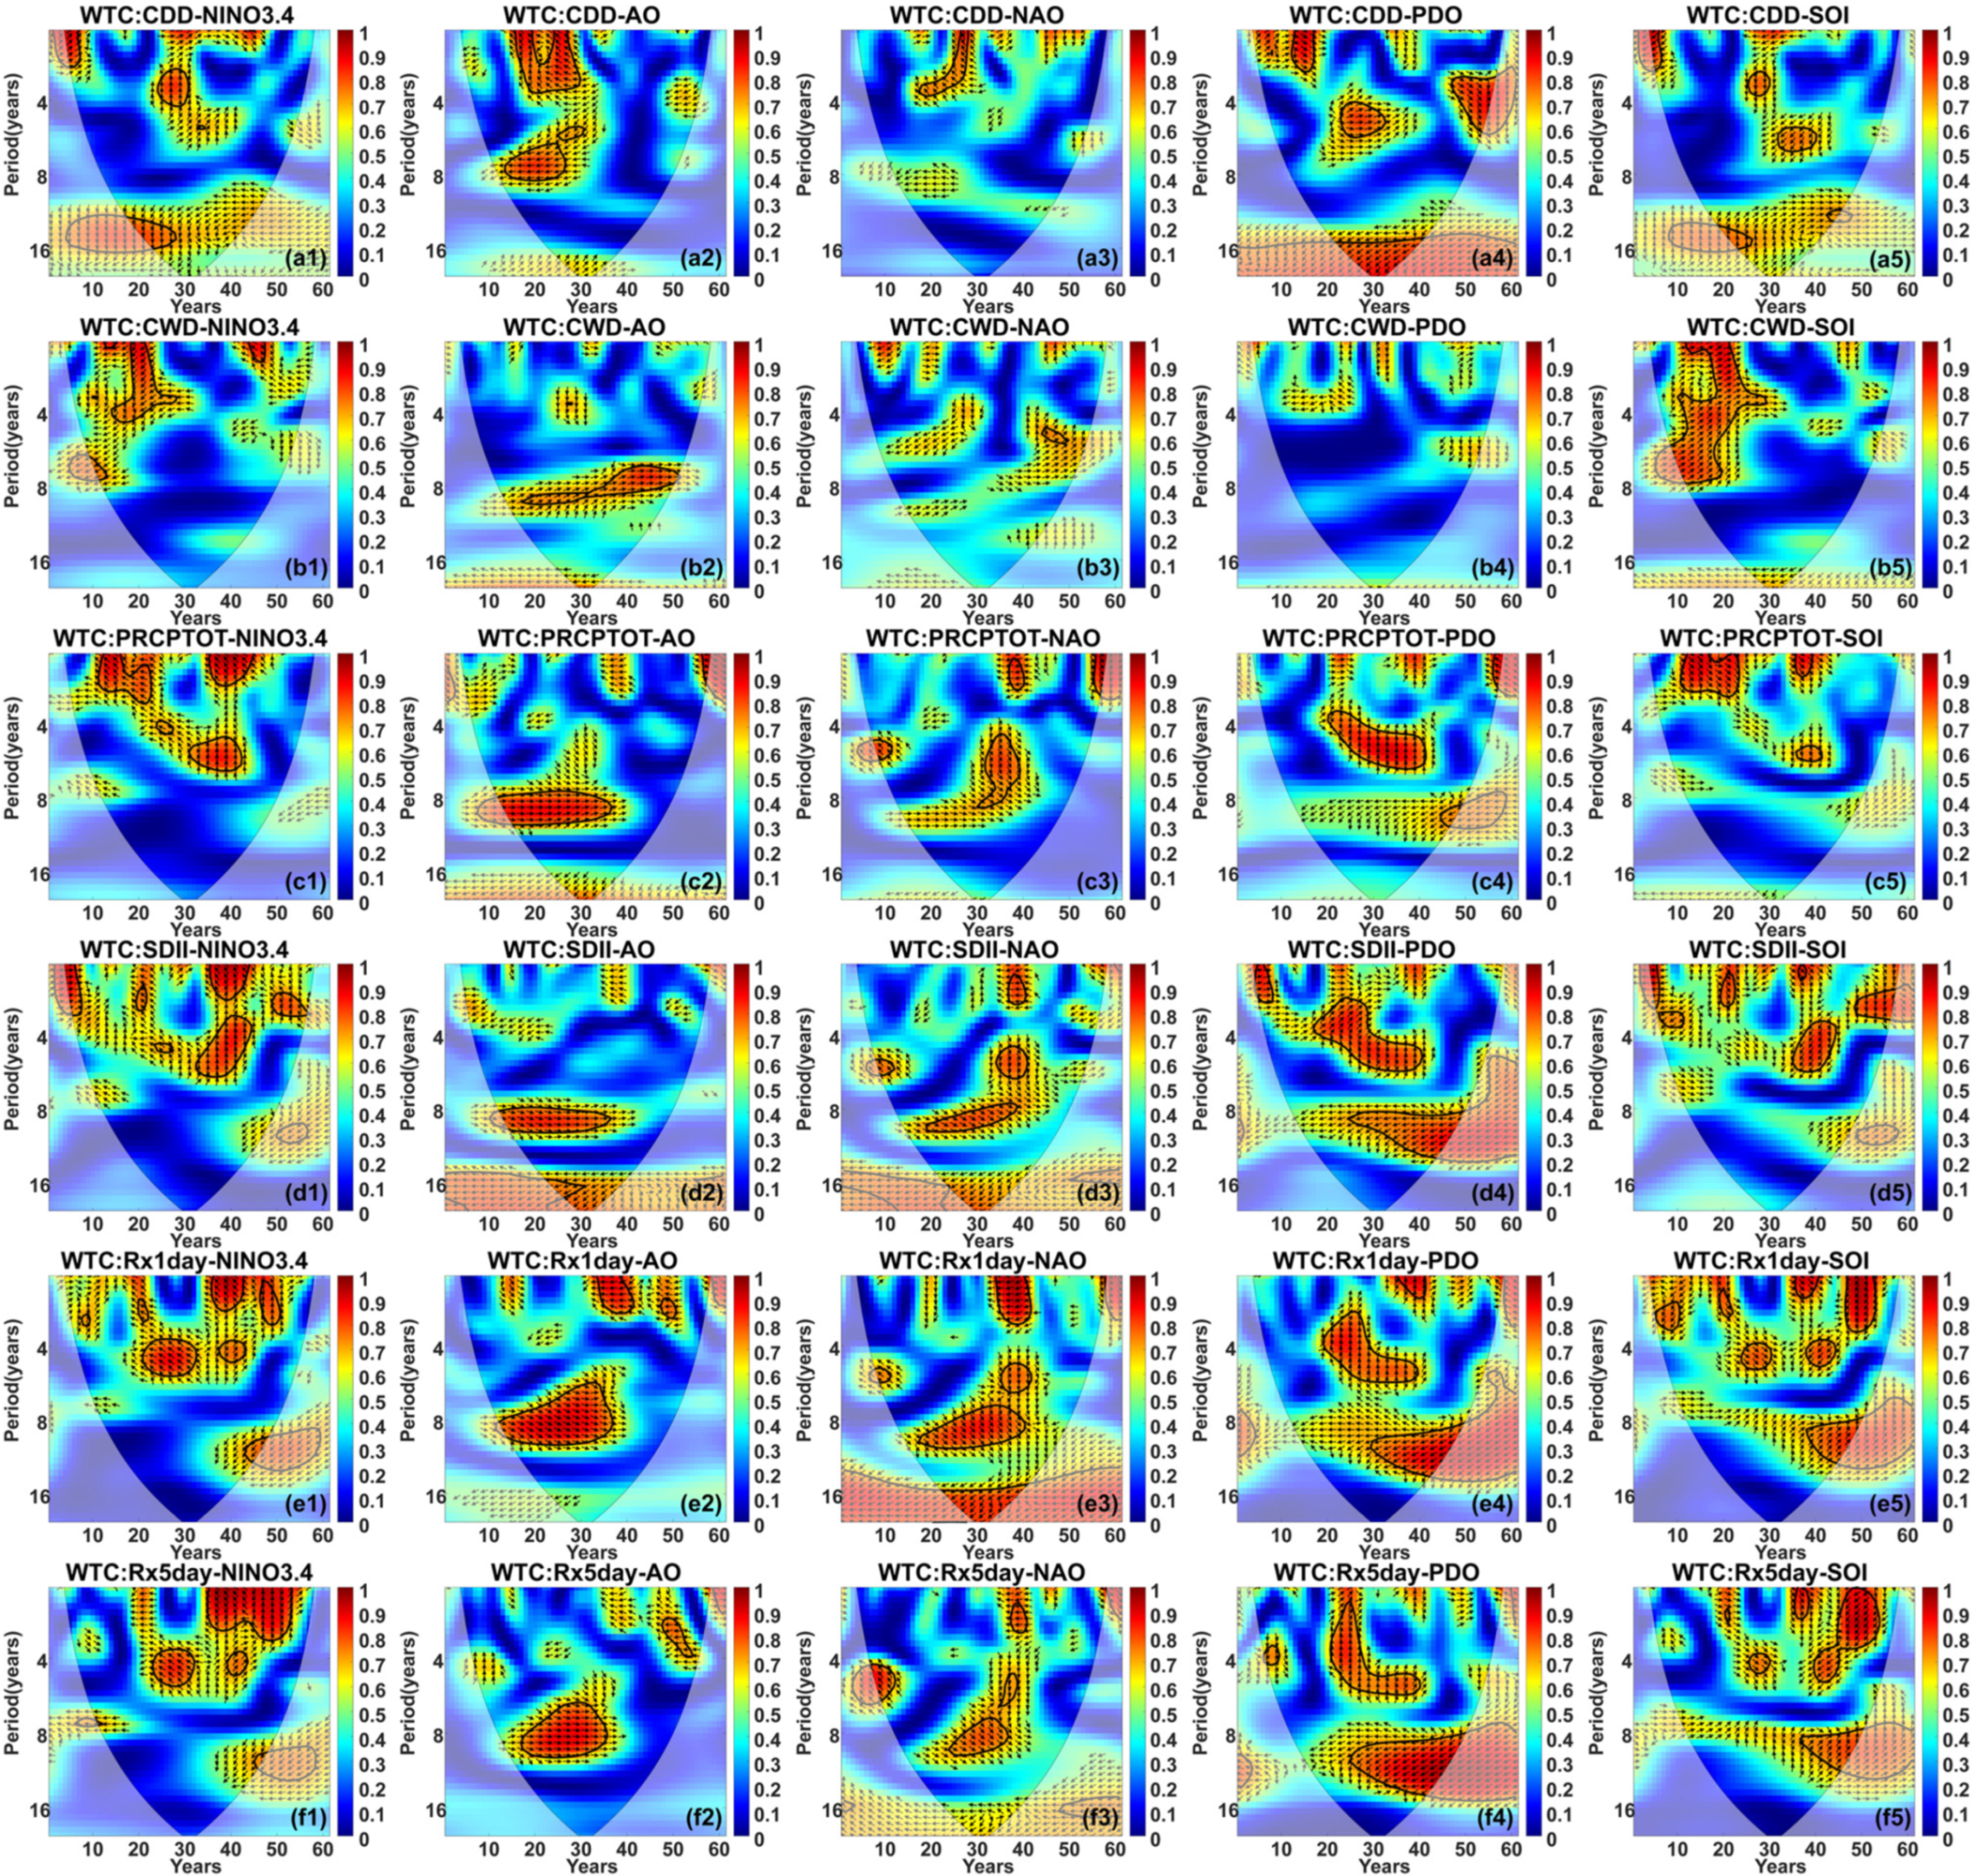
Figure 8 shows the results of extreme precipitation index and atmospheric circulation WTC. From a1–a5, it can be seen that CDD, PDO and SOI show significant coherence over a longer period of time. The significant coherence with NINO3.4 and AO are concentrated before 1992, and CDD and NINO3.4 show significant positive coherences at 0–2 years cycle and 12–16 years cycle from 1965 to 1972 and 1977 to 1985, respectively, and show significant negative coherence at 2–5 years cycle (1982–1990). AO and CDD showed significant negative coherence at different cycles (0–4 years, 5–8 years) from 1974 to 1992. However, CDD and NAO were only observed to be significantly negatively coherence in cycles of 0–4 years from 1975 to 1990. CWD and PDO showed a significant negative coherence with a cycle range of 0–8 years. CWD was observed to exhibit a positive correlation with AO for cycles of 7–9 years during 1976–2012. On the contrary, CWD showed only some local coherence (insignificant) with NAO and PDO over the 60-year period, while it showed a significant positive coherence with SOI over the 1970–1993 period (0–8-year cycle) (b1–b5). The wavelet signal plots of PRCTOP are similar to the wavelet signal plots of NINO3.4 and SOI, with similar years and cycles corresponding to the significance of the two, but with the former showing a significant negative coherence, while the opposite is true for the latter. We observe that PRCTOP exhibits a significant positive coherence with AO mainly in 1972–1996 (7–9 year cycle), and this localized significance is also the same as the significance of PDO mainly in 1980–2002 (3–6 year cycle) (c1–c5). The results of the SDII versus the atmospheric circulation WTC show that (d1–d5), the SDII versus the NINO3.4, SOI and NAO exhibit multiple resonance cycles in different years, but the significance of the former two is located in the 0–8 year cycle, while NAO is distributed in all of them. SDII and AO, on the other hand, exhibit opposite significance in different cycles (7–9 years, 15–17 years) in 1972–1996 and 1986–1992. In contrast, POD showed significant coherence with SDII (over longer periods and time). Rx1day had multiple resonant cycles with NINO3.4 and SOI, but over short time spans. On the contrary, Rx1day shows significant coherence (e1–e5) with AO, NAO, and POD in 1970–1996, 1977–2002, and 1980–2001, respectively (over longer time spans). Rx5day has significant relationships with all the atmospheric circulation patterns, at different cycles, in the case of PDO, in 1982–2002, 1985–2011 showed significant positive/negative coherence (f1–f5) on cycles of 1–6 and 7–15 years, respectively.
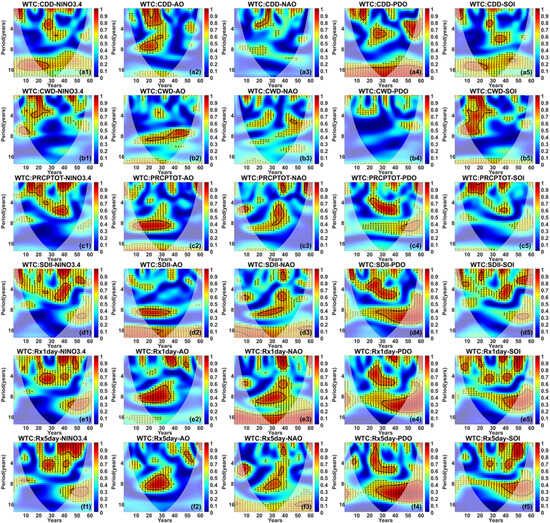
Figure 8.
WTC of atmospheric circulation index and extreme precipitation index in the Jialing River Basin from 1960 to 2020. (The region surrounded by the solid black line represents the significance of the region, and arrows to the left represent negative coherence and to the right represent positive coherence).
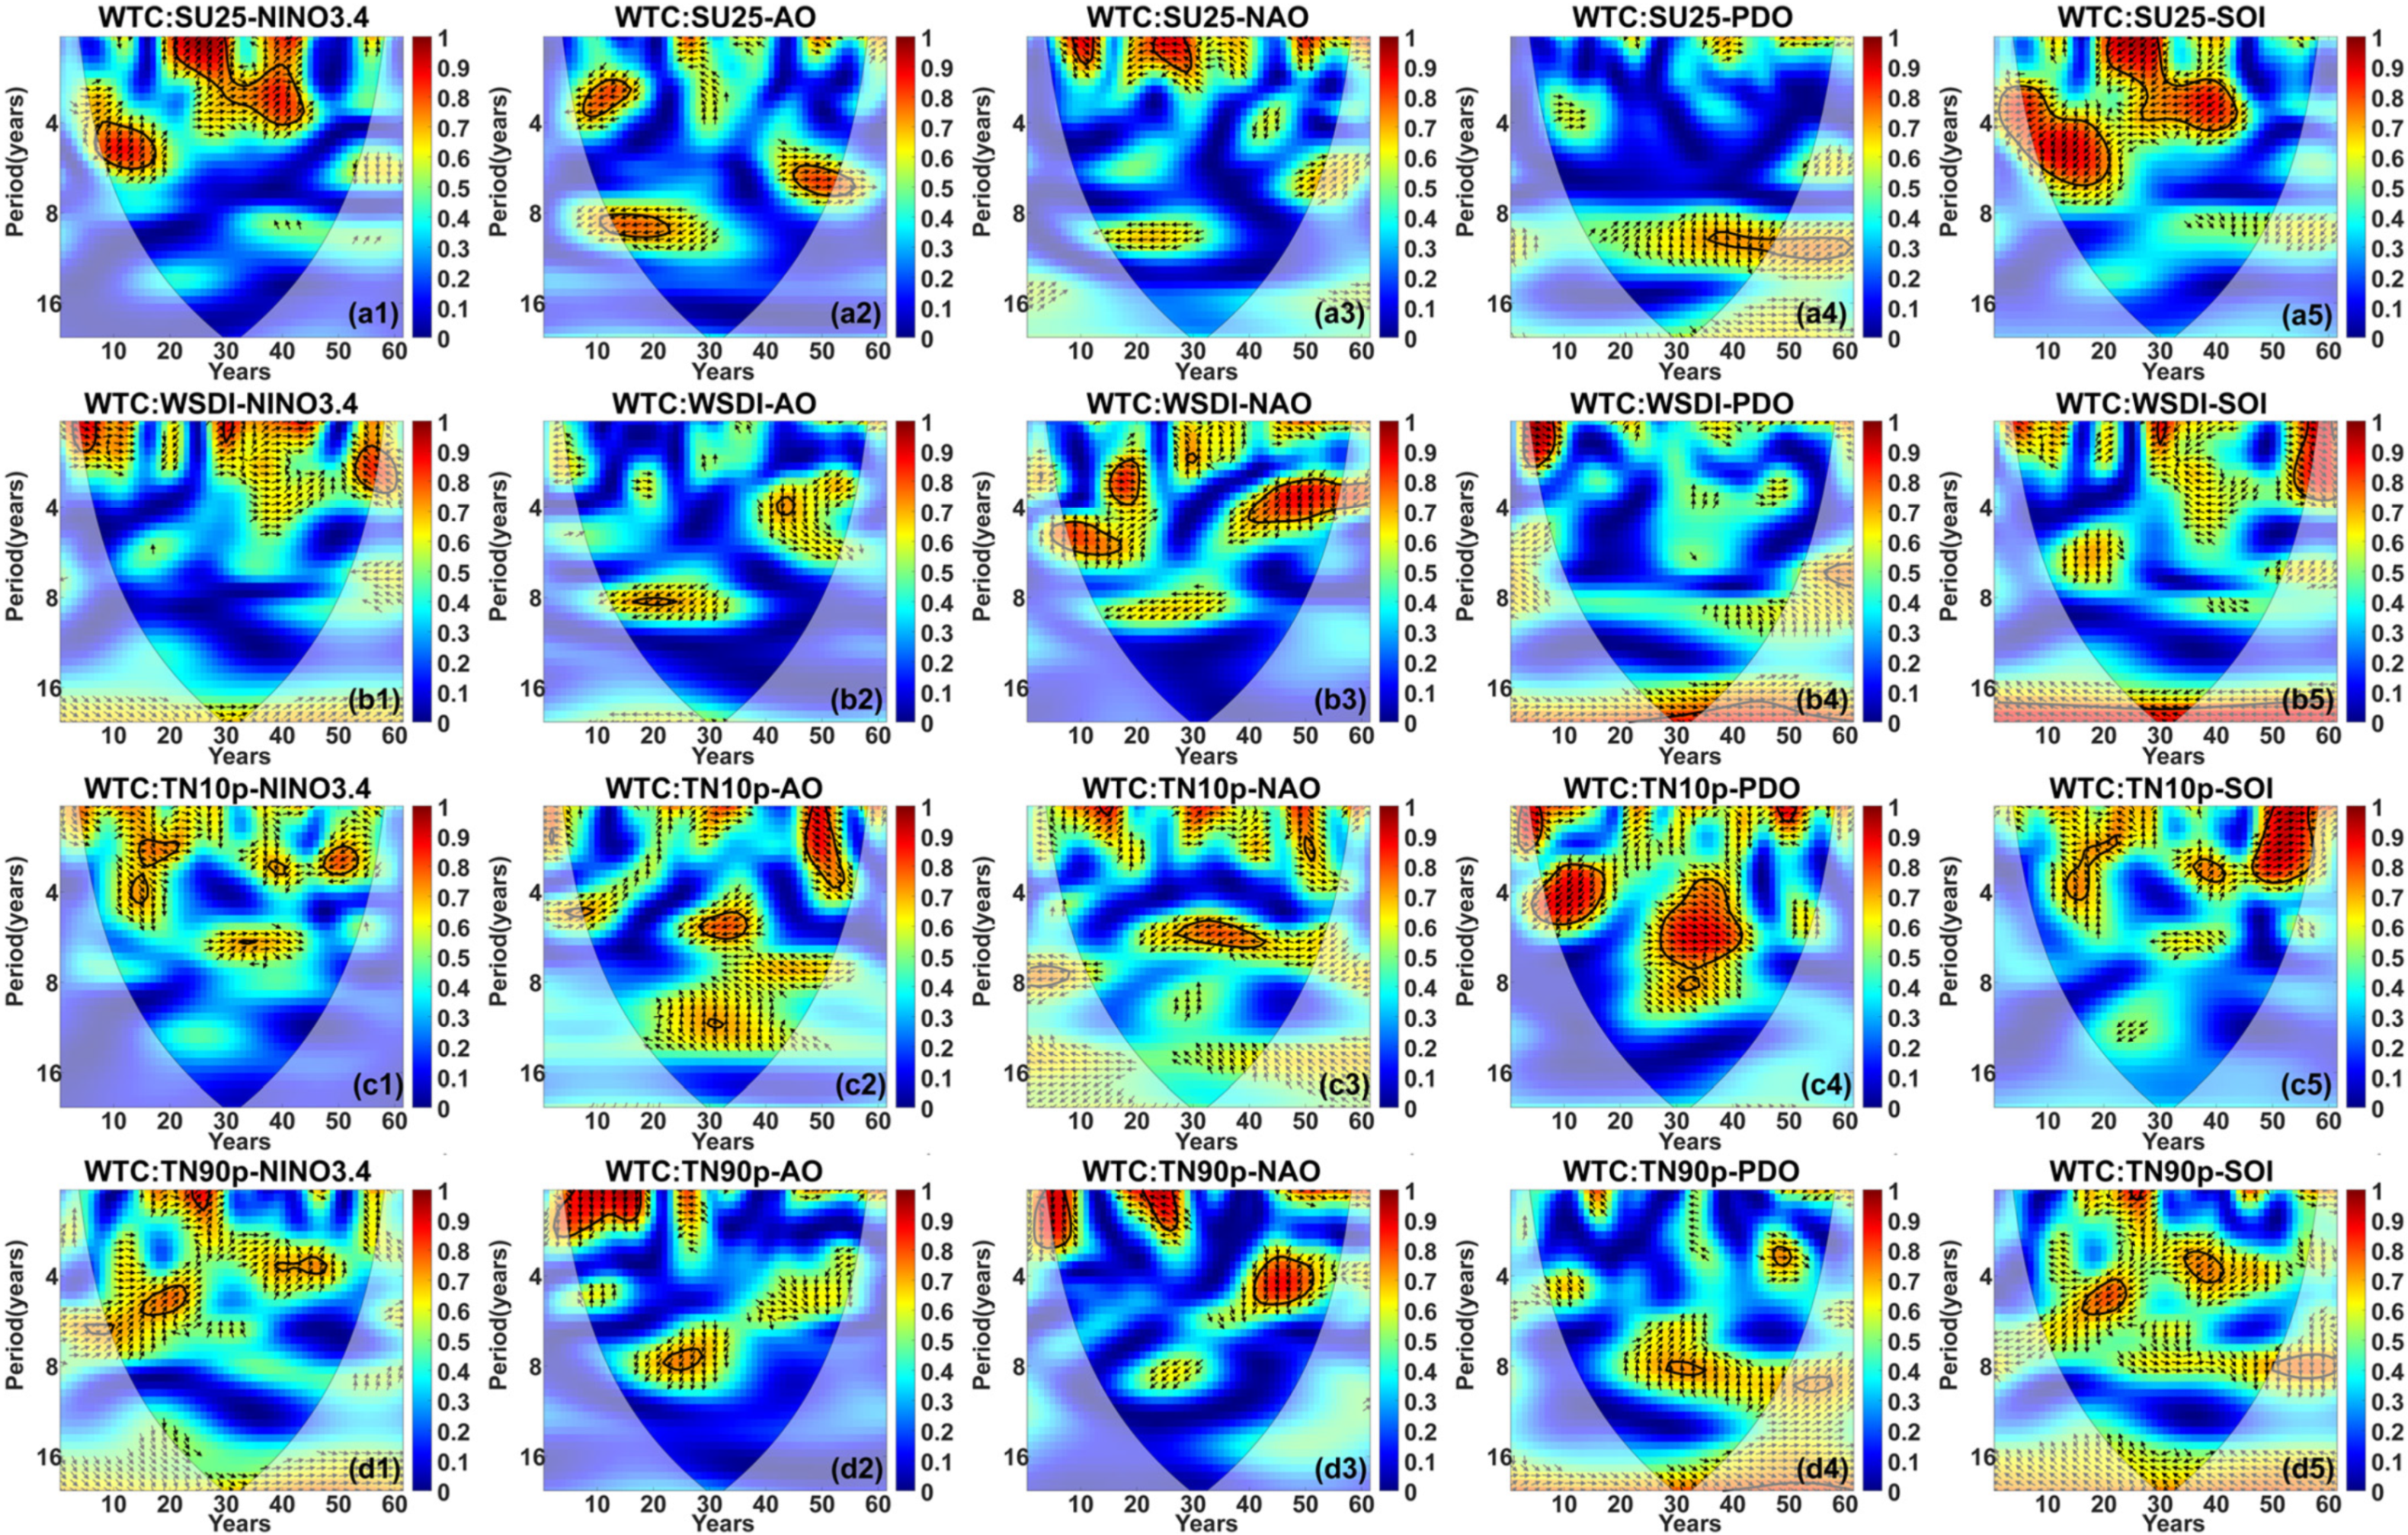
From the results of extreme atmospheric temperature index and WTC (Figure 9) we observe that SU25 is more significantly correlated with NINO3.4 and SOI, with the former showing significant positive correlation in 1969–1978 and 1979–2005 (cycles of 4–6 years and 0–5 years). On the contrary, the latter showed significant negative coherence in 1967–1986 (cycle 2–6 years) and 1980–2005 (cycle 0–5 years). SU25 showed opposite significant correlation with AO and NAO in different cycles and years. And it shows significant positive coherence with POD only in 1994–2007 (8–10 years cycle) (a1–a5). WSDI shows the most significant correlation with NAO (comparing 5 atmospheric circulation indicators), showing significant positive coherence in 1969–1978 (5–6 years cycle) and 1975–1982 (2–4 years cycle), while it shows significant positive coherence in 1996–2014 (3–5 year cycles) show significant negative coherence. SU25 has the weakest coherence with AO, showing negative coherence only in very short years and cycles (b1–b5). Multiple resonance cycles exist for TN10p and NINO3.4, but with shorter spans of years and cycles, and with PDO over much longer spans of years and cycles (1967–1978, 2–5 cycles, 1987–2003, 3–7 year cycles) showed varying significance (c1–c5). TN90p was more strongly coherent with AO and NAO, with AO in 1964–1979 (0–3 year cycles) and 1981–1993 (6–9-year cycle) both showed significant negative coherence, an showed different significance with NAO in 1965–1974 (0–3-year cycle), 1982–1990 (0–3-year cycle) and 2000–2012 (3–6-year cycle). It is noteworthy that the significant coherence zones of TN90p with NINO3.4, PDO, and SOI are small, which suggests that NINO3.4, PDO, and SOI are not the dominant TN90p circulation patterns (d1–d5).
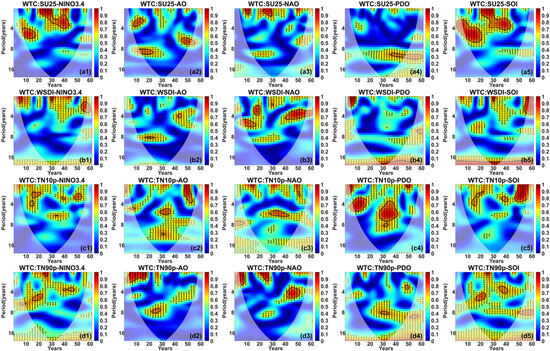
Figure 9.
WTC of atmospheric circulation index and extreme atmospheric temperature index in the Jialing River Basin from 1960 to 2020. (The region surrounded by the solid black line represents the significance of the region, and arrows to the left represent negative coherence and to the right represent positive coherence).
As can be seen (Figure 8 and Figure 9), unlike the linear correlations of local or individual factors, the nonlinearities of the atmospheric circulation patterns with the extreme indices are more pronounced and tend to show significance at different resonance periods and times, which verifies the complex response mechanism of the atmospheric circulation patterns to the climate. Our results also verified that there are linear and nonlinear associations of AO on extreme indices such as Rx1day, Rx5day, SU25, and TN90p. Related studies have shown that the anomalies of NINO3.4 in recent years based on the teleconnection model have caused significant changes in sea surface temperature, which in turn deeply affects the precipitation pattern [52,53]. This also corresponds to the significant nonlinear correlation of NINO3.4 for all extreme precipitation indices in this paper, while its enhancement in recent years corresponds to the phenomenon that CWD indices have declined more significantly after 2000 in JRB. The results of the WTC in this paper (Figure 8(c3,e3,f3)) show the significance of NAO with PRCTOT, Rx1day and Rx5day, and mostly positive correlations in longer periods and years.
There are many causes of extreme climate, which can be categorized into natural and anthropogenic factors [54,55]. There is a real need to study the response mechanism of ACF to extreme climate in order to adapt to the more complex climate change on earth and to formulate appropriate measures. The limitation of this study is that it does not consider the effects of multiple factors or mechanisms on extreme climate, and more cases have confirmed that the co-occurrence of multiple conditions can exacerbate global climate change [56,57]. Meanwhile, human activities are also an important factor in climate change (including emission of greenhouse gases, modification of biomes, etc.), and this effect is more obvious in the 21st century [58,59]. Therefore, the future exploration of extreme climate should consider this as an important factor to improve the accuracy of the outcomes.
4. Conclusions
In this paper, we focus on the influence of natural factors such as atmospheric circulation patterns (ACF). Nowadays, extreme climate events are becoming frequent and widespread [60]. And relevant studies have proved that atmospheric circulation patterns can have an impact on extreme climate (the introduction also mentions numerous studies showing that atmospheric circulation patterns can have an impact on precipitation, temperature, etc.), although the mechanism of such an impact is not yet clear. We comprehensively investigated the interannual and spatial trend characteristics of six extreme precipitation indices and four extreme atmospheric temperature indices, as well as their linear and nonlinear correlations with five atmospheric circulation patterns over the past 60 years in JRB, and the conclusions are as follows.
(1) Interannual variation characteristics: CDD and CWD of the extreme precipitation indices show a decreasing trend, among which CDD shows a significant decreasing trend (p < 0.001) with a rate of 3.0 day/10a. The other indices (PRCTOP, SDII, Rx1day, Rx5day) show a non-significant decreasing trend in the past years. The extreme atmospheric temperature indices all showed significant increase/decrease, with SU25, WSDI, and TN90p increasing at rates of 2.4 day/10a, 1.0 day/10a, and 1.1%/10a, respectively, and TN10p decreasing at a rate of 1.6%/10a. All indices of the JRB fluctuated significantly, with little change in total precipitation, and an increase in atmospheric temperature. Extreme precipitation will be widespread and the basin is slowly warming.
(2) Characteristics of spatial trend changes: Most of the stations in the extreme precipitation indices CDD and CWD show decreasing trends. PRCPTOT, SDII, Rx1day, Rx5dayd are mostly stations trending upward. Most of the declining stations are located in the western and northern regions, and most of the rising stations are located in the southern and northeastern regions. The upward/downward trend in the extreme precipitation index is somewhat regional in nature.
In the extreme atmospheric temperature index, except for TN10p, which shows a decrease, all other indices (SU25, WSDI, TN90p) show increasing trends at most stations. JRB temperatures indices tend to favor a single increasing/decreasing trend on 29 stations.
(3) Linear and nonlinear correlations: There are linear correlations between two of the extreme indices, with both PRCPTOP and SU25 showing extremely significant correlations (p < 0.001) with the three extreme indices, and the increase in the number of high-temperature days over the years in the JRB correspond to the significant increases in WSDI and TN90p. Atmospheric circulation patterns AO, NAO, PDO and NINO3.4 all showed linear relationships with CDD, with AO correlating more significantly with CDD (r = −0.365, p < 0.01). The extreme rainfall indices CDD and CWD are weakly correlated with NAO, and CWD has almost no significant resonance region with PDO. The extreme atmospheric temperature index WSDI is weakly correlated with AO, PDO, and SOI, and RX5day is likewise weakly correlated with PDO, and the significant coherence areas of TN90p with NINO3.4, PDO, and SOI are small, which are not the dominant circulation patterns for the change of TN90p. In addition, there are different significant correlations between the other extreme indices and the atmospheric circulation patterns. In summary, the nonlinear relationship of the extreme indices is more pronounced, and atmospheric circulation patterns tend to have more complex response mechanisms to extreme climate.
Author Contributions
L.L., investigation, methodology, data analysis, writing—original draft preparation; S.R., investigation, writing—review and editing; J.D., writing—review and editing, data acquisition; A.S., supervision; J.M., data acquisition; S.Q., editing. All authors have read and agreed to the published version of the manuscript.
Funding
The financial support for this work was received from the National Natural Science Foundation of China (No. 52150410408), the Science and Technology Planning Project of Guangxi, China (No. AB 22035075), and the Science and Technology Plan Project of Guilin (No. 20220114-2).
Data Availability Statement
The data presented in this study are available on request from the corresponding author.
Conflicts of Interest
The authors declare no conflicts of interest.
References
- Ai, X.; Han, Z.; Zhang, Q. Extreme Weather Experience and Climate Change Risk Perceptions: The Roles of Partisanship and Climate Change Cause Attribution. Int. J. Disaster Risk Reduct. 2024, 108, 104511. [Google Scholar] [CrossRef]
- Patwary, M.M.; Bardhan, M.; Haque, M.A.; Moniruzzaman, S.; Gustavsson, J.; Khan, M.M.H.; Koivisto, J.; Salwa, M.; Mashreky, S.R.; Rahman, A.K.M.F.; et al. Impact of Extreme Weather Events on Mental Health in South and Southeast Asia: A Two Decades of Systematic Review of Observational Studies. Environ. Res. 2024, 250, 118436. [Google Scholar] [CrossRef] [PubMed]
- Vo, T.-H.; Liou, Y.-A. Four-Decade Spring Droughts in Taiwan. J. Hydrol. Reg. Stud. 2024, 54, 101849. [Google Scholar] [CrossRef]
- Zhu, Y.; Song, F.; Guo, D. Interdecadal Changes in the Frequency of Winter Extreme Cold Events in North China during 1989–2021. Atmos. Ocean. Sci. Lett. 2024, 17, 100468. [Google Scholar] [CrossRef]
- Richards-Thomas, T.S.; Déry, S.J.; Stewart, R.E.; Thériault, J.M. Climatological Context of the Mid-November 2021 Floods in the Province of British Columbia, Canada. Weather Clim. Extrem. 2024, 45, 100705. [Google Scholar] [CrossRef]
- Luedders, J.; Poole, J.A.; Rorie, A.C. Extreme Weather Events and Asthma. Immunol. Allergy Clin. N. Am. 2024, 44, 35–44. [Google Scholar] [CrossRef] [PubMed]
- Rostami, M.; Green-Mignacca, S.; Bucking, S. Weather Data Analysis and Building Performance Assessment during Extreme Climate Events: A Canadian AMY Weather File Data Set. Data Brief 2024, 52, 110036. [Google Scholar] [CrossRef] [PubMed]
- Zhang, W.; Liu, L.; Li, X.; Cheng, L.; Cheng, Y.; Li, H. Intensified Response of Extreme Precipitation to Rising Temperature over the Tibetan Plateau from CMIP6 Multi-Model Ensembles. J. Hydrol. 2024, 637, 131397. [Google Scholar] [CrossRef]
- Xu, F.; Zhao, L.; Zhou, Y.; Yang, J.; Jing, W.; Deng, Y.; Li, Z. Impacts of Extreme Precipitation on Water Conservation in Beijiang River Basin, China. J. Hydrol. 2024, 637, 131299. [Google Scholar] [CrossRef]
- Sun, P.; Bian, Y.; Yu, S.; Yao, R.; Wang, Z.; Zhang, Q.; Chen, W.; Ge, C.; Ma, Z.; Du, W. Are Longer and More Intense Heatwaves More Prone to Extreme Precipitation? Glob. Planet. Chang. 2024, 236, 104428. [Google Scholar] [CrossRef]
- Ren, Z.; Zhao, H.; Shi, K.; Yang, G. Spatial and Temporal Variations of the Precipitation Structure in Jiangsu Province from 1960 to 2020 and Its Potential Climate-Driving Factors. Water 2023, 15, 4032. [Google Scholar] [CrossRef]
- Xu, Q.; Jiao, J.; Yan, Z.; Liao, J.; Zhang, Z.; Li, M.; Yan, X.; Chen, Y.; Li, J.; Jian, J. Response of Road Erosion to Hydrological Connectivity under a Heavy Rainstorm in an Agricultural Watershed on the Loess Plateau. CATENA 2024, 240, 107991. [Google Scholar] [CrossRef]
- Sun, J.; Liu, T.; Xie, S.; Xiao, J.; Huang, L.; Wan, Z.; Zhong, K. Will Extreme Temperature Events Emerge Earlier under Global Warming? Atmos. Res. 2023, 288, 106745. [Google Scholar] [CrossRef]
- Chikoore, H.; Mbokodo, I.L.; Singo, M.V.; Mohomi, T.; Munyai, R.B.; Havenga, H.; Mahlobo, D.D.; Engelbrecht, F.A.; Bopape, M.-J.M.; Ndarana, T. Dynamics of an Extreme Low Temperature Event over South Africa amid a Warming Climate. Weather Clim. Extrem. 2024, 44, 100668. [Google Scholar] [CrossRef]
- Yu, M.G.; Mukherjee, M.; Poudel, S.; Bender, S.R.; Hanif, S.; Hardy, T.D.; Reeve, H.M. A Valuation Framework for Customers Impacted by Extreme Temperature-Related Outages. Appl. Energy 2024, 368, 123450. [Google Scholar] [CrossRef]
- Zohrabi, N.; Massah Bavani, A.; Goodarzi, E.; Eslamian, S. Attribution of Temperature and Precipitation Changes to Greenhouse Gases in Northwest Iran. Quat. Int. 2014, 345, 130–137. [Google Scholar] [CrossRef]
- Li, H.; He, S.; Yuan, X.; Liu, Y.; Yan, Y. The Contrast Responses of August Precipitation over Northeast China to Strong and Moderate Developing El Niño. Atmos. Res. 2024, 304, 107378. [Google Scholar] [CrossRef]
- Wang, F.; Lai, H.; Men, R.; Sun, K.; Li, Y.; Feng, K.; Tian, Q.; Guo, W.; Du, X.; Qu, Y. Spatial and Temporal Evolutions of Terrestrial Vegetation Drought and the Influence of Atmospheric Circulation Factors across the Mainland China. Ecol. Indic. 2024, 158, 111455. [Google Scholar] [CrossRef]
- Sun, W.; Li, J.; Yu, R.; Li, N.; Zhang, Y. Exploring Changes of Precipitation Extremes under Climate Change through Global Variable-Resolution Modeling. Sci. Bull. 2024, 69, 237–247. [Google Scholar] [CrossRef]
- Dong, H.; Huang, S.; Wang, H.; Shi, H.; Singh, V.P.; She, D.; Huang, Q.; Leng, G.; Gao, L.; Wei, X.; et al. Effects of Interaction of Multiple Large-Scale Atmospheric Circulations on Precipitation Dynamics in China. Sci. Total Environ. 2024, 923, 171528. [Google Scholar] [CrossRef]
- Gao, M.; Yang, Y.; Shi, H.; Gao, Z. SOM-Based Synoptic Analysis of Atmospheric Circulation Patterns and Temperature Anomalies in China. Atmos. Res. 2019, 220, 46–56. [Google Scholar] [CrossRef]
- García-Burgos, M.; Gómara, I.; Rodríguez-Fonseca, B.; González-Alemán, J.J.; Zurita-Gotor, P.; Ayarzagüena, B. Abrupt and Persistent Atmospheric Circulation Changes in the North Atlantic under La Niña Conditions. Weather Clim. Extrem. 2023, 42, 100609. [Google Scholar] [CrossRef]
- Jong, S.-I.; Pak, Y.-I.; Om, K.-C.; Ham, Y.-S.; Kim, H.-U.; Paek, U.S. An Abrupt Change of Winter Surface Air Temperature over the Northern Part of Korean Peninsula in the Late 1980s and Related Atmospheric Circulation Variability. Atmos. Res. 2023, 290, 106803. [Google Scholar] [CrossRef]
- Lorenzo-Lacruz, J.; Morán-Tejeda, E.; Vicente-Serrano, S.M.; Hannaford, J.; García, C.; Peña-Angulo, D.; Murphy, C. Streamflow Frequency Changes across Western Europe and Interactions with North Atlantic Atmospheric Circulation Patterns. Glob. Planet. Change 2022, 212, 103797. [Google Scholar] [CrossRef]
- Ren, Y.; Xia, J.; Zeng, S.; Song, J.; Tang, X.; Yang, L.; Lv, P.; Fan, D. Identifying Critical Regions for Nitrogen and Phosphorus Loss Management in a Large-Scale Complex Basin: The Jialing River. Environ. Res. 2023, 232, 116359. [Google Scholar] [CrossRef] [PubMed]
- Chen, Y.; Ran, Y.; Chen, F.; Wang, S.; Hu, M.; Hou, T.; Zhao, X.; Yue, W.; Zhang, H. Examining the 2022 Drought Event in the Past and Future Discharge Changes of the Upper Jialing River from a Tree-Ring Perspective. J. Hydrol. Reg. Stud. 2024, 53, 101824. [Google Scholar] [CrossRef]
- Wang, Y.; Liang, L.; Chen, X.; Zhang, Y.; Zhang, F.; Xu, F.; Zhang, T. The Impact of River Sand Mining on Remobilization of Lead and Cadmium in Sediments—A Case Study of the Jialing River. Ecotoxicol. Environ. Saf. 2022, 246, 114144. [Google Scholar] [CrossRef]
- Xu, F.; Jia, Y.; Wang, Y.; Zhang, F.; Li, L.; Li, Y.; Ren, L.; Wang, D.; Zhang, T. Does Sand Mining Affect the Remobilization of Copper and Zinc in Sediments?—A Case Study of the Jialing River (China). Environ. Res. 2021, 200, 111416. [Google Scholar] [CrossRef]
- Zhang, S.; Li, W.; An, W.; Hou, J.; Hou, X.; Tang, C.; Gan, Z. Temporal and Spatial Evolutionary Trends of Regional Extreme Precipitation under Different Emission Scenarios: Case Study of the Jialing River Basin, China. J. Hydrol. 2023, 617, 129156. [Google Scholar] [CrossRef]
- Yu, J.; Zou, L.; Xia, J.; Dou, M.; Wang, F.; Chen, X. Characterizing Future Changes in Compound Flood Risk by Capturing the Dependence between Rainfall and River Flow: An Application to the Yangtze River Basin, China. J. Hydrol. 2024, 635, 131175. [Google Scholar] [CrossRef]
- Multi-Timescale Changes of Water Temperature Due to the Three Gorges Reservoir and Climate Change in the Yangtze River, China. Ecol. Indic. 2023, 148, 110129. [CrossRef]
- Sun, J.; Lei, X.; Tian, Y.; Liao, W.; Wang, Y. Hydrological Impacts of Climate Change in the Upper Reaches of the Yangtze River Basin. Quat. Int. 2013, 304, 62–74. [Google Scholar] [CrossRef]
- Wang, Y.; Gong, J.; Zhu, Y. Integrating Social-Ecological System into Watershed Ecosystem Services Management: A Case Study of the Jialing River Basin, China. Ecol. Indic. 2024, 160, 111781. [Google Scholar] [CrossRef]
- Gemmer, M.; Becker, S.; Jiang, T. Observed Monthly Precipitation Trends in China 1951–2002. Theor. Appl. Climatol. 2004, 77, 39–45. [Google Scholar] [CrossRef]
- Sun, Y.; Zhu, R.; Wang, T. Projection of Extreme Climate Change in the Asian Arid Region and the Tibetan Plateau in the Early and Middle 21st Century Based on NEX-GDDP-CMIP6. Atmos. Ocean. Sci. Lett. 2024, 100534. [Google Scholar] [CrossRef]
- Dong, Y.; Zhai, J.; Zhao, Y.; Liu, Z.; Yang, Q.; Jiang, S.; Lv, Z.; Yan, D.; Liu, K.; Ding, Z. Impacts of Large-Scale Circulation Patterns on the Temperature Extremes in the Cold Regions of China with Global Warming. Front. Earth Sci. 2023, 11, 1120800. [Google Scholar] [CrossRef]
- Jalkanen, L. WMO/IGAC Impacts of Megacities on Air Pollution and Climate. Urban Clim. 2012, 1, 67–68. [Google Scholar] [CrossRef]
- Fattah, M.A.; Hasan, M.M.; Dola, I.A.; Morshed, S.R.; Chakraborty, T.; Kafy, A.-A.; Alsulamy, S.; Khedher, K.M.; Shohan, A.A.A. Implications of Rainfall Variability on Groundwater Recharge and Sustainable Management in South Asian Capitals: An in-Depth Analysis Using Mann Kendall Tests, Continuous Wavelet Coherence, and Innovative Trend Analysis. Groundw. Sustain. Dev. 2024, 24, 101060. [Google Scholar] [CrossRef]
- Huang, R.; Hanif, M.F.; Siddiqui, M.K.; Hanif, M.F. On Analysis of Entropy Measure via Logarithmic Regression Model and Pearson Correlation for Tri-s-Triazine. Comput. Mater. Sci. 2024, 240, 112994. [Google Scholar] [CrossRef]
- Aisbett, J. Interpreting Tests of a Hypothesis at Multiple Alpha Levels within a Neyman–Pearson Framework. Stat. Probab. Lett. 2023, 201, 109899. [Google Scholar] [CrossRef]
- Mohan, M.G.; Fathima, S.; Adarsh, S.; Baiju, N.; Arathy Nair, G.R.; Meenakshi, S.; Soumya Krishnan, M. Analyzing the Streamflow Teleconnections of Greater Pampa Basin, Kerala, India Using Wavelet Coherence. Phys. Chem. Earth Parts A/B/C 2023, 131, 103446. [Google Scholar] [CrossRef]
- Hou, X.; Zhang, S.; Ruan, Q.; Tang, C. Synergetic Impact of Climate and Vegetation Cover on Runoff, Sediment, and Nitrogen and Phosphorus Losses in the Jialing River Basin, China. J. Clean. Prod. 2022, 361, 132141. [Google Scholar] [CrossRef]
- Meng, C.; Dong, Z.; Liu, K.; Wang, Y.; Zhang, Y.; Zhu, Y. Identification and Analysis of Evolution Characteristics of Flash Drought Based on Three-Dimensional Perspective: A Case Study in the Jialing River Basin. Urban Clim. 2024, 53, 101803. [Google Scholar] [CrossRef]
- Li, X.; Sha, J.; Wang, Z.-L. Comparison of Drought Indices in the Analysis of Spatial and Temporal Changes of Climatic Drought Events in a Basin. Environ. Sci. Pollut. Res. 2019, 26, 10695–10707. [Google Scholar] [CrossRef]
- Zeng, X.; Zhao, N.; Sun, H.; Ye, L.; Zhai, J. Changes and Relationships of Climatic and Hydrological Droughts in the Jialing River Basin, China. PLoS ONE 2015, 10, e0141648. [Google Scholar] [CrossRef]
- Zhang, J.; Zhang, M.; Song, Y.; Lai, Y. Hydrological Simulation of the Jialing River Basin Using the MIKE SHE Model in Changing Climate. J. Water Clim. Chang. 2021, 12, 2495–2514. [Google Scholar] [CrossRef]
- Herath, I.K.; Ye, X.; Wang, J.; Bouraima, A.-K. Spatial and Temporal Variability of Reference Evapotranspiration and Influenced Meteorological Factors in the Jialing River Basin, China. Theor. Appl. Climatol. 2018, 131, 1417–1428. [Google Scholar] [CrossRef]
- Zhang, T.; Zhang, X.; Xia, D.; Liu, Y. An Analysis of Land Use Change Dynamics and Its Impacts on Hydrological Processes in the Jialing River Basin. Water 2014, 6, 3758–3782. [Google Scholar] [CrossRef]
- Shang, S.; Yang, X.; Hu, J.; Wang, L.; Zhang, T. Millennial and Suborbital-Scale El Niño/Southern Oscillation Control of Climate Variability in Southern China over the Past 70 ka. Palaeogeogr. Palaeoclimatol. Palaeoecol. 2024, 637, 111987. [Google Scholar] [CrossRef]
- Zhou, B.; Qian, J.; Zhou, J.; Han, T.; Sun, B. Strengthening of the Relationship between West China Autumn Rain and Arctic Oscillation in the Mid-1980s. Atmos. Res. 2022, 265, 105916. [Google Scholar] [CrossRef]
- Cui, H.; Deng, W.; Liu, X.; Kang, H.; Chen, X.; Zeng, T.; Cai, G.; Zhao, J.; Wei, G. Possible Link between Decadal Variability in Precipitation in the South China Sea and the North Atlantic Oscillation during the 20th Century: A Perspective from Coral Geochemical Records. Palaeogeogr. Palaeoclimatol. Palaeoecol. 2022, 601, 111118. [Google Scholar] [CrossRef]
- Wang, T.; Gou, X.; Wang, X.; Liu, H.; Xie, F. Equatorward Shift of ENSO-Related Subtropical Jet Anomalies in Recent Decades. Atmos. Res. 2024, 297, 107109. [Google Scholar] [CrossRef]
- Khouakhi, A.; Villarini, G.; Zhang, W.; Slater, L.J. Seasonal Predictability of High Sea Level Frequency Using ENSO Patterns along the U.S. West Coast. Adv. Water Resour. 2019, 131, 103377. [Google Scholar] [CrossRef]
- Giannaros, T.M.; Papavasileiou, G. Changes in European Fire Weather Extremes and Related Atmospheric Drivers. Agric. For. Meteorol. 2023, 342, 109749. [Google Scholar] [CrossRef]
- Wang, Y.; Wu, Y.; Han, Z. Extreme Weather and Residents’ pro-Environmental Behaviors. Front. Environ. Sci. 2022, 10, 1030010. [Google Scholar] [CrossRef]
- Pascual, L.S.; Segarra-Medina, C.; Gómez-Cadenas, A.; López-Climent, M.F.; Vives-Peris, V.; Zandalinas, S.I. Climate Change-Associated Multifactorial Stress Combination: A Present Challenge for Our Ecosystems. J. Plant Physiol. 2022, 276, 153764. [Google Scholar] [CrossRef] [PubMed]
- Global Warming, Climate Change, and Environmental Pollution: Recipe for a Multifactorial Stress Combination Disaster. Trends Plant Sci. 2021, 26, 588–599. [CrossRef]
- Chen, J.; Pu, J.; Li, J.; Zhang, T. Response of Carbon- and Water-Use Efficiency to Climate Change and Human Activities in China. Ecol. Indic. 2024, 160, 111829. [Google Scholar] [CrossRef]
- He, Y.; Lin, C.; Wu, C.; Pu, N.; Zhang, X. The Urban Hierarchy and Agglomeration Effects Influence the Response of NPP to Climate Change and Human Activities. Glob. Ecol. Conserv. 2024, 51, e02904. [Google Scholar] [CrossRef]
- Hedayatnezhad Kashi, S.M.; Farrokhzadeh, S.; Baharvandi, S.; Hashemkhani Zolfani, S. Effects of Extreme Weather Events and Climate Change on Cities’ Livability. Cities 2024, 151, 105114. [Google Scholar] [CrossRef]


Disclaimer/Publisher’s Note: The statements, opinions and data contained in all publications are solely those of the individual author(s) and contributor(s) and not of MDPI and/or the editor(s). MDPI and/or the editor(s) disclaim responsibility for any injury to people or property resulting from any ideas, methods, instructions or products referred to in the content. |
© 2024 by the authors. Licensee MDPI, Basel, Switzerland. This article is an open access article distributed under the terms and conditions of the Creative Commons Attribution (CC BY) license (https://creativecommons.org/licenses/by/4.0/).