Article

Water Storage–Discharge Relationship with Water Quality Parameters of Carhuacocha and Vichecocha Lagoons in the Peruvian Puna Highlands

by
Samuel Pizarro
1,*,
Maria Custodio
2,
Richard Solórzano-Acosta
1,
Duglas Contreras
1 and
Patricia Verástegui-Martínez
1
1
Dirección de Supervisión y Monitoreo en las Estaciones Experimentales Agrarias, Instituto Nacional de Innovación Agraria (INIA), Carretera Saños Grande−Hualahoyo Km 8 Santa Ana, Huancayo, Junin 12002, Peru
2
Facultad de Medicina Humana, Centro de Investigación en Medicina de Altura y Medio Ambiente, Universidad Nacional del Centro del Peru Av. Mariscal Castilla N° 3909, Huancayo, Junin 12002, Peru
*
Author to whom correspondence should be addressed.
Water 2024, 16(17), 2505; https://doi.org/10.3390/w16172505 (registering DOI)
Submission received: 9 July 2024 / Revised: 8 August 2024 / Accepted: 13 August 2024 / Published: 4 September 2024
(This article belongs to the Section Water Quality and Contamination)

Abstract

:
Most Andean lakes and lagoons are used as reservoirs to manage hydropower generation and cropland irrigation, which, in turn, alters river flow patterns through processes of storage and discharge. The Carhuacocha and Vichecocha lagoons, fed by glaciers, are important aquatic ecosystems regulated by dams. These dams increase the flow of the Mantaro River during the dry season, supporting both energy production and irrigation for croplands. Water quality in the Carhuacocha and Vichecocha lagoons was assessed between storage and discharge events by using the Canadian Council of Ministers of the Environment Water Quality Index (CCME WQI) and multivariate statistical methods. The quality of both lagoons is excellent during the storage period; however, it decreases when they are discharged during the dry season. The most sensitive parameters are pH, dissolved oxygen (DO), and biochemical oxygen demand (BOD). This paper details the changes in water quality in the Carhuacocha and Vichecocha lagoons during storage and discharge events.

1. Introduction

The growth in population, coupled with economic expansion and urban industrial development, has led to an increased demand for water in both urban areas and agricultural lands. In Peru, nearly nine million residents of Lima depend on highland water bodies for nearly half of their drinking water [1], while highland populations use intermontane valleys for agricultural activities [2]. Similarly, hydropower developments depend on highland lakes and water transfer, which modify river flow patterns. In order to overcome these issues, most parts of the Andean lakes and lagoons are dammed to provide an essential freshwater resource, modifying in the process the characteristics of the ecosystems’ hotspots for biological species through a complex interaction between geographical reconfiguration and, therefore, changing the sociopolitical scene [3]. Climate change has led to alterations in rainfall patterns and higher temperatures in highland regions. This has led to heavy rainfall events, and current trends indicate that these changes are likely to persist, resulting in increased runoff [4] and glacier retreat [5]. Consequently, flood runoff is a potential pollution source for Andean lagoons.
Water quality is a critical environmental concern globally that must be assessed across various contexts to safeguard public health and safety. It should also be integrated into policies to prevent specific hazards through an adaptable and participatory approach [6]. The diminishing of water quality restricts the potential uses of freshwater sources and adversely impacts ecosystems related to them by leading to conditions such as hypoxia (low oxygen levels), excessive algal growth (algal blooms), reduced species diversity, and the accumulation of heavy metals and toxins [7]. Lagoons acquire basin-specific characteristics which make them unique. Even if they are in the same area, they can respond differently to similar stimuli.
The Peruvian Environmental Quality Standard (EQS) for water [8] regulates 104 parameters and categorizes water use into four distinct groups: public and recreational use; cultivation, extraction, and other coastal and inland fishfarming activities; irrigation of crops and livestock watering; and the preservation of aquatic ecosystems. Regarding each water body, it is necessary to measure certain parameters, according to the National Classification of the Superficial Continental Water Bodies [9]. Lagoons are in category four. For this study, the physical, chemical, and microbiological parameters specified in the methodology were evaluated. These parameters influence habitats and the diversity of biological communities, and their impacts are managed through the analysis of various environmental indicators According to Panhwar et al. [10], pH and electrical conductivity (EC) are some of the most important parameters for biological processes.
The Carhuacocha and Vichecocha lagoons are aquatic ecosystems sustained by glaciers and the runoff from other small glacier-fed ponds. They hold significant economic value as they regulate dams designed to enhance the flow of the Mantaro River during the dry season, thereby supporting cropland irrigation and electricity generation at the Santiago Antúnez de Mayolo hydroelectric power plant [11]. These areas are considered as habitats for an array of bird species. Their administration, which is in charge of the Nor yauyos Cochas Landscape reserve, has the objective of preserving biodiversity while regulating human activities around the lagoons.
Due to the unpredictable nature of floods, the complexity of hydrodynamic processes, and harsh environmental conditions, conducting field experiments is very challenging. Consequently, there is still a lack of field measurements and simulation studies on the effects of flood discharge for canyon-shaped drinking water reservoirs. In addition, there is limited research on the water quality of regulated lagoons in Peru. To fill this knowledge gap, we conducted this research to assess the impact of storage–discharge events on the physical−chemical properties of water in the Carhuacocha and Vichecocha lagoons. Water quality data were collected in situ during storage and discharge events of these two lagoons, while assessment was conducted using the Canadian Council of Ministers of the Environment Water Quality Index (CCME WQI) and multivariate statistical methods.

2. Materials and Methods
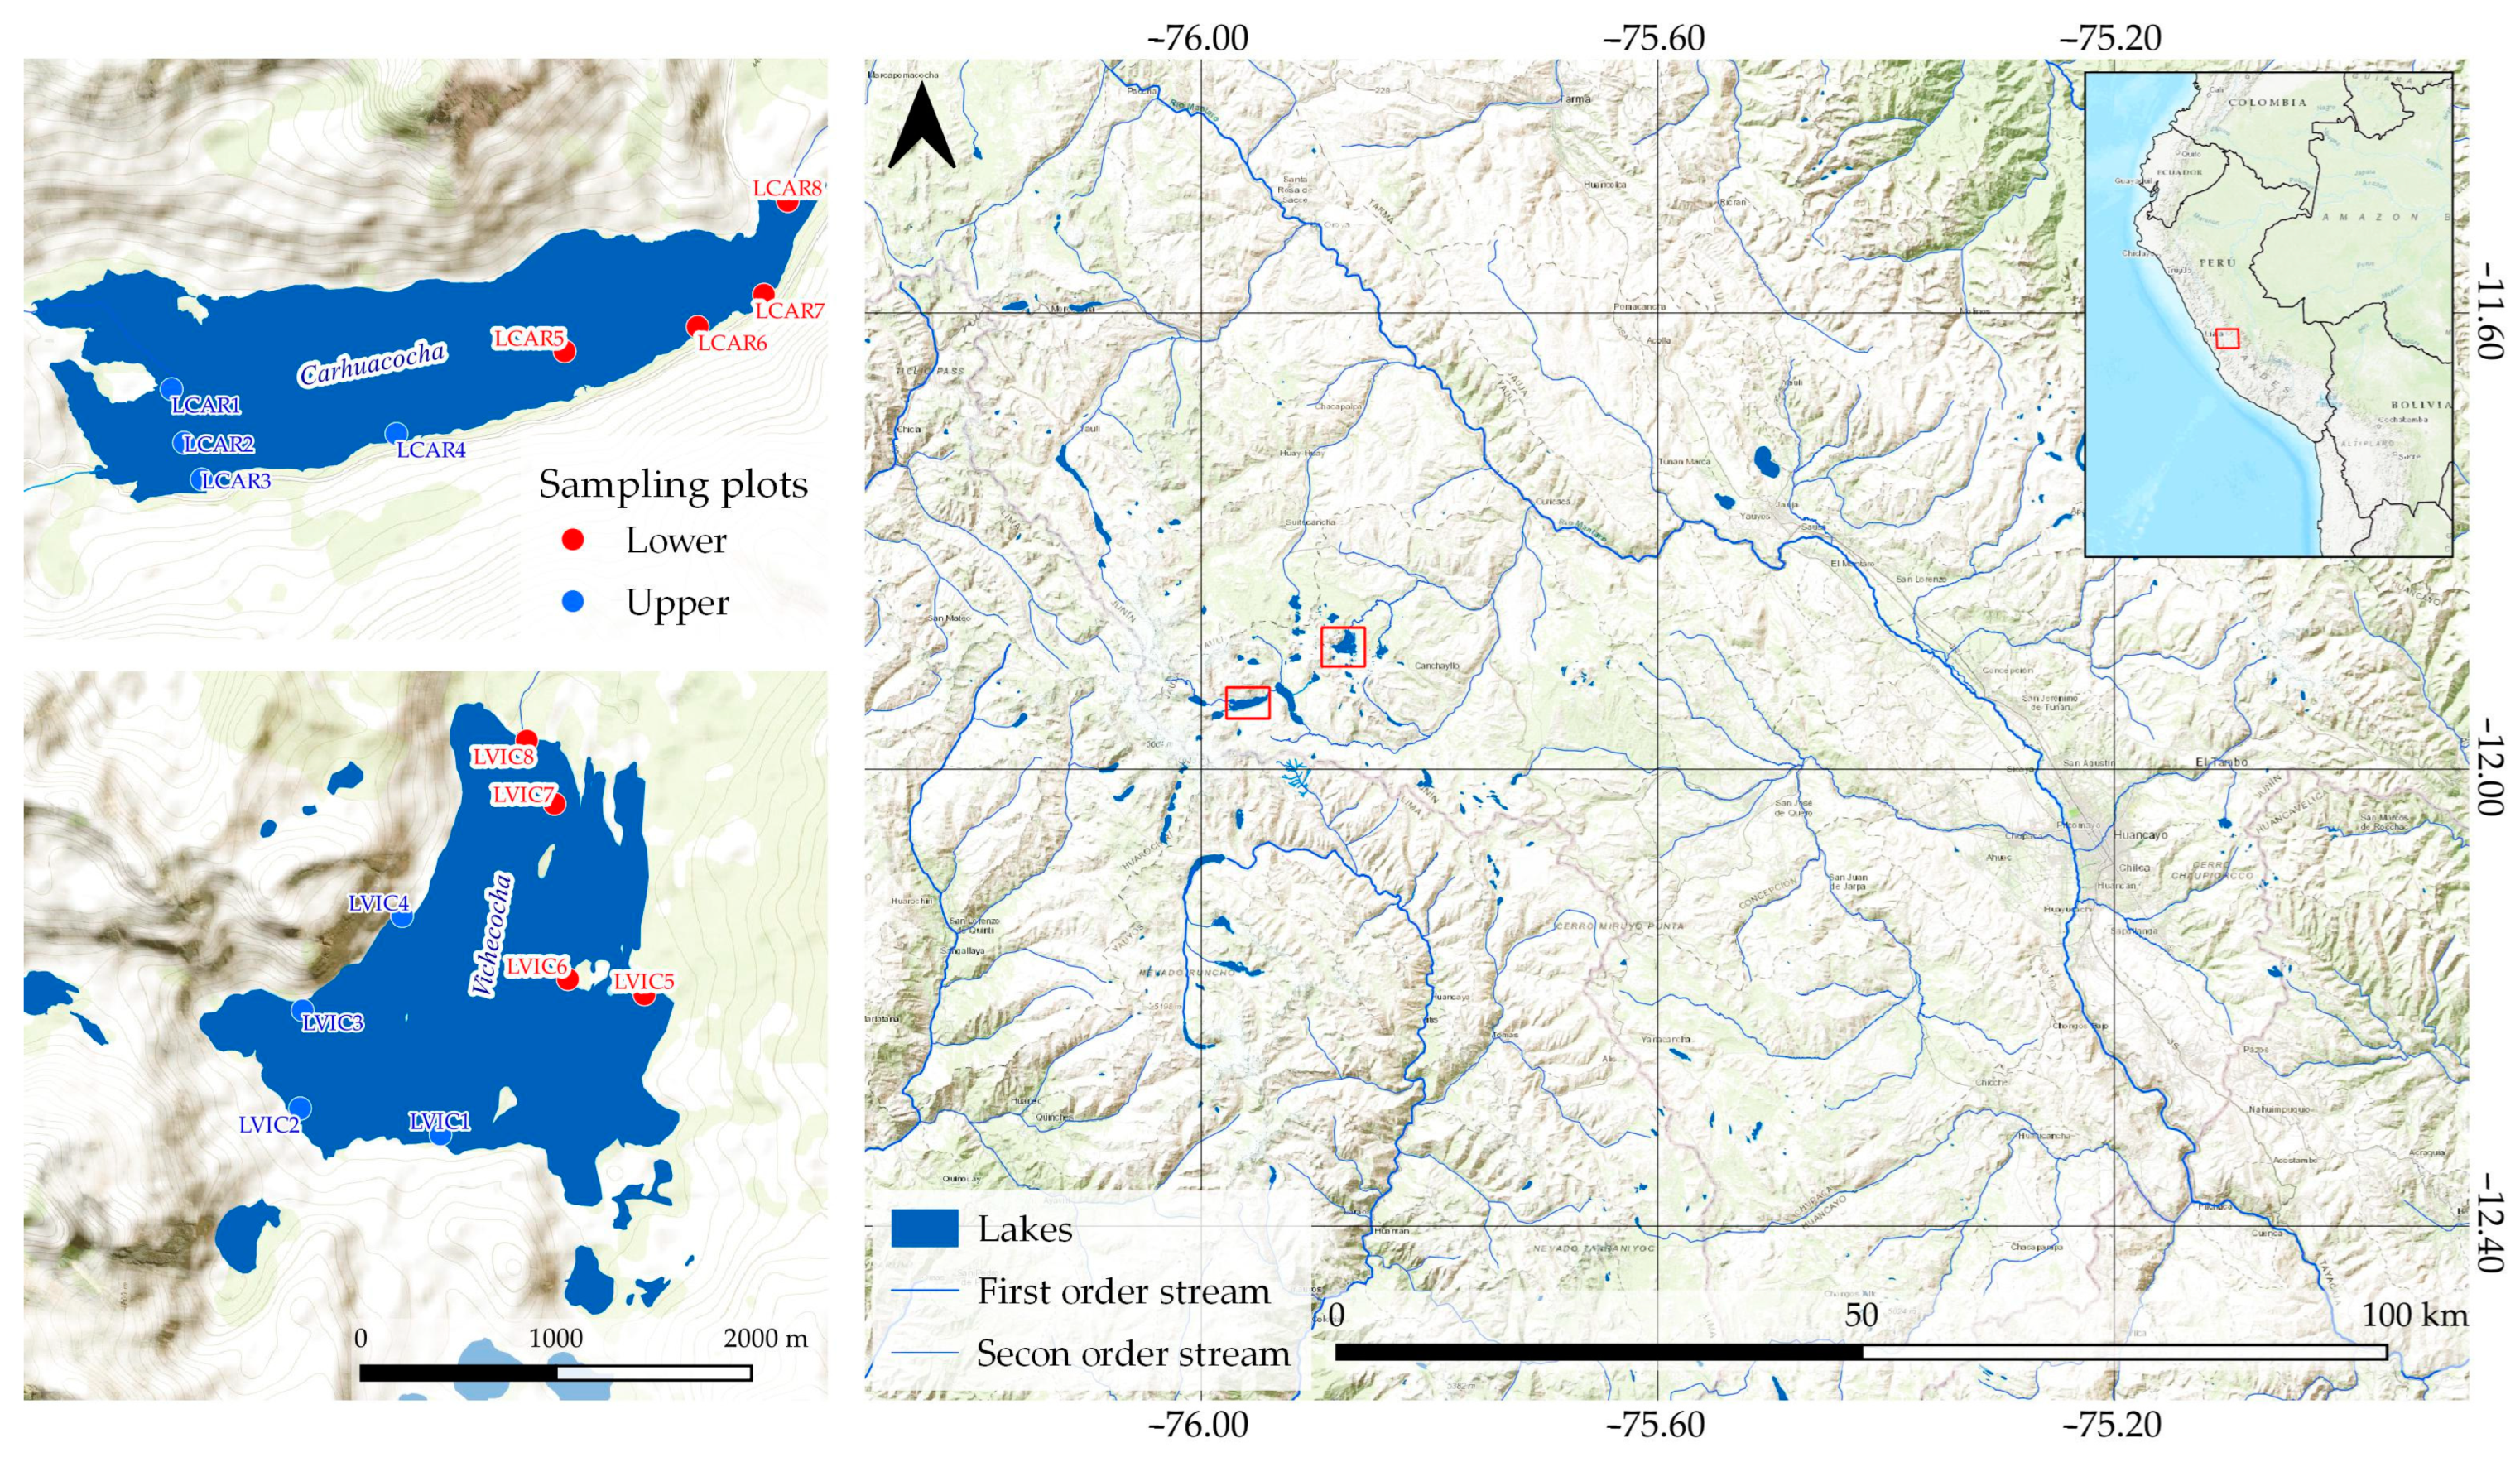
2.1. Study Area

The Carhuacocha and Vichecocha lagoons are situated at the head of the Pachacayo river sub-basin, within the Mantaro basin, at elevations of 4420 and 4480 m.a.s.l., respectively. They are surrounded by moraine and puna grasslands. These lagoons are in the territory of the Tupac Amaru livestock system, affiliated with the Canchayllo community and managed under the Nor Yauyos Cochas Landscape Reserve (Figure 1). The climate in this area is cold, with an average annual temperature of 3.4 °C and annual precipitation reaching 814 mm. Rainfall typically occurs from January to March, with dry periods from June to August. However, rainfall increases between August and September, becoming more significant from October until reaching maximum values in February [12].

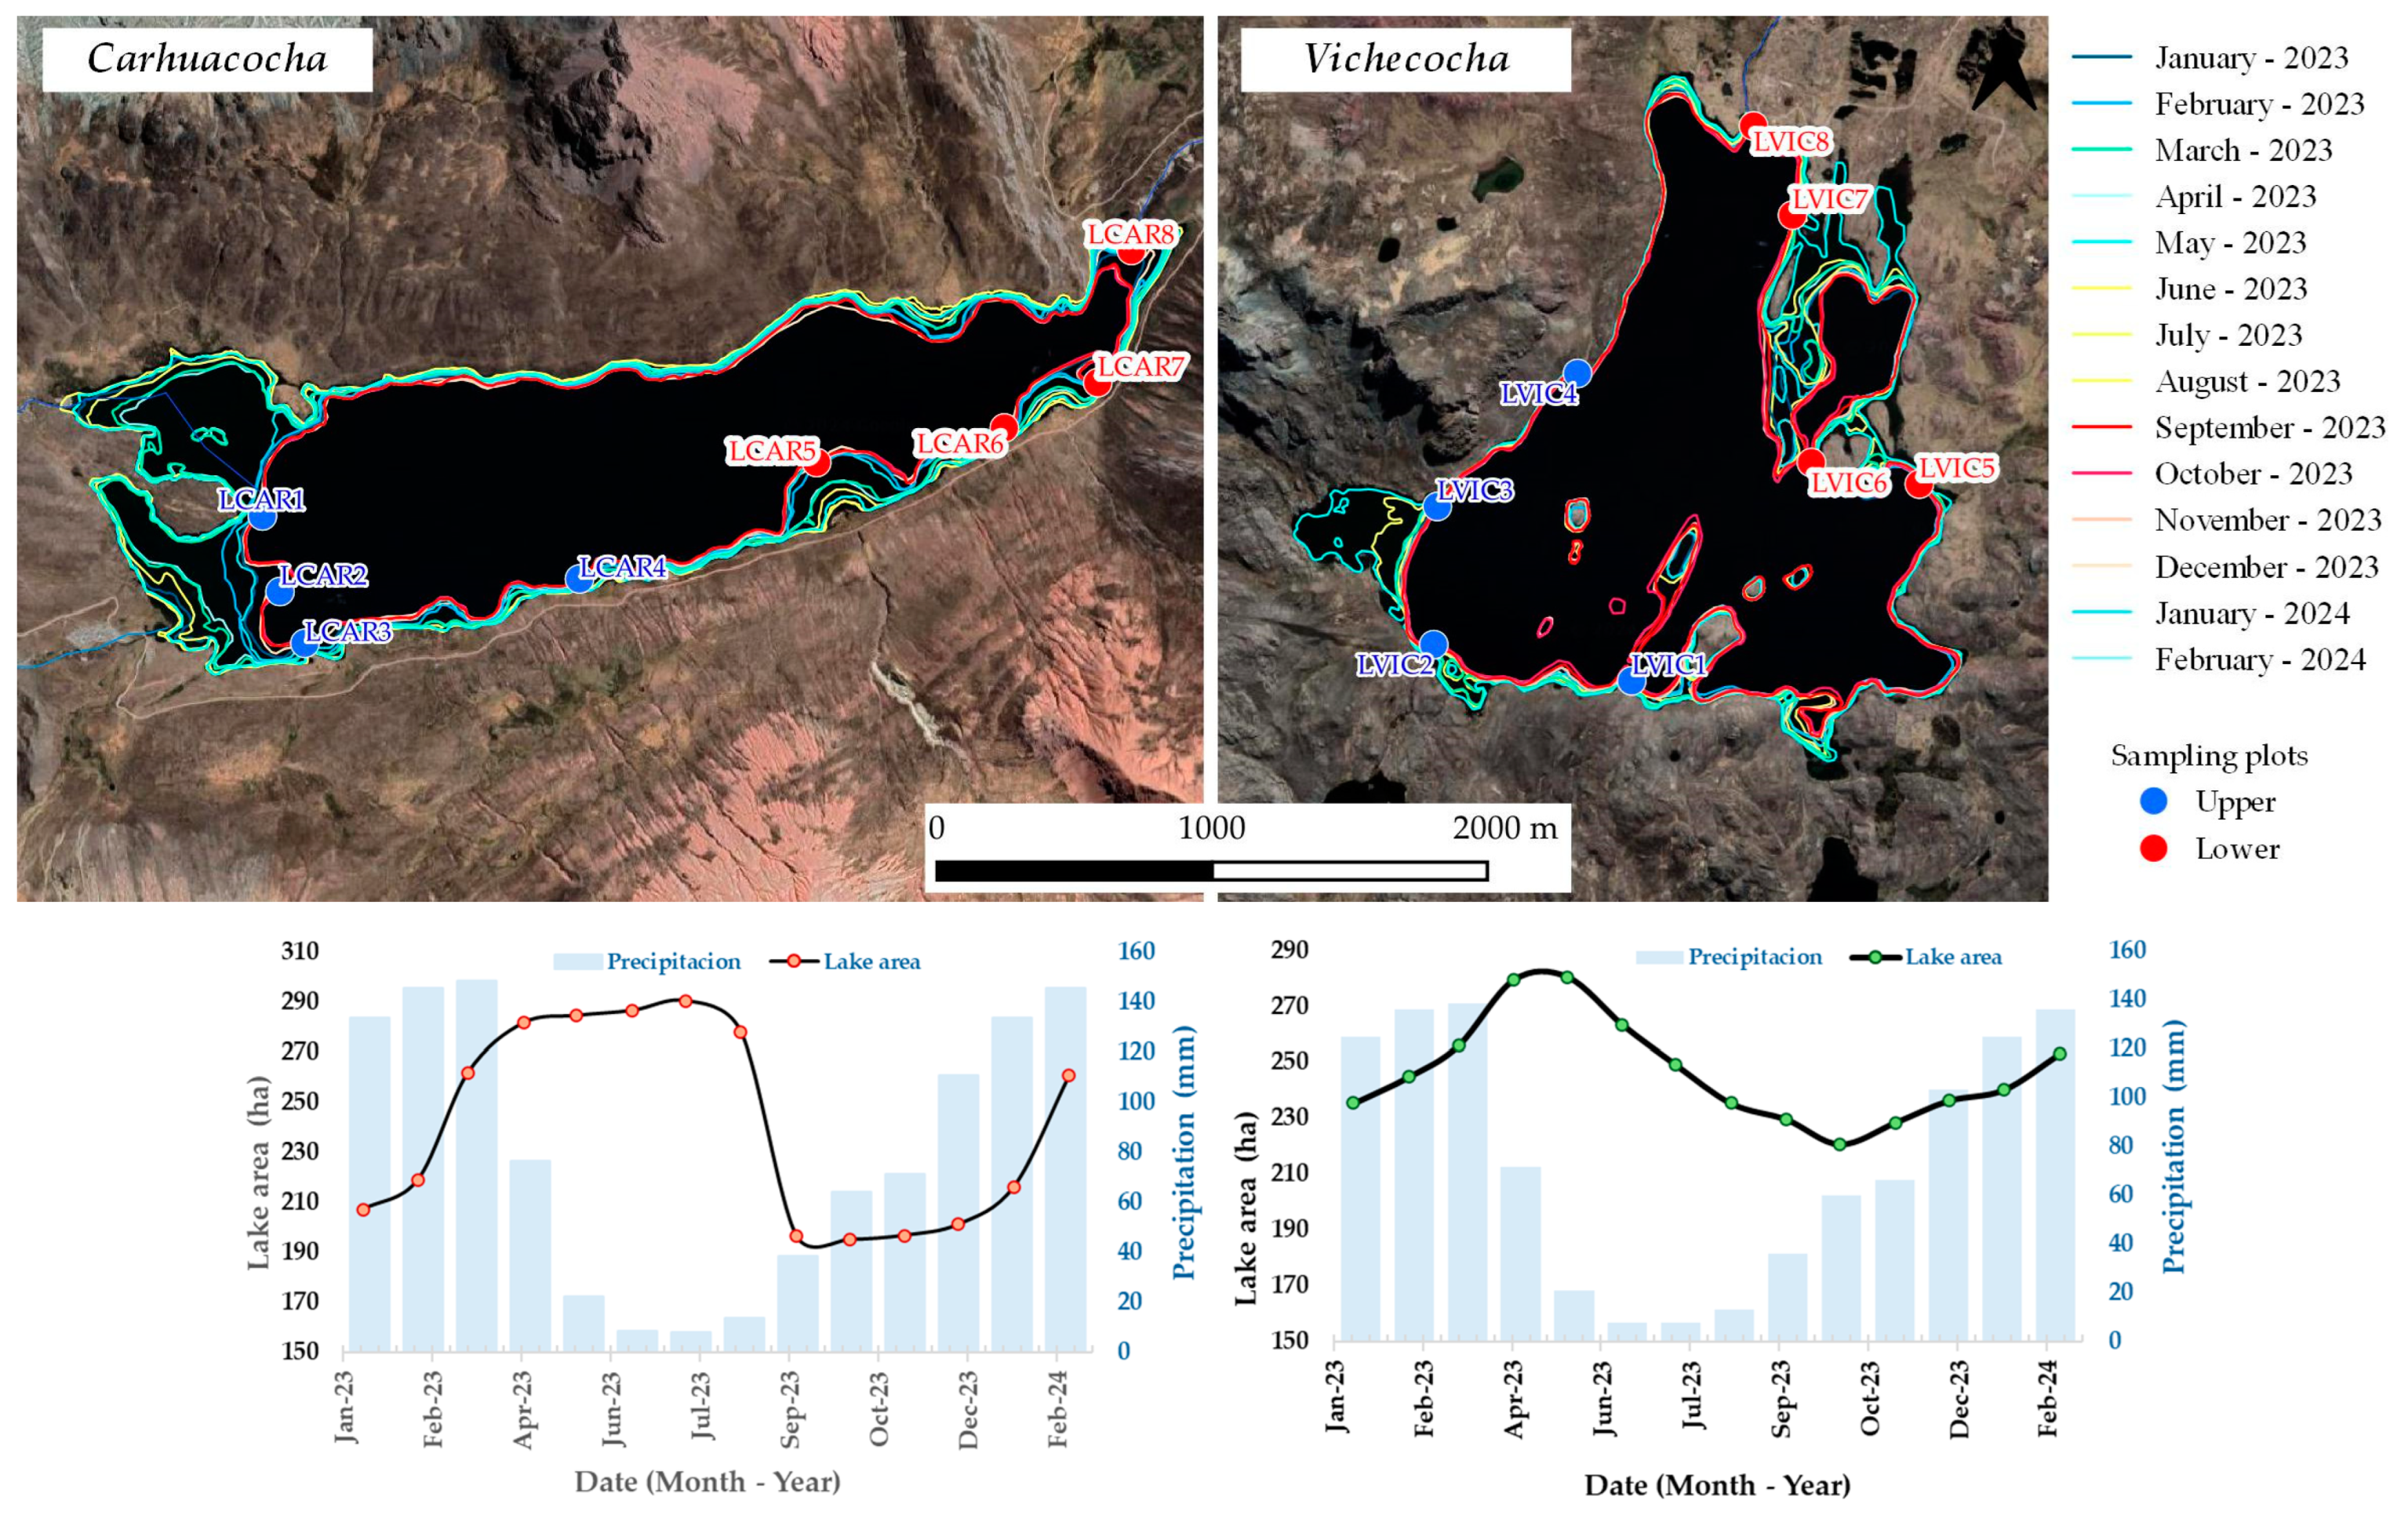
2.2. Water Extension

We used Planet−NICFI imagery surface reflectance four-band imagery (blue, green, red, and near-infrared) in composite (NIR–GREEN−RED), from January 2023 to February 2024, and analyzed this in the GEE platform [13]. In order to estimate the extension for the two lagoons, we used the Normalized Difference Water Index (NDWI), calculated as the difference between green and near-infrared reflectance (Band 2–Band 4) divided by the sum of green and near-infrared reflectance (Band 2 + Band 4/5) [14]. This index yields values ranging from −1 to 1, where values close to 1 indicate open-water pixels, which are more distinguishable from non-water pixels. These products combined with band composition NIR−GREEN−RED help to set the boundaries for both lagoons by photointerpretation in the same platform. After that, we contrasted the area with the dry and rainfall season of two weather stations close to the lagoons (Figure 2).

2.3. Sampling and Analytical Procedure

Eight sampling stations were set up around each lagoon, with four samples taken per station during two events (storage and discharge). In total, 128 water samples were collected (64 samples per lagoon) between July and December 2023. Sampling was carried out during this period because, from April to July, rainfall decreases drastically and, from August onwards, it increases until it reaches its maximum values in February [15]. Electrical conductivity (EC), pH, temperature, and dissolved oxygen (DO) were measured in field with a HANNA ® HI98129 and HI9146−10 multiparameter, respectively.
Water samples were collected using 500 mL glass bottles, which were sterilized and rinsed with distilled water prior to microbiological analysis. Additionally, two extra bottles were used for chemical analysis and heavy metal testing, respectively. For heavy metal analysis, the samples were preserved by adding 1.5 mL of concentrated nitric acid per liter of water, following the procedures outlined by the American Public Health Association (APHA) [16]. After collection, the water samples were transported to the laboratory and stored at 4 °C until preparation and analysis. All analyses were conducted in triplicate, and the findings were reported as the mean value. Detailed procedures for each analyzed parameter are outlined in Table 1.

2.4. Data Analysis

Statistical analysis and data processing were conducted using R Studio software (Version 3.4.3). The modified Shapiro−Wilks test was employed to assess the normality of the data. Pearson correlation analysis was utilized to explore the degree of correlation among the water parameters. Principal component analysis (PCA) was utilized to assess the suitability of the data for factor analysis. Kaiser−Meyer−Olkin (KMO) and Bartlett’s tests were conducted. KMO assesses sampling adequacy by indicating the proportion of variance that might be attributable to underlying factors. A high KMO value (approaching 1) typically suggests that factor analysis is appropriate, while a value below 0.5 indicates it may not be useful. Bartlett’s test of sphericity determines whether the correlation matrix resembles an identity matrix, which would indicate that variables are unrelated [17]. This analysis is used to identify possible associations with the physicochemical parameters of both lagoons.

Water Quality Assessment

To evaluate the health of aquatic ecosystems, we employed the Canadian Council of Ministers of the Environment’s Water Quality Index (CCME WQI) [18]. This index consists of three factors (F1, F2, and F3), scaled between 0 and 100, respectively. The values of the three measures of variance from selected objectives for water quality are combined to create a vector in an imaginary “objective exceedance” space. The length of the vector is then scaled to range between 0 and 100 and subtracted from 100 to produce an index which is 0 or close to 0 for very poor water quality and close to 100 for excellent water quality. Since the index is designed to measure water quality, it was considered that the index should produce higher numbers for better water quality indicators. The mathematical formulation of CCME WQI is given below.
C C M E W Q I = 100 F 1 2 + F 2 2 + F 3 2 1.732
where:
F1 (Scope) assesses the extent of noncompliance with the water quality standards over a specified period; F2 (Frequency) indicates the proportion of individual tests that fail to meet the set objectives (“failed tests”); and F3 (Amplitude) measures the degree to which the failed test values deviate from their objectives.
The CCME WQI scores are grouped into five categories of water quality: poor (0–44), marginal (45–64), fair (65–79), good (80–94), and excellent (95–100). Previously, water quality index scores were determined for 11 physicochemical parameters.

3. Results

3.1. Spatial Variability of Water Parameters Content

Descriptive statistics for physicochemical parameters from Carhuacocha and Vichecocha lagoons, encompassing both storage and discharge events, are presented in Table 2. These statistics are compared with the Environmental Quality Standards (EQS) established by Peruvian regulations for the conservation of aquatic environments [8]. The pH levels of water in both lagoons exhibit only minor variations between events, consistently falling within the acceptable ranges for the preservation of lacustrine and aquatic environments (6.5–9.0) and recreational use (6.0–9.0). However, at most sites, the pH values exceed the recommended range for drinking water (6.5–8.5), with particularly higher values observed in Vichecocha Lagoon. Average temperature values ranged from 12.69 to 13.98 °C in Carhuacocha Lagoon and from 11.41 to 12.06 °C in Vichecocha Lagoon. There were no significant differences in temperature between storage and discharge events in either lagoon.
Dissolved oxygen (DO) concentrations measured in both lagoons during storage events fall within the range specified by the Peruvian EQS and meet the World Health Organization’s recommended minimum of ≥5.5 mg/L for the overall health of aquatic systems [8].
However, during discharge events, this parameter falls below the expected range and shows a significant difference. The average EC in water samples ranged from 104.38 to 235.75 μS/cm, with the lowest mean EC recorded in Vichecocha, showing a significant difference between events. For both lagoons, EC values are below the upper limit (1000 μS/cm).
The mean BOD5 values recorded for Carhuacocha did not surpass the EQS water standard (5 mg/L) for the conservation of the aquatic environment. Although, in Vichecocha, this parameter exceeds the EQS water standard during discharge events, although, statistically, there is no significant difference between events. The mean values of chemical oxygen demand (COD) did not exceed the category 3 EQS water standard (40 mg/L) for vegetable irrigation and animal drinking. The thermotolerant coliform counts at all sampling sites for both lagoons did not exceed the EQS water standards.
The mean total phosphorus values at all sampling sites in both lagoons are lower than the Peruvian EQS water standard (0.035 mg/L). The mean chloride values vary between events for both lagoons. Nitrate values remain consistent between events and are below the Peruvian EQS water standard (13 mg/L) at all sampling sites in both lagoons. Sulfate levels decrease during discharge events in the Vichecocha lagoon, while silica content increases during discharge events in the Carhuacocha lagoon. The concentrations of the remaining elements in the water samples varied by sector and event, with the order of abundance in the Carhuacocha lagoon being Ca > Mg > Si > Na > K > Sr > Fe > Ba > Mn > Al > B > V > Cu > Li.
For Vichecocha, the order of abundance was Ca > Si > Na > Mg > K > Sr > Al > Fe > Mn > B > Ba > Cu > V > Li. The results reveal significative difference between water parameters (DO, Cl, Al, B, Ca, Cu, Sr, Fe, Mg, SiO2, Si, and Na) for Carhuacocha lagoon and (DO, Cl, B, Na, EC, SO−2, Li, and V) for Vichecocha between events. Significant variations in the described parameters were observed with each event for both lagoons.

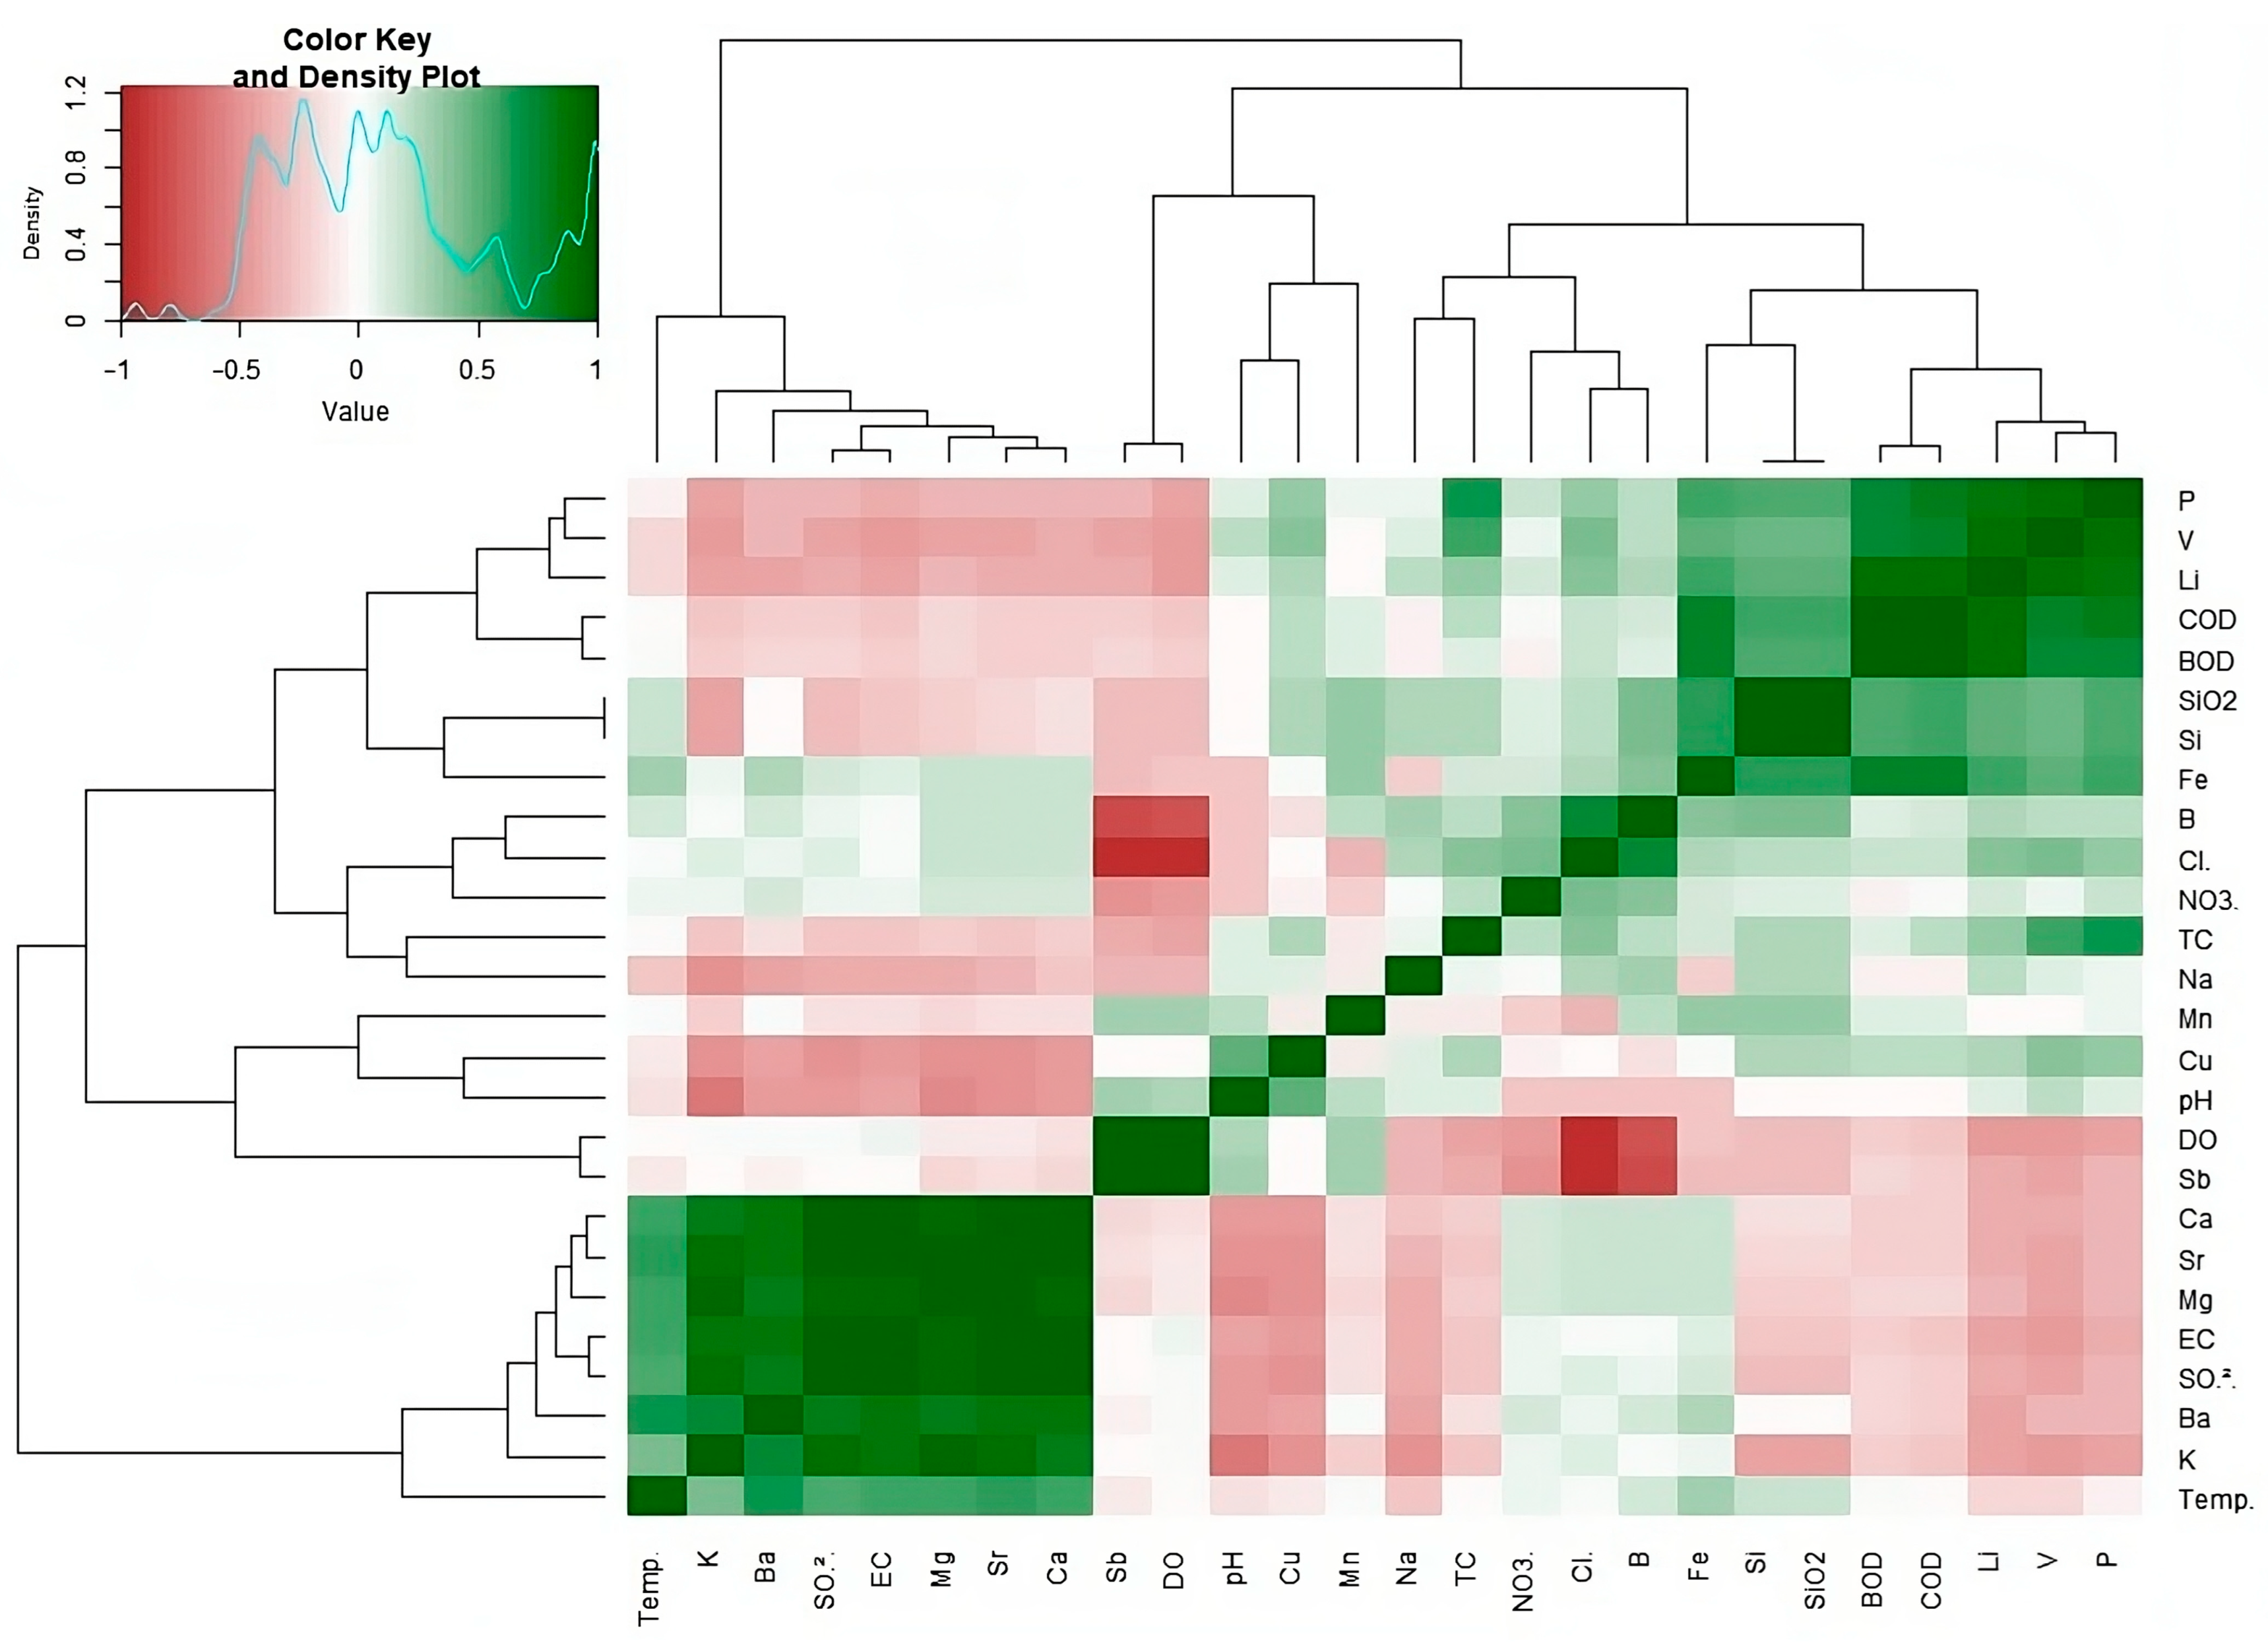
3.2. Correlation Analysis

Figure 3 shows how the different physical−chemical parameters and metals in the water samples relate to each other. The analysis identified clusters of parameters that tend to be present together. One group, including potassium (K), barium (Ba), sulfate (SO42−), magnesium (Mg), strontium (Sr), and calcium (Ca), likely comes from the same source and seems to influence electrical conductivity (EC) and temperature. Another group, including aluminum (Al), phosphorus (P), vanadium (V), lithium (Li), silicon dioxide (SiO2), silicon (Si), and iron (Fe), might be linked to higher biological oxygen demand (BOD) and chemical oxygen demand (COD).
These findings emphasize the importance of monitoring these parameters together to understand water quality. The analysis also revealed negative correlations between some parameters. For example, calcium (Ca), strontium (Sr), magnesium (Mg), sulfate (SO42−), barium (Ba), and potassium (K) showed negative correlations with silicon (Si), silicon dioxide (SiO2), lithium (Li), vanadium (V), phosphorus (P), and aluminum (Al). This suggests different dissolved solute sources or environmental behaviors for these opposing parameter groups. Interestingly, the water quality parameter dissolved oxygen (DO) had a negative co-relationship with chloride (Cl) and boron (B). These results suggest that Cl⁻ and B could come from different sources or have contrasting effects in the environment. While some correlations, such as those involving alkali−nonferrous metals, could point to a common source in the transported material, others probably originate from anthropogenic inputs [19].

3.3. Water Quality

The results of the water quality assessment based on the CCME WQI for all sampling sites in the Carhuacocha and Vichecocha lagoons are shown in Table 3. These results indicate excellent water quality at all sites in Carhuacocha lagoon and at six of eight sites in Vichecocha lagoon during the storage event. However, during the discharge event, water quality in Carhuacocha lagoon decreased from excellent to good, while, in Vichecocha lagoon, it deteriorated from excellent to good and fair. These findings confirm a noticeable decline in water quality following the discharge event.

3.4. Analysis of Main Components

Principal component analysis (PCA) was performed to analyze the water quality data from the Carhuacocha and Vichecocha lagoons. This analysis considered various parameters and elements measured during storage and discharge events. The suitability of the data for PCA was confirmed by two tests: the KMO sample adequacy measure (scoring 0.55) and Bartlett’s test of sphericity (with a p-value of 0.01).
The PCA identified two main components (PC1 and PC2) that explained over 60% of the overall variation in the data (Figure 4). For Carhuacocha lagoon during discharge events, PC1 was strongly linked to factors like temperature, electrical conductivity (EC), and concentrations of barium (Ba), calcium (Ca), strontium (Sr), magnesium (Mg), sulfate (SO42−), and potassium (K). In contrast, PC1 for the Vichecocha lagoon showed a stronger association with factors like pH, sodium (Na), and copper (Cu).

4. Discussion

The quality of aquatic ecosystems around the world is declining due to a double threat: natural processes like weathering and atmospheric transport and human activities linked to population growth and rapid economic development. This decline threatens our global water security [20]. According to the individual evaluated parameters, water quality in the Carhuacocha and Vichecocha lagoons for storage and discharge events revealed variability (Table 2). However, in both lagoons the concentration levels of most of the parameters did not exceed the environmental water quality standards for Peruvian lentic system waters established by MINAM (acronym for the Ministry of Environment in Spanish) [21]. Water pH results showed an increasing trend towards alkalinity. This pH behavior would be related to pond sediment conditions, photosynthetic activity, and agricultural activities in the area [22]. It is well documented that DO and temperature as a function of depth in the water column are factors that determine aquatic life [23].
Custodio et al. [24] evaluated the water quality of Peruvian high Andean lagoons with similar characteristics to the mentioned lagoons in this study and found results of physicochemical parameters that are consistent with our results. However, the average DO concentration during discharge events in both lagoons fell below the minimum regulatory value of ≥5.0 mg/L. This decline may be attributed to the impact of agricultural activities on these water bodies. Our findings are in line with the observations reported by Arenas-Sánchez et al. [25]. They found that lower oxygen levels could be explained by several factors: increased organic matter from a shrinking ecosystem, faster respiration rates at higher temperatures, and reduced oxygen solubility in the water. Our measurements of COD and BOD in the Carhuacocha and Vichecocha lagoons varied across locations. This spatial difference likely stems from fish farm activities in nearby areas. This finding aligns with research by Xiao et al. [26], who identified a positive correlation between COD and land-use changes, highlighting the impact of agriculture on water quality. Other studies point out that changes in land use influence all water quality indicators [27]. Therefore, to ensure that the COD concentration in the studied lagoons remains within the Environmental Quality Standards (EQS) for water, it is essential to promote the responsible use of fertilizers in agricultural areas. Although the average concentrations of most physical–chemical elements, metals, and heat-tolerant coliforms fell within the acceptable range for protecting aquatic life (EQS), a significant positive correlation between certain parameters (Figure 3) indicates a potential common source of environmental pressure. Specifically, COD and BOD were positively correlated with Al, P, V, Li, SiO2, Si, and Fe. This finding highlights the importance of monitoring these elements together, as several are linked to human activities like agriculture. Furthermore, the analysis revealed statistically significant differences in one third (33.33%) of the water quality parameters evaluated.
The quality of water is impacted by natural processes like erosion and by human actions such as industrial waste [28]. Rainfall throughout the year can influence water quality by washing away and diluting pollutants. This can cause seasonal fluctuations in contaminant levels [29]. Farming practices can significantly increase the amount of phosphorus, nitrogen, nitrate, ammonia, and sediment in waterways. Fertilizers and pesticides commonly used in agriculture can contribute to water pollution and eutrophication, which harms aquatic ecosystems. In addition, changes in water flow patterns caused by dams can also affect how pollutants move from land to water [30]. Our study revealed that, according to the CCME WQI, the water quality of the Carhuacocha and Vichecocha lagoons was predominantly classified as good or excellent quality at most sampling sites. However, one site in the Vichecocha lagoon was classified as having medium water quality. Our findings in the Vichecocha lagoon align with Mohamed et al. [31]. They point out that external sources of phosphorus, such as those from fish farms like the one in our study, can significantly influence water quality.

5. Conclusions

This study evaluated the water quality of the Carhuacocha and Vichecocha lagoons throughout the storage and discharge events using the WQI method. The results showed excellent water quality in both lagoons during storage. However, the water quality declined when the lagoons discharged water during the dry season. Ammonia, nitrate, and phosphate were identified as the key factors most directly affecting the WQI when their influence was analyzed individually.
Our study identified pH, dissolved oxygen (DO), and biological oxygen demand (BOD) as the most sensitive indicators of water quality in the lagoons. Since limited research exists for the Mantaro head basin, this fact highlights the need for the managers of the Carhuacocha and Vichecocha lagoons to implement mitigation measures. These measures should aim to maintain or improve the water quality to ensure the lagoons remain suitable for their various uses.

Author Contributions

S.P. and P.V.-M. designed the methodology; P.V.-M. and D.C. provided and validated field data; S.P. and P.V.-M. performed the data processing; S.P. and P.V.-M. analyzed the data; R.S.-A. managed funding acquisition; S.P., P.V.-M. and M.C. wrote the manuscript. All authors have read and agreed to the published version of the manuscript.

Funding

This research was funded by the INIA project “Mejoramiento de los servicios de investigación y transferencia tecnológica en el manejo y recuperación de suelos agrícolas degradados y aguas para riego en la pequeña y mediana agricultura en los departamentos de Lima, Áncash, San Martín, Cajamarca, Lambayeque, Junín, Ayacucho, Arequipa, Puno y Ucayali”, CUI 2487112.

Data Availability Statement

The data presented in this study are available on request from the corresponding author.

Acknowledgments

Santa Ana’s LABSAF teams for providing infrastructure and equipment for soil data collection and laboratory analysis.

Conflicts of Interest

The authors declare that they have no known competing financial interest or personal relationships that could have appeared to influence the work reported in this paper.

References

  1. Riveros, J.C.; Germaná, C.; Álvarez, C. Un Frágil Ciclo—Agua, Energía y Población En Lima; WWF: Lima, Perú, 2014; p. 68. [Google Scholar]
  2. Glavovic, B.C.; Smith, G.P. Adapting to Climate Change: Lessons from Natural Hazards Planning; Springer Science: Berlin/Heidelberg, Germany, 2014; ISBN 9789401786300. [Google Scholar]
  3. Hommes, L.; Boelens, R. Urbanizing Rural Waters: Rural-Urban Water Transfers and the Reconfiguration of Hydrosocial Territories in Lima. Polit. Geogr. 2017, 57, 71–80. [Google Scholar] [CrossRef]
  4. Silva, Y.; Takahashi, K.; Cruz, N.; Trasmonte Soto, G.L.; Mosquera, K.; Nickl, E.; Chavez, R.; Segura, B.; Lagos, P. Variability and Climate Change in the Mantaro River Basin, Central Peruvian Andes. In Proceedings of the International Conference on Southern Hemisphere Meteorology and Oceanography (ICSHMO), Foz do Iguacu, Brazil, 24–28 April 2006; pp. 407–419. [Google Scholar]
  5. Callañaupa Gutierrez, S.; Segura Cajachagua, H.; Saavedra Huanca, M.; Flores Rojas, J.; Silva Vidal, Y.; Cuxart, J. Seasonal Variability of Daily Evapotranspiration and Energy Fluxes in the Central Andes of Peru Using Eddy Covariance Techniques and Empirical Methods. Atmos. Res. 2021, 261, 105760. [Google Scholar] [CrossRef]
  6. Behmel, S.; Damour, M.; Ludwig, R.; Rodriguez, M.J. Water Quality Monitoring Strategies—A Review and Future Perspectives. Sci. Total Environ. 2016, 571, 1312–1329. [Google Scholar] [CrossRef] [PubMed]
  7. Custodio, M.; Peñaloza, R.; Chanamé, F.; Yaranga, R.; Pantoja, R. Assessment of the Aquatic Environment Quality of High Andean Lagoons Using Multivariate Statistical Methods in Two Contrasting Climatic Periods. J. Ecol. Eng. 2018, 19, 24–33. [Google Scholar] [CrossRef] [PubMed]
  8. Ministerio del Ambiente [MINAM]. Estandares de Calidad Ambiental (ECA) Para Aguas; El Peruano Official Newspaper, 6–9: Lima, Peru, 2017; pp. 10–19. [Google Scholar]
  9. Autoridad Nacional del Agua (ANA). Aprueban La Clasificación de Los Cuerpos de Agua Continentales Superficiales; El Peruano Official Newspaper, 9: Lima, Peru, 2018; Volume 21, pp. 10–13. [Google Scholar]
  10. Panhwar, M.Y.; Panhwar, S.; Keerio, H.A.; Khokhar, N.H.; Shah, S.A.; Pathan, N. Water Quality Analysis of Old and New Phuleli Canal for Irrigation Purpose in the Vicinity of Hyderabad, Pakistan. Water Pract. Technol. 2022, 17, 529–536. [Google Scholar] [CrossRef]
  11. ELECTROPERU. Memoria Descriptiva Infraestructura Hidráulica Operada Por ELECTROPERU S.A. Cuenca Rio Mantaro; ELECTROPERU: Lima, Peru, 2015. [Google Scholar]
  12. Custodio, M.; Peñaloza, R.; Alvarado, J.; Chanamé, F.; Maldonado, E. Surface Water Quality in the Mantaro River Watershed Assessed after the Cessation of Anthropogenic Activities Due to the Covid-19 Pandemic. Polish J. Environ. Stud. 2021, 30, 3005–3018. [Google Scholar] [CrossRef] [PubMed]
  13. Gorelick, N.; Hancher, M.; Dixon, M.; Ilyushchenko, S.; Thau, D.; Moore, R. Google Earth Engine: Planetary-Scale Geospatial Analysis for Everyone. Remote Sens. Environ. 2017, 202, 18–27. [Google Scholar] [CrossRef]
  14. McFeeters, S.K. The Use of the Normalized Difference Water Index (NDWI) in the Delineation of Open Water Features. Int. J. Remote Sens. 1996, 17, 1425–1432. [Google Scholar] [CrossRef]
  15. Peñaloza, R.; Custodio, M.; Cacciuttolo, C.; Chanamé, F.; Cano, D.; Solorzano, F. Human Health Risk Assessment for Exposure to Heavy Metals via Dietary Intake of Rainbow Trout in the Influence Area of a Smelting Facility Located in Peru. Toxics 2023, 11, 764. [Google Scholar] [CrossRef]
  16. Lipps, W.C.; Braun-Howland, E.B.; Baxter, T.E. Standard Methods for the Examination of Water and Wastewater, 24th ed.; Association, A.P.H., Ed.; American Public Health Association: Wahington, DC, USA, 2023. [Google Scholar]
  17. Kaiser, H.F. Analysis of Factorial Simplicity. Psychometrika 1974, 39, 31–36. [Google Scholar] [CrossRef]
  18. Canadian Council of Ministers of the Environment. Canadian Water Quality Guidelines for the Protection of Aquatic Life: CCME Water Quality Index 1.0; Technical Report; Canadian Council of Ministers of the Environment: Winnipeg, MB, Canada, 2001; pp. 1–13. [Google Scholar]
  19. Xiao, J.; Lv, G.; Chai, N.; Hu, J.; Jin, Z. Hydrochemistry and Source Apportionment of Boron, Sulfate, and Nitrate in the Fen River, a Typical Loess Covered Area in the Eastern Chinese Loess Plateau. Environ. Res. 2022, 206, 112570. [Google Scholar] [CrossRef] [PubMed]
  20. Trach, R.; Trach, Y.; Kiersnowska, A.; Markiewicz, A.; Lendo-Siwicka, M.; Rusakov, K. A Study of Assessment and Prediction of Water Quality Index Using Fuzzy Logic and ANN Models. Sustainability 2022, 14, 5656. [Google Scholar] [CrossRef]
  21. MINAM. Environmental Quality Standards (EQS) for Water: DS N° 004-2017-MINAM; El Peruano. Off. Newsp. 6: Lima, Peru, 2017. [Google Scholar]
  22. Meng, Z.; Yang, Y.; Qin, Z.; Huang, L. Evaluating Temporal and Spatial Variation in Nitrogen Sources along the Lower Reach of Fenhe River (Shanxi Province, China) Using Stable Isotope and Hydrochemical Tracers. Water 2018, 10, 231. [Google Scholar] [CrossRef]
  23. Zhao, Z.; Wang, S.; Lu, W.; Yang, W.; Li, S. Water Quality Assessment, Possible Origins and Health Risks of Toxic Metal(Loid)s in Five Cascade Reservoirs in the Upper Mekong. J. Clean. Prod. 2024, 441, 141049. [Google Scholar] [CrossRef]
  24. Custodio, M.; Chanamé, F.; Pizarro, S.; Cruz, D. Quality of the Aquatic Environment and Diversity of Benthic Macroinvertebrates of High Andean Wetlands of the Junín Region, Peru. Egypt. J. Aquat. Res. 2018, 44, 195–202. [Google Scholar] [CrossRef]
  25. Arenas-Sánchez, A.; Dolédec, S.; Vighi, M.; Rico, A. Effects of Anthropogenic Pollution and Hydrological Variation on Macroinvertebrates in Mediterranean Rivers: A Case-Study in the Upper Tagus River Basin (Spain). Sci. Total Environ. 2021, 766, 144044. [Google Scholar] [CrossRef]
  26. Xiao, R.; Wang, G.; Zhang, Q.; Zhang, Z. Multi-Scale Analysis of Relationship between Landscape Pattern and Urban River Water Quality in Different Seasons. Sci. Rep. 2016, 6, 1–10. [Google Scholar] [CrossRef]
  27. de Mello, K.; Taniwaki, R.H.; de Paula, F.R.; Valente, R.A.; Randhir, T.O.; Macedo, D.R.; Leal, C.G.; Rodrigues, C.B.; Hughes, R.M. Multiscale Land Use Impacts on Water Quality: Assessment, Planning, and Future Perspectives in Brazil. J. Environ. Manag. 2020, 270, 110879. [Google Scholar] [CrossRef]
  28. Akhtar, N.; Syakir Ishak, M.I.; Bhawani, S.A.; Umar, K. Various Natural and Anthropogenic Factors Responsible for Water Quality Degradation: A Review. Water 2021, 13, 2660. [Google Scholar] [CrossRef]
  29. Xiang, R.; Wang, L.; Li, H.; Tian, Z.; Zheng, B. Water Quality Variation in Tributaries of the Three Gorges Reservoir from 2000 to 2015. Water Res. 2021, 195, 116993. [Google Scholar] [CrossRef]
  30. Liu, Y.; Wu, X.; Qi, W. Assessing the Water Quality in Urban River Considering the Influence of Rainstorm Flood: A Case Study of Handan City, China. Ecol. Indic. 2024, 160, 111941. [Google Scholar] [CrossRef]
  31. Mohamed, H.M.; Khalil, M.T.; El-Zeiny, A.M.; Khalifa, N.; Kafrawy, S.B.E.; Emam, W.W.M. Trophic State and Potential Productivity Assessment for Qaroun Lake Using Spatial Techniques. Environ. Monit. Assess. 2023, 195, 1–13. [Google Scholar] [CrossRef] [PubMed]
Figure 1. Locations where water samples were taken from Carhuacocha and Vichecocha lagoons.
Water 16 02505 g001
Figure 2. Lake shorelines delineated from PlanetScope from period January 2023–February 2024 for Carhuacocha and Vichecocha lakes.
Water 16 02505 g002
Figure 3. Pearson’s correlation coefficients between physical–chemical parameters and metals in the water samples.
Water 16 02505 g003
Figure 4. Principal component analysis (PCA) for 27 water parameters for storage and discharge events in Carhuacocha and Vichecocha lagoons.
Water 16 02505 g004
Table 1. Details of the instrumentation used, methods employed, and quality control measures implemented during the analysis.
ParameterUsed Instrumentation and Methods/SolutionsAccuracy (Sensitivity)Range Test
pHHANNA ® HI98129±0.050–14
Conductivity (EC, µS/cm)±10–3999
Temperature (T, °C)±0.50.0–60.0
Dissolved oxygen (DO, mg/L)HANNA ® HI9146−10,±0.060.00–45.00
Chemical oxygen demand (COD, mg/L)Chemical Oxygen Demand, Closed Reflux Colorimetric Method
SMEWW−APHA−AWWA–WEF Part 5220 D. 23 rd. 2017.
±0.40–2
Biochemical oxygen demand (BOD5, mg/L)Biochemical Oxygen Demand (BOD). 5−Day BOD Test
SMEWW−APHA−AWWA–WEF Part 5210B. 24th Ed. 2022.
±20–5
Thermotolerant coliforms (TC, NMP/100 mL)Multiple-Tube defermentation Technique for Members of the Coliform Group. E. coli Procedure Using Fluorogenic Substrate. Simultaneous Determination of Thermotolerant Coliforms and E. coli.±1.8−−
Chloride (Cl, mg/L)Determination of inorganic anions by ion chromatography
Environmental Protection Agency. Methods for Chemicals Analysis (EPA)
Nitrate (NO3, mg/L)±0.020.02–0.300
Sulfate (SO42−, mg/L)±0.22–70
Phosphorus (P, mg/L)Ascorbic Acid Method
SMEWW−APHA−AWWA–WEF Part 4500–P B (Item 5) y E, 24th Ed. 2023.
±0.002
Aluminum (Al, mg/L)Determination of trace Elements in Water and Waste Inductively Coupled Plasma–Mass spectrometry.
Method 200.8 Revision 5.4 1994
±0.001
Bario (Ba, mg/L)±0.00008
Boron (B, mg/L)±0.0003
Calcium (Ca, mg/L)±0.001
Copper (Cu, mg/L)±0.0001
Strontium (Sr, mg/L)±0.00002
Iron (Fe, mg/L)±0.001
Lithium (Li, mg/L)±0.00003
Magnesium (Mg, mg/L)±0.0006
Manganese (Mn, mg/L)±0.00002
Potassium (K, mg/L)±0.003
Silica (SiO2, mg/L)±0.001
Silicon (Si, mg/L)±0.0002
Sodium (Na, mg/L)±0.0003
Vanadium (V, mg/L)±0.0001
Note(s): EPA: US Environmental Protection Agency. Methods for Chemicals Analysis; SMEWW: Standard Methods for the Examination of water and Wastewater; APHA: American Public Health Association.
Table 2. Event variation in physicochemical parameters and thermotolerant coliforms in Carhuacocha and Vichecocha Lagoons during 2023.
ParameterCarhuacochaVichecocha EQS Water—Conservation of the Aquatic Environment
StorageDischargeStorageDischarge
UpperLowUpperLowUpperLowUpperLow
pH8.3500 ± 0.3836 a8.5225 ± 0.2405 a8.1250 ± 0.0954 b8.1900 ± 0.1227 ab8.6575 ± 0.2061 a9.0925 ± 0.2965 a8.7075 ± 0.3917 a8.6825 ± 0.5789 a6.5–9.0
Temperature (°C)11.8500 ± 2.1825 a13.5250 ± 2.4446 a13.9250 ± 1.8998 a14.0250 ± 0.7500 a11.6250 ± 1.5218 a12.5000 ± 0.5354 b12.3250 ± 0.6850 b10.5000 ± 0.4967 ab∆ 3
DO (mg/L)7.6775 ± 0.1420 a7.9125 ± 0.3836 a2.2525 ± 0.1335 b2.2225 ± 0.4665 b7.7075 ± 0.2317 a8.1050 ± 0.3743 a1.6400 ± 0.3222 b1.4700 ± 0.2082 b≥5
EC (µS/cm)195.2900 ± 78.5408 a249.0000 ± 3.1623 a235.0000 ± 36.3043 a236.5000 ± 8.3865 a113.7500 ± 3.5940 a118.0000 ± 10.9545 a102.0000 ± 9.3452 b106.7500 ± 1.8930 b1000
BOD (mg/L)4.9900 ± 0.0000 a4.9900 ± 0.0000 a4.9900 ± 0.0000 a4.9900 ± 0.0000 a4.9900 ± 0.0000 a4.9900 ± 0.0000 b5.6950 ± 1.1530 a4.9900 ± 0.0000 a5
COD (mg/L)1.9900 ± 0.0000 a1.9900 ± 0.0000 a1.9900 ± 0.0000 a1.9900 ± 0.0000 a1.9900 ± 0.0000 a1.9900 ± 0.0000 a2.2675 ± 0.5550 a1.9900 ± 0.0000 a40
TC(NMP/100 mL)2.4750 ± 1.3500 ab1.7900 ± 0.0000 ab2.4675 ± 1.3550 a2.4675 ± 1.3550 b1.7900 ± 0.0000 a1.7900 ± 0.0000 b8.2750 ± 3.5132 a2.4675 ± 1.3550 a1000
P (mg/L)0.0059 ± 0.0000 a0.0059 ± 0.0000 a0.0059 ± 0.0000 ab0.0059 ± 0.0000 b0.0059 ± 0.0000 a0.0059 ± 0.0000 b0.0220 ± 0.0109 a0.0079 ± 0.0040 a0.035
Cl (mg/L)0.3232 ± 0.4445 a0.1045 ± 0.0013 a0.9900 ± 0.0000 b0.9900 ± 0.0000 b0.1085 ± 0.0013 a0.1125 ± 0.0013 a0.9900 ± 0.0000 b0.9900 ± 0.0000 b−−
NO3 (mg/L)0.1870 ± 0.1680 a0.1292 ± 0.1605 ab0.4175 ± 0.3931 b0.5600 ± 0.4968 ab0.1648 ± 0.0773 ab0.1320 ± 0.1000 a0.4250 ± 0.3779 b0.4125 ± 0.3958 b13
SO42− (mg/L)44.9525 ± 19.3041 a57.1100 ± 0.6914 ab56.4250 ± 13.8454 b54.8250 ± 0.6602 a19.0875 ± 0.2617 ab19.3650 ± 0.2525 a16.6500 ± 2.1810 c18.7000 ± 0.2000 bc−−
SiO2 (mg/L)3.1677 ± 0.6338 a3.6868 ± 0.0823 a4.8045 ± 0.8920 b4.1830 ± 0.1450 b4.9533 ± 0.3605 a4.4910 ± 0.2667 b5.3595 ± 1.1776 ab4.1242 ± 0.5154 b−−
Al (mg/L)0.0029 ± 0.0000 a0.0029 ± 0.0000 a0.0932 ± 0.0455 b0.0257 ± 0.0180 b0.0442 ± 0.0655 a0.0680 ± 0.0232 b0.1735 ± 0.2116 b0.0150 ± 0.0109 ab−−
Ba (mg/L)0.0089 ± 0.0040 a0.0132 ± 0.0019 ab0.0128 ± 0.0039 ab0.0138 ± 0.0023 b0.0056 ± 0.0021 a0.0039 ± 0.0004 ab0.0058 ± 0.0057 b0.0019 ± 0.0012 b0.7
B (mg/L)0.0009 ± 0.0000 a0.0009 ± 0.0000 a0.0174 ± 0.0013 b0.0168 ± 0.0004 b0.0091 ± 0.0113 a0.0009 ± 0.0000 a0.0126 ± 0.0023 b0.0144 ± 0.0011 ab−−
Ca (mg/L)0.0090 ± 0.0000 a0.0090 ± 0.0000 ab0.0002 ± 0.0000 bc0.0002 ± 0.0000 c0.0090 ± 0.0000 a0.0090 ± 0.0000 ab0.0002 ± 0.0000 b0.0002 ± 0.0000 b−−
Cu (mg/L)0.0002 ± 0.0000 a0.0002 ± 0.0000 a0.0007 ± 0.0002 b0.0008 ± 0.0001 b0.0002 ± 0.0000 ab0.0085 ± 0.0055 a0.0057 ± 0.0008 a0.0025 ± 0.0025 b0.1
Sr (mg/L)0.1846 ± 0.0821 a0.2434 ± 0.0044 a0.2809 ± 0.0646 ab0.2629 ± 0.0094 b0.0790 ± 0.0031 a0.0765 ± 0.0012 b0.0695 ± 0.0111 b0.0827 ± 0.0056 ab−−
Fe (mg/L)0.0360 ± 0.0094 a0.0437 ± 0.0250 ab0.0720 ± 0.0488 b0.0988 ± 0.0153 b0.0510 ± 0.0442 a0.0302 ± 0.0075 b0.1143 ± 0.1330 b0.0055 ± 0.0006 b5
Li (mg/L)0.0001 ± 0.0000 a0.0001 ± 0.0000 ab0.0001 ± 0.0000 b0.0001 ± 0.0000 b0.0001 ± 0.0000 a0.0001 ± 0.0000 a0.0023 ± 0.0027 b0.0014 ± 0.0003 b−−
Mg (mg/L)2.3093 ± 0.8920 ab2.9712 ± 0.0830 a3.5375 ± 0.3057 bc3.2715 ± 0.1133 c0.8914 ± 0.0328 a0.9264 ± 0.0448 a0.8728 ± 0.0796 a0.9498 ± 0.1216 a−−
Mn (mg/L)0.0059 ± 0.0021 a0.0090 ± 0.0022 a0.0086 ± 0.0048 a0.0057 ± 0.0023 a0.0251 ± 0.0269 a0.0127 ± 0.0087 b0.0091 ± 0.0066 b0.0014 ± 0.0015 b−−
K (mg/L)0.7888 ± 0.0763 a0.7480 ± 0.0157 b0.8875 ± 0.0561 a0.7685 ± 0.0471 a0.1752 ± 0.0439 a0.1942 ± 0.0688 b0.1305 ± 0.0515 ab0.2115 ± 0.0583 ab−−
Si (mg/L)1.4782 ± 0.2958 a1.7203 ± 0.0385 a2.2422 ± 0.4163 b1.9520 ± 0.0677 b2.3116 ± 0.1682 a2.0958 ± 0.1244 b2.5010 ± 0.5495 ab1.9246 ± 0.2407 b−−
Na (mg/L)1.1654 ± 0.3604 a1.4573 ± 0.0237 a1.5747 ± 0.3018 ab1.5274 ± 0.0297 b1.8290 ± 0.0181 a1.8021 ± 0.0833 b1.9106 ± 0.2413 b2.9350 ± 1.2264 b−−
V (mg/L)0.0003 ± 0.0000 a0.0003 ± 0.0000 a0.0003 ± 0.0000 ab0.0003 ± 0.0000 b0.0003 ± 0.0000 a0.0003 ± 0.0000 b0.0017 ± 0.0008 a0.0008 ± 0.0006 a−−
Note(s): means with different letters in the same column for each event level are statistically different (LSD Fisher, α = 0.05). TC: thermotolerant coliforms.
Table 3. Water quality of Carhuacocha and Vichecocha lagoons according to the Canadian Council of Environment Ministers Water Quality Index (CCME WQI).
EventLagoonSampling SiteF1F2F3CCME WQIWQI according to Color
StorageCarhuacocha1100.00Excellent
2100.00Excellent
3100.00Excellent
4100.00Excellent
5100.00Excellent
6100.00Excellent
7100.00Excellent
8100.00Excellent
Vichecocha1100.00Excellent
2100.00Excellent
3100.00Excellent
4100.00Excellent
5100.00Excellent
6100.00Excellent
79.099.090.2393.00Good
89.099.090.4393.00Good
DischargeCarhuacocha19.099.0917.1988.00Good
29.099.0915.9288.00Good
39.099.0916.3888.00Good
49.099.0917.7987.00Good
59.099.0917.1288.00Good
69.099.0913.8889.00Good
79.099.0917.1988.00Good
89.099.0921.2986.00Good
Vichecocha118.1818.1821.2481.00Good
29.099.0926.6783.00Good
39.099.0922.3485.00Good
49.099.0918.2987.00Good
59.099.0920.9086.00Good
69.099.0923.0285.00Good
79.099.0927.1483.00Good
818.1818.1824.5279.00Fair
Note(s): F1: range factor; F2: frequency factor; F3: amplitude factor.
Disclaimer/Publisher’s Note: The statements, opinions and data contained in all publications are solely those of the individual author(s) and contributor(s) and not of MDPI and/or the editor(s). MDPI and/or the editor(s) disclaim responsibility for any injury to people or property resulting from any ideas, methods, instructions or products referred to in the content.

