Abstract
Due to the changing climate and human activity, more and more researchers started to focus on non-stationarity in hydrology. In the Wei River Basin, which is the largest tributary of the Yellow River, there is a significant reduction in the total amount of water resources which has been found in past decades. Additionally, the distribution of water resources within the basin is unbalanced, with the lower reaches and southern regions having relatively abundant water resources and other regions lacking these resources. Within this situation, it is important to consider the spatial aspect of water resource management. Four non-stationarity detection methods have been applied to investigate variation in seasonal discharge series. Two meteorological factors have also been analyzed. Based on test results and Köppen Geiger Climate classification, the water resource management has been investigated spatially. As for results, the Baojixia Channel has significant impact on the abrupt change of discharge, while the precipitation and temperature may have an impact on the discharge trend change. In addition, there was no clear evidence to prove that the climate zones impact spatially on the non-stationarity of discharge.
1. Introduction
Today, most hydrological systems are impacted by multiple factors, such as climate changes, construction of dams and/or irrigation channels, and land use [1]. These have caused non-stationarity signals to be found in discharge time series [2,3,4]. Traditionally, water-resources management has relied on the stationarity assumption; however, this can no longer be considered the default for water-resource management [5].
To distinguish if the stationarity assumption is valid, it is necessary to consider both the mean and variance of a time-series. In a stationarity time-series, the mean and variance are constant, while in a non-stationarity series one or both measures vary. The major changes associated with non-stationaries are monotonic change and step change [6] and are tested for using trend or change-point tests, respectively.
Many different approaches have been used to test for trends, such as the following: the Mann–Kendall (MK) test [7]; the Seasonal MK test [8]; Sen’s slope [9]; the Moving Average and Spearman test [10], and Empirical Mode Decomposition (EMD) [11]. Tests such as the Pettitt test [12], the Heuristic Segmentation algorithm (BG algorithm) [13], Wavelet analysis, and the moving t-test have been used to test for change points.
Hu et al. [14] found the Modified MK was better at detecting trends compared to the MK test and Sen’s slope. Anghileri et al. [15] used a combined approach to evaluate seasonal trends in the Alps, noting limited impacts on water resources. Sang et al. [16] found EMD more effective for trend detection in China’s Hei River Basin. Zhang et al. [17] observed consistent results across multiple methods for detecting trends and change points in the Xitiaoxi River Basin, China. Huang et al. [18] used the BG algorithm to test for change points in the annual discharge series in the Wei River Basin in China, and found that human activities are the dominant driver of decreasing discharge. In these studies, various methods for monotonic trends and abrupt changes have been used and validated, but most employed a single approach. Therefore, multiple methods will be applied in this study to provide more objective tests results and enable an evaluation of the performance of different approaches.
Non-stationarity research in the Wei River Basin has mainly focused on annual averaged discharge to identify change and drivers [19,20,21,22]; predict the non-stationarity of discharge [23], investigate impact on low flows and droughts [24,25], and investigate the flood risk [26,27]. Li et al. [19] used EMD, while Zhang and Gu [22] used the Mann–Whitney U test and the MK test; both studies found the that Baojixia channel, a water diversion channel constructed in 1971, was the most important driver of the non-stationarity of discharge. Wu et al. [20] also investigated how the Baojixia channel affected the flow regime of the Wei River, and noted the discharge declined significantly due to the channel, particularly during the dry season. Xiong et al. [21] found that temperature rise was the primary cause of discharge decline. Meng et al. [23] used an SVM to forecast the non-stationarity of discharge series at three stations and found a modified empirical decomposition SVM outperformed other methods. Liu et al. [24] observed that decreasing low flows were impacted by both climate and human activities, while Zou et al. [25] noted that human activities dominated hydrological droughts short-term, with climate change more influential long-term. As for flood analysis, Liu et al., [26] associated flood risk with catchment changes and extreme precipitation, while Yan et al. [27] found similar reliability between stationarity and non-stationarity design methods. These studies mainly focused on finding the drivers of non-stationarity of different hydrological variables.
The distribution of the usage of surface water and groundwater varies significantly across the Wei River Basin [28]. These authors state that the ratio of surface water usage to groundwater (non-agriculture) is approximately double in the upper reaches (6:1) compared to that in the lower reaches (3:1). Xu and Zuo. [29] simulated the blue-water (discharge and groundwater) and green- water (used by the planet) resources in the Wei River basin, and found most of the basin experiences blue-water storage.
The seasonal aspect of non-stationarity in the WRB has generally been ignored. Anthropogenic and meteorological factors can both exhibit varying levels of impact across seasons. For example, Kousali et al. [30] found that meteorological and agricultural factors impacted freshwater volume to different degrees depending on the season, in Iran.
The overall aim of this study is to investigate how non-stationarity affects water resources in the Wei River Basin at both the annual and seasonal time scales. To achieve this aim, the following research questions will be addressed:
What are the changing patterns in hydro-meteorological variables, and how do they differ at different time scales?
What are the drivers of annual and seasonal non-stationarity of discharge for analysis?
Are these associated with the regional climate?
2. Study Area and Methodologies
2.1. Study Area and Data
The Wei River is the largest tributary of the Yellow River and has a catchment area of 135,000 km2. The Wei River has two main tributaries, the Jing River and the Beiluo River, whose catchment areas are 45,400 km2 and 26,900 km2, respectively [31]. The Wei River Basin (WRB) stretches across three provinces (Shaanxi, Gansu, and Ningxia), with 76 major cities and 22 million people living within the basin [18].
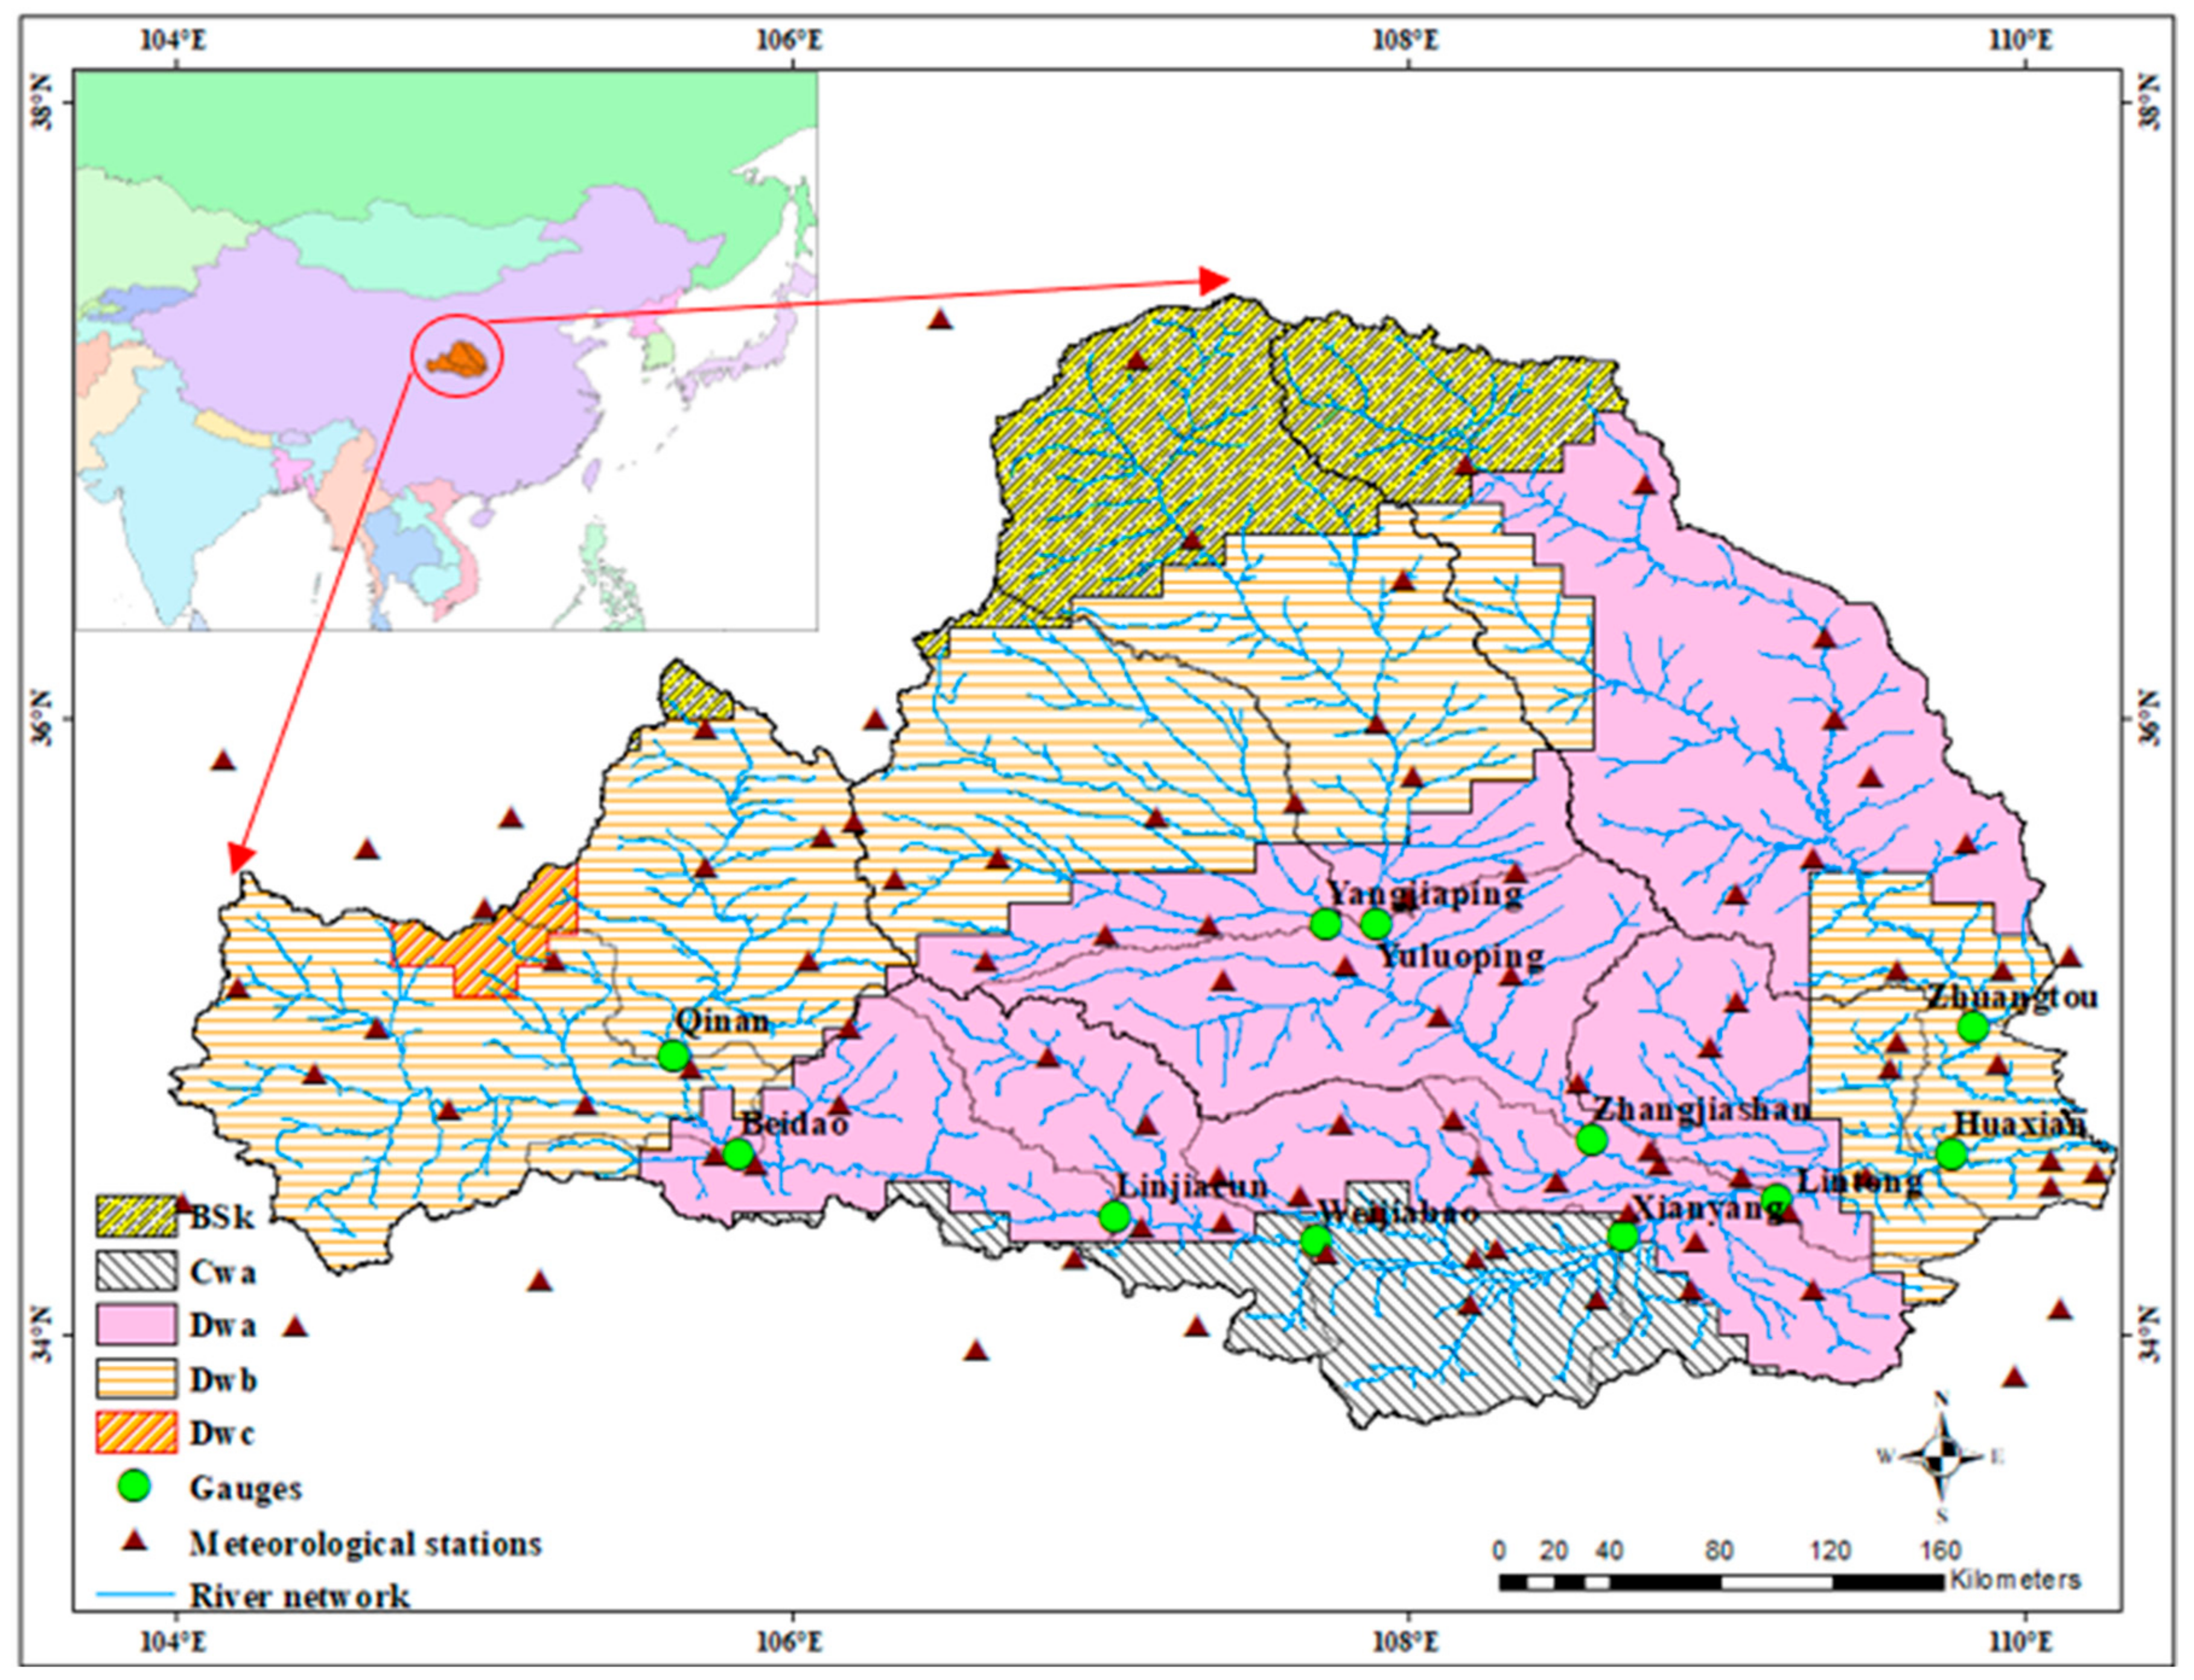
There are five different Köppen Geiger Climate classifications [32] within the basin. As shown in Figure 1, Dwb (monsoon-influenced warm-summer humid continental climate) and Dwa (monsoon-influenced hot-summer humid continental climate) are the dominate climate classifications followed by Bsk (dry: cold semi-arid (steppe) climate) then Cwa (monsoon-influenced humid subtropical climate) and finally Dwc (monsoon-influenced subarctic climate).

Figure 1.
Locations of discharge and meteorological stations overlaying the climate zones. Catchment outlines are shown in red.
2.1.1. Discharge Data:
Eleven discharge stations’ datasets were used in this study and data were provided by the Hydrology Bureau of the Yellow River Conservancy Commission. Daily discharge was available at ten stations; three of these (Linjiacun, Zhangjiashan, Zhuangtou) also had monthly data, and monthly discharge was only available at Weijiabao. Table 1 lists the recording period, catchment area and selected period (longest continuous recording period) used in this study. Of particular interest is Linjiacun, whose data are associated with the Baojixia diversion. Monthly data are collected upstream of the channel, while daily data are collected downstream of the diversion channel.

Table 1.
Discharge data used in the study including catchment’s full record, missing and selected periods, and area. N/A indicates no change points were found. Superscript ‘1’, ‘2’, ‘3’ indicates whether the station is located on the mainstem, Jing River, or Beiluo River, respectively.
2.1.2. Meteorological Data
A total of 93 meteorological stations were used in this study, and data were provided by the National Meteorological Information Centre provided by A Big Earth Data Platform for Three Poles [33]. For each station, nine variables were available; however, only temperature and precipitation datasets were used. Most stations have data between 1955 and 2010 and overlap with the discharge data, while only 19 stations have missing data for more than 5 years. Catchment average estimates for both temperature and precipitation corresponding to each discharge station were created using Thiessen Polygons.
2.2. Non-Stationarity Detection Methods
Four different methods are used in this study to detect non-stationarities in different variables at the annual and seasonal time scale.
The Sen’ slope test was used to detect trends and the value and direction of the slope indicates the magnitude and direction of the trend, respectively. The MK test was used to test for both trends and change points where the intersection between the forward- and reverse-sequence statistics is the location of the change points and a location above or below 0 indicates an increasing or decreasing trend.
Pettitt’s test was used to test for change points and is based on the Mann–Whitney two-sample test. The hypothesis of Pettitt’s test is there are no changes in location parameter.
The final test used to detect change points is the Heuristic Segmentation (BG) algorithm. This was initially developed for analyzing the non-stationarity of the human heart rate [13]. However, it has been used in hydrological studies and is considered to perform better than some traditional methods in detecting the abrupt change point [24,34].
The significant level of all four statistical tests is 0.05.
3. Results
3.1. Annual Time Series
3.1.1. Annual Mean Discharge
Table 2 show that most stations on the Wei River mainstem have significant decreasing trends, despite the non-stationarity detection method used. While Weijiabao (monthly) shows no significant trends, Qinan station has a significant trend using the Sen’s slope method but not using the MK test. In the sub-basins, only Zhangjiashan (monthly) exhibited significant decreasing trends across both tests, while Sen’s slope identified a significant decreasing trend at Yangjiaping. Table 2 also showed that Sen’s slope found more trends (significant and not) than the MK test, and all showed a decreasing trend in discharge across the WRB at all stations.
Table 2.
The non-stationarity of trends and change points (Year) for the annual mean discharge and meteorological variables. ↑ and ↓ indicate trend direction. Highlighted cells indicate non-significant trends. N/A indicates no change points were found. Superscript ‘1’, ‘2’, ‘3’ indicates whether the station is located on the mainstem, Jing River, or Beiluo River, respectively.
Only seven of the fourteen stations were found to have change points identified by all three tests. However, the timing of the change points was different for each test, and only the BG algorithm and Pettitt’s test found the same change point once for Zhangjiashan (monthly) in 1985, while the MK test found a change point in 1995. The BG algorithm was the only method that could detect multiple change points, and found two change points at four stations (Beidao, Linjiacun, Xianyang and Lintong). At five stations, no change points were found by any of the methods (Weijiabao (monthly), Yangjiaping, Yuluoping, Zhuangtou and Zhuangtou (monthly)), with the majority of these stations on the tributaries. The BG algorithm also found change points at Qinan and Zhangjiashan in 1970 and 1967, respectively, which no other method found.
3.1.2. Annual Mean Meteorological Variables
Fewer trends were found in either of the meteorological variables compared to discharge. For precipitation, only in the Xianyang catchment was a significant trend (decreasing) found with both methods. In the Beidao catchment, only the MK test found significant decreasing trends in precipitation, while the Sen’s slope test found a non-significant decreasing trend. While the majority of trends found using the Sen’s slope test (significant and non-significant) suggested decreasing precipitation, in the Weijiabao catchment a non-significant increasing trend was found.
More trends were found in the catchment average mean temperature time-series, with seven of the fourteen time-series showing significant increasing trends across both methods, and Linjiacun (daily) showing an increasing trend with the MK test. This was not seen with the Sen’s slope test, where all time-series showed increasing trends in temperature. Some initial surprising results from the MK trends were that significant increasing trends were found in temperature for the time-periods associated with the monthly discharge for Zhangjiashan (monthly) and Zhuangtou (monthly). but no significant trends were found in the time-period associated with the daily discharge. Additionally, different significant trends were discovered in the Linjiacun catchment for the time-periods associated with the daily and monthly discharge data.
No common change point was observed across all three tests for precipitation. The Pettitt test found no change points, while the BG algorithm found one in the Linjiacun catchment for the monthly discharge time-period and the MK test found two change points in the Beidao and Xianyang catchments. More change points were identified in the temperature time-series where change points were identified in half of the time-series with all methods. As with the discharge change points, the timing of temperature change points varied across all three tests. No change points were identified across all tests in five catchments (Qinan, Weijiabao, Yangjiaping, Yuluoping and Zhangjiashan) for the monthly time-period. Like the results of the trend tests, using different periods in the same catchment resulted in different timing of change points. For example, in the Linjiacun catchment the different time-periods between daily and monthly resulted in 1994 being identified as the change point for the daily time-period for both the BG algorithm and MK test, while 1997 was identified as the change point in both tests for the monthly time-period. The BG algorithm also identified two change points in the Beidao, Zhangjiashan (monthly) and Zhuangtou (monthly) time-series.
3.1.3. Annual Maximum Discharge
Table 3 presents the results for the annual maximum time-series for discharge, precipitation, and temperature. Only stations with daily data were used for the annual maximum analysis, as monthly data may not capture the maximum values.
Table 3.
The non-stationarity of trends and change points (Year) for the annual maximum discharge and meteorological variables. ↑ and ↓ indicate trend direction. Highlighted cells indicate non-significant trends. N/A indicates no change points were found. Superscript ‘1’, ‘2’, ‘3’ indicates whether the station is located on the mainstem, Jing River, or Beiluo River, respectively.
Five stations (Beidao, Linjiacun, Xianyang, Lintong and Huaxian) were found to have significant decreasing trends in discharge using both the Sen’s slope and MK tests. A negative trend was also found at Yangjiaping using Sen’s slope, but not with the MK test. At all, bar one (Yuluoping) discharge stations, negative trends were identified.
All five stations with significant trends from both methods had change points identified using suitable methods. A single change point was identified using all methods in the Linjiacun, Xianyang, Lintong and Huaxian discharge time-series; however, all three method identified different years. Two charge points (1978 and 1993) where identified by the BG algorithm for the Beidao time-series, while the Pettitt and MK testes identified one in 1988 and in 1986, respectively.
3.1.4. Annual Maximum Meteorological Variables
Table 3 shows that no significant trends or change points were in the annual maximum-precipitation series, irrespective of method used. The majority of Sen’s slope trends indicated a decreasing precipitation, except for the Beidao catchment. Only the Beidao catchment showed a significant trend of increasing maximum temperature using both the Sen’s slope and MK tests, while the MK test also found decreasing trends for both the Qinan and Xianyang catchments. Only in the Beidao’s annual maximum temperature were change points found using all methods, with 1994 being identified using the BG algorithm and MK test and 1993 using the Pettit test. While the Pettit test found no more change points, the BG algorithm also found 1994 to be the timing of a change point in the Linjiacun catchment. This was not collaborated by the MK test, which identified a change point in 1977 in the Qinan catchment and 1996 in the Xianyang catchment.
3.2. Seasonal Time-Series
Based on the annual time-series analyses it was decide to use the BG algorithm and Sen’s slope on the seasonal time-series, due to their ability to detect multiple change points and non-significant trends.
3.2.1. Seasonal Means
Table 4 shows that there is consistency in significant trends across the time-series; however, with fewer significant trends in the summer compared to the other seasons. For the discharge time-series, the same eight time-series exhibit significant decreasing trends in both spring and autumn. In winter, seven of these time-series still exhibit significant decreasing trends, with Lintong no longer having a significant trend. Only six of eight time-series have significant decreasing trends in summer, with Zhuangtou and Qinan not significant.
Table 4.
Trends identified in the seasonal mean time-series for discharge and meteorological variables. ↑ and ↓ indicate the direction of trend. Highlighted cells indicate non-significant trends. Superscript ‘1’, ‘2’, ‘3’ indicates whether the station is located on the mainstem, Jing River, or Beiluo River, respectively.
For the precipitation time-series, there is less consistency across seasons, with no catchment time-series exhibiting significant trends across seasons. In spring, there are six significant trends in precipitation (one increasing and five decreasing), but there are none in summer, four decreasing trends in autumn and only three significant trends (two increasing and one decreasing) in mean winter precipitation. Only Linjiacun (daily and monthly) seasonal precipitation displays significant trends in more than one season. For Linjiacun (daily), a decreasing trend was found in mean spring precipitation, while an increasing trend in mean winter precipitation was found. For Linjiacun (monthly), a decreasing trend in both spring and autumn was discovered.
All, bar one, significant trends in seasonal mean temperature show an increase, with Zhuangtou (daily) having a decreasing temperature trend in Summer. In only two catchments (Beidao and Linjiacun (daily)) was this increasing trend significant across all seasons.
Table 5 identifies the timing of change points discovered in the seasonal time-series using the BG algorithm. Five discharge time-series were found to have change points in all seasons (Beidao, Linjiacun-daily, Xianyang, Lintong, and Huaxian). However, the timing of the change points were not the same across seasons, with more multiple change points found in the mean spring discharge. Apart from the above time-series, three more time-series have change points in spring and autumn, one more in summer and four more in winter.
Table 5.
Timing of change points identified in the seasonal mean time-series for discharge and meteorological variables. N/A indicates no change points were found. Superscript ‘1’, ‘2’, ‘3’ indicates whether the station is located on the mainstem, Jing River, or Beiluo River, respectively.
Four mean precipitation on change points were found in the spring or summer means, four change points were found in autumn (Linjiacun (daily and monthly), Lintong and Zhuangtou (monthly)), and five in winter (Beidao, Linjiacun (daily), Weijiabao (monthly), and Zhangjiashan and Zhuangtou (daily)).
Seven of the catchments mean temperatures had change points found in all seasons, with the majority of these occurring in the 1990s. More time-series were found to have change points in summer (10) compared with spring (9), autumn (8) and winter (8). Of the ten summer temperature time-series with change points, 50% have multiple change points, with 1975 and 1994 identified as change-point years.
3.2.2. Seasonal Maximums
As with annual maximum, only stations with daily data were used. Table 6 shows the trends for the maximum seasonal time-series. Few time-series have significant trends across all seasons. For discharge time-series, only four time-series displayed significant trends (all decreasing) across all seasons (Beidao, Linjiacun, Xianyang and Huaxian). There is also a temporal pattern visible, with more discharge time-series showing significant trends in autumn and winter than the in other seasons, with only Qinan having significant decreasing trends in these seasons. Other noticeable differences across seasons were found for the discharge time-series of Lintong and Yangjiaping, with the former having significant decreasing trends in all seasons except summer and the latter only having a significant decreasing trend in summer.
Table 6.
Trends identified in the maximum seasonal time-series for discharge and meteorological variables. ↑ and ↓ indicate the direction of trend. Highlighted cells indicate non-significant trends. Superscript ‘1’, ‘2’, ‘3’ indicates whether the station is located on the mainstem, Jing River, or Beiluo River respectively.
For the precipitation time-series, no significant trends were found in either spring or summer, while only four were found in autumn and two in winter. The two significant trends in winter were found in the Linjiacun and Lintong catchments, with Linjiacun maximum precipitation showing an increasing trend and Lintong’s having a decreasing trend. Both these catchments also have significant trends in autumn, although with a different trend in Linjiacun’s maximum precipitation. Zhangjiashan’s and Zhuangtou’s maximum autumn precipitation was found to have decreasing trends.
Like the maximum precipitation, maximum temperature trends varied with the season. No significant trends were observed in spring, and only the maximum temperature in Beidao had a significant trend (increasing) in summer; the same five catchments had significant trends (all increasing) in both autumn and winter. These five catchments are all located on the mainstem of the Wei River and are Beidao, Linjiacun, Xianyang, Lintong and Huaxian.
Table 7 also shows that the time-series on the mainstem display more change than those on the tributaries. Four stations‘ (Beidao, Linjiacun, Xianyang and Huaxian) maximum discharge all had change points across all seasons. However, the timing varies across station and season. Multiple change points were found in the maximum discharge in spring compared to other seasons, with four stations having multiple change points in spring compared to only one station in both summer and winter, and none in autumn. The number of stations where change points were found in maximum discharge also varies across seasons, with eight stations (out of ten) having change points. This drops to six stations in spring, four in summer, and five in autumn, with Zhuangtou having change in both these three seasons but not in winter.
Table 7.
Timing of change points identified in the seasonal maximum time-series for discharge and meteorological variables. N/A indicates no change points were found. Superscript ‘1’, ‘2’, ‘3’ indicates whether the station is located on the mainstem, Jing River, or Beiluo River, respectively.
As with trends in maximum precipitation (Table 6), no change points were found in the spring or summer maximum precipitation. Four catchments (Linjiacun, Lintong, Zhangjiashan and Zhuangtou) had change points in maximum precipitation in autumn, while only two (Qinan and Linjiacun) in had change points in winter. The change points for Linjiacun were different between seasons, with 1970 being determined as the change point in maximum precipitation for autumn, while winter 1986 was determined as the time for the change point.
For the maximum temperature, no change points were found in the spring time-series, and 1994 was found as the change point in both the Beidao and Linjiacun maximum summer temperature. Five time-series had change points in autumn, with Huaxian’s and Lintong’s maximum temperature change point both in 1986; 1991 was determined as the timing of the change point in both the Linjiacun and Xianyang catchments, and 1993 was the change point for the maximum autumn temperature in the Beidao catchment. For winter, only two catchments were found to have change points, and 2000 was the time for the change point for both Beidao and Linjiacun.
4. Discussion
4.1. The Choice and Limitation of Non-Stationarity Detection Approaches
The importance of conducting change point detection and trend analysis simultaneously is clearly illustrated from the results. Four different non-stationarity detection methods, focusing on detecting trends and change points, were tested in Section 3.1. Three of these methods (BG algorithm, Pettitt’s test and the MK test) can test for change points, while only the MK test and Sen’s slope can detect trends.
From Table 3, when there is only a single change point, results from the three change-point methods are similar. However, only the BG algorithm is capable of testing for multiple change points, while the other two methods find only the single most-significant change point. To explore the impact of time-series length, the Huaxian discharge data were shortened by five years at either end of the time-series, and the results are shown in Table 8. The length of record has a larger impact on the MK and Pettitt tests, where even slight changes in the record length results will result in different change points, especially for the Pettitt test, while the BG algorithm results are more stable.
Table 8.
Impact of time-series length on Change Point detection.
For trend testing, the results did not vary between methods, therefore indicating that either method is suitable.
Additionally, according to Yue et al. [35] and Farris et al. [36], the magnitude of trend and size of sample impact the efficiency of non-parametric statistical tests. In this study, this would impact the results of the MK test and Kendall tau, with the latter used to determines the significance of Sen’s slope. Mallakpour and Villarini [37] and Fukuda et al. [38] also noted that the sensitivity of the Pettitt test and BG algorithm are also impacted by the length of the data record. In this study, five stations (Qinan, Weijiabao, Yuluoping, Zhangjiashan and Zhuangtou), with daily data from the last two, have fewer than 30 years of data length; therefore, the accuracy of all tests applied to these discharge time-series may be impacted, and there is the small potential for an incorrect null hypothesis to be accepted (type II error). For example, non-stationarity was not detected in the discharge time-series for Weijiabao, while significant non-stationarity signals were found at both upstream and downstream stations.
4.2. Annual Versus Seasonal Non-Stationarity Signals
Comparing the result between the annual and seasonal significant trends (Sen’s slope) for the mean time-series, there is not a consistent pattern between time-period and variable. For mean discharge, there is some consistency in results, with nine catchments showing deceasing trends at the annual scale and eight, six, eight and seven catchments having decreasing trends at the spring, summer, autumn and winter scale, respectively. The catchments with significant seasonal trends with mean discharge all have significant annual trends. There is more variability for mean precipitation and temperature. For mean precipitation, only three catchments exhibit significant decreasing trends at the annual scale, while six catchments have significant trends in spring (one increasing and five decreasing), zero in summer, four catchments with decreasing trends in autumn and three significant trends in winter (one increasing and two decreasing). Only one catchment, Linjiacun, has opposing significant trends across seasons, with a decreasing trend in spring but an increasing trend in winter. For mean temperature, autumn has the most significant trends, with eight followed by seven at the annual scale, six in winter, five in spring and three in summer. For annual, spring, autumn and winter, all trends were increasing, while for summer, one catchment (Zhuangtou) had a decreasing trend in mean temperature.
A similar pattern is also observed in the change points detected across the annual and seasonal time-periods. Nine catchments have change points in mean discharge at the annual scale and in winter; however, these are not the same catchments. Eight catchments have exhibited change points in spring and autumn, while six catchments have change points in summer. Five catchments (Beidao, Linjiacun, Xinyang, Lintong, Huaxian) exhibited change points across all periods, with the timing of these change points mostly similar across periods except, for autumn, whose change points mostly occur in 1985–1986. Only one catchment had an annual mean-precipitation change point (Linjiacun—monthly) which also corresponded to a mean discharge change point. No change points were found in the mean precipitation in either spring or summer, while four change points in autumn and five in winter were found; however, these did not align with change points in mean discharge. For mean temperature, the same eight catchments had change points at the annual scale and in both autumn and winter. At the annual scale, the change points in mean temperature corresponded to change points in mean discharge in the Beidao and Linjiacun catchment. In autumn only, in the Zhangjiashan catchment, the change points corresponded, while no change points corresponded in winter. Nine catchments had change points during spring, but none corresponded to discharge change points, and ten catchments in summer had change points, with six corresponding with mean discharge change points.
Results are similar for the maximum time-series. For maximum discharge, all significant trends are decreasing. Three catchments have significant trends across all periods (Beidao, Linjiacun and Xinyang); however, Qinan only has a significant trend in autumn and winter and Yangjiaping has a significant trend at the annual scale and in summer.
Comparing the change points of the maximum time-series, it is clear that maximum precipitation has not undergone the same changes as maximum discharge and temperature. No change points in maximum precipitation were found in the annual, spring or summer periods while only four in autumn and two in winter were detected, and none corresponded to change points in maximum discharge. Change points in maximum temperature were only found in two catchments (Beidao and Linjiacun) at the annual scale, and the timing was the same for summer but differed in both autumn and winter. Only in the Beidao, Linjiacun and Huaxian catchments did the change points for maximum temperature and discharge correspond. For maximum discharge, more change points were found for winter (eight) than any other period. Catchments along the mainstem of the WRB were found have more change points, with five of six catchments exhibiting change points at the annual scale and in spring, autumn and winter. In fact all bar two catchments (Yuluoping and Zhuangtou) exhibited change points during the winter.
4.3. The Non-Stationarity Driver Analysis and Water Resource Implications
The results obtained from trend tests and change point detection allow for a preliminary analysis of the non-stationarity drivers. Overall trends indicated decreasing trend in both discharge and precipitation across the entire basin, irrespective of annual or seasonal time-period, while temperature was increasing. This is not surprising considering the close relationship between discharge, precipitation and temperature (as a proxy for evapotranspiration); however, the number of significant trends in the mean spring series indicated that non-stationarity may have a greater impact on water resources during this period.
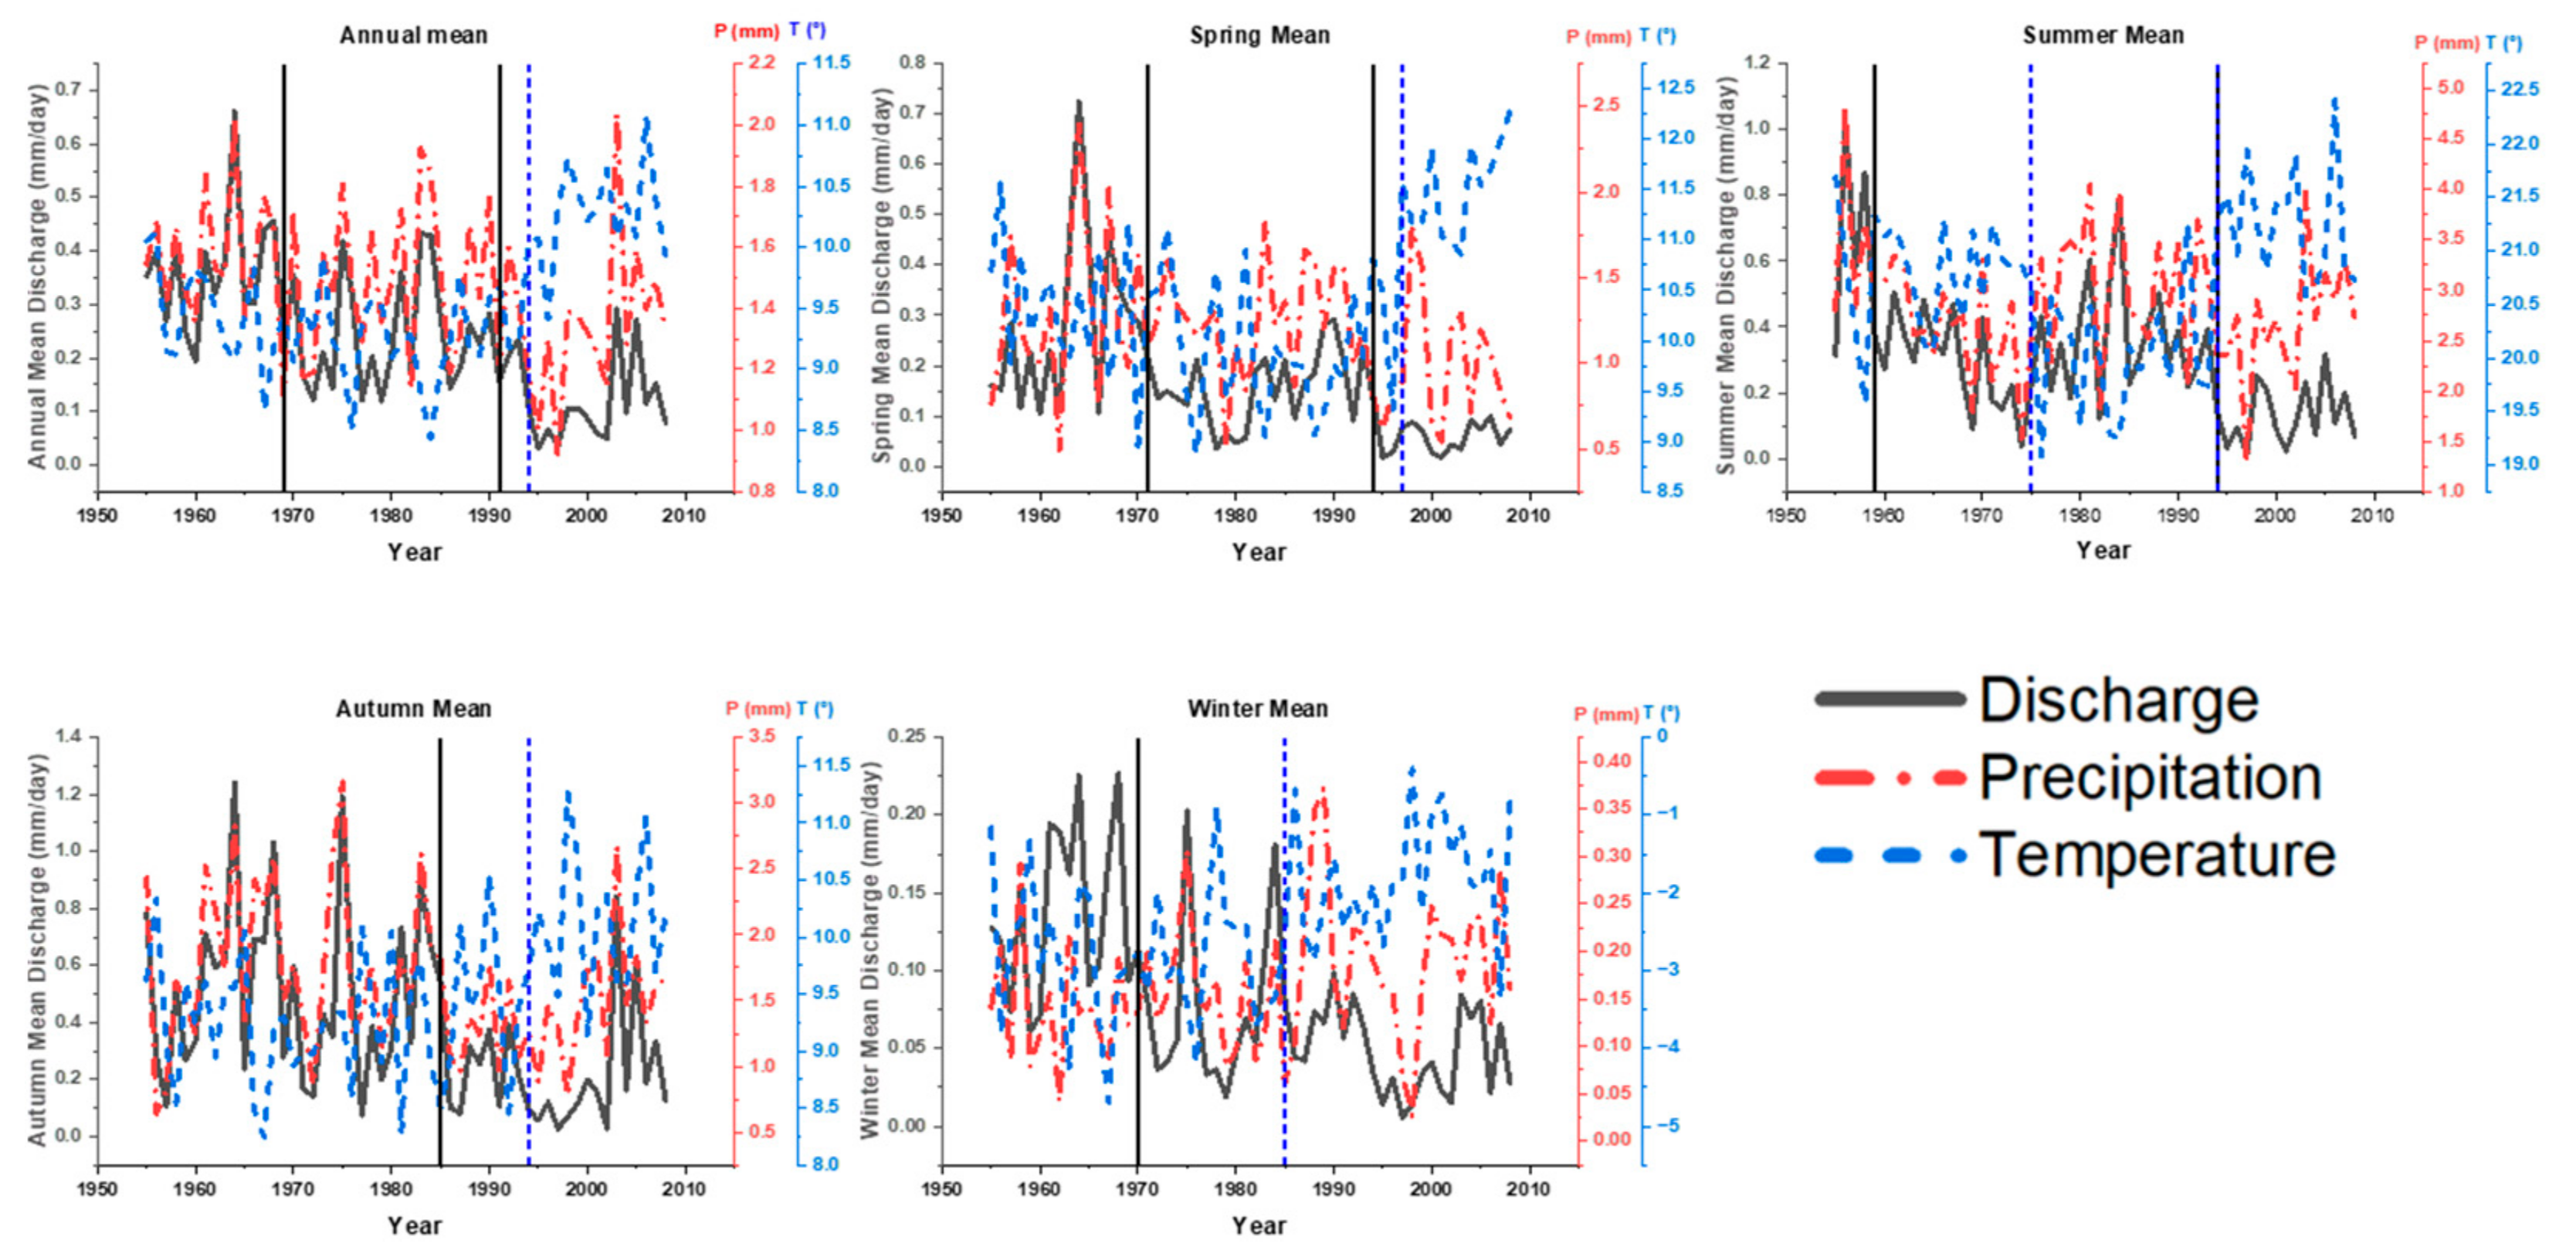
Change-point tests identified the fact that, in the early 1990s, change points were common along the mainstem of the Wei River and their timing corresponded to temperature change points. This indicates that temperature might be the driver of abrupt change. However, this corresponding timing is not consistent across all catchments and time-periods. Figure 2 shows an example plot of the mean time series at the Xianyang station, located in the middle and lower reaches of the basin, which shows that the fluctuations in both the discharge and precipitation time-series align well with each other, demonstrating that there is a correlation between discharge and precipitation. Therefore, a decreasing trend in precipitation, even if insignificant, will have an impact on discharge. In addition, both the discharge and temperature time-series have abrupt change points near 1990, after which there is a sharp increase in temperature and decrease in discharge. This pattern is visible in the annual, and in all but the winter, seasonal data.
Figure 2.
Discharge, precipitation, and temperature for the annual and seasonal average time-series at Xianyang station, where the vertical lines show the locations of the corresponding abrupt changes (only discharge and temperature have change points).
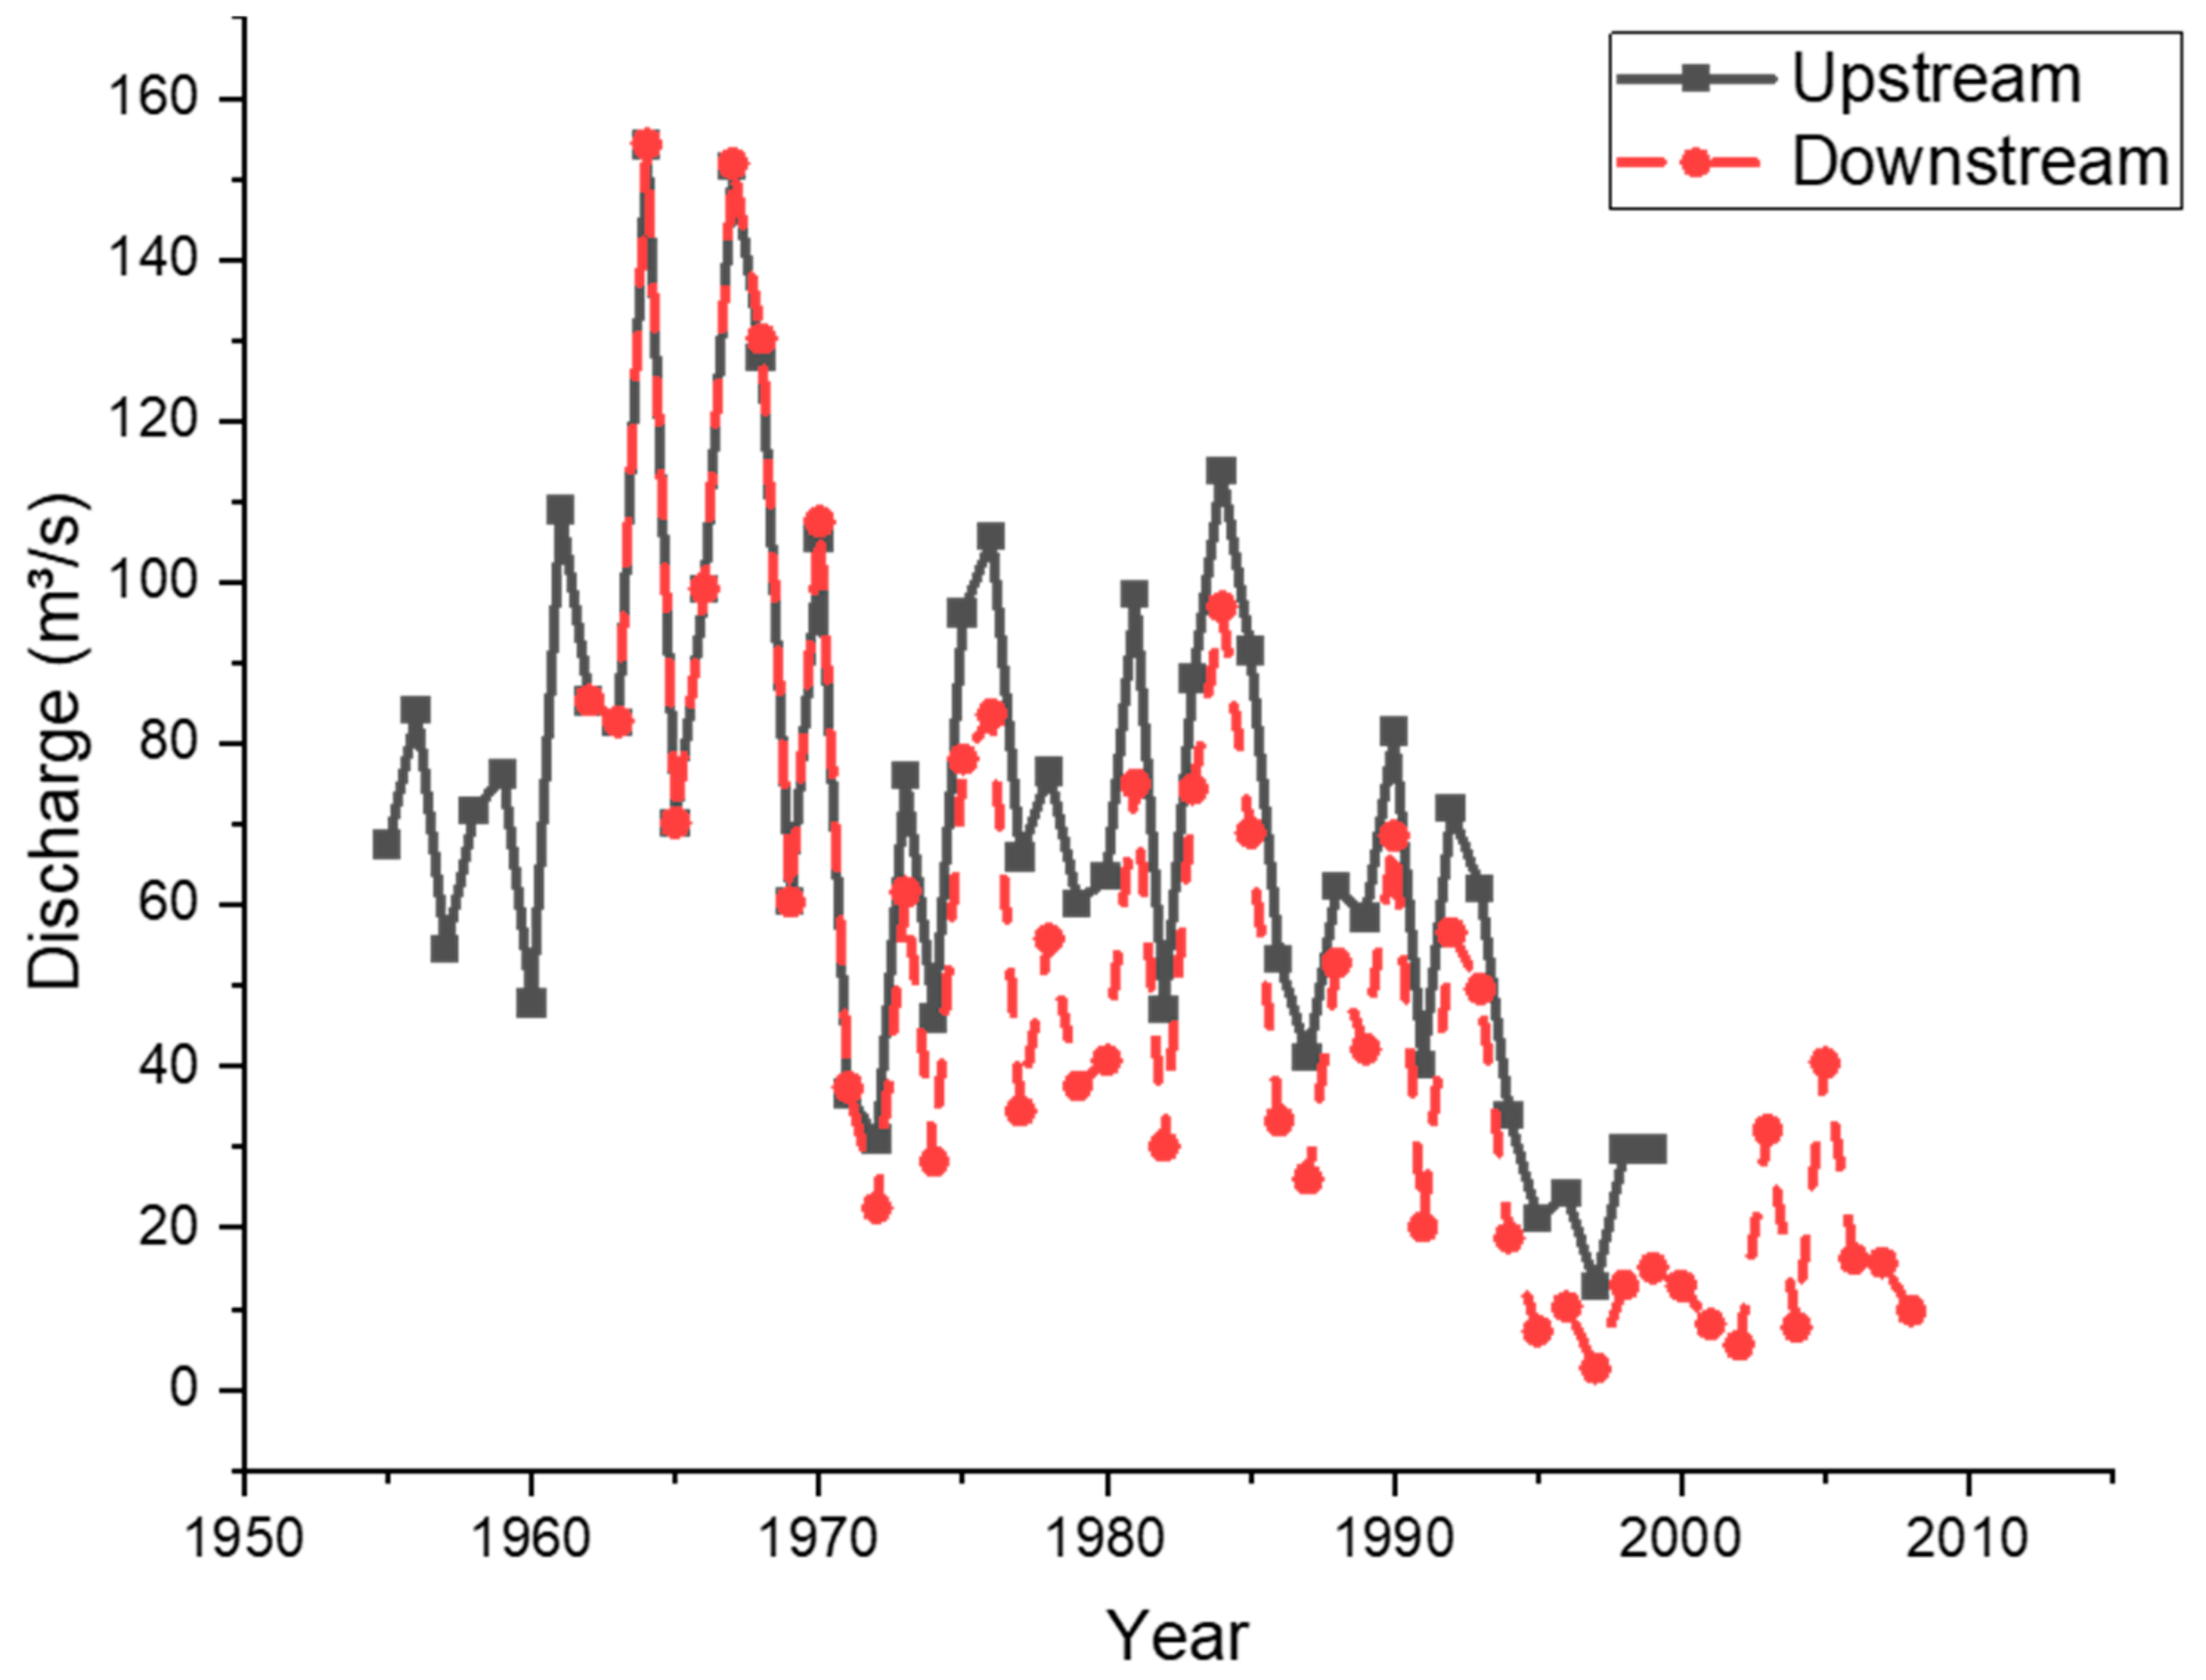
The construction of the Baojixia channel is clearly a driver of abrupt change, as the change point in 1970 at Linjiacun (daily) downstream of the Baojixia channel, which is not found upstream at Linjiacun (monthly), coincides with the construction time of the channel. From Figure 3, it can be noticed that, since 1971, there has been a significant decrease in the daily data compared to the monthly data (~30% decrease on average), which indicated the impact caused by the water diversion. Additionally, most of the discharge stations downstream of the Baojixia channel also exhibit change points around 1970, with the except of Huaxian, which is the farthest-downstream station investigated. This indicates the scale of the impact the Baojixia water diversion project had on the WRB. This analysis supports the previous studies which also attributed the change point around the 1970s to the construction of the Baojixia channel [19,21,22]. Zhang and Gu [22]. However, the 1970s are not the dominate change point in the maximum time series, which means that while the Baojixia water diversion impacted mean discharge, it did not have the same impact on the extreme discharge.

Figure 3.
A plot of the annual average discharge time-series of daily and monthly data for Linjiacun station.
Change points were also detected in the spring and winter mean discharge in the 1970s, as these are the dry seasons, but not in summer or autumn, indicating potential water supply issues. The results also suggest a spatial pattern in non-stationarity across the WRB, with all stations in the lower reaches having a change point located in 1959 in the mean summer mean, except those in the upper reaches. This spatial pattern may be caused by the distribution of climate zones within the WRB. From Figure 1, moving downstream along the Wei River, the proportion of Cwa significantly increases, while the proportion of Dwb decreases.
5. Conclusions
The aim of this study was to investigate how seasonality impacts non-stationarity across the Wei River Basin. Prior to looking at the seasonality impact, it was first necessary to determine the best approach, which was carried out at the annual scale. Four different approaches (the MK test, Pettitt test, BG algorithm, and Sen’s slope) were used to test for abrupt change points and trends in discharge and meteorological factors. For the seasonality analysis, it was determined that only the BG algorithm should be used to test for change points and Sen’s slope to determine trends. The BG algorithm was used as it produced more stable results, irrespective of record length, and was the only approach that could detect multiple change points.
Overall, 410 data-series were tested for non-stationarity, of which 111 had both significant change points and trends and a further 56 had either significant trends or change point(s). When comparing change-point detection approaches, the results showed that if a time-series had a single change-point, all three methods (the MK test, Pettit test and BG algorithm) were capable of capturing this, and the timings were fairly consistent. However, only the BG algorithm was able to detect multiple change points, not just the most significant ones. The BG algorithm was also found to be less sensitive to record length.
The overall trends for the Wei River Basin are mostly consistent across catchments, in both the annual and seasonal time-series and for the mean and maximum values. Discharge experiences significant decreasing trends, as does precipitation, while temperature shows increasing trends. However, the number of significant trends varies across the annual and seasonal time-periods. There are most significant trends in winter and spring, the dry period in this basin, suggesting non-stationarity has water-resource availability. This is also supported by the result that show mean time-series are more impacted by non-stationarity than the maximum time-series.
The analysis indicated that the majority of catchments on the main-stem of the Wei River have been impacted by non-stationarity. The largest driver of non-stationarity was the construction of the Baojixia diversion channel, as change points in mean discharge correspond to its construction.
While both decreasing trends in precipitation and an increasing trend in temperature are contributing to the decreasing discharge trend, temperature appears more important. The timing of change points in temperature corresponded more regular to change points in discharge than did precipitation.
This study also explored the potential impact that different climate zones have on the non-stationarity signals detected. However, no spatial pattern was observed in the significant trends, and only twice was spatial variability observed in change points, once in the 1970s, corresponding to the construction of the Baojixia channel, and in 1959, in the mean summer time-series. Only the latter suggests any correlation with the proportion of theclimate zone within each catchment.
Author Contributions
The material preparation, data collection, methodologies, analysis, and draft writing were performed by X.Y. and F.O. The reviewing of the draft was performed by F.O. All authors have read and agreed to the published version of the manuscript.
Funding
This research was funded by the joint scholarship between University College Dublin and the Chinese Scholarship Council. The grant number is ‘201908300018’.
Data Availability Statement
The data presented in this study are available on request from the corresponding author.
Conflicts of Interest
The authors declare no conflict of interest.
References
- Jiang, C.; Xiong, L.; Guo, S.; Xia, J.; Xu, C.Y. A process-based insight into nonstationarity of the probability distribution of annual discharge. Water Resour. Res. 2017, 53, 4214–4235. [Google Scholar] [CrossRef]
- Du, T.; Xiong, L.; Xu, C.Y.; Gippel, C.J.; Guo, S.; Liu, P. Return period and risk analysis of nonstationary low-flow series under climate change. J. Hydrol. 2015, 527, 234–250. [Google Scholar] [CrossRef]
- Lehner, F.; Wood, A.W.; Llewellyn, D.; Blatchford, D.B.; Goodbody, A.G.; Pappenberger, F. Mitigating the impacts of climate nonstationarity on seasonal streamflow predictability in the US Southwest. Geophys. Res. Lett. 2017, 44, 12208–12217. [Google Scholar] [CrossRef]
- Li, J.; Ma, Q.; Tian, Y.; Lei, Y.; Zhang, T.; Feng, P. Flood scaling under nonstationarity in Daqinghe River basin, China. Nat. Hazards 2019, 98, 675–696. [Google Scholar] [CrossRef]
- Milly, P.C.; Betancourt, J.; Falkenmark, M.; Hirsch, R.M.; Kundzewicz, Z.W.; Lettenmaier, D.P.; Stouffer, R.J. Stationarity is dead: Whither water management? Science 2008, 319, 573–574. [Google Scholar] [CrossRef]
- Slater, L.J.; Anderson, B.; Buechel, M.; Dadson, S.; Han, S.; Harrigan, S.; Kelder, T.; Kowal, K.; Lees, T.; Matthews, T.; et al. Nonstationary weather and water extremes: A review of methods for their detection, attribution, and management. Hydrol. Earth Syst. Sci. 2021, 25, 3897–3935. [Google Scholar] [CrossRef]
- Kendall, M.G. Rank Correlation Methods, 4th ed.; Griffin: London, UK, 1970. [Google Scholar]
- Hirsch, R.M.; Slack, J.R.; Smith, R.A. Techniques of trend analysis for monthly water quality data. Water Resour. Res. 1982, 18, 107–121. [Google Scholar] [CrossRef]
- Sen, P.K. Estimates of the Regression Coefficient Based on Kendall’s Tau. J. Am. Stat. Assoc. 1968, 63, 1379–1389. [Google Scholar] [CrossRef]
- Spearman, C. The proof and measurement of association between two things. Am. J. Psychol. 1987, 100, 441–471. [Google Scholar] [CrossRef]
- Huang, N.E.; Shen, Z.; Long, S.R.; Wu, M.C.; Shih, H.H.; Zheng, Q.; Yen, N.C.; Tung, C.C.; Liu, H.H. The empirical mode decomposition and the Hilbert spectrum for nonlinear and non-stationary time series analysis. Proc. R. Soc. Lond. Ser. A Math. Phys. Eng. Sci. 1998, 454, 903–995. [Google Scholar] [CrossRef]
- Pettitt, A.N. A Non-Parametric Approach to the Change-Point Problem. Appl. Stat. 1979, 28, 126–135. [Google Scholar] [CrossRef]
- Bernaola-Galván, P.; Ivanov, P.C.; Amaral, L.A.N.; Stanley, H.E. Scale invariance in the nonstationarity of human heart rate. Phys. Rev. Lett. 2001, 87, 168105. [Google Scholar] [CrossRef]
- Hu, M.; Sayama, T.; Try, S.; Takara, K.; Tanaka, K. Trend analysis of hydroclimatic variables in the Kamo River Basin, Japan. Water 2019, 11, 1782. [Google Scholar] [CrossRef]
- Anghileri, D.; Pianosi, F.; Soncini-Sessa, R. Trend detection in seasonal data: From hydrology to water resources. J. Hydrol. 2014, 511, 171–179. [Google Scholar] [CrossRef]
- Sang, Y.F.; Wang, Z.; Liu, C. Comparison of the MK test and EMD method for trend identification in hydrological time series. J. Hydrol. 2014, 510, 293–298. [Google Scholar] [CrossRef]
- Zhang, C.; Zhang, B.; Li, W.; Liu, M. Response of streamflow to climate change and human activity in Xitiaoxi river basin in China. Hydrol. Process. 2014, 28, 43–50. [Google Scholar] [CrossRef]
- Huang, S.; Liu, D.; Huang, Q.; Chen, Y. Contributions of climate variability and human activities to the variation of discharge in the Wei River Basin, China. Hydrol. Sci. J. 2016, 61, 1026–1039. [Google Scholar] [CrossRef]
- Li, Y.; Chang, J.; Wang, Z.; Li, H. Detection of abrupt changes in discharge in the Weihe River Basin. Adv. Meteorol. 2016, 2016, 6962082. [Google Scholar] [CrossRef]
- Wu, W.; Xu, Z.X.; Liu, X.C. Impact of Baojixia water diversion works on the hydrologic regime in the Wei River basin. Procedia Environ. Sci. 2012, 13, 1653–1662. [Google Scholar] [CrossRef]
- Xiong, L.; Jiang, C.; Du, T. Statistical attribution analysis of the nonstationarity of the annual discharge series of the Weihe River. Water Sci. Technol. 2014, 70, 939–946. [Google Scholar] [CrossRef]
- Zhang, H.B.; Lei, G.U. Hydrological variation analysis in Wei River basin. J. Water Resour. Res. 2014, 3, 1–8. [Google Scholar] [CrossRef]
- Meng, E.; Huang, S.; Huang, Q.; Fang, W.; Wu, L.; Wang, L. A robust method for non-stationary streamflow prediction based on improved EMD-SVM model. J. Hydrol. 2019, 568, 462–478. [Google Scholar] [CrossRef]
- Liu, S.; Huang, S.; Xie, Y.; Huang, Q.; Wang, H.; Leng, G. Assessing the non-stationarity of low flows and their scale-dependent relationships with climate and human forcing. Sci. Total Environ. 2019, 687, 244–256. [Google Scholar] [CrossRef]
- Zou, L.; Xia, J.; She, D. Analysis of impacts of climate change and human activities on hydrological drought: A case study in the Wei River Basin, China. Water Resour. Manag. 2018, 32, 1421–1438. [Google Scholar] [CrossRef]
- Liu, S.; Huang, S.; Xie, Y.; Wang, H.; Leng, G.; Huang, Q.; Wei, X.; Wang, L. Identification of the non-stationarity of floods: Changing patterns, causes, and implications. Water Resour. Manag. 2019, 33, 939–953. [Google Scholar] [CrossRef]
- Yan, L.; Xiong, L.; Guo, S.; Xu, C.Y.; Xia, J.; Du, T. Comparison of four nonstationary hydrologic design methods for changing environment. J. Hydrol. 2017, 551, 132–150. [Google Scholar] [CrossRef]
- Ichinose, T.; Liu, K.; Onishi, A.; Shi, F. Grouping of water supply-and-demand structure in the Yellow River Basin of China: Focusing on balance between groundwater and surface-water. Sustainability 2019, 11, 3984. [Google Scholar] [CrossRef]
- Xu, Z.; Zuo, D. Simulation of blue and green water resources in the Wei River basin, China. Proc. Int. Assoc. Hydrol. Sci. 2014, 364, 486–491. [Google Scholar] [CrossRef]
- Kousali, M.; Salarijazi, M.; Ghorbani, K. Estimation of Non-Stationary Behavior in Annual and Seasonal Surface Freshwater Volume Discharged into the Gorgan Bay, Iran. Nat. Resour. Res. 2022, 31, 835–847. [Google Scholar] [CrossRef]
- Zuo, D.; Xu, Z.; Wu, W.; Zhao, J.; Zhao, F. Identification of streamflow response to climate change and human activities in the Wei River Basin, China. Water Resour. Manag. 2014, 28, 833–851. [Google Scholar] [CrossRef]
- Köppen, W.; Volken, E.; Brönnimann, S. The thermal zones of the earth according to the duration of hot, moderate and cold periods and to the impact of heat on the organic world (Translated from: Die Wärmezonen der Erde, nach der Dauer der heissen, gemässigten und kalten Zeit und nach der Wirkung der Wärme auf die organische Welt betrachtet, Meteorol Z 1884, 1, 215–226). Meteorol. Z. 2011, 20, 351–360. [Google Scholar]
- National Meteorological Information Center. Daily Meteorological Dataset of BASIC Meteorological Elements of China National Surface Weather Station (V3.0) (1951–2010); A Big Earth Data Platform for Three Poles: Lanzhou, China, 2019. Available online: http://poles.tpdc.ac.cn/zh-hans/data/52c77e9c-df4a-4e27-8e97-d363fdfce10a/ (accessed on 1 September 2024).
- Liu, S.; Huang, S.; Huang, Q.; Xie, Y.; Leng, G.; Luan, J.; Song, X.; Wei, X.; Li, X. Identification of the non-stationarity of extreme precipitation events and correlations with large-scale ocean-atmospheric circulation patterns: A case study in the Wei River Basin, China. J. Hydrol. 2017, 548, 184–195. [Google Scholar] [CrossRef]
- Yue, S.; Pilon, P.; Cavadias, G. Power of the Mann–Kendall and Spearman’s rho tests for detecting monotonic trends in hydrological series. J. Hydrol. 2002, 259, 254–271. [Google Scholar] [CrossRef]
- Farris, S.; Deidda, R.; Viola, F.; Mascaro, G. On the role of serial correlation and field significance in detecting changes in extreme precipitation frequency. Water Resour. Res. 2021, 57, e2021WR030172. [Google Scholar] [CrossRef]
- Mallakpour, I.; Villarini, G. A simulation study to examine the sensitivity of the Pettitt test to detect abrupt changes in mean. Hydrol. Sci. J. 2016, 61, 245–254. [Google Scholar] [CrossRef]
- Fukuda, K.; Stanley, H.E.; Amaral, L.A.N. Heuristic segmentation of a nonstationary time series. Phys. Rev. E 2004, 69, 021108. [Google Scholar] [CrossRef]
Disclaimer/Publisher’s Note: The statements, opinions and data contained in all publications are solely those of the individual author(s) and contributor(s) and not of MDPI and/or the editor(s). MDPI and/or the editor(s) disclaim responsibility for any injury to people or property resulting from any ideas, methods, instructions or products referred to in the content. |
© 2024 by the authors. Licensee MDPI, Basel, Switzerland. This article is an open access article distributed under the terms and conditions of the Creative Commons Attribution (CC BY) license (https://creativecommons.org/licenses/by/4.0/).