
Characterization of Groundwater Hydrochemistry and Temporal Dynamics of Water Quality in the Northern Baiquan Spring Basin


 ,
,
Abstract
1. Introduction
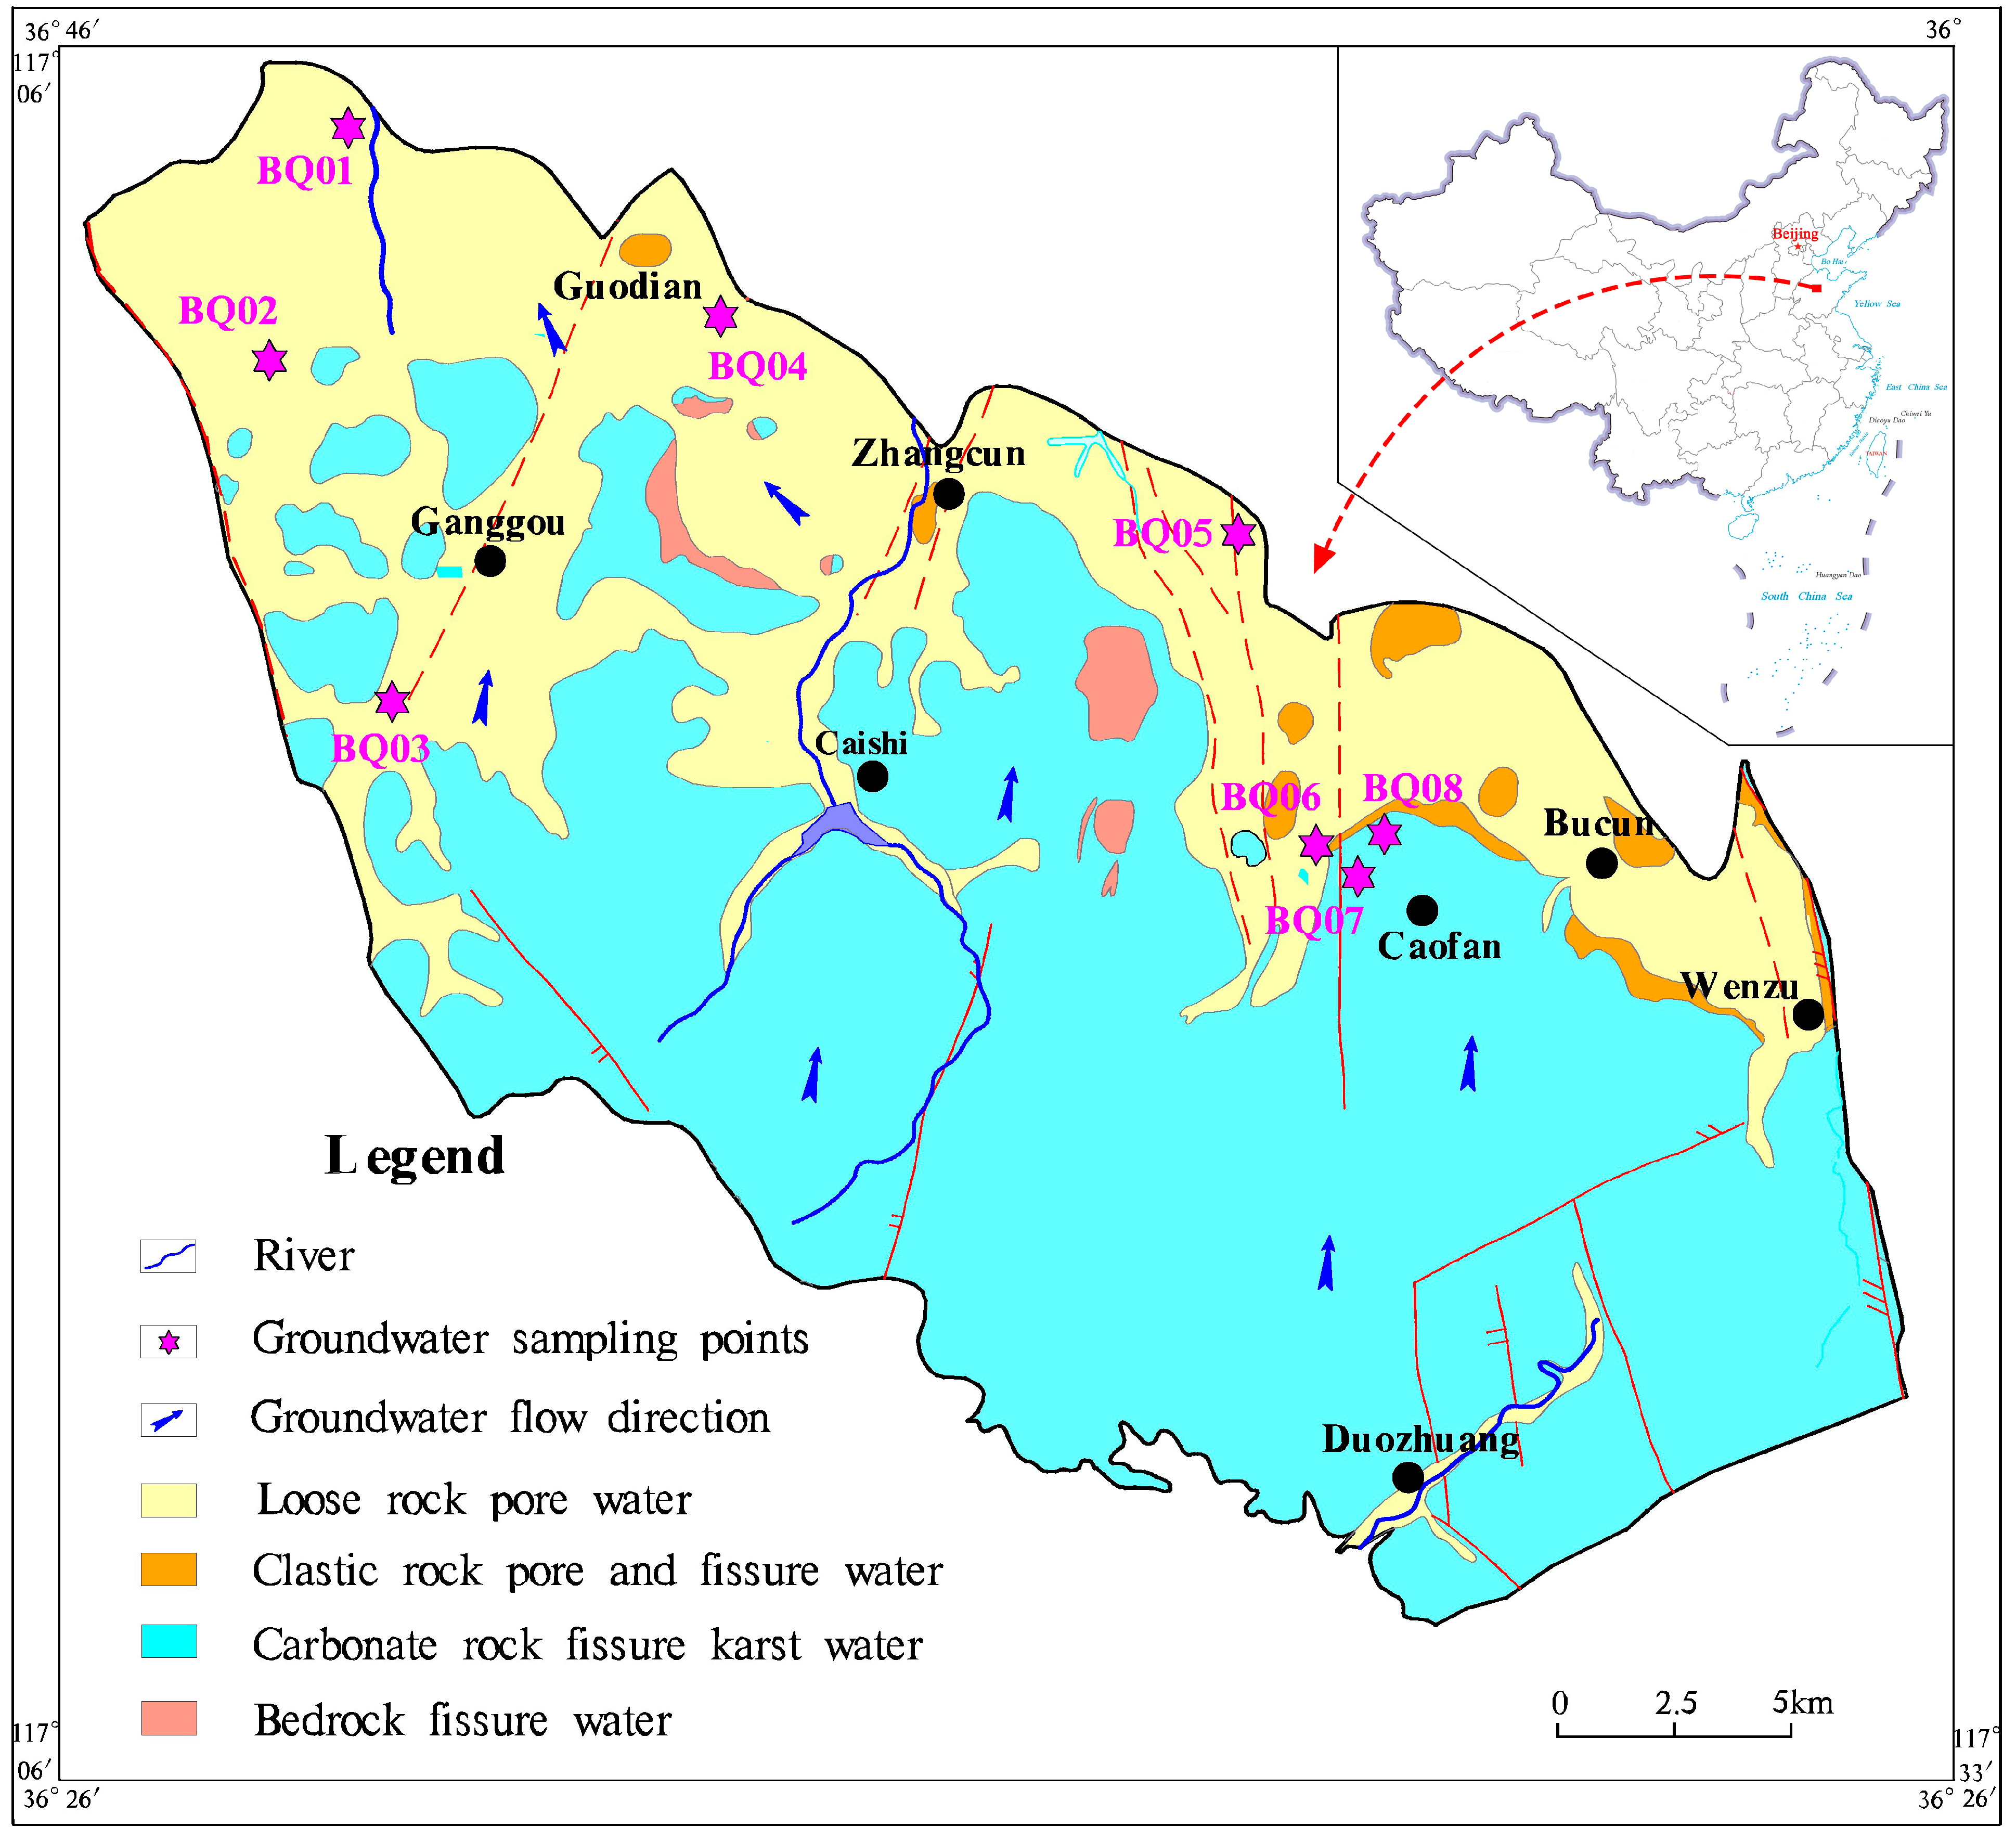
Study Area
2. Materials and Methods
2.1. Sampling
2.2. Testing
2.3. Groundwater Quality Evaluation
3. Results
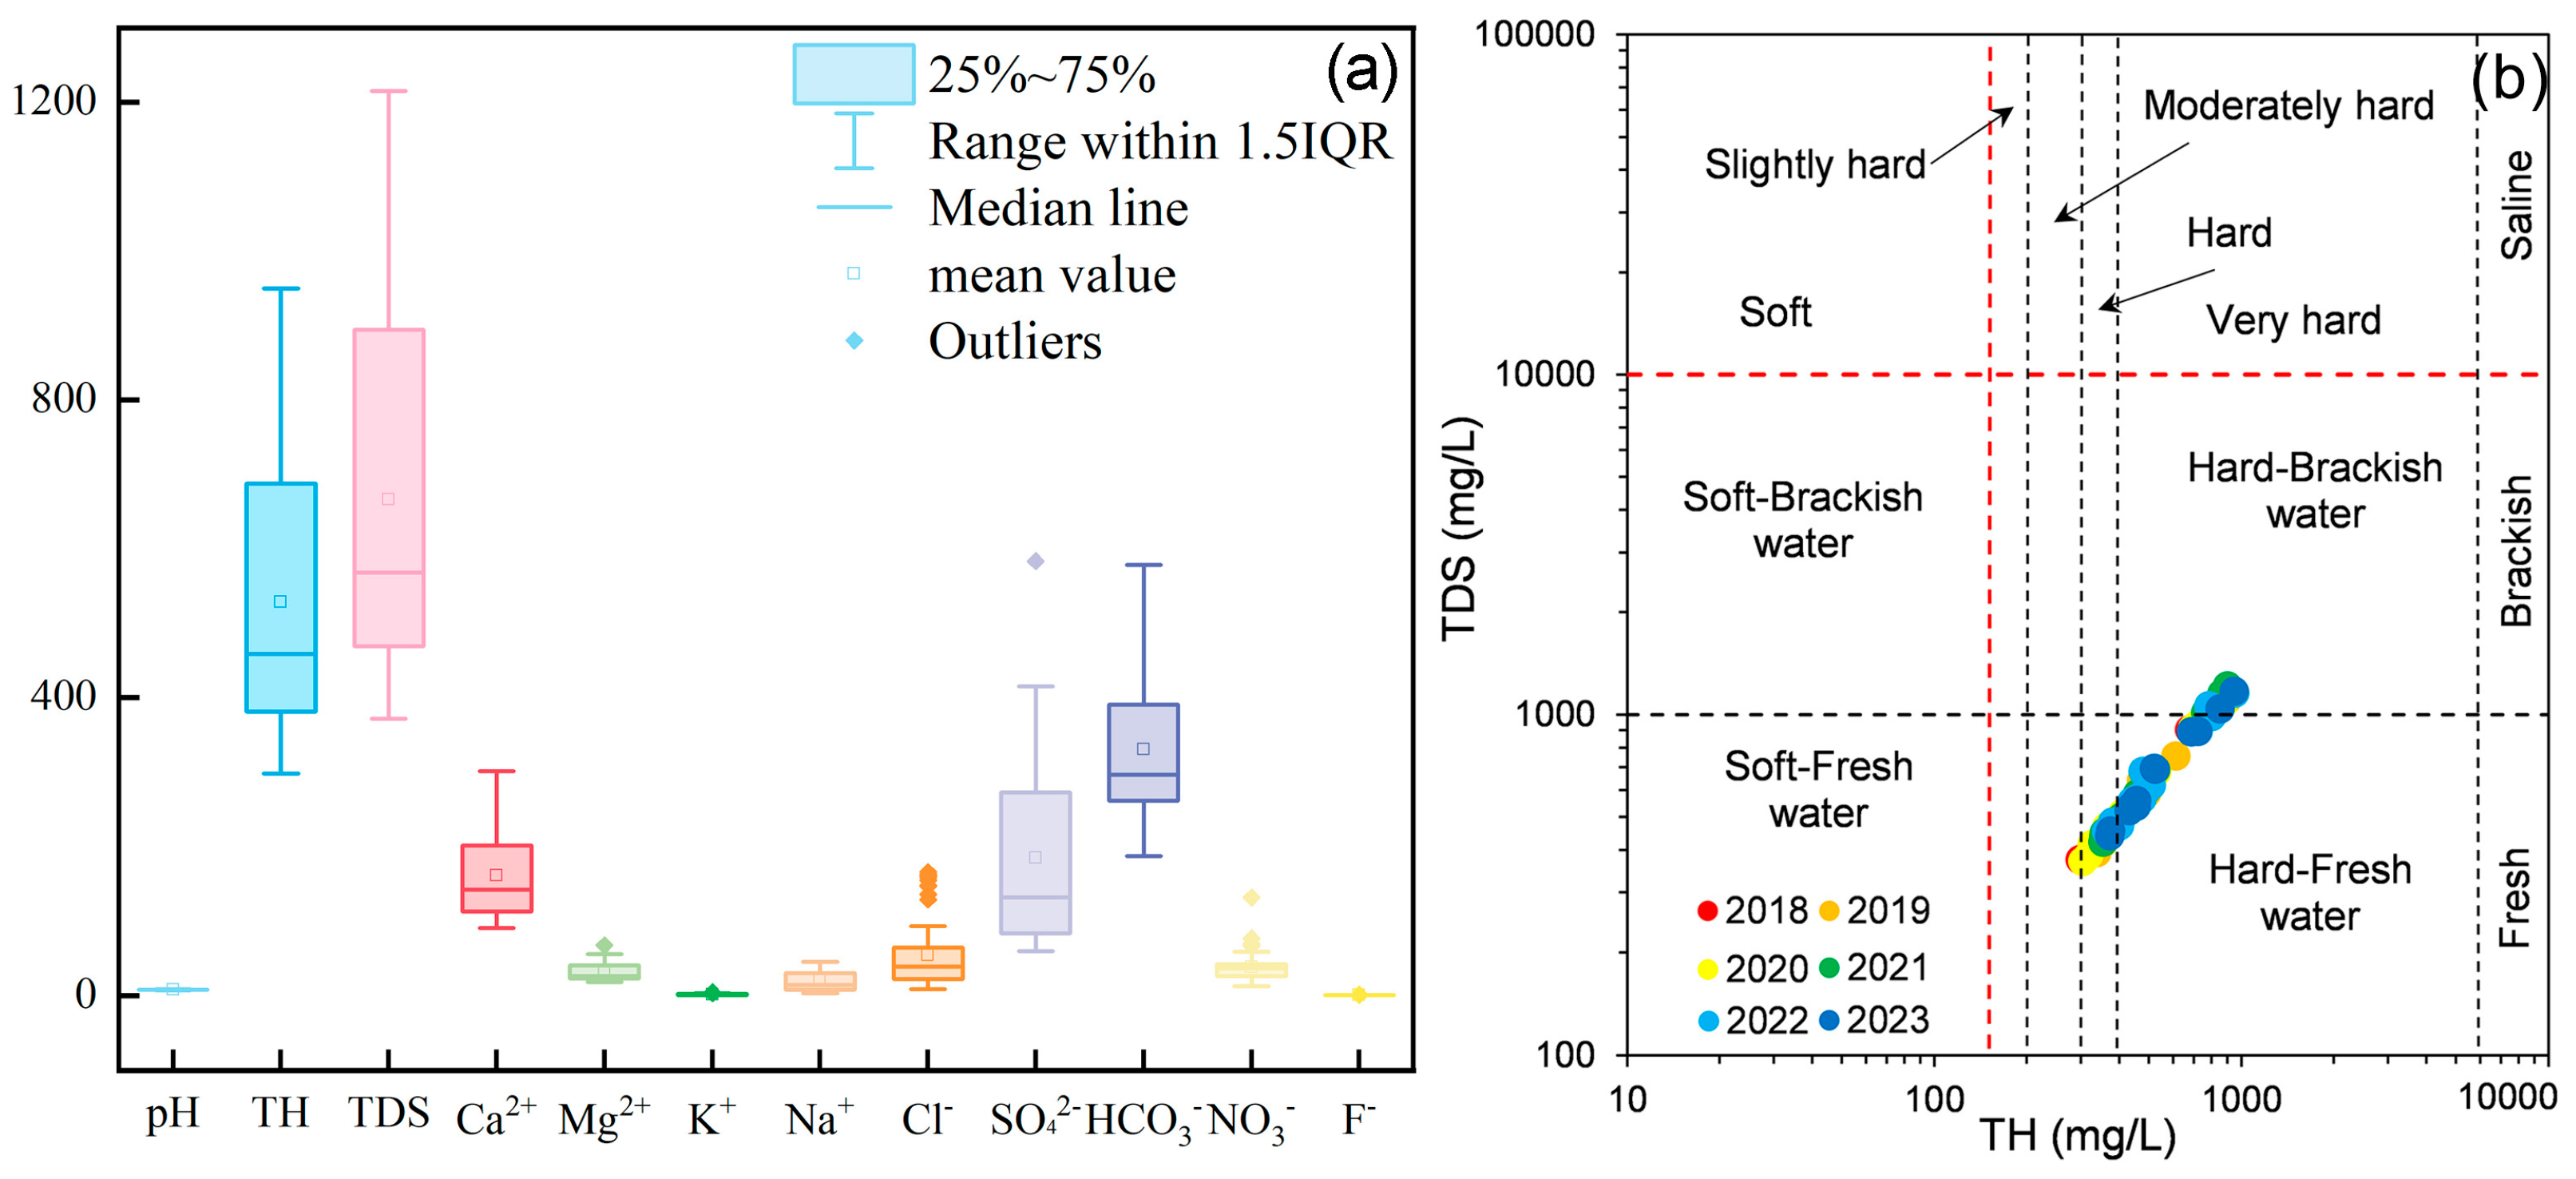
3.1. Overall Characteristics of Groundwater Hydrochemistry
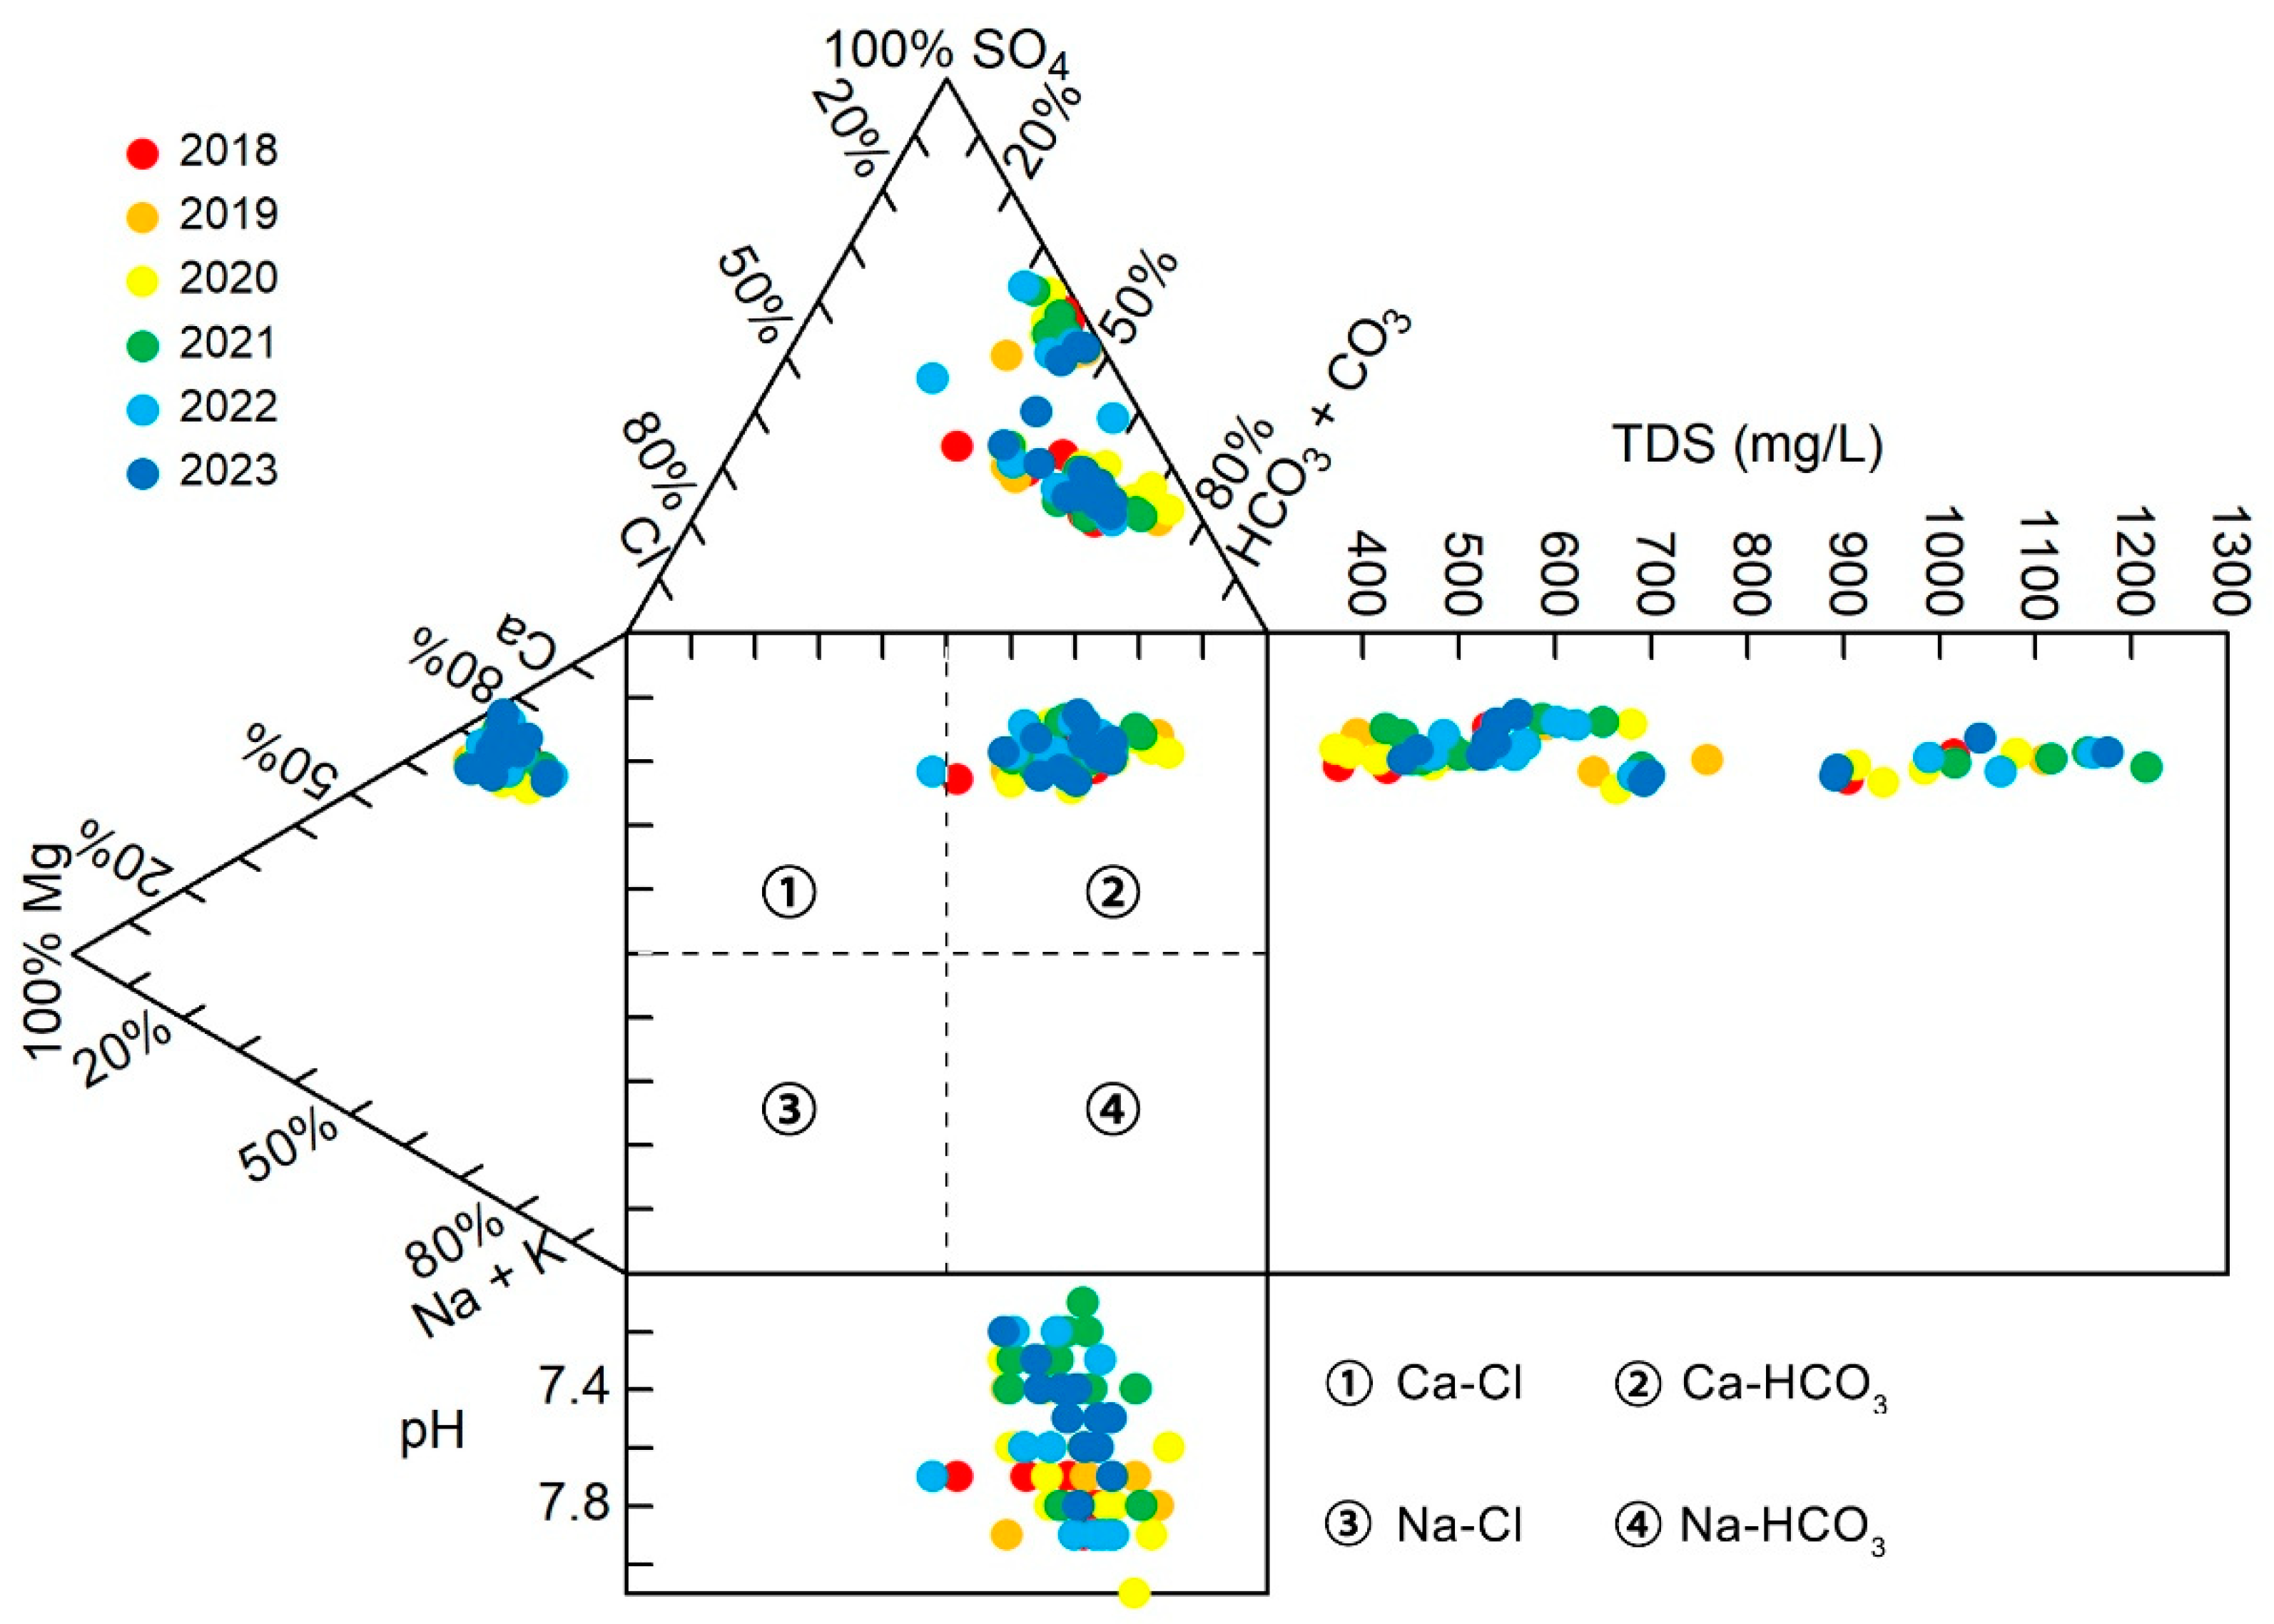
3.2. Hydrochemical Types
3.3. Water Quality Evaluation Results
4. Discussion
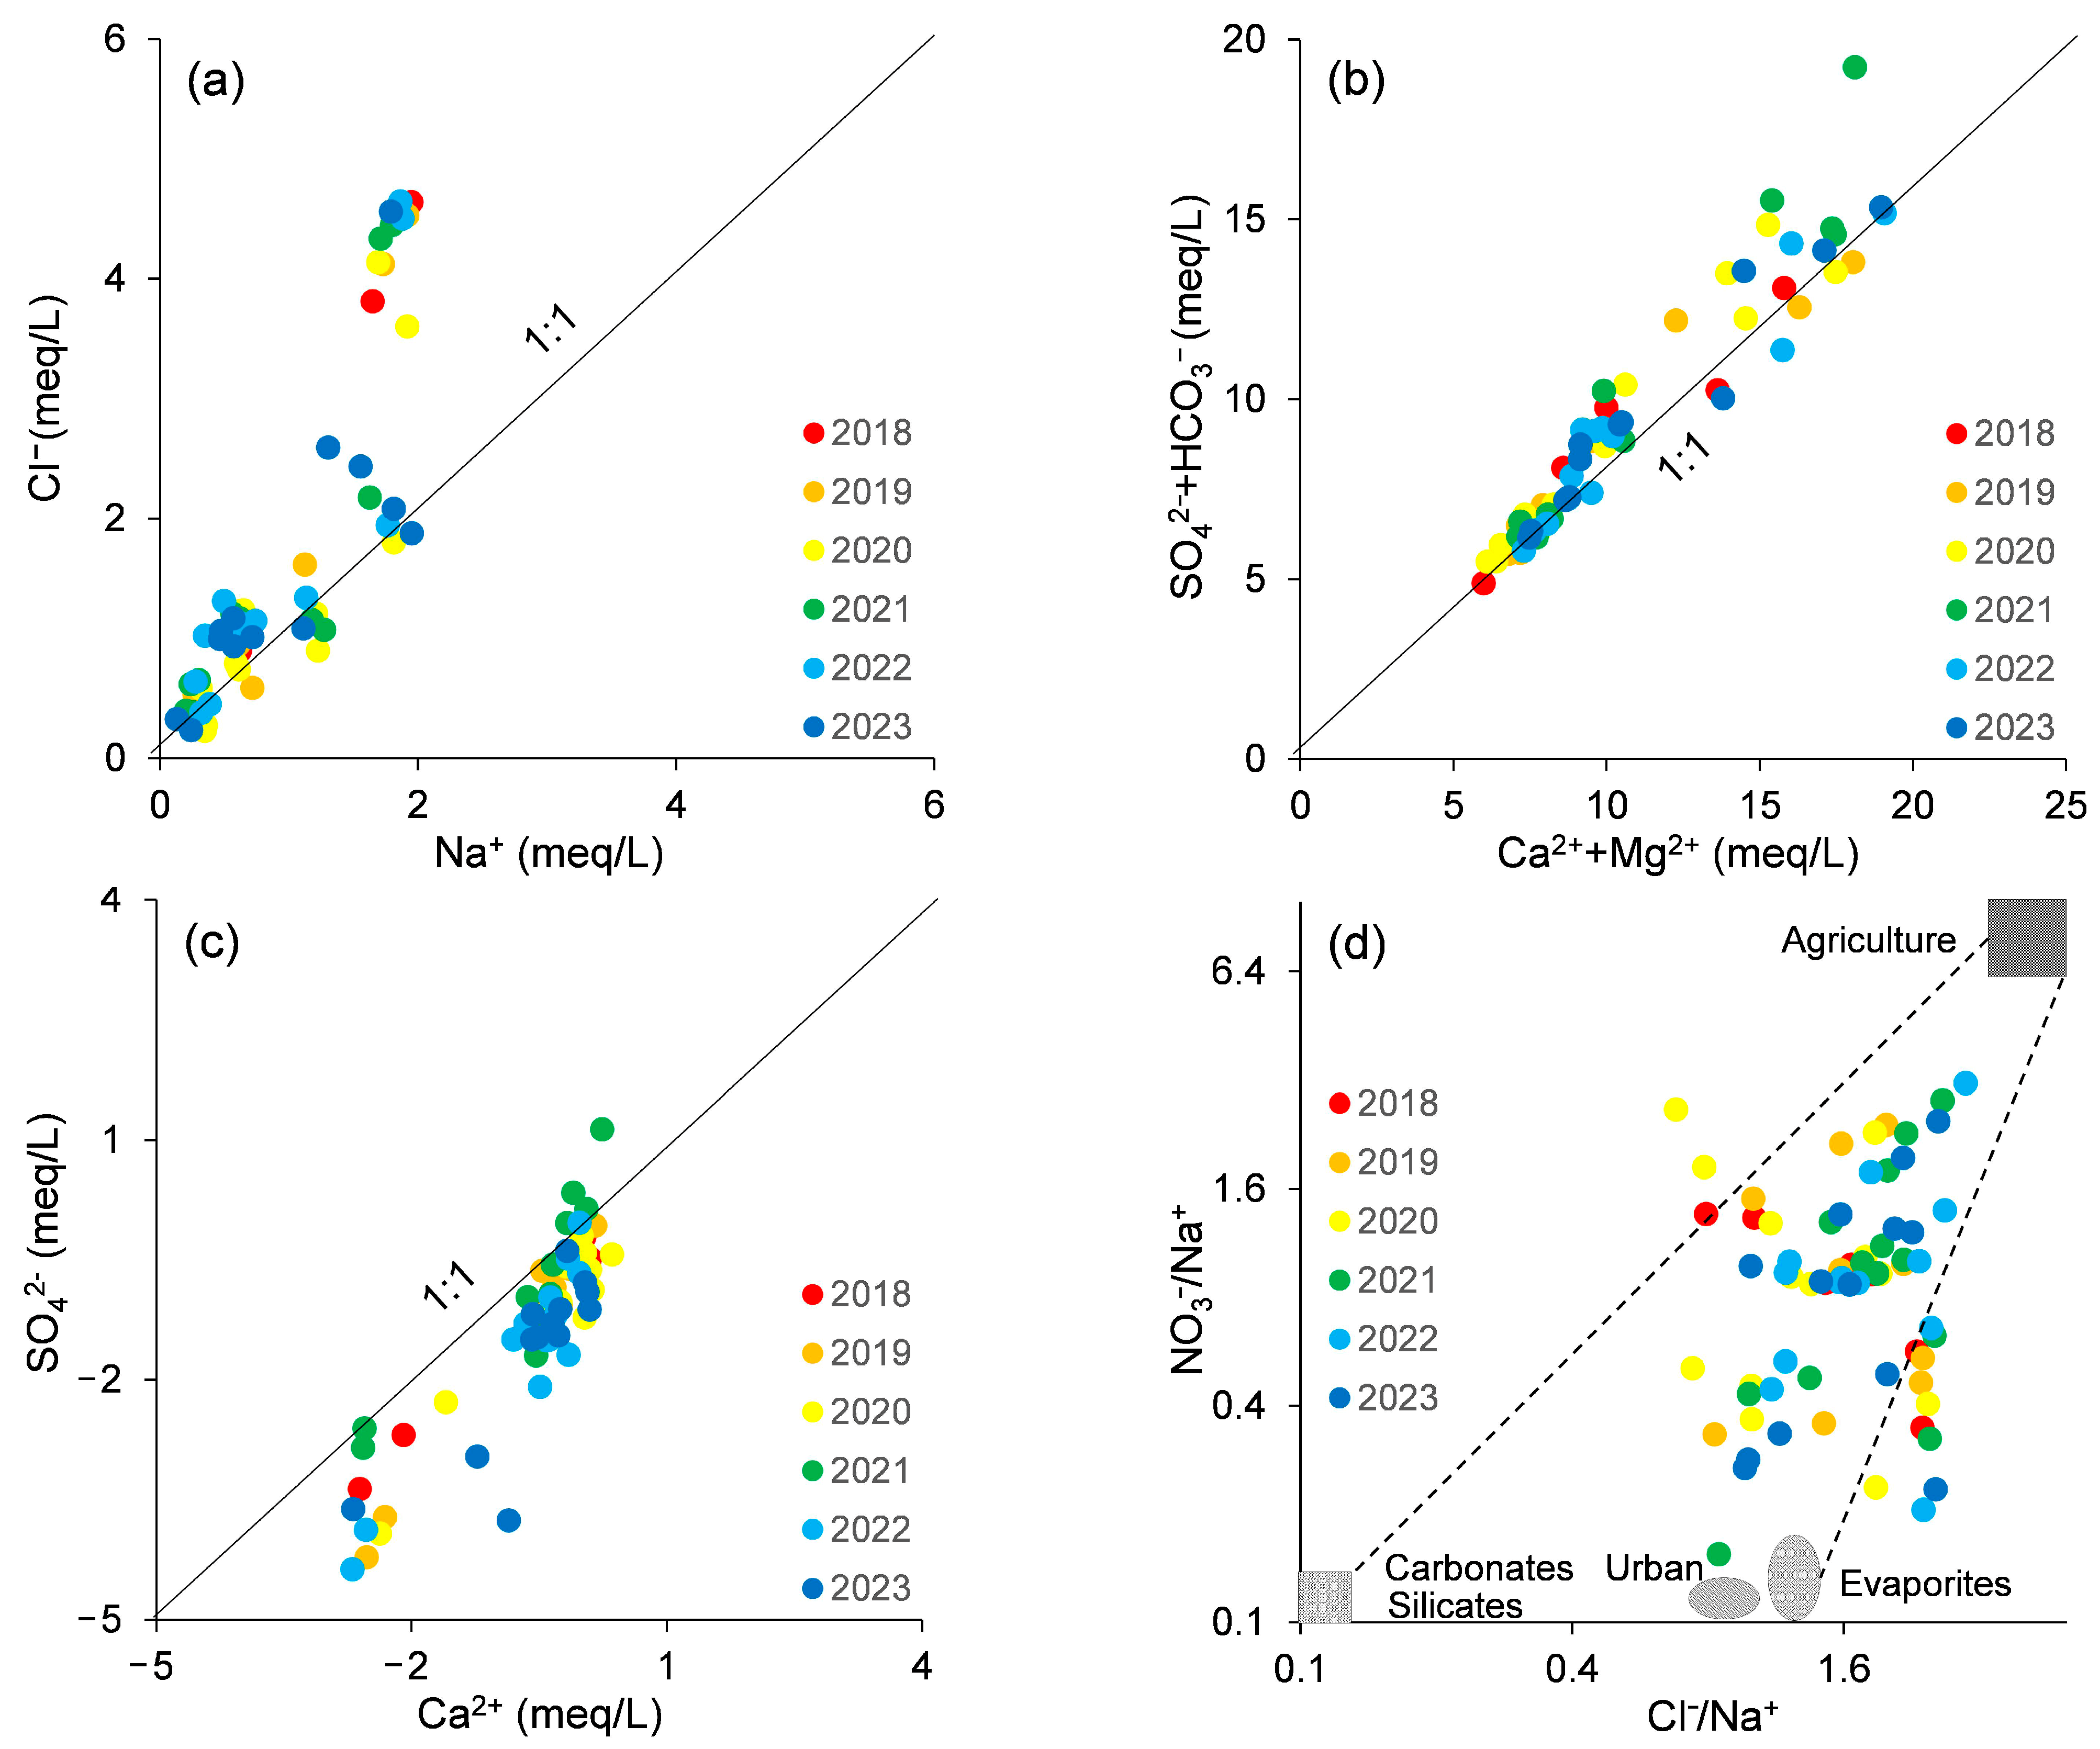
4.1. Sources of Major Ions
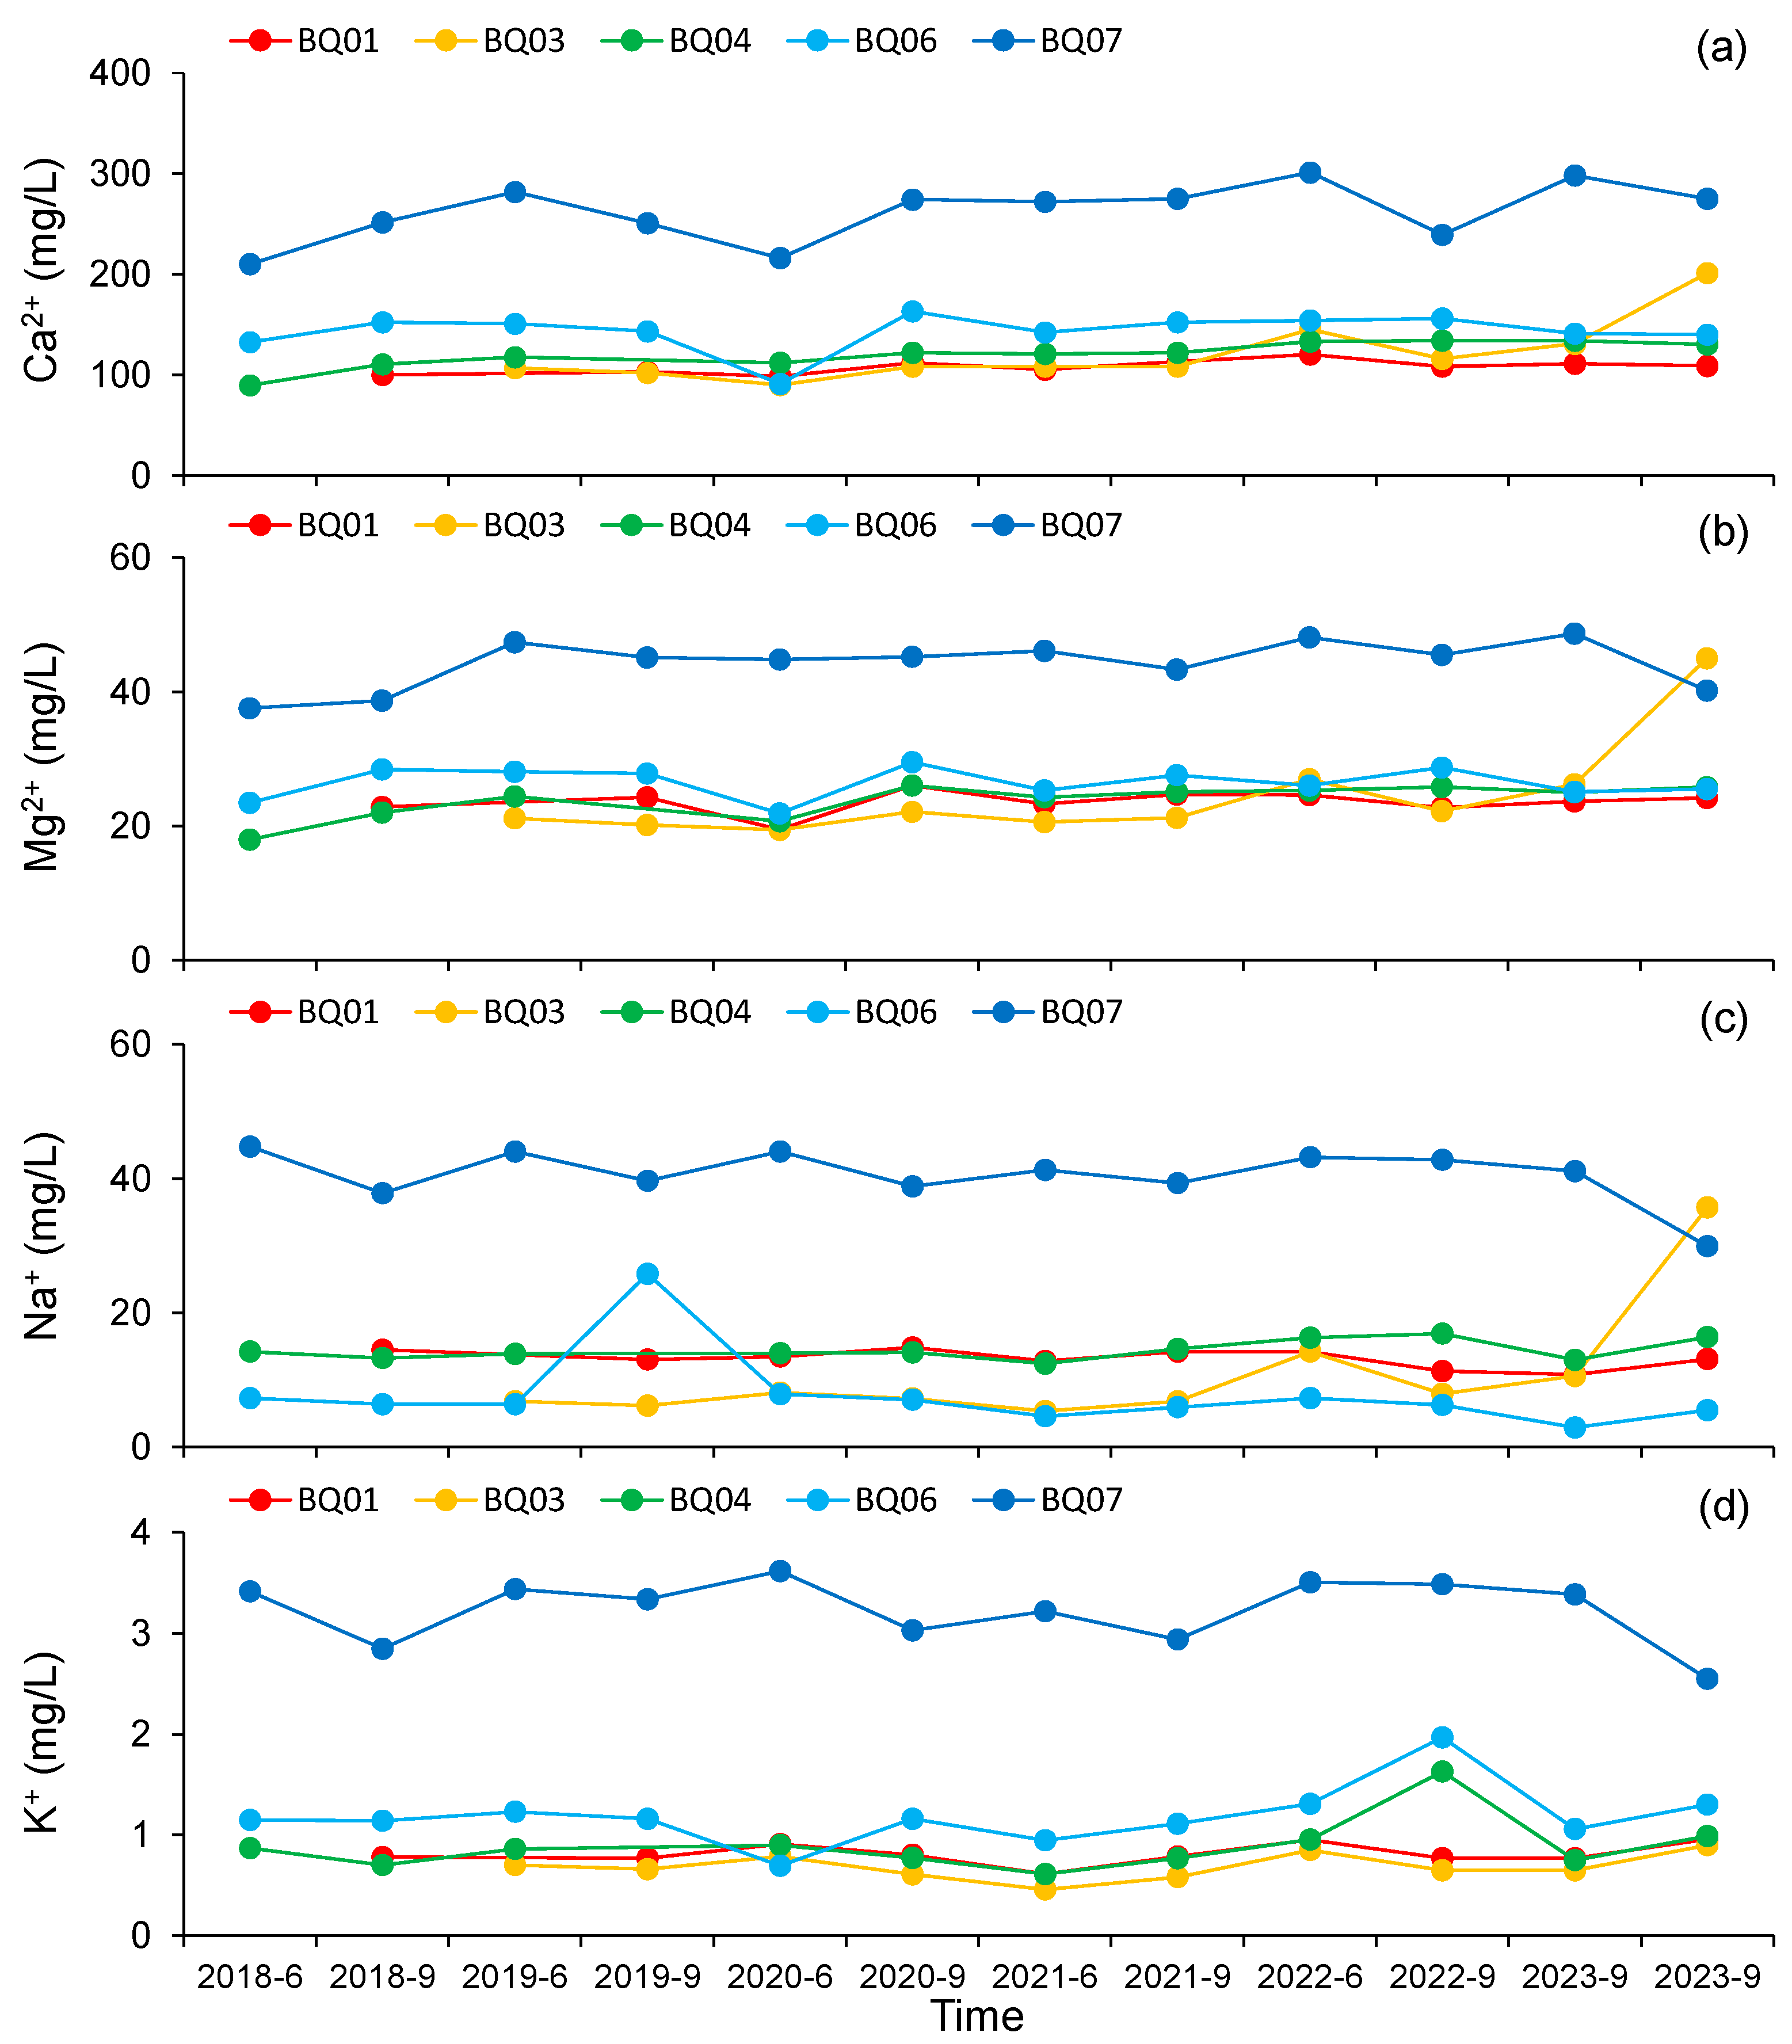
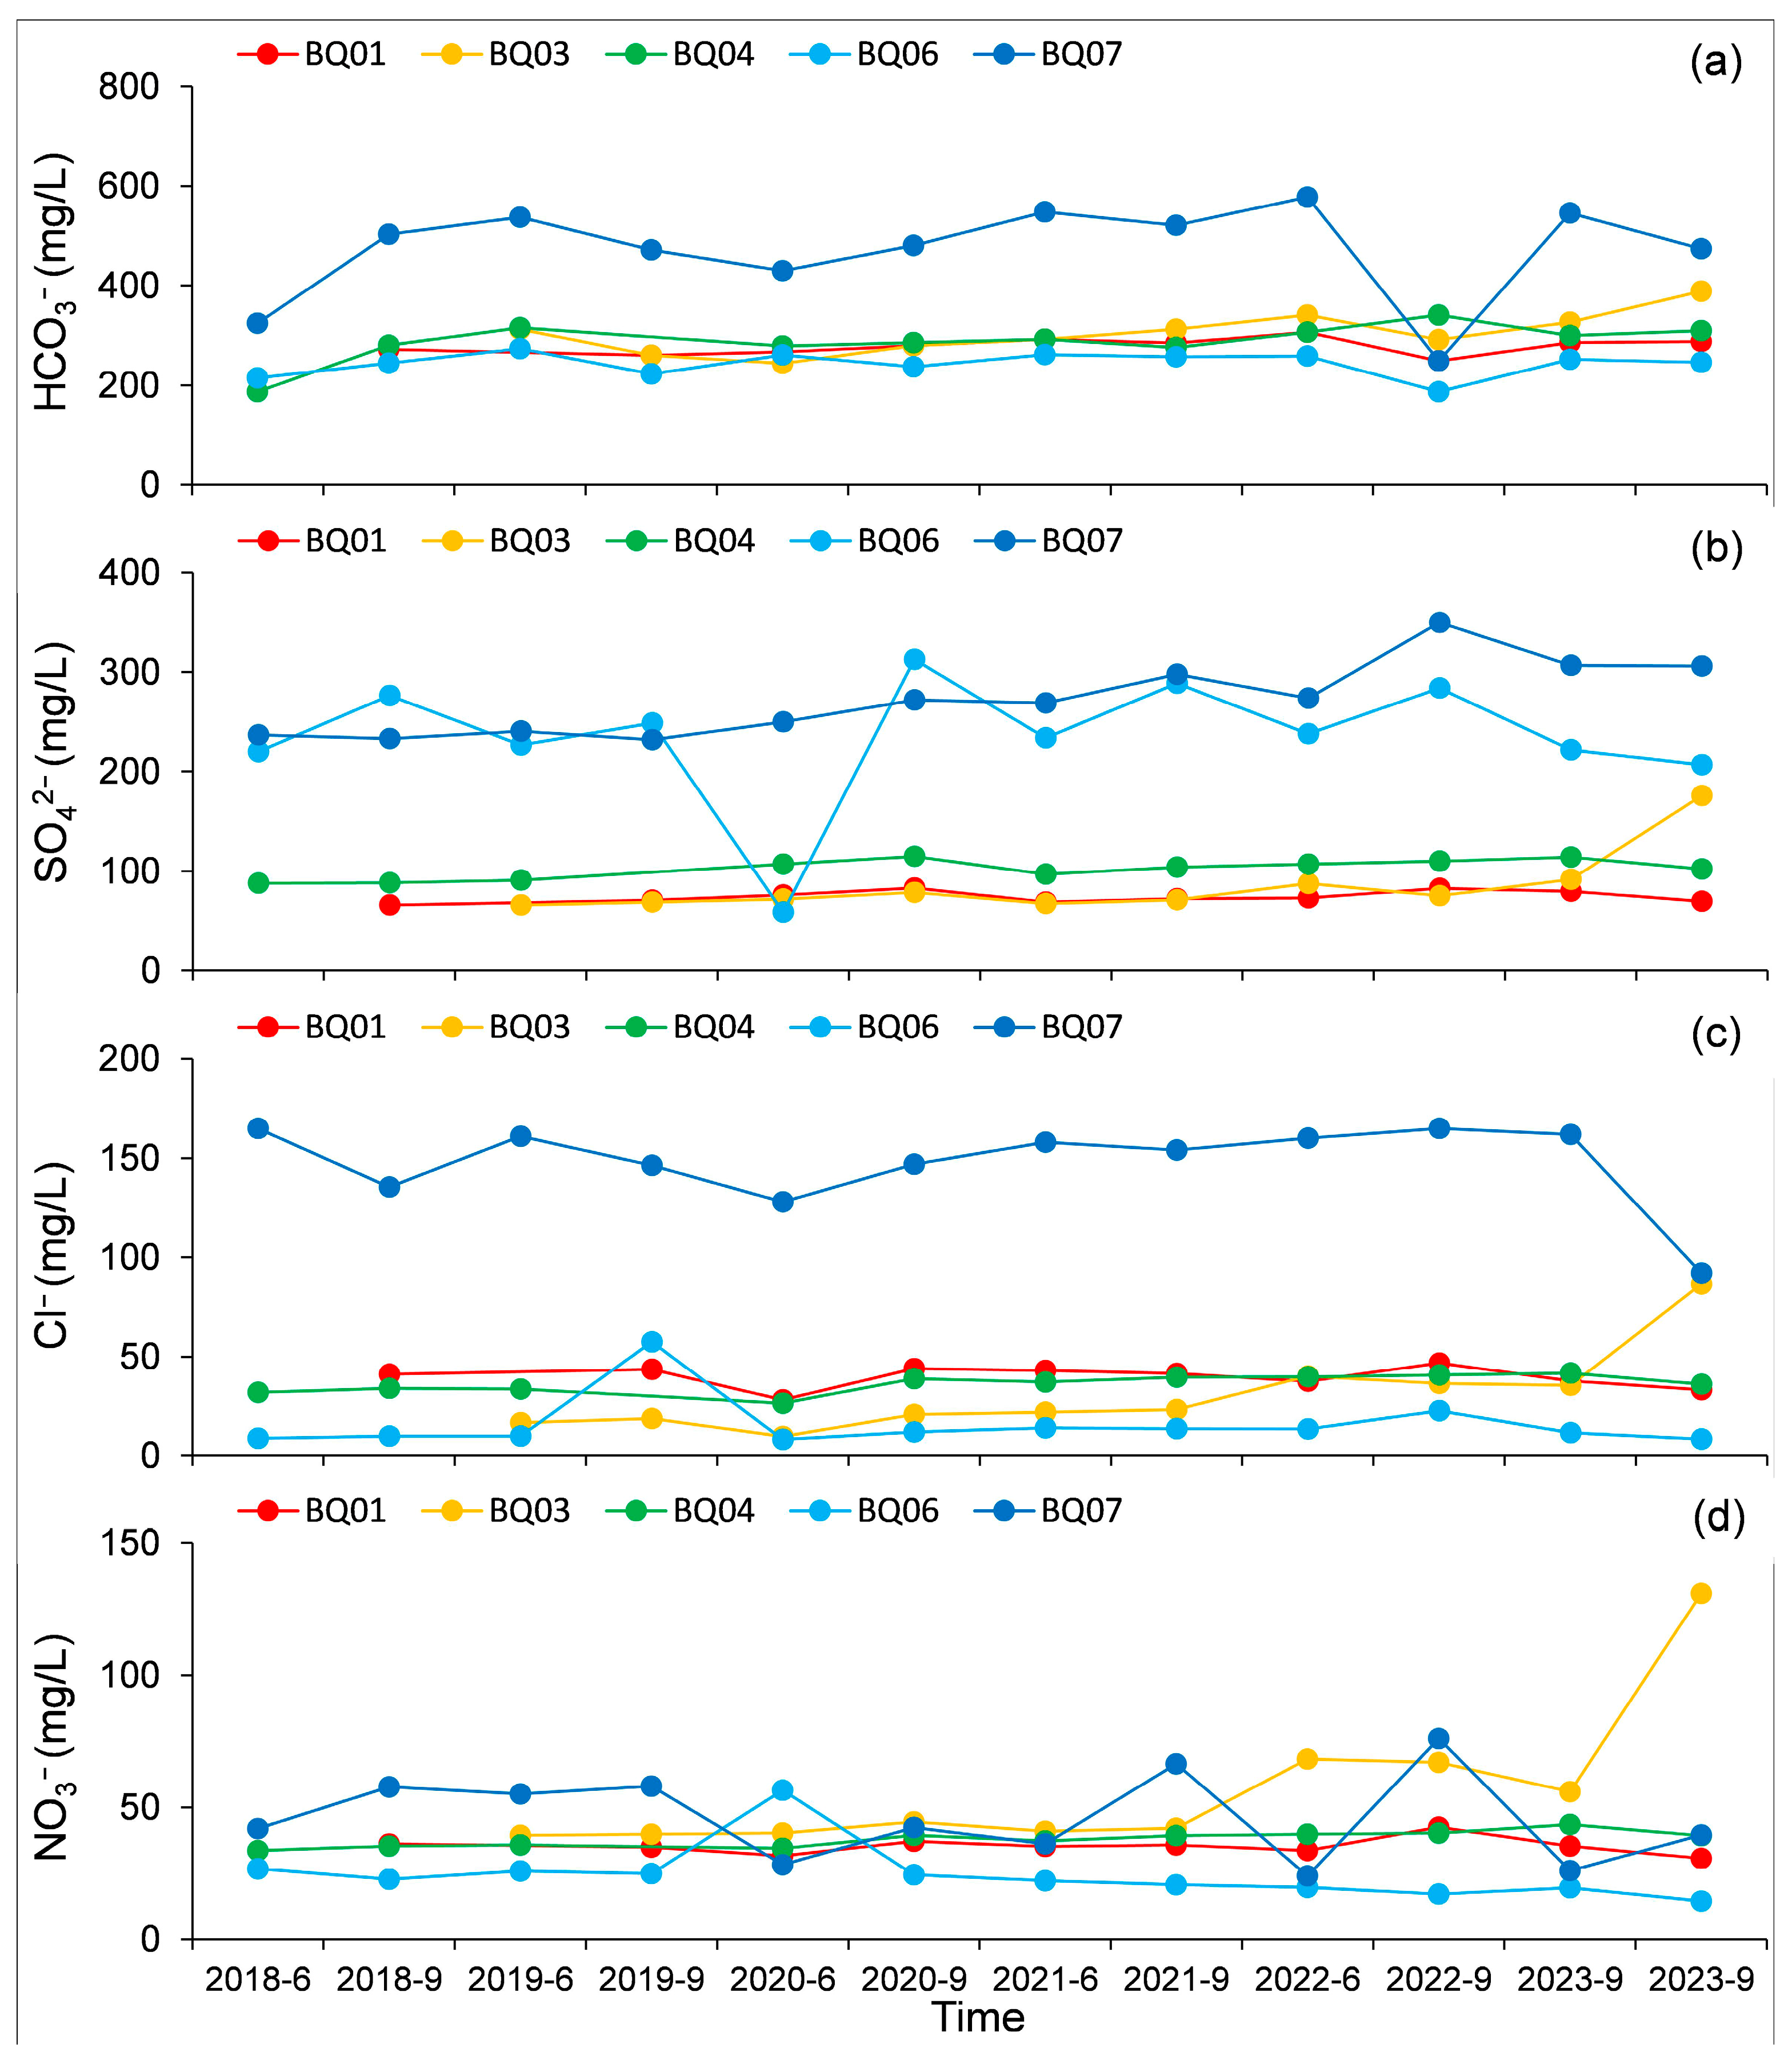
4.2. Variation Characteristics of Major Ion Content in Groundwater
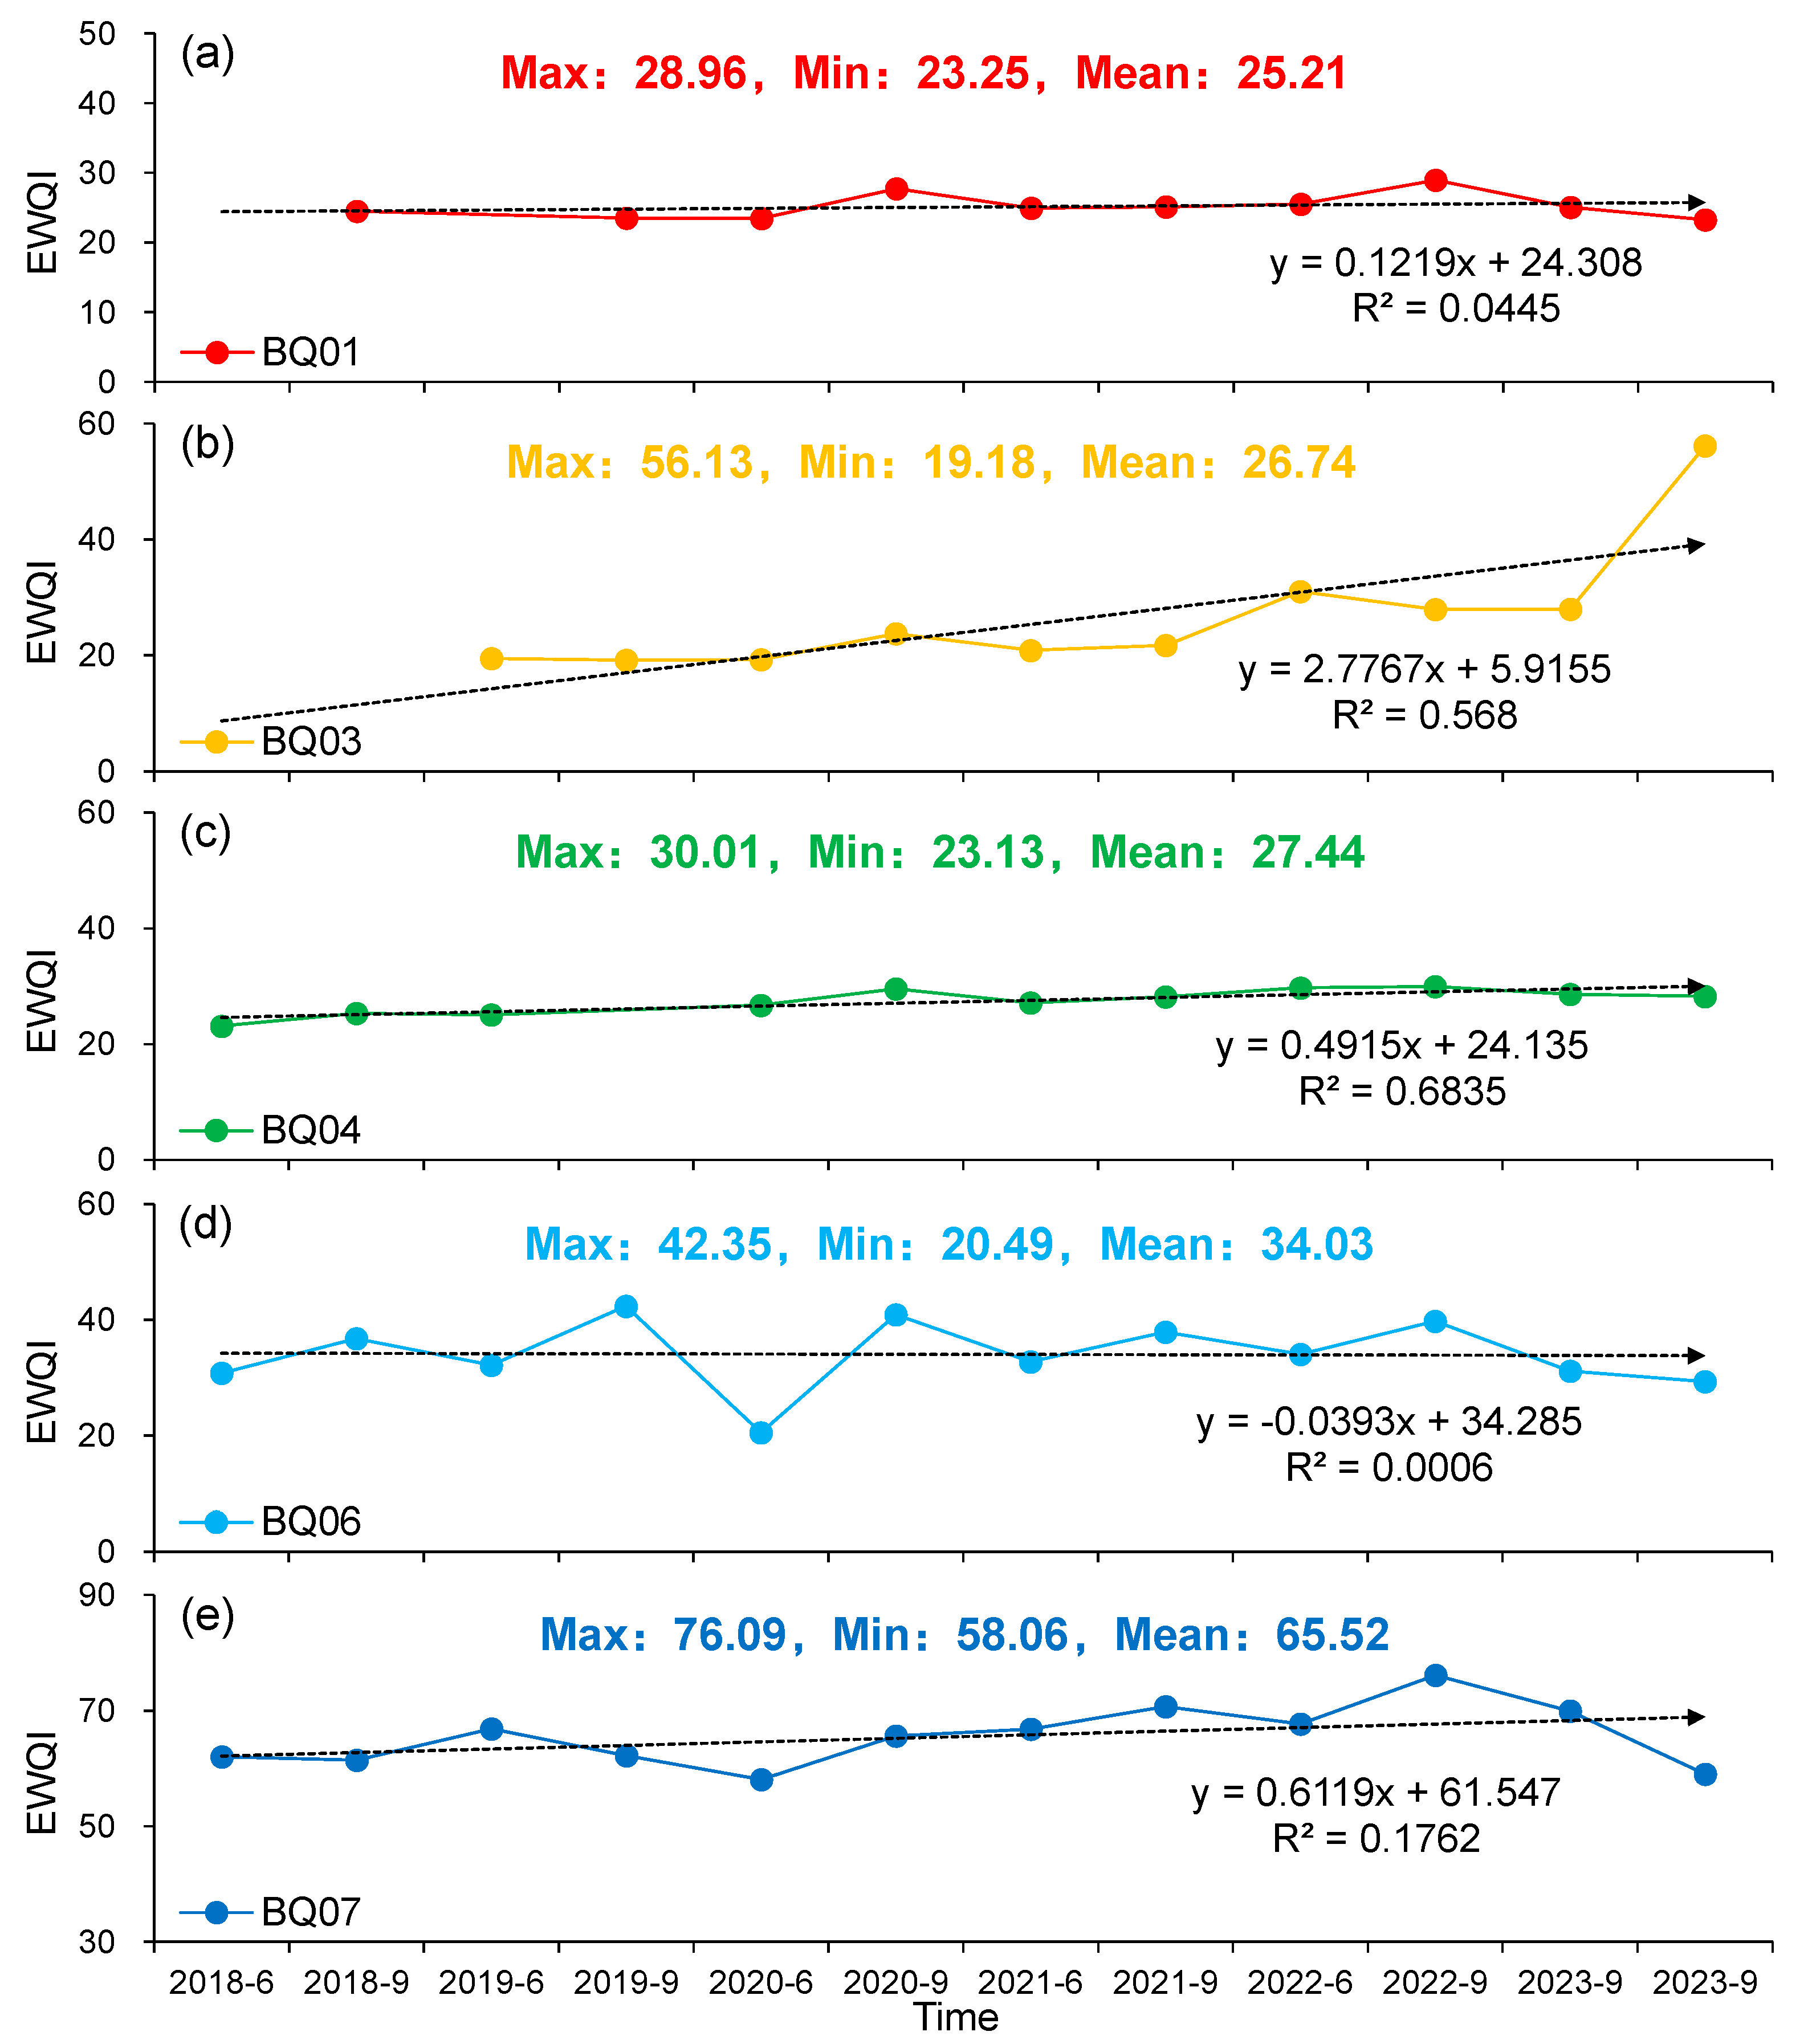
4.3. Variation Characteristics of Groundwater Quality
4.4. Suggestions for the Management, Utilization, and Protection of Groundwater Resources in NBSB
- (1)
- Establish Comprehensive Legislation and Policies: Develop robust laws, regulations, and policies to define groundwater management responsibilities and rights clearly. Regulate groundwater development and use, and enhance supervision over groundwater resources.
- (2)
- Enhance Groundwater Monitoring: Strengthen groundwater monitoring by establishing a comprehensive network to track groundwater levels, water quality, and quantity. This will enable the assessment of dynamic changes in groundwater resources and provide a scientific basis for their rational use.
- (3)
- Control Groundwater Pollution Sources: Implement stringent measures to prevent the discharge of harmful substances into groundwater. Increase efforts to manage and mitigate groundwater pollution.
- (4)
- Improve Groundwater Resource Management: Advance the integrated management of groundwater resources by refining management institutions, coordinating resources across stakeholders, and ensuring the rational allocation and use of groundwater.
- (5)
- Designate Groundwater Protection Zones: Identify and protect groundwater protection zones by restricting development and utilization in sensitive areas. Prevent pollutant infiltration to safeguard groundwater quality and ensure its sustainable use.
- (6)
- Promote Public Awareness and Education: Enhance public education and awareness about groundwater resources. Encourage water conservation practices and foster a greater understanding of groundwater protection among the public.
5. Conclusions
- (1)
- From 2018 to 2023, the average pH of groundwater in the NBSB was 7.59, indicating a generally weak alkalinity. The average TDS and TH were 665.63 mg/L and 527.80 mg/L, respectively, classifying the water predominantly as hard-fresh. The predominant anions and cations were HCO3− and Ca2+, with mean concentrations of 160.62 mg/L and 329.97 mg/L, respectively, which classifies the groundwater hydrochemical type in the NBSB as HCO3-Ca.
- (2)
- The primary ions in the NBSB’s groundwater are derived from mineral dissolution, primarily from carbonate and silicate minerals. There is also dissolution of halite and gypsum. Additionally, anthropogenic activities have influenced the chemical composition of the groundwater, with NO3− primarily originating from agricultural practices.
- (3)
- The fluctuation in anion concentrations over time was more pronounced compared to cations. Overall, while the main ions at the BQ03 monitoring point exhibited a significant increasing trend after 2021, other monitoring points did not show notable increases or decreases over time.
- (4)
- The overall groundwater quality in the NBSB is satisfactory and suitable for use as a water supply source. However, with the exception of the BQ06 monitoring point, the EWQI values at all other points have shown an upward trend over time, particularly at BQ03, which warrants attention. It is recommended to enhance the management, utilization, and protection of groundwater resources in the NBSB to ensure their sustainable use.
Author Contributions
Funding
Data Availability Statement
Acknowledgments
Conflicts of Interest
References
- Gao, Z.; Li, Q.; Liu, J.; Su, Q.; Tan, M.; Wang, Y. Assessment of Groundwater Hydrogeochemistry, Controlling Factors, Water Quality, and Nitrate-Related Health Risks in the Longkou Bay, North China. Water Air Soil Pollut. 2024, 235, 392. [Google Scholar] [CrossRef]
- Liu, J.; Gao, Z.; Feng, J.; Wang, M. Identification of the hydrochemical features, genesis, water quality and potential health hazards of groundwater in Dawen River Basin, North China. Ecol. Indic. 2023, 149, 110175. [Google Scholar] [CrossRef]
- Makhlouf, A.; Sharaan, M.; El-Rawy, M.; Kanae, S.; Ibrahim, M.G. Investigating the effects of surface water recharge on groundwater quality using hydrochemistry and ANFIS model: A case study Minia Governorate, Egypt. J. Environ. Manag. 2024, 362, 121269. [Google Scholar] [CrossRef] [PubMed]
- Chaudhari, M.P.; George, A.; Sanyal, M.; Shrivastav, P.S. Hydrochemistry and groundwater quality assessment of Gujarat, India: A compendious review. Phys. Chem. Earth Parts A/B/C 2024, 135, 103635. [Google Scholar] [CrossRef]
- Khan, M.H.; Xiao, Y.; Yang, H.; Wang, L.; Zhang, Y.; Hu, W.; Wang, J.; Liu, G.; Liu, W. Identification of hydrochemical fingerprints, quality and formation dynamics of groundwater in western high Himalayas. Environ. Monit. Assess. 2024, 196, 305. [Google Scholar] [CrossRef] [PubMed]
- Kouser, B.; Bala, A.; Verma, O.; Prashanth, M.; Khosla, A.; Pir, R.A. Hydrochemistry for the assessment of groundwater quality in the Kathua region, Jammu and Kashmir, India. Appl. Water Sci. 2022, 12, 143. [Google Scholar] [CrossRef]
- Liu, J.; Gao, Z.; Wang, M.; Li, Y.; Ma, Y.; Shi, M.; Zhang, H. Study on the dynamic characteristics of groundwater in the valley plain of Lhasa City. Environ. Earth Sci. 2018, 77, 646. [Google Scholar] [CrossRef]
- Xie, C.; Liu, H.; Li, X.; Zhao, H.; Dong, X.; Ma, K.; Wang, N.; Zhao, L. Spatial characteristics of hydrochemistry and stable isotopes in river and groundwater, and runoff components in the Shule River Basin, Northeastern of Tibet Plateau. J. Environ. Manag. 2024, 349, 119512. [Google Scholar] [CrossRef]
- Bayou, W.T.; Mohammed, M.; Ayenew, T.; Mebrahtu, T.K.; Wohnlich, S. Hydrochemistry and isotope hydrology of groundwater and surface water in the Sor and Gebba watershed, southwestern Ethiopia. Environ. Earth Sci. 2024, 83, 316. [Google Scholar] [CrossRef]
- Liu, J.; Peng, Y.; Li, C.; Gao, Z.; Chen, S. Characterization of the hydrochemistry of water resources of the Weibei Plain, Northern China, as well as an assessment of the risk of high groundwater nitrate levels to human health. Environ. Pollut. 2021, 268, 115947. [Google Scholar] [CrossRef]
- Shang, Y.; Fu, C.; Zhang, W.; Li, X.; Li, X. Groundwater hydrochemistry, source identification and health assessment based on self-organizing map in an intensive mining area in Shanxi, China. Environ. Res. 2024, 252, 118934. [Google Scholar] [CrossRef]
- Liu, J.; Lou, K.; Gao, Z.; Wang, Y.; Li, Q.; Tan, M. Comprehending hydrochemical fingerprint, spatial patterns, and driving forces of groundwater in a topical coastal plain of Northern China based on hydrochemical and isotopic evaluations. J. Clean. Prod. 2024, 461, 142640. [Google Scholar] [CrossRef]
- Meena, P.L. Appraisal of hydrogeochemical and quality of groundwater in the Banas river basin in North West India. Arab. J. Geosci. 2024, 17, 128. [Google Scholar] [CrossRef]
- Wang, S.; Chen, J.; Zhang, S.; Bai, Y.; Zhang, X.; Chen, D.; Hu, J. Groundwater hydrochemical signatures, nitrate sources, and potential health risks in a typical karst catchment of North China using hydrochemistry and multiple stable isotopes. Environ. Geochem. Health 2024, 46, 173. [Google Scholar] [CrossRef] [PubMed]
- Chen, Z.; Zhou, P.; Wang, G.; Mao, H.; Feng, X.; Huang, H. Groundwater chemistry and isotope for interpreting the hydrogeological conditions and hydrochemical evolution of multilayer aquifer system of Donghai island, China. Appl. Geochem. 2023, 159, 105833. [Google Scholar] [CrossRef]
- Rind, I.K.; Khuhawar, M.Y.; Lanjwani, M.F.; Khuhawar, T.M.J.; Samtio, M.S.; Soomro, W.A.; Baloch, A.R. Spatial variability of hydrochemistry and health risk assessment of groundwater of taluka Hala, district Matiari, Sindh, Pakistan. Arab. J. Geosci. 2023, 16, 99. [Google Scholar] [CrossRef]
- Ismail, A.H.; Shareef, M.A.; Hassan, G.; Alatar, F.M. Hydrochemistry and water quality of shallow groundwater in the Tikrit area of Salah Al Din Province, Iraq. Appl. Water Sci. 2023, 13, 197. [Google Scholar] [CrossRef]
- Obiri-Nyarko, F.; Duah, A.A.; Karikari, A.Y.; Tagoe, R. Characterization of leachate, groundwater quality analysis, and evaluation of hydrogeochemical processes at the Kpone engineered landfill site, Ghana. Sustain. Water Resour. Manag. 2022, 9, 15. [Google Scholar] [CrossRef]
- Poetra, R.P.; Adji, T.N.; Haryono, E.; Cahyadi, A.; Agniy, R.F.; Riyanto, I.A.; Fatchurohman, H.; Kholis, A.N.; Tivianton, T.A.; Febriarta, E. Discovering water relations using hydrochemistry, isotopic data, and mass-balance calculation approaches to reduce the risk of impacts from limestone mining. Groundw. Sustain. Dev. 2023, 21, 100949. [Google Scholar] [CrossRef]
- Mishra, S.; Chauhan, M.S.; Sundaramurthy, S. Assessing groundwater quality dynamics in Madhya Pradesh: Chemical contaminants and their temporal patterns. Environ. Res. 2024, 252, 118887. [Google Scholar] [CrossRef]
- Ismail, S.; Ahmed, M.F.; Abu Bakar, M.Z. Assessing the impact of urbanization on groundwater quality of lahore region, Pakistan. Environ. Sci. Pollut. Res. 2023, 30, 83929–83949. [Google Scholar] [CrossRef] [PubMed]
- Pacheco Castro, R.; Pacheco Ávila, J.; Ye, M.; Cabrera Sansores, A. Groundwater Quality: Analysis of Its Temporal and Spatial Variability in a Karst Aquifer. Groundwater 2018, 56, 62–72. [Google Scholar] [CrossRef] [PubMed]
- Zhang, L.; Xu, Y.; Zhang, H. Study on Formation Mechanism of Baiquan Spring Groups in Jinan City. Shandong Land Resour. 2017, 33, 58–62. [Google Scholar]
- Chen, H.; Cao, H. Evaluation of Groundwater Resources and Withdrawal Potential in Bai Spring Area, Jinan City, China. Front. Earth Sci. 2021, 11, 1250–1258. [Google Scholar]
- Shu, L.; Wang, X.; Li, H.; Ni, H.; Li, G.; Yu, Y.; Wang, X.; Zhang, M. Lmpact of Subway Construction on Flow of Baiquan Spring Group in Jinan. J. Jilin Univ. 2021, 51, 192–200. [Google Scholar]
- Qi, X.; Li, W.; Yang, L.; Shang, H.; Yi, F. The Lag Analysis of Groundwater Level Anomaliesto Precipitation Anomaly of Jinan Baiquan Springs Watershed. Earth Environ. 2015, 43, 619–627. [Google Scholar]
- Zhang, Y.; He, Z.; Tian, H.; Huang, X.; Zhang, Z.; Liu, Y.; Xiao, Y.; Li, R. Hydrochemistry appraisal, quality assessment and health risk evaluation of shallow groundwater in the Mianyang area of Sichuan Basin, southwestern China. Environ. Earth Sci. 2021, 80, 576. [Google Scholar] [CrossRef]
- Apollaro, C.; Buccianti, A.; Vespasiano, G.; Vardè, M.; Fuoco, I.; Barca, D.; Bloise, A.; Miriello, D.; Cofone, F.; Servidio, A.; et al. Comparative geochemical study between the tap waters and the bottled mineral waters in Calabria (Southern Italy) by compositional data analysis (CoDA) developments. Appl. Geochem. 2019, 107, 19–33. [Google Scholar] [CrossRef]
- Aghazadeh, N.; Chitsazan, M.; Golestan, Y. Hydrochemistry and quality assessment of groundwater in the Ardabil area, Iran. Appl. Water Sci. 2017, 7, 3599–3616. [Google Scholar] [CrossRef]
- Zhang, M.; Han, S.; Wang, Y.; Wang, Z.; Li, H.; Wang, X.; Liu, J.; Li, C.; Gao, Z. Characteristics and Controlling Factors of Groundwater Hydrochemistry in Dongzhi Tableland Area of the Loess Plateau of Eastern Gansu—A Case Study of Ning County Area, North China. Water 2022, 14, 3601. [Google Scholar] [CrossRef]
- Ramaroson, V.; Randriantsivery, J.R.; Rajaobelison, J.; Fareze, L.P.; Rakotomalala, C.U.; Razafitsalama, F.A.; Rasolofonirina, M. Nitrate contamination of groundwater in Ambohidrapeto–Antananarivo-Madagascar using hydrochemistry and multivariate analysis. Appl. Water Sci. 2020, 10, 178. [Google Scholar] [CrossRef]
- Yang, F.; Jia, C.; Yang, X.; Yang, H.; Chang, W. Probabilistic potential health risk quantification, hydrochemistry, driving forces of groundwater nitrate and fluoride in a typical irrigation district, Northern China. J. Environ. Manag. 2022, 323, 116171. [Google Scholar] [CrossRef] [PubMed]
- Durov, S.A. Classification of natural waters and graphical representation of their composition. Dokl. Akad. Nauk. SSSR 1948, 59, 87–90. [Google Scholar]
- Jalees, M.I.; Farooq, M.U.; Anis, M.; Hussain, G.; Iqbal, A.; Saleem, S. Hydrochemistry modelling: Evaluation of groundwater quality deterioration due to anthropogenic activities in Lahore, Pakistan. Environ. Dev. Sustain. 2021, 23, 3062–3076. [Google Scholar] [CrossRef]
- Zhao, C.; Li, X.; Wang, Z.; Hou, X.; Ma, J. Integration of self-organizing maps and entropy-weighted quality index methods to study hydrochemical processes and quality assessment in Qilian coal base of China. Environ. Earth Sci. 2024, 83, 92. [Google Scholar] [CrossRef]
- Gao, Z.; Liu, J.; Feng, J.; Wang, M.; Wu, G. Hydrogeochemical Characteristics and the Suitability of Groundwater in the Alluvial-Diluvial Plain of Southwest Shandong Province, China. Water 2019, 11, 1577. [Google Scholar] [CrossRef]
- Fu, T.; Fu, Y.; Li, C.; Dong, M.; Qi, C.; Wang, Z.; Chen, G.; Su, Q.; Xu, X.; Yu, H. Seawater intrusion-triggered high fluoride groundwater development on the eastern coast of China. Environ. Sci. Pollut. Res. 2024, 31, 11307–11320. [Google Scholar] [CrossRef]
- Roy, S.K.; Zahid, A. Assessment of river water–groundwater–seawater interactions in the coastal delta of Bangladesh based on hydrochemistry and salinity distribution. SN Appl. Sci. 2021, 3, 411. [Google Scholar] [CrossRef]
- Karunanidhi, D.; Subramani, T.; Roy, P.D.; Li, H. Impact of groundwater contamination on human health. Environ. Geochem. Health 2021, 43, 643–647. [Google Scholar] [CrossRef]
- Liu, J.; Peng, Y.; Li, C.; Gao, Z.; Chen, S. An investigation into the hydrochemistry, quality and risk to human health of groundwater in the central region of Shandong Province, North China. J. Clean. Prod. 2021, 282, 125416. [Google Scholar] [CrossRef]
- Xiao, J.; Wang, L.; Chai, N.; Liu, T.; Jin, Z.; Rinklebe, J. Groundwater hydrochemistry, source identification and pollution assessment in intensive industrial areas, eastern Chinese loess plateau. Environ. Pollut. 2021, 278, 116930. [Google Scholar] [CrossRef] [PubMed]
- Hua, K.; Xiao, J.; Li, S.; Li, Z. Analysis of hydrochemical characteristics and their controlling factors in the Fen River of China. Sust. Cities Soc. 2020, 52, 101827. [Google Scholar] [CrossRef]
- Apollaro, C.; Caracausi, A.; Paternoster, M.; Randazzo, P.; Aiuppa, A.; De Rosa, R.; Fuoco, I.; Mongelli, G.; Muto, F.; Vanni, E.; et al. Fluid geochemistry in a low-enthalpy geothermal field along a sector of southern Apennines chain (Italy). J. Geochem. Explor. 2020, 219, 106618. [Google Scholar] [CrossRef]


| Maximum | Minimum | Mean | Standard Deviation | Coefficient of Variation | |
|---|---|---|---|---|---|
| pH | 8.1 | 7.1 | 7.59 | 0.23 | 3.03 |
| TH (mg/L) | 950 | 298 | 527.80 | 187.66 | 35.56 |
| TDS (mg/L) | 1215 | 371 | 665.63 | 248.05 | 37.27 |
| Ca2+ (mg/L) | 301 | 89.6 | 160.62 | 58.62 | 36.50 |
| Mg2+ (mg/L) | 66.6 | 18.1 | 30.77 | 11.29 | 36.69 |
| K+ (mg/L) | 3.62 | 0.46 | 1.39 | 0.92 | 66.19 |
| Na+ (mg/L) | 44.8 | 2.93 | 19.77 | 13.75 | 69.55 |
| Cl− (mg/L) | 165 | 8.25 | 53.39 | 47.17 | 88.35 |
| SO42− (mg/L) | 583 | 58.7 | 184.39 | 113.34 | 61.47 |
| HCO3− (mg/L) | 578 | 187 | 329.79 | 93.94 | 28.48 |
| NO3− (mg/L) | 131 | 12.2 | 37.76 | 17.62 | 46.66 |
| F− (mg/L) | 0.57 | 0.06 | 0.26 | 0.11 | 42.31 |
Disclaimer/Publisher’s Note: The statements, opinions and data contained in all publications are solely those of the individual author(s) and contributor(s) and not of MDPI and/or the editor(s). MDPI and/or the editor(s) disclaim responsibility for any injury to people or property resulting from any ideas, methods, instructions or products referred to in the content. |
© 2024 by the authors. Licensee MDPI, Basel, Switzerland. This article is an open access article distributed under the terms and conditions of the Creative Commons Attribution (CC BY) license (https://creativecommons.org/licenses/by/4.0/).
Share and Cite
Wu, D.; Li, B.; Li, Y.; Li, Q.; Sheng, C.; Liu, J.; Wang, M.; Min, Y.; Feng, J.; Zhang, Y.; et al. Characterization of Groundwater Hydrochemistry and Temporal Dynamics of Water Quality in the Northern Baiquan Spring Basin. Water 2024, 16, 2519. https://doi.org/10.3390/w16172519
Wu D, Li B, Li Y, Li Q, Sheng C, Liu J, Wang M, Min Y, Feng J, Zhang Y, et al. Characterization of Groundwater Hydrochemistry and Temporal Dynamics of Water Quality in the Northern Baiquan Spring Basin. Water. 2024; 16(17):2519. https://doi.org/10.3390/w16172519
Chicago/Turabian StyleWu, Di, Bo Li, Yuxing Li, Qingbin Li, Chen Sheng, Jiutan Liu, Min Wang, Yangyang Min, Jianguo Feng, Yuqi Zhang, and et al. 2024. "Characterization of Groundwater Hydrochemistry and Temporal Dynamics of Water Quality in the Northern Baiquan Spring Basin" Water 16, no. 17: 2519. https://doi.org/10.3390/w16172519
APA StyleWu, D., Li, B., Li, Y., Li, Q., Sheng, C., Liu, J., Wang, M., Min, Y., Feng, J., Zhang, Y., & Yu, J. (2024). Characterization of Groundwater Hydrochemistry and Temporal Dynamics of Water Quality in the Northern Baiquan Spring Basin. Water, 16(17), 2519. https://doi.org/10.3390/w16172519