Article

Method for Producing Columnar Ice in Laboratory and Its Application

School of Naval Architecture, Ocean and Energy Power Engineering, Wuhan University of Technology, Wuhan 430063, China
*
Author to whom correspondence should be addressed.
Water 2024, 16(18), 2558; https://doi.org/10.3390/w16182558
Submission received: 2 August 2024 / Revised: 7 September 2024 / Accepted: 9 September 2024 / Published: 10 September 2024
(This article belongs to the Special Issue Ice and Snow Properties and Their Applications)

Abstract

:
This study presents the design of a small open-circuit wind tunnel for laboratory use and a method for preparing columnar ice. The ice formation process was analyzed in terms of temperature and ice thickness variations under varying environmental temperatures and wind speeds. Observations revealed that as wind speed increased, the grain size of the columnar ice decreased. Key findings include the following: (1) the selection and validation of two cubic arcs for the wind tunnel contraction section, achieving an acceleration ratio of 6.7–6.8 and stable wind speeds of 1–10 m/s; (2) real-time temperature monitoring indicated rapid cooling before freezing and slower cooling post-freezing, with lower ambient temperatures and higher wind speeds accelerating the icing process; (3) the −1/2 power of grain size was found to be positively correlated with wind speed; and (4) the method’s feasibility for studying mechanical properties of polar columnar ice was confirmed. This technique offers a controlled approach for producing columnar ice in the laboratory, facilitating comprehensive research on ice properties and providing a foundation for future studies on the mechanical behavior of ice under windy polar conditions.

1. Introduction

Ice plays a significant role in cold regions, affecting human activities and infrastructure. The internal structure of ice is quite complex and can be classified into granular ice and columnar ice based on crystal structure types [1]. Columnar ice is composed of vertically aligned ice crystal columns exhibiting distinct crystallographic orientation. In contrast, granular ice consists of randomly oriented small ice crystals lacking any regular crystallographic alignment. Granular ice forms in the early stages of freezing, influenced by wave agitation. When the water surface is calm or when a surface ice layer has already formed, ice crystals elongate vertically to form columnar ice. Granular ice is isotropic, while columnar ice exhibits significant anisotropy [2]. Ice formed in rivers, lakes, and oceans is generally predominantly columnar ice. In the Arctic and high-latitude inland waterways, the presence of ice is seasonal—water surfaces begin to freeze in winter and melt in summer [3,4]. The harsh winter environment results in complex ice conditions on the water surface. Issues such as ice-bound waterways and vessel damage not only affect shipping efficiency but also pose safety risks. When navigating during the ice season, ships need to select appropriate routes and icebreaking strategies [5,6,7]. Therefore, studying the mechanical properties and formation process of columnar ice is crucial for guiding the selection of navigation strategies for ships.
Ice strength is often a primary focus in the study of its mechanical properties, as it is a critical parameter for designing ships and offshore structures in icy regions. The failure modes of ice include compression, tension, and flexure, corresponding to compressive strength, tensile strength, and flexural strength, respectively [8,9,10]. Moslet [11] studied the uniaxial compressive strength of columnar sea ice in Svalbard, Norway, and found that sea ice exhibits brittle and ductile behavior under different loading rates. Tests on both horizontal and vertical samples concluded that strength mainly depends on temperature and also summarized the relationship between Young’s modulus and porosity. Li [12], addressing the abnormal ice conditions in the Bohai Sea during the winter of 2009–2010, collected columnar sea ice samples from Liaodong Bay and conducted loading tests parallel to the ice surface. The uniaxial compressive strength of sea ice was measured, and the surface relationship between uniaxial compressive strength and porosity within the selected strain rate range was summarized, quantitatively describing the transition point of mechanical behavior with changes in porosity. Bonath [13] conducted uniaxial tensile tests on first-year ice ridges in the Svalbard region, finding that brine volume is a significant parameter affecting the tensile strength of columnar ice. Menge [14] conducted tensile tests on columnar ice perpendicular to the growth direction, showing that maximum tensile stress is most influenced by temperature, while failure strain and modulus are affected by loading rate. Han [15] studied the flexural properties of large columnar freshwater ice, revealing that flexural strength is not affected by loading direction but shows a clear correlation with temperature and strain rate. As test temperature decreases, ice strength increases; as strain rate increases, strength first increases and then decreases. Karulina [16] conducted full-scale flexural strength tests on sea ice and freshwater ice beams from the Svalbard region. The results indicated that sea ice has lower flexural strength than freshwater ice and that flexural strength is independent of the direction of the flexural force applied to the free end of the beam.
For studying the ice formation process, the most direct approach is to use specialized tools for real-time measurement of ice thickness. Common methods include drilling, echo sounding, electromagnetic (EM) sounding, visual ship-based observations, and video observations [17]. Worby [18] evaluated the applicability of using portable electromagnetic induction (EMI) devices for determining sea ice thickness under Antarctic winter and spring conditions. Uto [19] used ship-based electromagnetic induction devices to detect sea ice thickness in the southern Sea of Okhotsk, with results closely matching those obtained from drilling measurements. Upward-looking sonar is another classic method for monitoring sea ice thickness, typically mounted on submarines. This method was first used in Arctic sea ice surveys [20], providing technical support for Arctic exploration and yielding accurate data on Arctic sea ice thickness [21]. With technological advancements, radar has also been employed for ice thickness detection. Initially, it was primarily used in the polar regions [22,23], but it has since been used for ice thickness observations in high-latitude inland rivers [24].
During in situ measurements, the climate and environmental conditions at measurement locations are generally harsh, often leading to negative factors such as installation difficulties, instrument damage, and challenges in equipment retrieval due to external causes [25]. Additionally, the relatively high time and economic costs associated with field measurements result in certain limitations. Consequently, scholars are choosing to conduct studies on mechanical properties and the ice formation process in laboratory settings. Cole [26] prepared polycrystalline ice samples in the laboratory and reviewed several ice-making methods. Deng [27] conducted a series of uniaxial compression tests on laboratory-made ice, investigating the strain rate range during the transition from ductile to brittle behavior and the dispersion of compressive strength measurement data. Zhang [28] used a low-temperature laboratory to prepare distilled water ice at different temperatures, studying the relationship between uniaxial compressive strength, strain rate, and ice crystal grain size. Rosa [29] equipped a laboratory tank with wave conditions and thermal effects to observe the process of frazil ice crystals gradually accumulating to form a grease ice layer. Roscoe [30] studied the growth and composition of frost flowers in the laboratory, comparing laboratory results with field observations and finding consistency between the two.
Cultivating sea ice and freshwater ice in the laboratory provides a method for observing the physical properties of ice. Researchers can control the growth of ice through stringent variable control by adjusting environmental conditions [31]. Environmental temperature and wind speed are significant factors influencing the ice formation process. Generally, a temperature-controlled room can achieve the desired atmospheric temperature to control temperature effectively [32,33,34]. In some studies, fans are used to blow cold air over the water surface to increase the heat transfer rate and ensure the uniform distribution of cold air [35,36]. However, this method neither provides a stable wind speed nor allows precise wind speed adjustment. In the study of atmospheric ice, wind tunnel devices are used to provide stable and adjustable wind speeds for the icing process [37,38] and thus can be utilized in low-temperature laboratories to simulate cold region environments. This study proposed a method for preparing columnar ice in the laboratory, combining low-temperature laboratory and wind tunnel to simulate the cold and windy conditions of polar regions in a laboratory setting. This approach will facilitate future testing of columnar ice in the laboratory, thereby supplementing and improving the study of ice properties.

2. Methods

2.1. Design of Wind Tunnel

To ensure stable wind speed during the process of freezing, it is necessary to control the wind speed using a wind tunnel. In conventional air mediums, the maximum speed in a typical low-speed wind tunnel does not exceed 130 m/s [39]. In this research, the wind tunnel is housed within a low-temperature laboratory. Considering manufacturing costs and spatial constraints, the wind tunnel is designed as an open-circuit low-speed wind tunnel, with its structural schematic shown in Figure 1.
The wind tunnel should be designed as a whole for the purpose of sealing. As the settling chamber necessitates an internal flow rectification device while the contraction section does not, both sections are fabricated as a single unit. The remaining sections are individually processed and interconnected via flanges, supplemented with 2 mm thick rubber for damping and sealing purposes. For observational requirements, the test section is constructed using acrylic material with a thickness of 4 mm, while the remaining components are fabricated from stainless steel plates.

2.1.1. Design of Test Section and Settling Chamber

Based on the practical usage of the wind tunnel, the cross-sectional shape of the test section is designed to be square, and the dimensions are 150 mm × 150 mm. For low-speed wind tunnels, the length of the test section is typically 1.75 to 2.5 times the hydraulic diameter of the inlet cross-section [40]. Considering the size of the icing pool, the length of the test section is set at 285 mm. Thus, the final dimensions of the test section are determined to be 285 mm × 150 mm × 150 mm (length × width × height).
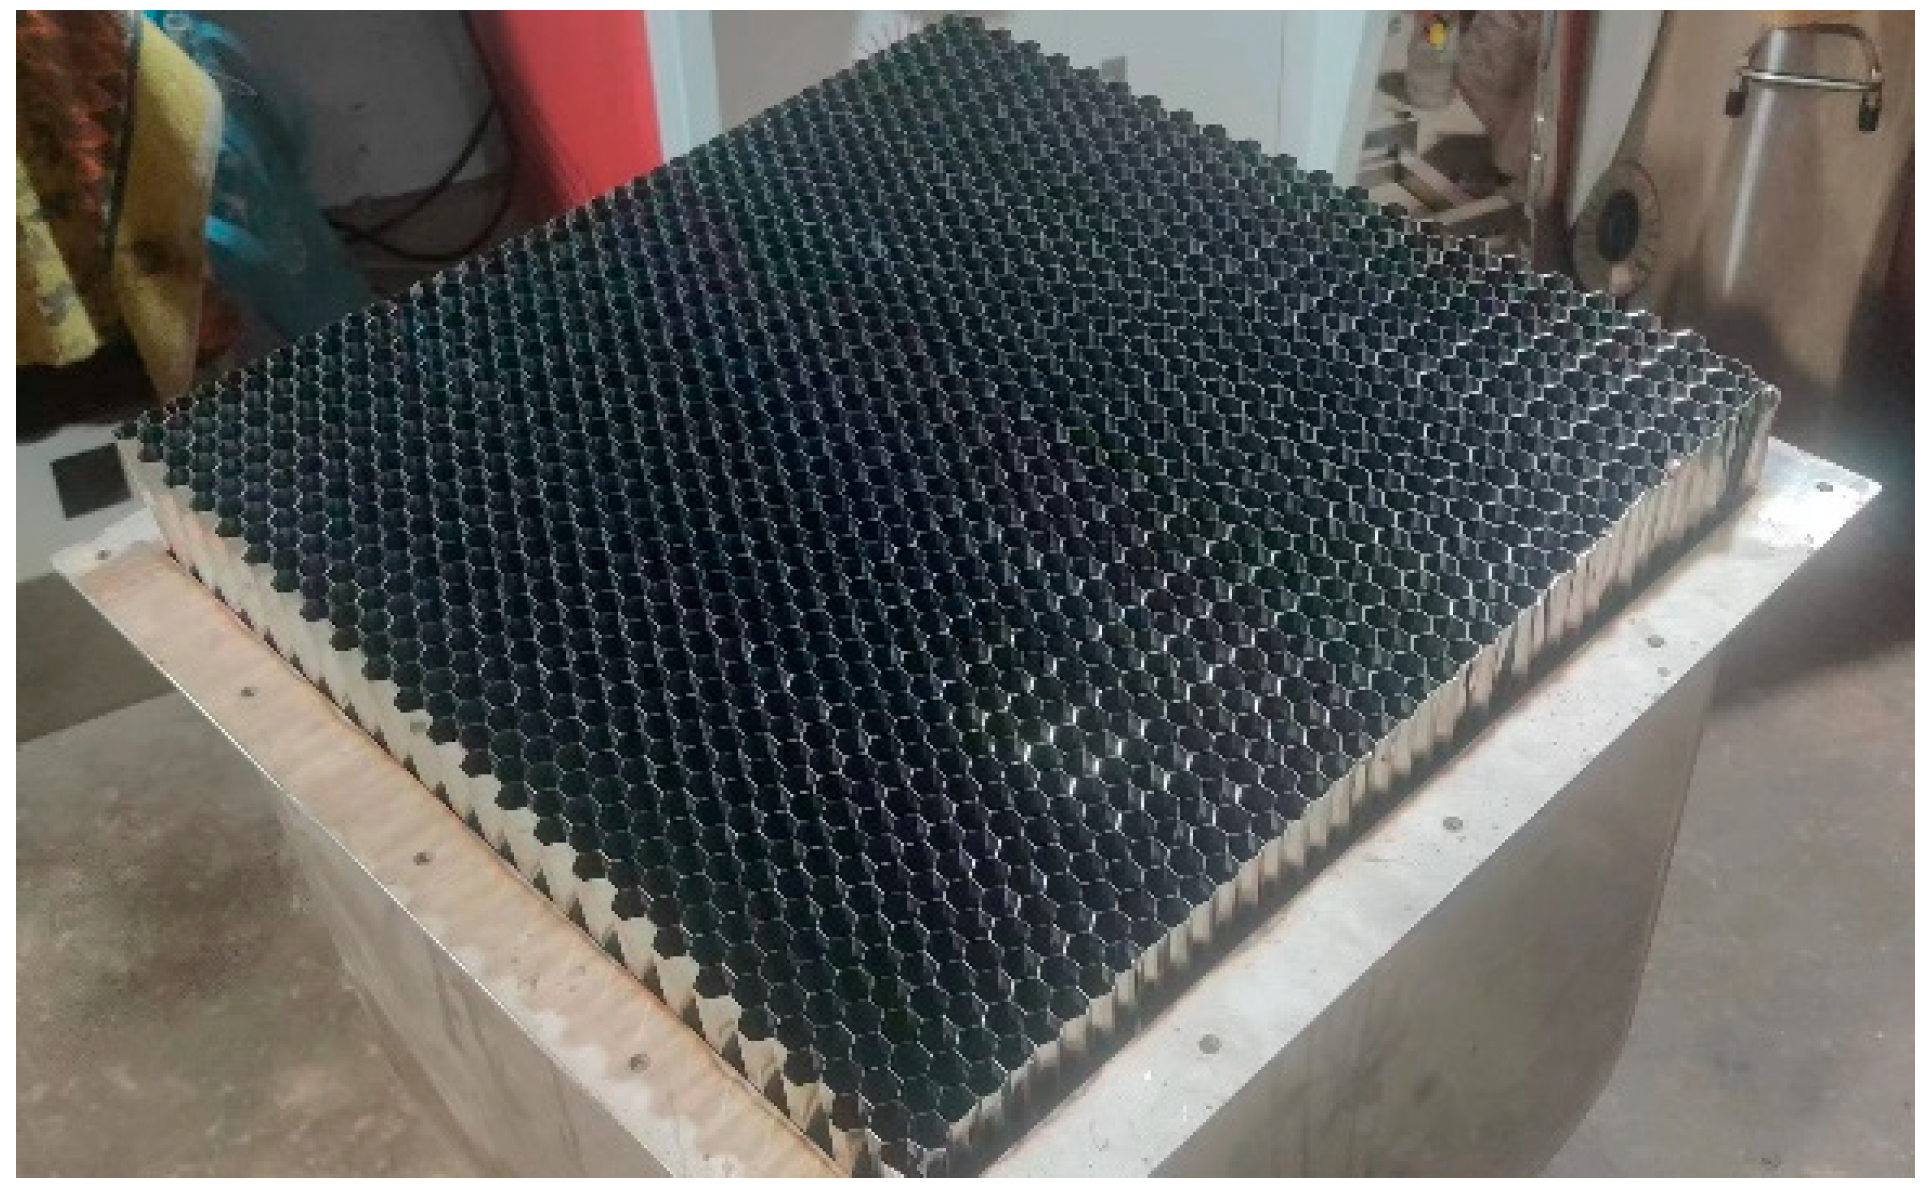
The size of the cross-sectional area of the settling chamber depends on the contraction ratio of the wind tunnel’s contraction section. The contraction ratio is the ratio of the cross-sectional area between the settling chamber and the test section. For small-scale, low-speed open-circuit wind tunnels, the contraction ratio typically ranges from 6 to 9 [40]. In this study, the contraction ratio of the wind tunnel is set to 7. Calculations yield a settling chamber cross-sectional area of 1.6 × 105 mm2, resulting in a square cross-section size of 400 mm × 400 mm. When the contraction ratio exceeds 5, the settling section’s length is generally 0.5 to 1.0 times the diameter [40]. Therefore, the length of the settling chamber is determined to be 300 mm. To enhance the quality of the airflow field, a flow rectification device should be installed within the settling chamber to rectify and stabilize the flow field. The honeycomb structure was selected as the flow rectification device, as shown in Figure 2.

2.1.2. Design of the Contraction

The contraction section is the core functional structure of the wind tunnel. The design of the contraction section mainly focuses on the axial length, contraction curve, and contraction ratio. Generally, the axial length of the contraction section is 0.5–1 times its inlet hydraulic diameter (the side length of the settling chamber) [40], so the length range of the contraction section is 200–400 mm. Selecting a longer length of the contraction section can make the contraction curve smooth, which is conducive to no separation of airflow. Therefore, the length of the contraction section was taken as 400 mm. The contraction curves commonly used for wind tunnel equipment with better performance are the Witosznski curve and the two cubic arcs [41]. Witosznski curve was defined by a 2nd-order polynomial as follows:
R = R 2 1 1 R 2 R 1 2 1 3 x 2 a 2 2 1 + x 2 a 2 3
where R 1 , R 2 are the section radius at the inlet and outlet of the contraction section (mm), R is the section radius at the axial distance x (mm), and a is the length (mm) of 3 times the contraction section.
The formula of the two cubic arcs is given as follows:
R R 2 R 1 R 2 = 1 1 X m 2 x L 3 ,               x / L X m 1 1 X m 2 1 x L 3 ,           x / L > X m
where x / L is a dimensionless local-contraction length, X m = x m / L is the dimensionless contraction length where the matching of the two cubic arcs occurs, and R 1 , R 2 are the section radius at the inlet and outlet of the contraction section (mm). The flow characteristics of the contraction section based on two kinds of curve modeling were analyzed by the computational fluid dynamics (CFD) method. It was determined that the contraction section should be modeled using the two cubic arcs. The computational results are elaborated in Section 3.

2.1.3. Design of Exit Diffuser and Wide-Angle Diffuser

The exit diffuser is located behind the test section and is directly connected to the atmosphere. The area ratio of the sections at both ends of the diffuser is generally designed to be about 2. The calculated outlet section size of the diffuser was 210 mm × 210 mm. The diffusion angle was taken as 10°, and the length of the diffuser was 140 mm. The wide-angle diffuser is located between the fan and the settling chamber. The diameter of the axial flow fan is 310 mm, so the inlet size of the diffusion section is set at 300 mm × 300 mm to ensure a good fit with the fan and reduce the airflow loss. The length of the wide-angle diffuser was determined to be 300 mm.
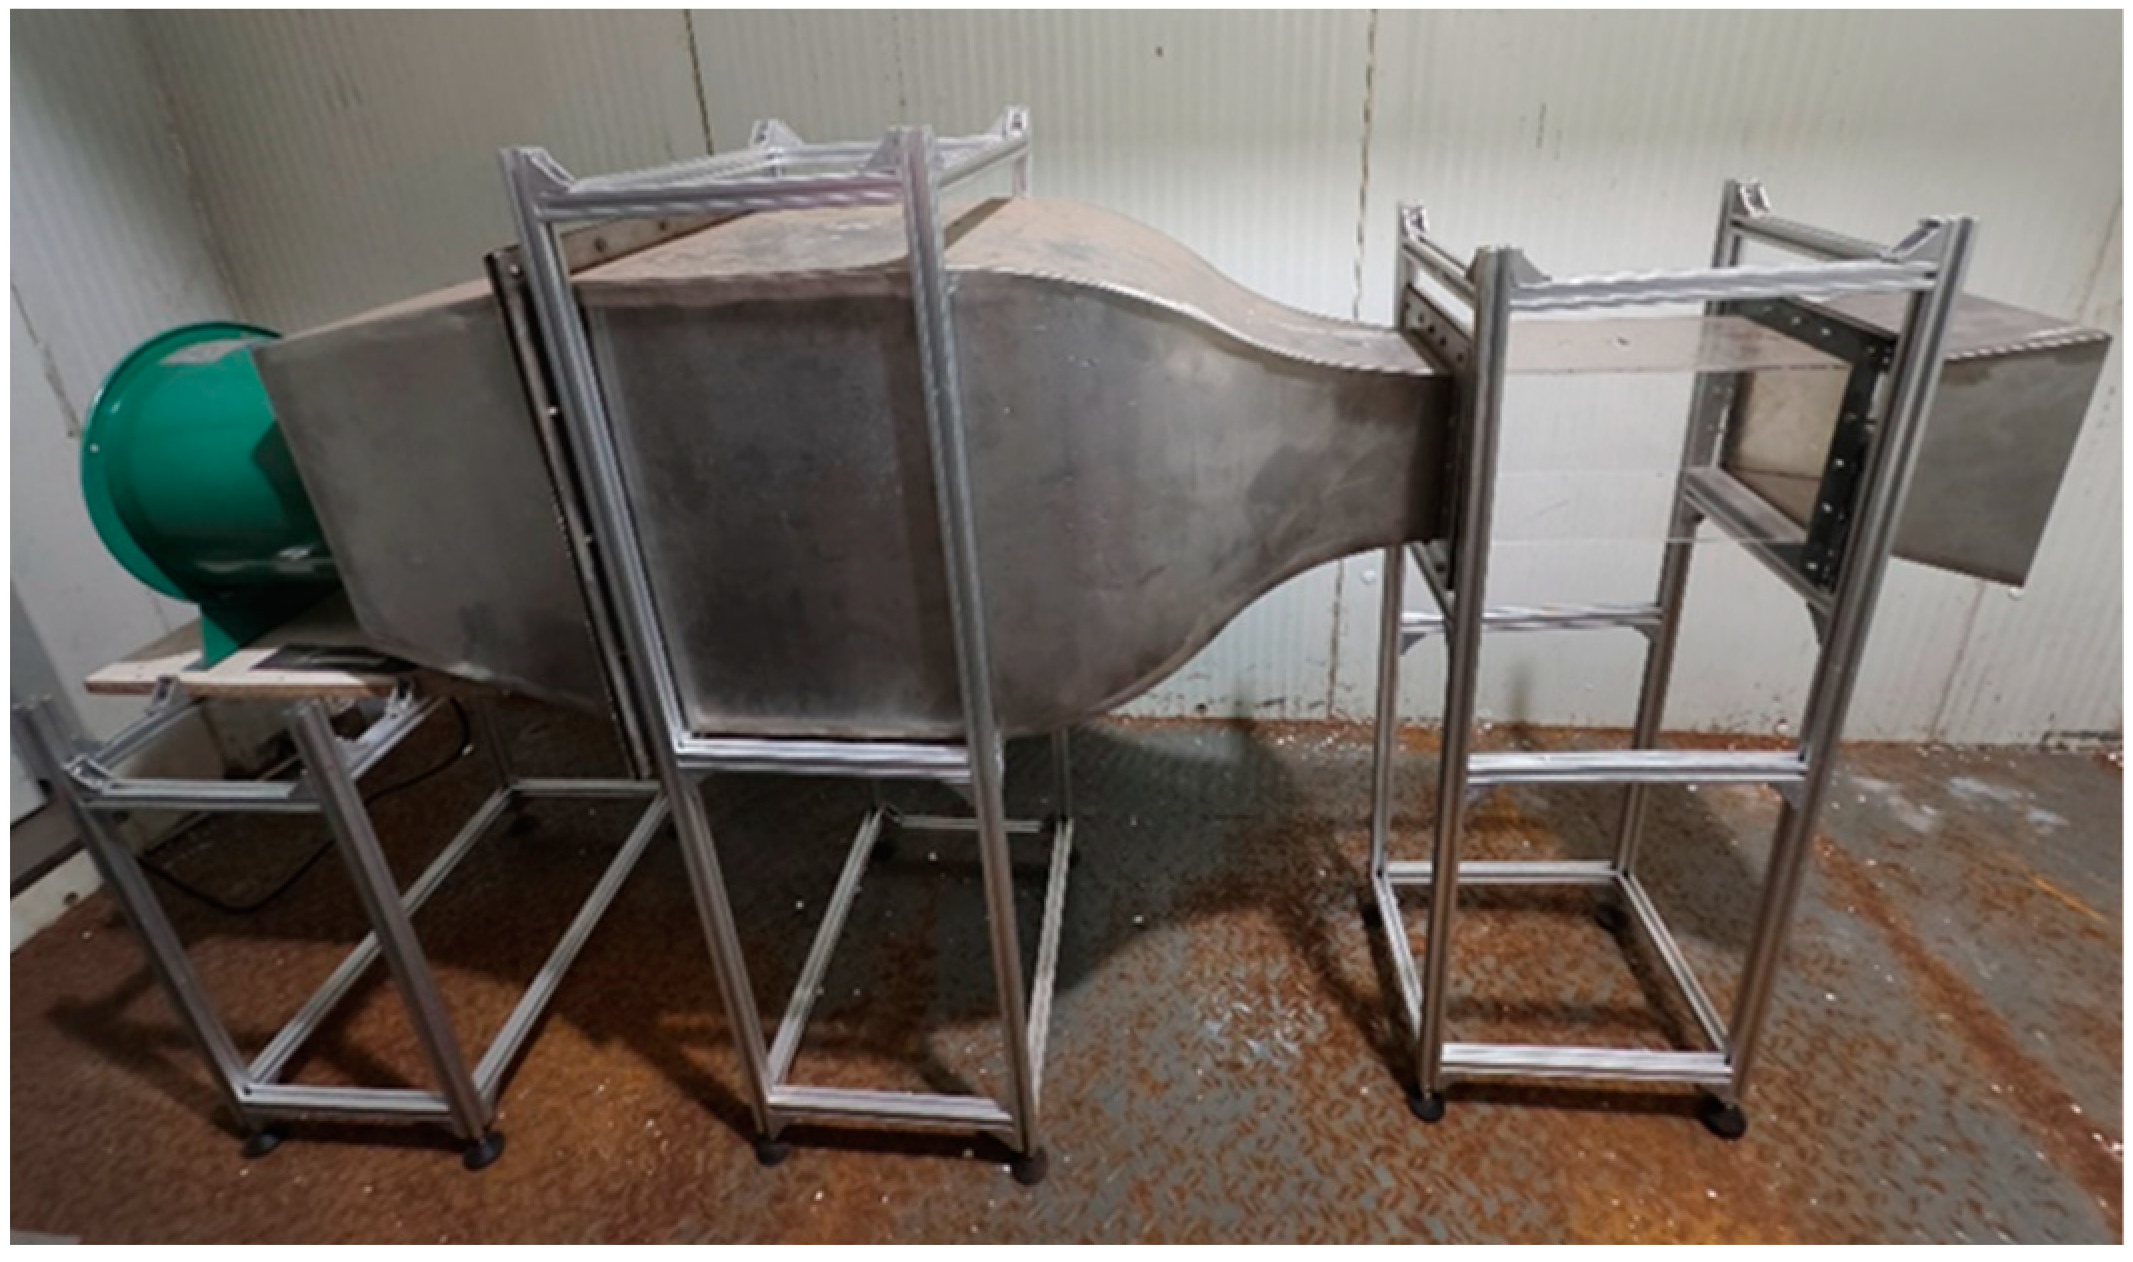
According to the above design of each part of the open-circuit low-speed wind tunnel, the wind tunnel device with a total length of 1425 mm was finally obtained. The structures of each part were connected by flanges and nuts, as shown in Figure 3. Wind tunnel performance testing has determined that the maximum wind speed achievable by the wind tunnel is 10 m/s. The results of the performance testing are discussed in Section 3.

2.2. Ice Formation Test

2.2.1. Test Devices

Regarding the selection of materials for the ice formation tank, while acrylic glass offers the advantage of transparency, facilitating direct observation of the ice formation process, its relatively high thermal conductivity causes heat exchange between the tank walls and the cold air. This exchange can affect the ice growth direction and observation accuracy. The objective of the experiment is to produce columnar ice, and to ensure that the ice grows naturally from top to bottom, a foam box is chosen as the ice formation tank. The reasons for this choice include the following: foam material has a low thermal conductivity, excellent sealing properties, resistance to water leakage, ease of repair in case of leaks, and stability in low-temperature environments. Additionally, the foam box’s elasticity allows it to conform tightly to the test section and prevent air leakage. It is also lightweight, which facilitates handling during experiments and is cost-effective, thus reducing overall costs.
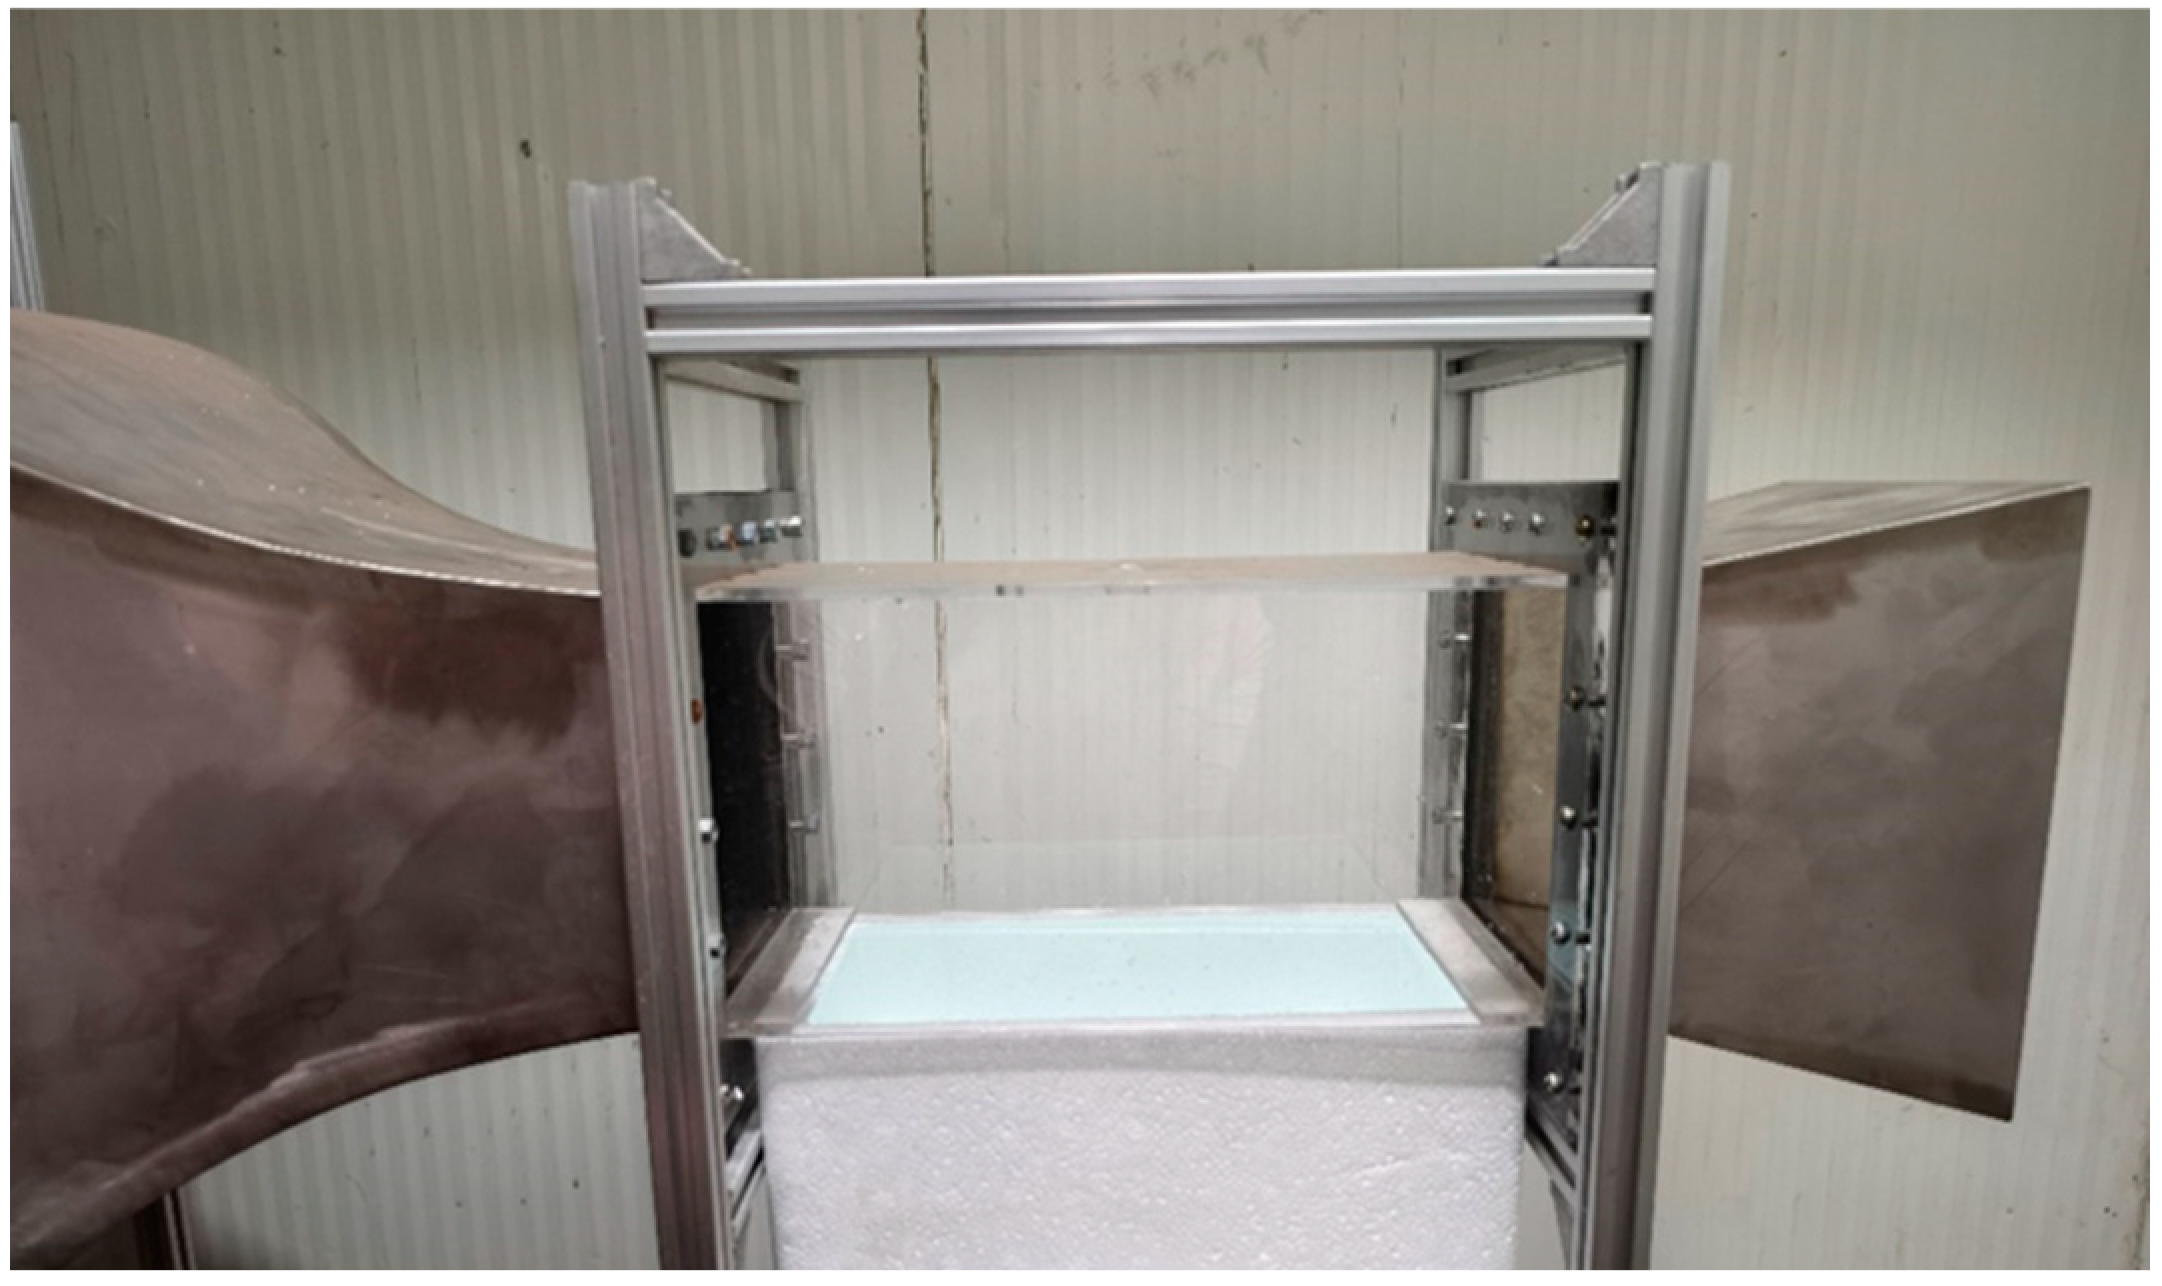
The ice formation tests were conducted in a low-temperature laboratory, where the environmental temperature could be lowered to a minimum of −40 °C, with a temperature control precision of 0.1 °C. To ensure that the initial water temperature in the ice formation tank of each test remains consistent, the foam ice pools were placed in a high–low temperature test chamber for temperature stabilization before the tests. The specific parameters of the low-temperature laboratory and the high–low temperature test chamber have been described in a previous study [42]. The required wind speed for the tests was provided by the wind tunnel. The test section of the wind tunnel was modified, with holes opened at the upper part of the test section to facilitate the insertion of temperature and wind measuring instruments; the lower part of the test section was not sealed, allowing the water to be in direct contact with the airflow, as shown in Figure 4.
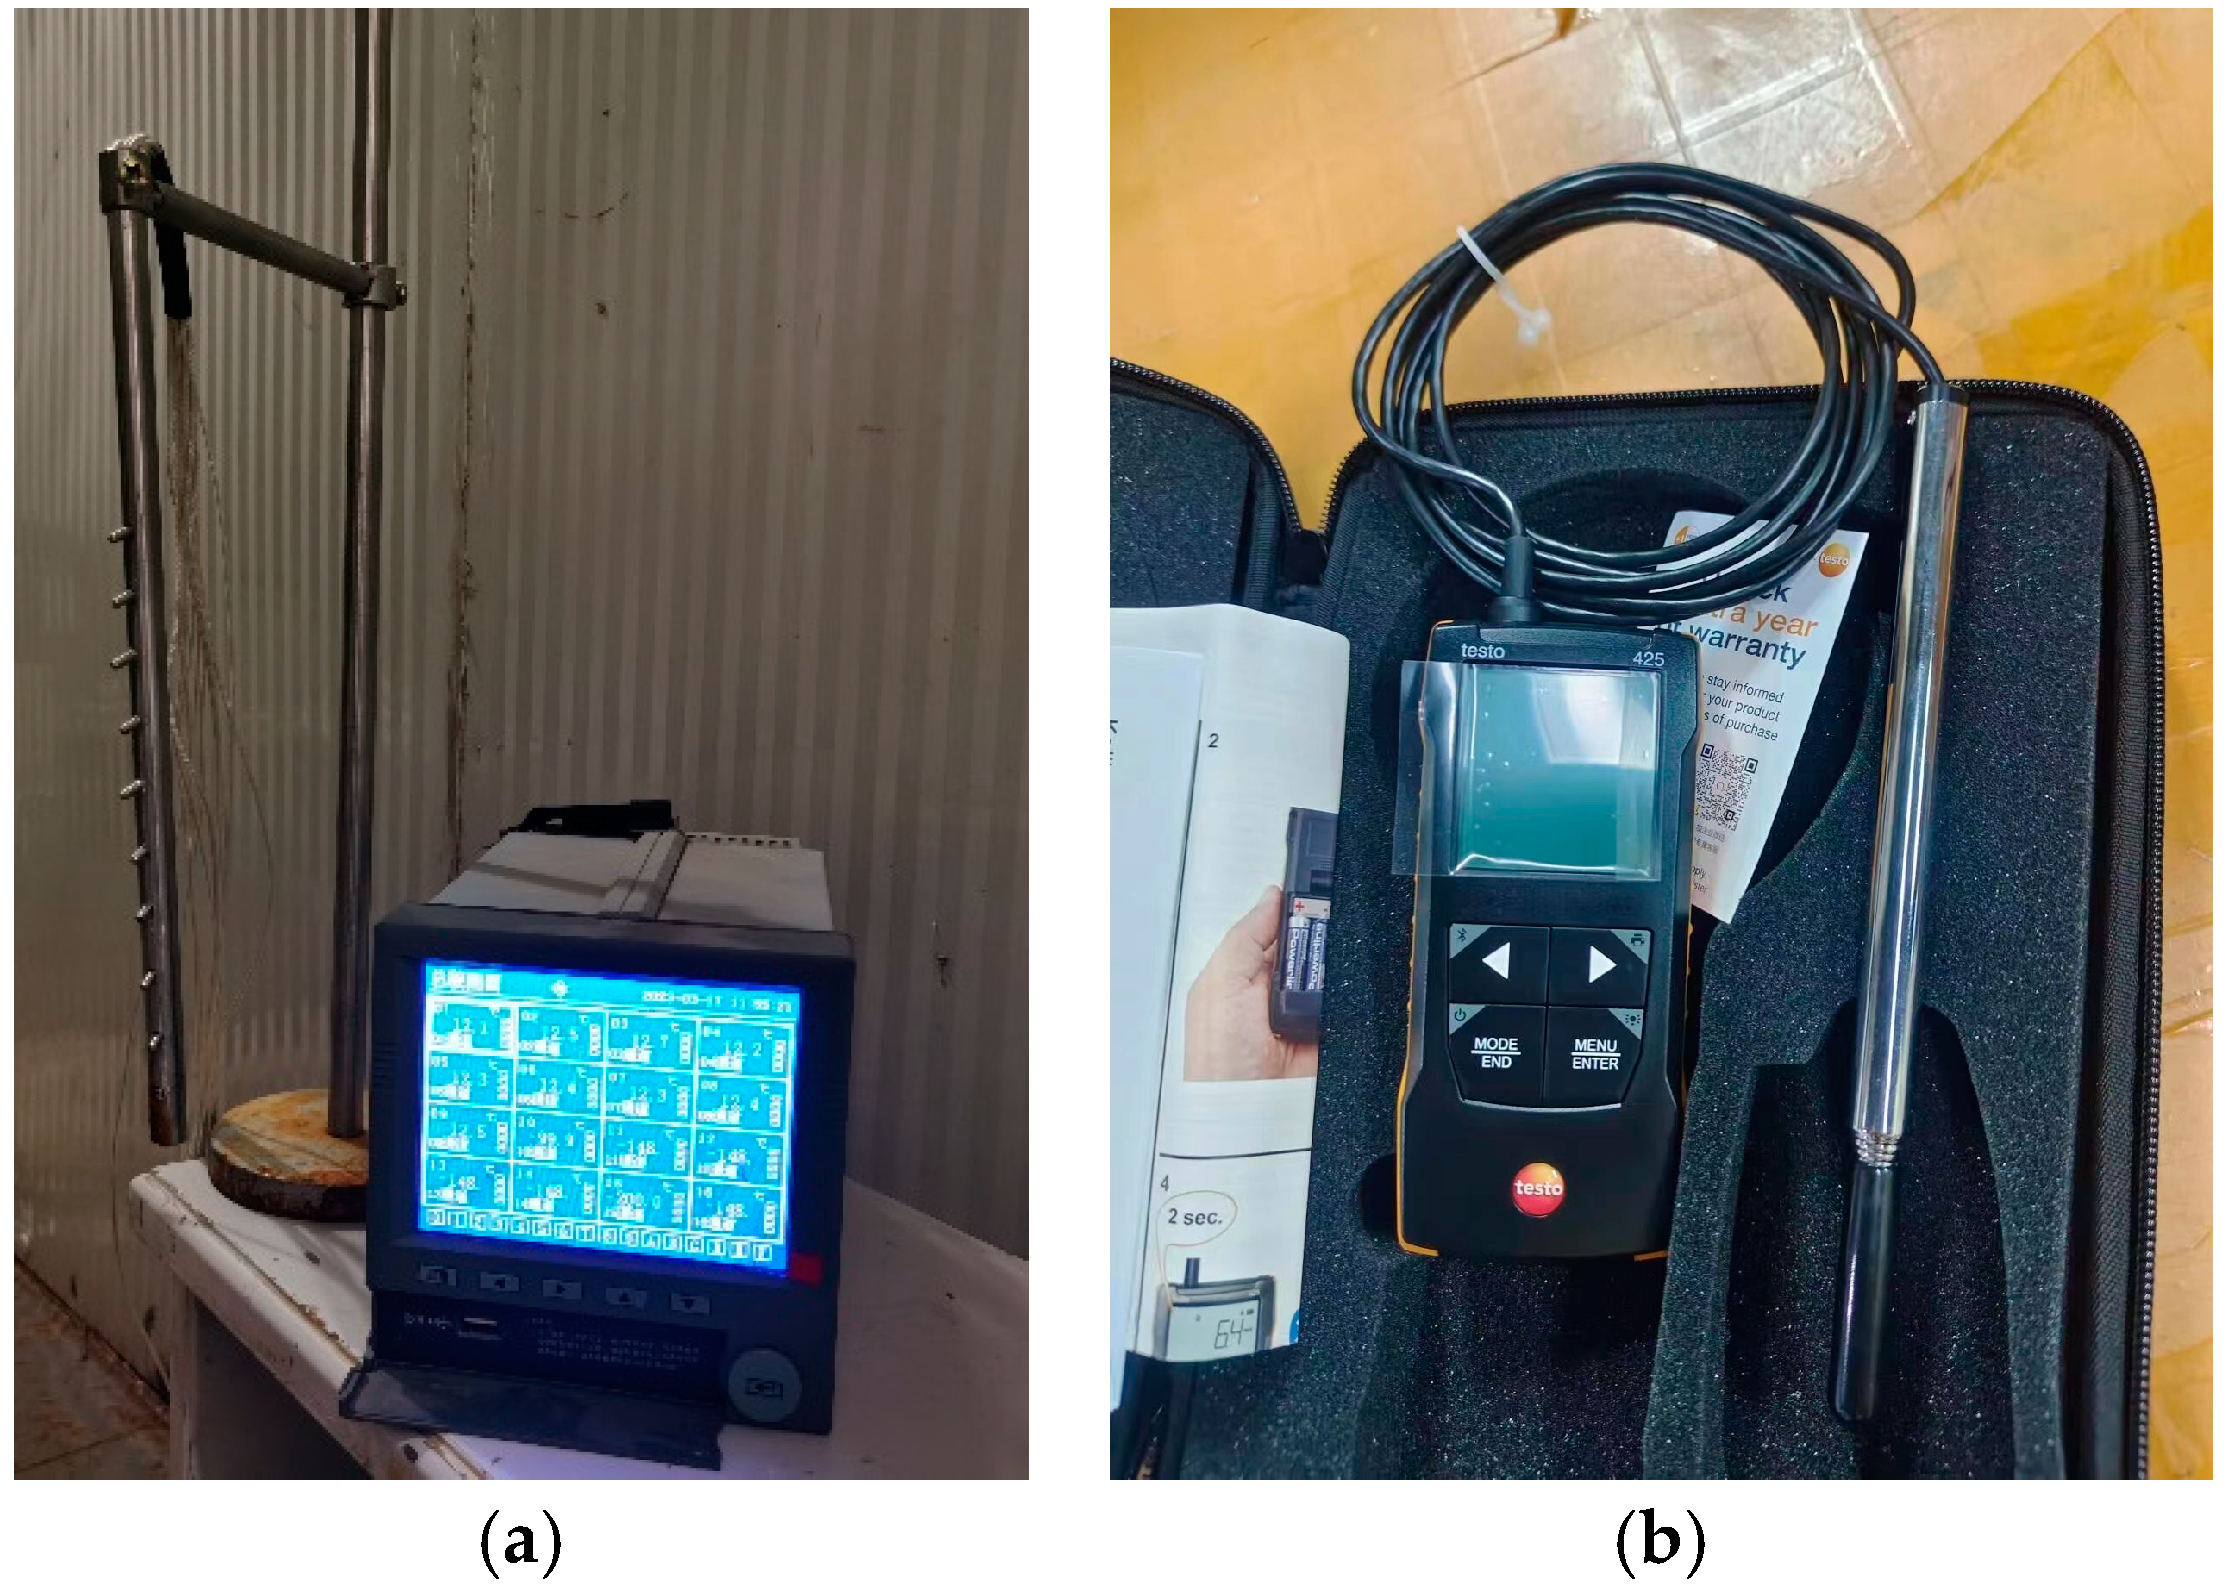
To measure temperature using a PT100 temperature sensor (Sigma-Aldrich, St. Louis, MA, USA), the sensor probe is welded onto a stainless-steel tube, forming a temperature chain. The high thermal conductivity of stainless steel may affect the heat transfer between air, ice, and water during the freezing process. To minimize this impact, the thickness of the stainless-steel tube is set at 1 mm. After welding the probe, the tube was vacuum-sealed. Temperature probes are placed at intervals of 2 cm along the temperature chain. The temperature sensor has a measurement range of −50 °C to 450 °C and an accuracy of 0.1 °C. The measurement data from the sensors are recorded using a paperless recorder, which has a reading accuracy of 0.1 °C. Wind speed is measured using the Testo 425 hot-wire anemometer (Testo SE, Titisee-Neustadt, Germany), with a resolution of 0.01 m/s and an accuracy of ±(0.03 m/s + 4.0% of the measured value). The arrangement of the temperature chain and the anemometer is illustrated in Figure 5.

2.2.2. Test Procedure

Before the test, the ice formation tank filled with water is placed in the high–low temperature test chamber until thermal equilibrium is reached. Once the low-temperature laboratory reaches the desired test temperature and thermal equilibrium is maintained, the tank is positioned below the test section. The temperature chain is arranged vertically downward in the center of the foam ice pool, with five probes submerged in the water, the uppermost probe being at the water surface. Ambient temperatures in the low-temperature laboratory were set to −10 °C, −15 °C, −20 °C, −25 °C, and −30 °C, with wind speeds of 1 m/s, 2 m/s, 4 m/s, 6 m/s, and 8 m/s for each temperature. Ice thickness is measured hourly. At the same depth, three positions are selected to insert a fine iron pin horizontally into the ice pool’s side. If the pin cannot be inserted, the depth is frozen; if it inserts smoothly, the depth contains water. The pin is then withdrawn, and waterproof tape is used to seal the hole. After the final measurement, the foam box is destroyed to drain the remaining water. The ice sample is photographed, its thickness measured, and its shape recorded.

3. Results and Discussion

3.1. Selection of the Wind Tunnel Contraction Section

3.1.1. The Distribution of Pressure and Velocity

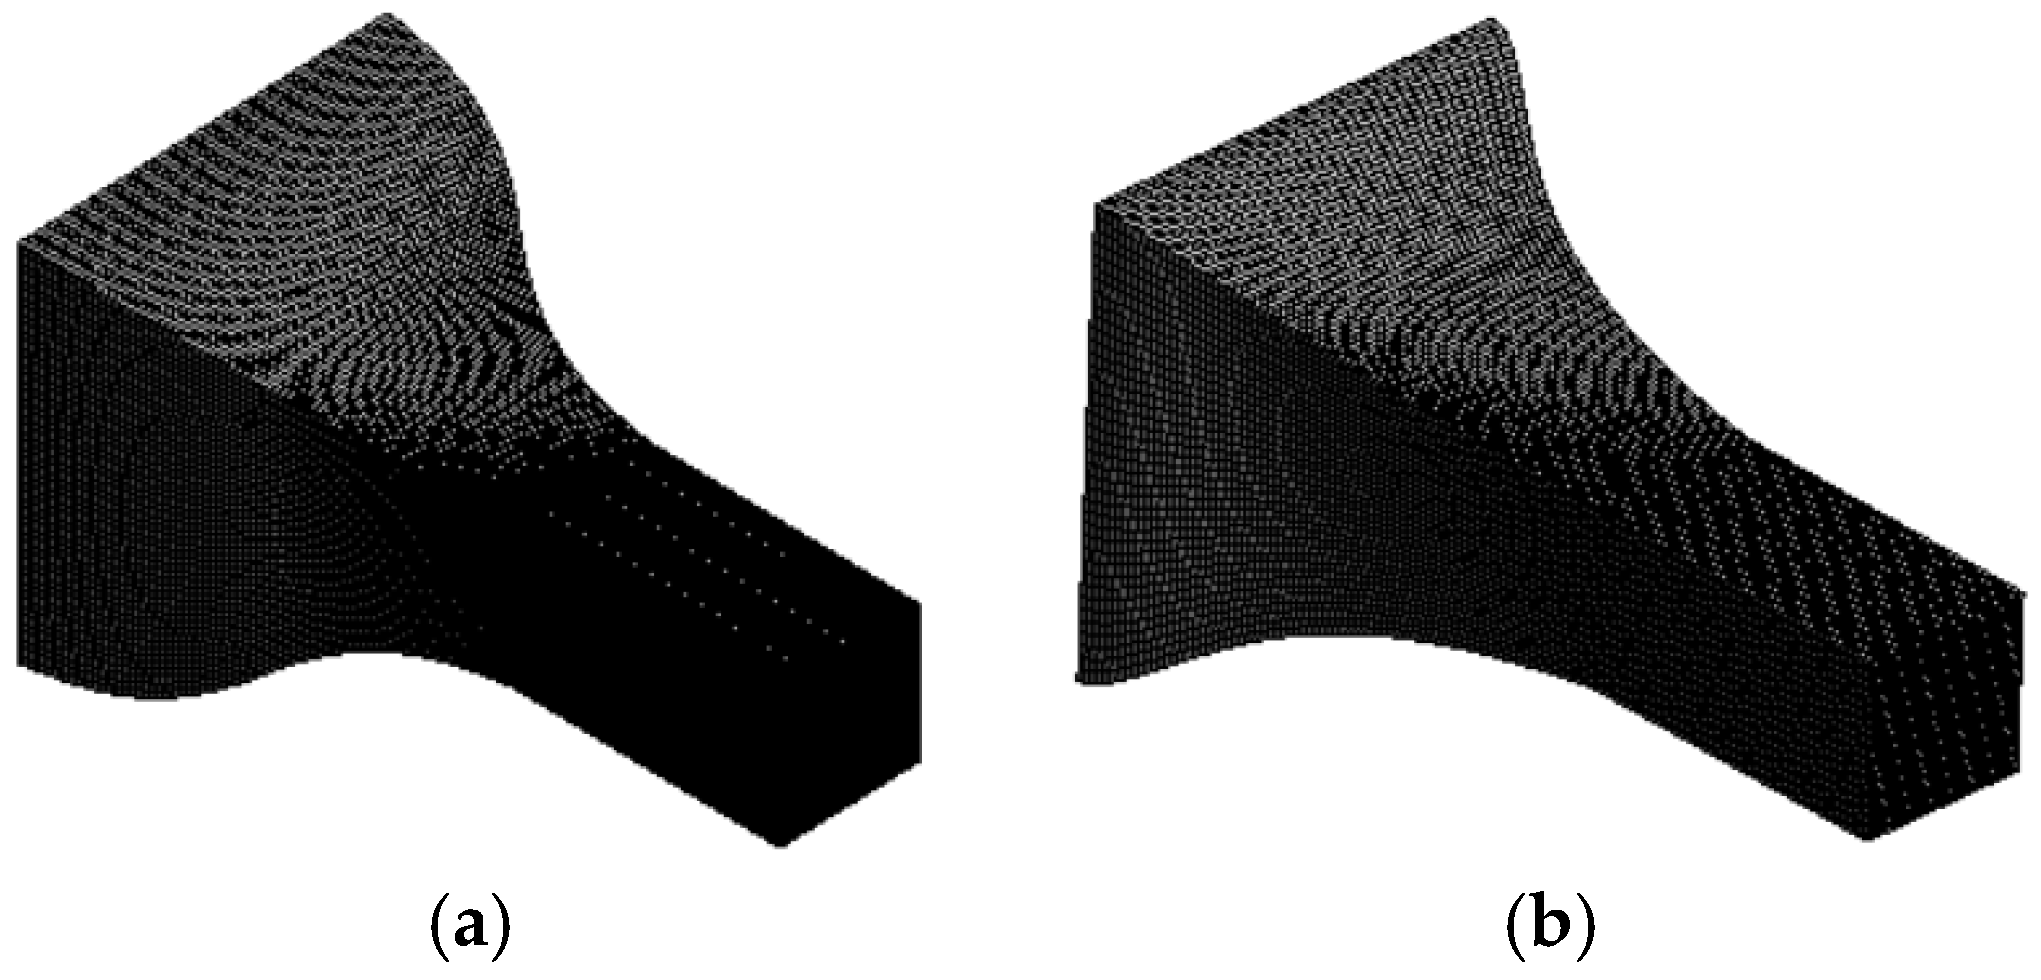
In Section 2, it was mentioned that the contraction section is the core structure of the wind tunnel design, and two common contraction section curves were proposed. This section introduces the selection of the contraction section for the experimental wind tunnel. Finite element models of the two contraction sections were established, as shown in Figure 6. Computational fluid dynamics (CFD) methods were used to analyze the flow fields inside the two contraction sections and the test section, with inlet velocities set at 0.1 m/s, 1 m/s, 3 m/s, and 10 m/s, respectively. The CFD simulations were conducted using FLUENT 2020 R2.
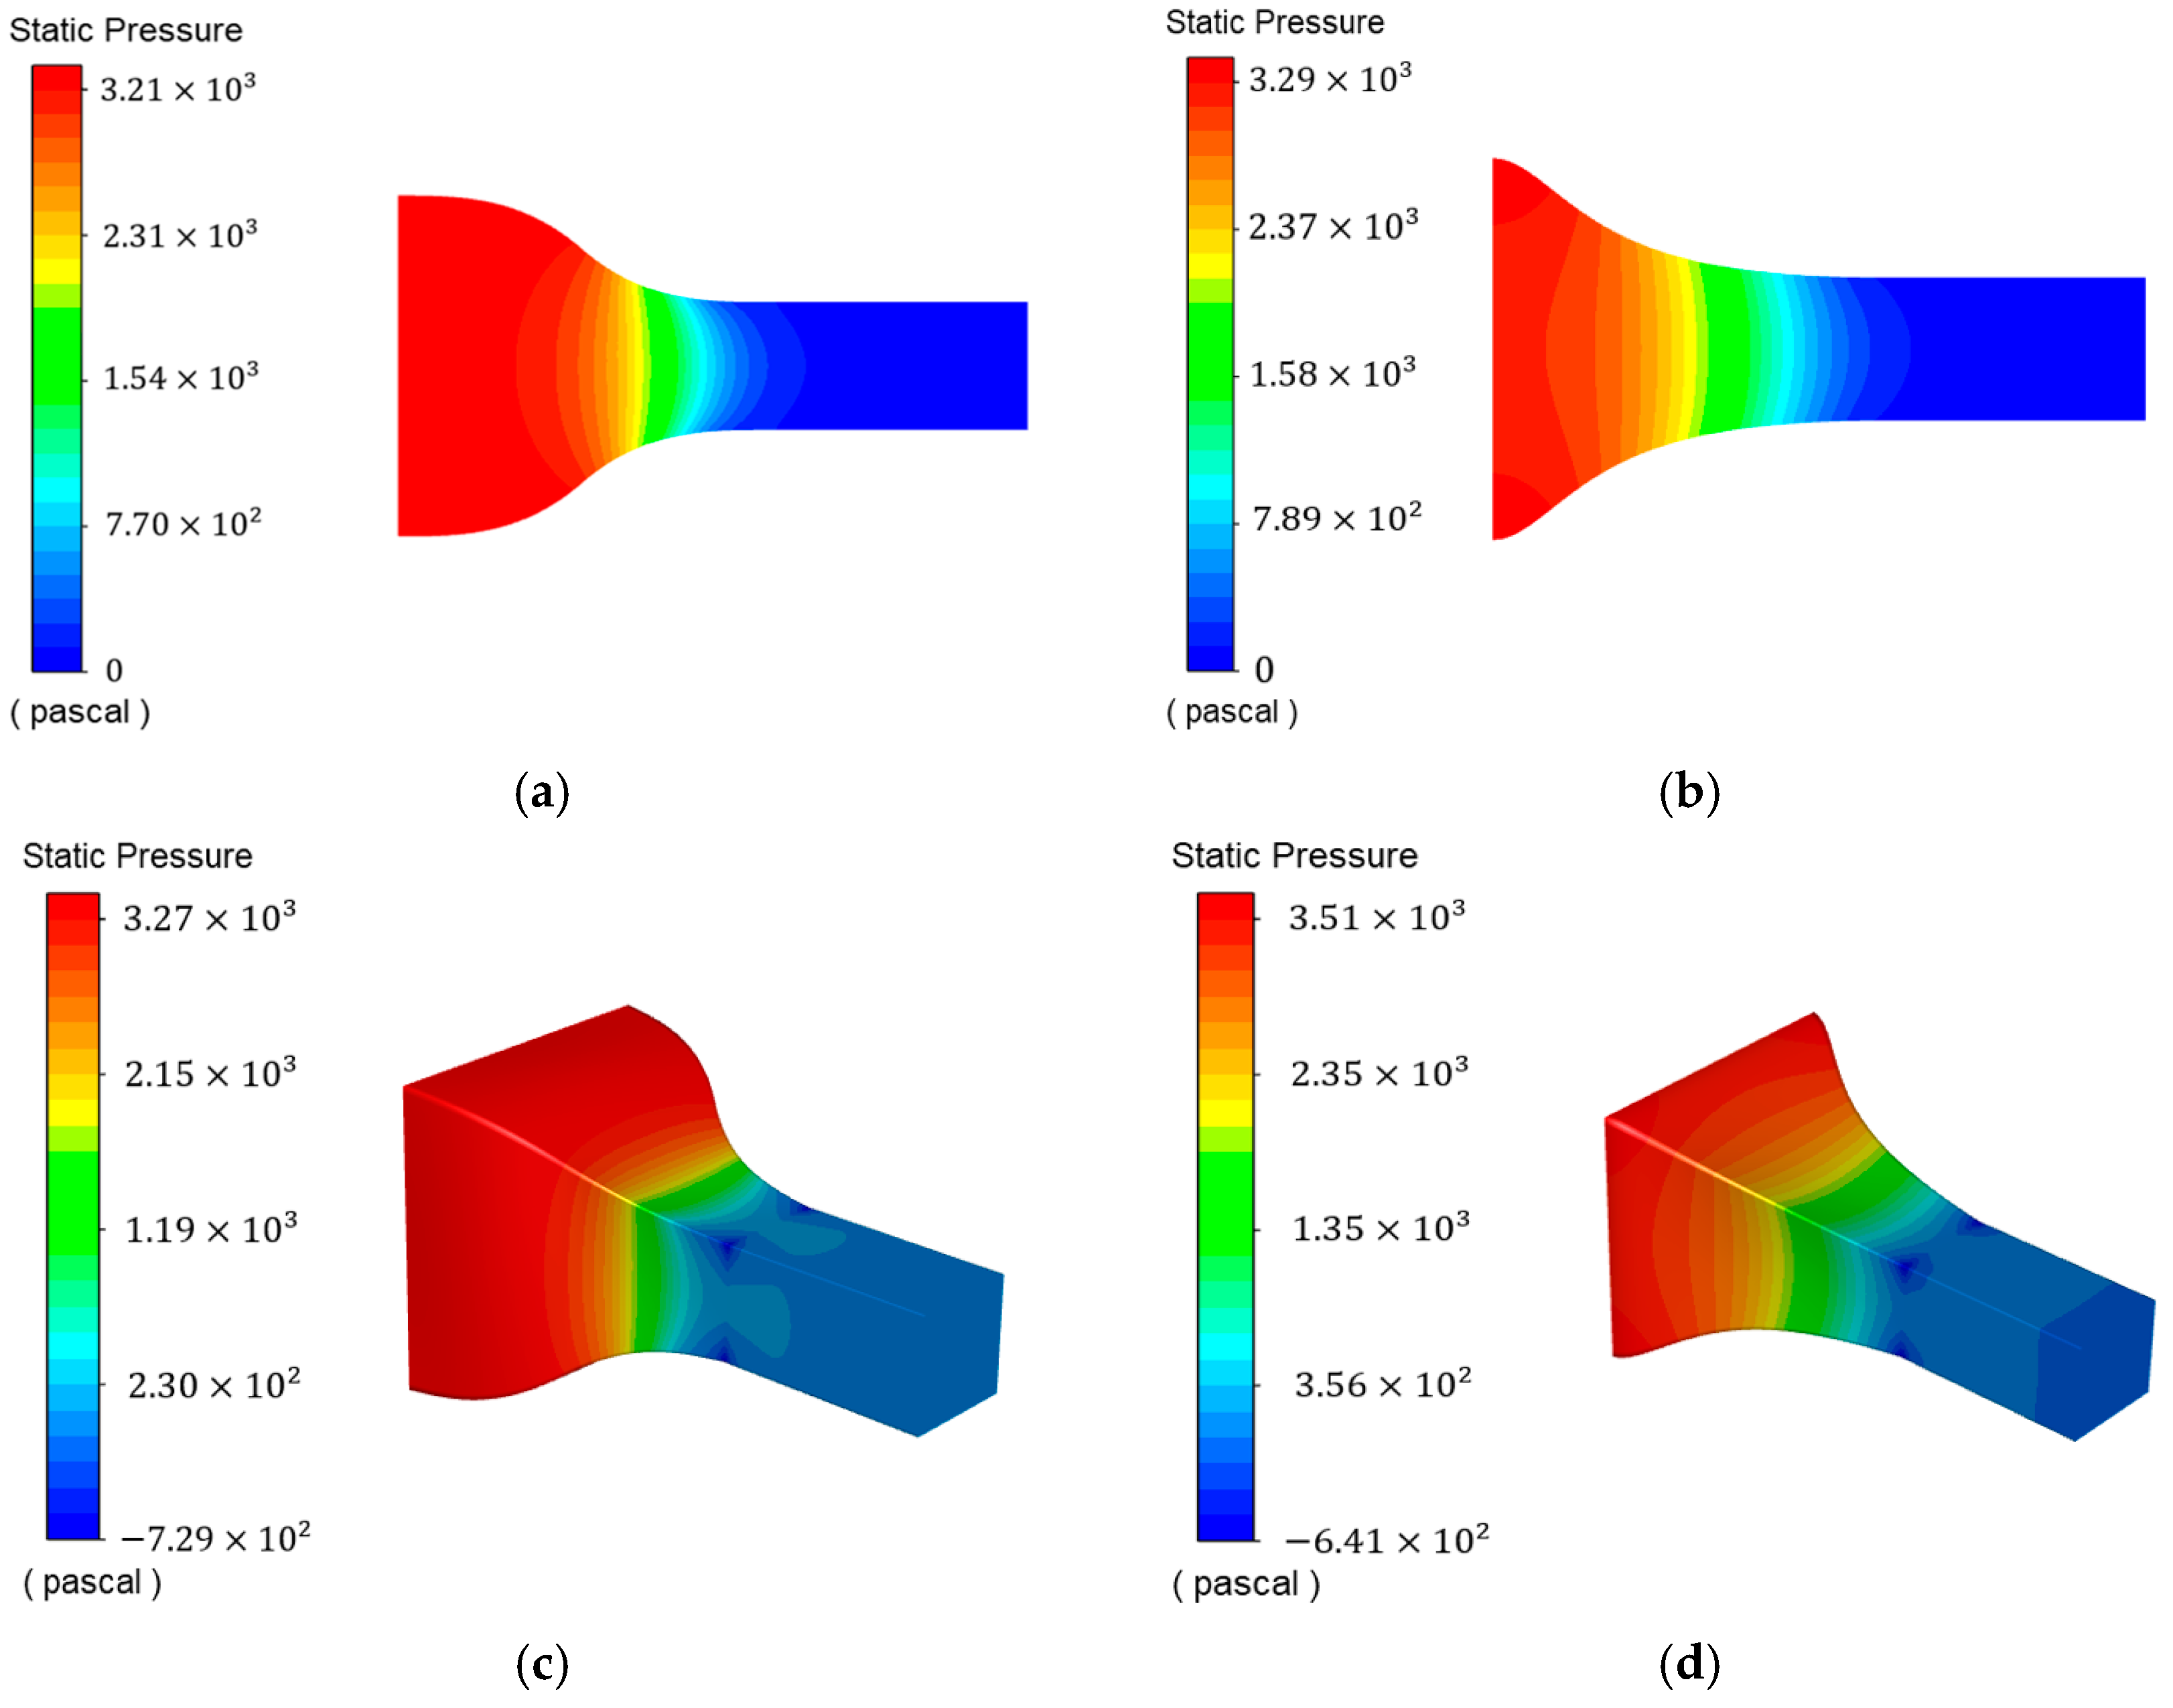
Under the same inlet velocity conditions, comparing the static pressure (gauge pressure) contour maps of the two types of contraction sections shown in Figure 7, taking 10 m/s as an example, it can be observed that the static pressure decreases along the flow direction from the entrance of the contraction section and tends to zero at the exit of the test section. In the contraction section constructed using two cubic arcs, the static pressure distribution is relatively uniform, with the maximum pressure evenly distributed at the entrance of the contraction section, and the rate of static pressure decrease is relatively gentle. In contrast, in the contraction section constructed using the Witosznski curve, it can be clearly observed that the static pressure distribution at the entrance is not uniform, with the maximum pressure concentrated at the corners of the entrance of the contraction section. This may lead to adverse pressure gradients causing gas recirculation, which could affect the overall quality of the flow field.
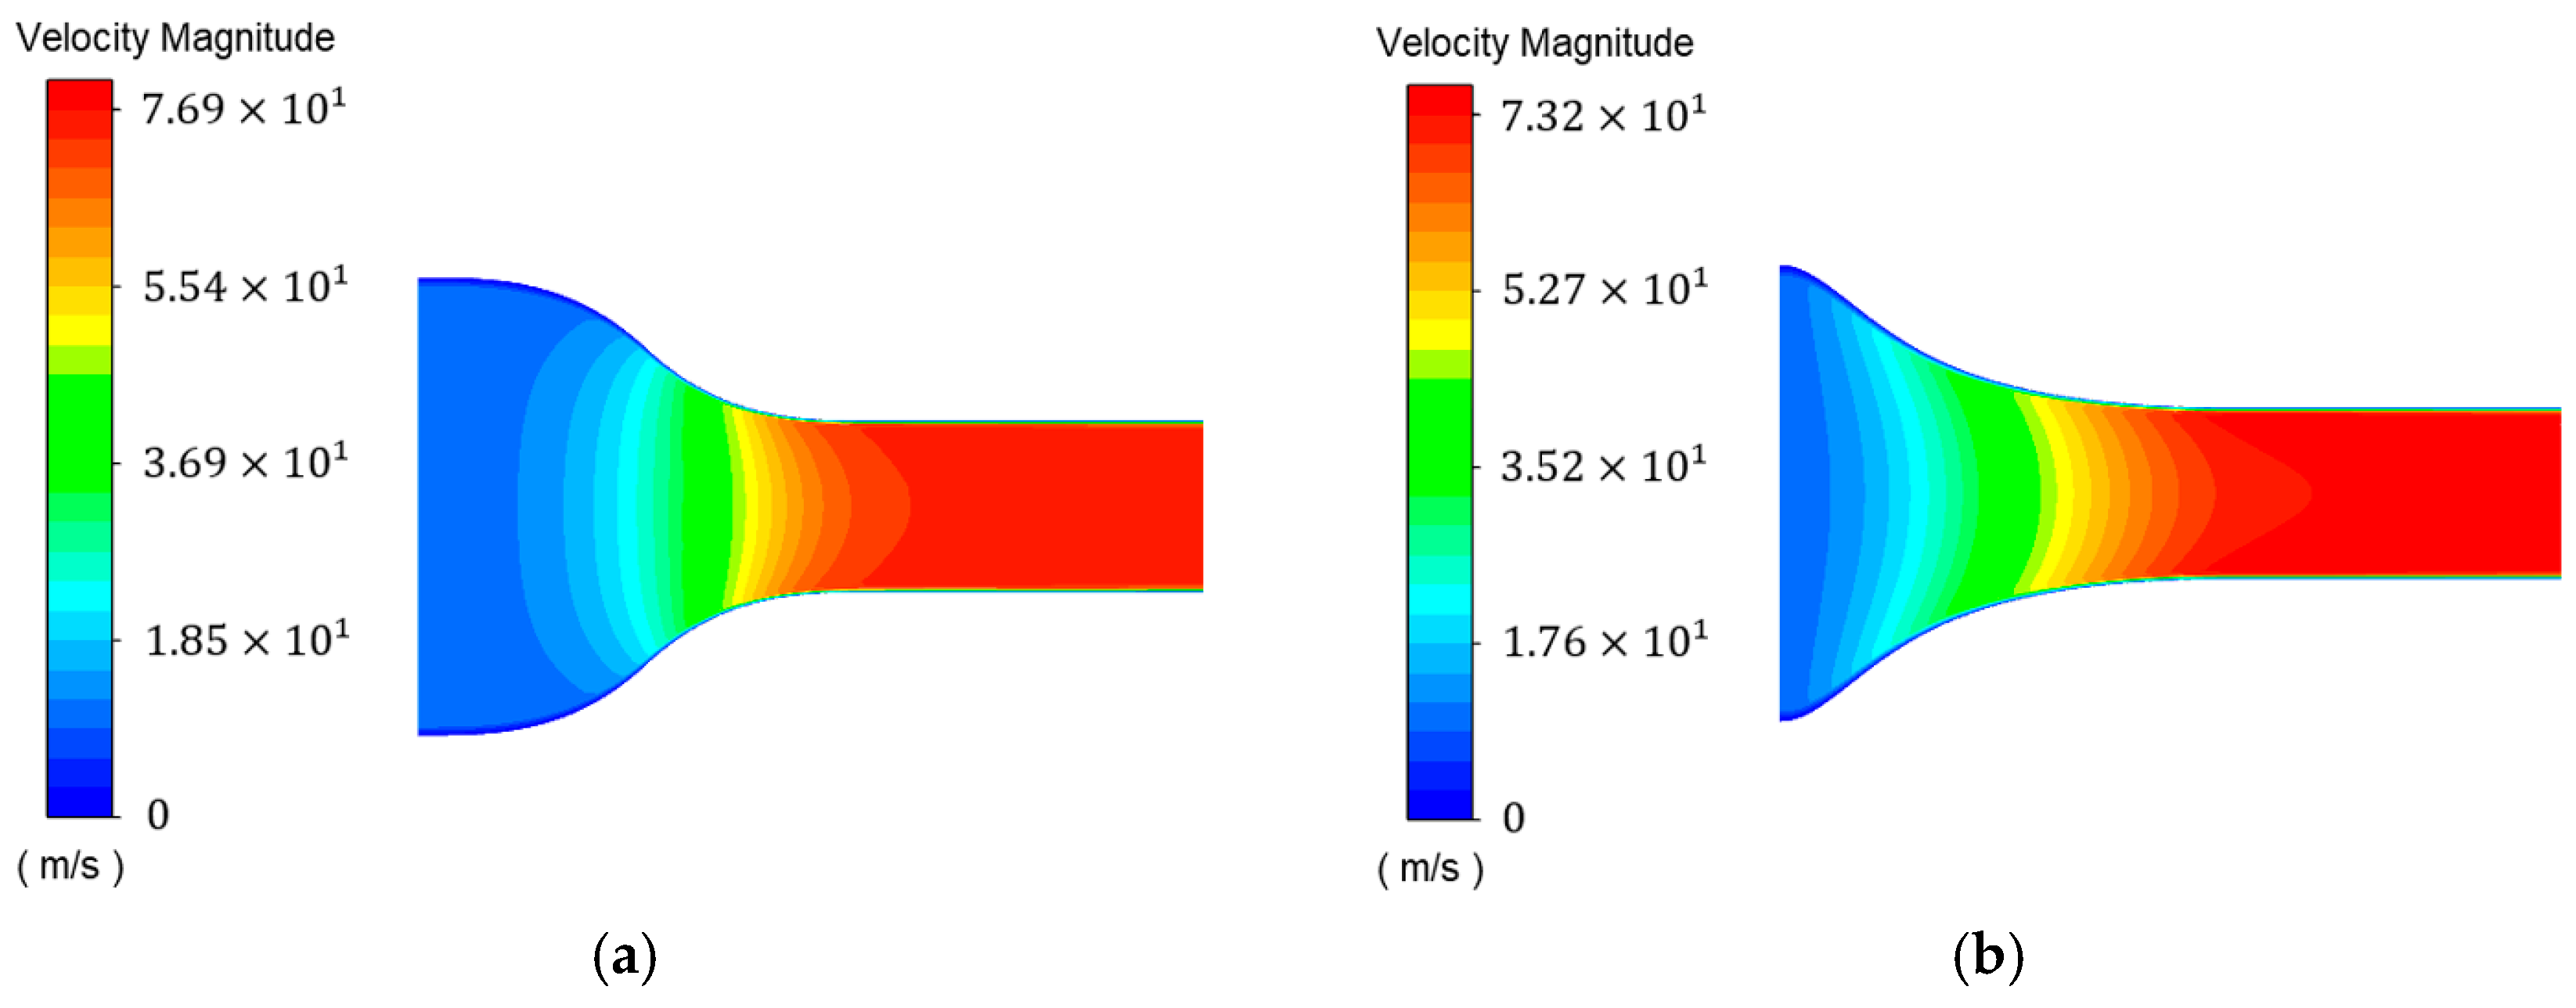
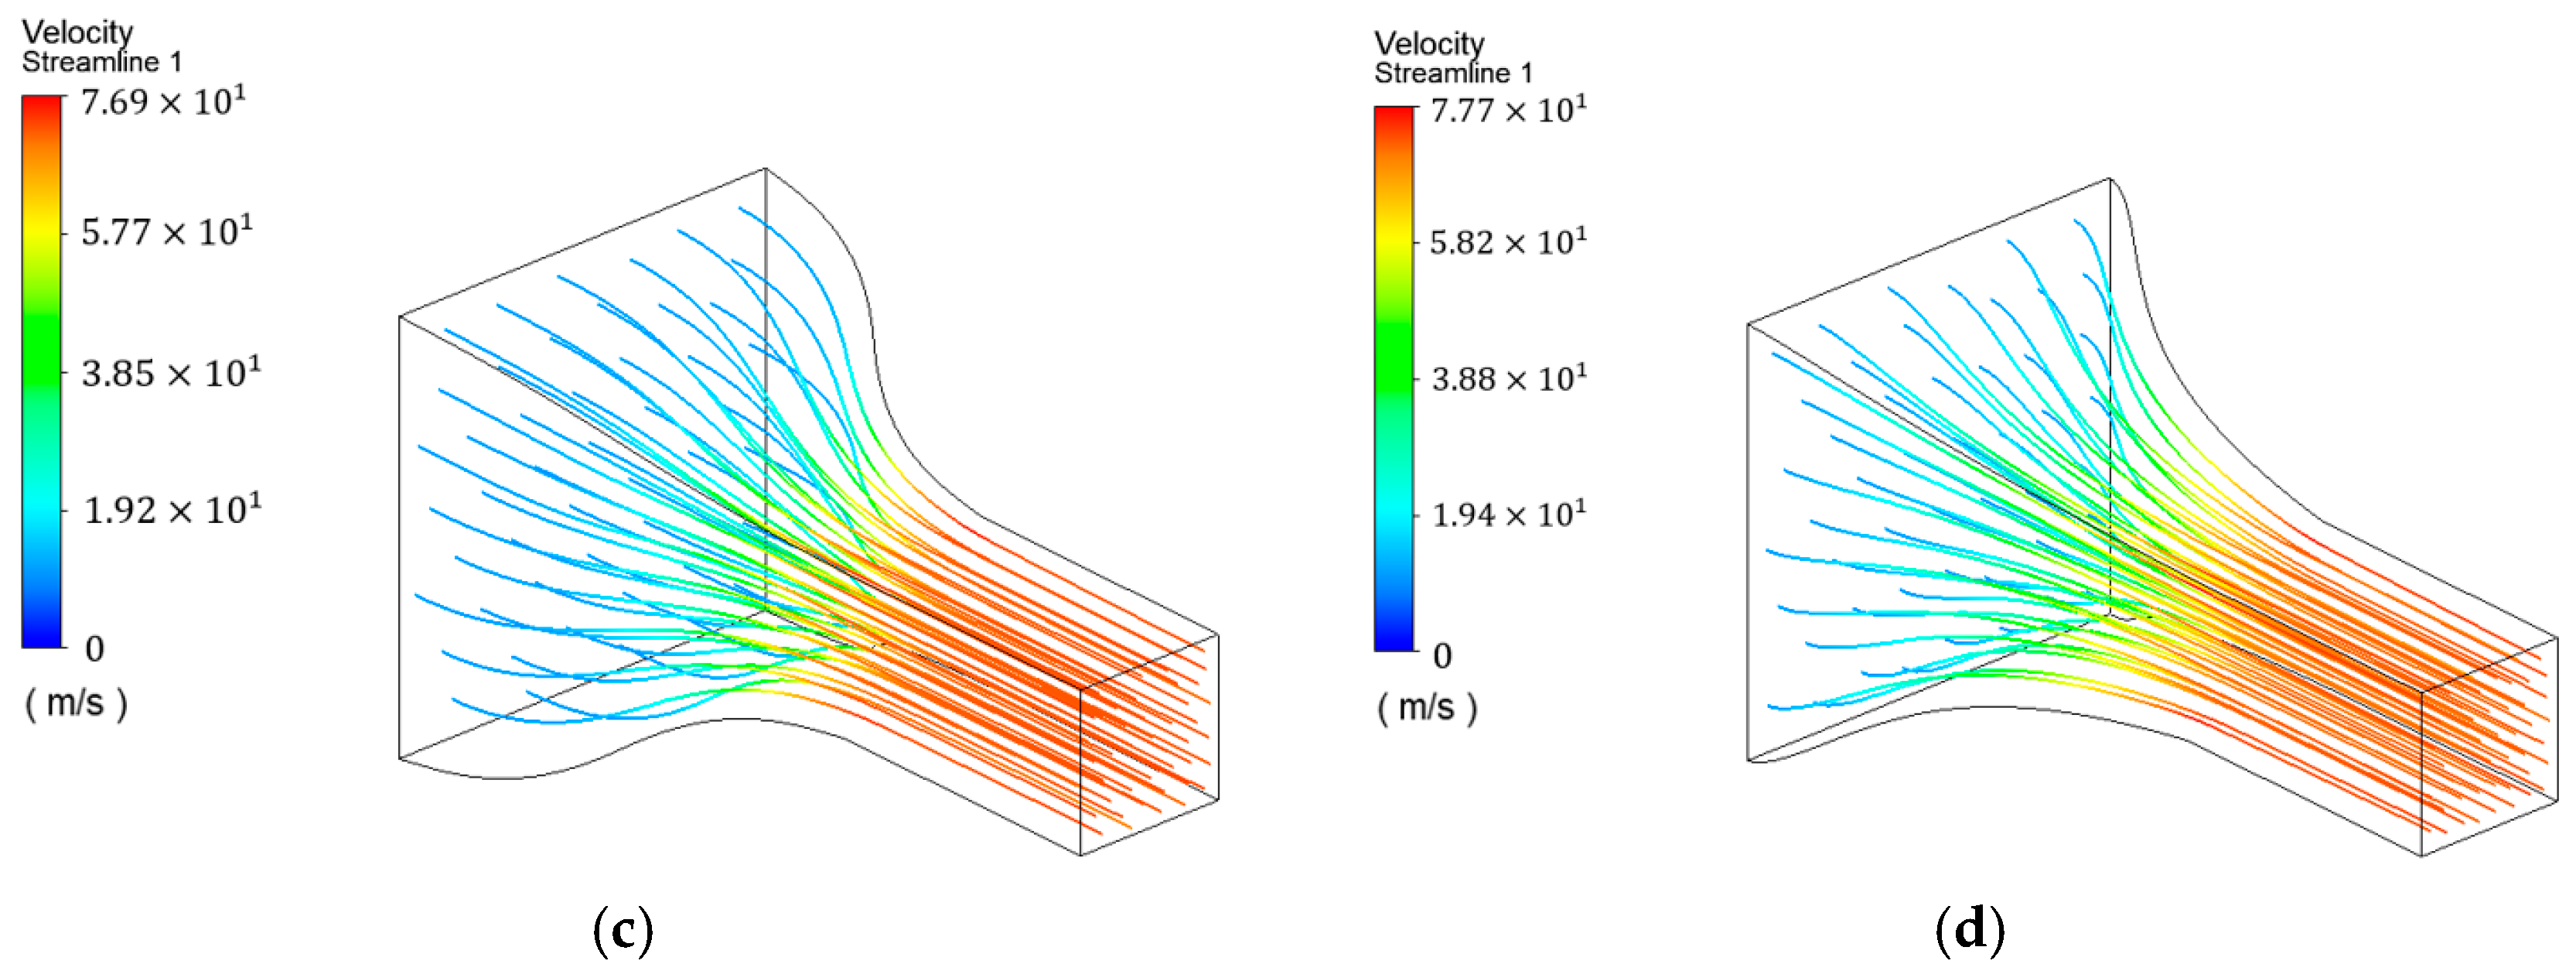
As shown in Figure 8, it can be found that at each inlet wind speed, the ratio of the velocity at the end of the contraction section to the inlet velocity is approximately 7, which matches the contraction ratio C = 7 designed for the wind tunnel model. Taking 10 m/s as an example, velocity streamlines in the test section in both types of models are relatively straight, indicating that both can provide a stable flow field. However, it was observed that the Witosznski curve contraction section exhibits more drastic changes in inlet velocity, while the two-cubic arcs contraction section experiences minimal variation in inlet velocity, primarily concentrated in the middle section for acceleration, and the velocity gradient at the exit returns to be gentle. A qualitative analysis of pressure and velocity distributions suggests that the flow characteristics of the two-cubic arcs contraction section are favorable.

3.1.2. Comparison of Dynamic Pressure Coefficient and Velocity Non-Uniformity

The dynamic pressure coefficient and velocity non-uniformity are crucial parameters for evaluating the uniformity of airflow in the test section. By comparing their magnitudes, the performance of the contraction curves can be quantitatively assessed, with smaller values indicating better flow uniformity. The formulas for calculating the dynamic pressure coefficient α i and velocity non-uniformity η are given as follows [43]:
α i = q i q ¯ 1
η = v i v ¯ 1
where q i is the dynamic pressure at point i , q ¯ is the average dynamic pressure measured at different points, v i is the velocity at point i , and v ¯ is the average velocity measured at different points.
The maximum dynamic pressure coefficient and maximum velocity non-uniformity in the central region of the test section for both wind tunnel models are calculated at different wind speeds (Table 1 and Table 2). As the wind speed increases, both parameters decrease, indicating a more uniform flow field within the test section. When the wind speed is 0.1 m/s, the velocity non-uniformity of the Witosznski curve model is slightly better than that of the two-cubic arcs model. However, at inlet wind speeds of 1 m/s, 3 m/s, and 10 m/s, the maximum dynamic pressure coefficient and velocity non-uniformity for the model with the two-cubic arcs contraction section are smaller. Therefore, the model with the two-cubic arcs contraction section exhibits better flow characteristics than the one with the Witosznski curve contraction section and is chosen for use in this study.

3.2. Wind Tunnel Test Section Velocity Verification

After the completion of the wind tunnel construction, performance testing is required. In this study, the primary purpose of the wind tunnel is to provide stable wind speeds during the ice formation process. Therefore, the wind speed within the test section has been selected as the subject for performance verification. The contraction ratio was defined in Section 2. According to the law of mass conservation, the numerical ratio of the wind speed within the test section to the wind speed at the entrance of the contraction section should equal the contraction ratio. Therefore, measuring the wind speed can also verify whether the acceleration effect matches the design expectations. The wind speed within the wind tunnel is provided by an axial flow fan equipped with a variable transformer. The rotational speed of the fan blades can be continuously adjusted by varying the output voltage of the transformer. The transformer is adjusted to a specific output voltage until the fan speed remains constant. Then, the anemometer probe is positioned at the midpoint of the contraction section entrance cross-section, and the test section midpoint and the wind speeds are recorded, respectively. The output voltage is gradually adjusted from low to high, and the wind speed is measured at the midpoint of the test section. This process will determine the minimum and maximum stable wind speeds that the wind tunnel can provide under operational conditions. At each output voltage, the wind speed measurements are repeated three times, and the average is taken to minimize errors. The results of the wind speed measurements are shown in Table 3.
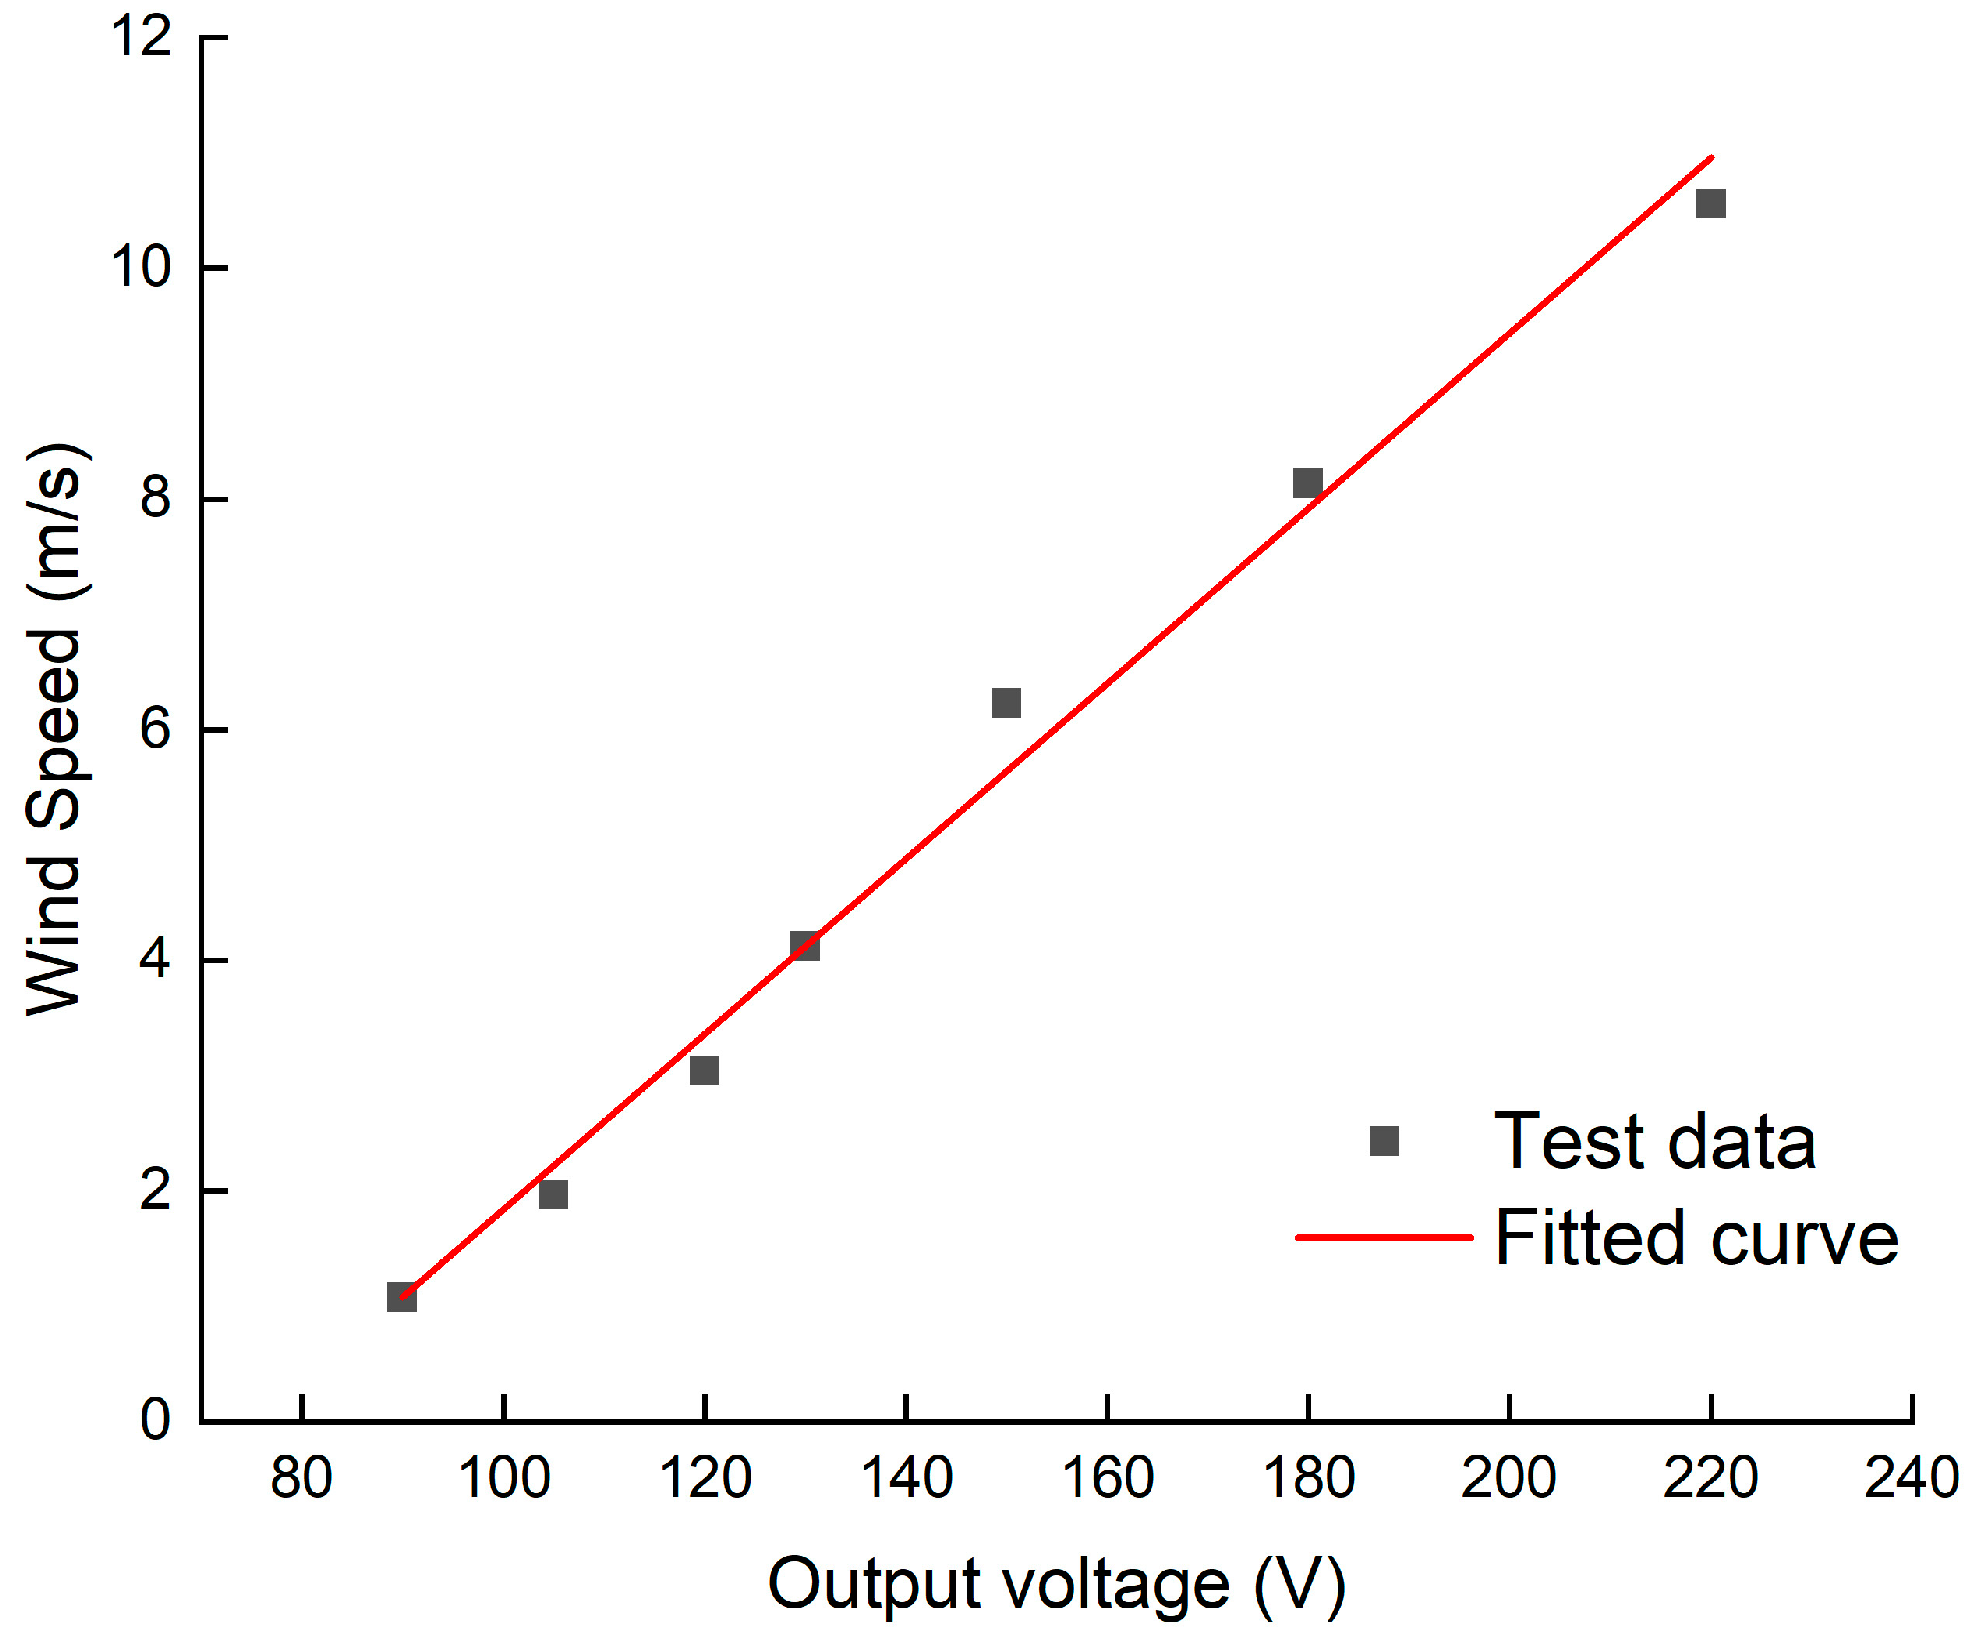
The calculated ratio of the wind speed at the midpoint of the test section to the wind speed at the entrance of the contraction section ranges from 6.7 to 6.8, which is marginally less than the designed contraction ratio of 7. This deviation can be attributed to the fact that theoretical calculations typically assume idealized conditions, such as smooth wall surfaces and negligible flow losses. In contrast, practical implementations involve pressure gradients and energy dissipation within the wind tunnel, which reduce the kinetic energy of the airflow. Additionally, the formation of a boundary layer due to viscous effects between the airflow and the walls reduces the effective cross-sectional area, leading to a contraction ratio that is slightly lower than the design value. The results indicate that the wind tunnel in this study can provide a stable wind speed range from 1 m/s to 10 m/s under operational conditions. Integrating the midpoint wind speed of the test section with the output voltage into Figure 9 reveals a linear positive correlation between the output voltage and the midpoint wind speed of the test section. The relationship is expressed by the following equation:
v v 0 = 0.076 U U 0 5.759  
where U is output voltage and v is wind speed of test section. v 0 and U 0 are used for non-dimensionalization.

3.3. Results and Discussion of Ice Formation Test

In the initial stages of the ice formation observed according to the experimental methods in Section 2, five temperature sensor probes were arranged every 2 cm along the water surface, with Probe 1 located at the water surface. The temperature data were collected at a frequency of once per minute, resulting in temperature variation curves during the experiment, as partially shown in Figure 10 and Figure 11.
It can be observed that, under all conditions, the temperature variation in the condensation tank can be divided into two stages. The first stage is characterized by a rapid overall decline in water temperature, with the slopes of the temperature curves obtained by each probe being largely consistent. This slope can be used to calculate the cooling rate of the water before icing, with the calculated results shown in Table 4. By comparing the temperature curves at the same temperature but different wind speeds (Figure 10) and at the same wind speed but different temperatures (Figure 11), it is found that higher wind speeds and lower temperatures lead to faster cooling rates. Furthermore, it is evident that wind speed has a more significant impact on the cooling rate than ambient temperature at this stage. This is because the heat transfer modes in this study include both convective heat transfer and conduction. At this stage, the water surface has not yet frozen, and the convective heat transfer between water and air dominates. In the second stage, the cooling rate of the temperature at each measuring point in the condensation tank slows down, and the temperature differences between measuring points gradually increase. The closer to the air, the lower the temperature and the faster the cooling rate. The reason for the slowdown in cooling is that the water starts to freeze during this period, releasing heat during the phase transition. Additionally, the thermal conductivity of ice is lower than that of water. Once the water surface freezes, the ice layer acts as a thermal resistance, providing some insulation and affecting the heat exchange process between the underlying water and the cold air. This is reflected in the graphs, showing that the deeper the water, the slower the temperature drops.
After each test, the condensation tank was destroyed, and the remaining water was drained to reveal the final ice formation, with some results shown in Figure 12. It can be observed that despite the low thermal conductivity of the foam box, which minimizes boundary effects, there are still some protrusions around the edges of the ice. Additionally, the thickness in the middle of the ice layer is slightly greater due to the influence of the temperature chain. The thickness of the ice was measured after removing the protruding parts. The condensation tank is 280 mm long, and measurements were taken at 10 mm, 75 mm, 140 mm, 205 mm, and 270 mm from the end near the fan. The average value of these measurements was then calculated. Combined with the duration of test, the average icing rate was recorded in Table 5.
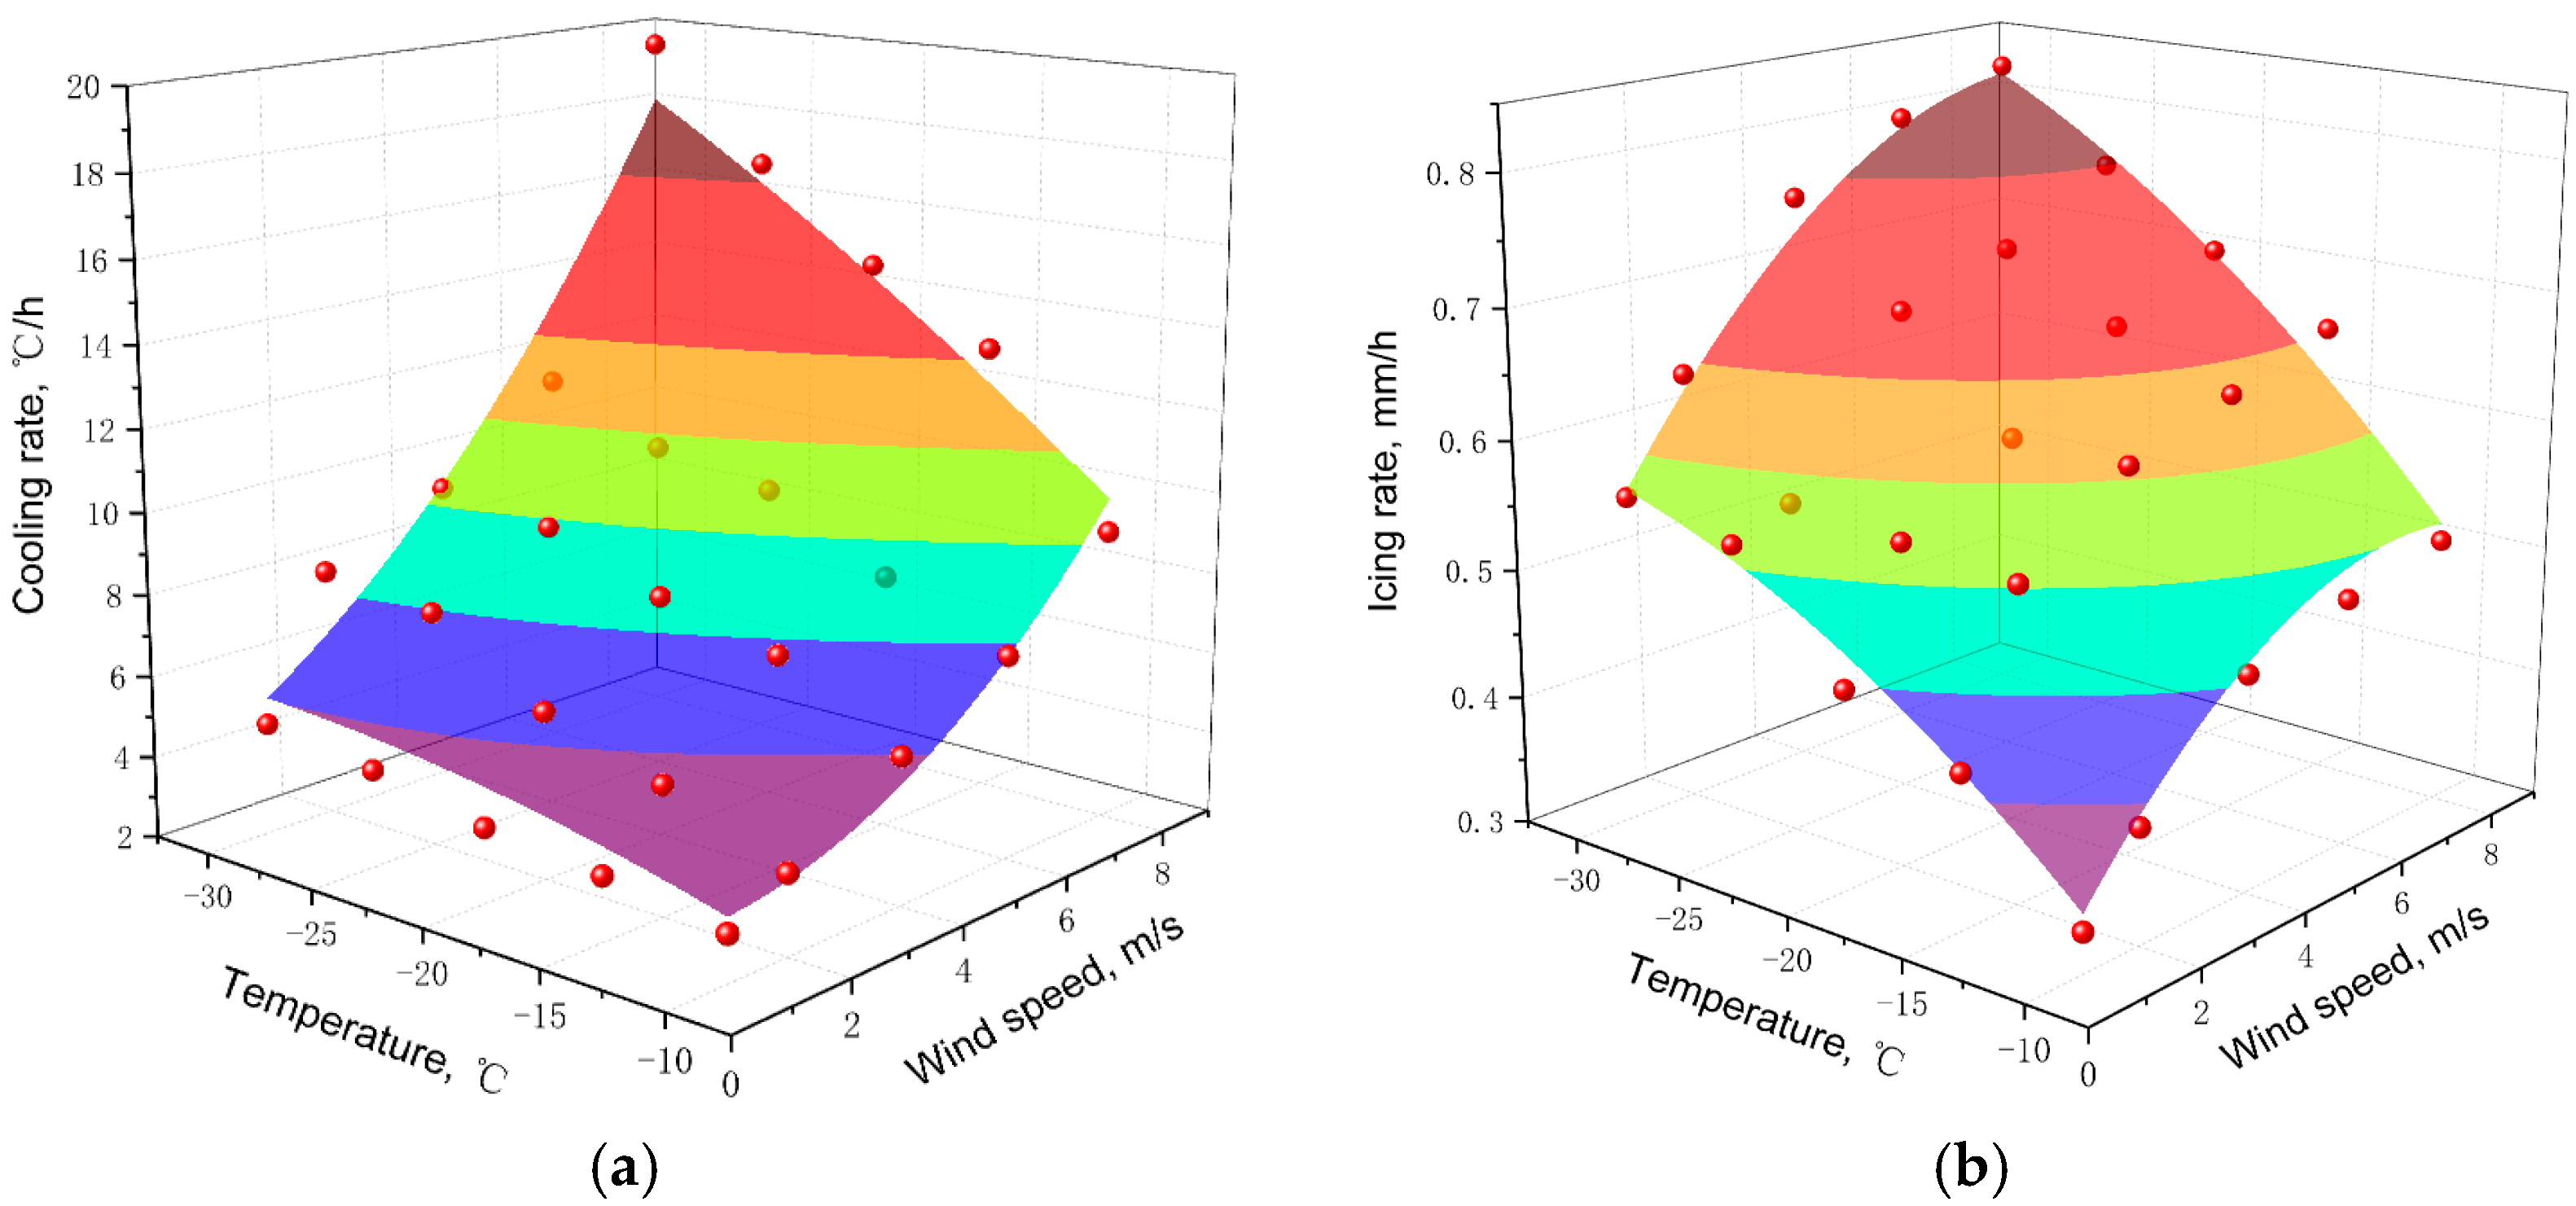
The results indicate that both the cooling rate of the water body before the onset of freezing and the initial icing rate are influenced by the combined effects of ambient temperature and wind speed. By plotting the data in Figure 13 and applying surface fitting, the relationships between the cooling rate, the icing rate, and the temperature and wind speed can be expressed by Equations (6) and (7):
u c = 2.051 0.183 T 0.581 v 0.003 T 2 + 0.115 v 2 0.046 T v  
u i = 0.092 0.022 T + 0.061 v 2.95 × 10 4 T 2 0.005 v 2 5.94 × 10 4 T v  
where u c is the cooling rate of the water body, u i is icing rate, T is ambient temperature, and v is wind speed.

3.4. Results and Discussion of Ice Crystal Measurement

The objective of this study is to simulate the low-temperature, windy conditions of polar regions in a laboratory setting to produce columnar ice. Consequently, it is necessary to measure the crystal structure of the ice fabricated using the techniques in this study. To ensure the integrity of the ice and facilitate its smooth extraction, temperature chains were not inserted for temperature monitoring during the freezing process of the ice used for crystal structure observation. The methods for observing ice crystal structures are well established and have been utilized in previous studies [28,42]. Thin ice sections attached to glass slides are observed under polarized light, with sections categorized as either horizontal or vertical based on their orientation relative to the ice growth direction. The method for preparing sections for observing the ice crystal structure is as follows: after extracting the ice sample, sections of appropriate size and smooth cross-sections are cut from different positions, oriented either vertically (parallel to the ice growth direction) or horizontally (perpendicular to the ice growth direction), with a thickness of approximately 1–2 cm. A planer is used to gradually flatten one side of the section to ensure it can adhere seamlessly to a clean glass slide. The preheated glass slide, maintained in a water bath slightly above 0 °C, is then used to bond the flattened surface of the ice section. After a few minutes, the ice section is firmly frozen to the glass slide. The section is then thinned to a thickness of less than 1 mm using a planer to facilitate the distinction of crystal boundaries. Vertical sections are used to observe the crystal type, while the results of horizontal sections are analyzed using the equivalent circular diameter method to calculate the grain size. The equivalent circle diameter method involves counting the number of complete grains on a known cross-sectional area and treating each grain as a circle to calculate its diameter. The calculation formula is as follows:
D g = 2 S n π
where D g is the average grain diameter (mm); S is the area of ice section (mm2); and n is number of grains on the section.
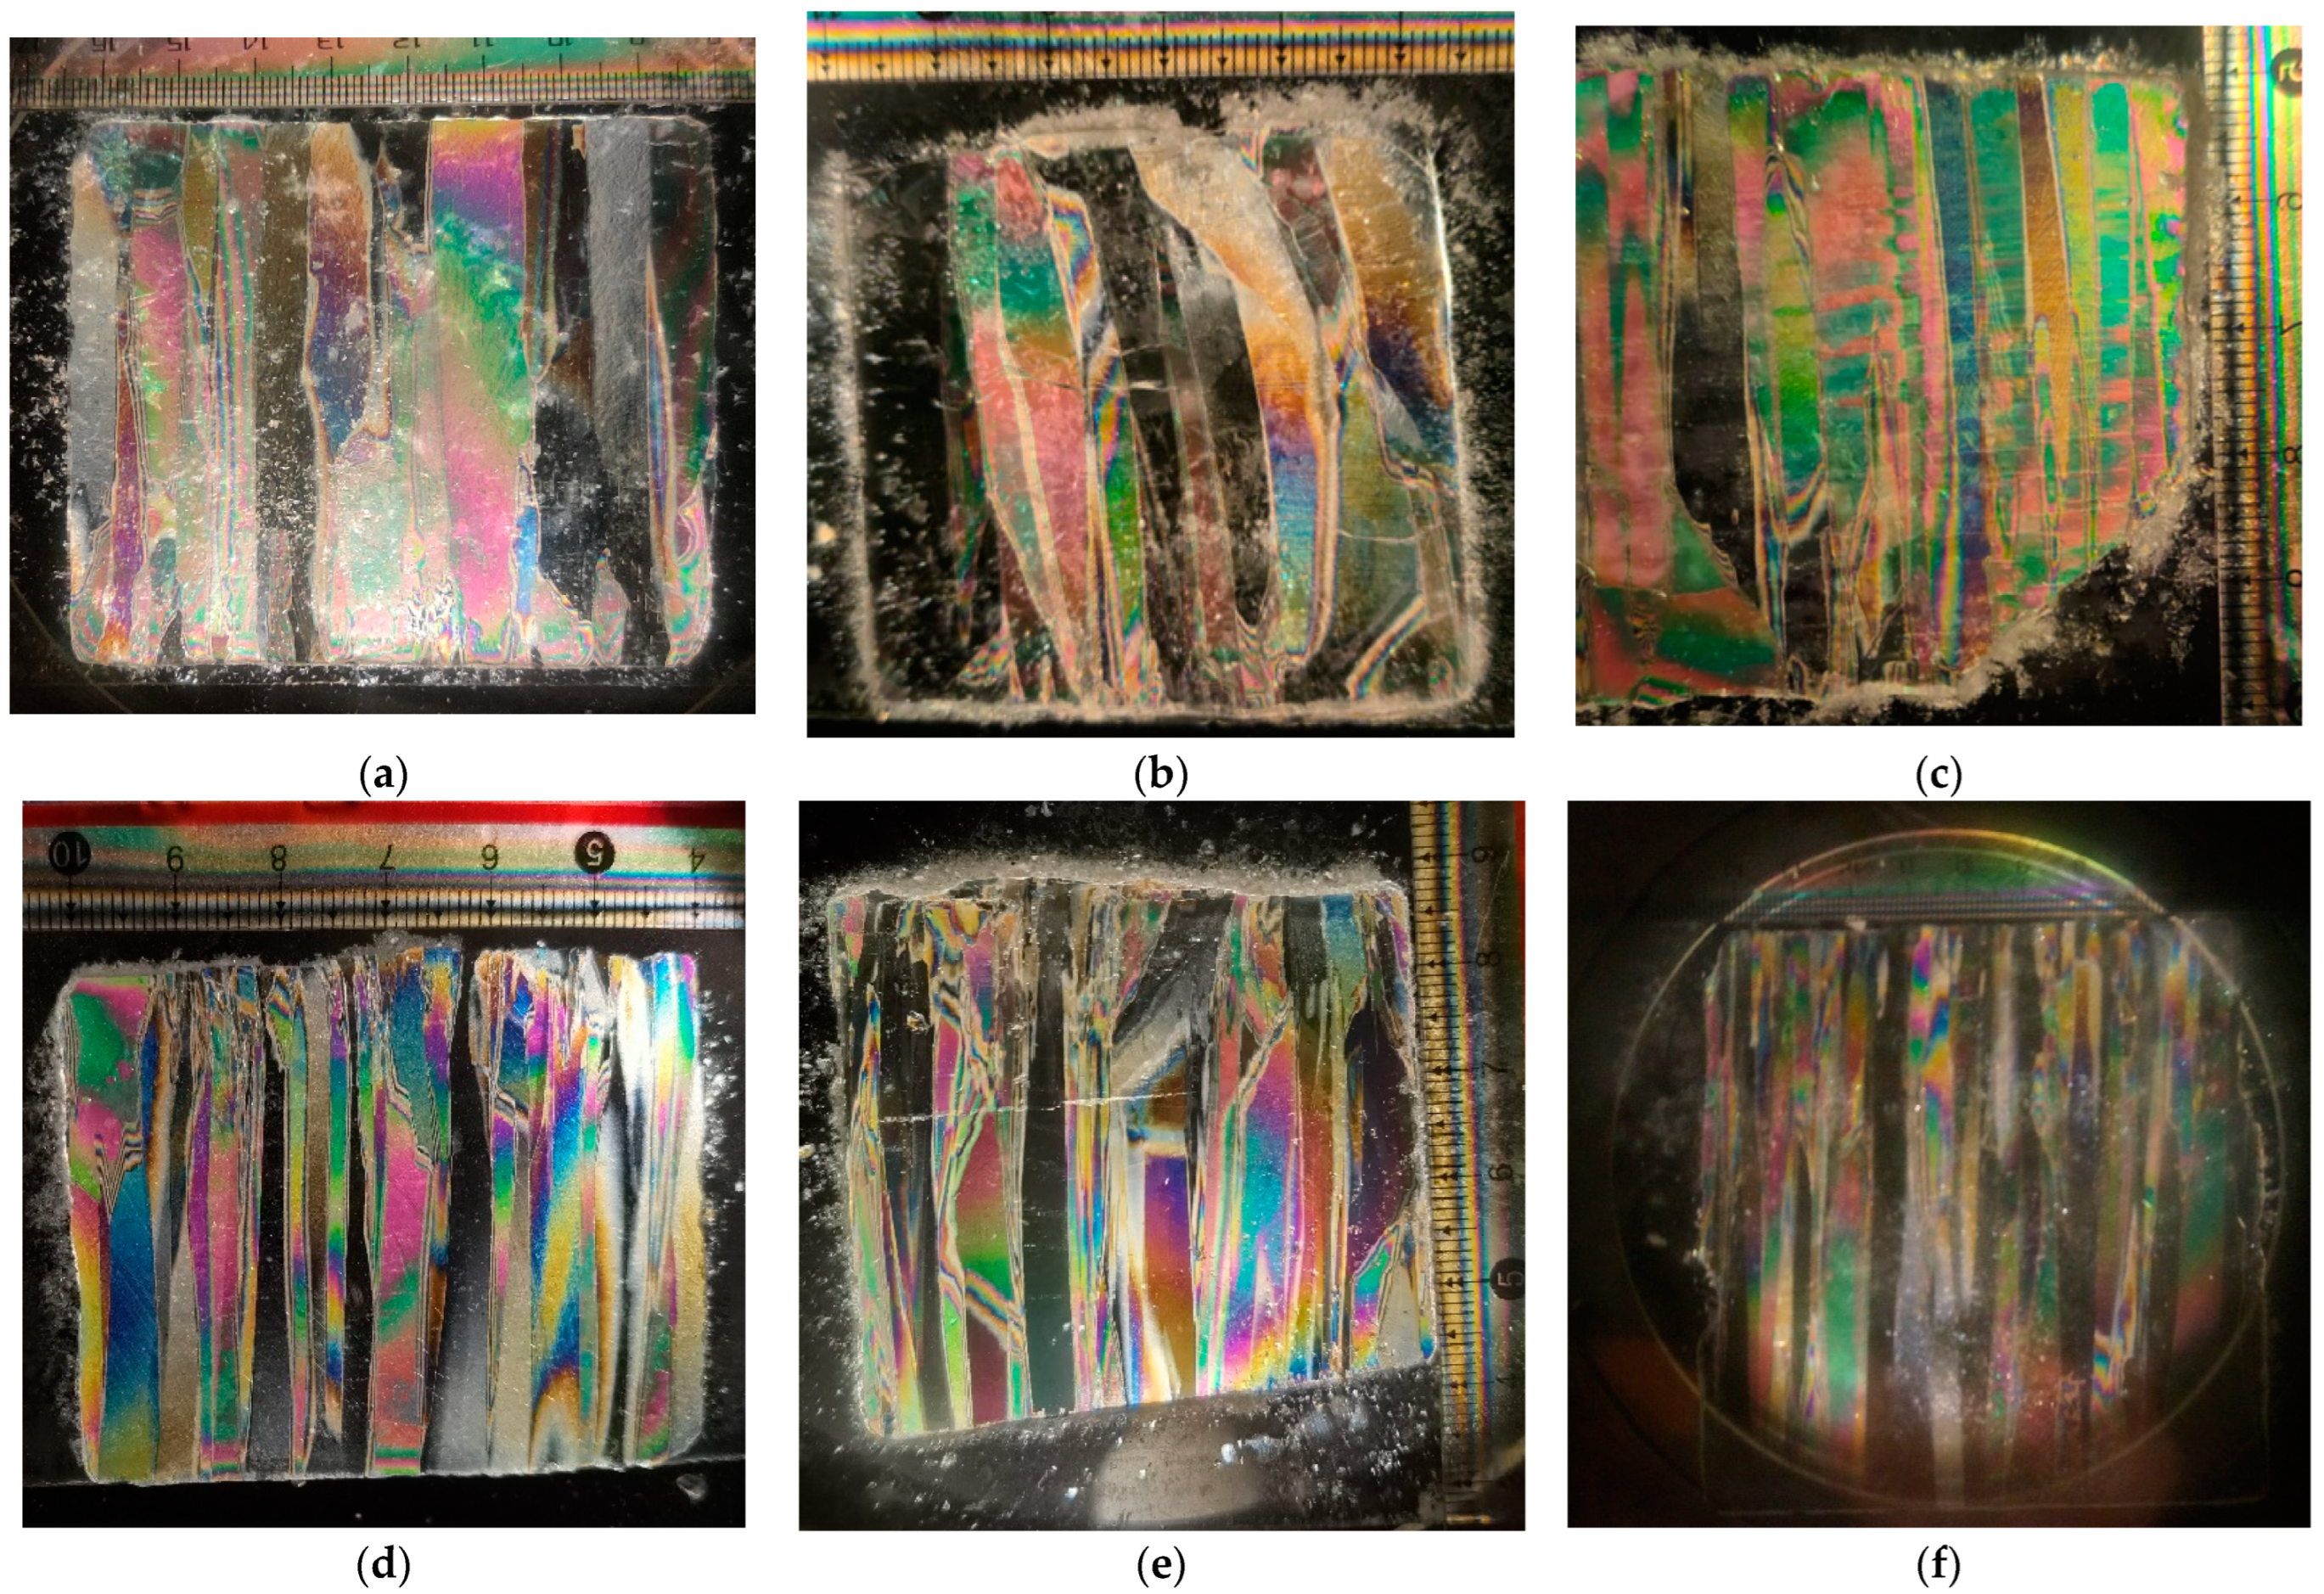
The temperature of the low-temperature laboratory was set to −30 °C, and ice samples were prepared at different wind speeds. As shown in Figure 14, the ice samples grown under various wind speed conditions all exhibited columnar ice structures.
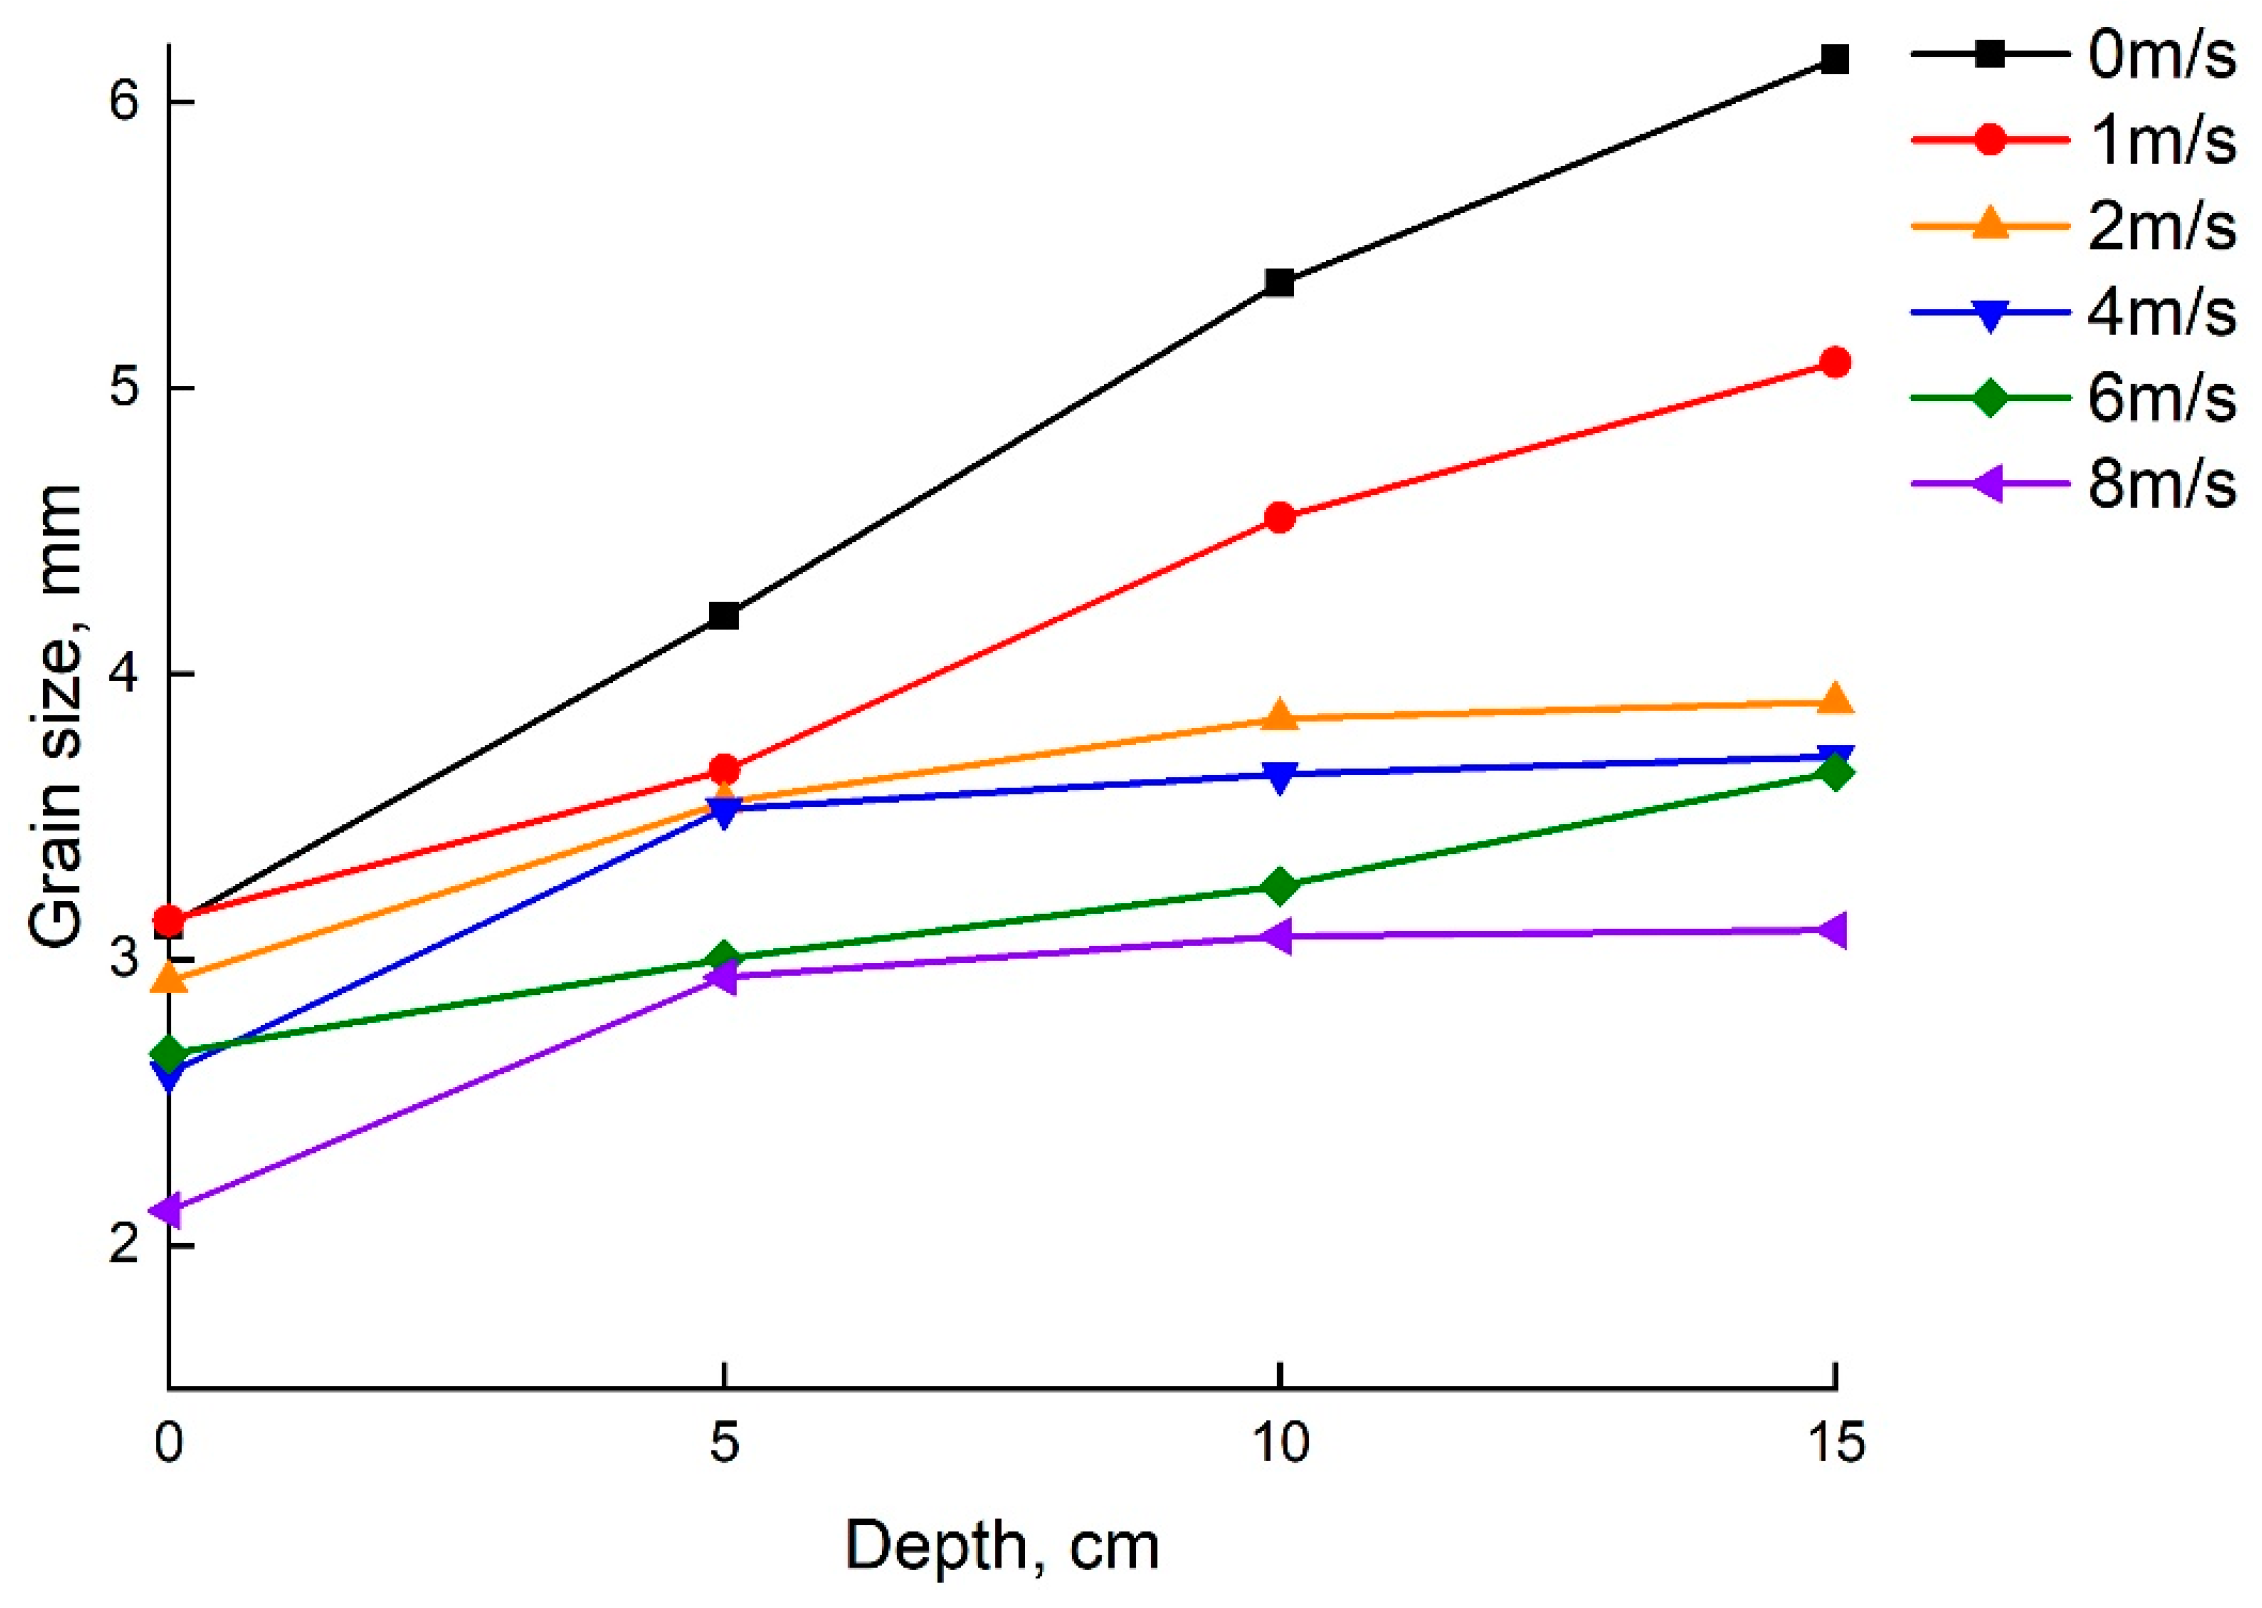
During the entire freezing process, ambient temperature remained almost constant, and wind speed only caused some disturbance to the water surface at the initial stage of freezing. Once the surface was frozen, the heat exchange between the stagnant ice and the underlying water and air diminished. This is reflected in the slower temperature fluctuations observed in Section 3.3. Consequently, the ice crystals had sufficient time and space to grow. Each crystal’s growth was constrained by surrounding crystals, resulting in downward growth only, ultimately leading to the formation of columnar ice structures. The data for grain size calculations are presented in Figure 15. It is evident that the grain size increases with depth and decreases with increasing wind speed. The reason for this trend is that slower crystallization rates result in larger grain sizes, while higher wind speeds accelerate the icing rate, leading to smaller grain sizes. As the ice thickness gradually increases, the thermal resistance between the water and the cold air also increases, causing the icing rate to slow down and the grain size to increase.
From the results of ice grain size, it typically ranges from millimeters and does not easily achieve micron-scale sizes like other materials primarily due to its formation mechanisms, thermodynamic properties, and growth environment. The growth of ice grains is closely related to the cooling rate; in slower cooling conditions, ice crystals have more time to grow, leading to the formation of larger grains. Consequently, both experimental and natural environments with slow cooling rates typically result in millimeter-scale ice grains. In contrast, the formation of micron-scale grains theoretically requires extremely rapid cooling rates, which are often not achievable in ice formation processes. Additionally, the low thermal conductivity of ice leads to a slower heat dissipation during freezing, further limiting the reduction in grain size. The hexagonal crystal structure of ice, along with its unique intermolecular hydrogen bonding, also contributes to the tendency for ice to form larger crystal clusters during growth, making it challenging to achieve micron-scale grains under natural or conventional experimental conditions.
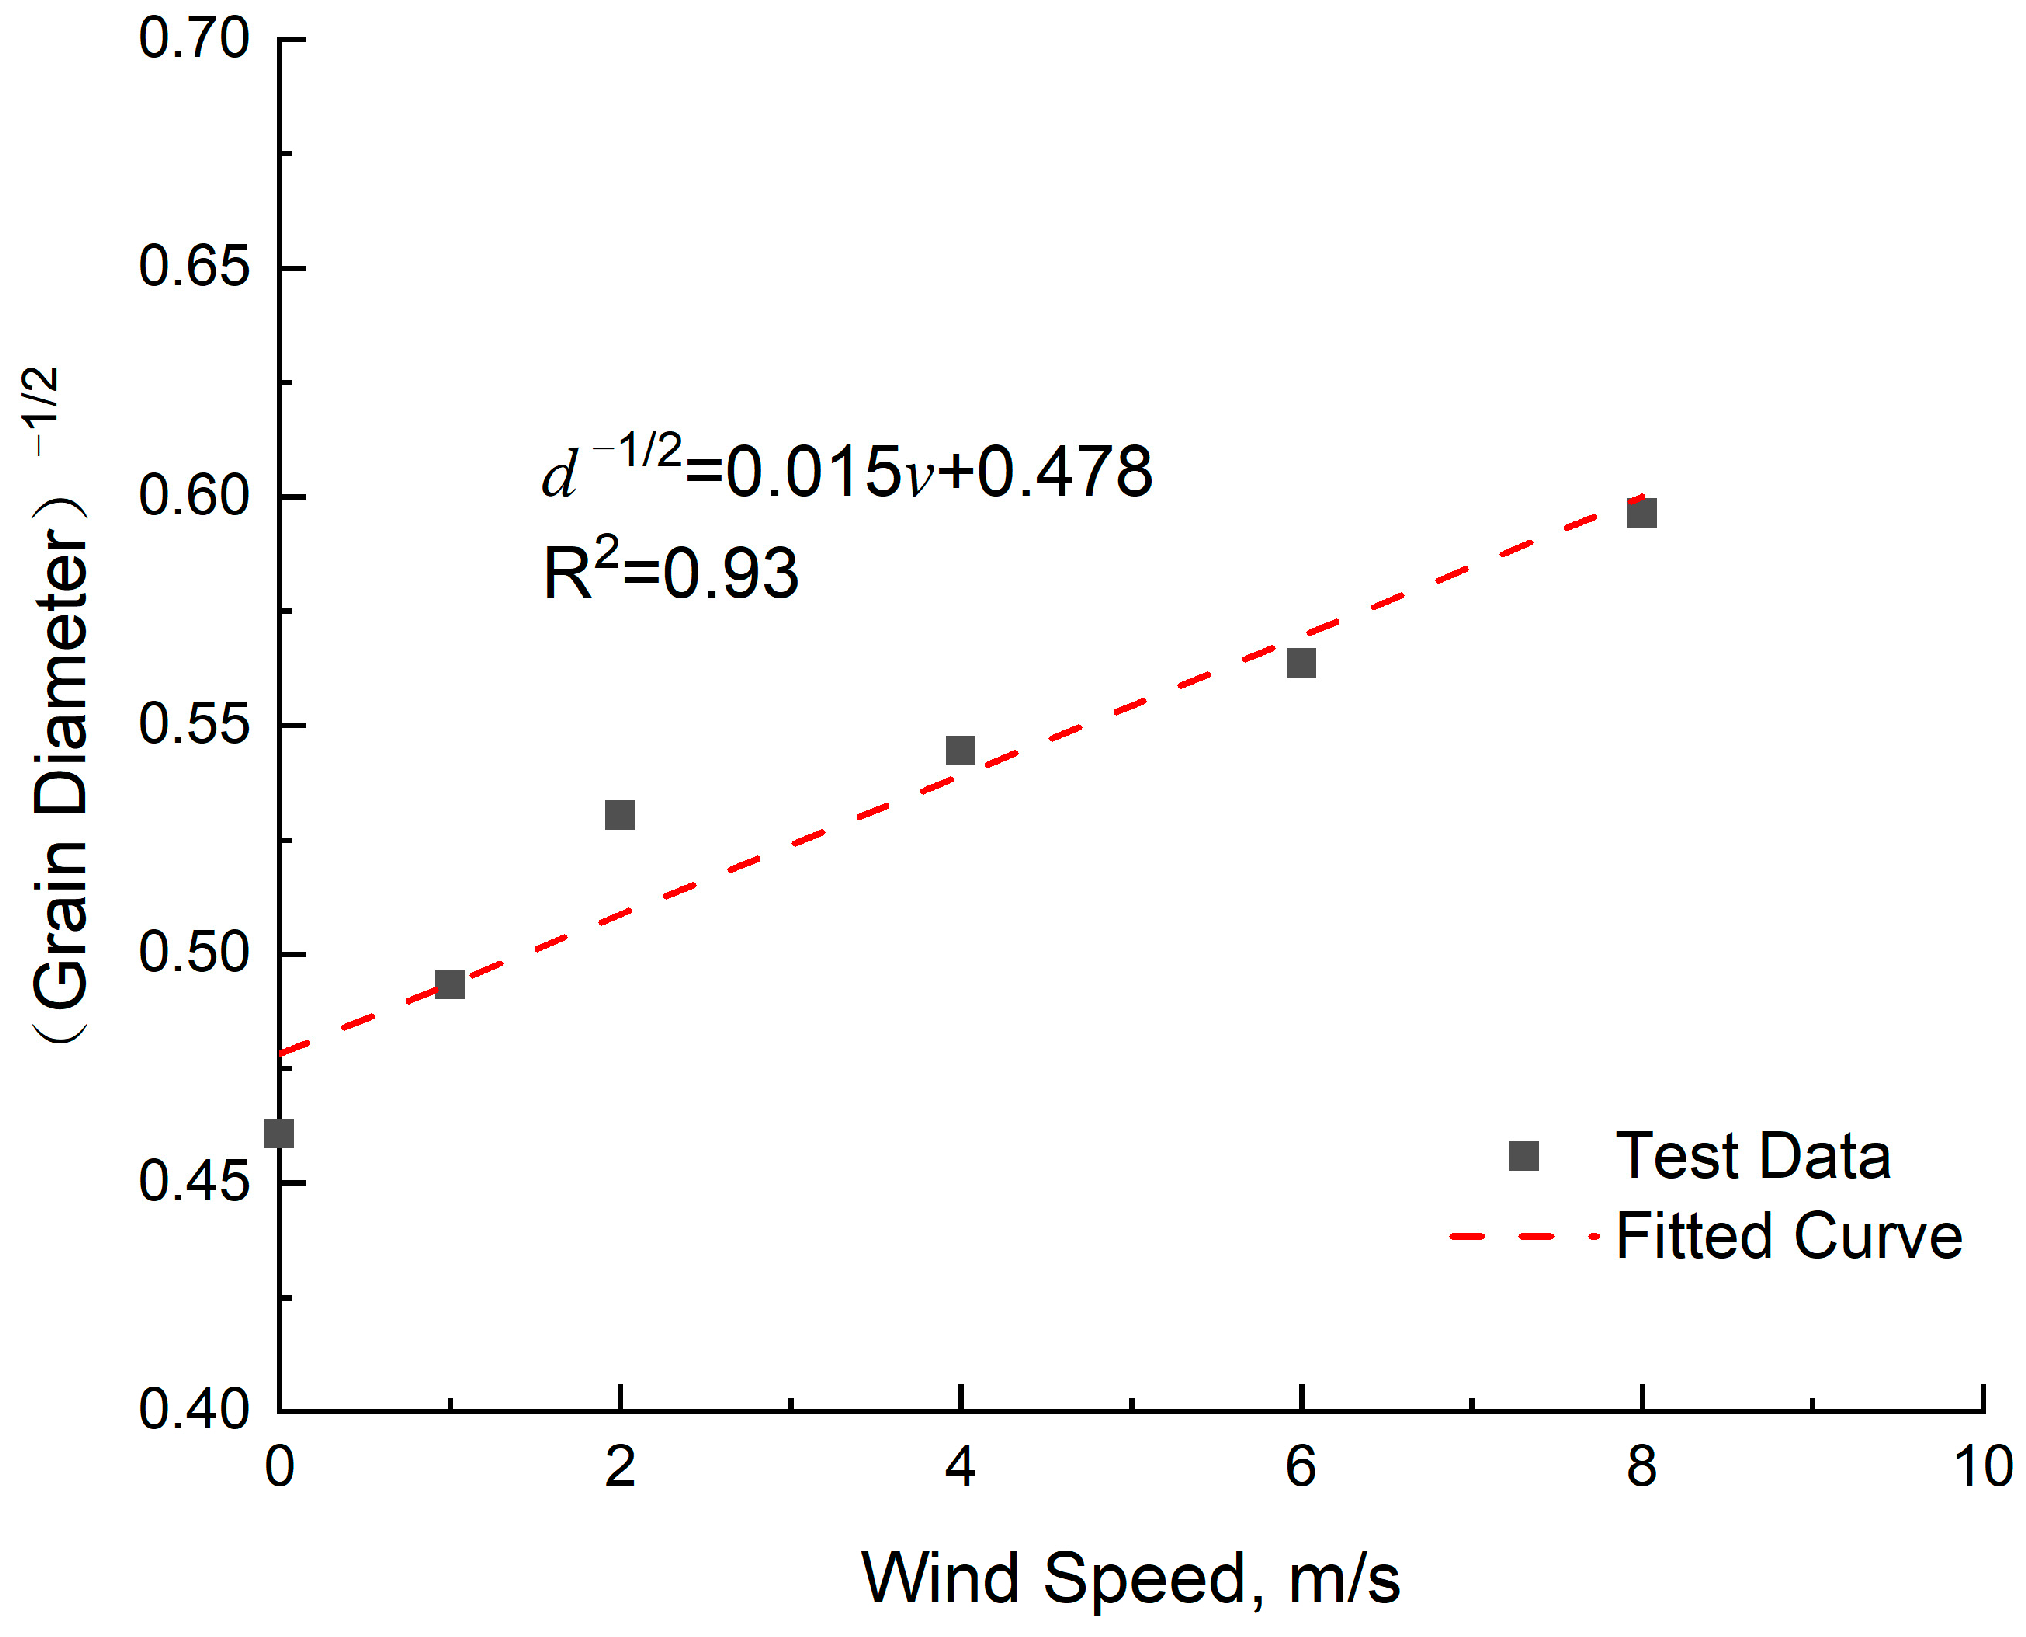
Previous studies have indicated that the strength of ice is linearly related to −1/2 power of grain size [44,45,46]. The analysis above reveals that wind speed is one of the factors influencing grain size. As summarized, there is a linear relationship between wind speed and −1/2 power of average grain size, as shown in Figure 16. This implies that, under constant temperature conditions, the desired grain size can be achieved by controlling the wind speed, thereby facilitating further research into the physical properties of ice. Future research could further investigate the combined effects of temperature and wind speed on grain size.

3.5. Application Discussion

This study integrates a low-temperature laboratory with a custom-made wind tunnel apparatus to develop a technique for producing columnar ice under laboratory conditions. This method allows for the simulation of the microstructure of ice formed under cold and windy conditions. In previous research [42], it was applied to study the uniaxial compressive strength of ice, investigating the strain rate sensitivity of columnar ice’s uniaxial compressive strength. The results elucidated the relationship between grain size and compressive strength, explaining the physical mechanism behind the higher ice strength observed in polar regions under low temperature and high wind speed conditions. This technique provides the means for comprehensive research into the mechanical properties of polar ice formed under windy conditions. It allows for better control of environmental variables during the freezing process, laying the foundation for studying the effects of various factors on the physical properties of columnar ice.
In future work, this ice production method can be used to provide test samples for mechanical property testing of columnar ice formed under windy polar conditions. Zhang [47] utilized confined single-sided shear tests and Brazilian disc splitting tests to study the shear and tensile strengths of freshwater and seawater, examining the impact of temperature on both strengths. The ice samples were formed by freezing water collected from different bodies of water in molds within the laboratory. Wang [48] collected sea ice samples from Prydz Bay and, after transporting them back to the laboratory, investigated the bending and compressive strengths of the sea ice using three-point bending tests and uniaxial compression tests, respectively, studying the effects of strain rate and porosity on strength. Ji [49], based on field observations, studied the impact of loading direction on the uniaxial compressive strength of sea ice. The columnar sea ice was subjected to uniaxial compression tests at different loading rates in both horizontal (parallel to the grain columns) and vertical (across the grain columns) directions, exploring the anisotropy of the compressive properties of columnar sea ice. The columnar ice production method developed in this study can also be applied to the aforementioned research to supply test samples. This method allows for more precise control of variables and can be completed under laboratory conditions, addressing the challenges and costs associated with field sample collection. This technique facilitates supplementary and comprehensive studies on ice properties and can be utilized in numerous experimental investigations.

4. Conclusions

This study designed a small open-circuit wind tunnel for laboratory use and proposed a method for the preparation of columnar ice. Using this method, columnar ice was produced, and the freezing process was observed under different environmental temperatures and wind speeds. Temperature changes and ice thickness variations during the freezing process were analyzed. The shape and grain size of the columnar ice were observed, and the relationship between grain size and wind speed was investigated. The application prospects of this method were discussed, leading to the following conclusions:
1. The contraction section of the wind tunnel was selected. Through qualitative and quantitative analyses, it was found that using two cubic arcs for the contraction section was more appropriate based on the flow field characteristics of models established with different curves. Wind speed verification tests were conducted on the processed wind tunnel, showing that the actual acceleration ratio of the wind tunnel contraction section was 6.7–6.8, providing a stable wind speed range of 1 m/s to 10 m/s.
2. The temperature chain was used for real-time monitoring of the temperature at different depths in the condensation tank during the freezing process. It was observed that the water temperature experienced two stages: a rapid overall decline before freezing and a slow decline after freezing began. The relationships between water cooling rate, icing rate, ambient temperature, and wind speed were analyzed. Lower ambient temperatures and higher wind speeds resulted in faster cooling and icing rates. These relationships were summarized through surface fitting.
3. The crystal structure of ice samples produced using this method was observed, revealing that all samples were columnar ice. The grain size of the ice crystals was calculated, showing that under the same temperature, higher wind speeds resulted in smaller grain sizes. It was concluded that −1/2 power of the grain size was positively linearly correlated with wind speed.
4. The feasibility of this method was discussed in conjunction with previous research on the mechanical properties of ice. This method can be used in the future to test various mechanical properties of columnar ice formed under windy polar conditions, providing supplementary and refined methods for ice property research.
These conclusions highlight the effectiveness and potential applications of the columnar ice production method developed in this study, offering a controlled laboratory technique to study the physical and mechanical properties of ice.

Author Contributions

Conceptualization, Y.Z. and Z.Q.; methodology, Y.Z.; software, Y.Z. and W.H.; validation, Y.Z. and W.H.; formal analysis, Y.Z.; investigation, Y.Z.; resources, Y.Z.; data curation, Y.Z.; writing—original draft preparation, Y.Z.; writing—review and editing, Y.Z. and W.H.; visualization, Y.Z.; supervision, Z.Q.; project administration, Z.Q. and Y.Z.; funding acquisition, Z.Q. All authors have read and agreed to the published version of the manuscript.

Funding

This research was funded by the National Natural Science Foundation of China, grant number 51676144.

Data Availability Statement

The original contributions presented in the study are included in the article, and further inquiries can be directed to the corresponding author.

Acknowledgments

The authors would like to thank the Wuhan University of Technology (WUT).

Conflicts of Interest

The authors declare no conflicts of interest.

References

  1. Cole, D.M. The microstructure of ice and its influence on mechanical properties. Eng. Fract. Mech. 2001, 68, 1797–1822. [Google Scholar] [CrossRef]
  2. Timco, G.W.; Weeks, W.F. A review of the engineering properties of sea ice. Cold Reg. Sci. Technol. 2010, 60, 107–129. [Google Scholar] [CrossRef]
  3. Moline, M.A.; Karnovsky, N.J.; Brown, Z.; Divoky, G.J.; Frazer, T.K.; Jacoby, C.A.; Torres, J.J.; Fraser, W.R. High latitude changes in ice dynamics and their impact on polar marine ecosystems. Ann. N. Y. Acad. Sci. 2008, 1134, 267–319. [Google Scholar] [CrossRef]
  4. Xu, H.; Yin, Z.; Jia, D.; Jin, F.; Ouyang, H. The potential seasonal alternative of Asia–Europe container service via Northern sea route under the Arctic sea ice retreat. Marit. Pol. Mgmt. 2011, 38, 541–560. [Google Scholar] [CrossRef]
  5. Goerlandt, F.; Goite, H.; Banda, O.A.V.; Höglund, A.; Rainio, P.A.; Lensu, M. An analysis of wintertime navigational accidents in the Northern Baltic Sea. Saf. Sci. 2017, 92, 66–84. [Google Scholar] [CrossRef]
  6. Lee, H.W.; Roh, M.; Kim, K.S. Ship route planning in Arctic ocean based on POLARIS. Ocean Eng. 2021, 234, 109297. [Google Scholar] [CrossRef]
  7. Shu, Y.; Zhu, Y.; Xu, F.; Gan, L.; Lee, P.T.; Yin, J.; Chen, J. Path planning for ships assisted by the icebreaker in ice-covered waters in the Northern Sea Route based on optimal control. Ocean Eng. 2023, 267, 113182. [Google Scholar] [CrossRef]
  8. Petrovic, J.J. Review mechanical properties of ice and snow. J. Mater. Sci. 2003, 38, 1–6. [Google Scholar] [CrossRef]
  9. Dempsey, J.P. Research trends in ice mechanics. Int. J. Solids Struct. 2000, 37, 131–153. [Google Scholar] [CrossRef]
  10. Timco, G.W.; Brien, S.O. Flexural strength equation for sea ice. Cold Reg. Sci. Technol. 1994, 22, 285–298. [Google Scholar] [CrossRef]
  11. Moslet, P.O. Field testing of uniaxial compression strength of columnar sea ice. Cold Reg. Sci. Technol. 2007, 48, 1–14. [Google Scholar] [CrossRef]
  12. Li, Z.; Zhang, L.; Lu, P.; Leppäranta, M.; Li, G. Experimental study on the effect of porosity on the uniaxial compressive strength of sea ice in Bohai Sea. Sci. China Technol. Sci. 2011, 54, 2429–2436. [Google Scholar] [CrossRef]
  13. Bonath, V.; Edeskär, T.; Lintzén, N.; Fransson, L.; Cwirzen, A. Properties of ice from first-year ridges in the Barents Sea and Fram Strait. Cold Reg. Sci. Technol. 2019, 168, 102890. [Google Scholar] [CrossRef]
  14. Menge, J.A.R.; Jones, K.F. The tensile strength of first-year sea ice. J. Glaciol. 1993, 39, 609–618. [Google Scholar] [CrossRef]
  15. Han, H.; Jia, Q.; Huang, W.; Li, Z. Flexural strength and effective modulus of large columnar-grained freshwater ice. J. Cold Reg. Eng. 2016, 30, 04015005. [Google Scholar] [CrossRef]
  16. Karulina, M.; Marchenko, A.; Karulin, E.; Sodhi, D.; Sakharov, A.; Chistyakov, P. Full-scale flexural strength of sea ice and freshwater ice in Spitsbergen Fjords and North-West Barents Sea. Appl. Ocean Res. 2019, 90, 101853. [Google Scholar] [CrossRef]
  17. Alekseeva, T.A.; Frolov, S.V.; Serovetnikov, S.S. Review of methods and main results of sea ice thickness measurements in the Arctic. Russ. Arctic. 2021, 1, 33–49. (In Russian) [Google Scholar] [CrossRef]
  18. Worby, A.P.; Griffin, P.W.; Lytle, V.I.; Massom, R.A. On the use of electromagnetic induction sounding to determine winter and spring sea ice thickness in the Antarctic. Cold Reg. Sci. Technol. 1999, 29, 49–58. [Google Scholar] [CrossRef]
  19. Uto, S.; Toyota, T.; Shimoda, H.; Takeyama, K.; Shirasawa, K. Ship-borne electromagnetic induction Sounding of Sea-ice thickness in the Southern Sea of Okhotsk. Ann. Glaciol. 2006, 44, 253–260. [Google Scholar] [CrossRef]
  20. McLaren, A.S. The under-ice thickness distribution of the Arctic Basin as recorded in 1958 and 1970. J. Geophys. Res.-Ocean. 1989, 94, 4971–4983. [Google Scholar] [CrossRef]
  21. Vinje, T.; Nordlund, N.; Kvambekk, Å. Monitoring ice thickness in Fram Strait. J. Geophys. Res.-Ocean. 1998, 103, 10437–10449. [Google Scholar] [CrossRef]
  22. Giles, K.A.; Laxon, S.W.; Ridout, A.L. Circumpolar thinning of Arctic sea ice following the 2007 record ice extent minimum. Geophys. Res. Lett. 2008, 35, L22502. [Google Scholar] [CrossRef]
  23. Griggs, J.A.; Bamber, J.L. Antarctic ice-shelf thickness from satellite radar altimetry. J. Glaciol. 2011, 57, 485–498. [Google Scholar] [CrossRef]
  24. Fu, H.; Liu, Z.; Guo, X.; Cui, H. Double-frequency ground penetrating radar for measurement of ice thickness and water depth in rivers and canals: Development, verification and application. Cold Reg. Sci. Technol. 2018, 154, 85–94. [Google Scholar] [CrossRef]
  25. Kwok, R.; Cunningham, G.F. ICESat over Arctic sea ice: Estimation of snow depth and ice thickness. J. Geophys. Res.-Ocean. 2008, 113, 179–185. [Google Scholar] [CrossRef]
  26. Cole, D.M. Preparation of polycrystalline ice specimens for laboratory experiments. Cold Reg. Sci. Technol. 1979, 1, 153–159. [Google Scholar] [CrossRef]
  27. Deng, K.; Feng, X.; Tian, X.; Hu, Y. Experimental research on compressive mechanical properties of ice under low strain rates. Mater. Today Commun. 2020, 24, 101029. [Google Scholar] [CrossRef]
  28. Zhang, Y.; Qian, Z.; Lv, S.; Huang, W.; Ren, J.; Fang, Z.; Chen, X. Experimental investigation of uniaxial compressive strength of distilled water ice at different growth temperatures. Water 2022, 14, 4079. [Google Scholar] [CrossRef]
  29. Ghobrial, T.R.; Loewen, M.R.; Hicks, F. Laboratory calibration of upward looking sonars for measuring suspended frazil ice concentration. Cold Reg. Sci. Technol. 2012, 70, 19–31. [Google Scholar] [CrossRef]
  30. Roscoe, H.K.; Brooks, B.; Jackson, A.V.; Smith, M.H.; Walker, S.J.; Obbard, R.W.; Wolff, E.W. Frost flowers in the laboratory: Growth, characteristics, aerosol, and the underlying sea ice. J. Geophys. Res. Atmos. 2011, 116, D12301. [Google Scholar] [CrossRef]
  31. Haas, C. Ice tank investigations of the microstructure of artificial sea ice grown under different boundary conditions during INTERICE II. In Proceedings of the HYDRALAB Workshop, Hannover, Germany, 19 February 1999. [Google Scholar]
  32. Weeks, W.F. Tensile strength of NaCl ice. J. Glaciol. 1962, 4, 25–52. [Google Scholar] [CrossRef]
  33. Cottier, F.; Eicken, H.; Wadhams, P. Linkages between salinity and brine channel distribution in young sea ice. J. Geophys. Res.-Ocean. 1999, 104, 15859–15871. [Google Scholar] [CrossRef]
  34. Loose, B.; McGillis, W.R.; Schlosser, P.; Perovich, D.; Takahashi, T. Effects of freezing, growth, and ice cover on gas transport processes in laboratory seawater experiments. Geophys. Res. Lett. 2009, 36, 1–5. [Google Scholar] [CrossRef]
  35. Perovich, D.K.; Grenfell, T.C. Laboratory studies of the optical properties of young sea ice. J. Glaciol. 1981, 27, 331–346. [Google Scholar] [CrossRef]
  36. Marks, A.A.; Lamare, M.L.; King, M.D. Optical properties of laboratory grown sea ice doped with light absorbing impurities (black carbon). Cryosphere 2017, 11, 2867–2881. [Google Scholar] [CrossRef]
  37. Liu, R.; Liu, Y.; Wang, Q.; Yi, X. Investigation of microstructure and density of atmospheric ice formed by high-wind-speed in-cloud icing. Crystals 2023, 13, 1015. [Google Scholar] [CrossRef]
  38. Bansmer, S.E.; Baumert, A.; Sattler, S.; Knop, I.; Leroy, D.; Schwarzenboeck, A.; Jurkat-Witschas, T.; Voigt, C.; Pervier, H.; Esposito, B. Design, construction and commissioning of the Braunschweig Icing Wind Tunnel. Atmos. Meas. Tech. 2018, 11, 3221–3249. [Google Scholar] [CrossRef]
  39. Blocken, B.; Stathopoulos, T.; Van Beeck, J.P.A.J. Pedestrian-level wind conditions around buildings: Review of wind-tunnel and CFD techniques and their accuracy for wind comfort assessment. Build. Environ. 2016, 100, 50–81. [Google Scholar] [CrossRef]
  40. Mehta, R.D.; Bradshaw, P. Design rules for small low speed wind tunnels. Aeronaut. J. 1979, 83, 443–453. [Google Scholar] [CrossRef]
  41. Zanoun, E.S. Flow characteristics in low-speed wind tunnel contractions: Simulation and testing. Alex. Eng. J. 2018, 57, 2265–2277. [Google Scholar] [CrossRef]
  42. Zhang, Y.; Qian, Z.; Huang, W.; Chen, X.; Zhang, Z.; Ren, J. Effect of grain size on the uniaxial compressive strength of ice forming with different wind speeds in a cold laboratory. Water 2024, 16, 2049. [Google Scholar] [CrossRef]
  43. Morel, T. Design of Two-Dimensional Wind Tunnel Contractions. J. Fluids Eng. 1977, 99, 371–377. [Google Scholar] [CrossRef]
  44. Schulson, E.M. The brittle compressive fracture of ice. Acta Metall. Mater. 1990, 38, 1963–1976. [Google Scholar] [CrossRef]
  45. Cole, D.M. Strain-rate and Grain-size Effects in Ice. J. Glaciol. 1987, 33, 274–280. [Google Scholar] [CrossRef]
  46. Nixon, W.A. Wing crack models of the brittle compressive failure of ice. Cold Reg. Sci. Technol. 1996, 24, 41–55. [Google Scholar] [CrossRef]
  47. Zhang, Y.; Zhang, Y.; Guo, R.; Cui, B. Method for testing shear and tensile strengths of freshwater/seawater ice. Water 2022, 14, 1363. [Google Scholar] [CrossRef]
  48. Wang, Q.; Li, Z.; Lu, P.; Xu, Y.; Li, Z. Flexural and compressive strength of the landfast sea ice in the Prydz Bay, East Antarctic. Cryosphere 2022, 16, 1941–1961. [Google Scholar] [CrossRef]
  49. Ji, S.; Chen, X.; Wang, A. Influence of the loading direction on the uniaxial compressive strength of sea ice based on field measurements. Ann. Glaciol. 2020, 61, 86–96. [Google Scholar] [CrossRef]
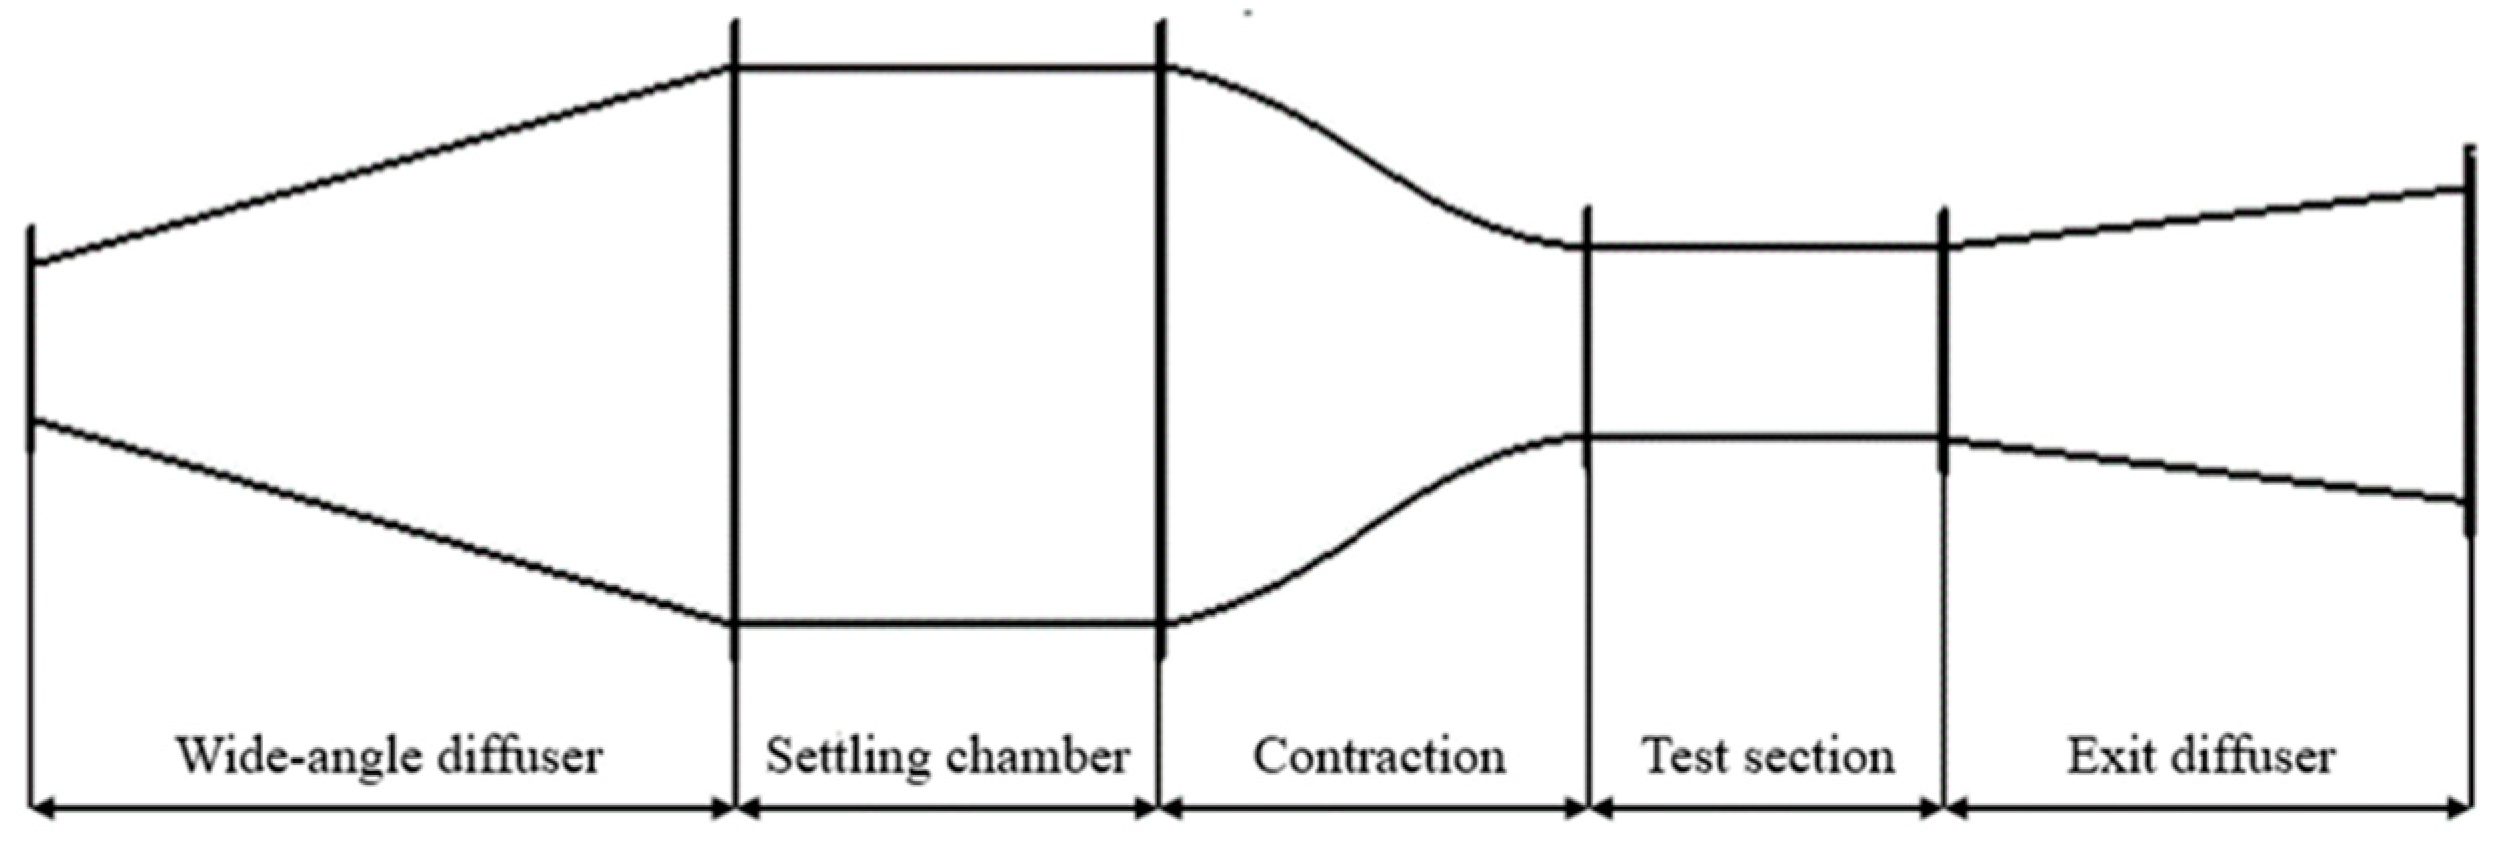
Figure 1. Structure of a typical open-circuit low-speed wind tunnel.
Water 16 02558 g001
Figure 2. Flow rectification device.
Water 16 02558 g002
Figure 3. Open-circuit low-speed wind tunnel for this study.
Water 16 02558 g003
Figure 4. Ice formation tank and test section.
Water 16 02558 g004
Figure 5. Temperature and wind speed measurement device. (a) Temperature chain and paperless recorder. (b) Hot-wire anemometer.
Water 16 02558 g005
Figure 6. The finite element models of the contraction sections and the test section with different contraction curve profiles. (a) The contraction section constructed using two cubic arcs. (b) The contraction section constructed using the Witosznski curve.
Water 16 02558 g006
Figure 7. When the inlet wind speed is 10 m/s, the distribution of sectional static pressure and overall static pressure within the contraction and test section of the wind tunnel varies between the two types of contraction sections. (a,c) Contour maps of the two-cubic arcs model. (b,d) Contour maps of the Witosznski curve model.
Water 16 02558 g007
Figure 8. Contour maps and streamlines of the velocity distribution of two models when the inlet wind speed is 10 m/s. (a,c) Contour map and streamline of the two-cubic arcs model. (b,d) Contour map and streamline of the Witosznski curve model.
Water 16 02558 g008aWater 16 02558 g008b
Figure 9. Wind speed at the midpoint of the test section at different output voltages.
Water 16 02558 g009
Figure 10. Temperature variation curves in the condensation tank at an ambient temperature of −10 °C at different wind speeds. The wind speeds for (ac) are 1 m/s, 4 m/s, and 8 m/s, respectively.
Water 16 02558 g010
Figure 11. Temperature variation curves in the condensation tank at a wind speed of 8 m/s at different ambient temperatures. The temperatures for (ac) are −10 °C, −20 °C, and −30 °C, respectively.
Water 16 02558 g011
Figure 12. The results of ice shapes after the formation test at −10 °C. The wind speeds for (ac) are 1 m/s, 4 m/s, and 8 m/s, respectively.
Water 16 02558 g012
Figure 13. Surface fitting results for the relationships between cooling rate (a), icing rate (b), temperature, and wind speed.
Water 16 02558 g013
Figure 14. Ice crystal morphologies at varying wind speeds. Wind speeds of (af) are 0 m/s, 1 m/s, 2 m/s, 4 m/s, 6 m/s, and 8 m/s.
Water 16 02558 g014
Figure 15. Grain size vs. depth curves of distilled water ice grown at different wind speeds.
Water 16 02558 g015
Figure 16. Grain size versus wind speed and fitted curve.
Water 16 02558 g016
Table 1. Maximum dynamic pressure coefficient in the middle of the test section of two wind tunnel models under different wind speeds.
Wind Speed (m/s)0.11310
Two cubic arcs0.0710.0250.0220.019
Witosznski curve0.0610.0460.0360.032
Table 2. Maximum velocity non-uniformity in the middle of the test section of two wind tunnel models under different wind speeds.
Wind Speed (m/s)0.11310
Two cubic arcs0.0350.0120.0110.009
Witosznski curve0.0300.0230.0180.016
Table 3. Output voltages and results of wind speed measurements.
Output
Voltages (V)
Average Wind Speed at the Midpoint of the Test Section (m/s)Average Wind Speed at the Contraction Section Entrance (m/s)Speed
Ratio
901.080.166.75
1051.970.296.79
1203.040.456.76
1304.120.616.75
1506.230.926.77
1808.131.216.72
22010.561.576.73
Table 4. Calculation results of cooling rate at different wind speeds and temperatures (unit: °C/h).
Wind Speed/Temperature−10 °C−15 °C−20 °C−25 °C−30 °C
1 m/s3.153.563.814.374.71
2 m/s3.945.136.067.728.05
4 m/s5.567.207.918.989.35
6 m/s6.978.209.7310.2311.40
8 m/s9.1313.0914.7116.8819.63
Table 5. Calculation results of icing rate at different wind speeds and temperatures (unit: mm/h).
Wind Speed/Temperature−10 °C−15 °C−20 °C−25 °C−30 °C
1 m/s3.314.194.545.395.54
2 m/s3.885.415.495.576.36
4 m/s4.676.006.016.807.53
6 m/s4.926.296.637.087.99
8 m/s5.096.577.037.578.26
Disclaimer/Publisher’s Note: The statements, opinions and data contained in all publications are solely those of the individual author(s) and contributor(s) and not of MDPI and/or the editor(s). MDPI and/or the editor(s) disclaim responsibility for any injury to people or property resulting from any ideas, methods, instructions or products referred to in the content.