Article

Spatial Distribution and Health Risk Assessment of Saline Water Intrusion and Potentially Hazardous Pollutants in a Coastal Groundwater Environment

1
Shandong Provincial No.4 Institute of Geological and Mineral Survey, Weifang 261021, China
2
Key Laboratory of Coastal Zone Geological Environment Protection, Shandong Geology and Mineral Exploration and Development Bureau, Weifang 261021, China
3
Institute of Marine Science and Technology, Shandong University, Qingdao 266237, China
*
Author to whom correspondence should be addressed.
These authors contributed equally to this work.
Water 2024, 16(18), 2573; https://doi.org/10.3390/w16182573
Submission received: 24 July 2024 / Revised: 4 September 2024 / Accepted: 7 September 2024 / Published: 11 September 2024
(This article belongs to the Special Issue Advances in Coastal Hydrological and Geological Processes)

Abstract

:
In coastal plains, saline water intrusion (SWI) and potentially hazardous pollutants are harmful to local human health. The southern Laizhou Bay has become a typical representative of the northern silty coast due to its extensive silt sedimentation and the significant impact of human activities. This research focuses on a portion of the southern Laizhou Bay, using GIS-based spatial analysis, water quality index methods and health risk assessments to evaluate the impact of saltwater intrusion and potential hazardous pollutants. The results show that the groundwater in the study area is significantly impacted by saline water intrusion, leading to major ion concentrations that far exceed World Health Organization (WHO) standards. The groundwater chemical types of brine and brackish water in the study area are mainly Cl-Na, and the main chemical types of fresh water are HCO3-Ca·Na. The average concentration sequence of the main ions in groundwater is K+ > HCO3 > Cl > Na+ > SO42− > Ca2+ > Mg2+. The average hazard quotient (HQ) sequence in typical pollutants is Cl > F > NO3-N > Se > Mn > NO2-N > Cu > Pb > Zn > Fe, and the carcinogenic risk (CR) sequence caused by carcinogenic heavy metals is Cd > As > Cr. The noncarcinogenic health risk area is mainly distributed in the northwest of the study area, while the potential carcinogenic risk area is in the central region. The Cl is the greatest noncarcinogenic risk to adults and children. The mean HQ values for adults and children were 95.69 and 146.98, indicating a significant noncarcinogenic risk. The mean CR values for adults and children were 0.00037 and 0.00057, suggesting a relatively low carcinogenic risk. SWI is the main influencing factor on human health; therefore, it is necessary to prevent and control SWI. Moreover, potentially hazardous pollutants are carcinogenic and noncarcinogenic risks and are caused by agriculture, industry and other human activities. The findings of this research offer scientific insights for groundwater pollution control and saline water intrusion management in similar coastal areas.

1. Introduction

Water resources, especially groundwater, are an indispensable natural resource for human survival and development and an important part of ecological and environmental systems in coastal plains [1,2,3]. Worldwide, nearly 44% of the global population live in coastal areas [4]. Due to agriculture, industry, economic development and population growth, the consumption of groundwater resources has accelerated. Furthermore, potentially hazardous groundwater pollutants have been a common environmental problem worldwide, such as dissolved metal pollution, fluorine, nitrate, organic pollutants and groundwater salinization [5,6,7,8,9].
The cleanliness and safety of coastal groundwater are directly related to human health [10,11]. In recent years, research has been conducted on the origin, evolution, and formation processes and factors influencing groundwater characteristics, as well as on groundwater quality assessment and human health risk evaluation [12,13,14]. In coastal plains, seawater (or saline water) intrusion is a common groundwater environmental problem that can lead to groundwater salinization and the deterioration of groundwater quality [15]. Meanwhile, potentially hazardous groundwater pollutants, which have certain levels of carcinogenicity, are also the main groundwater environmental problem [4]. Arsenic has been widely recognized as one of the most toxic chemicals, and over 200 million people worldwide still drink arsenic-contaminated water [16]. Heavy metals can damage the human nervous, digestive and endocrine systems and may induce cancer and cause cytoplasmic poisoning [4,17,18,19,20]. High-concentration nitrate (NO3-N) can lead to methemoglobinemia or blue baby syndrome [21,22]. A high-concentration of fluoride (F) in groundwater is the most widespread cause of fluorosis worldwide, such as in areas of the United States, India, Pakistan, South Africa, South Korea and China [23,24,25,26,27,28,29]. Thus, human health risk assessments of saline water intrusion and potentially hazardous groundwater pollutants in coastal areas are important.
The southern Laizhou Bay serves as a representative of northern China’s silty coasts, characterized by extensive silt deposits, rich ecological diversity, significant human activity and a sensitive response to climate change. This area exemplifies the unique features of silty coastal environments in northern regions, which is an important salt production base in China. Groundwater with different water quality types is distributed widely in this area, such fresh water (TDS < 1 g/L), brackish water (1 g/L ≤ TDS < 3 g/L), saline water (3 g/L ≤ TDS < 50 g/L) and brine (TDS ≥ 50 g/L). The main hydrochemical types of fresh water are Cl·HCO3·SO4-Ca·Na, Cl-Ca·Na, HCO3-Ca·Na and HCO3·SO4·Cl-Na. The hydrochemical types of brackish water, saline water and brine are Cl-Na·Ca, Cl-Na·Mg, Cl·SO4-Na and Cl-Na. Because of the overexploitation of underground fresh water and the widespread distribution of underground saline water, saline water intrusion has occurred [15]. Influenced by saline water intrusion, the concentrations of TDS, Natrium (Na+), Chlorine (Cl), Calcium (Ca2+) and Magnesium (Mg2+) increase and groundwater becomes salinized, which can lead to the deterioration of groundwater quality. Moreover, other human activities, such as irrigation and sewage discharge, can also affect groundwater quality. The direct impacts are that groundwater quality is becoming unsuitable for local resident to drink, having a negative impact on human health. Previous studies have found that saline water intrusion, high-F groundwater and dissolved metals are the main groundwater environmental problems [15,30]. However, research on saline water intrusion and dissolved metals in the groundwater of this region remains relatively limited, with no research available on the human health risk associated with groundwater.
In this paper, we choose part of southern Laizhou Bay as the study area. Saline water intrusion and potentially hazardous pollutants are considered. The objectives of this study were to (1) further investigate and analyze the spatial distribution characteristics of hydrochemical data and the main pollutants in the groundwater environment; (2) evaluate the human health risk of saline water intrusion and potentially hazardous pollutants; and (3) analyze the main influencing factors on the human health risk of groundwater. The research results can provide a scientific reference for groundwater resource management and ensuring drinking water safety in coastal plains.

2. Materials and Methods

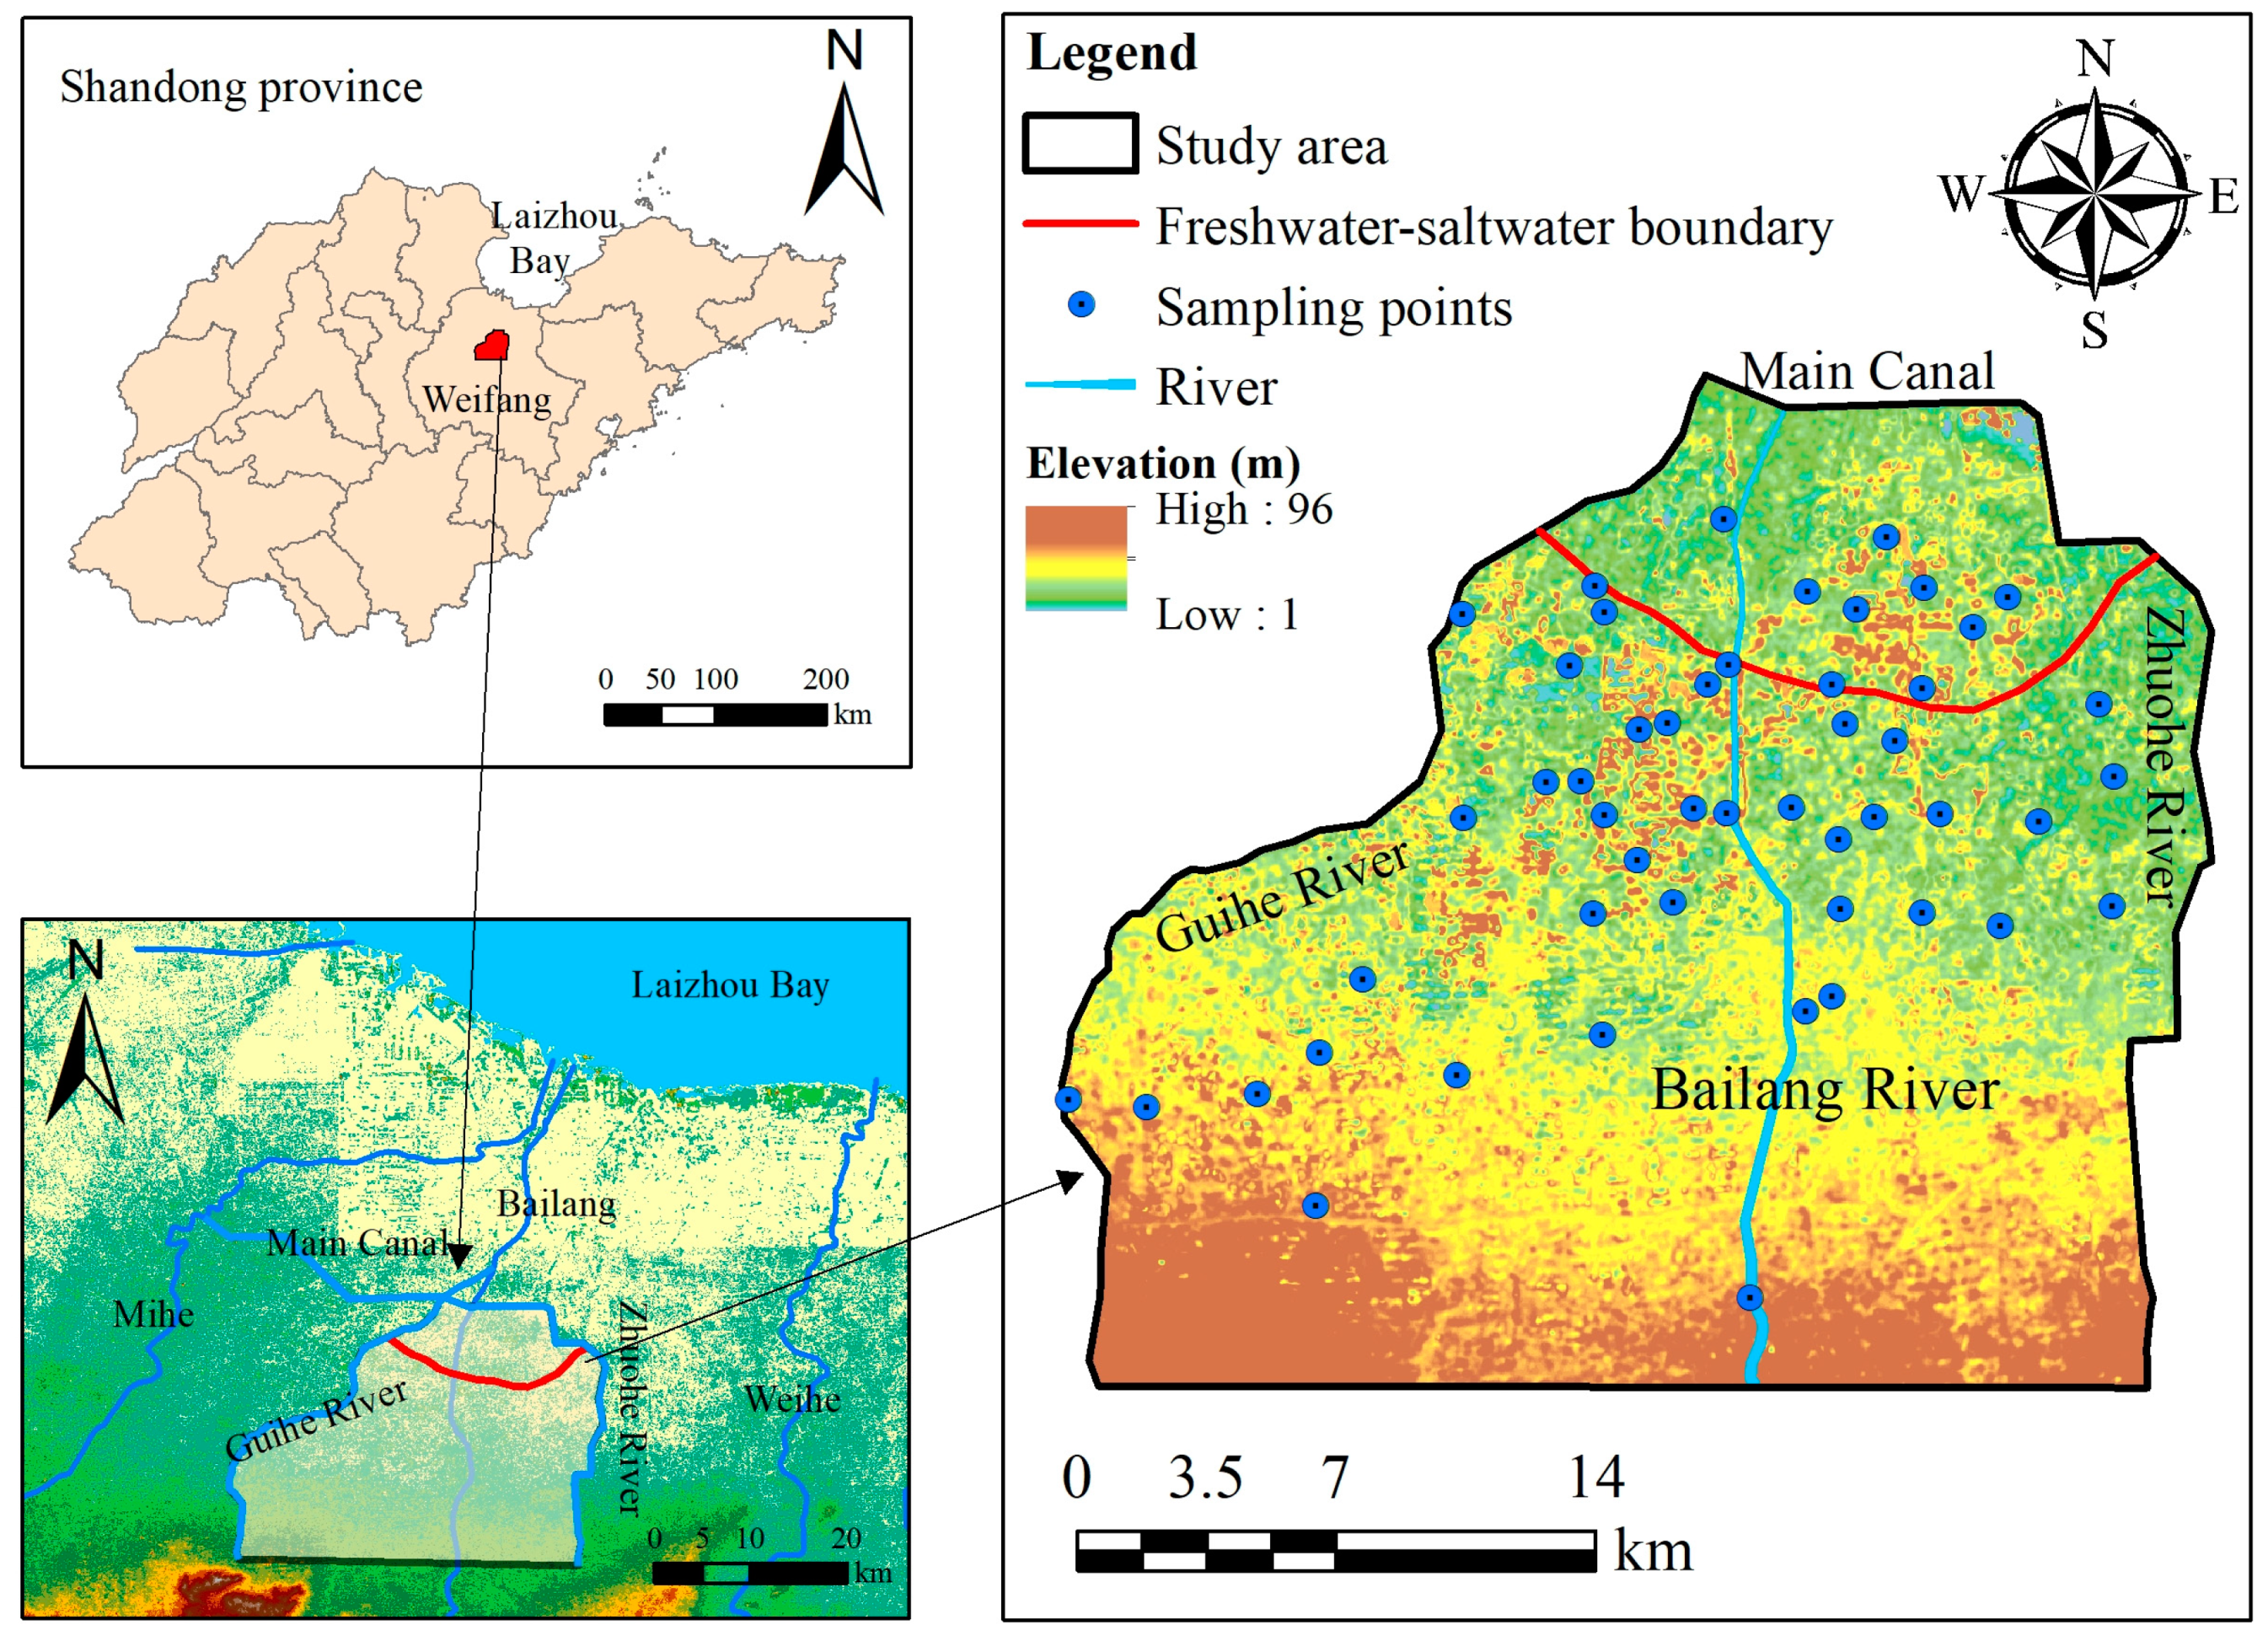
2.1. Location and Climatic Conditions of the Study Area

The study area is located in southern Laizhou Bay and the northern Weibei Plain, Shandong Province, China, with an area of 627.48 km2 (Figure 1). The study area is characterized by a thick Quaternary sediment layer at the surface. Due to alluvial and coastal deposition processes in the region, the aquifers mainly consist of loose sediments, primarily composed of Quaternary pore aquifers. The lithology of these aquifers mainly includes silt, fine sand, and medium-fine sand. The groundwater depth typically ranges between 5 and 10 m, with the general flow direction being from south to north. The groundwater flows generally from south to north. The broad alluvial plain has been shaped by several rivers, such as the Bailang River, Wei River and Mi River. The main types of land use are cultivated land and artificial surfaces. The average annual precipitation is approximately 660 mm, and 60–70% of the rainfall occurs between June and August. The mean annual evaporation is 1648 mm, with 50% of the total evaporation capacity occurring from April to June [31]. The boundaries of the study area were chosen based on the natural geological conditions. The study area is bounded by the main canal for water diversion from Yellow River to Qingdao city in the north, Yuhe River in the west, Zhuohe River in the east, and the source of the river in the south. The study area is a mixed saltwater–freshwater area.

2.2. Sampling and Analysis

A total of 47 groundwater samples, mainly from civilian wells, groundwater monitoring wells and irrigation wells, were collected from May to June 2021 (Figure 1). Groundwater samples were evenly distributed in the study area. Before sampling, the sampling wells were fully cleaned with a centrifugal pump, and the amount of water pumped was 3 times the volume of the wellbore water. The samples were collected in polyethylene bottles (1200 mL) and thoroughly washed three times with well water at the sampling point. All groundwater samples were stored in a low-temperature environment and sent to the laboratory for testing and analysis for the first time.
In this study, water quality parameters were analyzed in the laboratory, including Na+, K+, Ca2+, Mg2+, Fe, Cl, SO42−, HCO3, CO32−, F, NO2-N, NO3-N, TDS, Cu, Zn, Mn, Cr6+, Pb, Cd, As, Se, Hg and pH. The pH, temperature and conductivity were measured on field using a portable water analyzer (HACH, Hydrolab HL7). The mass concentration of cations in water samples was determined using an inductively coupled plasma optical emission spectrometer (Thermo Scientific, iCAP 7400, Waltham, MA, USA). An ion chromatograph (Thermo Dionex, ICS-600) was used to determine the mass concentration of anions. An inductively coupled plasma mass spectrometer (Thermo Scientific, iCAPRQ ICP-MS) was used to determine the concentration of metal elements in the water samples. The standard deviation of the measurements was less than 5%. The number of samples averaged for each analysis was 3. The error in charge balance between anions and cations was less than 5%.

2.3. Groundwater Quality Index (WQI)

The WQI, the most widely reliable comprehensive analysis for evaluating drinking water quality, is used to evaluate the groundwater quality [32,33,34,35]. The determined WQI values were then classified into five categories: excellent (WQI ≤ 50); good (50 < WQI ≤ 100); poor (100 < WQI ≤ 200); very poor (200 < WQI≤ 300); and unsuitable for drinking water (WQI > 300) [36,37].
Wi = wiwi
qi = (Ci/Si) × 100
SIi = Wi × qi
WQI = ΣSIi
where Wi represents the relative weight, wi represents the weight that is often allocated to each parameter, ∑wi represents the sum of the weights of all parameters, qi is the quality level of the ith parameter concentration, Ci represents the detected concentration for each parameter in each sample, Si represents the WHO maximum allowable limits for each parameter and SIi represents the water quality subindex of the ith parameter.

2.4. Health Risk Assessment

Health risk assessment is very important for understanding the potential health risks of chemical pollutants to human beings and is an important basis for local governments to formulate policies or regulations to protect the health of residents [38]. Health risk assessments include carcinogen risk assessment and noncarcinogen risk assessment. According to the International Agency for Research on Cancer and Integrated Risk Information System (databases), typical pollutants are classified as noncarcinogenic substances and carcinogenic substances [39]. According to the classification of chemical substances by the International Agency for Research on Cancer (IARC), pollutants with concentrations far below the WHO standard values are removed when conducting health risk assessments. Mn, Fe, Pb, Cu, Zn, F, NO3-N, Cl, NO2-N and Se are classified as noncarcinogenic pollutants and Cr, As and Cd are classified as carcinogenic pollutants in this study area. Based on the water quality health risk assessment model proposed by the United States Environmental Protection Agency (USEPA), the possible health effects of typical pollutants in inland water on adults and children are evaluated by combining the noncancer hazard quotient index (HQi) values and carcinogenic risk index (CRi) values [40]. This method was used to quantitatively describe whether several groundwater chemical pollutants were present. The calculation formulas for the HQi and CRi of typical pollutants are as follows [21,27,41]:
C D D i = M C i × I R × E F × E D B W × A T
H Q i = C D D i R f D i
C R i = C D D i × S F i
H Q = i = 1 n H Q i
C R = i = 1 n C R i
where CDDi is the exposure dose through drinking water, mg/(kg·d); MCi is the average mass concentration of pollutants in water, mg/L; IR is the intake rate, L/d; EF is the exposure frequency, d/a; ED is the duration of exposure, a; BW is human body mass, kg; AT is the average time of exposure, d; RfDi is the reference dose of chemical pollutants in the drinking water exposure route, mg/(kg·d); and SFi is the cancer slope factor, mg/(kg·d).
The parameter values of each variable used in the calculation are based on the data of the risk assessment information system established by the Oak Ridge National Laboratory of the U.S. Department of Energy and the actual situation of the study area, as shown in Table 1 and Table 2. The exposure dose was obtained udsing Formula (5), and Formulas (6) and (7) were used for pollutant risk assessment. The total health risks of the sampling points were evaluated using Equations (8) and (9).
The health risk level of the HQ was divided into four levels: (1) HQ ≤ 1, no risk; (2) 1 < HQ ≤ 5, low risk; (3) 5 < HQ ≤ 10, medium risk; and (4) HQ > 10, high risk. According to the USEPA, a CR value greater than 0.0001 indicates a risk level where there is a concern for potential cancer development.

2.5. Spatial Interpolation

Geostatistical applications were coupled to geographic information systems to delineate different water quality types and potential health risk areas. The spatial interpolation analysis algorithm transforms the measured data of discrete points into continuous data surfaces and is widely used in the statistical analysis of the geospatial patterns of soil, groundwater and surface water [42,43]. Geostatistics is a branch of applied statistics that focuses on detecting, modeling and estimating spatial patterns in georeferenced data [44]. Geostatistics can estimate the values of variables in unsampled regions, and multiple interpolation methods can be used. The inverse distance weighted (IDW) method has been widely used in groundwater contaminant prediction due to its simplicity, high efficiency and wide applicability. The results of Gong et al. [45] Khouni et al. [46] showed that the IDW interpolation method performed better than the Kriging method in groundwater contamination prediction. This study used the inverse distance weighted method to predict the spatial distribution of pollutants in the study area. This method combines the advantages of the natural nearest neighbor method based on Tyson polygons and the multiple regression gradient method [47,48]. This method not only considers the distance factor but also assigns weights to discrete observation points near the interpolation point based on the distance. The inverse distance weighted method is constructed using the following formula [49,50]:
Z ^ ( S 0 ) = i = 1 n λ i Z ( S i ) λ i = [ d ( S i , S 0 ) ] P i = 1 n [ d ( S i , S 0 ) ] P
where Z ^ ( S 0 ) is the predicted value of S0 (g/kg), Z ( S i ) is the measured value of the known point (g/kg), λ i is the weight, d ( S i , S 0 ) is the Euclidean distance between the sampling points (m) and P is the specified power.

3. Results

3.1. Groundwater Quality Types and Hydrochemical Types

By analyzing hydrochemical types, it is possible to understand the mineralization and dominant ion characteristics of the water body, which helps infer its sources and formation processes. This information is crucial for identifying contaminants and constructing health risk models. The pH values are 6.94~8.72, which indicates a neutral and weakly alkaline environment (Table 3). The TDS values are 266~5082 mg/L. Six groundwater samples are saline water, 10 groundwater samples are fresh water and 31 groundwater samples are brackish water. High-TDS groundwater is distributed in the central and northern parts of the study area (Figure 2a). Saline water intrusion and geochemical processes are responsible for the wide TDS range in this area [15,51]. Liu et al. [52] found the trend of a higher value for major ions in coastal areas during the analysis of high-density groundwater sampling in Weifang, which was the same as the result of this study.
The hydrochemical types of the saline water are Cl-Na, Cl-Na•Mg and Cl•SO4-Na•Ca•Mg. The hydrochemical types of the brackish water are Cl-Na, Cl•HCO3•SO4-Ca•Mg, HCO3•Cl-Ca•Mg, Cl•HCO3-Na and HCO3•Cl-Na. The hydrochemical types of the fresh water are HCO3-Ca•Na, HCO3•Cl-Na•Mg•Ca, HCO3•Cl-Na and HCO3•Cl-Ca•Na•Mg (Figure 3).

3.2. Spatial Distribution of Groundwater Quality

The significance of spatial distribution analysis of groundwater quality lies in identifying the specific locations and extents of saltwater intrusion and potential pollutants. This provides scientific evidence for identifying high-risk areas, formulating targeted remediation measures and safeguarding public health. The Na+, Ca2+ and Mg2+ concentrations were determined to be 39.37~1548.41 mg/L, 27.33~448.45 mg/L and 11.78~293.30 mg/L, with average values of 350.16 mg/L, 134.88 mg/L and 105.40 mg/L, respectively. The Cl, SO42− and HCO3 concentrations were determined to be in the ranges 32.29~2171.16 mg/L, 39.13~992.15 mg/L and 148.01~927.22 mg/L, with average values of 461.85 mg/L, 261.31 mg/L and 499.07 mg/L, respectively (Table 3). Regions with excess ions were distributed widely in this study area (Figure 2). Apart from NO2-N, all other non-metallic indicators show varying degrees of exceedance in certain areas. Overall, the groundwater pollutant concentrations are relatively lower near the Bailang River. The areas with groundwater quality exceeding the standard are more extensive on the western side of the river than on the eastern side. This suggests that the river has a positive impact on groundwater quality, while the pollution conditions on both sides of the river differ. The Bailang River may serve as a source of clean recharge water for the surrounding areas, helping to dilute pollutant concentrations in the groundwater. Active exchange between the river and groundwater likely contributes to improving groundwater quality. The higher levels of pollution on the western side of the river could be attributed to more intensive agricultural activities or industrial discharges, increasing the likelihood of pollutants entering the groundwater system.
The TDS and Cl considerations can be used to determine the degree of SWI [15]. The critical value of TDS was 1000 mg/L, for Cl it was 250 mg/L. Figure 2a,f show that the TDS and Cl considerations are seriously above critical values in most areas, which can indicate that the SWI is prevalent in the groundwater environment of the study area. The main influencing factor is groundwater exploitation [15]. The regions with high TDS and Cl concentrations are mainly located in the northern part of the study area, consistent with the typical intrusion pattern of saltwater. This northern region is predominantly agricultural land (Figure 4b). Elevated levels of TDS and Cl can adversely impact agricultural irrigation and potentially harm aquatic ecosystems.
The F concentration was 0.59~5.41 mg/L; the average value was 2.28 mg/L, and the median value was 2.31 mg/L. Thirty-two groundwater samples had F concentrations above the drinking water guideline value of the WHO (1.5 mg/L), which was 68.1% of the total groundwater samples. This result indicates that the F concentration is very high and can have negative effects on human health. This high fluoride concentration poses a significant risk to human health. The areas with high F concentrations are mainly distributed in the central and southern parts of the study area (Figure 2i), with most of these regions located in urban residential zones (Figure 4b). Urbanization activities, such as the use of fluoride-containing building materials or chemicals during construction, may contribute to elevated F levels.
The NO3-N concentration was 0.96~134.25 mg/L; the average value was 40.39 mg/L, and the median value was 35.17 mg/L (Table 3). High NO3-N levels are primarily found in the western and central-northern parts of the study area (Figure 2j), which are predominantly agricultural lands (Figure 4b). This distribution is likely linked to agricultural activities, such as fertilizer application and livestock farming. The nitrogen from fertilizers can leach into groundwater systems. The distribution of the main ions obtained in this study has the same characteristics as the groundwater chemistry study conducted by Liu et al. [52] in Weifang.
The spatial distribution characteristics of heavy metal pollutants in the study area are shown in Figure 4. The concentrations of Zn, As, Fe, Pb and Cu are below WHO standards, while only Cd and Mn exceed WHO standards in some regions. Moreover, the spatial distribution of heavy metal pollutants varies significantly, with occurrences in different locations, indicating that the pollution sources might be more dispersed. There is no clear correlation with the river, suggesting that the river may not be the primary pathway for the spread of these contaminants. The concentration ranges for Cd and Mn are 0.04–24.24 μg/L and 0–1.62 mg/L, with average values of 1.912 μg/L and 0.086 mg/L, respectively. Several groundwater samples exceed the standards. The areas where Cd exceeds the standard are primarily located in the central and southeastern parts of the study area, which are mainly industrial or urban land (Figure 4b). The elevated Cd levels may be attributed to industrial activities or other anthropogenic pollution sources in these areas. Cd is a heavy metal that can enter the groundwater system through various pathways, such as industrial wastewater discharge, improper disposal of used batteries and pesticide application. Elevated Mn levels are mainly found in the northwestern part of the study area, which is a construction land zone. The presence of Mn in these areas may be linked to the local geological background, industrial activities and agricultural practices. Although Mn exceedances are less likely to cause severe health problems compared to Cd, they can still pose some health risks and may affect the taste and color of the water.

3.3. Groundwater Quality Assessment

The groundwater quality index offers a quantitative assessment of the overall water quality, revealing the impact of saltwater intrusion and potential contaminants on groundwater quality. Based on existing references and the characteristics of the groundwater environment in this study area, K+, Na+, Ca2+, Mg2+, Cl, SO42−, HCO3, F, NO3-N, TDS, Mn and Cd were chosen to calculate the groundwater WQI values (Table 4). The calculation results are shown in Figure 5a,b.
The groundwater WQI range was 28.92~396.22. The groundwater quality was excellent (1 groundwater sample), good (18 groundwater samples), poor (18 groundwater samples), very poor (8 groundwater samples) or unsuitable for drinking water (2 groundwater samples). A total of 40.43% of the total groundwater samples were excellent and good, whereas 59.57% of the total groundwater samples were poor, very poor and unsuitable for drinking water (Figure 5a). As shown in Figure 5a,b, the unsuitable drinking water and very poor water samples were concentrated in the northwestern part of the study area, which is mainly affected by saltwater intrusion. Good groundwater is mostly distributed in the southwest, where areas are less affected by human activities. Poor groundwater is mainly distributed in residential areas and urban areas. In addition, the quality of groundwater near the Bailang River is mainly poor, which will also affect the quality of surface water. Figure 5c shows the relationship between the WQI and major pollutants exceeding the standard (Cl, F, NO3-N, Cd). It can be seen from this that the growth trend of Cl and WQI shows a high consistency and Cl is the main factor affecting WQI.

4. Discussion

4.1. Direct Effects of Saline Water Intrusion

Our study has verified that saline water intrusion is the main hydrogeological process in this study area and the main factor influencing groundwater quality [30]. During saline water intrusion, the main phenomenon is that the TDS and the main ion (Na+, Ca2+, K+, Mg2+, SO42− and Cl) concentrations increase [15], which can influence cation exchange in the groundwater environment.
Cation exchange, which can drive the enrichment of F in groundwater, is an important process in areas impacted by saline water intrusion [53]. CAI 1 ((Cl − (Na+ + K+))/Cl) and CAI 2 ((Cl − (Na+ + K+))/(SO42− + HCO3 + NO3 + CO32−)) can illustrate the possibility of cation exchange [54,55]. The CAI 1 and CAI 2 values of groundwater samples vary from −1.174 to 0.582 and from −0.001 to 0.0001, respectively. Only 14 groundwater samples (approximately 33.3% of the total samples) exhibit negative CAI 1 and CAI 2 values, indicating that the cation exchange of Ca2+ and Mg2+ relative to Na+ and K+ in groundwater in the aquifer may not be prevalent and that reverse cation exchange (2NaX + Ca2+ → CaX2 + 2Na+) is likely dominant in the study area (Figure 6). This process can lead to a decrease in the Ca2+ concentration [56]. The role of calcite and dolomite dissolution in groundwater chemistry can be determined by the Ca2+/Mg2+ ratio [13]. As shown in Figure 6, almost all groundwater samples with high F concentrations plot below the Ca2+/Mg2+ = 1:1 line, which suggests that dolomite dissolution (CaMg(CO3)2→Ca2+ + Mg2+ + 2CO32−) is prevalent in the groundwater environment. Yousefi et al. [57] also explained in his research that the existence of anions and cations in water has an important impact on F ions, which is consistent with our research.

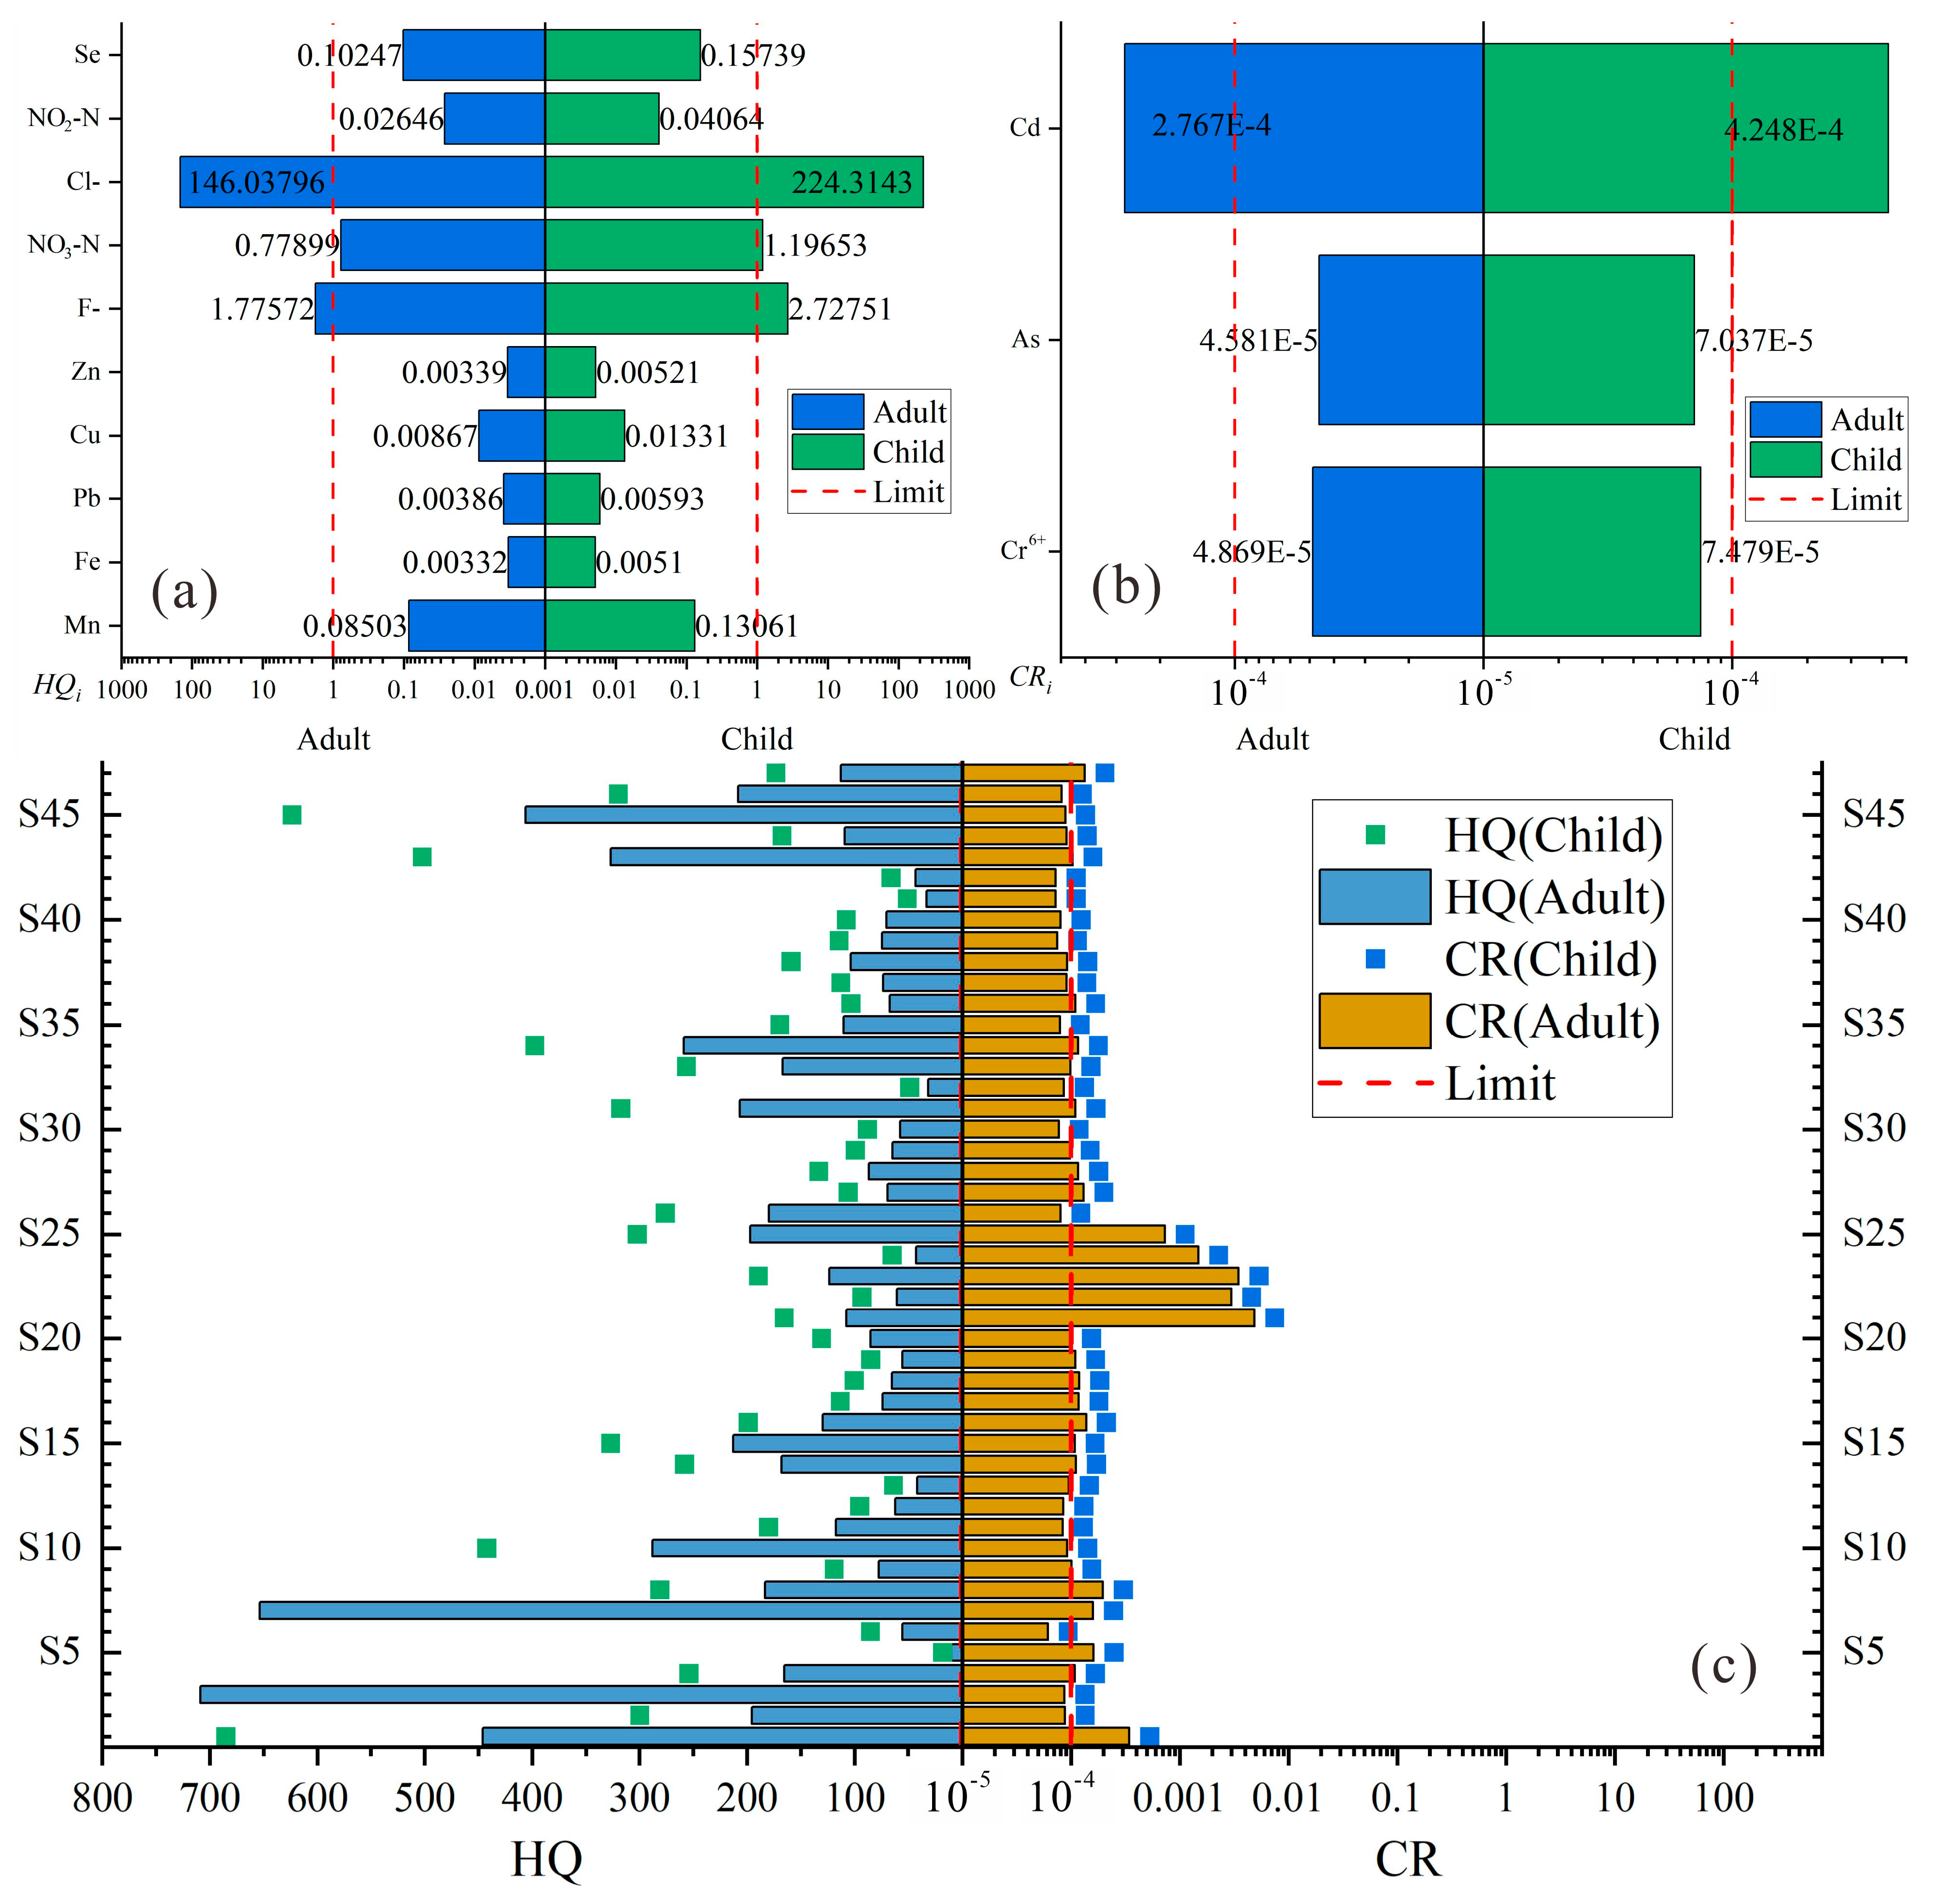
4.2. Health Risk Assessment and Main Factors

In this study, a health risk assessment model and related model parameters were used to calculate the health risk of groundwater in the study area. The carcinogenic risk and noncarcinogenic risk calculation results of each factor are shown in Figure 7. The average HQ values of potentially hazardous pollutants were Cl > F > NO3-N > Se > Mn > NO2-N > Cu > Pb > Zn > Fe, and the HQ value ranges for adults and children were 11.86~708.55 and 18.21~1088.33 (95.69 and 146.98 on average), respectively. This result indicates that there are high and very high noncarcinogenic risks for adults and children.
The greatest noncarcinogenic risk for adults and children in the study area was caused by Cl. The HQi values of Cl ranged from 10.48 to 704.82 (adults) and 16.10 to 224.31 (children), with averages of 146.04 (adults) and 224.31 (children), accounting for 98.13% of the average HQ values of potentially hazardous pollutants. Therefore, the HQi value of the noncarcinogenic pollutant Cl in groundwater greatly exceeded the threshold, which had negative impacts on the health of adults and children. The second highest contribution to HQ was F. The HQi values of F ranged from 0.48 to 4.39 (adults) and 0.74 to 6.74 (children), and the average values were 1.78 (adults) and 2.73 (children). F accounted for 1.19% of the total HQ, which had a great impact on the health of adults and children. Amouei et al. [58] also reported similar research results. Among the indicators of noncarcinogenic risk, the contribution of NO3-N to the HQ value was third, with no serious impacts on the health of adults but with a certain impact on the health of children. The HQi values of other noncarcinogenic risk indicators, such as Se, Mn, NO2-N, Cu, Pb, Zn and Fe, were all lower than the standards and had low impacts on the health of adults and children. Fe had the smallest contribution to the total noncarcinogenic risk, and its contribution to the HQ value was only 0.0022%.
According to the carcinogenic risk index method, Cr, As and Cd were evaluated. The order of the contribution of carcinogenic risk factors according to the CRi was Cd (74.53%) > As (13.12%) > Cr (12.35%). The range of CR values for the total carcinogenic risks of adults and children was 6.148 × 10⁻⁵~0.0049 and 9.444 × 10⁻⁵~0.0075 and their average CR values were 0.00037 and 0.00057, respectively. Among these results, the evaluation result of a single index showed that the CRs of Cr and As were less than 1 × 10⁻⁴, so their carcinogenic risk could be ignored. Cd was the most important indicator of carcinogenic risk, accounting for 74.53% of the CR. The ranges of the CR values of the Cd index in adults and children were 7.92 × 10⁻⁵~0.0048 and 1.217 × 10⁻⁵~0.0074, respectively, with an average value of 0.000277~0.000425. The CRi value of Cd for adults and children exceeded international standards; the CR value for children was approximately 1.5 times that for adults, indicating that children were at higher risk of carcinogenesis.
Among the noncarcinogenic risks and carcinogenic risks of groundwater, the health risk to children through drinking water is greater than that to adults (Figure 7). This shows that children are more sensitive risk recipients than adults and are more severely affected by groundwater pollutants. Yousefi et al. [59] also found that children have higher health risks than adults. Therefore, children’s drinking water safety should be more strictly controlled. According to the USEPA risk standard, the HQ values of adults and children of all groundwater samples exceeded the standard limit. A total of 53.19% of the groundwater poses noncancer health risks to adults, whereas 97.87% of the groundwater poses noncancer health risks to children. This result indicates that the noncarcinogenic pollutants in the groundwater environment have great negative impacts on the health of adults and children and that the carcinogenic pollutants also have greater impacts on the health of adults and children.
Based on the GIS platform, 6951 randomly distributed sampling points corresponding to 10 index values were extracted from the HQ and CR distribution maps of adults and children. Multiple regression analysis was used to analyze all index values and evaluation results. The calculated correlation coefficient analysis results are listed in Table 5. The results show that Cl, which was caused by saline water intrusion in this study area, was the most relevant indicator affecting the noncarcinogenic health risks of adults and children. In addition, the regression coefficients of F, NO3-N, Mn, Se and other factors in the area remained above 0.001, which may affect the health risks of residents to a certain extent. Among heavy metals, Mn is the main factor affecting HQ, while Cd is the factor that has the greatest impact on the CR value.

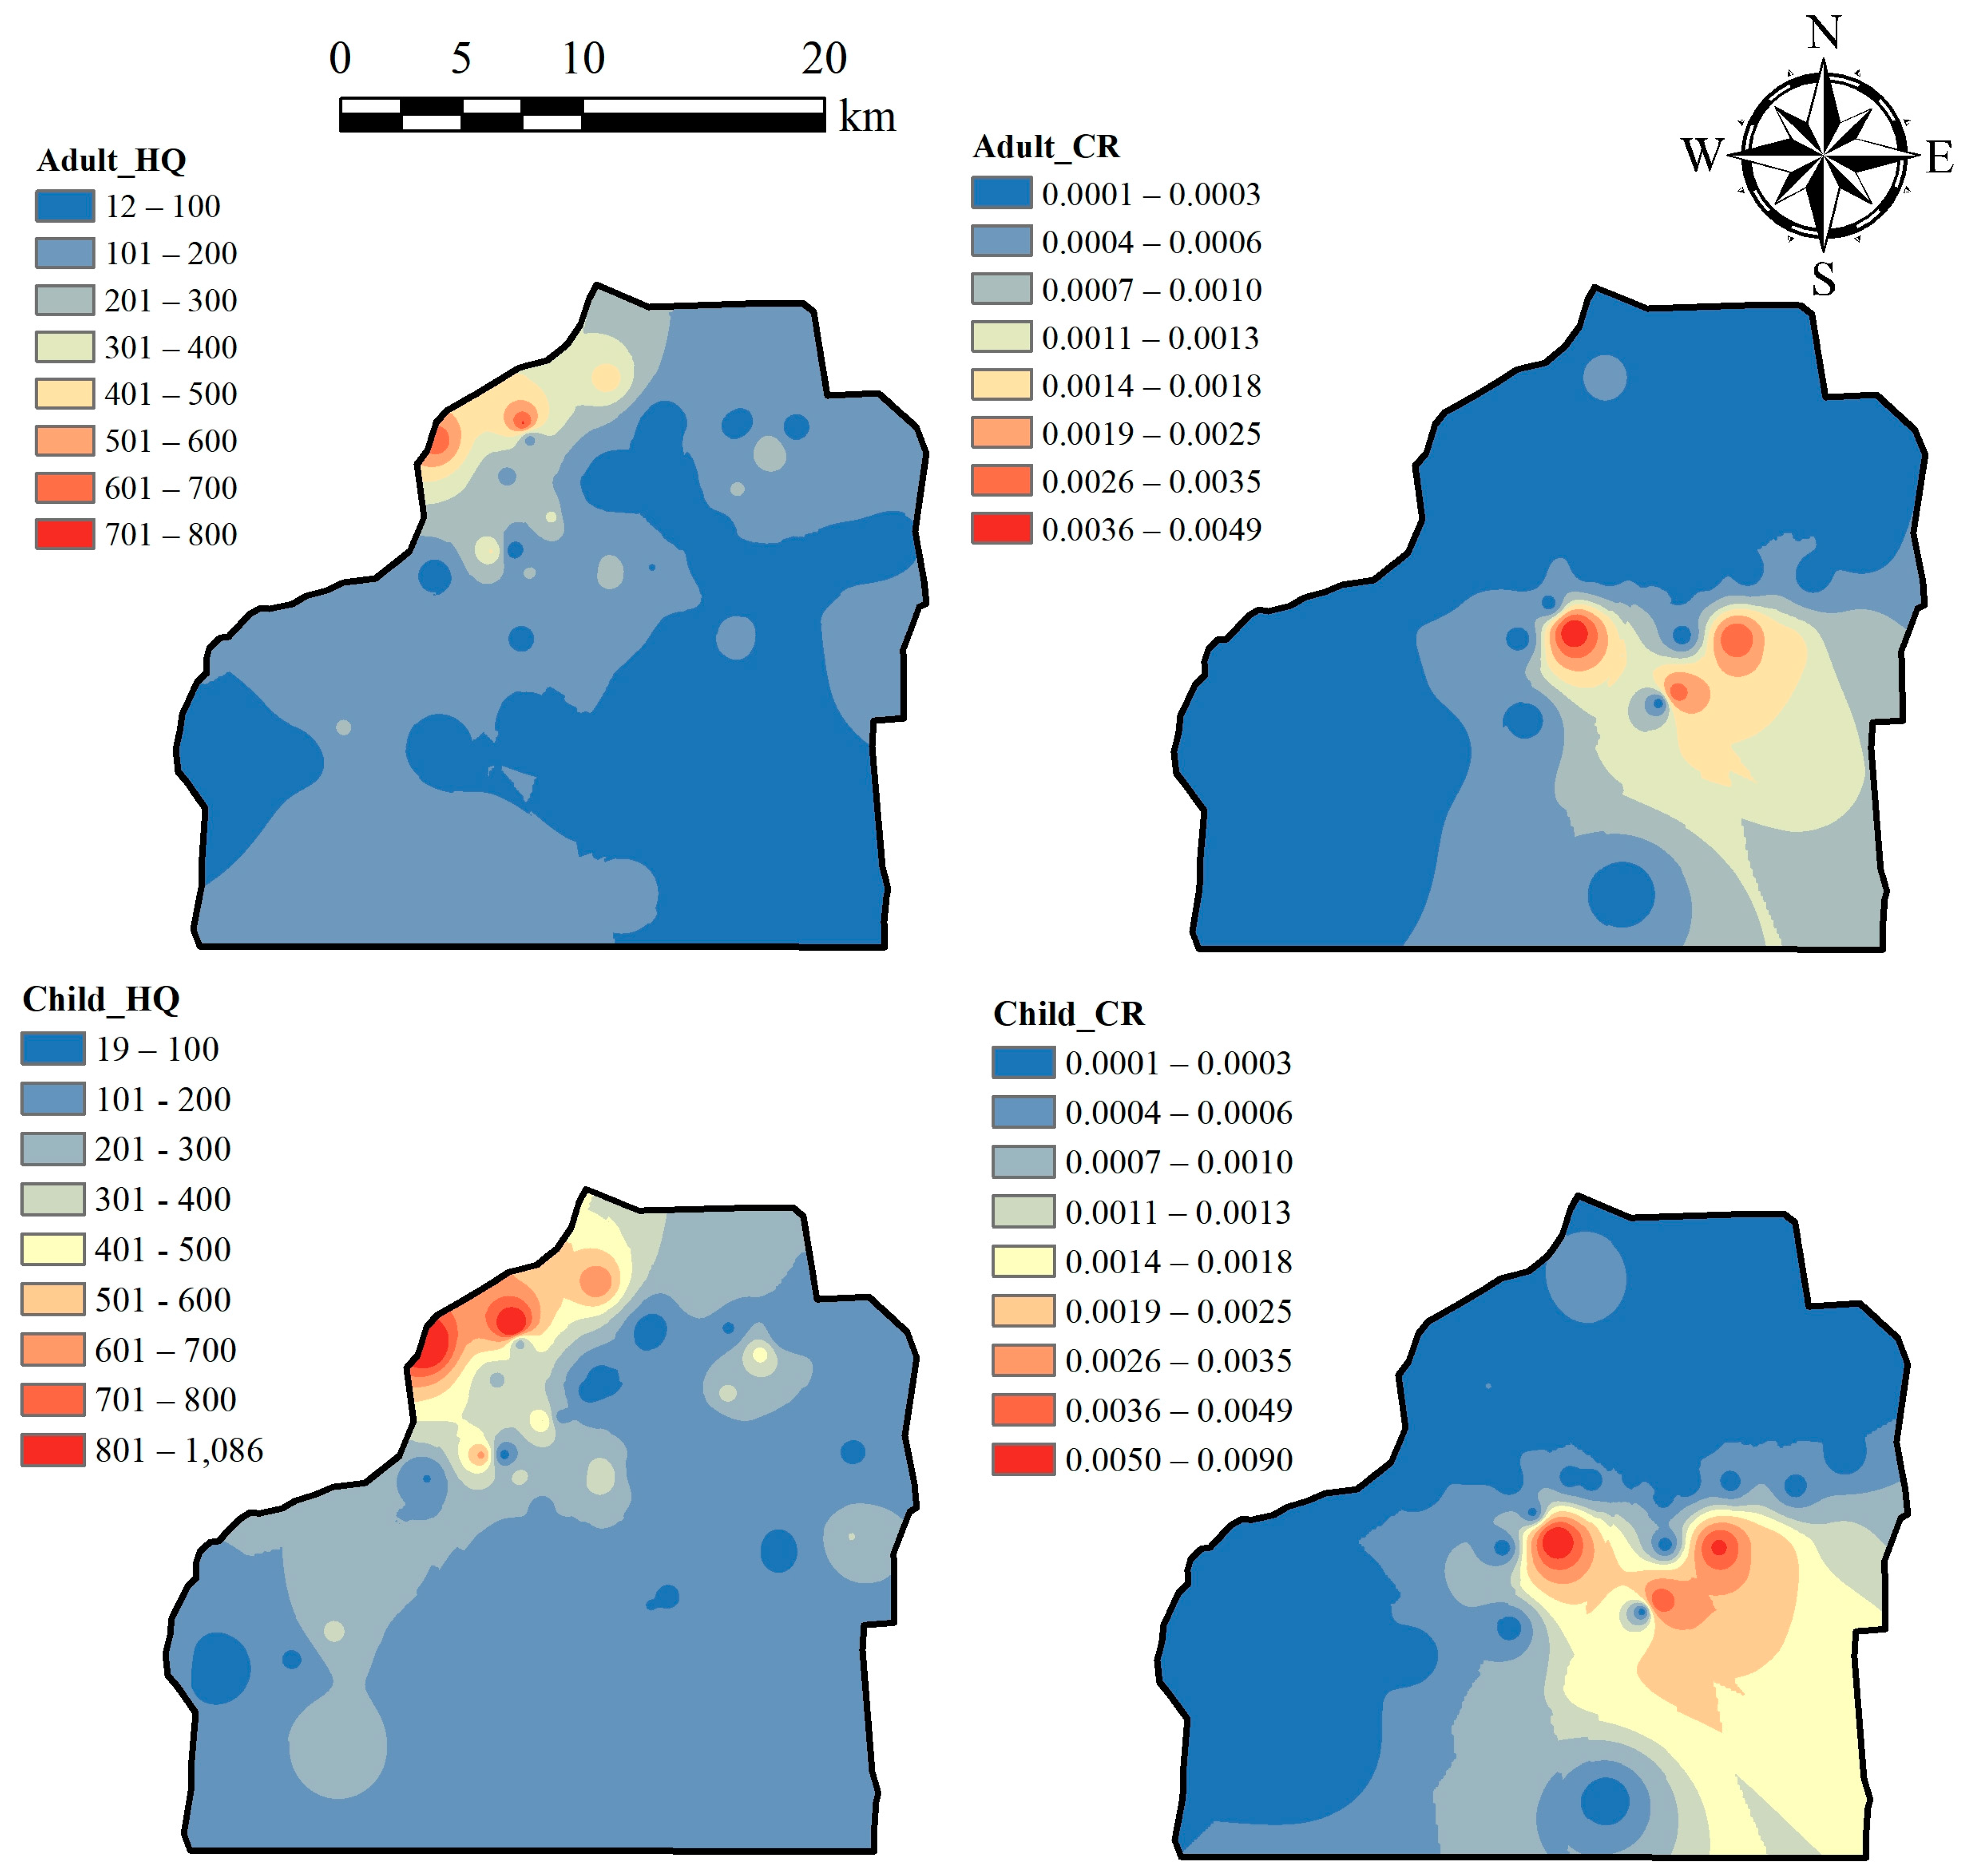
4.3. Spatial Distribution of HQ and CR

The HQ values of noncarcinogenic pollutants in adults and children were all higher than the standards. The polluted areas that seriously affect the health of residents are mainly concentrated on the northwest side of the study area, as shown in Figure 8. The highest HQ value for adults was 707, and the mean value was 129. A total of 71.25% of the region had HQ values in the 12~129 range. The highest HQ value for children reached 1086, with an average of 198. The HQ values of 68.57% of the area were in the range 100~200. The areas where groundwater carcinogenic pollutants had elevated health effects on adults and children were mainly concentrated in the central region of the study area. The proportion of over-standard areas for adults reached 35.37%, and the proportion of over-standard areas for children reached 44.77%.
In addition, the highest CR value for adults was 0.0049, and the average value was 0.0004. The average value was consistent with international standard health risk limits. The highest CR value for children was 0.0075, and the average value was 0.0007, which was slightly higher than the international standard risk limit. Noncarcinogenic pollutants have definite health effects on the human body, while carcinogenic pollutants may cause the CR to exceed the standard in some areas, which has negative effects on human health. The spatial distribution results showed that noncarcinogenic pollutants were enriched.
The WQI, HQ and CR risk data were integrated in GIS, and the groundwater in the study area was divided into three zones based on the equal-weighted index strategy: the hazard free region, the vulnerable region and the contaminated region (Figure 9). It can be seen from Figure 7 that the groundwater pollution areas in the study area are mainly concentrated in the northwest and middle of the region, accounting for 5.52% of the total area. The potential pollution areas (vulnerable areas) are distributed in the northwest and southeast, accounting for 30.07% of the total area. Most areas in the study area are hazard free areas, accounting for 64.41% of the total area, which indicates that the overall groundwater condition in the study area is good. The highly polluted zones in the northwest and central regions have relatively low population densities, ranging from 4 to 8 people per square kilometer, resulting in a relatively minor impact on human health. However, stricter land and groundwater usage policies should be enforced in these polluted areas to limit activities that could exacerbate contamination. In contrast, the southeastern part of the study area has a higher population density, ranging from 5 to 40 people per square kilometer, and thus requires focused management. Groundwater zoning management should be implemented in this region to restrict over-extraction. Additionally, constructing impermeable walls or artificial barriers may be necessary to prevent further seawater intrusion.

4.4. Adaptability of the Research Framework

This study offers a decision-making tool based on spatial distribution and risk assessment that can assist local governments or environmental management agencies in identifying high-risk areas and implementing targeted interventions. Although the research focuses on the southern Laizhou Bay, the employed methodologies—including GIS-based spatial analysis, water quality index methods, and health risk assessment models—are broadly applicable. Particularly for coastal regions, the spatial analysis framework for saltwater intrusion and pollutant distribution can be directly applied to other areas with similar geological, climatic, and hydrological conditions (Figure 10). The management strategies and risk mitigation measures proposed are not limited to the study area but also provide valuable references for water resource protection and pollution prevention in other regions.

5. Conclusions

Under the conditions of excessive groundwater extraction and the presence of subsurface saline water, saltwater intrusion has occurred. As a result, the concentrations of K+, Na+, Ca2+, Mg2+, Cl−, SO42− and HCO3 have significantly exceeded WHO standards. Moreover, agricultural irrigation has led to an increase in nitrate nitrogen in groundwater. Industrial activities can lead to an increase in the amounts of dissolved metals in groundwater. A total of 59.57% of the total groundwater samples were poor, very poor or unsuitable for drinking water.
The average HQ sequence in typical groundwater pollutants is Cl > F > NO3-N > Se > Mn > NO2-N > Cu > Pb > Zn > Fe, and the CR sequence caused by carcinogenic pollutants is Cd > As > Cr. Cd is the most important indicator of carcinogenic risk, and it contributes 74.53% of the CR. The HQ values of noncarcinogenic pollutants in groundwater for adults and children are all higher than the standard value, and the pollution areas that seriously affect residents’ health are mainly concentrated in the northwest of the study area. The regions with high health impacts related to the carcinogenic pollutants in groundwater are mainly concentrated in the central part of the study area, with an exceeding range of 35.37% for adults and 44.77% for children.
The Cl concentration was extremely high and was the most relevant indicator affecting the noncarcinogenic health risks of adults and children in the area. It can be concluded that saline water intrusion is the main factor affecting human health. The potentially hazardous pollutants are of carcinogenic and noncarcinogenic risks, which are caused by agriculture, industry and other human activities. Therefore, it is necessary to prevent and control saline water intrusion and to improve groundwater quality.

Author Contributions

Conceptualization, S.L.; methodology, Z.S. and X.Y.; software, X.Y.; validation, S.L., Z.S. and X.Y.; formal analysis, X.Y.; investigation, J.W.; resources, M.L.; data curation, S.L.; writing—original draft preparation, Z.S., X.Y., J.W., M.L. and S.L.; writing—review and editing, S.L. and X.Y.; visualization, S.L.; supervision, S.L.; project administration, S.L.; funding acquisition, S.L. All authors have read and agreed to the published version of the manuscript.

Funding

This research was financially supported by the [Open Research Fund of Key laboratory of coastal zone geological environment protection (No. SYS202103)] and [National Natural Science Foundation of China (No. 42007166, 41977173)].

Data Availability Statement

Data are available from the corresponding author upon reasonable request.

Acknowledgments

None.

Conflicts of Interest

The authors declare no competing interests.

References

  1. Post, V.E.A. Fresh and saline groundwater interaction in coastal aquifers: Is our technology ready for the problems ahead? Hydrogeol. J. 2005, 13, 120–123. [Google Scholar] [CrossRef]
  2. Al-Ansari, N. Management of water resources in Iraq: Perspectives and prognoses. Engineering 2013, 5, 667–684. [Google Scholar] [CrossRef]
  3. Adimalla, N.; Qian, H. Groundwater chemistry, distribution and potential health risk appraisal of nitrate enriched groundwater: A case study from the semi-urban region of South India. Ecotoxicol. Environ. Saf. 2021, 207, 111277. [Google Scholar] [CrossRef] [PubMed]
  4. Wang, Z.Y.; Su, Q.; Wang, S.; Gao, Z.J.; Liu, J.T. Spatial distribution and health risk assessment of dissolved heavy metals in groundwater of eastern China coastal zone. Environ. Pollut. 2021, 290, 118016. [Google Scholar] [CrossRef]
  5. Wen, X.H.; Lu, J.; Wu, J.; Lin, Y.C.; Luo, Y.M. Influence of coastal groundwater salinization on the distribution and risks of heavy metals. Sci. Total Environ. 2019, 652, 267–277. [Google Scholar] [CrossRef]
  6. Lu, J.; Wu, J.; Zhang, C.; Zhang, Y. Possible effect of submarine groundwater discharge on the pollution of coastal water: Occurrence, source, and risks of endocrine disrupting chemicals in coastal groundwater and adjacent seawater influenced by reclaimed water irrigation. Chemosphere 2020, 250, 126323. [Google Scholar] [CrossRef]
  7. Li, X.; Huang, X.; Zhang, Y.H. Spatio-temporal analysis of groundwater chemistry, quality and potential human health risks in the Pinggu basin of North China Plain: Evidence from high-resolution monitoring dataset of 2015–2017. Sci. Total Environ. 2021, 800, 149568. [Google Scholar] [CrossRef]
  8. Wang, Z.Y.; Gao, Z.J.; Wang, S.; Liu, J.T.; Li, W.; Deng, Q.J.; Lv, L.; Liu, Y.Q.; Su, Q. Hydrochemistry characters and hydrochemical processes under the impact of anthropogenic activity in the Yiyuan city, Northern China. Environ. Earth Sci. 2021, 80, 60. [Google Scholar] [CrossRef]
  9. Solgi, E.; Jalili, M. Zoning and human health risk assessment of arsenic and nitrate contamination in groundwater of agricultural areas of the twenty-two village with geostatistics (Case study: Chahardoli Plain of Qorveh, Kurdistan Province, Iran). Agric. Water Manag. 2021, 255, 107023. [Google Scholar] [CrossRef]
  10. Sanford, W.E.; Pope, J.P. Current challenges using models to forecast seawater intrusion: Lessons from the Eastern Shore of Virginia, U.S.A. Hydrogeol. J. 2010, 18, 73–93. [Google Scholar] [CrossRef]
  11. Famiglietti, J.S. The global groundwater crisis. Nat. Clim. Chang. 2014, 4, 945–948. [Google Scholar] [CrossRef]
  12. Li, P.; Tian, R.; Xue, C.; Wu, J. Progress, opportunities and key fields for groundwater quality research under the impacts of human activities in China with a special focus on western China. Environ. Sci. Pollut. Res. 2017, 24, 13224–13234. [Google Scholar] [CrossRef] [PubMed]
  13. Li, P.; Wu, J.; Tian, R.; He, S.; He, X.; Xue, C.; Zhang, K. Geochemistry, hydraulic connectivity and quality appraisal of multilayered groundwater in the Hongdunzi Coal Mine, Northwest China. Mine Water Environ. 2018, 37, 222–237. [Google Scholar] [CrossRef]
  14. Luo, Y.F.; Xiao, Y.; Hao, Q.C.; Zhang, Y.H.; Zhao, Z.; Wang, S.B.; Dong, G.F. Groundwater geochemical signatures and implication for sustainable development in a typical endorheic watershed on Tibetan plateau. Environ. Sci. Pollut. Res. 2021, 28, 48312–48329. [Google Scholar] [CrossRef] [PubMed]
  15. Liu, S.; Tang, Z.; Gao, M.; Hou, G. Evolutionary process of saline-water intrusion in Holocene and Late Pleistocene groundwater in southern Laizhou Bay. Sci. Total Environ. 2017, 607–608, 586–599. [Google Scholar] [CrossRef]
  16. Naujokas, M.; Anderson, B.; Ahsan, H.; Aposhian, H.V.; Suk, W. The broad scope of health effects from chronic arsenic exposure: Update on a worldwide public health problem. Environ. Health Perspect. 2013, 121, 295–302. [Google Scholar] [CrossRef]
  17. Esmaeilzadeh, M.; Jaafari, J.; Mohammadi, A.A.; Panahandeh, M.; Javid, A.; Javan, S. Investigation of the extent of contamination of heavy metals in agricultural soil using statistical analyses and contamination indices. Hum. Ecol. Risk Assess 2019, 25, 1125–1136. [Google Scholar] [CrossRef]
  18. Sharma, S.; Nagpal, A.K.; Kaur, I. Appraisal of heavy metal contents in groundwater and associated health hazards posed to human population of Ropar wetland, Punjab, India and its environs. Chemosphere 2019, 227, 179–190. [Google Scholar] [CrossRef]
  19. Manoj, S.; RamyaPriya, R.; Elango, L. Long-term exposure to chromium contaminated waters and the associated human health risk in a highly contaminated industrialised region. Environ. Sci. Pollut. Res. 2021, 28, 4276–4288. [Google Scholar] [CrossRef]
  20. Mukherjee, I.; Singh, U.K.; Singh, R.P. An Overview on Heavy Metal Contamination of Water System and Sustainable Approach for Remediation, Water Pollution and Management Practices; Springer: Singapore, 2021; pp. 255–277. [Google Scholar]
  21. Azhdarpoor, A.; Radfard, M.; Pakdel, M.; Abbasnia, A.; Badeenezhad, A.; Mohammadi, A.A.; Yousefi, M. Assessing fluoride and nitrate contaminants in drinking water resource and their health risk assessment in a semiarid region of southwest Iran. Desalin. Water Treat 2019, 149, 43–51. [Google Scholar] [CrossRef]
  22. Rezaei, H.; Jafari, A.; Kamarehie, B.; Fakhri, Y.; Ghaderpoury, A.; Karami, M.A.; Ghaderpoori, M.; Shams, M.; Bidarpoor, F.; Salimi, M. Health risk assessment related to the fluoride, nitrate, and nitrite in the drinking water in the Sanandaj, Kurdistan county, Iran. Hum. Ecol. Risk Assess. 2019, 25, 1242–1250. [Google Scholar] [CrossRef]
  23. Chae, G.T.; Yun, S.T.; Mayer, B.; Kim, K.H.; Kim, S.Y.; Kwon, J.S.; Kim, K.; Koh, Y.K. Fluorine geochemistry in bedrock groundwater of South Korea. Sci. Total Environ. 2007, 385, 272–283. [Google Scholar] [CrossRef] [PubMed]
  24. Kim, S.H.; Kim, K.; Ko, K.S.; Kim, Y.; Lee, K.S. Co-contamination of Arsenic and Fluoride in the Groundwater of Unconsolidated Aquifers Under Reducing Environments. Chemosphere 2012, 87, 851–856. [Google Scholar] [CrossRef] [PubMed]
  25. Thapa, R.; Gupta, S.; Gupta, A. Geochemical and geostatistical appraisal of fluoride contamination: An insight into the quaternary aquifer. Sci. Total Environ. 2018, 640, 406–418. [Google Scholar] [CrossRef]
  26. Jia, C.P.; Chen, Q.; Wei, J.C.; Wang, H.M.; Shi, L.Q.; Ning, F.Z.; Liu, S.L.; Yang, M.Y.; Xue, X.; Dong, F.Y. The study on the mechanism of fluorine transformation between water and rock (soil) in seawater intrusion areas based on FTIR spectrum. Spectrosc. Spectr. Anal. 2019, 39, 1036–1040. [Google Scholar] [CrossRef]
  27. Karami, M.A.; Fakhri, Y.; Rezania, S.; Alinejad, A.A.; Mohammadi, A.A.; Yousefi, M.; Ghaderpoori, M.; Saghi, M.H.; Ahmadpour, M. Non-Carcinogenic Health Risk Assessment due to Fluoride Exposure from Tea Consumption in Iran Using Monte Carlo Simulation. Int. J. Environ. Res. Pub. He 2019, 16, 4261. [Google Scholar] [CrossRef]
  28. Yadav, K.K.; Kumar, S.; Pham, Q.B.; Gupta, N.; Rezania, S.; Kamyab, H.; Yadav, S.; Vymazal, J.; Kumar, V.; Tri, D.Q.; et al. Fluoride Contamination, Health Problems and Remediation Methods in Asian Groundwater: A Comprehensive Review. Ecotoxicol. Environ. Saf. 2019, 182, 109362. [Google Scholar] [CrossRef]
  29. Mcmahon, P.B.; Brown, C.J.; Johnson, T.D.; Belitz, K.; Lindsey, B.D. Fluoride Occurrence in United States Groundwater. Sci. Total Environ. 2020, 732, 139217. [Google Scholar] [CrossRef]
  30. Yang, F.; Liu, S.; Jia, C.; Gao, M.S.; Chang, W.B.; Wang, Y.J. Hydrochemical characteristics and functions of groundwater in southern Laizhou Bay based on the multivariate statistical analysis approach. Estuar. Coast. Shelf Sci. 2021, 250, 107153. [Google Scholar] [CrossRef]
  31. Liu, S.; Gao, M.; Tang, Z.; Hou, G.; Guo, F. Responses of submarine groundwater to silty-sand coast reclamation: A case study in south of Laizhou Bay, China. Estuar. Coast. Shelf Sci. 2016, 181, 51–60. [Google Scholar] [CrossRef]
  32. Abbasnia, A.; Yousefi, N.; Mahvi, A.H.; Nabizadeh, R.; Radfard, M.; Yousefi, M.; Alimohammadi, M. Evaluation of groundwater quality using water quality index and its suitability for assess ing water for drinking and irrigation purposes: Case study of Sistan and Baluchistan province (Iran). Hum. Ecol. Risk Assess. Int. J. 2019, 25, 988–1005. [Google Scholar] [CrossRef]
  33. Nong, X.Z.; Shao, D.G.; Zhong, H.; Liang, J.K. Evaluation of water quality in the Southto-North Water Diversion Project of China using the water quality index (WQI) method. Water Res. 2020, 178, 115781. [Google Scholar] [CrossRef] [PubMed]
  34. Singh, G.; Patel, N.; Jindal, T.; Srivastava, P.; Bhowmik, A. Assessment of spatial and temporal variations in water quality by the application of multivariate statistical methods in the Kali River, Uttar Pradesh, India. Environ. Monit. Assess. 2020, 192, 1–26. [Google Scholar] [CrossRef] [PubMed]
  35. Alshehri, F.; Almadani, S.; El-Sorogy, A.S.; Alwaqdani, E.; Alfaifi, H.; Alharbi, T. Influence of seawater intrusion and heavy metals contamination on groundwater quality, Red Sea coast, Saudi Arabia. Mar. Pollut. Bull. 2021, 165, 112094. [Google Scholar] [CrossRef] [PubMed]
  36. Njuguna, S.M.; Onyango, J.A.; Githaiga, K.B.; Gituru, R.W.; Yan, X. Application of multivariate statistical analysis and water quality index in health risk assessment by domestic use of river water. Case study of Tana River in Kenya. Process Safety and Environmental. Protection 2020, 133, 149–158. [Google Scholar] [CrossRef]
  37. Githaiga, K.B.; Njuguna, S.M.; Gituru, R.W.; Yan, X. Water quality assessment multivariate analysis human health risks of heavy metals in eight major lakes in Kenya. J. Environ. Manag. 2021, 297, 113410. [Google Scholar] [CrossRef]
  38. Hu, G.; Liu, H.; Chen, C.; Li, J.; Hou, H.; Hewage, K.; Sadiq, R. An integrated geospatial correlation analysis human health risk assessment approach for investigating abandoned industrial sites. J. Environ. Manag. 2021, 293, 112891. [Google Scholar] [CrossRef]
  39. Sadeghfam, S.; Abdi, M.; Khatibi, R.; Nadiri, A.A. An investigation into uncertainties within Human Health Risk Assessment to gain an insight into plans to mitigate impacts of arsenic contamination. J. Clean. Prod. 2021, 211, 127667. [Google Scholar] [CrossRef]
  40. Hu, G.; Rana, A.; Mian, H.R.; Saleem, S.; Mohseni, M.; Jasim, S.; Hewage, K.; Sadiq, R. Human health risk-based life cycle assessment of drinking water treatment for heavy metal(loids) removal. J. Clean. Prod. 2020, 267, 121980. [Google Scholar] [CrossRef]
  41. Li, Z.; Ma, Z.; van der Kuijp, T.J.; Yuan, Z.; Huang, L. A review of soil heavy metal pollution from mines in China: Pollution and health risk assessment. Sci. Total Environ. 2014, 468–469, 843–853. [Google Scholar] [CrossRef]
  42. Horrocks, T.; Holden, E.; Wedge, D.; Wijns, C. 3-D geochemical interpolation guided by geophysical inversion models. Geosci. Front. 2021, 12, 101089. [Google Scholar] [CrossRef]
  43. Zou, W.; Yin, S.; Wang, W. Spatial interpolation of the extreme hourly precipitation at different return levels in the Haihe River basin. J. Hydrol. 2021, 598, 126273. [Google Scholar] [CrossRef]
  44. Qiao, P.; Lei, M.; Yang, S.; Yang, J.; Guo, G.; Zhou, X. Comparing ordinary kriging and inverse distance weighting for soil as pollution in Beijing. Environ. Sci. Pollut. Res. 2018, 25, 15597–15608. [Google Scholar] [CrossRef] [PubMed]
  45. Gong, G.; Mattevada, S.; O Bryant, S.E. Comparison of the accuracy of kriging and IDW interpolations in estimating groundwater arsenic concentrations in Texas. Environ. Res. 2014, 130, 59–69. [Google Scholar] [CrossRef] [PubMed]
  46. Khouni, I.; Louhichi, G.; Ghrabi, A. Use of GIS based Inverse Distance Weighted interpolation to assess surface water quality: Case of Wadi El Bey, Tunisia. Environ. Technol. Innov. 2021, 24, 101892. [Google Scholar] [CrossRef]
  47. Chen, F.; Liu, C. Estimation of the spatial rainfall distribution using inverse distance weighting (IDW) in the middle of Taiwan. Paddy Water Environ. 2012, 10, 209–222. [Google Scholar] [CrossRef]
  48. Nistor, M.M.; Rahardjo, H.; Satyanaga, A.; Hao, K.Z.; Xiaosheng, Q.; Sham, A.W.L. Investigation of groundwater table distribution using borehole piezometer data interpolation: Case study of Singapore. Eng. Geol. 2020, 271, 105590. [Google Scholar] [CrossRef]
  49. Charizopoulos, N.; Zagana, E.; Psilovikos, A. Assessment of natural and anthropogenic impacts in groundwater, utilizing multivariate statistical analysis and inverse distance weighted interpolation modeling: The case of a Scopia basin (Central Greece). Environ. Earth Sci. 2018, 77, 380. [Google Scholar] [CrossRef]
  50. Tiwari, S.; Kumar Jha, S.; Sivakumar, B. Reconstruction of daily rainfall data using the concepts of networks: Accounting for spatial connections in neighborhood selection. J. Hydrol. 2019, 579, 124185. [Google Scholar] [CrossRef]
  51. Han, D.M.; Song, X.F.; Currell, M.J.; Yang, J.L.; Xiao, G.Q. Chemical and isotopic constraints on evolution of groundwater salinization in the coastal plain aquifer of Laizhou Bay, China. J. Hydrol. 2014, 508, 12–27. [Google Scholar] [CrossRef]
  52. Liu, J.; Gao, Z.; Zhang, Y.; Sun, Z.; Sun, T.; Fan, H.; Wu, B.; Li, M.; Qian, L. Hydrochemical evaluation of groundwater quality and human health risk assessment of nitrate in the largest peninsula of China based on high-density sampling: A case study of Weifang. J. Clean Prod. 2021, 322, 129164. [Google Scholar] [CrossRef]
  53. Rashid, A.; Guan, D.X.; Farooqi, A.; Khan, S.; Zahir, S.; Jehan, S.; Khattak, S.A.; Khan, M.S.; Khan, R. Fluoride prevalence in groundwater around a fluorite mining area in the flood plain of the River Swat. Pakistan. Sci. Total Environ. 2018, 635, 203–215. [Google Scholar] [CrossRef] [PubMed]
  54. Schoeller, H. Qualitative Evaluation of Groundwater Resources. In: Methods and Techniques of Groundwater investigations and Development UNESCO. Water Resour. Ser. 1967, 33, 44–52. [Google Scholar]
  55. Su, C.M.; Puls, R.W. Arsenate and Arsenite Removal by Zerovalent Iron: Effects of Phosphate, Silicate, Carbonate, Borate, Sulfate, Chromate, Molybdate, and Nitrate, Relative to Chloride. Environ. Sci. Technol. 2001, 35, 4522–4568. [Google Scholar] [CrossRef] [PubMed]
  56. Chen, Q.; Jia, C.P.; Wei, J.C.; Dong, F.Y.; Yang, W.G.; Hao, D.C.; Jia, Z.W.; Ji, Y.H. Geochemical process of groundwater fluoride evolution along global coastal plains: Evidence from the comparison in seawater intrusion area and soil salinization area. Chem. Geol. 2020, 552, 119779. [Google Scholar] [CrossRef]
  57. Yousefi, M.; Kazemi Moghaddam, V.; Maghsoudi Nasab, S.; Nabizadeh, R.; Hadei, M.; Zarei, A.; Baghal Asghari, F.; Mohammadi, A.A. Northwest of Iran as an endemic area in terms of fluoride contamination: A case study on the correlation of fluoride concentration with physicochemical characteristics of groundwater sources in Showt. Desalin. Water Treat. 2019, 155, 183–189. [Google Scholar] [CrossRef]
  58. Amouei, A.I.; Mahvi, A.H.; Mohammadi, A.A.; Asgharnia, H.A.; Fallah, S.H.; Khafajeh, A.A. Fluoride concentration in potable groundwater in rural areas of Khaf city, Razavi Khorasan Province, northeastern Iran. Int. J. Occup. Environ. Med. 2012, 3, 201–203. [Google Scholar]
  59. Yousefi, M.; Asghari, F.; Zuccarello, P.; Oliveri Conti, G.; Ejlali, A.; Mohammadi, A.; Ferrante, M. Spatial Distribution Variation and Probabilistic Risk Assessment of Exposure to Fluoride in Ground Water Supplies: A Case Study in an Endemic Fluorosis Region of Northwest Iran. Int. J. Environ. Res. Public Health 2019, 16, 564. [Google Scholar] [CrossRef]
Figure 1. Location of study area and groundwater samples. (DEM data is derived from global bathymetric data). The freshwater–saltwater boundary is from derived from local groundwater survey data.
Water 16 02573 g001
Figure 2. The spatial distribution of non-metal data. (a), TDS; (b), K+; (c), Na+; (d), Ca2+; (e), Mg2+; (f), Cl; (g), SO42−; (h), HCO3; (i), F; (j), NO3−N; (k), Se; (l) NO2−N.
Water 16 02573 g002
Figure 3. The Piper program of groundwater samples in study area.
Water 16 02573 g003
Figure 4. The spatial distribution of heavy metals. (a) Zn; (b) As; (c) Cd; (d) Mn; (e) Fe; (f) Pb; (g) Cu.
Water 16 02573 g004
Figure 5. WQI result distribution: (a) WQI value of each sampling point; (b) WQI spatial distribution; (c) WQI value and main factor (Cl, F, NO3−N and Cd) distribution chart.
Water 16 02573 g005
Figure 6. Scatterplots of CAI 1 versus CAI 2 to verify cation exchange. Ca2+ versus Mg2+ to evaluate the role of calcite and dolomite dissolution in groundwater chemistry.
Water 16 02573 g006
Figure 7. Evaluation results for each risk factor: (a) noncancer hazard quotient indices; (b) carcinogenic risk indices; (c) health risk assessment at each point.
Water 16 02573 g007
Figure 8. The distribution of Adult_HQ, Adult_CR, Child_HQ and Child_CR.
Water 16 02573 g008
Figure 9. Distribution map of comprehensive groundwater pollution.
Water 16 02573 g009
Figure 10. The conceptual model of groundwater environmental effects in saline–fresh water mixing zones.
Water 16 02573 g010
Table 1. Parameter values for the health risk assessment model.
ParametersAdultChildUnits
Ingestion rate (IR)2.50.78L/d
Exposure frequency (EF)350350d/a
Exposure duration (ED)266a
Average body weight (BW)8015kg
Average time (AT)87602190d
Table 2. Reference dose of noncarcinogenic index and slope factor of carcinogenic index.
ElementsRfDiSFiUnits
Cr0.0030.5(mg·kg−1·d−1)
As0.00031.5(mg·kg−1·d−1)
Cd0.00056.1(mg·kg−1·d−1)
Mn0.02-(mg·kg−1·d−1)
Fe0.3-(mg·kg−1·d−1)
Pb0.0014-(mg·kg−1·d−1)
Cu0.04-(mg·kg−1·d−1)
Zn0.3-(mg·kg−1·d−1)
F-0.04-(mg·kg−1·d−1)
NO3-N1.6-(mg·kg−1·d−1)
Cl-0.1-(mg·kg−1·d−1)
NO2-N0.1-(mg·kg−1·d−1)
Se0.005-(mg·kg−1·d−1)
Table 3. Minimum, median, maximum and average values of heavy metals and chemical variables in 47 groundwater samples.
Chemical IndicatorsUnitMaxMinAverageMedianWHO
K+mg/L24.550.513.22112
Na+mg/L1548.4139.37350.16268.35200
Ca2+mg/L448.4527.33134.88118.575
Mg2+mg/L293.311.78105.483.8120
Femg/L0.140.0040.030.0210.3
Clmg/L2171.1632.29461.85322.24250
SO42−mg/L992.1539.13261.31178.71250
HCO3mg/L927.22148.01499.07477.4200
Fmg/L5.410.592.282.311.5
NO2-Nmg/L1.160.0030.090.0073
NO3-Nmg/L134.250.9640.3935.1750
TDSmg/L50822661749.8514891000
Cumg/L0.020.0090.0110.0092
Znmg/L0.4820.0010.0370.0064
Mnmg/L1.620.00050.0860.0030.4
Pbμg/L1.680.090.2210.090.01
Cdμg/L24.30.051.9120.050.003
Asμg/L5.90.090.9840.710.01
Seμg/L1120.0518.3545.940.04
pH8.726.947.687.636.5–8.5
Table 4. The weights of each of the parameters used for the WQI determination.
ParameterWeight (wi)Wi
K+20.0444
Na+20.0444
Ca2+30.0667
Mg2+30.0667
Cl50.1111
SO42−50.1111
HCO310.0222
F50.1111
NO3-N50.1111
TDS40.0889
Mn50.1111
Pb50.1111
Total451
Table 5. The regression coefficient of each factor.
IndicatorRegressive CoefficientStandard Error
Mn0.002380.00007
Fe0.000020.00286
Pb0.000060.00114
Cu0.000020.00319
Zn0.000060.00108
F0.006330.00001
NO3-N0.004610.00001
Cl0.998000.00000
NO2-N0.000360.00043
Se0.001070.00007
Disclaimer/Publisher’s Note: The statements, opinions and data contained in all publications are solely those of the individual author(s) and contributor(s) and not of MDPI and/or the editor(s). MDPI and/or the editor(s) disclaim responsibility for any injury to people or property resulting from any ideas, methods, instructions or products referred to in the content.

