Abstract
Backfill mining is an important means of ensuring the high efficiency and safety of the coal mining under thin bedrock and loose aquifers. Based on the case study of Taiping Coalmine, the theoretical analysis of entropy and numerical modeling methods are adopted to establish the visualization model of temporal–spatial cube of stress and displacement induced by the multiple layers backfill mining. Moreover, the quantitative characterization and measurement framework of symmetric KL-divergence is established based on information entropy and mutual information. The results show that: (1) The non-uniformity of stress and displacement is enhanced due to the multiple layers backfill mining, showing certain fluctuation characteristics. (2) The KL-divergence of stress to displacement is slightly greater than that of displacement to stress, and the hotspot distribution law of stress–displacement related efficiency is consistent with KL-divergence. (3) The hotspots of stress entropy and the gap between stress entropy and displacement entropy in multiple layers backfill mining decrease obviously. (4) Stress plays a main role in displacement, and displacement is a linkage response to stress due to the coordinated deformation. Multiple layers backfill mining results in an enhanced correlation degree and more chaotic state between stress and displacement. The results will provide engineering geological basis for optimal design and safe production of backfill mining under loose aquifers.
1. Introduction
Mine safety and efficient exploitation are eternal themes of the coal mining underground [1]. Green mining technology, based on filling mining, is an inevitable path to achieve China’s secure energy supply and efficient development [2]. China has fully developed filling mining technology, solving a large amount of coal under buildings, railways, and water bodies, thereby improving the coal extraction rate [3,4]. However, a large amount of coal resources is located under thick loose aquifers. The current national standards, which mandates a minimum bedrock thickness of 20 m for all types of coal pillars, under both filling and non-filling mining conditions, are being enforced indiscriminately. This leads to unreasonable filling mining designs, causing resource wastage and restricting energy development. Moreover, filling mining under loose aquifers faces the risk of overburden failure and connectivity with the aquifer, causing water and sand inrush disasters, roof accidents, surface subsidence, and ecological damage, thereby rendering the safety situation in China’s coal production still severe.
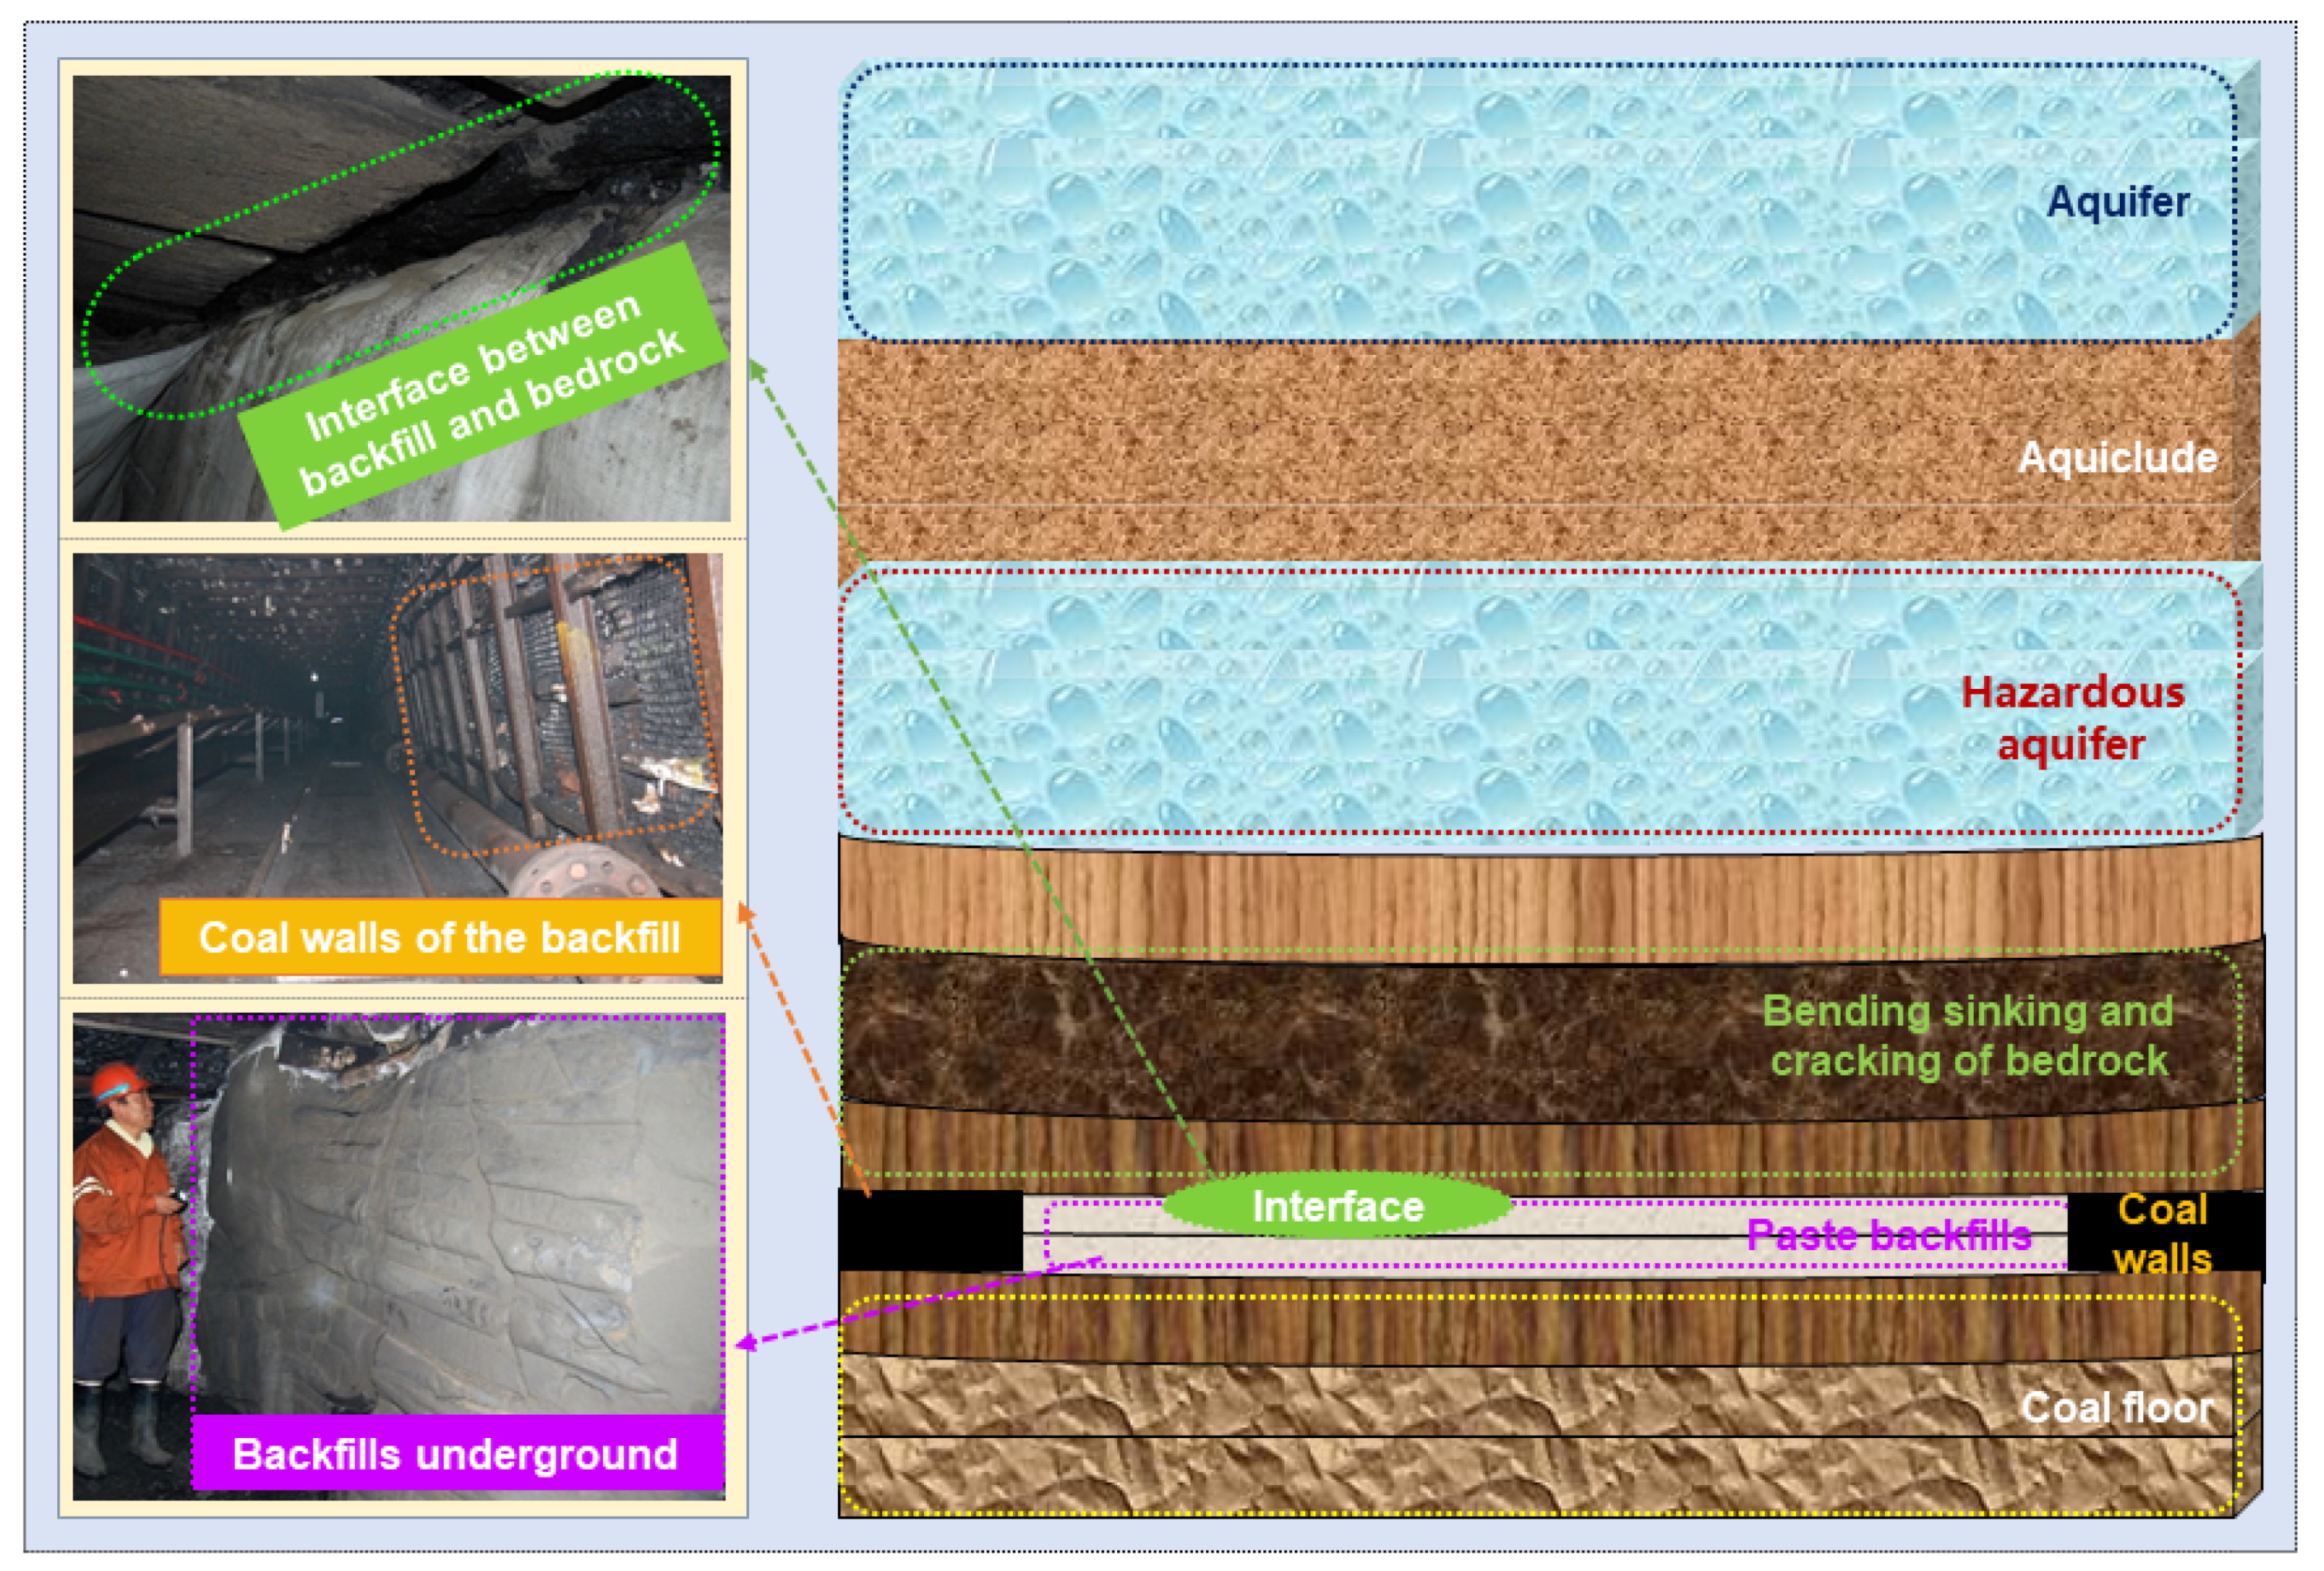
The purpose of filling mining is to control the movement and deformation of the overlying strata, prevent the height of the overburden failure from reaching the aquifer, reduce mine water and sand inrush, and surface subsidence incidents, and effectively protect the ecological environment within the influence range of mining [5,6]. During the filling mining process, the backfill combines with the surrounding rock, generating cohesive force and friction force at the interface [7,8]. As the strength of the filling body hardens, the strength gap between the two gradually narrows, and stress coordination occurs, leading to interface effects and stress transfer. When the complex stress conditions at the boundary exceed a certain degree, it may cause coordinated deformation between the two, resulting in shear or tensile failure at the interface, delamination of the filling body and surrounding rock, eventually leading to failure and instability of the surrounding rock structure near the filling stope [9,10], as shown in Figure 1. The backfill and the surrounding rock or the residual coal pillar bear the load together as a surrounding rock structure, coordinate deformation and breakage, thus controlling the movement and deformation of the rock layers [11,12,13]. It is very important to analyze the stress of filling body and surrounding rock structure for deformation control and disaster prevention and control of rock mass structure. Based on the mechanical model, combined with GPS monitoring data and three-dimensional analysis technology of surface movement, the stress and displacement distribution laws within the surrounding rock structure are analyzed to obtain the vertical and horizontal stress of the filling body under surface load [14,15,16,17]. The research on room-pillar filling mining indicates that the stress in the stope follows a logarithmic distribution [18]. According to the filling mining experience in Jinchuan, the stress distribution of the filling body is uneven, and the whole backfill body is in a relatively low-stress state.

Figure 1.
Backfills and surrounding rocks structure due to the paste backfill mining.
Research on the temporal–spatial evolution law of overburden deformation in backfill mining mostly adopts methods such as numerical simulation and model experiments to qualitatively study the spatial distribution form of the structure and its evolution law with the mining process, as well as the stage characteristics and control factors [19,20,21,22]. Methods such as time series, grey system theory, Kalman filtering, and the Knothe improved model combined with the backfill mining rock layer movement model are often used to study the simulation and prediction of dynamic subsidence and the process expression of dynamic evolution [23]. During the mining process, the hydrogeological structure will also have a linkage response to stress and deformation, changing the permeability properties of the surrounding rock structure and the geological characteristics of the water-bearing and water-separating layers, forming channels for water inflows and sand bursts [24].
Long-term coal resource extraction has provided abundant field experience and guidance for the development and construction of underground and even deep engineering projects. The accumulation of field measurement and numerical simulation analysis results for many years provides a large amount of data and experience support for the prediction and evaluation of filling mining safety [25,26]. However, the theoretical analysis lagging far behind engineering experience leads to safety prediction and evaluation of coal resource extraction being mostly based on expert experience or fuzzy methods, and the subjective evaluation often overlooks the complexity and nonlinearity of engineering. After filling activities, rock stratum movement will be inhibited under the support of the backfill [27]. The height of the water-conducting fractured zone is an important key parameter for setting a reasonable safety extraction range and increasing the extraction limit, and is also an important technical parameter for predicting mine safety and mine design [28]. The height, evolution characteristics, and three-dimensional spatial development characteristics of the water-conducting fractured zone are affected by mining height and filling rate [29,30].
However, for paste filling mining under loose aquifers, the significantly reduced height of roof and floor strata failure due to the coordinated deformation of surrounding rock and filling body, and the potential for low water inrush and sand inflow, have not been established by definite and reliable scientific laws. The vague qualitative basis cannot serve as a direct basis for production decisions. The deep-seated coordinated deformation evolution mechanism and the disturbance and control mechanism of filling mining on aquifers and surrounding rock are not yet clear, severely restricting the safe and efficient development and optimized design of filling mining. This is an urgent bottleneck issue that needs to be addressed.
For backfill mining, the stress and displacement linkage response between the backfill and the surrounding rock structure, and the mutual influence and restriction between the two are interconnected. The response of displacement to mining and stress shows obvious hysteresis effect. This study focuses on the issues of how to quantify and express the information state of stress and displacement, analyze the correlation degree of stress–displacement, characterize the evolution degree and state of displacement and stress, and the control effect of stress on displacement. A temporal–spatial cube visualization model of stress and displacement is constructed considering the time effect and spatial characteristics of surrounding rock structure. Then the correlation characteristics and the correlation degree and state of stress and displacement are analyzed and quantified, and the temporal–spatial information measurement framework of stress and displacement correlation degree is established.
2. Materials and Methods
2.1. Engineering Geological Conditions
The Taiping Coalmine in Shandong province involves typical thick loose aquifer mining under thin bedrock, and is the first coalmine to use the paste backfill mining method in China. It is threatened by the water and sand inrush disaster, which urgently need quantitative predication and prevention measures. The main mining seam is the 3rd coal seam of the Permian Shanxi Formation, with a thickness of 7.27~9.97 m, averaging 8 m. The coal seam has a strike of 5º~171º and a dip direction of 95~261° with a dip angle of 0~15°, averaging 3°. The coal seam is buried at a depth of 161.5~211.5 m. The immediate roof is composed of siltstone or mudstone, with a thickness of 2~3 m. The main roof is fine to medium sandstone, with a thickness of 10~26 m. Due to the denudation of the upper strata of Shanxi Formation, the coal seam is buried shallowly, and much of the fine to medium sandstone in the old roof has weathered, greatly reducing its strength. The compressive strength of weathered medium sandstone is 19.7 MPa, tensile strength is 1.09~3.92 MPa, elastic modulus is 1470 MPa, Poisson’s ratio is 0.3, and it is prone to disintegration. The siltstone and mudstone have a compressive strength of 12.5 MPa, a tensile strength of 0.39 MPa, an elastic modulus of 1434 MPa, a Poisson’s ratio of 0.3, and are also prone to disintegration. There is a weathered zone in the upper part of the bedrock in contact with the Quaternary system. The thickness of the weathering zone is 2.41~28.39 m, with an average thickness of 13.63 m. The thickness of the Quaternary topsoil is 147.00~166.15 m, with an average thickness of 154.91 m. The coal seam outcrop directly connects to the bottom of the Quaternary, posing dual challenges of mining beneath villages and loose aquifers. The paste backfill mining design and construction commenced in 2005 in the Taiping Coalmine to resolve the coal mining issues under villages and water bodies. The mining proceeded from top to bottom in four layers of paste filling, with a single layer mining height of 2.2 m, totaling 8.8 m mining height, with a total coal output of 287,139 t. During the mining of the lower layers, the upper layer backfill body served as the direct roof for the lower layers, with no significant water inflow observed during mining.
2.2. Acquisition and Representation of the Temporal–Spatial Information
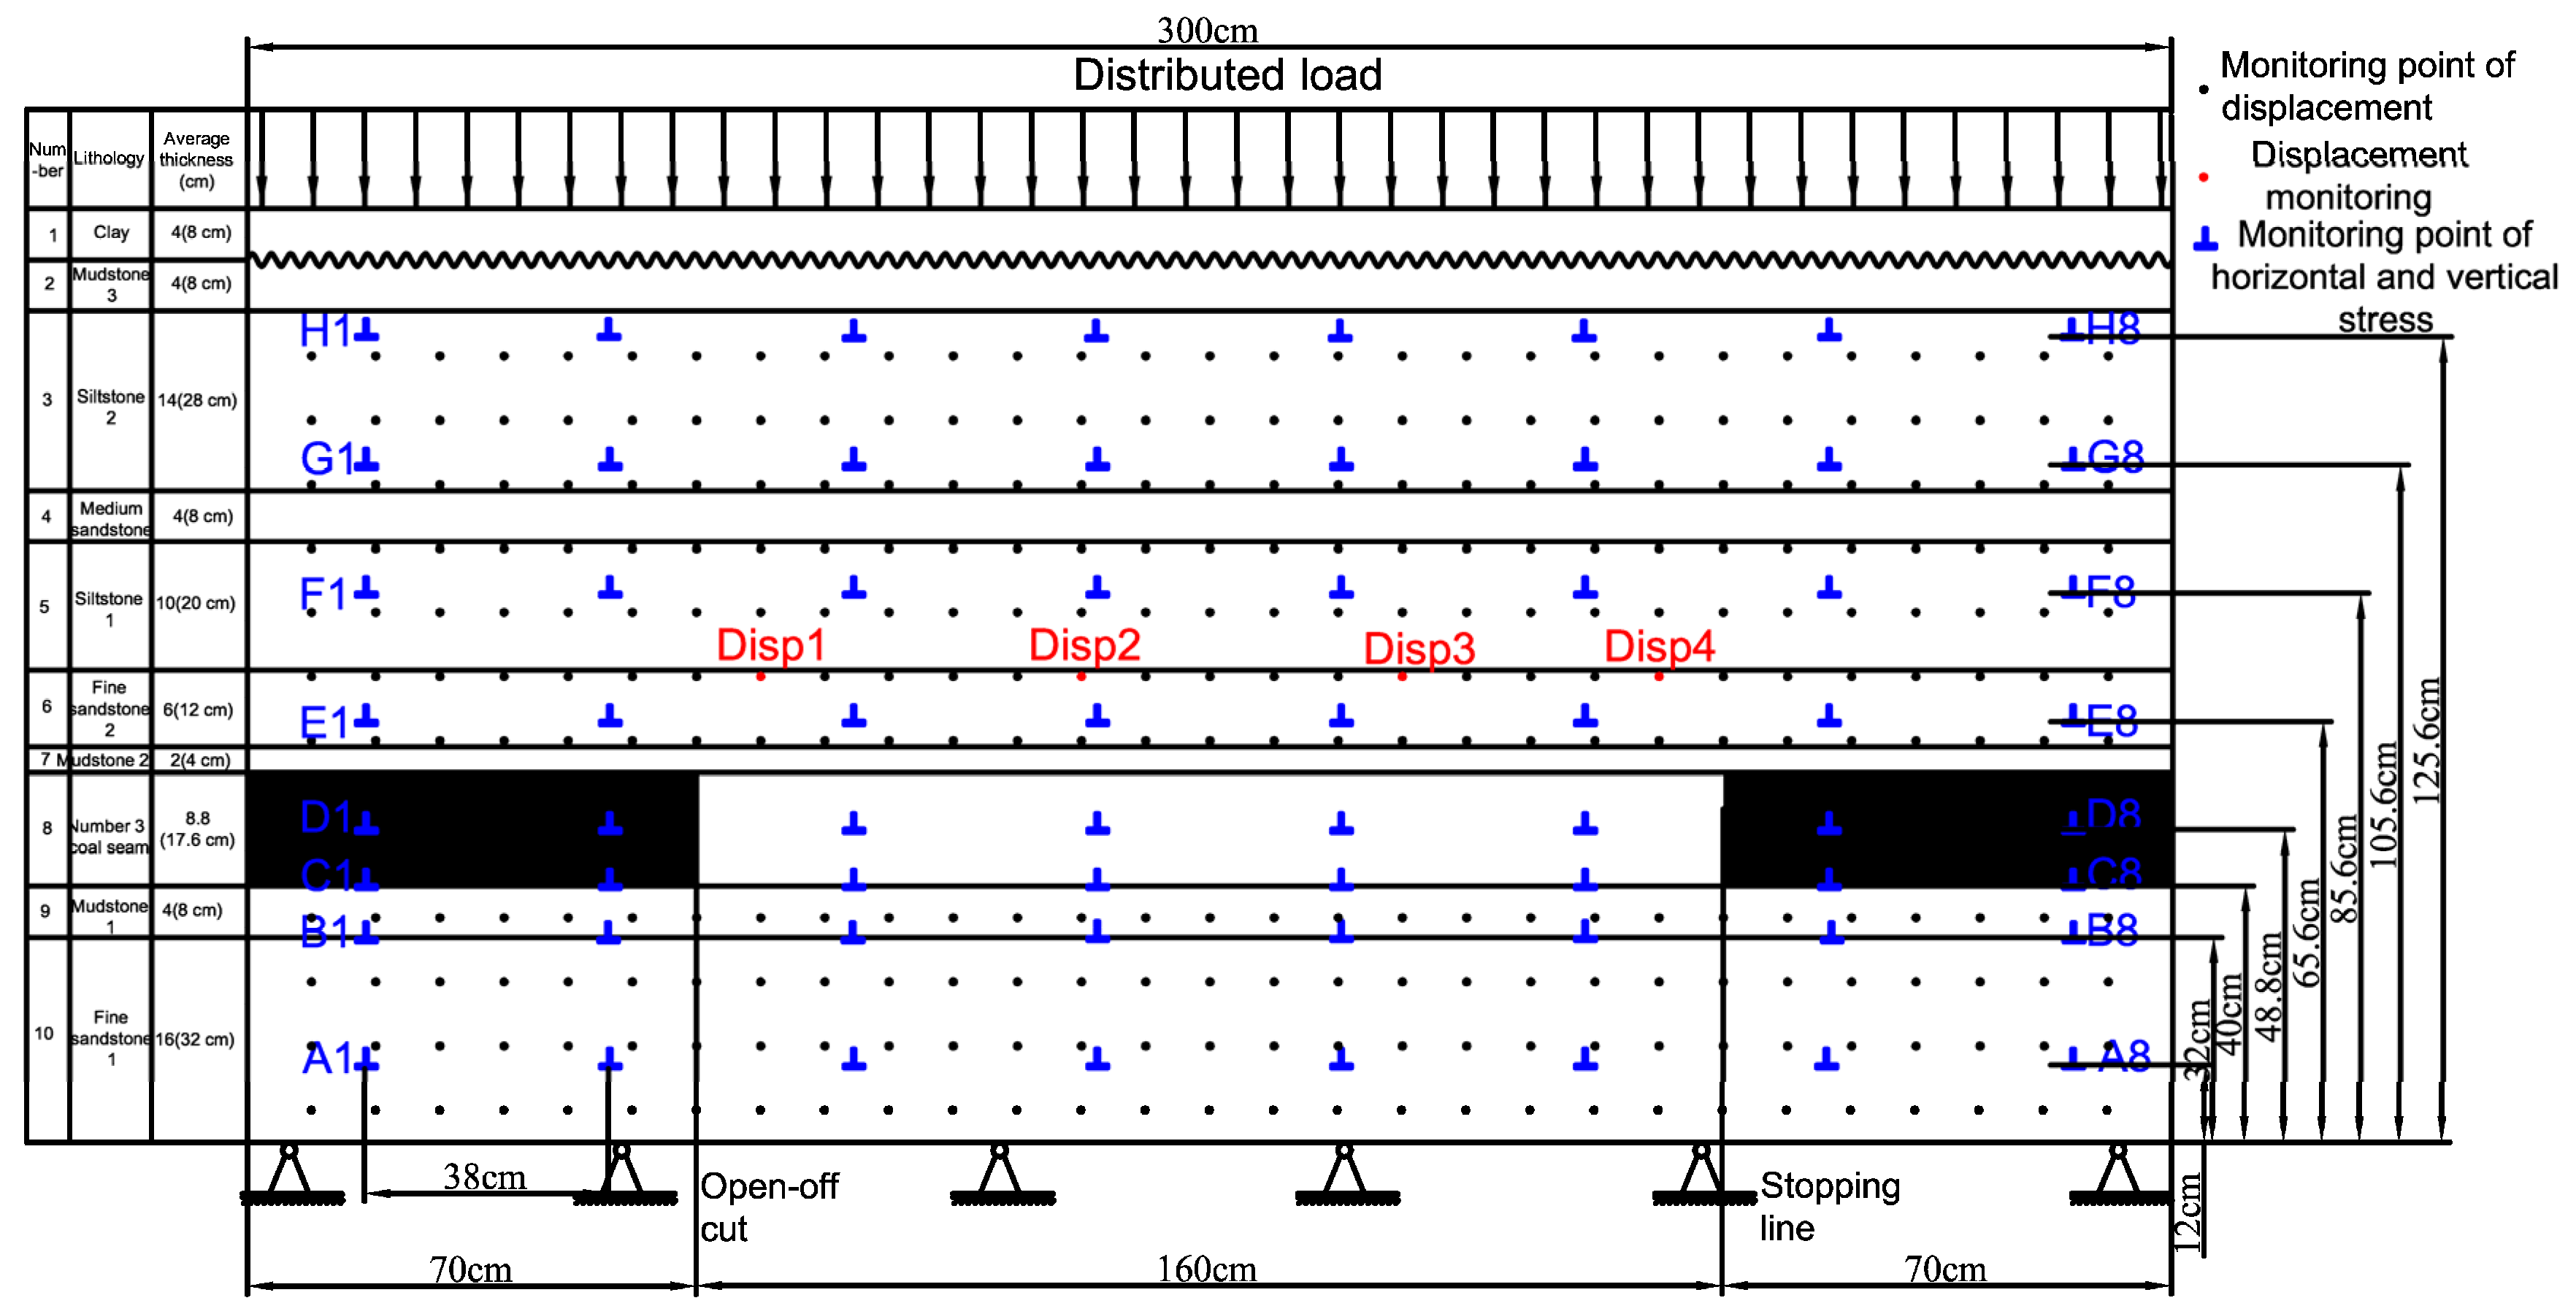
Based on the geological conditions of Taiping Coalmine in Shandong Province, a scale model of multiple layers backfill mining was conducted with a bedrock thickness of 40 m, clay bottom thickness of 6 m, and a loose layer thickness of 158 m. The similarity ratios for geometric, time and density were 50, 7.07, 1.67, respectively. Then the stress similarity ratio was identified as 75. The length × width × height of the model frame was 300 cm × 30 cm × 200 cm, and the height can be adjusted.
A total of 11 survey lines were set up to observe the overburden damage and deformation, with vertical and horizontal spacing of 10 cm. Eight survey lines were set up within the range of the top and bottom of coal seam, including 2 lines on the bottom plate (with an interval of 10 m), 2 lines on the backfill body (with an interval of 4.4 m), and 4 lines on the roof to the bottom of the clay layer. A total of 128 monitoring points (64 horizontal and 64 vertical) were used to monitor the evolution process of stress. The model and monitoring of displacement and stress are shown in Figure 2.
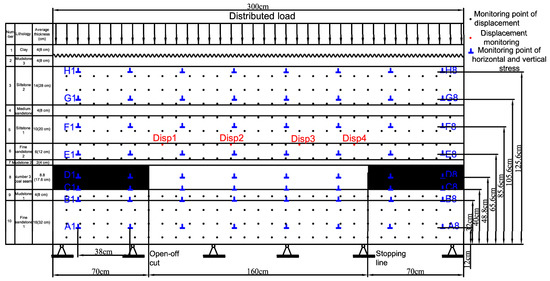
Figure 2.
Diagram of scale model of the Taiping Coalmine.
Spatio-temporal random variables refer to an attribute value f changing with sample unit p and time t [31], as shown in Formula (1).
where Dp is the spatial domain of the study area, Dt is the time domain of the study area, R is the real number, and d is the dimension.
The spatial–temporal velocity of stress and displacement change were constructed to characterize the evolution characteristics of time and space, as shown in Formulas (2) and (3).
2.3. Information Measurement of Stress and Displacement in the Surrounding Rock Structure
Shannon first proposed the measurement method of information entropy [32,33], which describes the uncertainty of random events and the dispersion degree of random variables, and is also used to characterize the state and chaos degree of the system. The greater the information entropy, the more chaotic the system.
Assuming A describe the discrete random variable, its information entropy was defined as Formula (4).
Suppose that the joint probability distribution of random vectors (A, B) is pij (i = 1, 2, …, m; j = 1, 2,…, n), then the two-dimensional joint entropy H(A,B) is defines as Formula (5).
Then the conditional entropy of H(A|B) and H(B|A) can be defined as Formulas (6)–(9), respectively.
Generally, the relative reduction of entropy is more meaningful and more widely applicable. The information ratio IR indicates the relative transfer efficiency between variables, as shown in Formulas (10) and (11).
The concept of mutual information is based on Kullback–Leibler divergence, abbreviated as KL-divergence, also known as relative entropy, which is a statistical measure used to quantify the difference between two random distributions [34], as shown in Formulas (12) and (13).
where “” denotes the relative KL-divergence between R and T, with R||T representing the KL-divergence of R relative to T, and T||R representing the KL-divergence of T relative to R, both of which are not equal and greater than 0. The larger the divergence, the higher the degree of correlation between the two, which can be used to measure the degree of disorder in the state.
Since the KL-divergences of the two are not equal, the symmetric KL-divergence is defined [34] to measure the degree of correlation, as shown in Formula (14).
Yang Binbin [35] proposed the concept of stress entropy, describing the spatial–temporal evolution of overburden stress during mining activities, as shown in Formula (15). During the backfill mining, the vertical displacement is also in a chaotic state, which contains rich information. On this basis, the concept of displacement entropy is proposed, as shown in Formula (16).
where, Kσ is the stress entropy, σi is the stress value, HDF is the displacement entropy, DF is the displacement value. The larger the entropy, the more chaotic the state.
Generally, stress and deformation information have different dimensions and cannot directly calculate the KL-divergence. The obtained data must be normalized first before analyzing the changes in entropy values. The stress increases and decreases after disturbance and belongs to a relatively balanced state at the initial stress. Therefore, the attribute of stress is fixed type and in a relatively balanced state when fluctuating around a fixed value, and its normalization process is shown in Formula (17). The displacement gradually increases with mining; the larger the displacement, the more stable the state, which is a cost type and its impact on the state is negatively correlated. The normalization process is shown in Formula (18).
The stress entropy and displacement entropy of the surrounding rock structure were calculated first, and then the KL-divergence and symmetrical KL-divergence of the stress and displacement were calculated respectively, and finally, the correlation efficiency of the stress and displacement was calculated as shown in Formulas (19) and (20).
3. Results
Considering the time effect and spatial characteristics of the coordinated deformation of the surrounding rock structure during multiple layers backfill mining, a temporal–spatial cube visualization model of the stress and displacement is constructed to visually display the temporal–spatial evolution process of the coordinated deformation of the surrounding rock structure.
The basic concepts of information entropy and mutual information are introduced to quantify the chaotic state of stress and displacement in the surrounding rock structure due to the multiple layers backfill mining. The evolution state of stress and displacement is quantified to characterize the main control mechanism of stress on displacement.
3.1. Temapoal and Spatial Evolution of Stress in Surrounding Rock Structural Stress due to Multiple Layers Backfill Mining
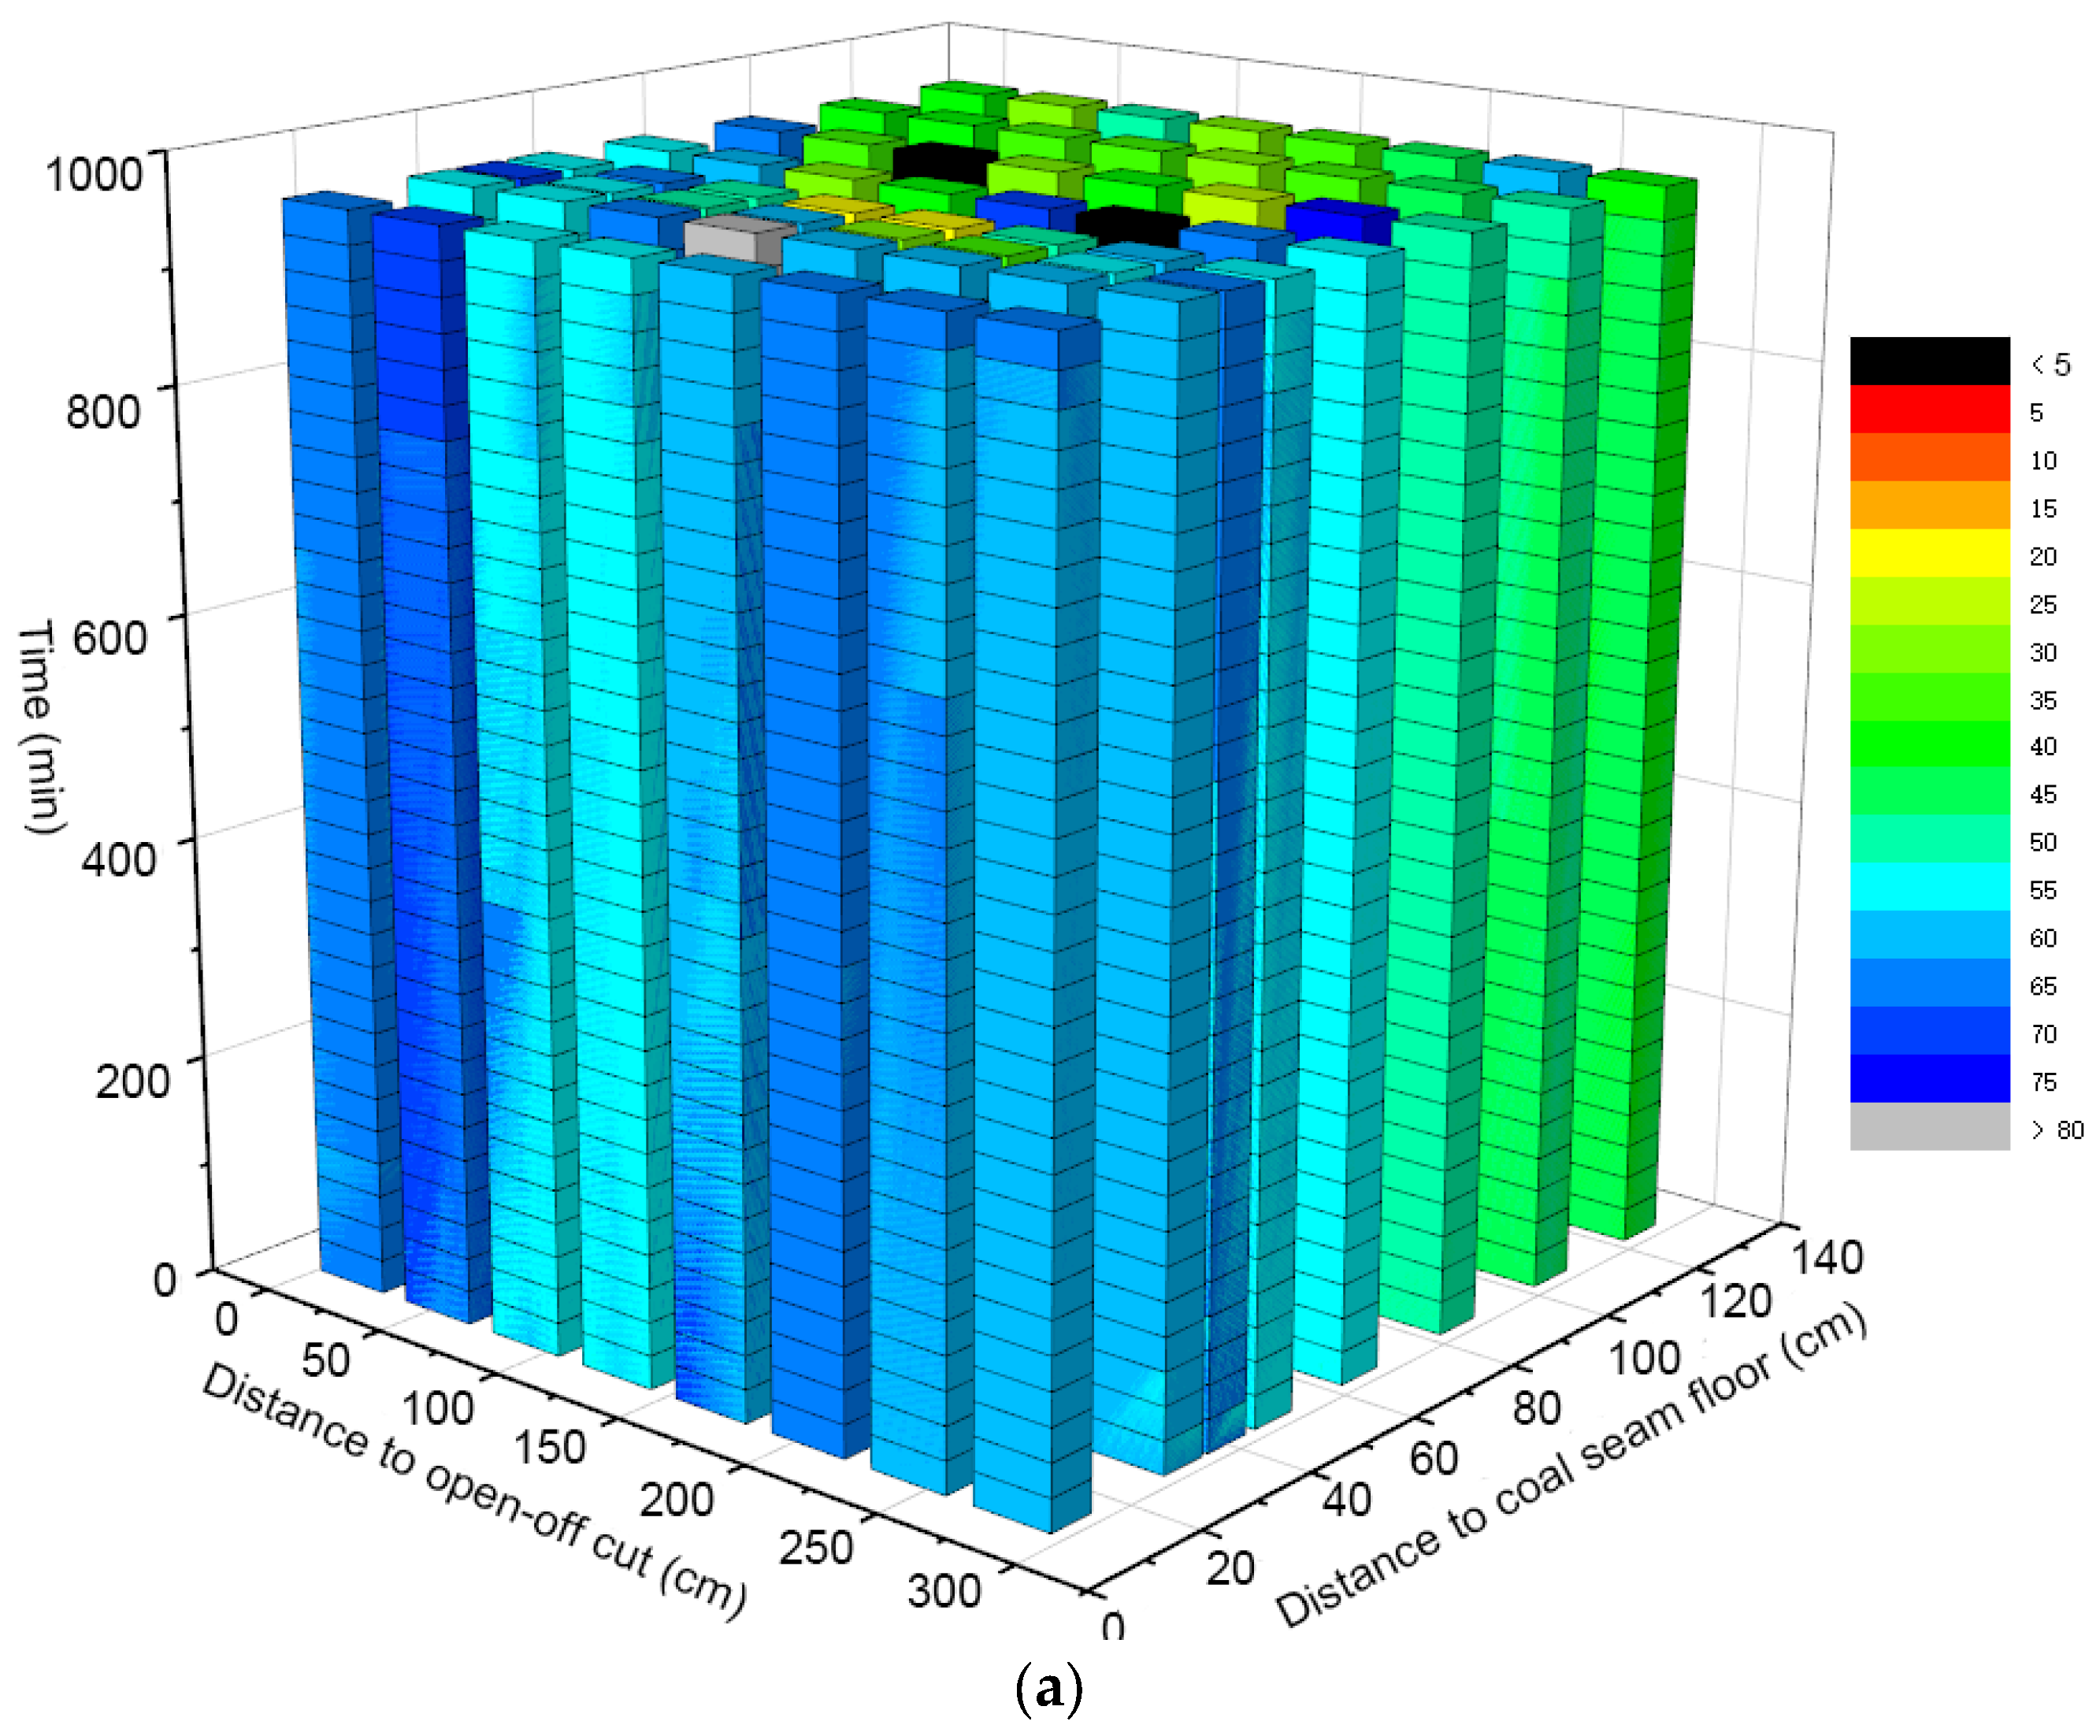
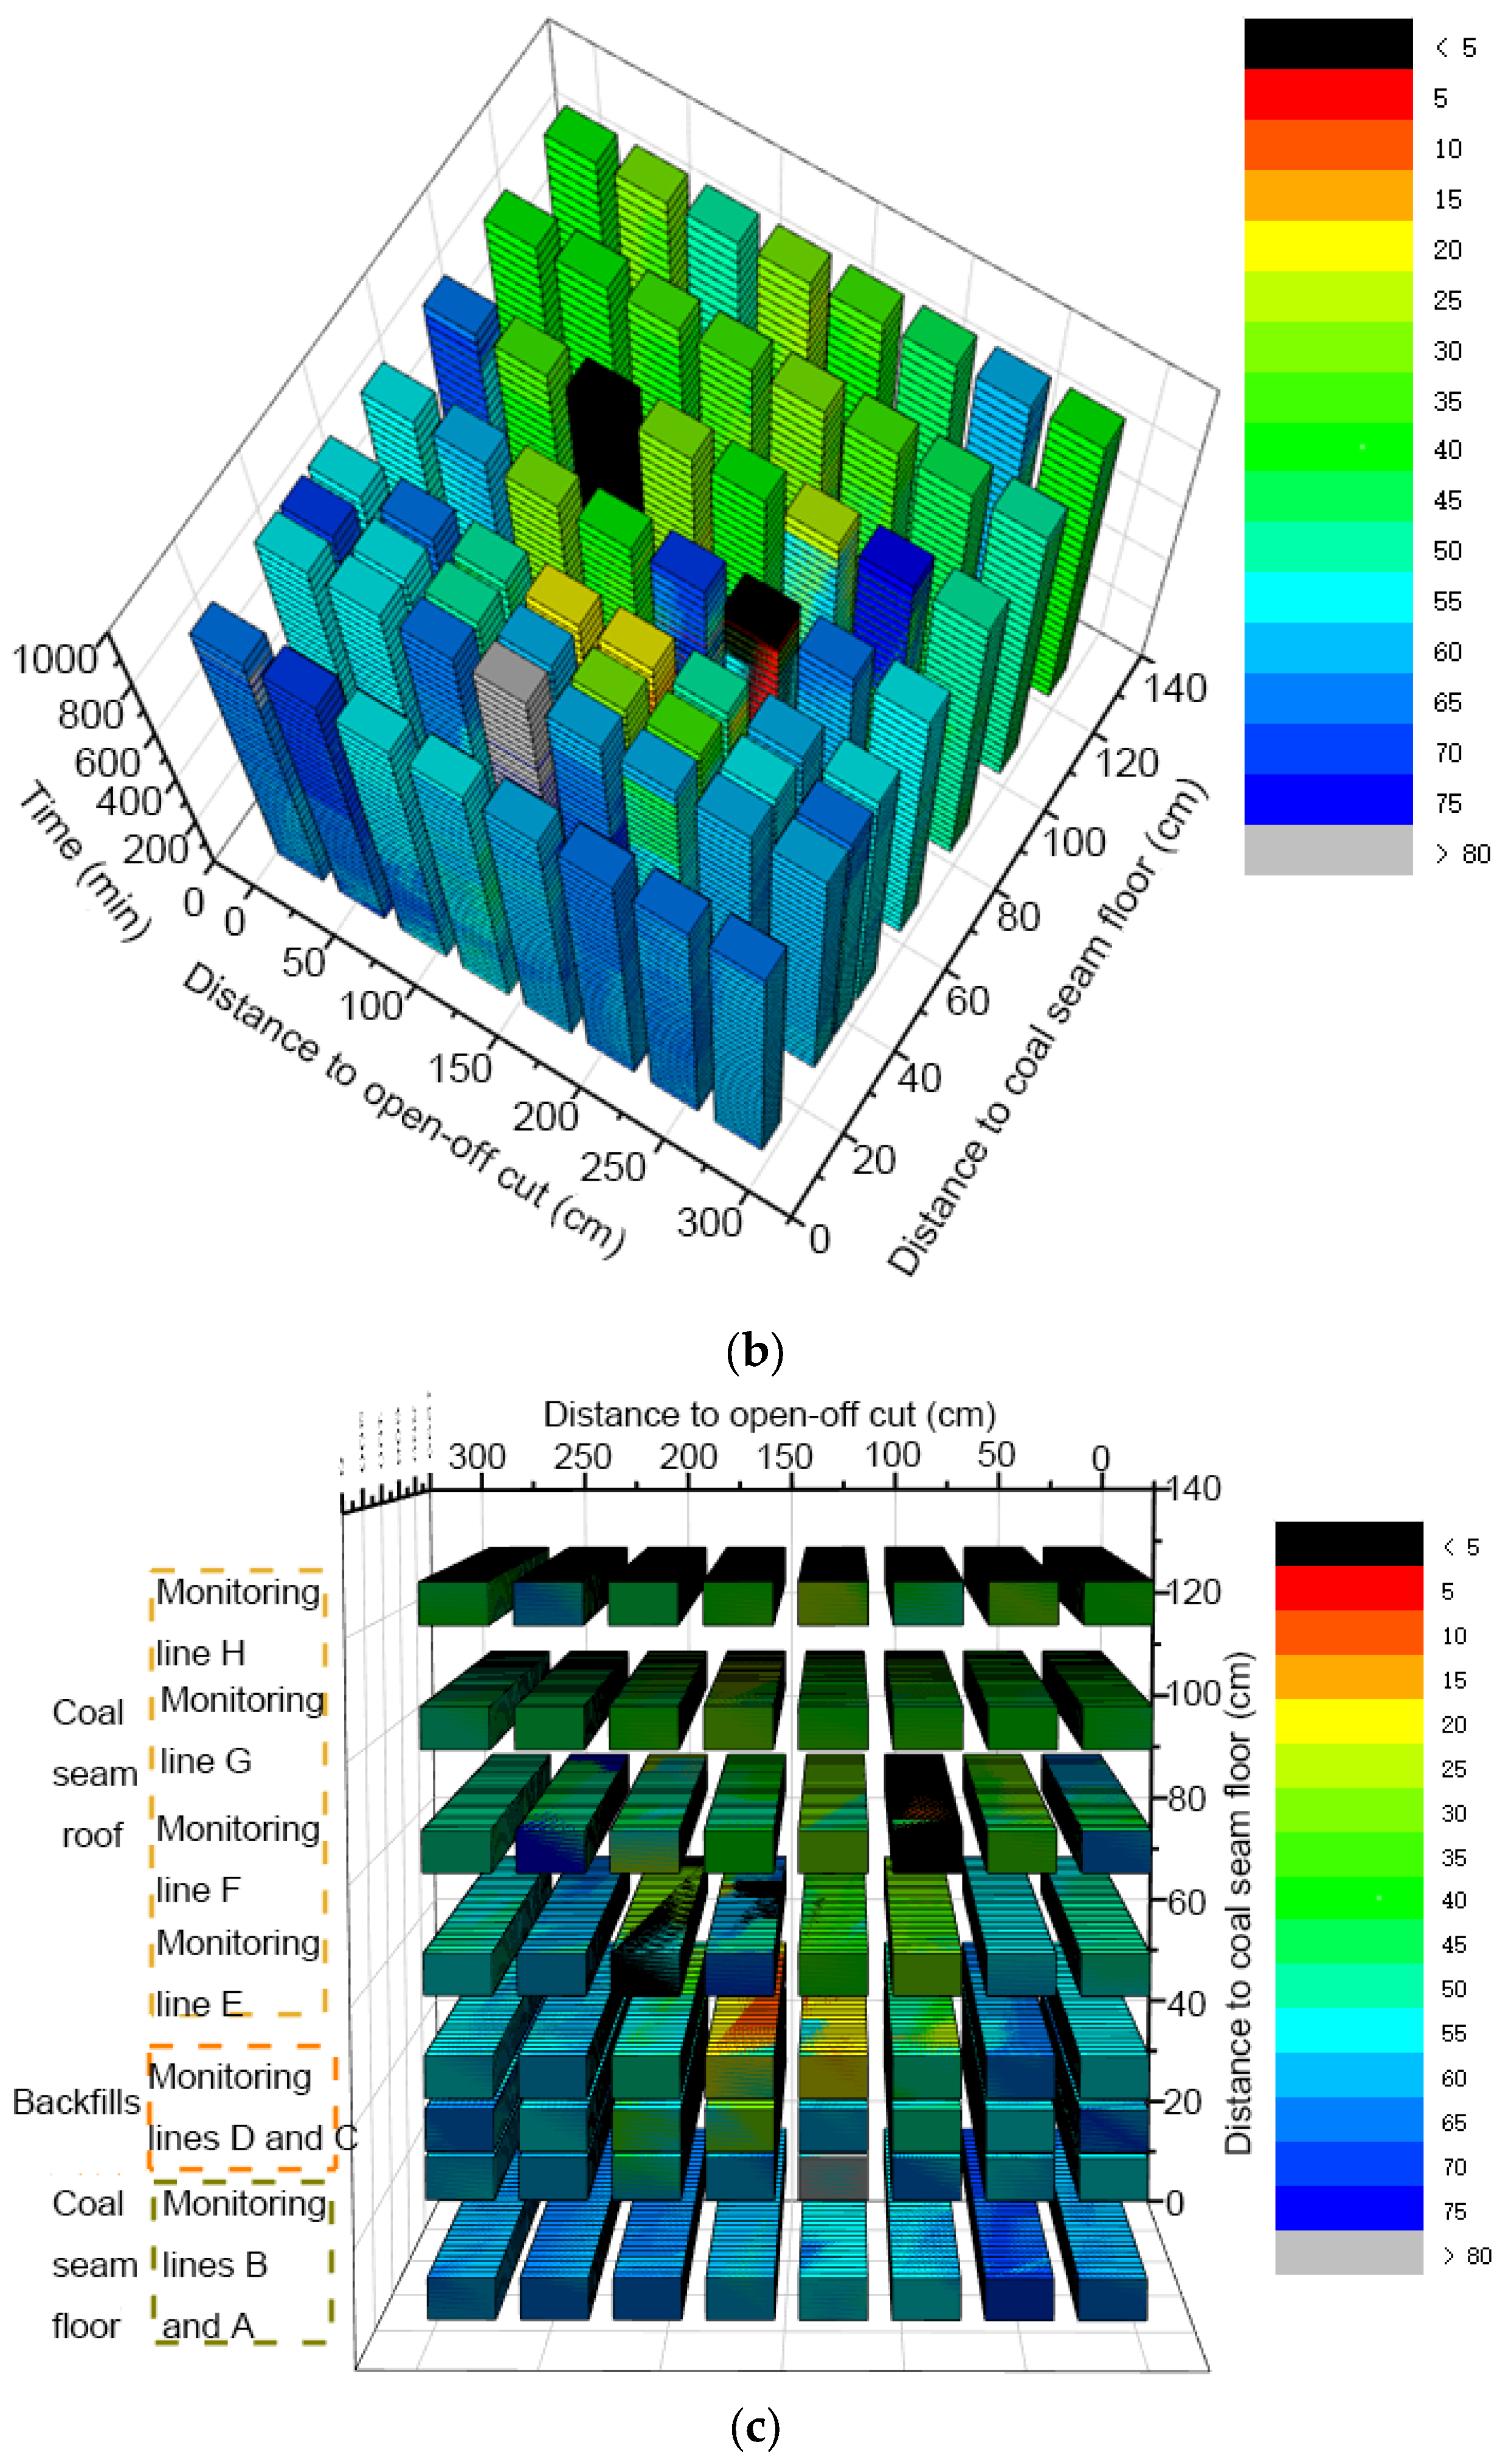
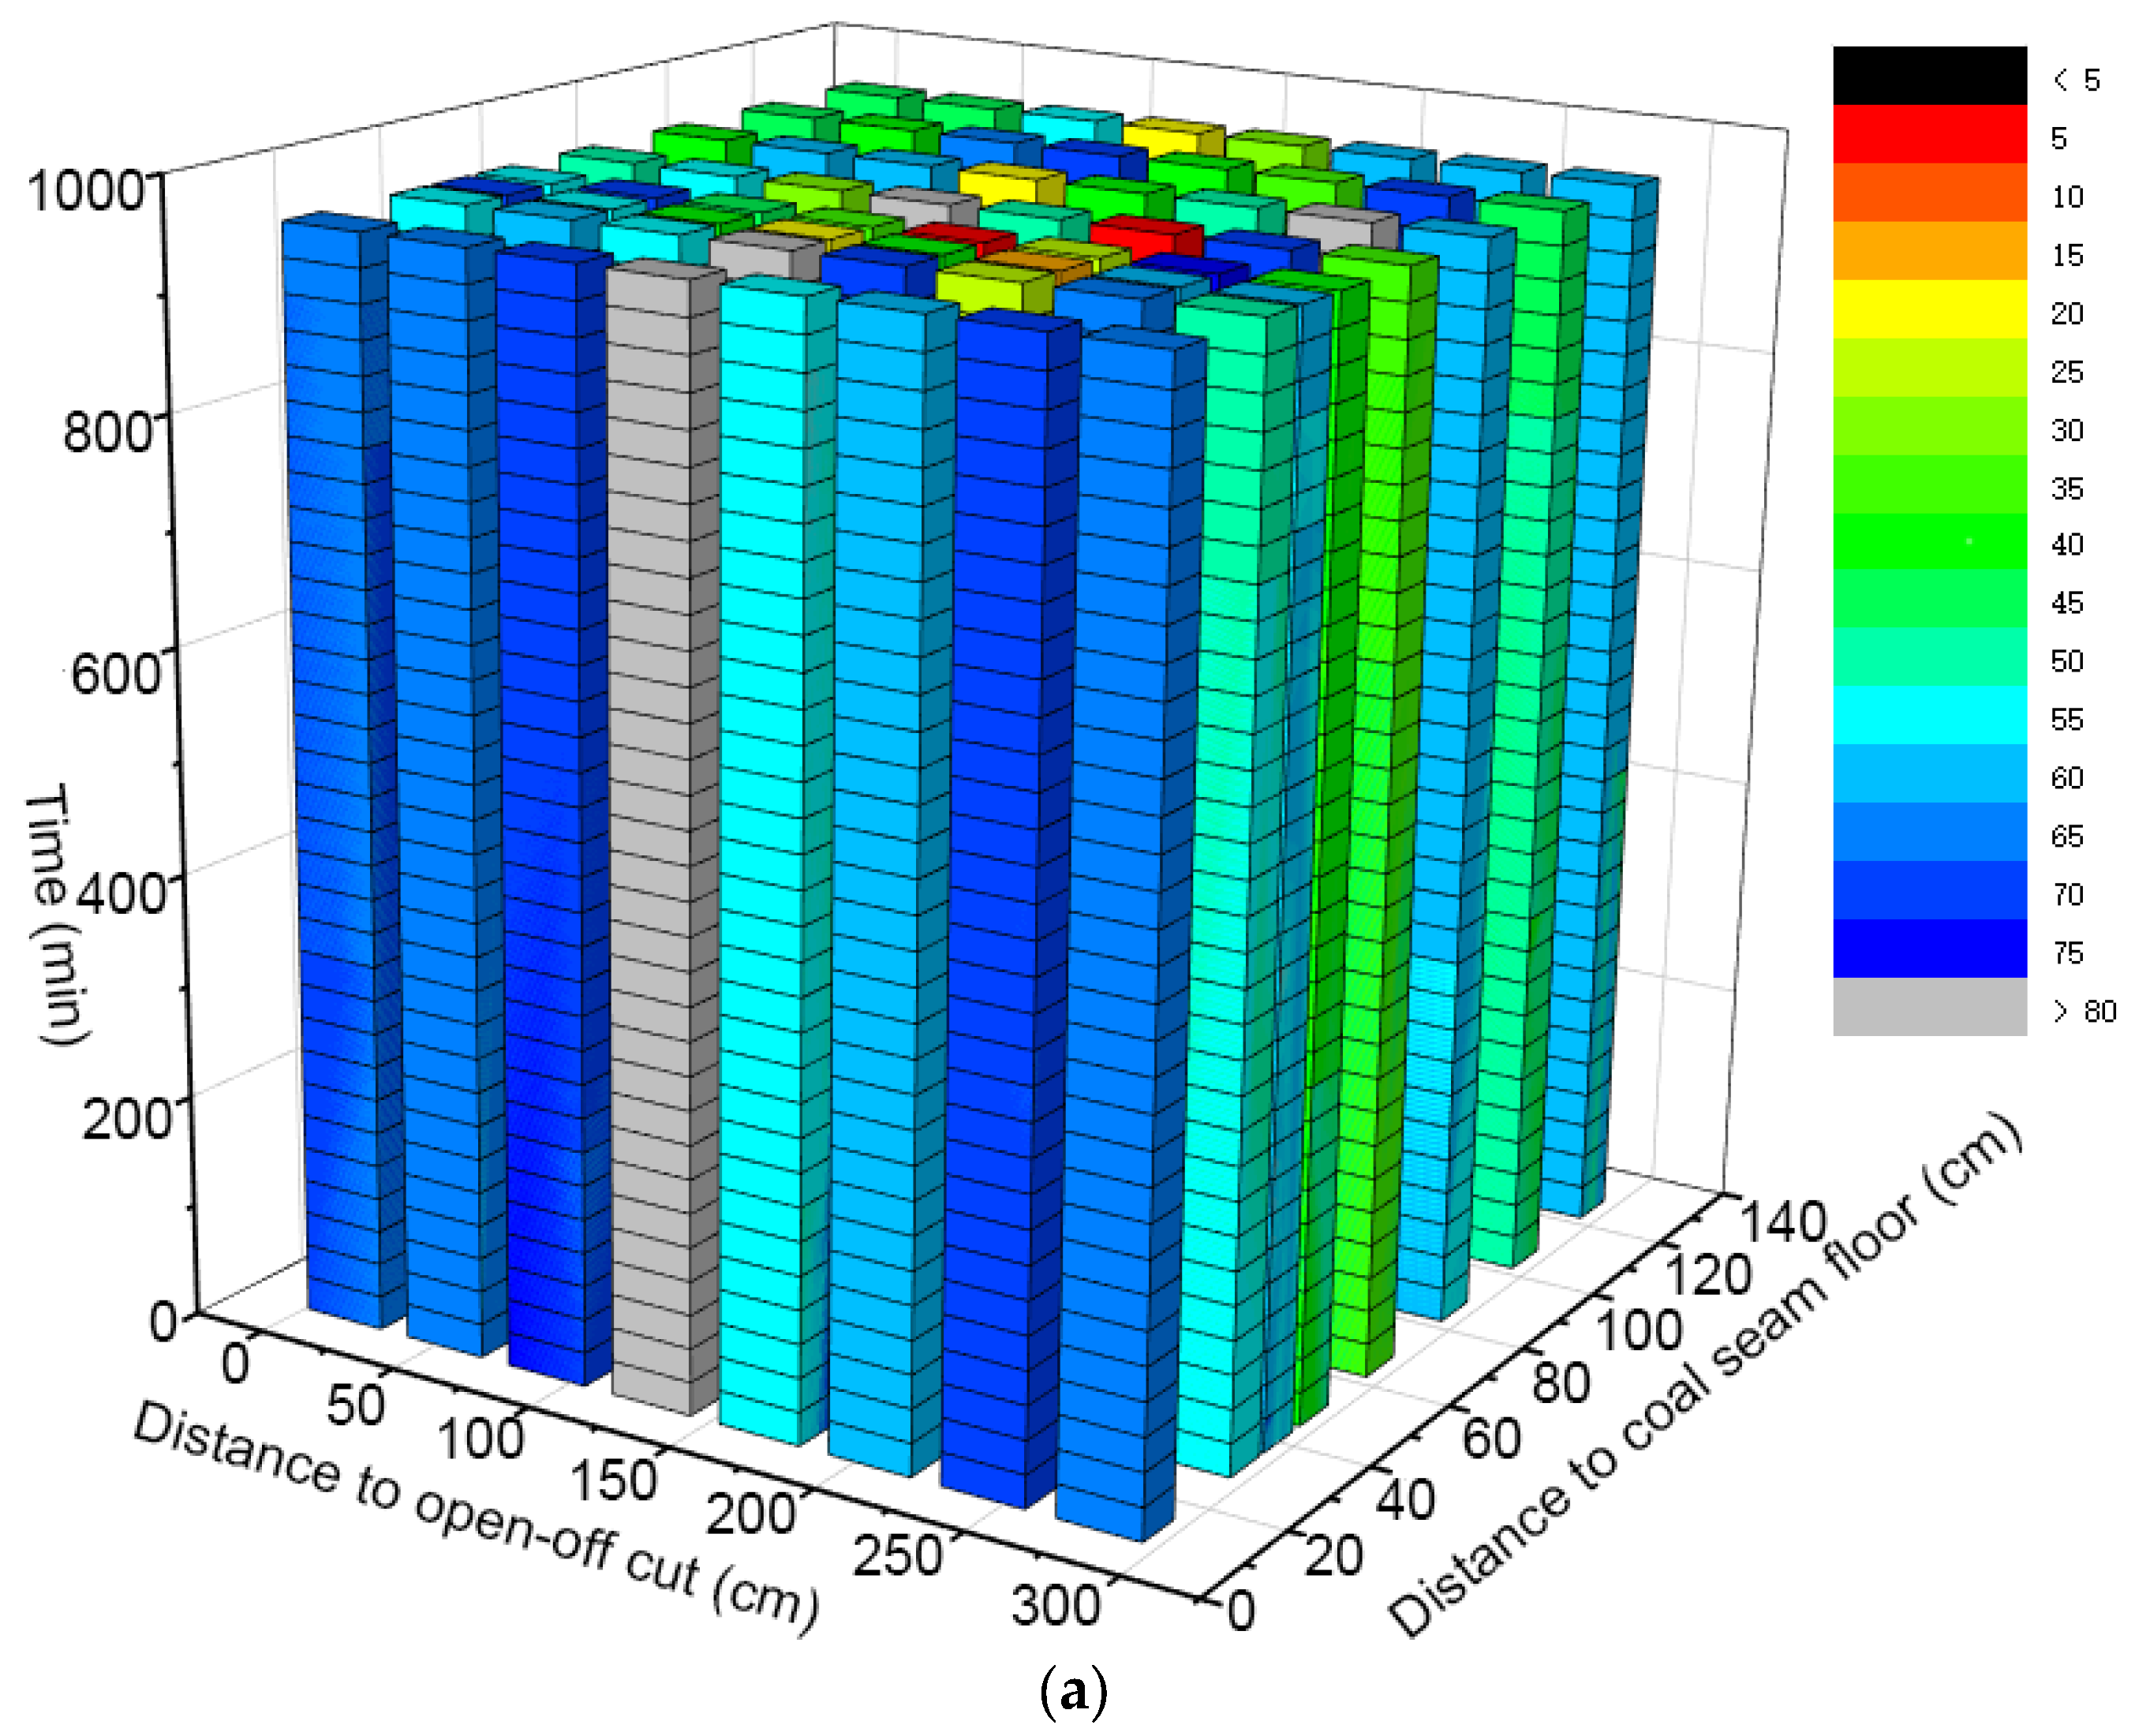
The temporal–spatial cube model of the structural stress of surrounding rock during the upper layer backfill mining is shown in Figure 3. Blue represents higher attribute values, indicating greater stress. As it transitions to green and red, the attribute values gradually decrease, indicating diminishing stress. In the time dimension, the color change in attribute values is not significant, with no distinct span in color systems. The attribute values of the floor of the surrounding rock structure show a slow growth trend overall, while the color at the positions of the coal seam and the backfill body fluctuates significantly, gradually transitioning to the minimum value in black, and the overall attribute values are smaller. The color of the roof slowly lightens, and the attribute values slowly decrease. This indicates that the stress changes in the surrounding rock structure are minimal over time. The stress change trends of the floor and the roof are opposite, and the positions of the coal seam and the backfill body exhibit fluctuation characteristics.
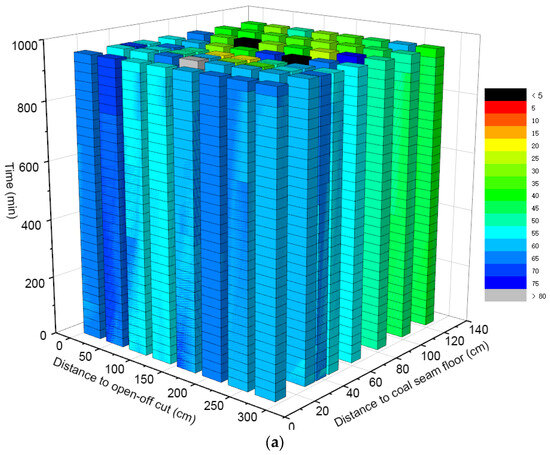

Figure 3.
Temporal–spatial cube model of stress in the surrounding rock structure due to the upper layer backfill mining. (a) Main view of the temporal–spatial cube model; (b) Top view of the temporal–spatial cube model (c) Elevation view of the temporal–spatial cube model.
In the spatial dimension, the floor of the surrounding rock structure is predominantly characterized by high attribute values of blue and green colors, with the blue color being relatively pale, indicating a high-stress area. The range of the coal seam and backfill body belongs to the mining disturbance area, with attribute colors evolving from green to black and primarily yellow to black, indicating a low-stress area with sporadic distribution, suggesting that the disturbance is uneven. The roof of the surrounding rock structure is mainly green, affected by mining disturbance, and belongs to the stress fluctuation area.
The attribute color changes of the surrounding rock structure are minimal, with local extreme values of attributes. The disturbance to the immediate roof is significant, while the color change is minimal farther from the roof, mainly characterized by medium green attribute values, indicating a lesser degree of mining disturbance. The amplitude of color changes in the spatial extension direction gradually decreases, transitioning to green, especially in the positions of the coal seam, the backfill body, and the immediate roof, showing characteristics of smaller attribute values in green and red, indicating a sharp reduction in stress. This is in the dynamic phase of stress absorption and transfer in the backfill body, with stress exhibiting certain fluctuation characteristics. Both sides of the spatial position are characterized by deeper blue high attribute values, indicating that the stress values on both sides of the panel are greater than those in the middle, consistent with the stress distribution characteristics of the mining field.
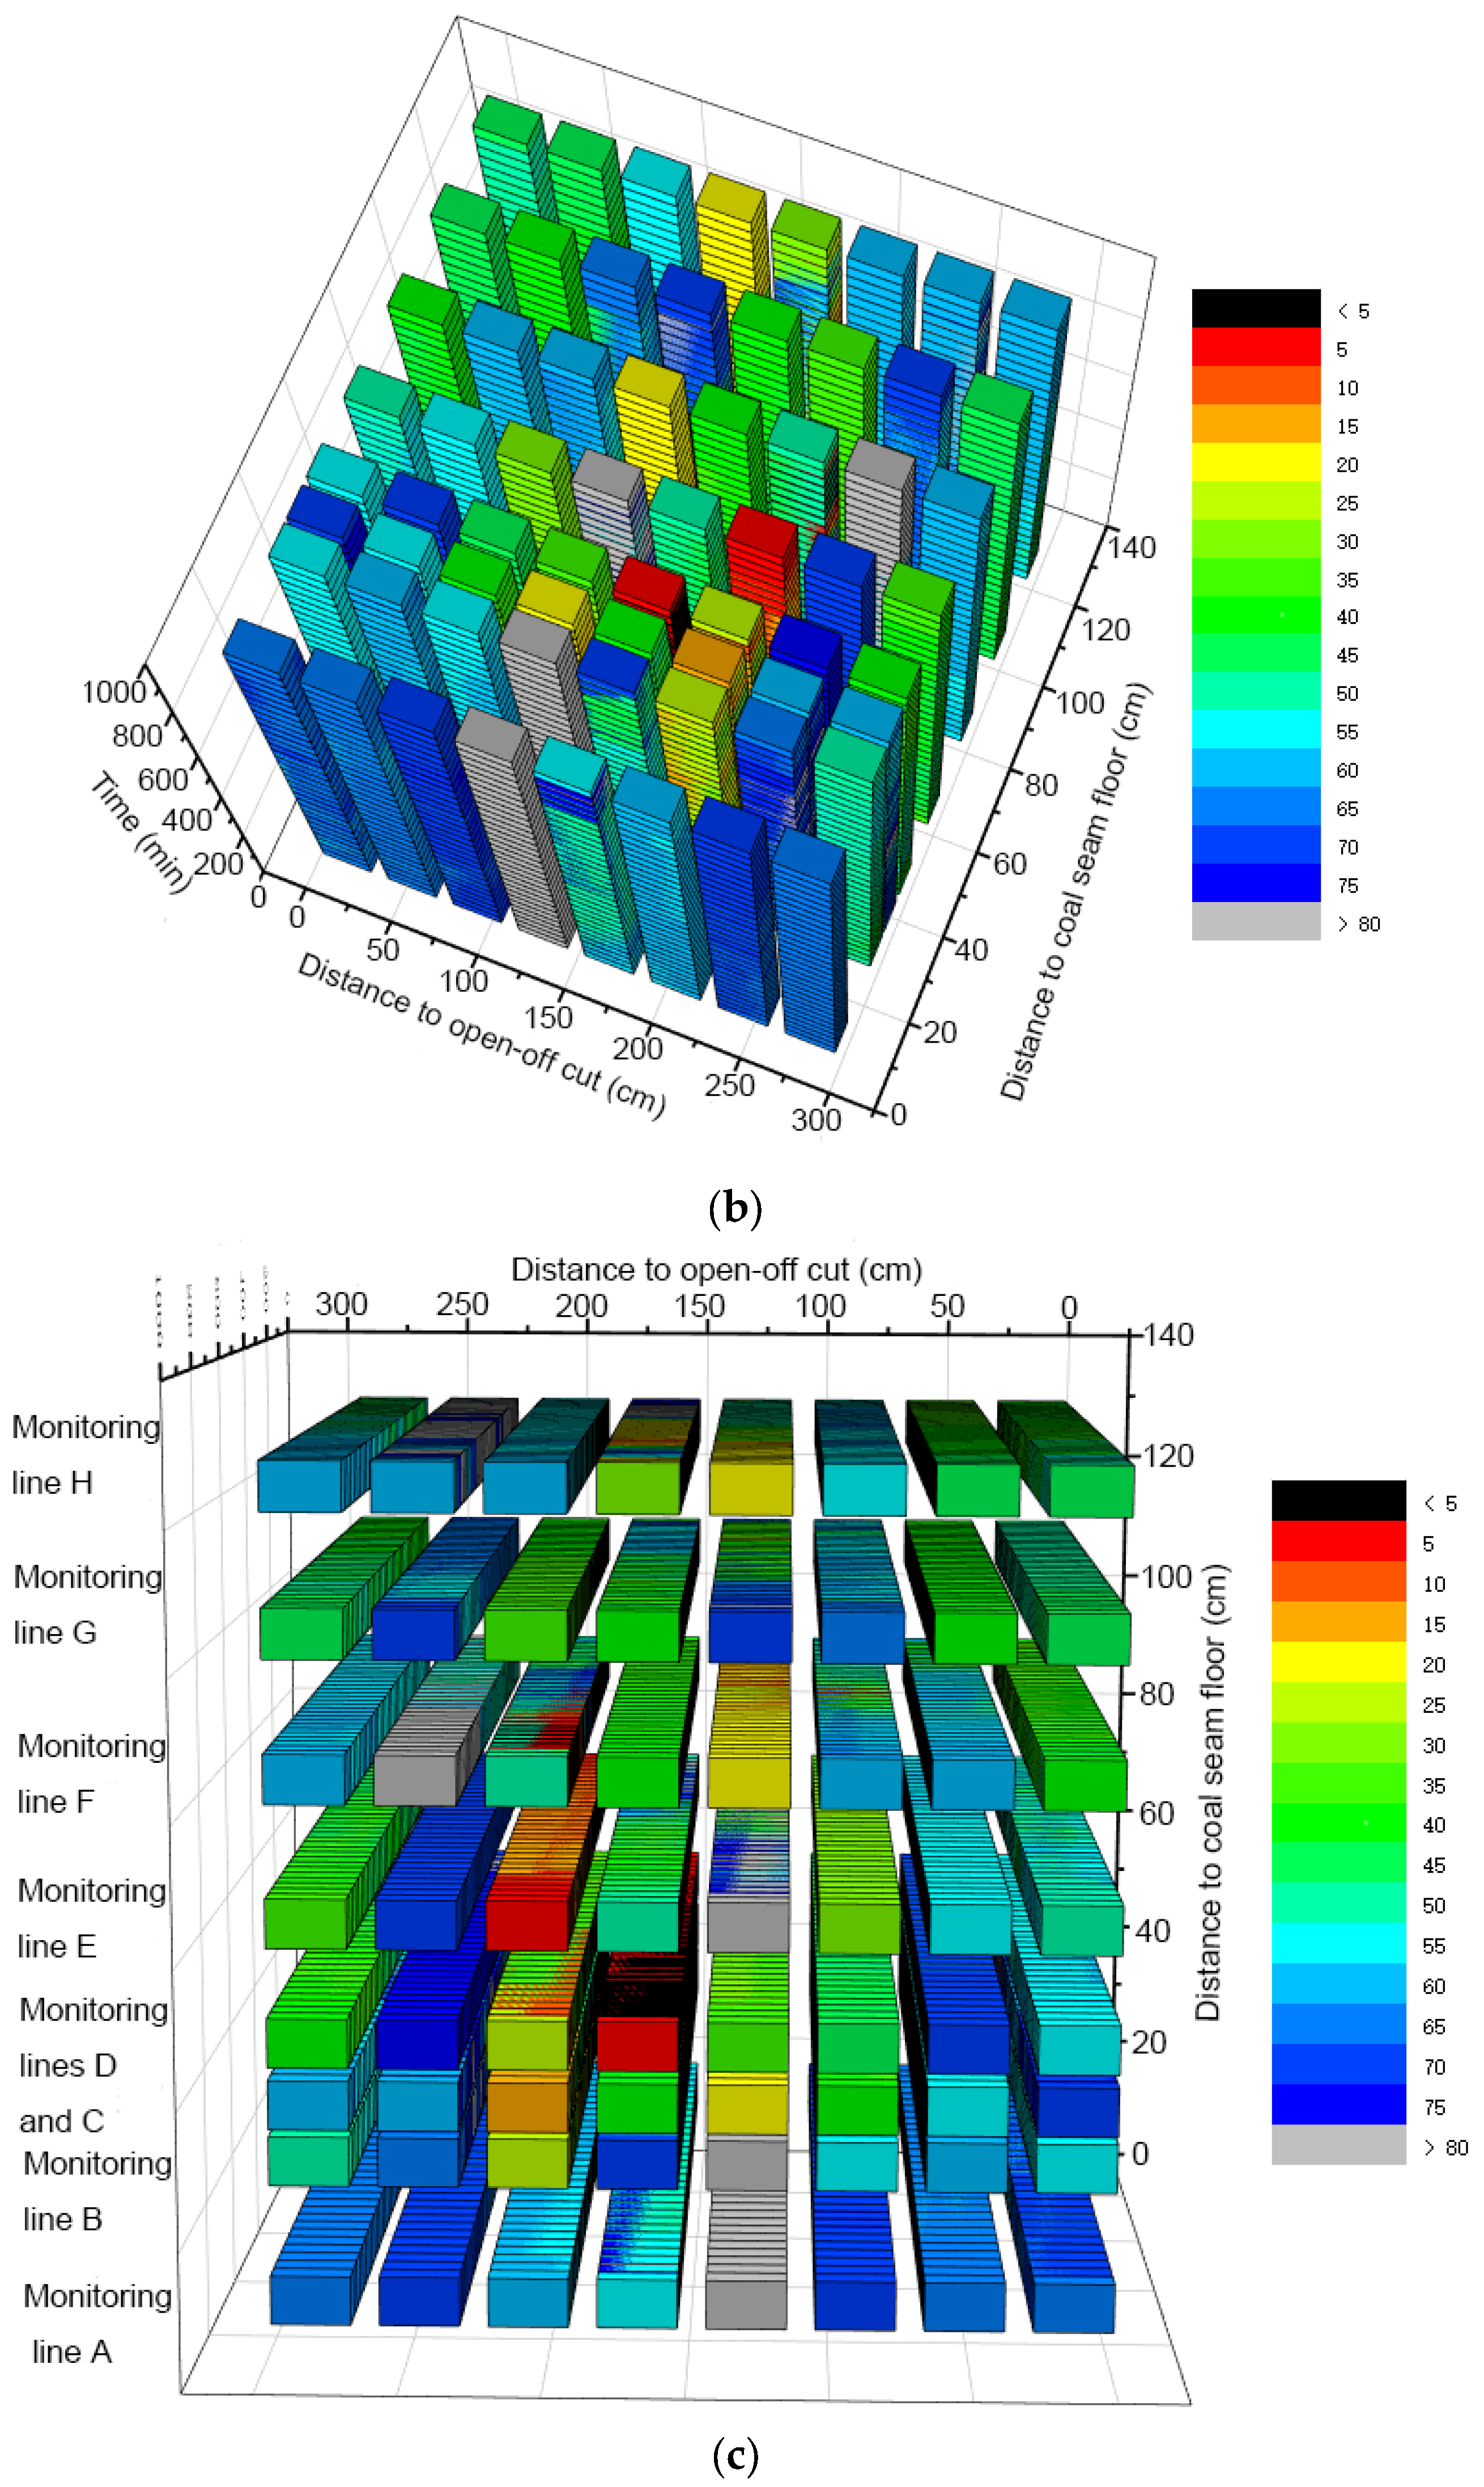
The temporal–spatial cube of the stress of the surrounding rock structure in the lower layer backfill mining is shown in Figure 4. In terms of spatial position, the blue high-attribute value parts increase, and locally, gray high-attribute values appear. The spatial vertical extension also increases the light blue attributes, and the local black extremely small attribute values disappear. The red low-attribute values sporadically increase. In the spatial dimension, the low attribute values of yellow to red are mainly distributed in the coal seam and backfill body and directly above the roof, and sporadically appear blue high attribute values far from the floor, indicating that the unevenness of mining disturbance increases. The non-uniform distribution of stress concentration causes local high stress, and the unevenness of top plate color attribute changes extends to the deep space, indicating that the scope of mining disturbance expands, and the local high stress concentration layer conforms to the characteristics of the stress shell. This indicates that the color of the spatial extension direction property changes greatly, but the overall property is blue on both sides and red in the middle, that is, the high attribute stress values on both sides of the space are high, and the attribute stress values in the middle are low, and the overall change range is greater than that of the upper layer mining. The spatio-temporal cube model visually displays the spatio-temporal distribution characteristics of stress.
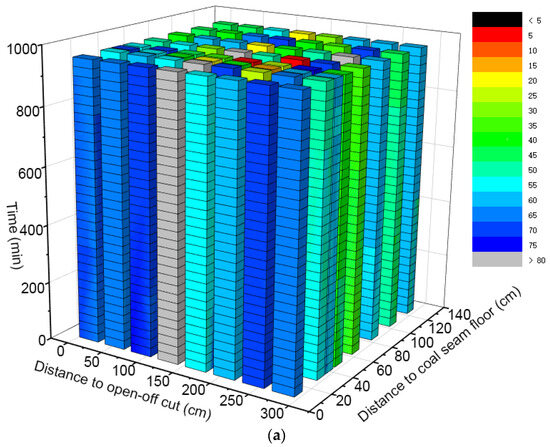
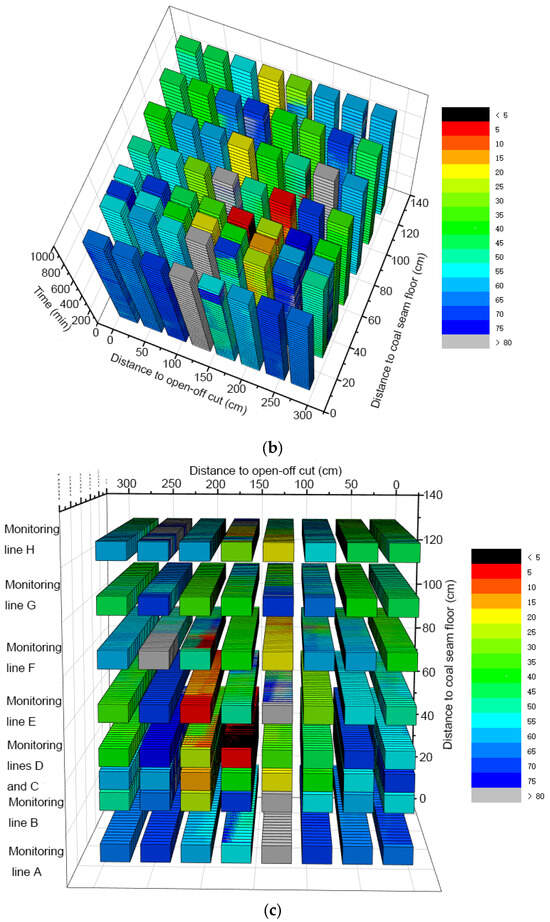
Figure 4.
Temporal–spatial cube model of stress in the surrounding rock structure due to the lower layer backfill mining. (a) Main view of the temporal–spatial cube model; (b) Top view of the temporal–spatial cube model (c) Elevation view of the temporal–spatial cube model.
In the time dimension, different spatial positions of the roof show wave characteristics, stress concentration, release, and recovery characteristics emerge with the wave of time. Compared to upper layer mining, the attribute color change is smaller, indicating that repeated mining did not aggravate the superimposed damage, and the upper layer backfill body played a bearing role, effectively restraining the deformation of the roof.
3.2. Temporal and Spatial Evolution of Displacement in Surrounding Rock Structure due to Multiple Layers Backfill Mining
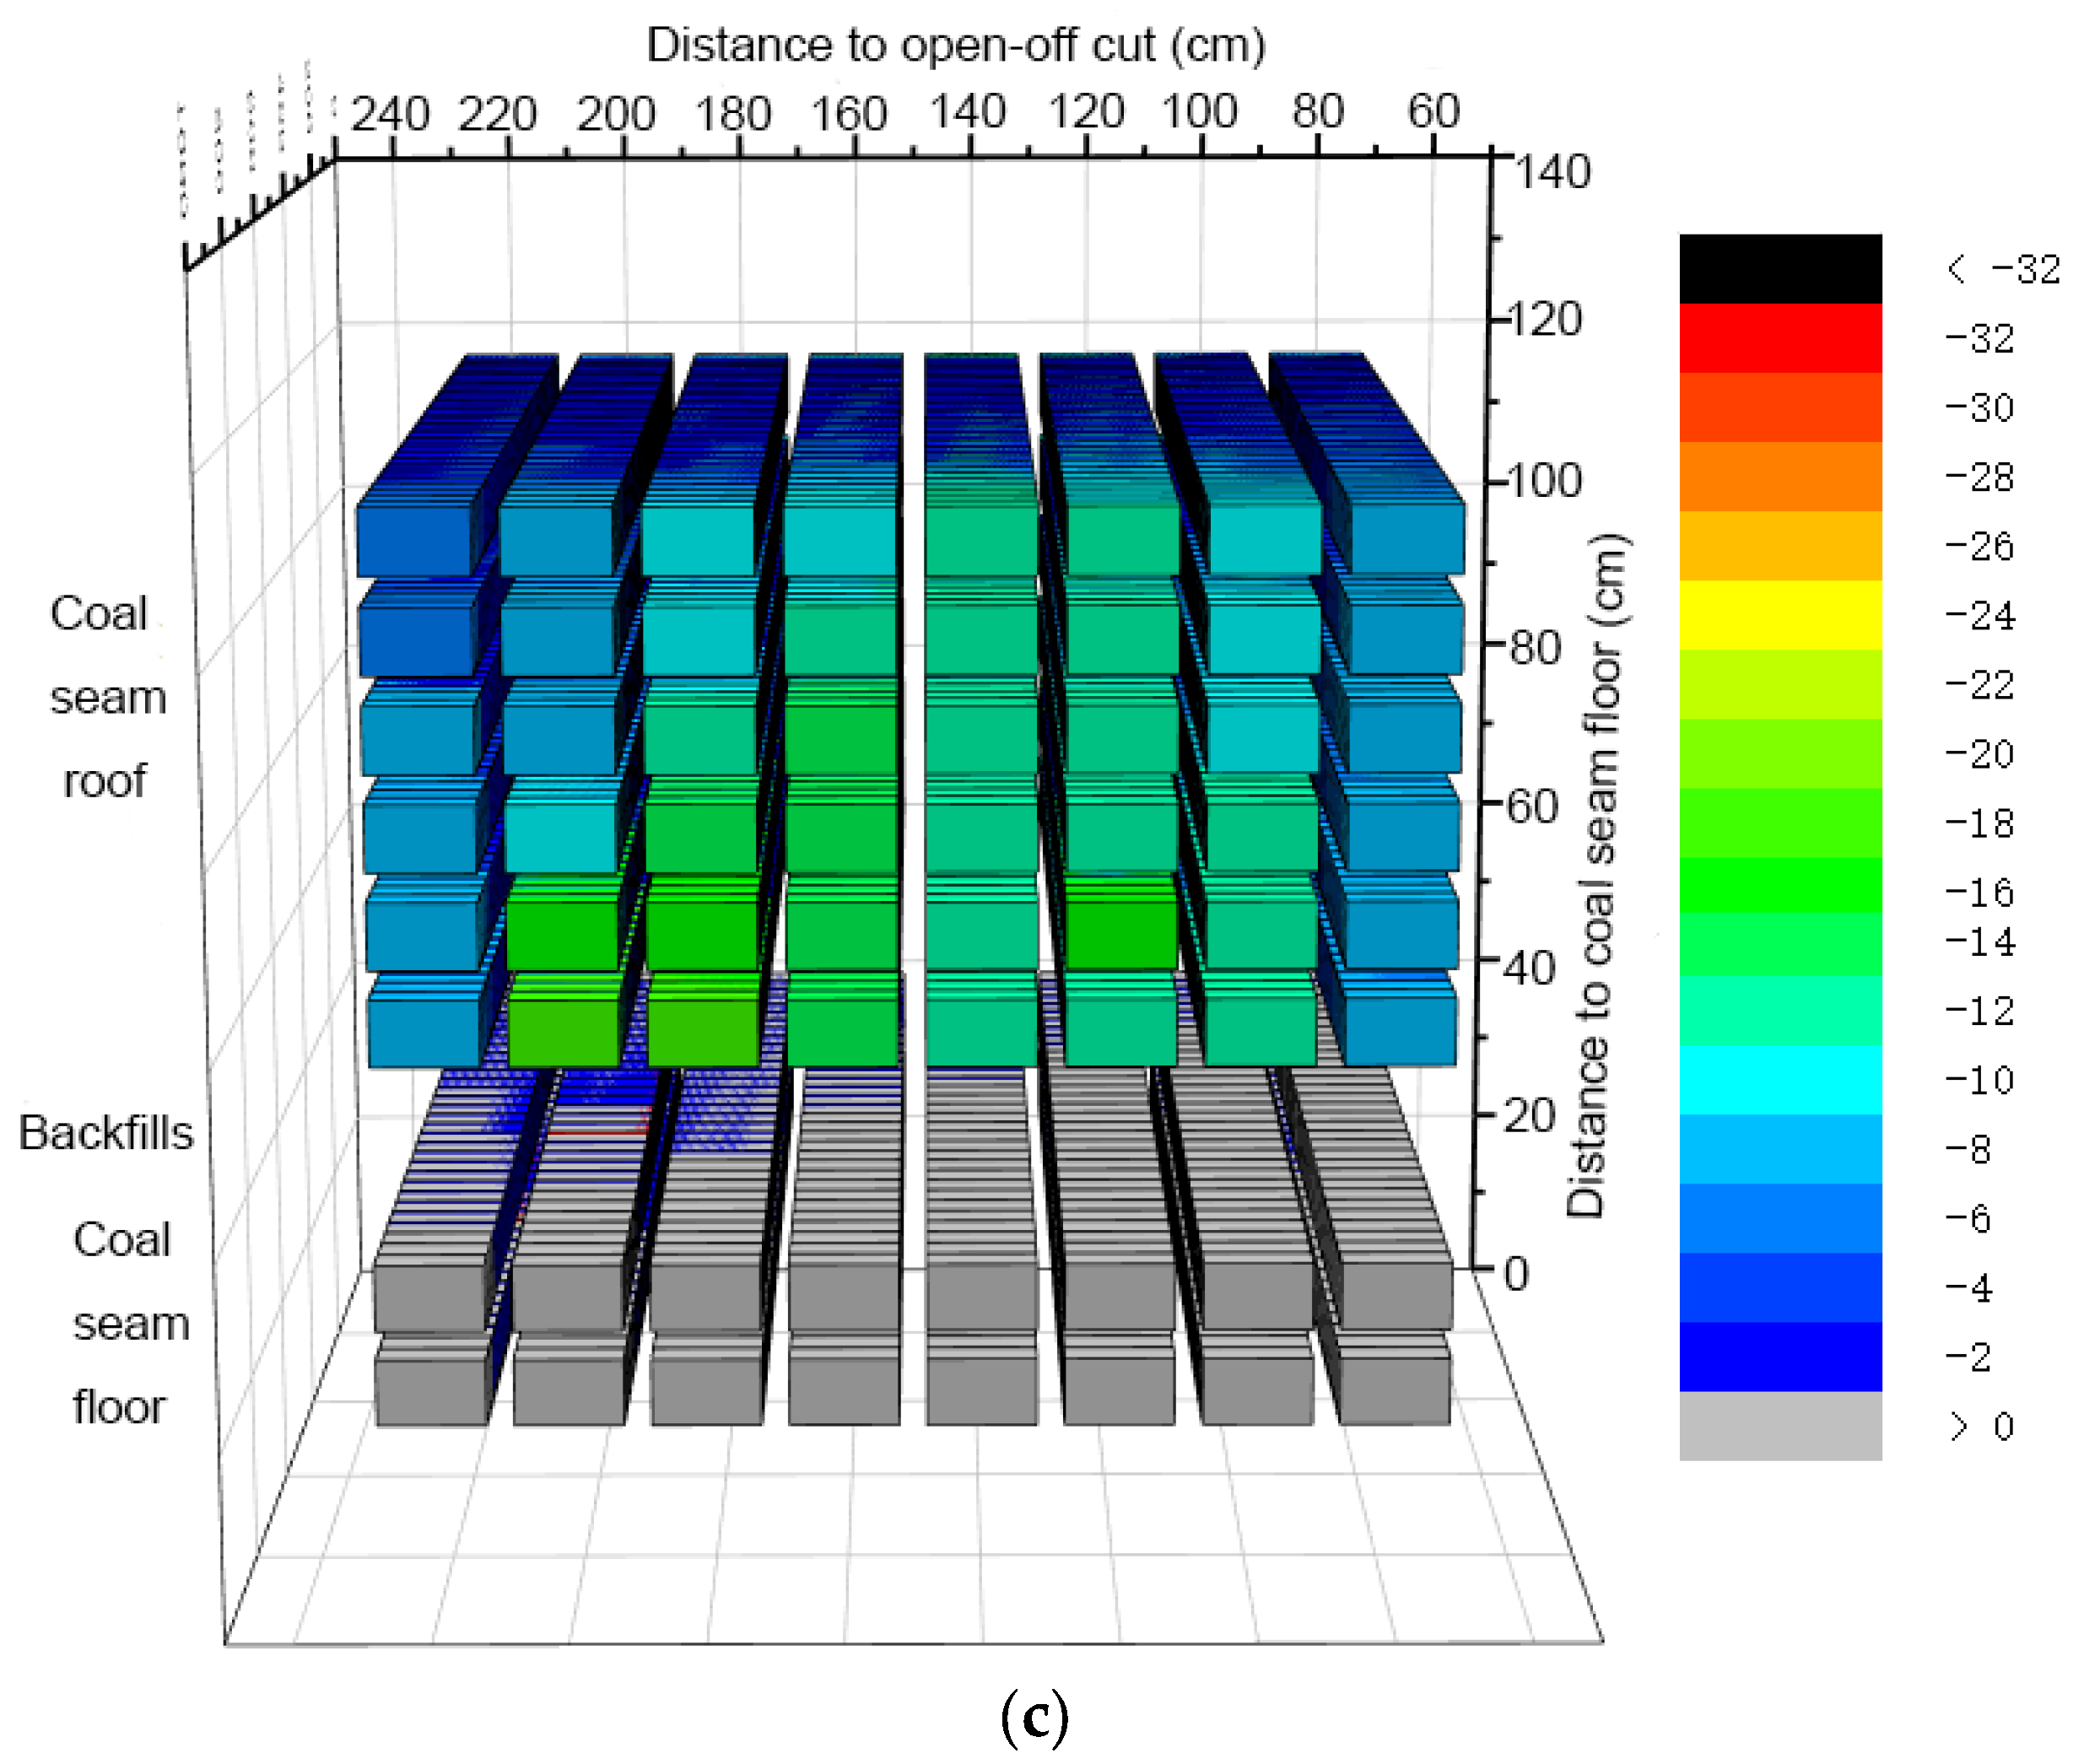
Figure 5 shows the temporal–spatial cube model of the displacement of the surrounding rock structure in upper layer backfill mining. Considering the time and space dimensions, different colors represent the displacement attribute values. Gray represents displacement greater than 0, indicating the floor uplifts, and the transition from blue to black represents displacement less than 0, with the color decreasing sequentially, indicating the roof subsidence.
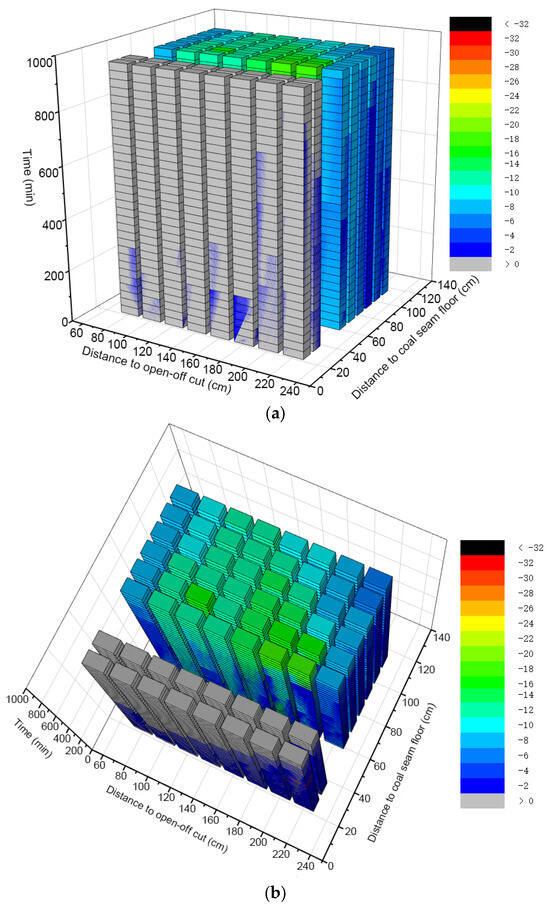

Figure 5.
Temporal–spatial cube model of displacement in the surrounding rock structure due to the upper layer backfill mining. (a) Main view of the temporal–spatial cube model; (b) Top view of the temporal–spatial cube model; (c) Elevation view of the temporal–spatial cube model.
The gray attribute parts are mainly concentrated in the two levels closest to the floor, with attribute values greater than 0. The blue color is mainly distributed in areas away from the floor, and the blue deepens as the distance from the floor increases. The direct roof part is green, and the attribute value is further smaller than that of the blue system, indicating that the displacement relatively increases. After mining ends, the floor of the surrounding rock structure at the coal seam and backfill body position uplifts, and the roof subsides, the subsidence amount in the middle of the panel is significantly greater than on both sides. Due to the small uplifting amount of the floor, the floor is mainly gray and distributed in the range of 0~2 mm. The attribute color of the roof subsidence is mainly blue and green, indicating that the displacement amount is distributed between −18 mm and 0 mm, the lighter the green, the greater the displacement amount, and the deeper the blue, the smaller the displacement amount. The blue is mainly concentrated on both sides of the panel, and the further away from the floor, the deeper the blue, indicating that the displacement amount gradually decreases with the distance to the roof.
In terms of spatial position, the floor is represented by gray with attribute values greater than 0. The roof is represented by blue and green with attribute values less than 0, and the blue deepens with the spatial position extension. The green deepens with the spatial position extension, and the distribution range becomes smaller, indicating that the attribute value change is closely related to spatial distribution. In terms of time, the blue and green colors gradually lighten as time extends, and the attribute values gradually increase. This indicates that the spatio-temporal cube comprehensively displays the evolution characteristics of the displacement of the surrounding rock structure along time and space.
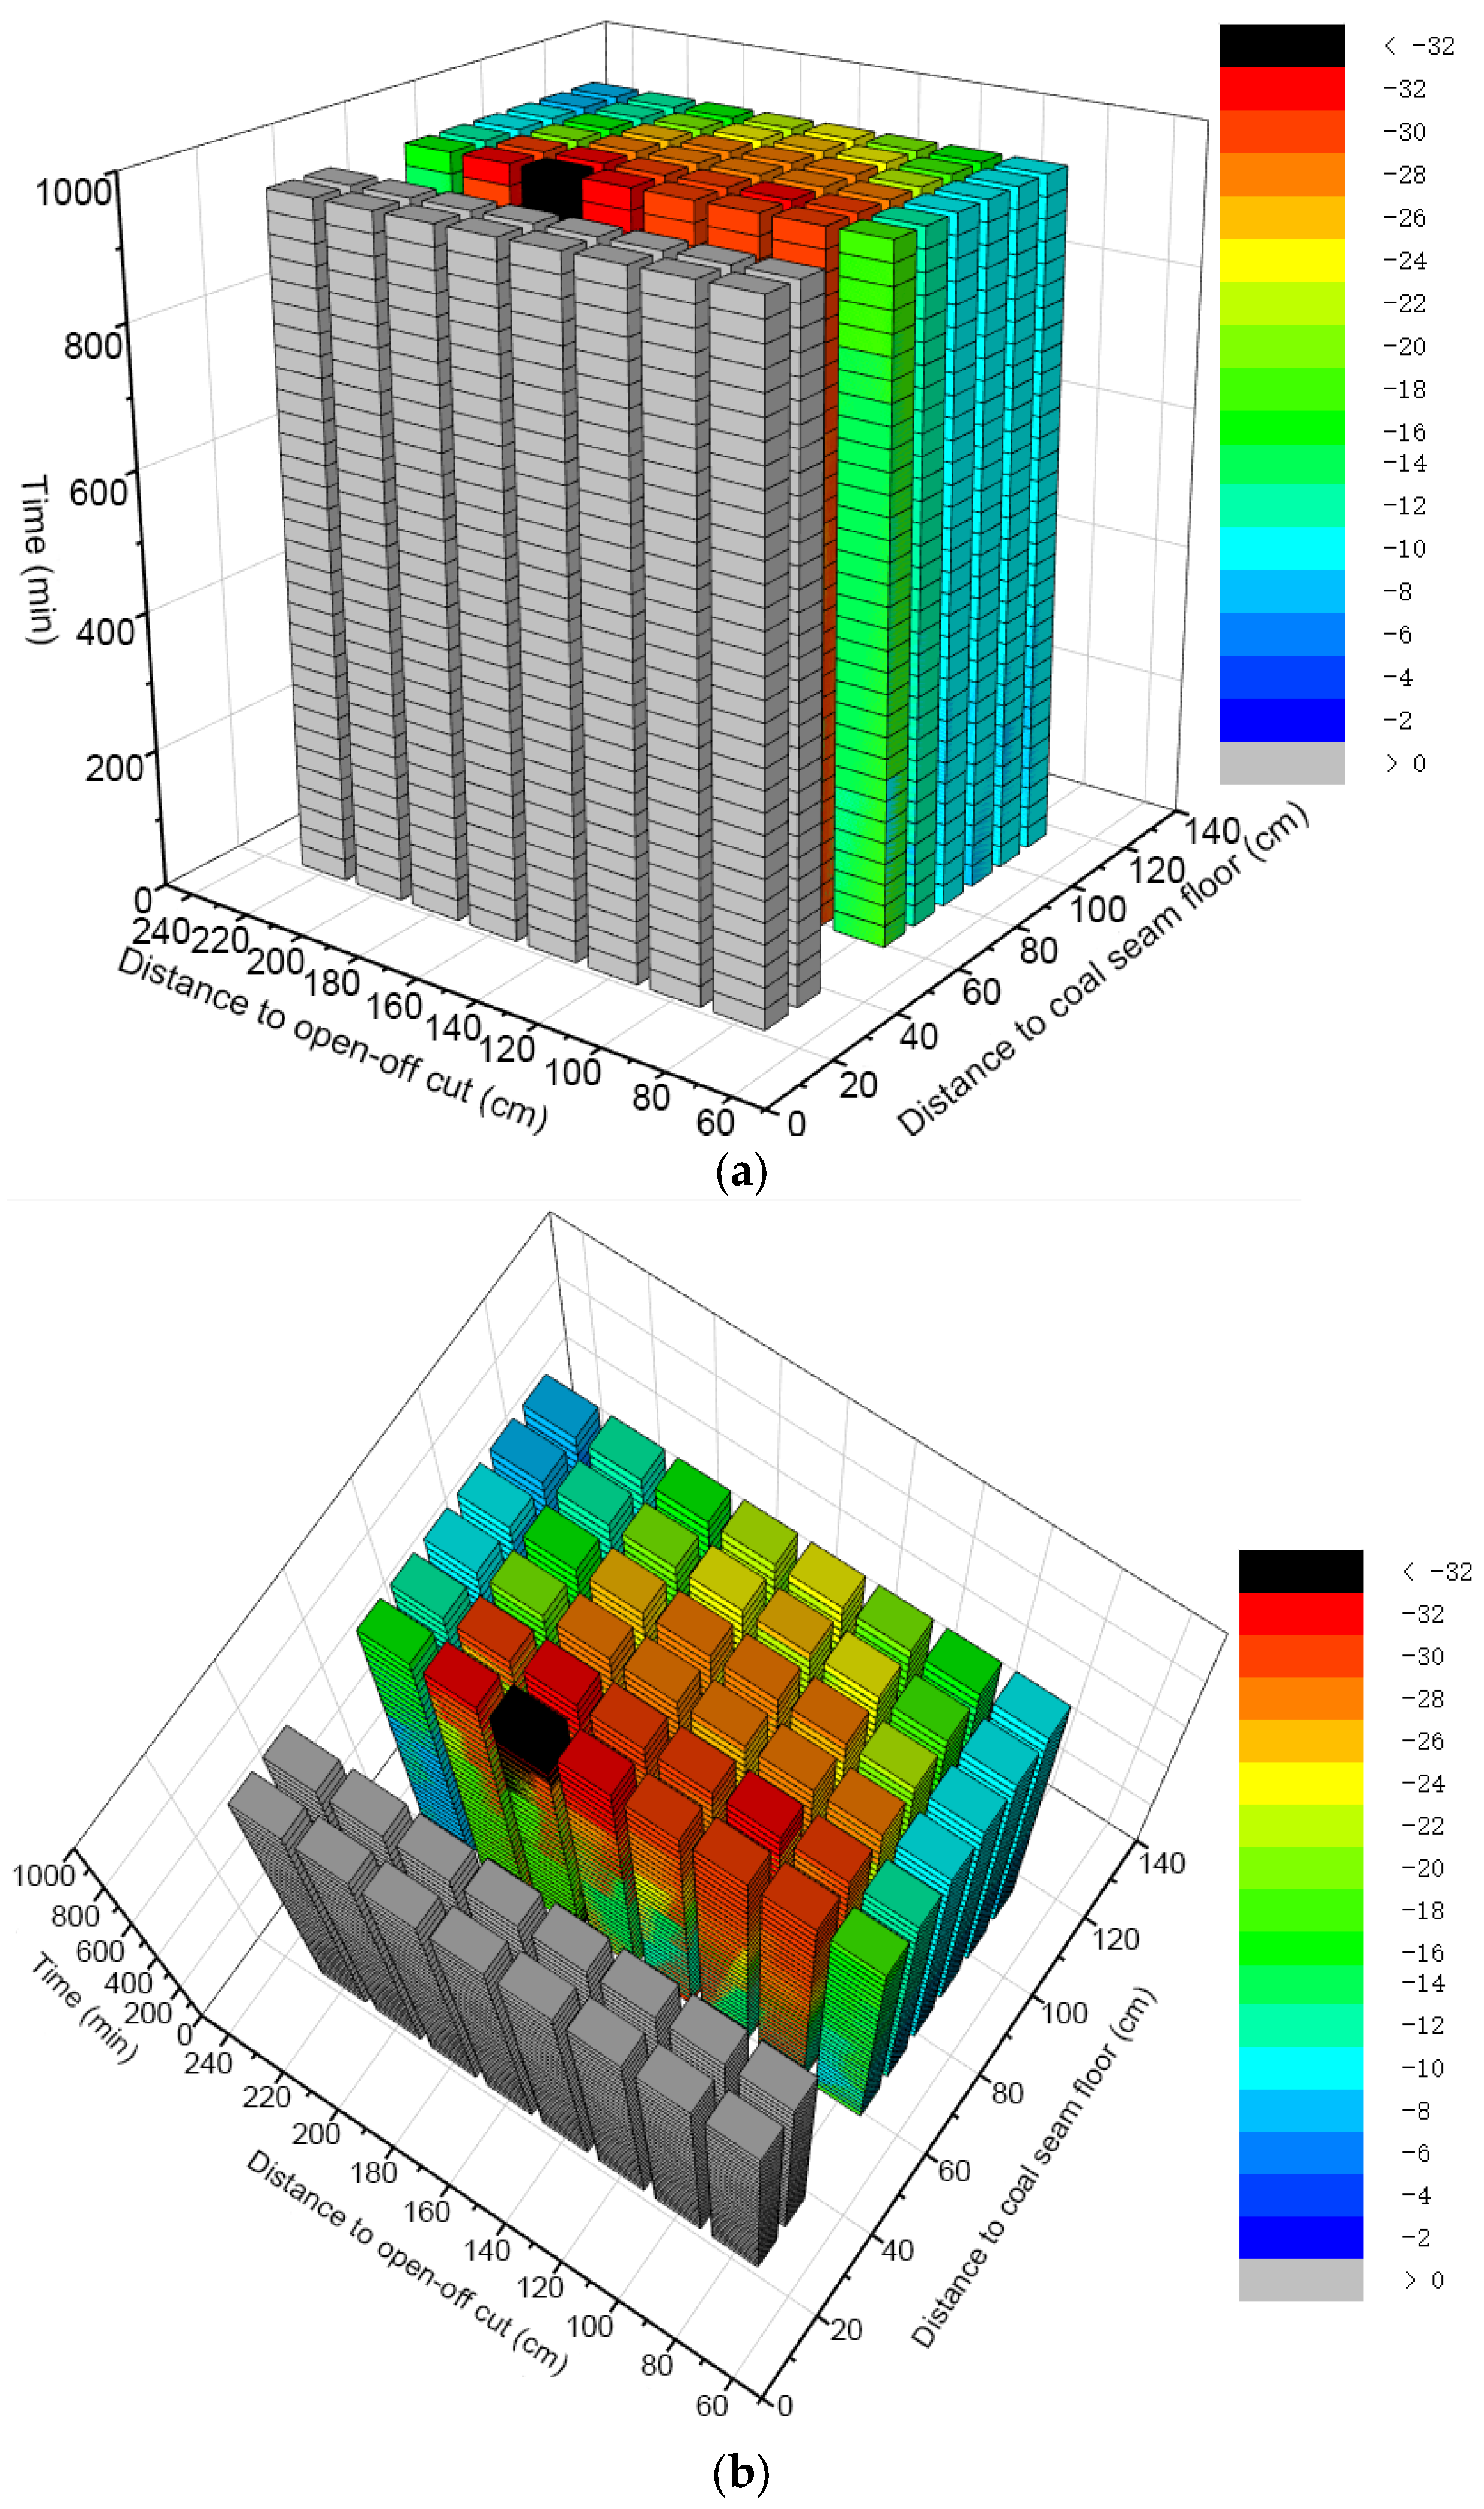
Figure 6 shows the temporal–spatial cube model of displacement of surrounding rock structure in the lower layer backfill mining. The high-attribute red and black series increase, the green series gradually lightens, and the blue series gradually disappears. The attribute value further increases, indicating a relatively larger displacement. The gray with attribute values greater than 0 is still mainly distributed on the floor. With the extension of space, the green and red series gradually appear, and the attribute value increases. As the spatial extension increases, the color series gradually lightens, and the attribute value decreases. The immediate roof is mainly distributed in the red series and occasionally in the black series. Both the range and color of the red series gradually decrease and lighten with spatial extension, indicating that the displacement gradually decreases.


Figure 6.
Temporal–spatial cube model of displacement in the surrounding rock structure due to the lower layer backfill mining. (a) Main view of the temporal–spatial cube model; (b) Top view of the temporal–spatial cube model; (c) Elevation view of the temporal–spatial cube model.
In the time dimension, within the range of the immediate roof, the color changes from green to red series, the red gradually deepens until black appears, and the displacement gradually increases. The blue changes to the green series, and the color gradually lightens; the attribute value gradually increases, and the displacement gradually increases. In the spatial dimension, the floor is still mainly gray, with little change in attribute value. A large range of red appears on the roof and gradually decreases with spatial extension, approximating an arch shape. The red series gradually lightens and transitions to the green series, especially on both sides of the panel, which are mainly green series and transition to blue series. This indicates that the displacement gradually decreases with spatial lateral extension. Furthermore, with horizontal spatial extension, it transitions from the green series to the red series and then back to the green series, showing characteristics of larger subsidence in the middle and smaller subsidence on the sides.
3.3. Hotspot Distribution Characteristics of Stress and Displacement Entropy due to Multiple Layers Backfill Mining
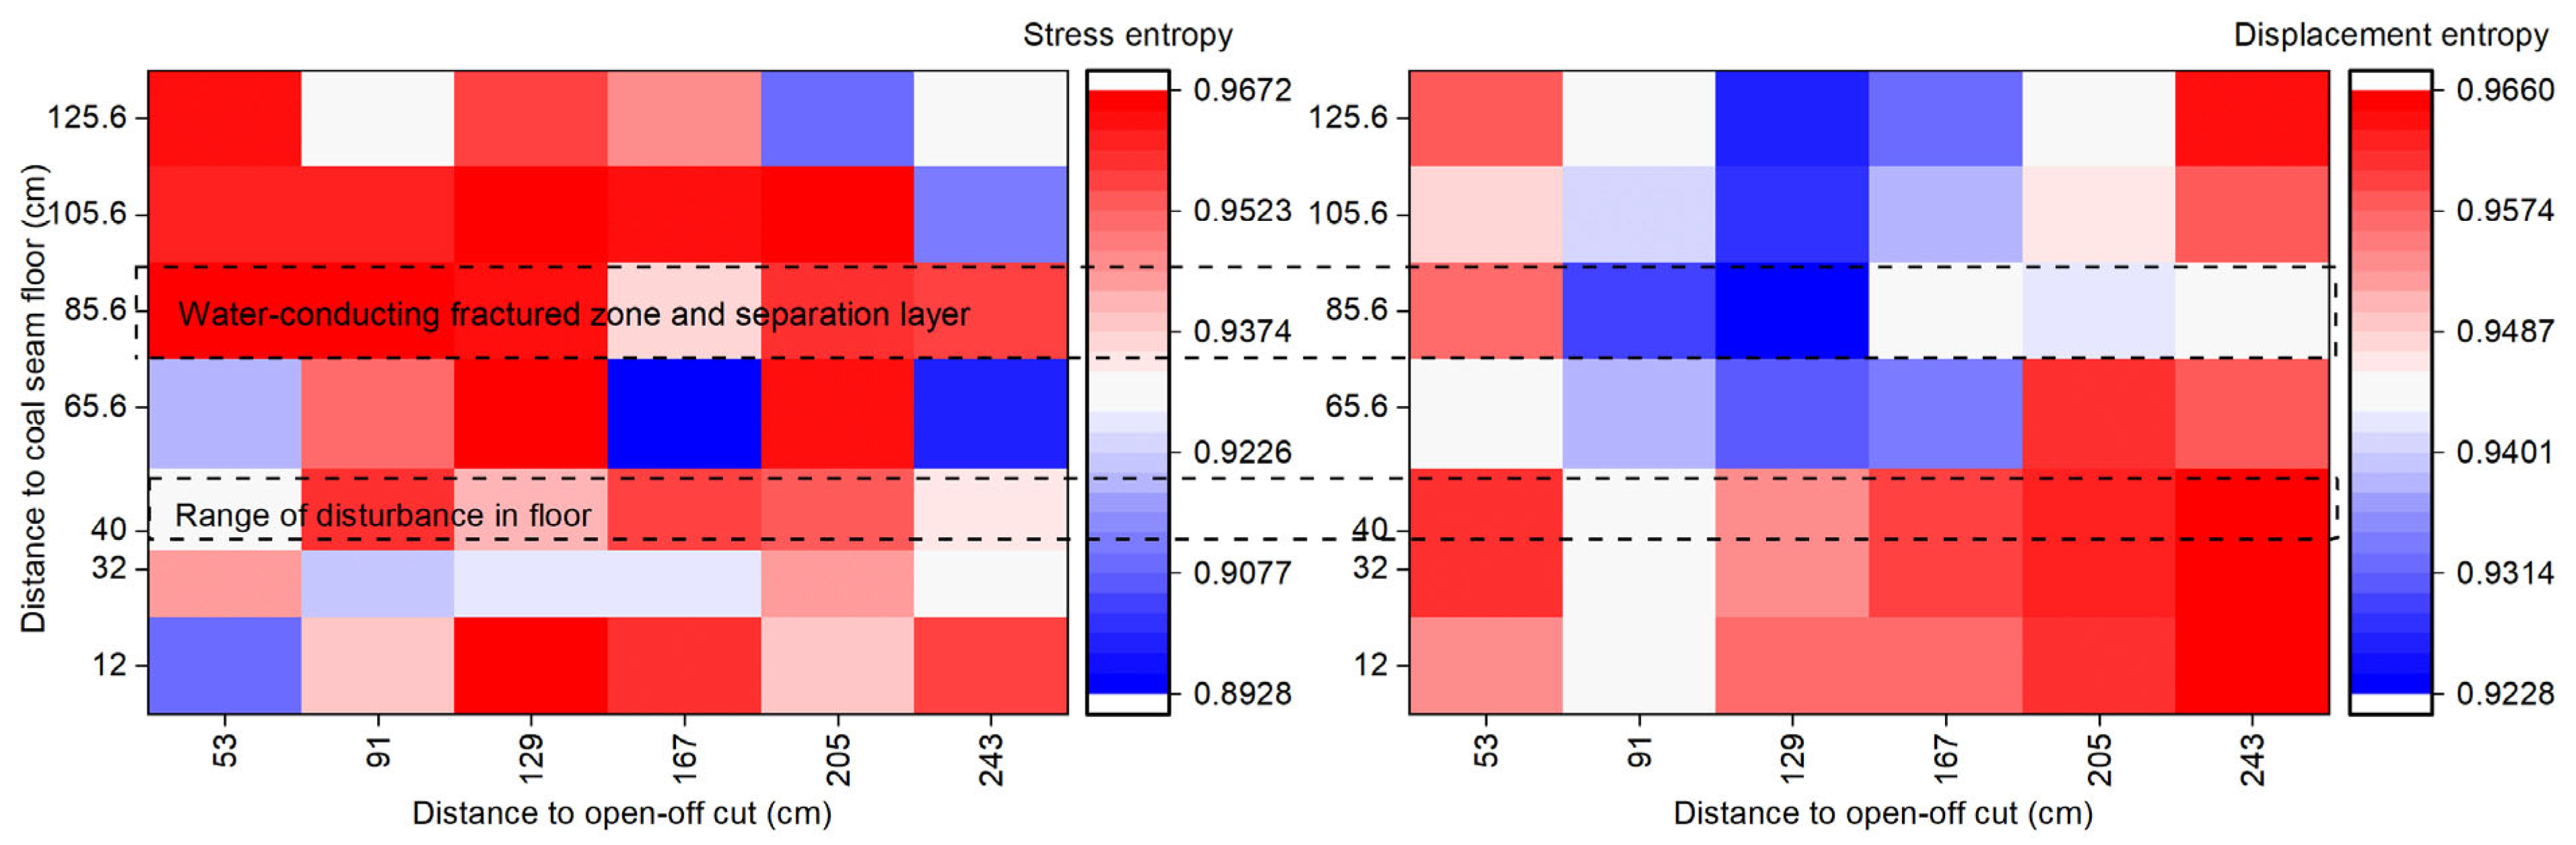
The hotspot distribution of stress entropy and displacement entropy in the surrounding rock structure in the upper layer backfill mining is shown in Figure 7. The deeper the red color, the higher the entropy value, and the deeper the blue color, the lower the entropy value. The distribution patterns of stress entropy and displacement entropy are opposite. The hotspots of stress entropy in the roof are densely distributed, indicating a more chaotic stress state in the roof, especially at the 48 cm position where stress entropy hotspots are concentrated, indicating higher stress here. Hotspots of displacement entropy are mostly distributed at the bottom of the coal seam, especially near the stop-mining line, indicating significant deformation here, which is consistent with the stress and displacement distribution patterns. The greater the displacement, the more obvious the stress release, and the less concentrated the stress entropy hotspots. The hotspots of stress entropy and displacement entropy at 28 cm in the roof indicate relative chaos here, which is the location of the separation layer and the water-conducting fractured zone. The 8.8 cm mark on the floor indicates the disturbance range of the floor, which is less than the disturbance range of the roof.
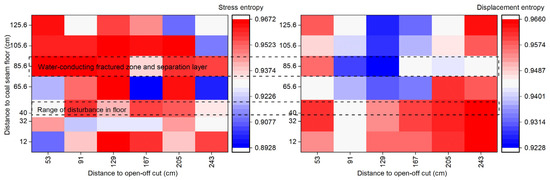
Figure 7.
Hotspot of stress and displacement entropy of the surrounding rock structure due to the upper layer backfill mining.
As shown in Figure 8, the hotspots of stress entropy in the surrounding rock structure during lower layer backfill mining are significantly reduced, especially in the middle of the panel, where the stress entropy is smaller, indicating a higher degree of stress release and a reduction in the level of stress chaos. Theoretically, the higher the entropy value, the more disordered the system, tending towards an ordered state. A reduction in the entropy value indicates that the stress tends towards a disordered state. The hotspots of displacement entropy are mainly concentrated at the stopping line, indicating severe deformation here. The reduction in the disparity between stress entropy and displacement entropy suggests that the degree of stress–displacement chaos tends to be consistent. Compared to upper layer mining, the degree of chaos in lower layer mining is reduced, indicating that the stress and displacement evolution pattern of lower layer backfill mining continues from upper layer mining, but with increases in the magnitude of stress and displacement, further releasing and concentrating stress, and significantly aggravating deformation at the stopping line. However, the reduction in entropy values makes the state more disordered, and the presence of disorder increases uncertainty, making the stope environment more complex.
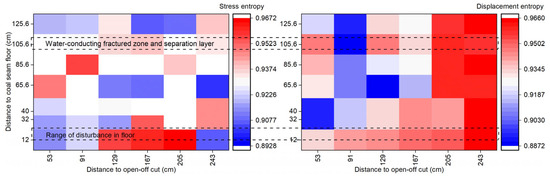
Figure 8.
Hotspot of stress and displacement entropy of the surrounding rock structure due to the lower layer backfill mining.
3.4. Distribution Characteristics of KL-Divergence Hotspot of Surrounding Rock Structure in Multiple Layers Backfill Mining
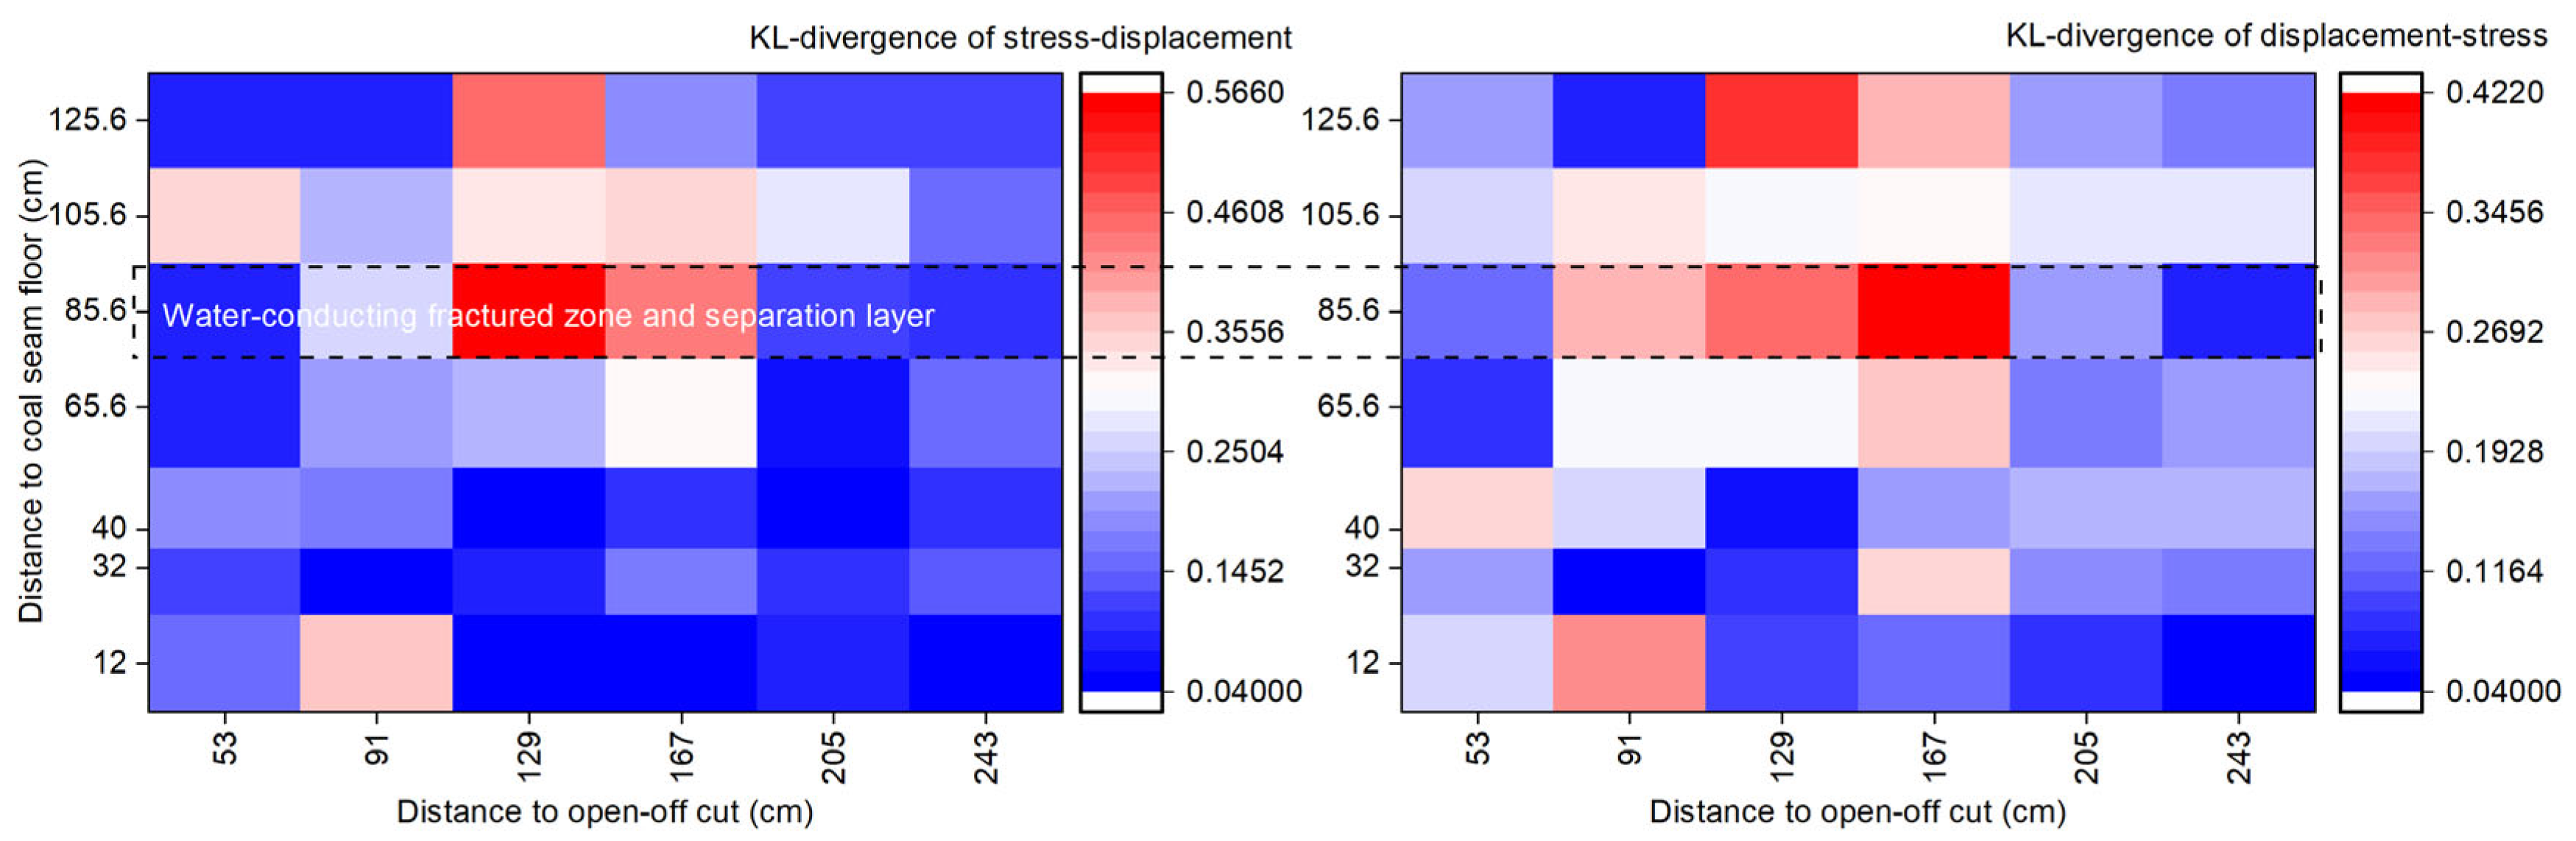
KL-divergence characterizes the degree of correlation and state between stress and displacement. The higher the divergence, the stronger the correlation between stress and displacement, and the more intense the disturbance to the stress and displacement state. The KL-divergence hotspot distribution of surrounding rock structure in upper backfill mining is shown in Figure 9. The KL-divergence of stress to displacement and displacement to stress is not significantly different, with the former being slightly larger than the latter. This indicates that the correlation degree of stress to displacement is greater than that of displacement to stress, meaning that stress has a greater controlling effect on displacement. Displacement is a linked response to stress, and stress plays a dominant role in controlling stability in the stope environment. KL-divergence hotspots are mainly distributed at 28 cm of the roof, indicating significant changes in deformation and displacement at that location. In contrast, there are almost no hotspots in the coal pillars on both sides, and the KL-divergence is relatively small. This indicates that the displacement of the coal pillars on both sides is very small, with minimal disturbance from mining, and the controlling effect of stress on displacement is not obvious. Additionally, the response of displacement to stress is also weaker. There are also fewer hotspots on the coal seam floor, indicating that mining has the greatest disturbance on the roof, with less disturbance on the coal pillars on both sides and the floor.
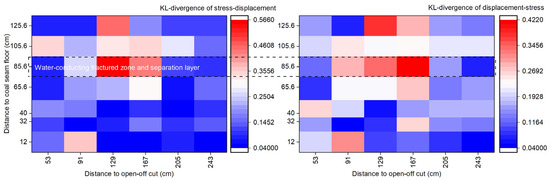
Figure 9.
Hotspot of KL-divergence of the surrounding rock structure due to the upper layer backfill mining.
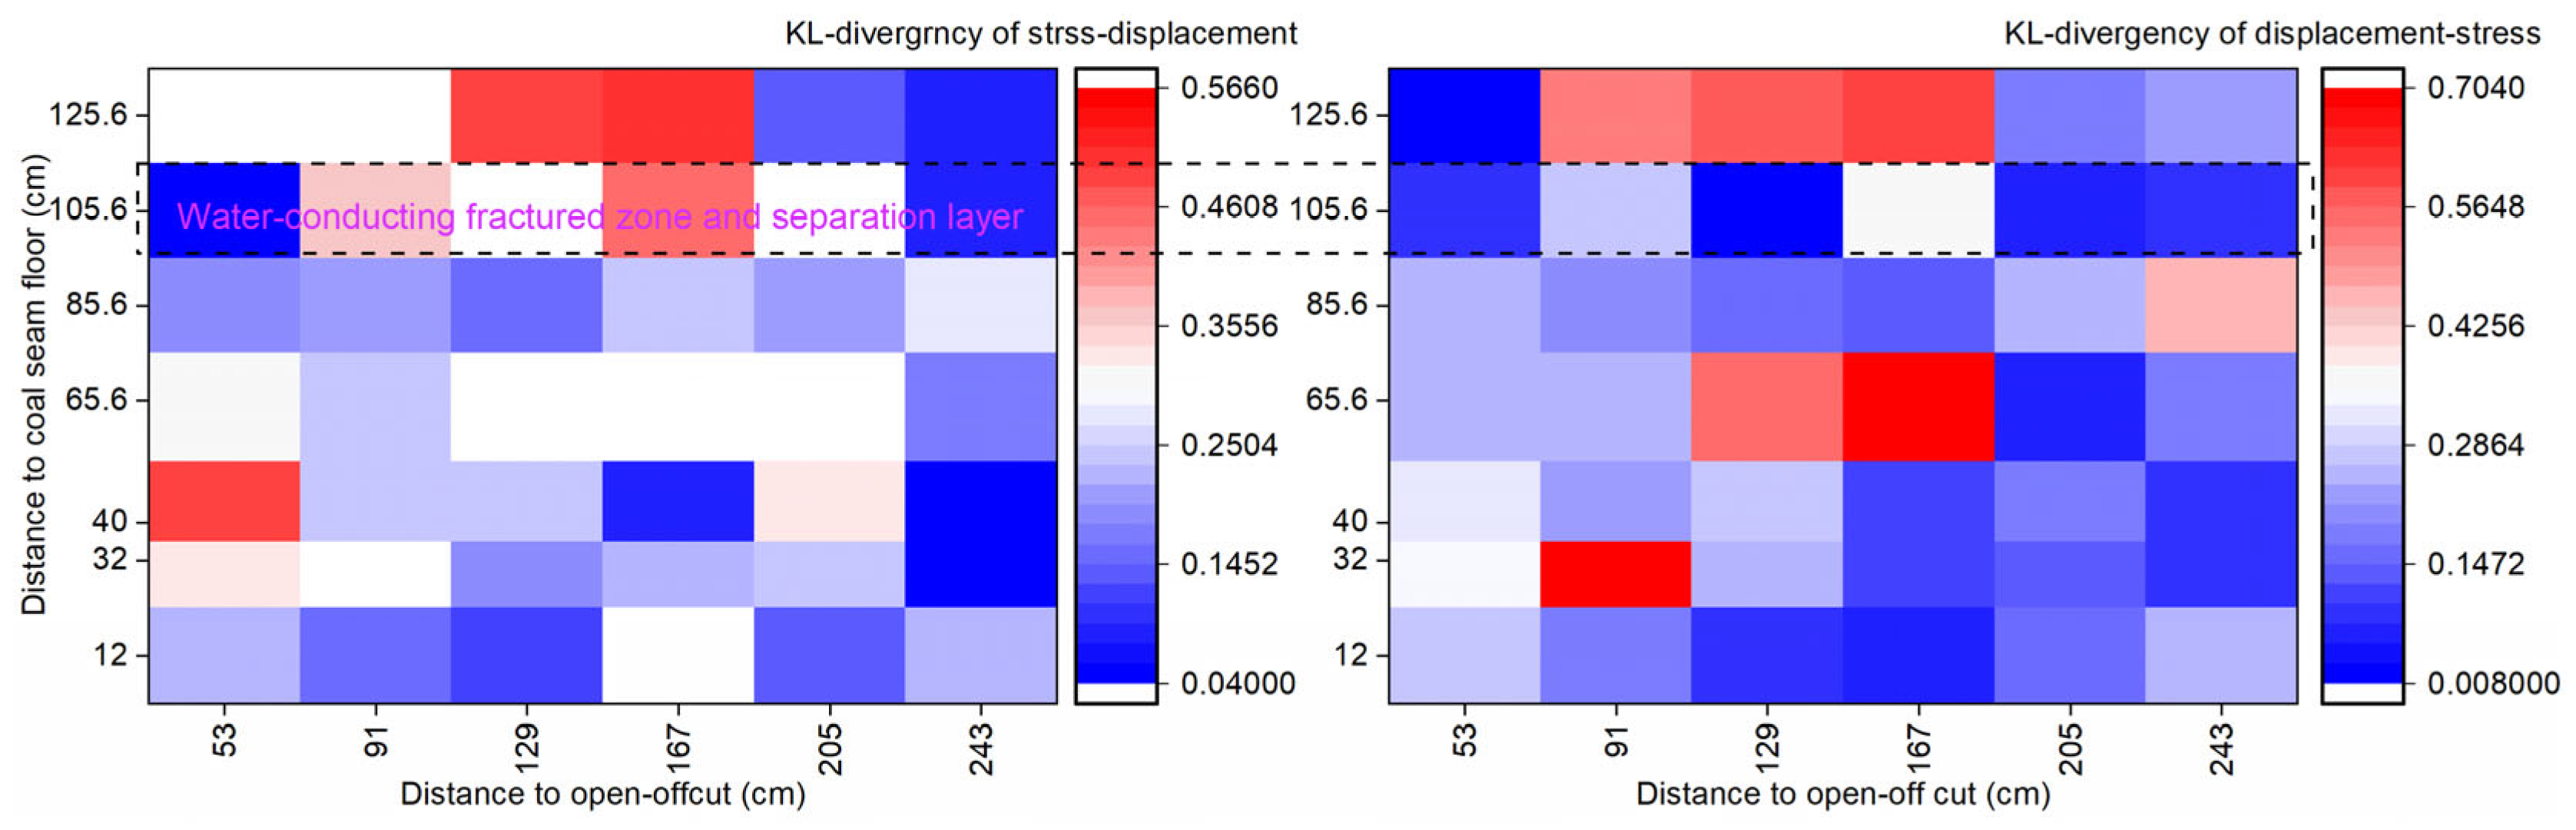
The KL-divergence hotspot distribution of the surrounding rock structure during the lower layer backfill mining is shown in Figure 10. The KL-divergence of stress–displacement is relatively higher than that of the upper layer backfill mining, indicating that the correlation degree of stress–displacement is enhanced and stress still maintains its dominant control effect on displacement. The increase in the degree of correlation between displacement and stress suggests an intensified change in displacement. A hotspot appears at 68 cm of the roof, indicating that the stress–displacement state tends to be chaotic, and the mining disturbance extends longitudinally to the roof. Local hotspots on the floor indicate an increase in mining disturbance toward the deeper part. The divergence value of the coal pillar is relatively small, indicating that the change in the stress–displacement state is not significant.
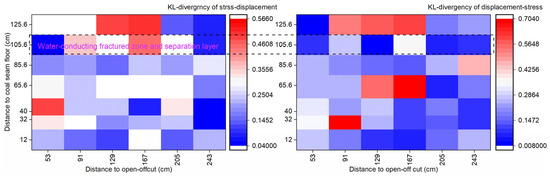
Figure 10.
Hotspot of KL-divergence of the surrounding rock structure due to the lower layer backfill mining.
3.5. Hotspot Distribution Characteristics of Stress–Displacement Related Efficiency of Surrounding Rock Structure in Multiple Layers Backfill Mining
The related efficiency of stress to displacement (or displacement to stress) represents the degree of correlation between stress and displacement. As shown in Figure 11, the distribution pattern of stress–displacement related efficiency of the surrounding rock structure in the upper layer backfill mining is consistent with KL-divergence, indicating that the related efficiency between stress and displacement is controlled by KL-divergence. The higher the related efficiency, the stronger the controlling effect, thus stress predominantly controls displacement. Considering that the response of stress precedes displacement during the mining process, when stress accumulates to a certain extent beyond the resistance capacity of the rock mass, the rock mass undergoes bending deformation until it fractures. Therefore, stress has a higher control effect on the displacement, and the two have a higher correlation and interaction to jointly control the stability of the stope.
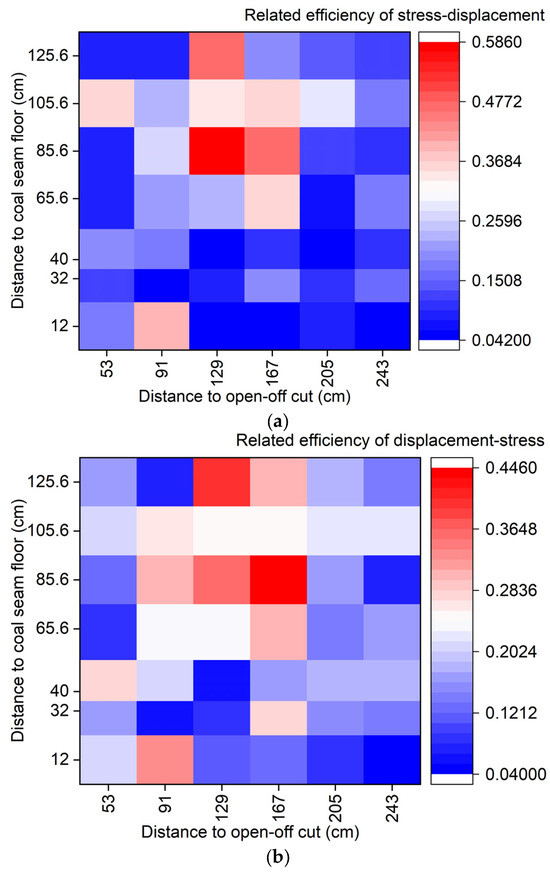
Figure 11.
Hotspot of related efficiency of stress–displacement of the surrounding rock structure due to the upper layer backfill mining. (a) Related efficiency of stress to displacement; (b) Related efficiency of displacement to stress.
Figure 12 shows the hotspot distribution pattern of the efficiency of stress–displacement correlation in the surrounding rock structure during the lower layer backfill mining. The control effect of stress on displacement is still relatively high and is enhanced compared to that of the upper layer backfill mining. The concentration of stress leads to the accumulation and release of rock mass energy, resulting in rock mass deformation and fracture. Repeated disturbances from mining keep the rock mass in a fragile equilibrium state, making the stress response of the rock mass more apparent and easier to reach the critical state of rock mass deformation, which is induced by the enhancement of the correlation degree and control effect of stress on displacement. Overall, the hotspot distribution pattern extends and transmits vertically compared to that of the upper layer mining. The degree of stress–displacement correlation increases, and hotspot of related efficiency appear in the locations of severe deformation in the middle of the panel.
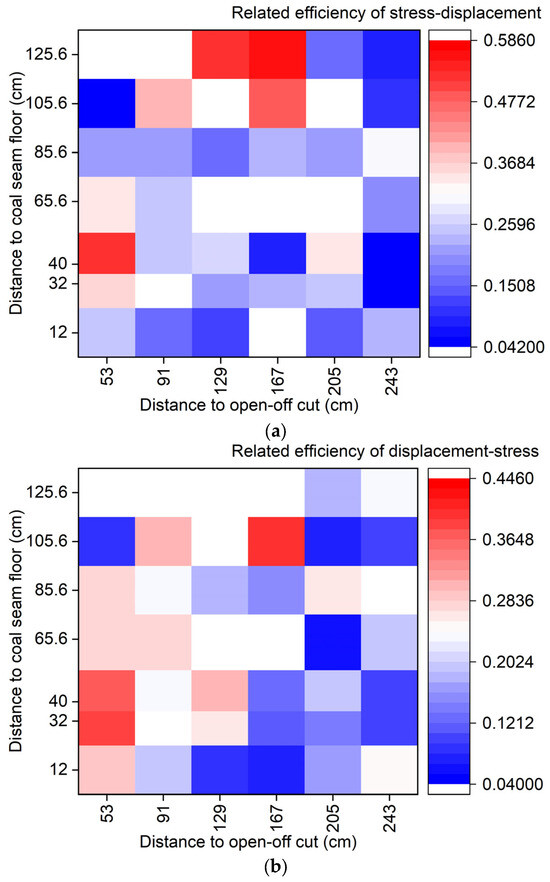
Figure 12.
Hotspot of related efficiency of stress–displacement of the surrounding rock structure due to the lower layer backfill mining. (a) Related efficiency of stress to displacement; (b) Related efficiency of displacement to stress.
3.6. Characteristics of Symmetrical KL-Divergence Hotspot Distribution of Surrounding Rock Structure in Multiple Layers Backfill Mining
The absolute degree of correlation and state between stress and displacement using symmetric KL-divergence is characterized, eliminating the differences in the correlation degree of stress–displacement. As shown in Figure 13a, the larger the symmetric KL-divergence, the higher the correlation degree between stress and displacement of the surrounding structure during the upper layer backfill mining, the more chaotic the stress–displacement state, and the more unstable the surrounding rock structure. The hotspots are mainly distributed at the central roof of the panel at 28 cm, indicating a higher degree of chaos and relatively stronger instability, which is within the range of the water-conducting fractured zone. Comparing the temporal–spatial evolution characteristics of stress–displacement, an obvious separation layer develops at this location. The distribution of hotspots in the floor is less, indicating relatively stable conditions compared to the roof, and less disturbance from mining activities. Thus, symmetric KL-divergence effectively reflects the state of stress–displacement and can serve as an indicator for the stability of the mining stope.
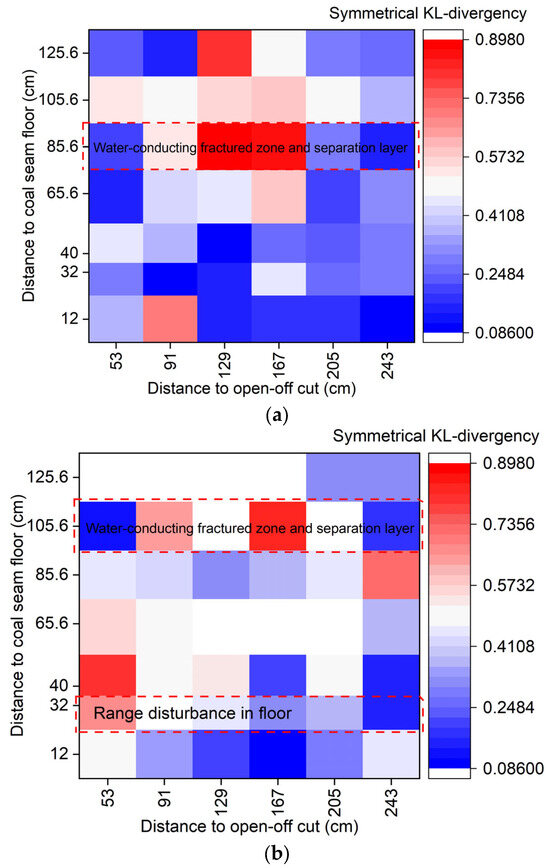
Figure 13.
Hotspot of symmetrical KL-divergency of the surrounding rock structure due to multiple layers backfill mining. (a) Hotspot of symmetrical KL-divergency induced by the upper layer backfill mining; (b) Hotspot of symmetrical KL-divergency induced by the lower layer backfill mining.
Figure 13b shows the hotspot distribution of symmetric KL-divergence in the surrounding rock structure during the lower layer backfill mining. It shows that hotspots are distributed at 48 cm of the roof, extending 20 cm longitudinally compared to the upper layer backfill mining. This indicates that the stress–displacement instability extends longitudinally, with further upward development of overburden failure. The floor has no obvious hotspots, showing an increased divergence value compared to the upper layer backfill mining, indicating a relatively chaotic state but overall better stability. Compared to the upper layer backfill mining, the overall symmetric KL-divergence increases, indicating an enhanced correlation degree of stress–displacement and increased state chaos, but tending to be orderly. The existence of order indicates consistent stress–displacement patterns, and subsequent disturbances will have similar stress–displacement response characteristics, which is beneficial for controlling the stability of the mining stope.
4. Discussions
Backfill mining is a dynamic process closely related to time and space, where rock movement, fracture generation, and rock mass stress changes caused by mining fluctuate over time and space. This process dynamically changes with the passage of time and the expansion of space, showing certain random fluctuations and spatiotemporal characteristics. The spatio-temporal cube can visually display the spatiotemporal process according to the attribute values with different colors.
The displacement and stress temporal–spatial process is in a closed black box space due to the multiple layers backfill mining. Relying on conventional input conditions to infer output results cannot fully show its process and mechanism. Therefore, using a spatiotemporal cube model to achieve the spatio-temporal evolution process of stress and displacement is beneficial for the stability of early warning and forecasting engineering.
For backfill mining, stress and displacement are interlinked and mutually constrained, with displacement showing a significant lag effect in response to mining activities and stress. By introducing the concepts of information entropy and mutual information, the information states of stress and displacement are quantified and expressed to analyze the correlation between stress and displacement. This represents the evolution degree and state of displacement and stress, as well as the control effect of stress on displacement, quantitatively characterizing the coordinated deformation state of the surrounding rock structure. Due to the dominant effect of stress on displacement, the stress and displacement of surrounding rock structure show the non-unithood feature. The chaotic state in the backfill mining tends to be disorderly, which increases the uncertainty and makes the mining environment more complicated. Consequently, it exacerbates the damage to the overlying rock, and might even damage the overlying aquifer, leading to water and sand inrush disasters.
Engineering practice shows that 11 panels in Taiping Coalmine have successfully achieved multiple layers paste backfill mining since 2006. The retained coal–rock pillars fully meet safe mining requirements, liberating a large amount of stagnant coal resources under the Sihe River and villages. The mining situation is listed in Table 1. According to the field investigation, the subsidence coefficient of backfill mining ranges from 0.14 to 0.34, far less than the 0.89 for the single-layer collapse method mining under the same condition [3]. The development of the fractured zone is slow, and no collapse zone forms in backfill mining, and the height of the water-conducting fractured zone is significantly reduced. The effects of backfill mining are good, with the consolidation degree and integrity of the backfill body fully meeting the requirements for roof support and waterproof performance in the underground. Especially during the multiple layers backfill mining, the backfill body is strong and stable, which can effectively serve as the immediate roof for the lower layer. Only local large deformation occurs in the open–off cut and stopping line, most of the rock strata show little deformation, which reduces the height of overburden failure and ensuring the safe mining of the multiple layers backfill mining, leading to the non-unithood stress and displacement of the surrounding rock structure. Additionally, the lithology uncertainty of the study area can also result in non-unithood stress and displacement of surrounding rock structure. Thus, paste backfill mining can effectively ensure the safe mining of coal seams under thin bedrock and thick loose aquifers.

Table 1.
Backfill mining situation of different panels.
However, due to the need for multidimensional processing and calculation of data in the spatiotemporal cube model, several drawbacks may occur during the application of the temporal–spatial cube visualization model. Firstly, there is great difficulty in data acquisition, storage and management, which may affect the security and reliability of data. Secondly, there is high complexity of data processing, which may affect the system’s performance and stability. Thirdly, there are difficulties in data updating, which may affect the real-time and accuracy of the data. Fourth, poor data visualization effect may result in reduced readability and comprehensibility of data.
Backfilling mining is a dynamic, open and complex nonlinear evolutionary process. The spatial–temporal evolution may extend the time series to the spatial evolution, and combine with the phase space reconstruction to establish the nonlinear spatial–temporal evolution model and obtain the corresponding evolutionary parameters in the further study. The map of the potential risks related to further stress and displacement in multiple layers backfill mining when it occurs in a chaotic state should also be researched in the further study. Moreover, the seepage on surrounding rock deformation, as well as the coupling characteristics of seepage field, deformation field and stress field, including the coupling characteristics of fracture evolution and stress response, stress response and seepage effect, fracture evolution and seepage effect, are also the focus of further research.
5. Conclusions
This study analyzed the temporal–spatial evolution process of stress and displacement in the surrounding rock structure during multiple layers backfill mining. The temporal–spatial cube visualization models were established to show the spatial and temporal distribution characteristics and evolution patterns of stress and displacement in the surrounding rock structure due to the multiple layers backfill mining, which revealed the coordinated deformation evolution mechanism and the disturbance and control mechanism of filling mining on aquifers and surrounding rock.
During the upper layer backfill mining, the stress and displacement of the surrounding rock structure extend with time and space, with larger color attribute values but smaller changes, and extreme attribute values appear locally. The stress in the backfill body decreased sharply and entered a dynamic stage of stress absorption and transfer, where the support function of the filling body limited the displacement of the roof and floor. The heterogeneity of stress and displacement in the surrounding rock structure of the lower layer backfill mining increased, displaying certain fluctuation characteristics. The backfill body required time and space buffers to absorb and transfer loads, and the displacement extends over time and space.
A symmetric KL-divergence quantitative characterization and measurement framework based on information entropy and mutual information of stress and displacement correlation degree and chaotic state was established. The concept of displacement entropy was proposed, and the hotspot distribution diagram of stress entropy, displacement entropy and KL-divergence was obtained.
The hotspot distribution patterns of stress entropy and displacement entropy during the upper layer backfill mining were opposite. The larger the displacement, the more obvious the stress release, with stress entropy hotspots not being concentrated. The KL-divergence between stress and displacement differed slightly, with the former slightly larger than the latter, which is consistent with the stress–displacement correlation efficiency’s hotspot distribution pattern. In the lower layer backfill mining, the hotspots of stress entropy in the surrounding rock structure decreased significantly, and the disorder of stress was reduced. The gap between stress entropy and displacement entropy narrowed, and the disorder level of stress–displacement tended to be consistent. The overall KL-divergence and symmetrical KL-divergence of stress–displacement increased, and the correlation between stress and displacement was enhanced, with the disorder level increasing and tending toward order, making the response of rock mass stress more significant.
Multiple layers backfill mining lead to an enhanced correlation and more chaotic states between stress and displacement. The backfill body coordinated its deformation and evolution with the roof and floor, with stress playing a dominant role over displacement, and displacement acting as a linkage response to stress. Moreover, the hotspot distributions of stress and displacement entropy, KL-divergency, and symmetric KL-divergency can clearly reflect the height of water-conducting fractured zone, which can be used as a technical parameter for predicting mine safety and mine design.
Engineering practice has shown that the consolidation degree and integrity of the backfill body fully meet the underground roof support and waterproof performance. Especially during themultiple layers backfill mining process, the backfill body in the upper layer can effectively serve as the immediate roof for the lower layer mining, ensuring safe mining in the lower layers. The results will provide a geological foundation basis for the optimized design and safe production of paste backfill mining under loose aquifers.
Author Contributions
Conceptualization, J.L. and W.S.; Methodology, J.L. and W.S.; Software, J.L.; Writing-Original Draft Preparation, J.L.; Writing-Review and Editing, W.S.; Formal analysis, J.L. and W.S.; Investigation, J.L.; Data Curation, J.L.; Resources, W.S.; Supervision, W.S.; Funding acquisition, W.S. and J.L. All authors have read and agreed to the published version of the manuscript.
Funding
This research was funded by the National Natural Science Foundation of China under Grant No. 42130706 and the Natural Science Foundation of Henan Province under Grant No. 232300421408.
Data Availability Statement
The datasets generated during the current study are available from the corresponding author on reasonable request.
Acknowledgments
The authors thank the Excellence Funding Project for Overseas Students in Henan Province for its support of this work.
Conflicts of Interest
The authors declare no conflict of interest.
References
- Xie, H.; Zhang, J.; Gao, F.; Li, B.; Li, C.; Xie, Y.; Zhou, N. Theory and technical conception of carbon-negative and high-efficient backfill mining in coal mines. J. China Coal Soc. 2024, 49, 36–46. (In Chinese) [Google Scholar]
- Wang, S.; Liu, L.; Zhu, M.; Shen, Y.; Shi, Q.; Sun, Q.; Fang, Z.; Ruan, S.; He, W.; Yang, P.; et al. New way for green and low-carbon development of coal industry under the target of “daul-carbon”. J. China Coal Soc. 2024, 49, 152–171. (In Chinese) [Google Scholar]
- Liu, J.; Sui, W.; Zhao, Q. Environmentally sustainable mining: A case study of intermittent cut-and-fill mining under sand aquifers. Environ. Earth Sci. 2017, 76, 562. [Google Scholar] [CrossRef]
- Yang, K.; Zhao, X.; Wei, Z.; Zhang, J. Development overview of paste backfill technology in China’s coal mines: A review. Environ. Sci. Pollut. R. 2021, 28, 67957–67969. [Google Scholar] [CrossRef]
- Zhu, C.; Zhang, J.; Taheri, A.; Zhou, N.; Li, Z.; Li, M. Control effect of coal mining solid-waste backfill for ground surface movement in slice mining: A case study of the Nantun Coal Mine. Environ. Sci. Pollut. R. 2023, 30, 27270–27288. [Google Scholar] [CrossRef]
- Xie, G.; Liu, L.; Suo, Y.; Zhu, M.; Yang, P.; Sun, W. Study on the green disposal of industrial high salt water and its performance as activator to prepare magnesium-coal based solid waste backfill material for mine. J. Clean. Prod. 2024, 452, 141933. [Google Scholar] [CrossRef]
- Xin, J.; Jiang, Q.; Gong, F.; Liu, L.; Liu, C.; Liu, Q.; Yang, Y.; Chen, P. Mechanical behaviors of backfill-rock composites: Physical shear test and back-analysis. J. Rock Mech. Geotech. Eng. 2024, 16, 807–827. [Google Scholar] [CrossRef]
- Zhao, K.; Huang, M.; Zhou, Y.; Yan, Y.; Wan, W.; Ning, F.; He, Z.; Wang, J. Synergistic deformation in a combination of cemented paste backfill and rocks. Constr. Build. Mater. 2022, 317, 125943. [Google Scholar] [CrossRef]
- Zhao, Y.; Zhao, G.; Xu, L.; Zhou, J.; Huang, X. Mechanical property evolution model of cemented tailings-rock backfill considering strengthening and weakening effects. Constr. Build. Mater. 2023, 377, 131081. [Google Scholar] [CrossRef]
- Du, X.; Feng, G.; Qi, T.; Guo, Y.; Zhang, Y.; Wang, Z. Failure characteristics of large unconfined cemented gangue backfill structure in partial backfill mining. Constr. Build. Mater. 2019, 194, 257–265. [Google Scholar] [CrossRef]
- Yu, X.; Kemeny, J.; Tan, Y.; Song, W.; Huang, K. Mechanical properties and fracturing of rock-backfill composite specimens under triaxial compression. Constr. Build. Mater. 2021, 304, 124577. [Google Scholar] [CrossRef]
- Yu, X.; Kemeny, J.; Li, J.; Song, W.; Tan, Y. 3D Observations of Fracturing in Rock-Backfill Composite Specimens Under Triaxial Loading. Rock Mech. Rock Eng. 2021, 54, 6009–6022. [Google Scholar] [CrossRef]
- Wu, W.; Xu, W.; Zuo, J. Effect of inclined interface angle on shear strength and deformation response of cemented paste backfill-rock under triaxial compression. Constr. Build. Mater. 2021, 279, 122478. [Google Scholar]
- Li, M.; Peng, Y.; Zhang, J.; Zhu, C.; Ma, D.; Huang, P. Effects of compressive deformation of backfill materials on strata movement and stress evolution in deep gangue backfill mining. Bull. Eng. Geol. Environ. 2022, 81, 361. [Google Scholar] [CrossRef]
- Zhu, W.; Wang, F.; Chen, S.; Yin, D.; Zhou, J.; Jie, Z.; Zou, Y. Asymmetric Deformation Mechanism of Roadway with Continuous Mining and Continuous Backfilling. Rock Mech. Rock Eng. 2024, 57, 2125–2142. [Google Scholar] [CrossRef]
- Zhu, X.; Guo, G.; Liu, H.; Yang, X. Surface subsidence prediction method of backfill-strip mining in coal mining. Bull. Eng. Geol. Environ. 2019, 78, 6235–6248. [Google Scholar] [CrossRef]
- Li, L.; Aubertin, M. Numerical Analysis of the Stress Distribution in Symmetrical Backfilled Trenches with Inclined Walls. Indian Geotech. J. 2015, 45, 278–290. [Google Scholar] [CrossRef]
- Tesarik, D.R.; Seymour, J.B.; Yanske, T.R. Post-failure behavior of two mine pillars confined with backfill. Int. J. Rock Mech. Min. Sci. 2003, 40, 221–232. [Google Scholar] [CrossRef]
- De Santis, F.; Renaud, V.; Gunzburger, Y.; Kinscher, J.; Bernard, P.; Contrucci, I. In situ monitoring and 3D geomechanical numerical modelling to evaluate seismic and aseismic rock deformation in response to deep mining. Int. J. Rock Mech. Min. Sci. 2020, 129, 104273. [Google Scholar] [CrossRef]
- Zhao, K.; Zhou, Y.; Yu, X.; Yan, Y.; Song, Y.; Wang, J.; Suo, T.; Guo, X. Dynamic Prediction Model of Overburden Settlement in Deep Mining Areas based on Space–Time Relationship. Nat. Resour. Res. 2021, 30, 3839–3852. [Google Scholar] [CrossRef]
- Yang, K.; Zhao, X.; He, X.; Zhou, G.; Wei, Z.; Zhang, J.; Ji, J. Study on the Spatiao Tempora Evolution Law and Mechanism of the Three-field of Overlying Strata In-stiu Backfill Mining. J. Min. Saf. Eng. 2023, 40, 643–655. (In Chinese) [Google Scholar]
- Xie, S.; Gao, M.; Chen, D.; Yue, S. Study on the distribution and evolution characteristics of spherical stress shell in backfilling mining stope. J. Min. Saf. Eng. 2019, 36, 16–23. (In Chinese) [Google Scholar]
- Wei, P.; Li, X.; Hu, Q.; Peng, S.; Liu, S. A trapezoidal three-dimensional model for gas extraction based on shapes of caved overlying strata and numerical calculation. Nat. Resour. Res. 2020, 29, 4031–4051. [Google Scholar] [CrossRef]
- Zhao, B.; He, S.; Bai, K.; Lu, X.; Wang, W. Elastic wave prospecting of water-conducting fractured zones in coal mining. Sci. Rep. 2024, 14, 7036. [Google Scholar] [CrossRef]
- Bo, H.; Guo, G.; Li, H.; Wang, Y.; Jiang, Q.; Hu, S.; Zhang, F. Study on surface subsidence prediction method of shallow coal seam backfill strip mining under the hard roof. Bull. Eng. Geol. Environ. 2023, 82, 281. [Google Scholar] [CrossRef]
- Zhang, Y.; Cao, S. Control of water-flowing fracture development with solid backfill mining: Designing a backfill body compression ratio for water resources protection. Mine Water Environ. 2021, 40, 877–890. [Google Scholar] [CrossRef]
- Liu, J.; Sui, W. Determination of mechanical and microstructure properties of paste backfills to avoid to overburden failure. J. Clean. Prod. 2023, 388, 135926. [Google Scholar] [CrossRef]
- Bai, E.; Guo, W.; Zhang, H.; Tan, Y.; Ma, Z.; Wu, D.; Guo, M.; Wen, P. Coal mining method with near-zero impact on the ecological environment in a high-intensity mining area of Northwest China. Bull. Eng. Geol. Environ. 2022, 81, 80. [Google Scholar] [CrossRef]
- Bo, L.; Yang, S.; Liu, Y.; Wang, Y.; Zhang, Z. Research on the data validity of a coal mine solid backfill working face sensing system based on an improved transformer. Sci. Rep. 2023, 13, 11092. [Google Scholar] [CrossRef]
- Yang, P.; Liu, L.; Suo, Y.; Qu, H.; Xie, G.; Zhang, C.; Deng, S.; Lv, Y. Basic characteristics of magnesium-coal slag solid waste backfill material: Part I. preliminary study on flow, mechanics, hydration and leaching characteristics. J. Environ. Manag. 2023, 329, 117016. [Google Scholar] [CrossRef]
- Wang, J.; Ge, Y.; Li, L.; Meng, B.; Wu, J.; Bai, Y.; Du, S.; Liao, Y.; Hu, M.; Xu, C. Spatiotemporal data analysis in geography. Acta Geogr. Sin. 2014, 69, 1326–1345. [Google Scholar]
- Shannon, C.E.; Weaver, W. The Mathematical Theory of Communication (Urbana, IL). Philos. Rev. 1949, 60, 1–54. [Google Scholar]
- Shannon, C.E. A mathematical theory of communication. Bell Syst. Tech. J. 1948, 27, 379–423. [Google Scholar] [CrossRef]
- Gong, W. Watershed Model Uncertainty Analysis Based on Information Entropy and Mutual Information. Doctoral Thesis, Tinghua University, Beijing, China, 2012. (In Chinese). [Google Scholar]
- Yang, B. Spatio-Temporal Variation of Fractures in Overburden Due to Mining and Risk Assessment Model for Water and Sand Inrush. Doctoral Thesis, China University of Mining and Technology, Xuzhou, China, 2018. (In Chinese). [Google Scholar]


Disclaimer/Publisher’s Note: The statements, opinions and data contained in all publications are solely those of the individual author(s) and contributor(s) and not of MDPI and/or the editor(s). MDPI and/or the editor(s) disclaim responsibility for any injury to people or property resulting from any ideas, methods, instructions or products referred to in the content. |
© 2024 by the authors. Licensee MDPI, Basel, Switzerland. This article is an open access article distributed under the terms and conditions of the Creative Commons Attribution (CC BY) license (https://creativecommons.org/licenses/by/4.0/).