Article

Research on Glacier Changes and Their Influencing Factors in the Yigong Zangbo River Basin of the Tibetan Plateau, China, Based on ICESat-2 Data

1
Research Center of Big Data Technology, Nanhu Laboratory, Jiaxing 314000, China
2
College of Information Engineering, Jiaxing Nanhu University, Jiaxing 314001, China
3
Jiaxing Key Laboratory of Intelligent Computing and Data Science, Jiaxing 314001, China
4
School of Earth Sciences and Engineering, Hohai University, Nanjing 211100, China
5
Institute of Tibetan Plateau Research, Chinese Academy of Sciences, Beijing 100101, China
6
Chongqing Shete Meteorological Application Research Institute, Chongqing 401120, China
*
Author to whom correspondence should be addressed.
Water 2024, 16(18), 2617; https://doi.org/10.3390/w16182617
Submission received: 28 August 2024 / Revised: 11 September 2024 / Accepted: 12 September 2024 / Published: 15 September 2024
(This article belongs to the Section Water and Climate Change)

Abstract

:
The intense changes in glaciers in the southeastern Tibetan Plateau (SETP) have essential impacts on regional water resource management. In order to study the seasonal fluctuations of glaciers in this region and their relationship with climate change, we focus on the Yigong Zangbo River Basin in the SETP, extract the annual and seasonal variations of glaciers in the basin during 2018–2023, and analyze their spatio-temporal characteristics through the seasonal-trend decomposition using the LOESS (STL) method. Finally, combining the Extreme Gradient Boosting (XGBoost) model and the Shapley additive explanations (SHAP) model, we assess the comprehensive impact of meteorological factors such as temperature and snowfall on glacier changes. The results indicate that glaciers in the Yigong Zangbo River Basin experienced remarkable mass loss during 2018–2023, with an average annual melting rate of −0.83 ± 0.12 m w.e.∙yr−1. The glacier mass exhibits marked seasonal fluctuations, with increases in January–March (JFM) and April–June (AMJ) and noticeable melting in July–September (JAS) and October–December (OND). The changes over these four periods are 2.12 ± 0.04 m w.e., 0.93 ± 0.15 m w.e., −1.58 ± 0.19 m w.e., and −1.32 ± 0.17 m w.e., respectively. Temperature has been identified as the primary meteorological driver of glacier changes in the study area, surpassing the impact of snowfall. This study uses advanced altimetry data and meteorological data to monitor and analyze glacier changes, which provides valuable data for cryosphere research and also validates a set of replicable research methods, which provides support for future research in related fields.

1. Introduction

The Tibetan Plateau has the largest alpine ecosystem in the mid-latitude range and is also one of the largest freshwater reservoirs in the world [1]. The plateau serves as the source of many of Asia’s major rivers, playing a crucial role in regional ecological balance and socio-economic development [2]. As a highly sensitive region to global climate change, the Tibetan Plateau is undergoing remarkable glacier retreat and rapid lake expansion due to ongoing global warming [3], which profoundly impacts regional ecosystem health and water resource management [2,4]. Notably, the SETP, influenced by the monsoon climate and characterized by temperate maritime glaciers [5], exhibits the most dramatic loss of glacier mass in the entire Himalayan region and its surroundings [6,7]. Temperate glaciers are mainly distributed in High Asia, the European Alps, the Andes in South America, and western North America. Studies have shown that in recent decades, all glaciers in the Alps have shown negative balance, the accumulation area has continued to decline [8], the continuous decline of glaciers in the Andes has led to the formation and expansion of hundreds of glacial lakes [9], and the glaciers in the SETP have experienced an accelerated melting trend [10,11]. This rapid glacier retreat and the increase in glacial meltwater have profoundly affected runoff volume and the changes in land cover types, leading to lake expansion and triggering geologic hazards such as landslides and debris flows [12,13]. Historically, large-scale landslides have repeatedly occurred in the SETP, forming extensive barrier lakes and subsequent outburst floods causing widespread downstream flooding [14].
The issue of glacier changes in alpine regions has become increasingly prominent, and thus, numerous related studies have been conducted. Traditional mass balance observations capture and obtain the spatio-temporal characteristics of ice volume changes through field surveys [15]. Some researchers use glacier hydrological models and glacier mass balance models to analyze the response of glaciers to regional climate conditions [7]. With the development of remote sensing technology, this non-contact observation method has gradually become an indispensable tool in glacier change research in plateau areas. Multi-source remote sensing data, including KH-9 [16], Landsat [17], UAV [18], ICESat [19], and TanDEM-X [20,21], are widely used to investigate glacial area changes and glacier mass balance. Based on these data, either by measuring elevations or creating digital elevation models (DEM) at different times [22], geodetic methods can accurately describe glacier changes over the past few decades and analyze the spatio-temporal characteristics of these changes [23,24]. The seasonal variation in glaciers has significant impacts on regional water cycles [25,26]. However, studies on glacier changes in short timescales primarily utilize ground laser scanning and field measurements [27]. With the release of the Ice, Cloud and land Elevation Satellite (ICESat-2) altimetry data, monitoring seasonal variations in glacier mass has become possible [28,29]. Due to the complex terrain and cloudy weather conditions in the SETP, it is difficult to use satellite altimetry data to study the glacier mass balance on a seasonal timescale, and most studies focus on decadal and interannual variations. Therefore, in this study, we use the ICESat-2 altimetry data to extract interannual and seasonal glacier changes and analyze their spatio-temporal characteristics.
Research on glacier changes requires not only an analysis of the spatio-temporal characteristics of these changes but also an exploration of their driving factors. Currently, the analysis of driving factors for glacier changes typically employs several typical methods, such as correlation analysis [30], sensitivity analysis [31], and forcing experiments [7]. According to previous studies, the main determinants of dynamic glacier changes on the Tibetan Plateau are temperature and precipitation [32,33]. Over the past few decades, simultaneous changes in temperature and precipitation have limited the use of traditional analysis methods to estimate their relative impacts on glacier changes [7]. This limitation makes it difficult to capture their influence on glacier changes. Lundberg and Lee (2017) proposed an innovative theoretical framework known as SHAP [34], which quickly became an important tool for interpreting the decision mechanisms of complex machine learning models. The SHAP allows the output value of each prediction instance to be decomposed into the sum of contributions from each feature. This not only reveals the influence of individual features on model output but also provides both global and local interpretability for models like XGBoost [35]. Based on the revelation of this method [36,37], our study uses the XGBoost model to evaluate the influence of driving factors on glacier mass changes (GMCs), and employs the SHAP algorithm to interpret the evaluation results of the XGBoost model. In contrast with previous research, this study aims to reveal the specific functional relationships and relative importance between the driving factors and the GMC, thereby providing a clearer perspective for the study of glacier change mechanisms.
In this research, the Yigong Zangbo River Basin in the SETP region is selected as the study area, and the glaciers within the basin are taken as the research object. Based on the ICESat-2 data, we extracted the interannual and seasonal glacier changes, analyzed the spatio-temporal characteristics of glacier changes, and determined the importance and specific functional relationships of meteorological driving factors with glacier changes. As the SETP is one of the regions where temperate glaciers are concentrated, the study of glacier changes and their climate-influencing factors not only has a significant impact on the regional ecological environment and water resource security but also provides a valuable scientific basis for the formulation of global sustainable development and climate adaptation strategies.

2. Study Area and Datasets
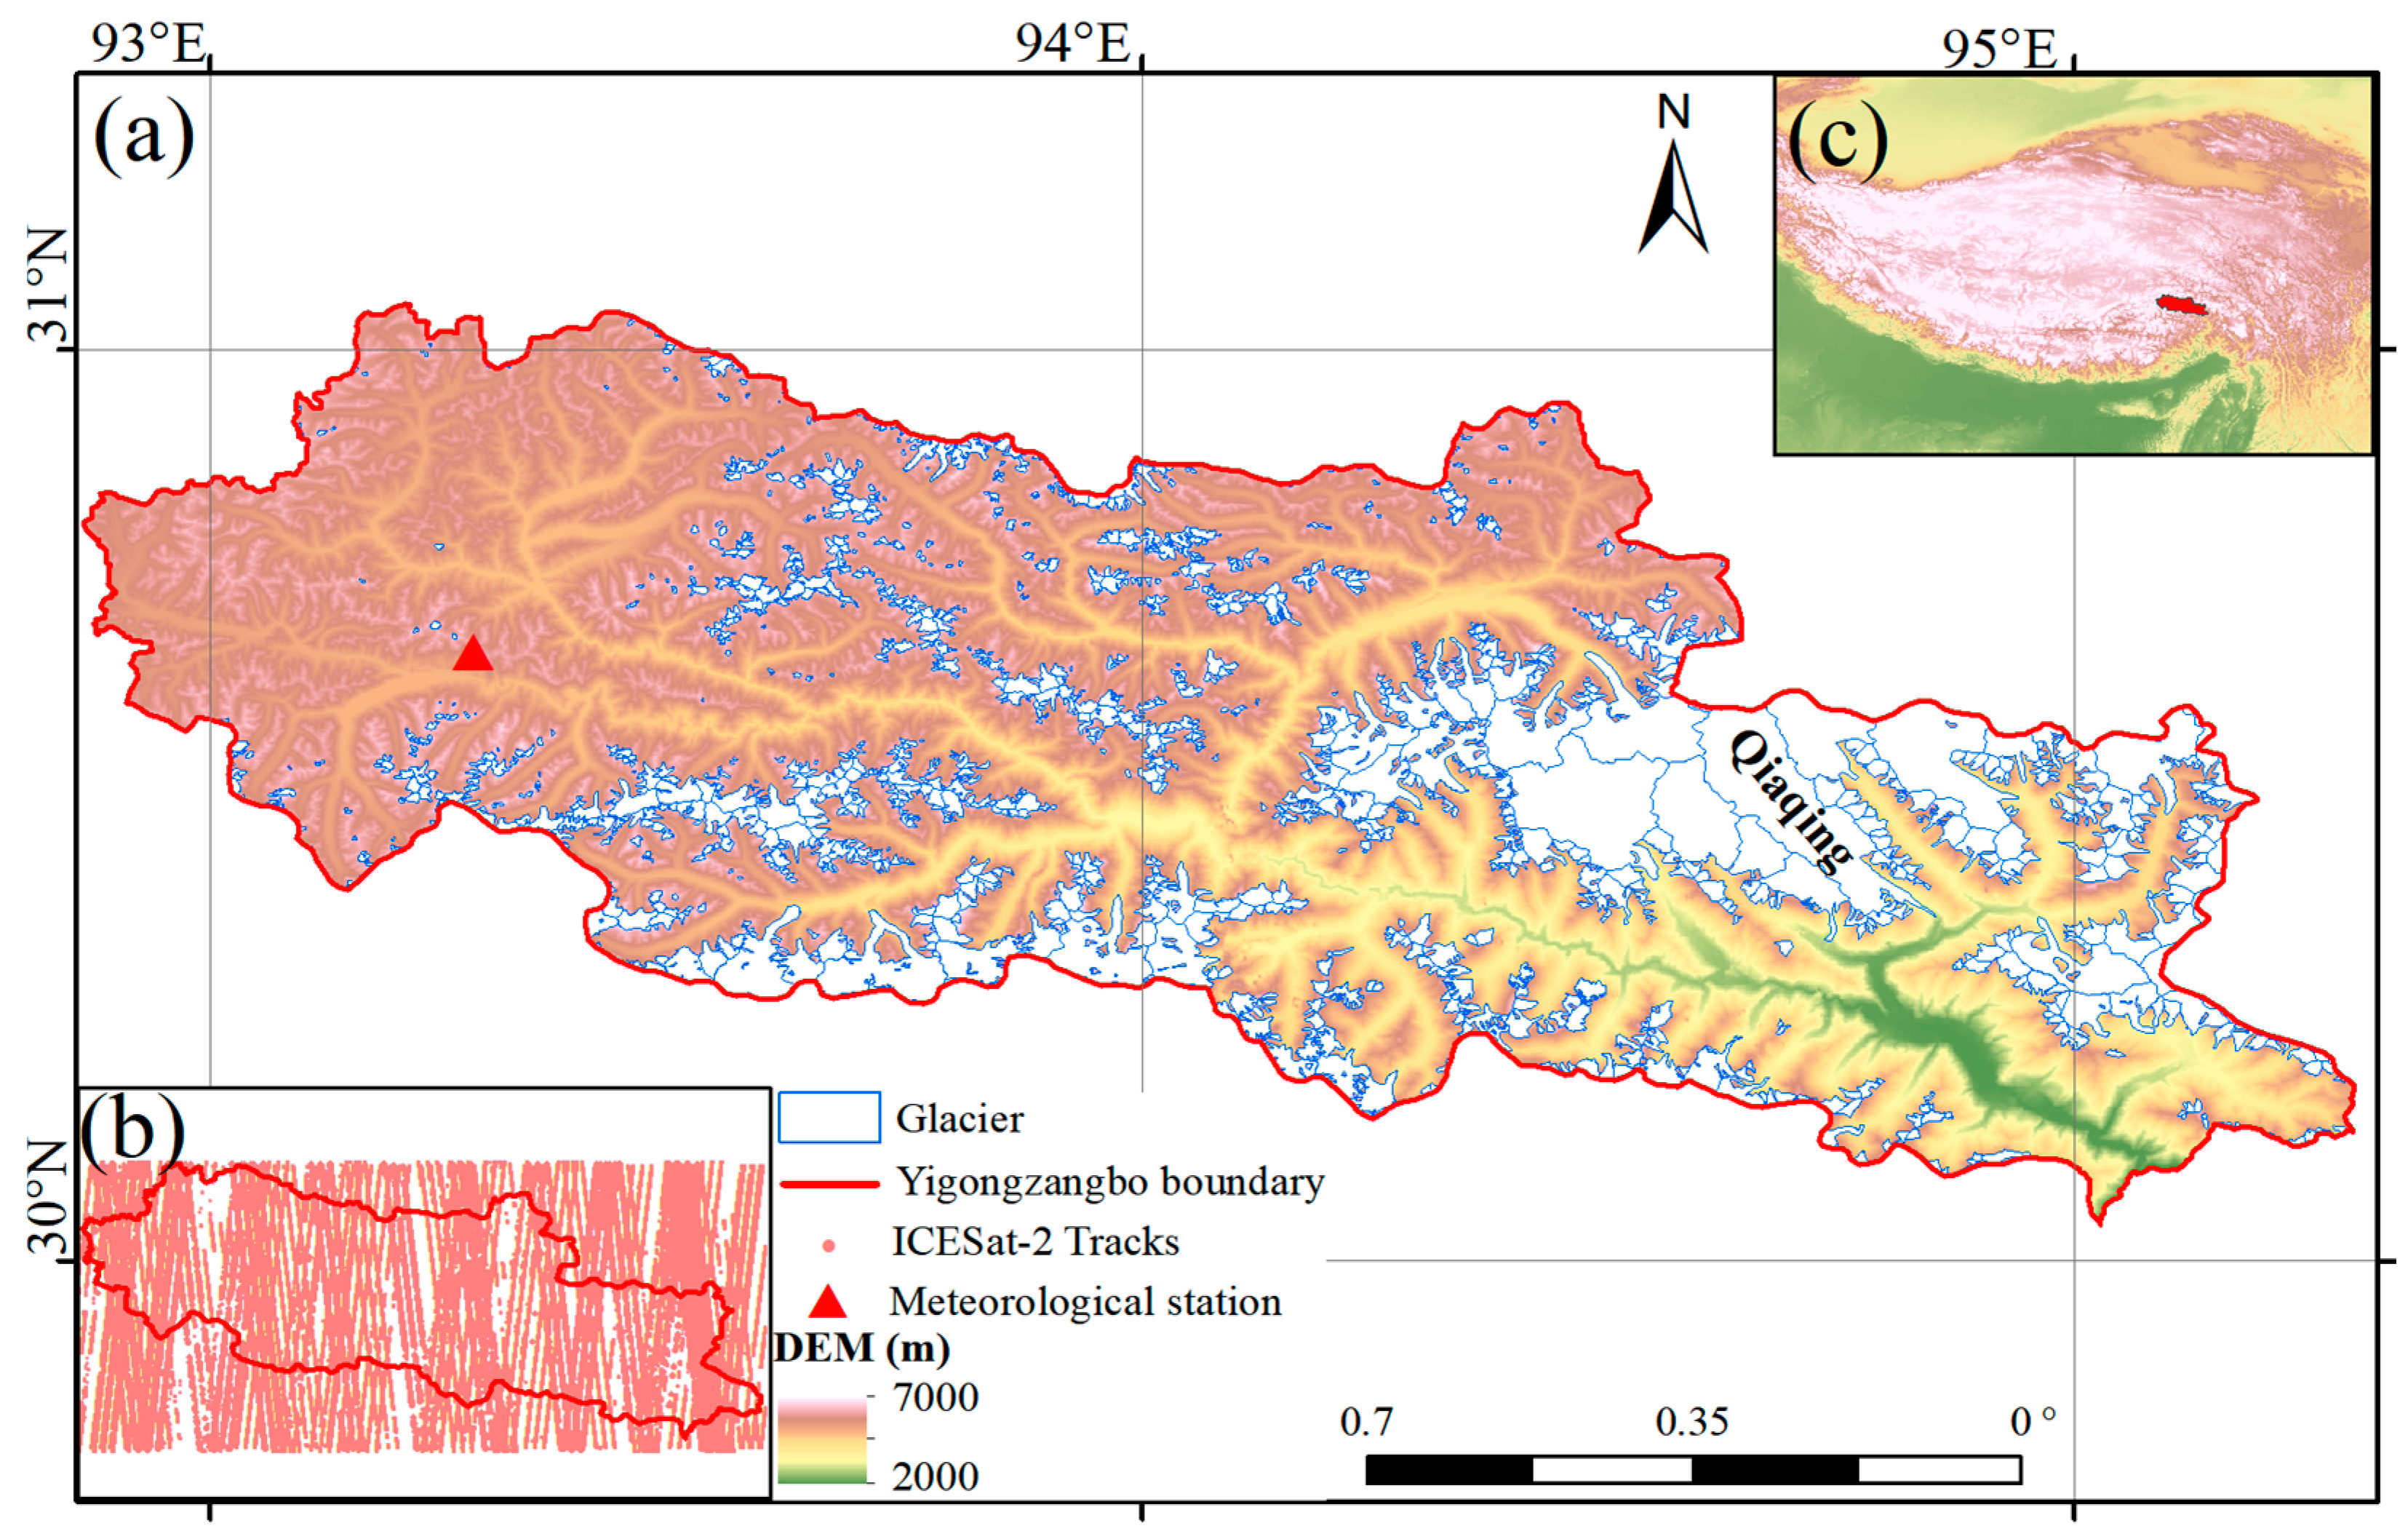
2.1. Study Area

The study area is the Yigong Zangbo River Basin (92.86° E–95.30° E, 30.03° N–31.05° N) (Figure 1a). The Yigong Zangbo River is the largest tributary of the Parlung Zangbo River, originating from the southern foothills of the Nyainqentanglha Mountains in the northwest of Lhari County. The basin covers an area of 13,533 km2, accounting for 47.3% of the Parlung Zangbo River Basin. The terrain is high in the west and low in the east, with altitudes of 2000–6900 m. The basin is characterized by a deeply incised alpine terrain, with numerous snow-capped mountains and glaciers. Influenced by the northward advance of the warm and humid air currents from the Indian Ocean, the basin experiences a humid climate with abundant precipitation. This environment fosters the development of temperate glaciers, which are highly sensitive to climate change [38]. The Qiaqing Glacier, the largest temperate glacier in China, is located within this basin, ranging from 4500 m to 6900 m in altitude, covering an area of 131 km2 and extending approximately 30.2 km in length. The temperature and precipitation in this basin show remarkable seasonal variations. Meteorological data from 2018 to 2023 indicate that the average temperature during four months of the year (June–September) exceeds 0 °C, with the peak temperature occurring in August (4.5 °C), the lowest temperature of the year in January (−15.7 °C), the maximum monthly precipitation in July (178.3 mm), and the minimum monthly precipitation in January (8.6 mm).

2.2. Dataset

2.2.1. ICESat-2 Data

The ICESat-2 is an Earth observation satellite launched in September 2018. Its primary mission is to measure changes in ice sheet elevation and global surface height to study the impacts of climate change. The sensor aboard ICESat-2 measures the time it takes to bounce back from the Earth’s surface using laser pulses to determine the surface height, which is measured with an accuracy of approximately 0.03 m. The ICESat-2 data consist of three pairs of beams, each pair spaced approximately 3 km apart, with an intra-beam spacing of 90 m. The laser point diameter is about 17 m, and the along-track spacing is approximately 0.7 m [39]. This study primarily utilizes the ATL06 (Land Ice Height) product from the ICESat-2 dataset (https://nsidc.org/data/icesat-2/, accessed on 7 July 2024) (Figure 1b). The ATL06 provides high-precision surface elevation information of ice sheets and glaciers at 20 m intervals along photon trajectories.

2.2.2. ALOS DEM Data

The Advanced Land Observing Satellite (ALOS) is an advanced Earth observation satellite launched in January 2006. Its primary purpose is to provide high-precision geospatial data for applications such as topographic mapping, environmental monitoring, and disaster assessment. The sensors carried by ALOS operate in Interferometric Synthetic Aperture Radar (InSAR) fine-beam single-polarization mode, providing L-band high-resolution (12.5 m), high precision, and wide-coverage DEM (https://search.asf.alaska.edu/, accessed on 12 June 2024). The L-band, with its deep penetration capability, offers superior-quality data in glacier-covered regions [40]. This study utilizes the ALOS DEM data from February 2009 as the baseline data for the research area.

2.2.3. Meteorological Data

Lhari national meteorological station, located in the western part of the study area, may not accurately represent the overall meteorological conditions of the basin, and there remain uncertainties in the distributions of precipitation and temperature. Therefore, this study uses a combination of the high-resolution near-surface meteorological forcing dataset in the Third Pole region (TPMFD) and meteorological station observations to assess the spatio-temporal patterns of precipitation and temperature in the study area. The TPMFD is a high-resolution (1/30°) ground-based meteorological element dataset (https://data.tpdc.ac.cn/, accessed on 10 July 2024). The precipitation and temperature data in the TPMFD are derived from a fusion of short-term high-resolution simulations (using the Weather Research and Forecasting model), long-term ERA5 reanalysis data, and station observations. This dataset offers higher accuracy compared with current mainstream reanalysis data and is suitable for climate analysis and model input related to land surface, hydrology, and ecology in the Third Pole region [41]. In this study, the monthly average temperature and daily precipitation data from the TPMFD during 2018–2023 are used. Since Lhari station in the study area is located at an altitude of 4488 m within the main glacier distribution range, daily snowfall is determined based on the station data. Monthly snowfall is then calculated for the meteorological factor analysis of glacier changes in the study area.

2.2.4. Auxiliary Data
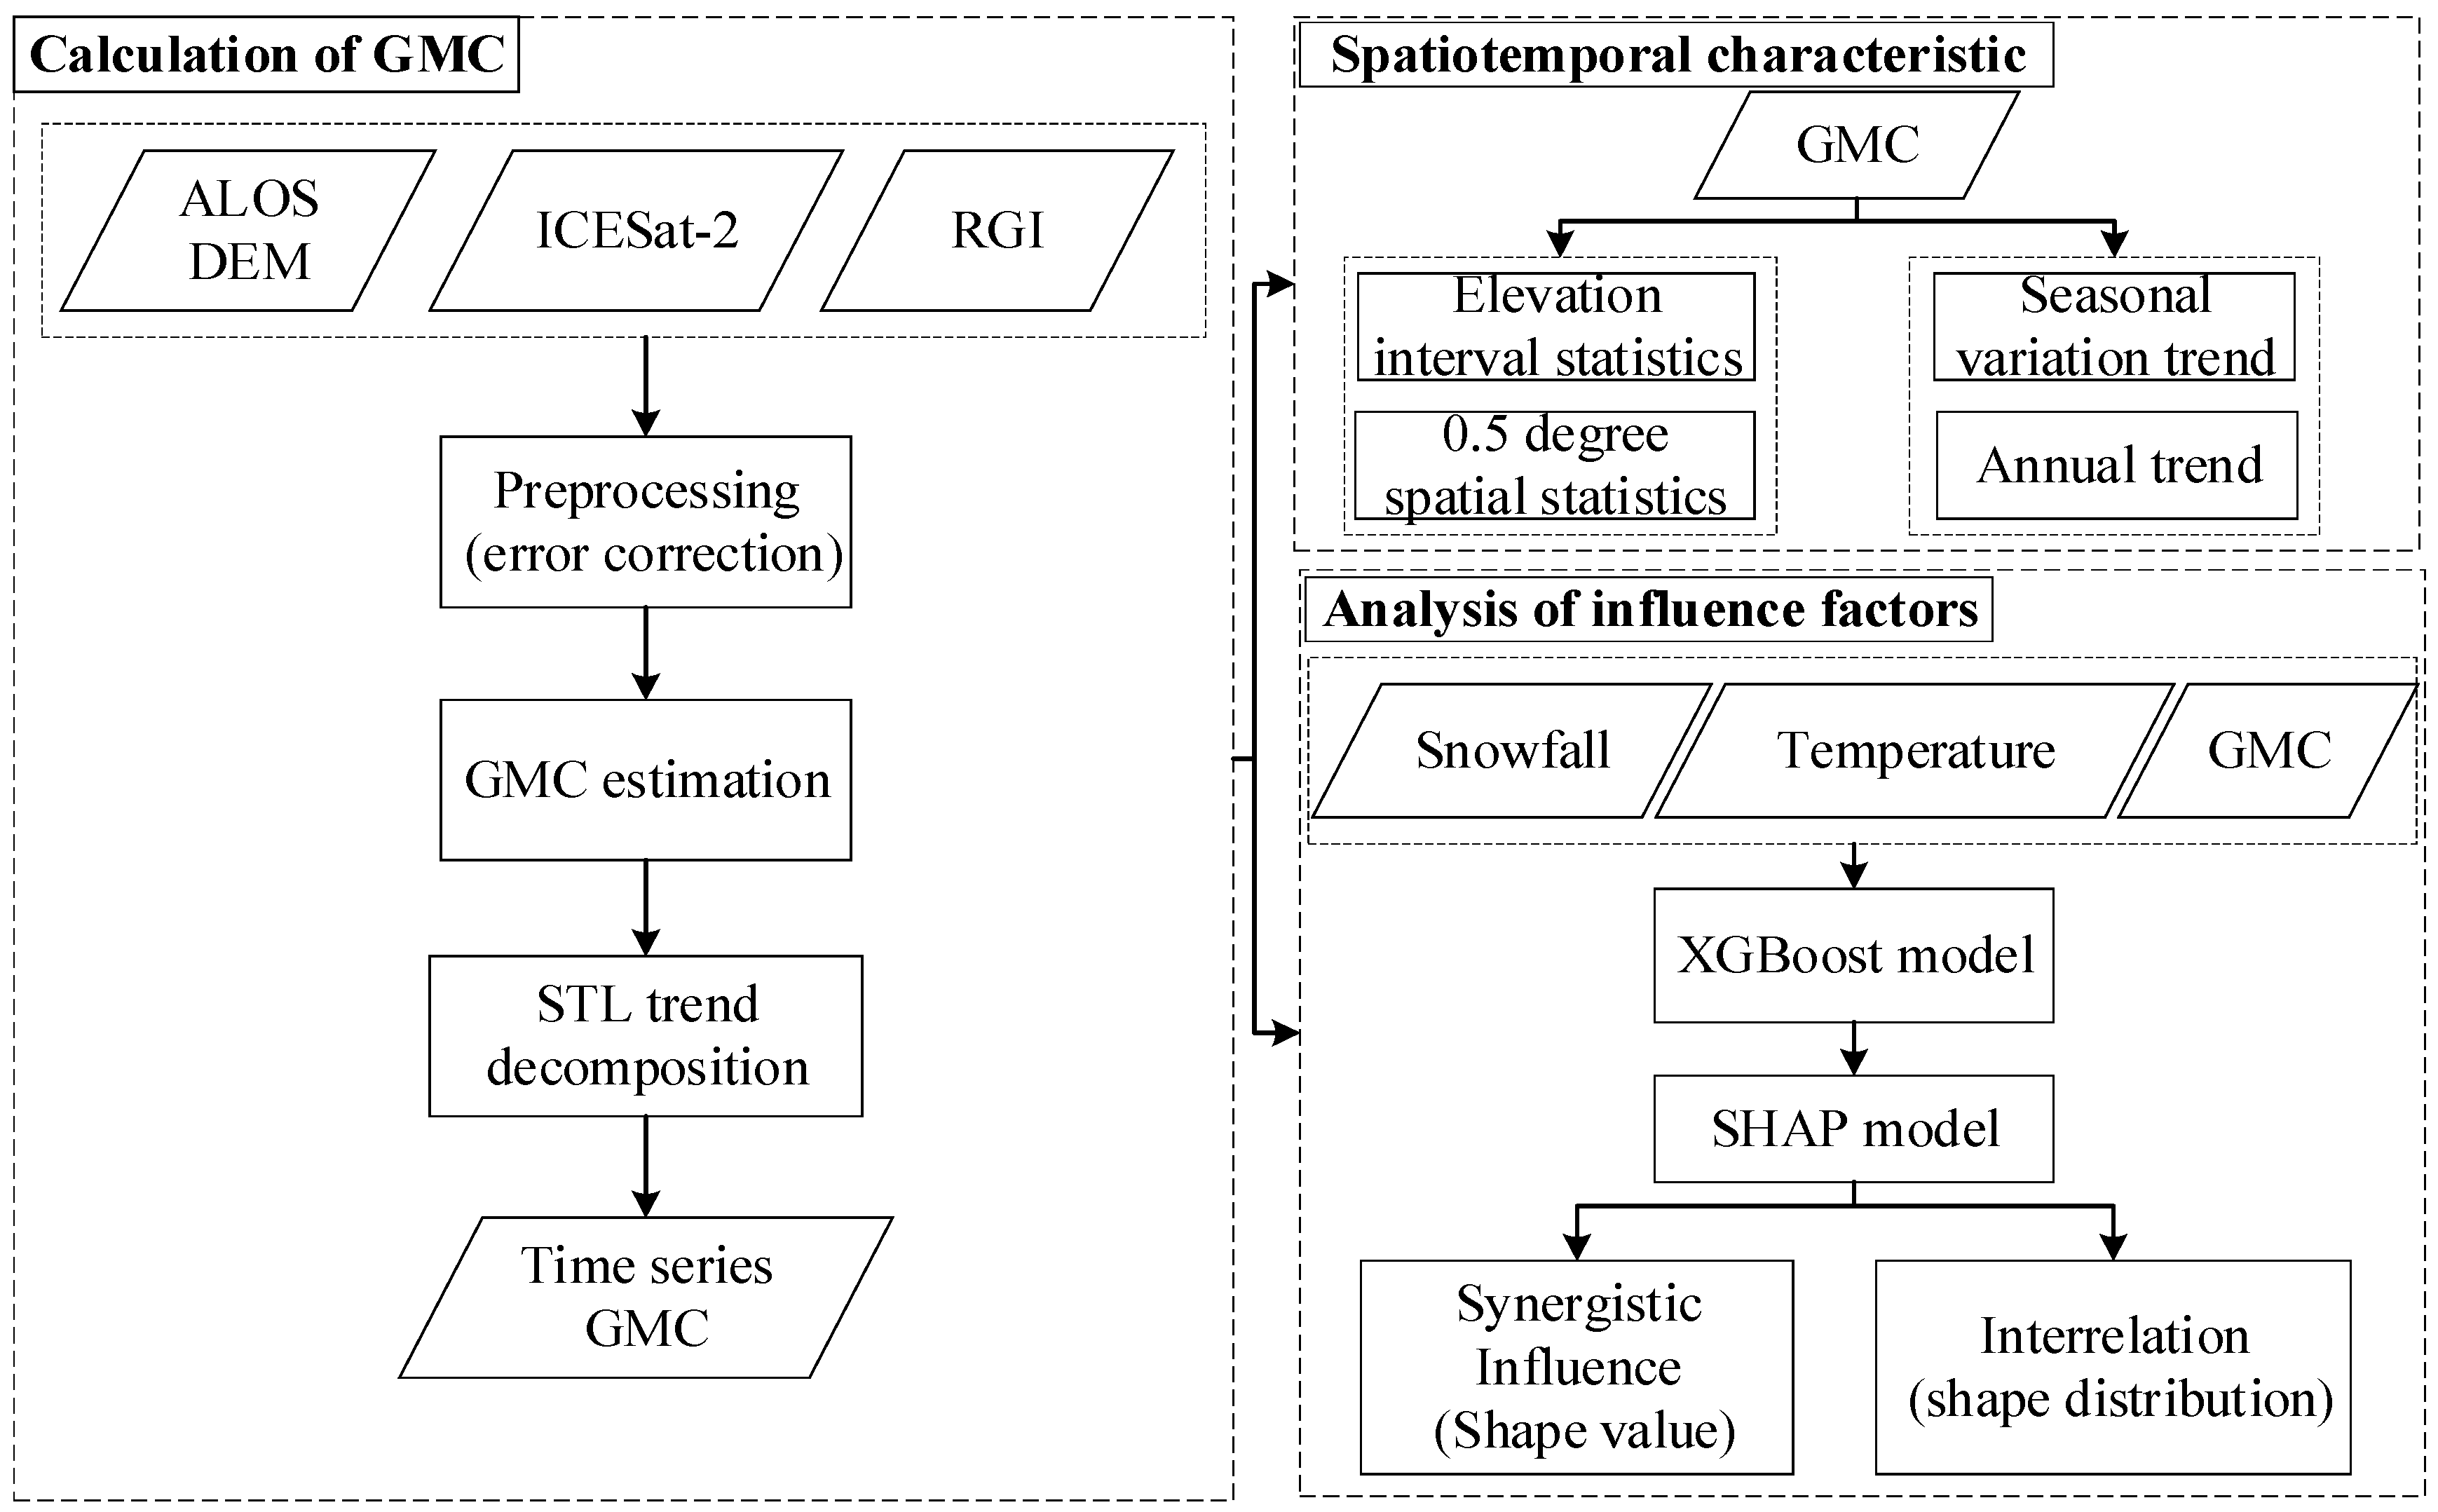
In this study, we adopt the Randolph Glacier Inventory (RGI) dataset (https://nsidc.org/data/glims/, accessed on 2 June 2024), which is a comprehensive global glacier database. The RGI dataset contains the boundaries, area, elevation, and length of glaciers worldwide, creating a valuable repository of glacier geographic information. Data collection primarily relies on the Landsat TM/ETM+ satellite imagery, supplemented by other high-resolution remote sensing images and topographic data from the ASTER, IKONOS, and SPOT, which ensure the richness and accuracy of the data [42]. The latest version, version 6.0, was officially released in July 2017. Given its high quality and detailed content, this version is used as a data source in this study to precisely delineate glacial and non-glacial areas in the research region.

3. Methods

The main research content of this study is divided into three parts (Figure 2): glacier change extraction, spatio-temporal analyses of glacier change characteristics, and the synergistic effects of meteorological factors. First, we extracted the GMC in the Yigong Zangbo River Basin during four periods of JFM, AMJ, JAS, and OND during 2018–2023. Then, multiple components were obtained by trend decomposition of the GMC sequence. On this basis, spatio-temporal analysis methods were employed to identify the interannual and seasonal variation trends of the glaciers in the study area, as well as the spatial distribution characteristics of seasonal glacier variations. Finally, through a combination of the XGBoost and SHAP models, this study reveals the synergistic effects of meteorological driving factors such as temperature and snowfall on glacier changes and their interrelationships.

3.1. Estimates of Glacier Mass Change

In this research, we estimate surface elevation changes based on the elevation differences between the ICESat-2 and ALOS DEM data within the glacier-covered areas of the study region. To obtain a sufficient number of the ICESat-2 footprints for calculating glacier elevation changes (GECs) and to improve the reliability of calculations, we focus on a seasonal timescale rather than on a monthly timescale. Since ICESat-2 footprint is not evenly distributed in space, and GECs vary along altitude due to different energies and conditions [43], we divided the glacier along altitude into equal intervals and estimated GEC for each altitude interval. The overall GEC in the study area are calculated as the area-weighted average of the GEC at different elevation intervals [44].
For ICESat-2 footprints in each season, the GEC relative to the ALOS DEM can be estimated by Equation (1).
h i = H I C E S a t H A L O S   D E M P A L O S   D E M   ( i = O N D   2018 , , J A S   2023 )
where HICESat denotes the elevation of the ICESat-2 footprints, and HALOS DEM indicates the elevation of the corresponding point in the ALOS DEM data obtained by using bilinear interpolation. PALOS DEM represents the L-band penetration depth in glacial areas, which is ignored when the footprint is in non-glacial areas. Since the reference ALOS DEM used in this study was collected in February 2009, we obtained the ICESat-1 elevation data from December 2008 that passed over the study area to estimate the penetration depth and its error of the L-band on the glacier surface. After correcting for elevation differences in non-glacial areas, we compared the differences in glacial areas via penetration depth. According to the statistics, the penetration depth of the L-band for the glacier surface elevation in the study area is 3.58 ± 0.93 m.
To reduce the influence of data anomalies of the ICESat-2 and ALOS-DEM on steep slopes, we removed all points with | h i | > 100 m and with a surface slope greater than 30° [29]. Then, the points on the glacier were divided at 100 m elevation intervals. In season i, the GEC ( h i , j ) in elevation zone j relative to the ALOS DEM was estimated as the median of all points ( h i ) within that elevation zone. The overall GEC ( H i ) in season i is the area-weighted value across all elevation intervals, as expressed by Equation (2) [28].
H i = j = 0 n F j × h i j ( j = 1,2 , , n )
where H i represents the estimated GEC in season i, n the number of elevation bins, and Fj the ratio of the glacial area in elevation interval j to the total glacial area. To reduce estimation errors caused by the uneven distribution of the ICESat-2 points at different altitudes, we estimated H i using 100 m elevation intervals starting from 3000 m, 3025 m, 3050 m, and 3075 m, obtaining four H i values. Then, we took the average of these H i values, denoted as | H i | ¯ , as the final estimate of the GEC in season i.
The GMC was estimated based on changes in glacial area, glacier surface elevation, and ice density. Due to the short time span and the presence of extensive debris-covered glaciers in the study area, it was difficult to identify the change in the glacier boundary. Therefore, we assumed that the seasonal change in the glacial area can be neglected. In the study area, the GMC ( M i , unit: m w.e.) in season i can be calculated by converting the GEC to water equivalent using ice density.
M i = f × | H i | ¯
where f represents the average density of mountain glaciers, approximately 850 kg m−3 [45].
Based on the above algorithm, we could obtain the GMC relative to ALOS DEM for each time period from 2018 to 2023 in the study area. To further analyze the spatio-temporal characteristics of the GMC, we calculated the GMC for each time period at both 200 m elevation intervals and in 0.5° × 0.5° grid cells. The difference in glacier mass between adjacent seasons ( M i = M i M i 1 ) was also calculated, and the mean seasonal GMC ( G M C ¯ ) and M ( M ¯ ) were counted, which were used as the baseline data for analyzing the spatial characteristics of GMCs in Section 4.2.

3.2. Decomposition of Seasonal Trends

To further analyze the temporal characteristics of glacier changes during 2018–2023, this study employed the STL method [46]. The STL method can decompose a non-stationary seasonal time series into three components: the trend term (T) reflecting long-term changes, the seasonal term (S) capturing periodic seasonal fluctuations, and the residual term (ε) representing random noise or remaining variation. Using the GMC as an example, the GMC ( M i ) in season i can be decomposed by the STL method, as shown in Equation (4) [28].
M i = T i + S i + ε i
where T i , S i , and ε i represent the trend term, seasonal term, and residual term in season i, respectively, during OND 2018 to JAS 2023.
Subsequently, we performed a least-squares linear regression analysis on the deseasonalized GMC series X ( X i = T i + ε i ) to derive the seasonal change rate of glaciers (i.e., the slope of the linear regression). The annual change rate of glaciers can be considered as four times the seasonal change rate. Additionally, by calculating the differences between adjacent values in the seasonal term S ( M S T L = S i S i 1 ), we can identify the growth or ablation characteristics of glacier mass in different seasons.

3.3. Analysis of Influencing Factors

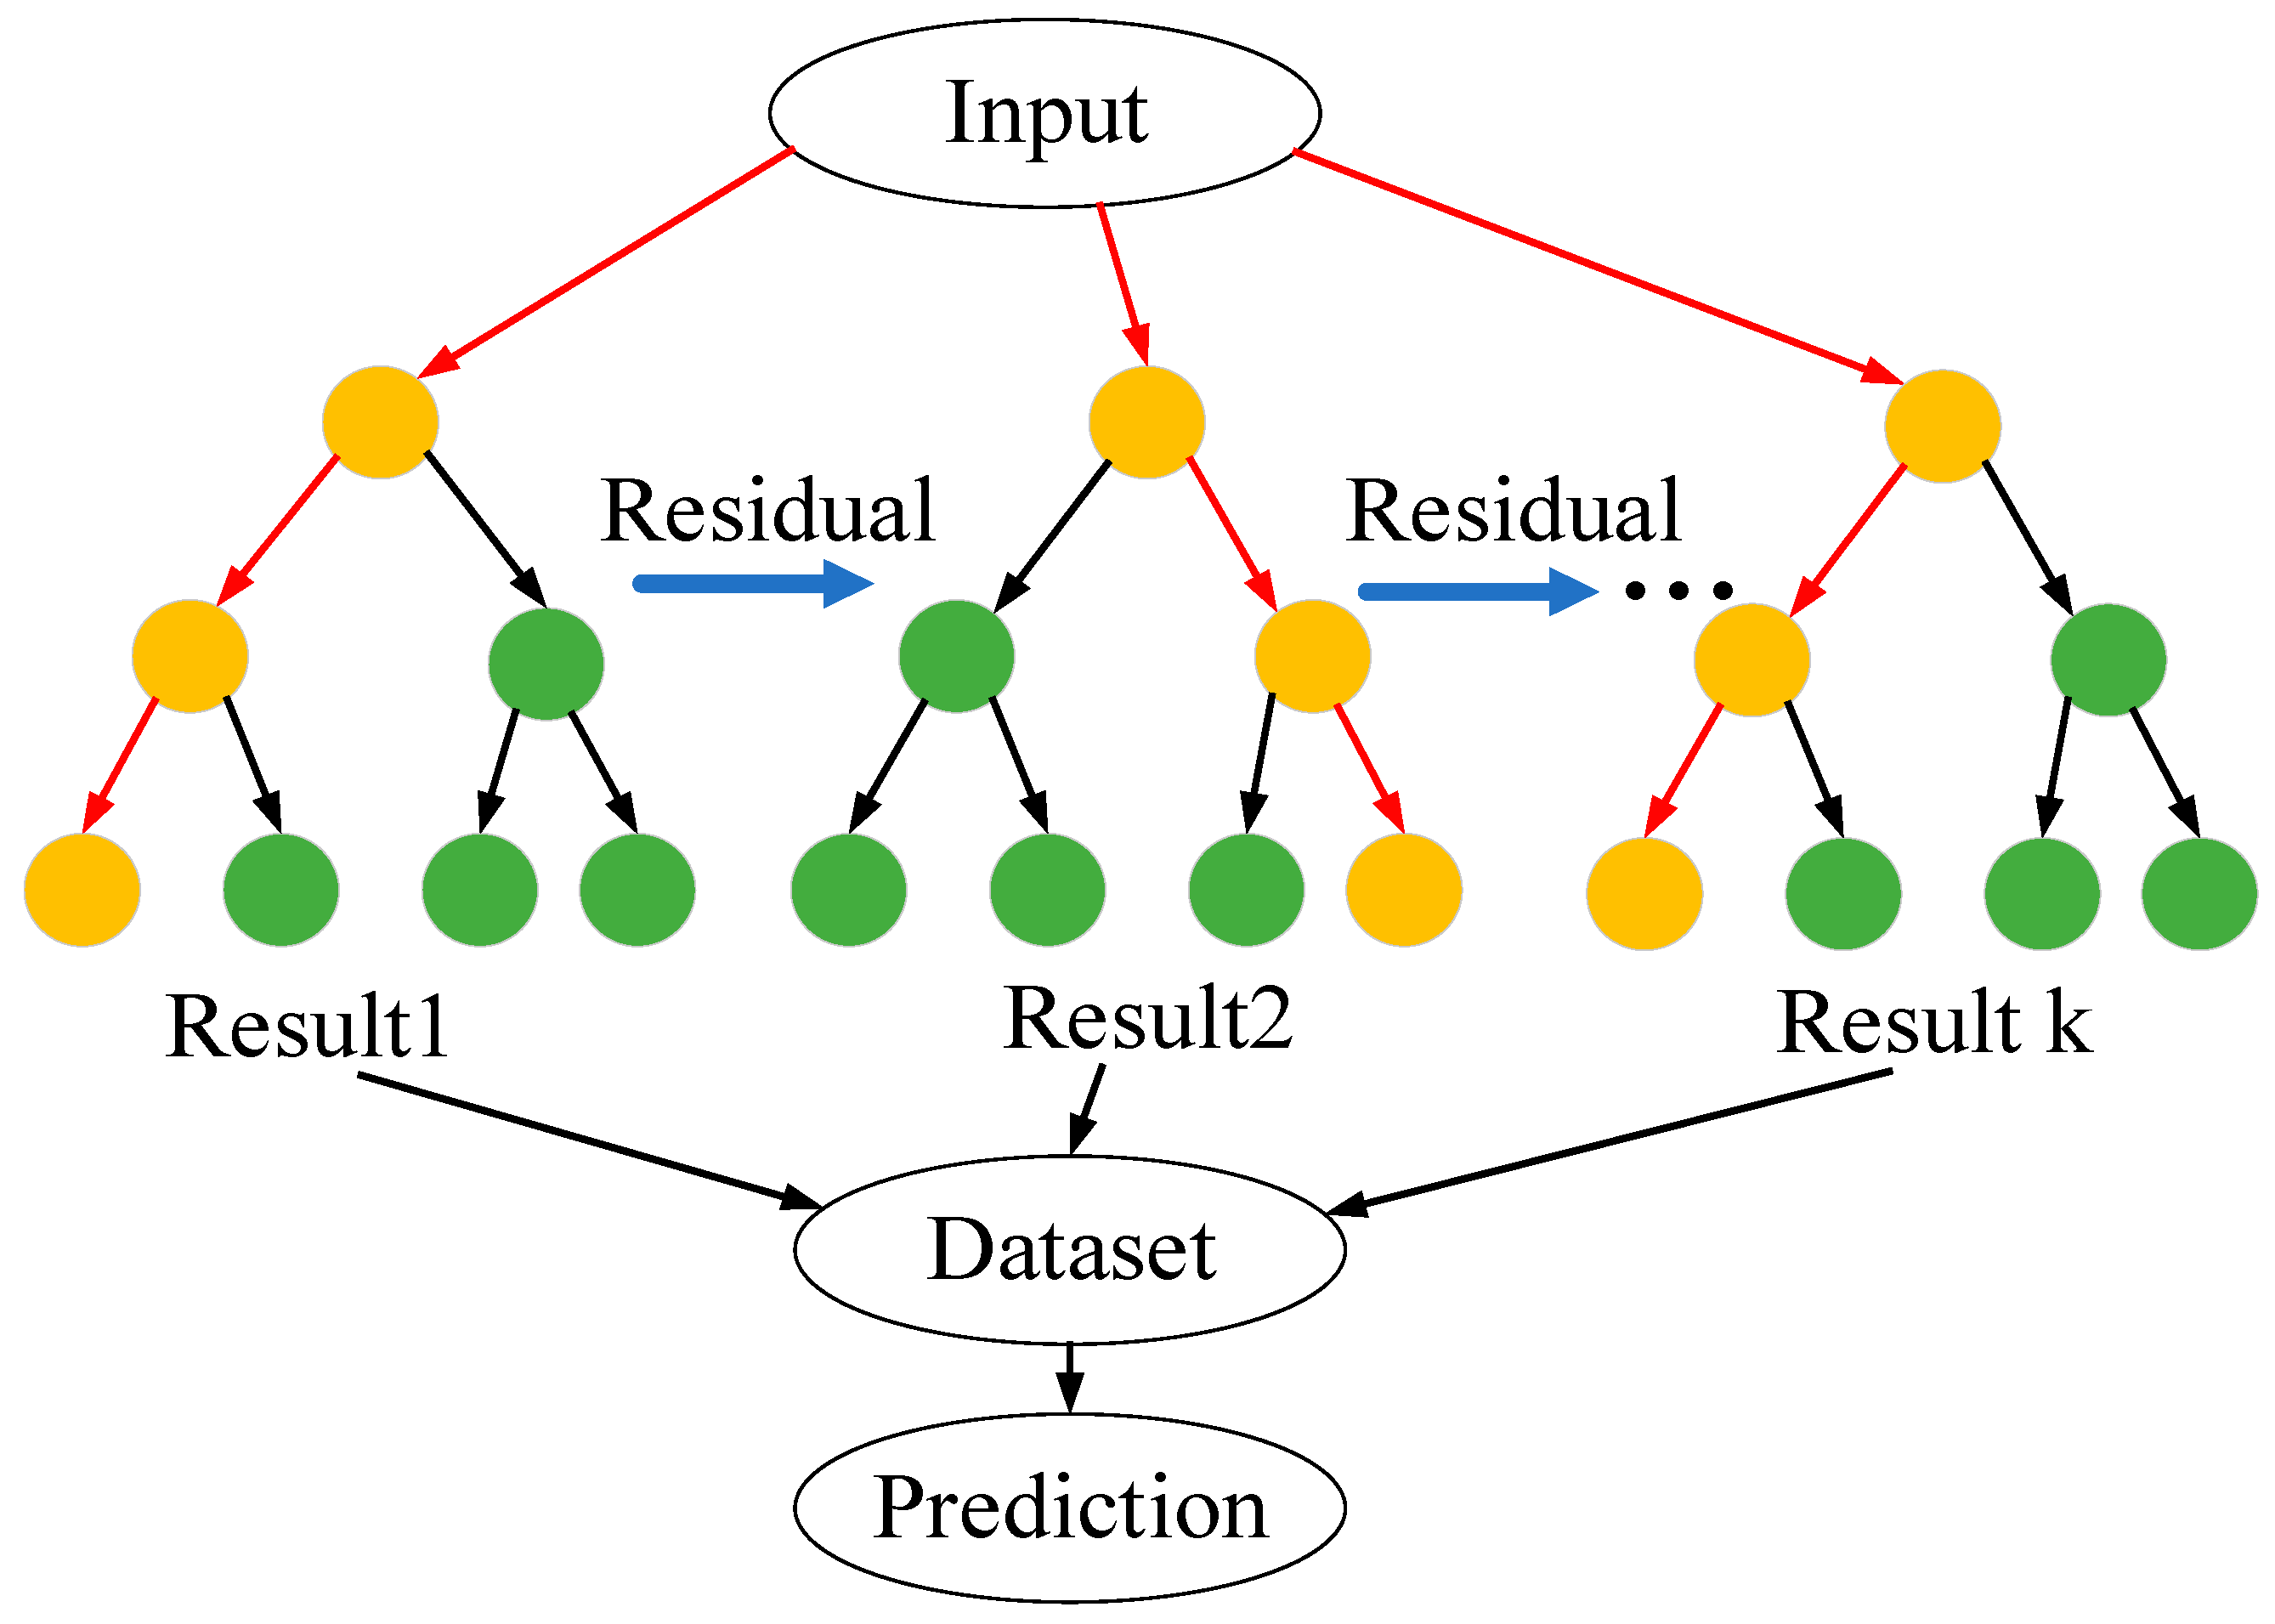
3.3.1. XGBoost Model

As shown in Figure 3, XGBoost is a decision-tree-integrated algorithm based on the gradient boosting framework. By adding new trees to the model to correct the errors generated by the previous tree, the model accuracy is improved. It shows excellent performance in machine learning tasks and can effectively improve the generalization ability of the model through various optimization strategies. In terms of regression, this model offers advantages in performance and robustness compared with traditional algorithms and provides functionality for importance analysis [47]. The objective function for minimizing in the XGBoost model is shown in Equation (5) [48].
L = t l ( y i , y i ^ ) + k Ω ( f k )
where L denotes the objective function, i the i-th sample, k the k-th tree, y i ^ the predicted value for the i-th sample, Ω ( f k ) the regularization term, and k Ω ( f k ) the complexity of the k-th tree.

3.3.2. SHAP Model

This study also uses the SHAP model proposed by Lundberg [34] to interpret the driver analysis results of the XGBoost model. The SHAP model attributes the output values to each feature to measure the impact of each driving factor on the output value, as expressed by Equation (6) [34].
g z = ϕ 0 + j = 1 N ϕ j z j
where g denotes the explanation model, N the number of driving factors, z j the presence of the corresponding factor, ϕ j the attribution value of each driving factor, and ϕ 0 a constant.
In this study, we statistically analyzed the GMC and meteorological factors at 100 m elevation intervals over the research period. To ensure the comparability and consistency of the model input data, we standardized all variables using the range normalization method. The standardized variables are then put into the XGBoost model for multifactor regression analysis. The SHAP model is used to obtain the SHAP values of the driving factors and visualize the scatter distribution.

4. Results

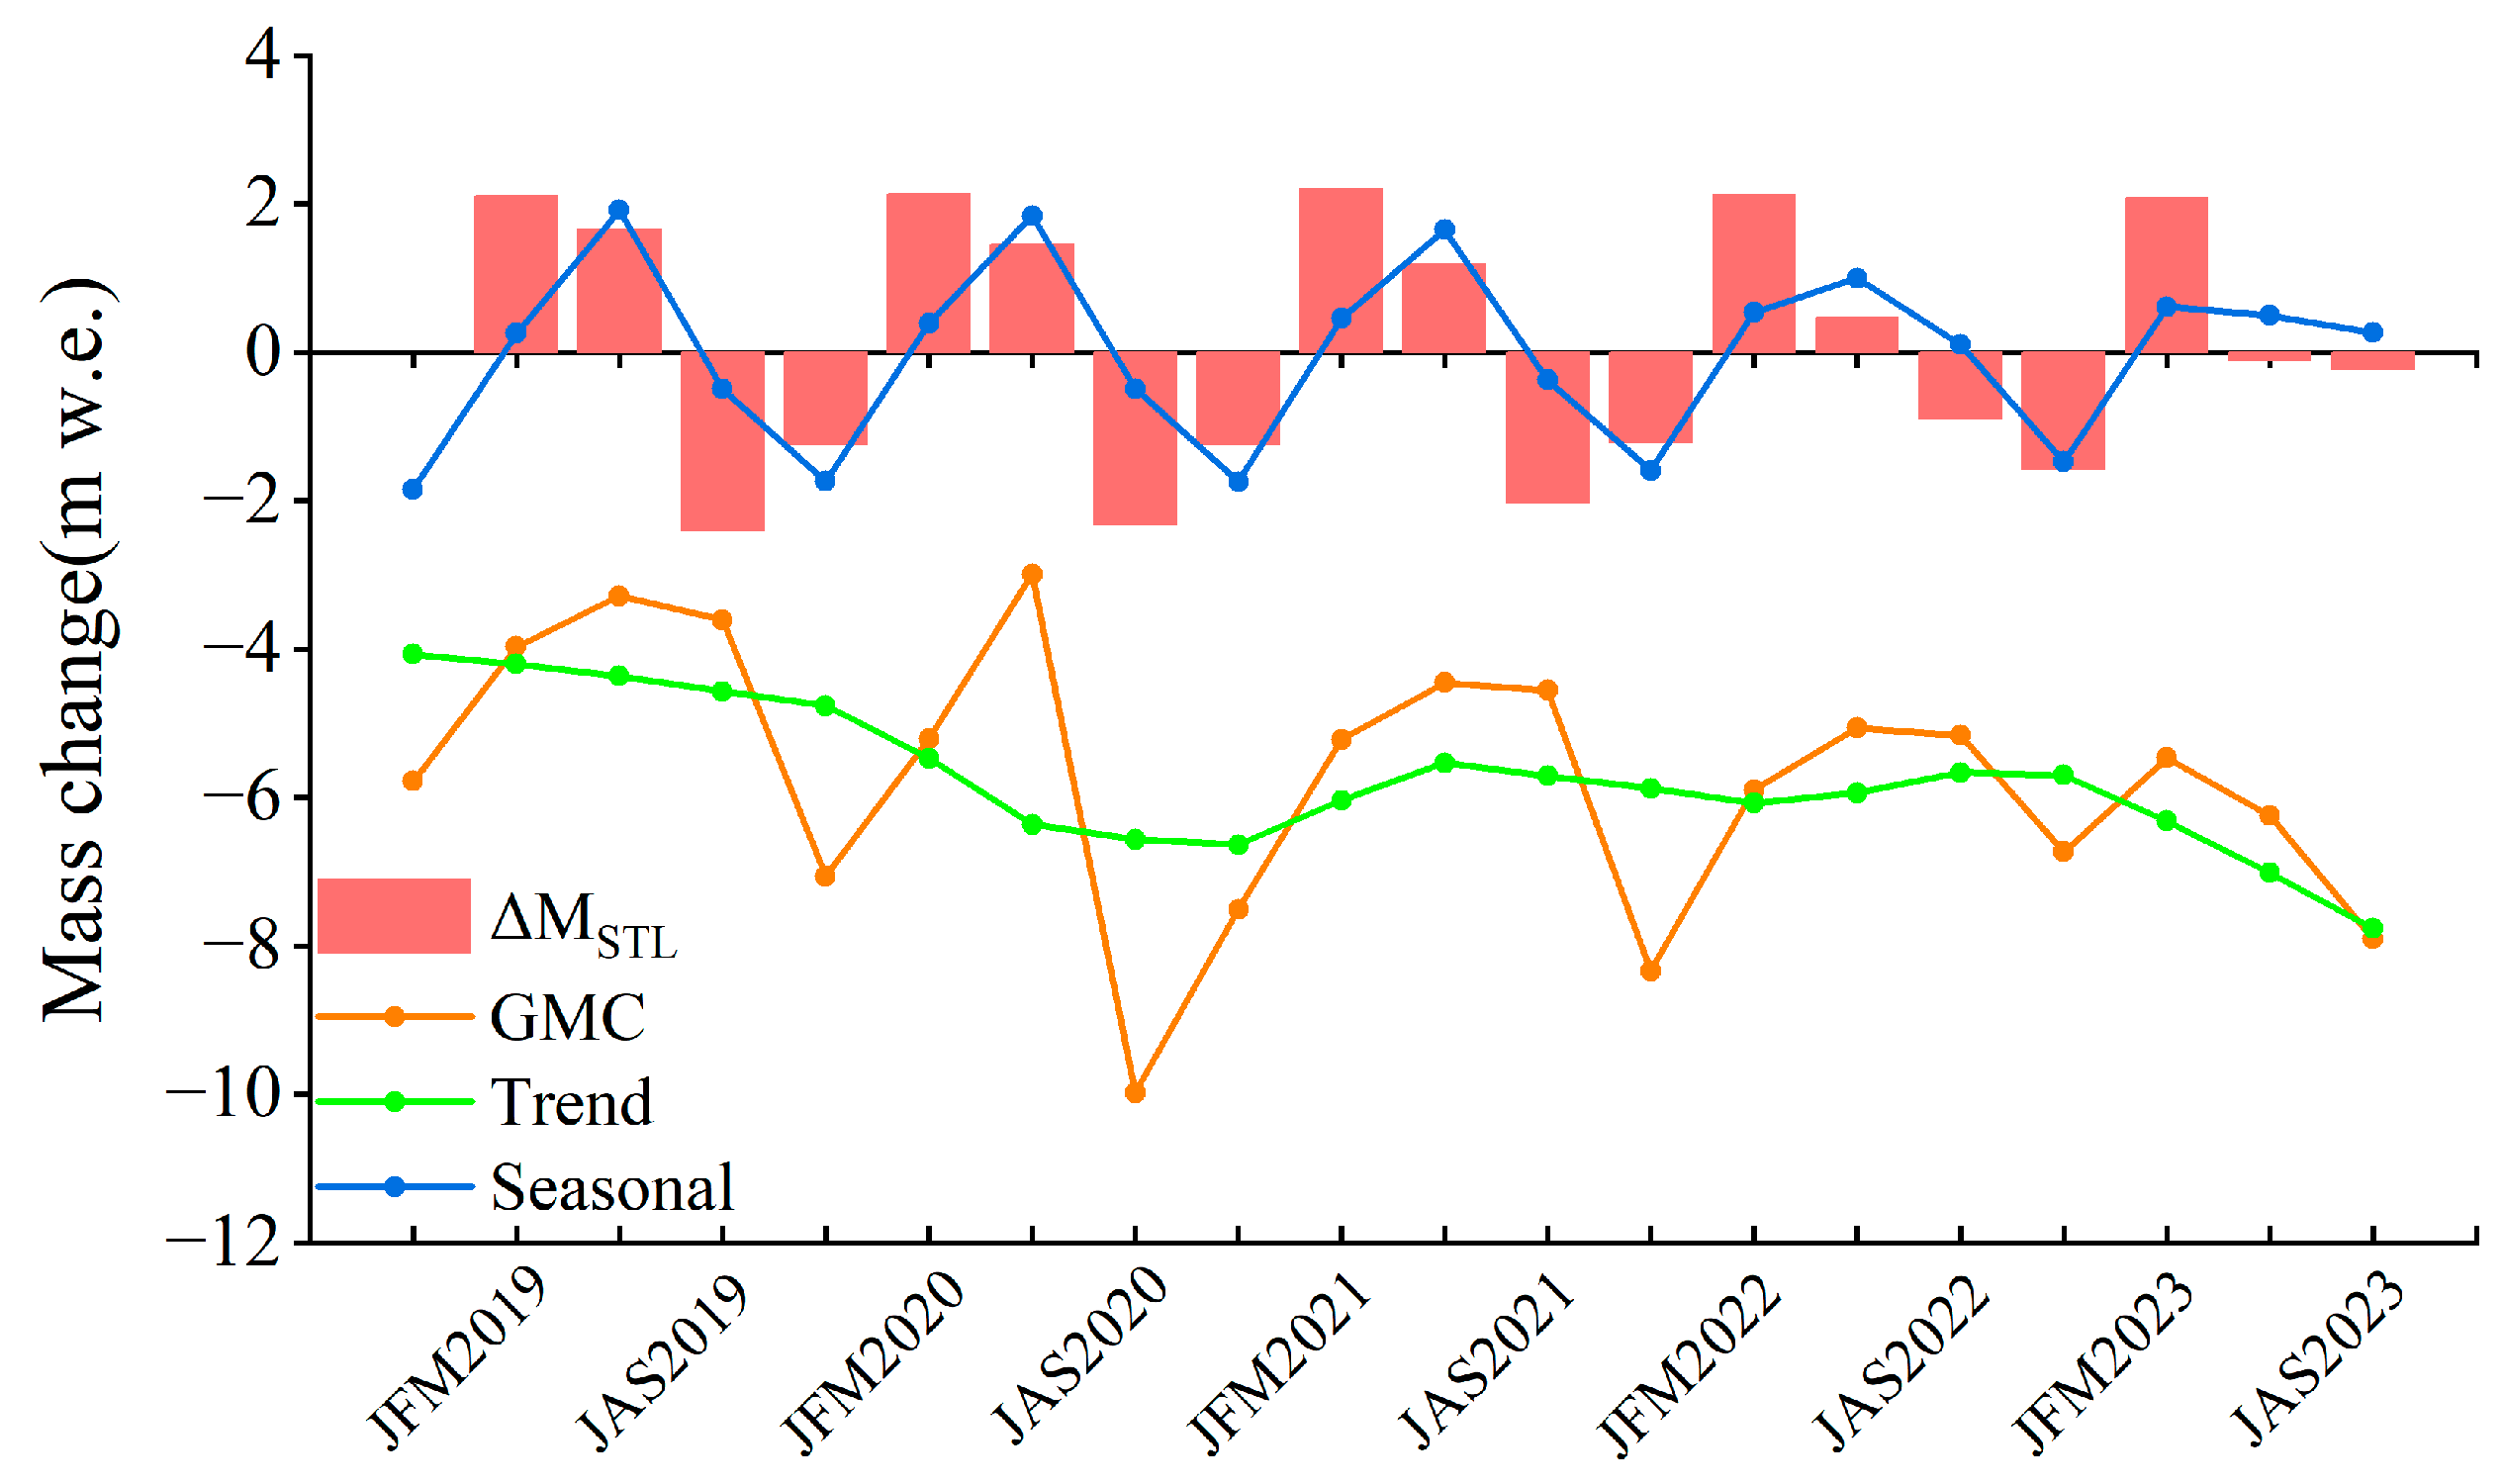
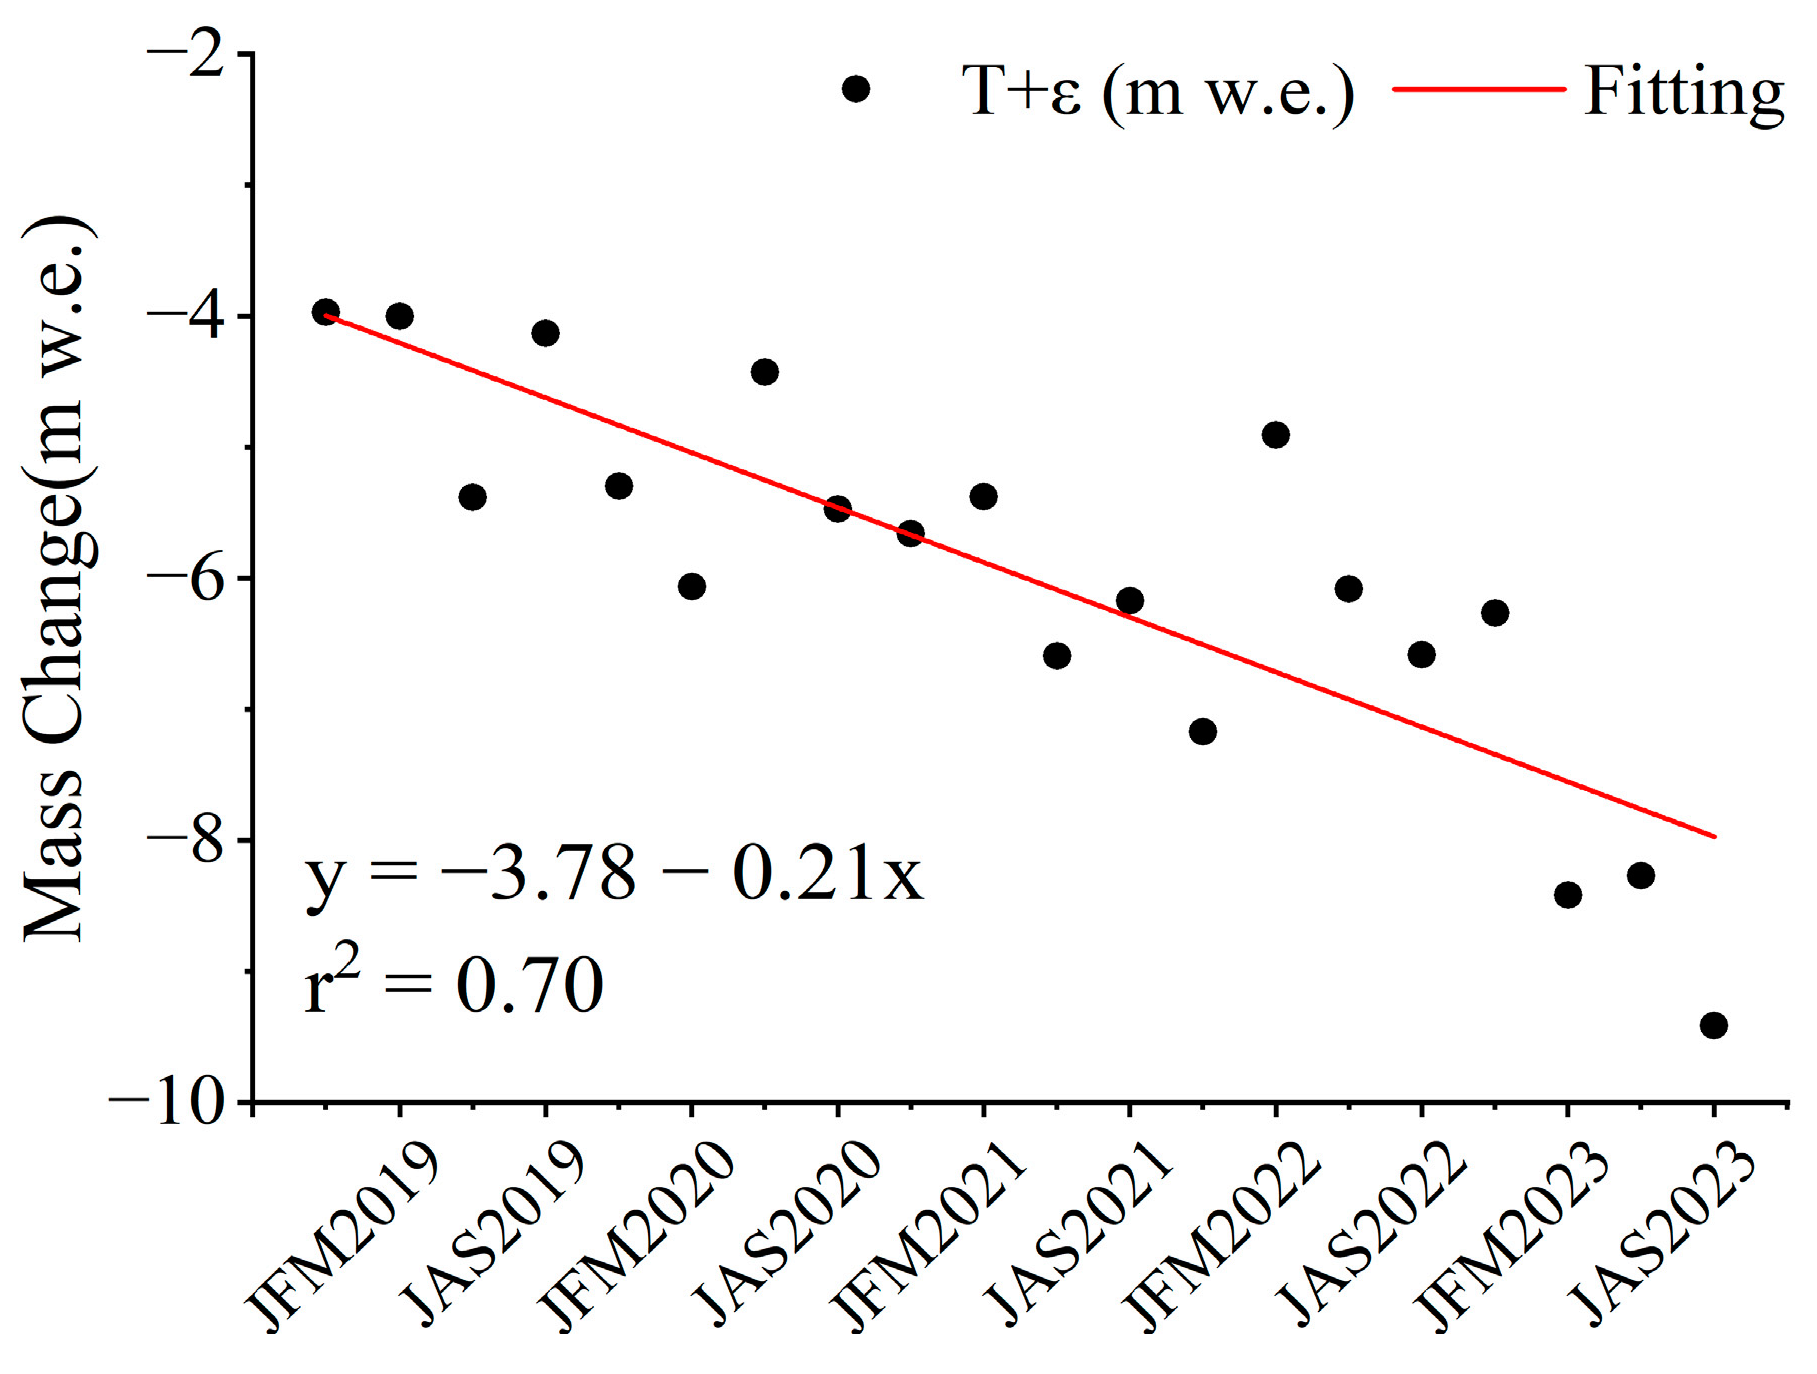
4.1. Interannual and Seasonal Variations of Glaciers

According to the methods outlined in Section 3.1 and Section 3.2, the glaciers in the Yigong Zangbo River Basin exhibit distinct seasonal variations (Figure 4), with glacier accumulation primarily occurring from late winter and early spring (JFM) to early summer (AMJ), and glacier ablation concentrated from midsummer (JAS) to early autumn (OND). We estimated the average seasonal variation ( M ¯ ) for the four periods. The results indicate that the average accumulation during JFM and AMJ is 2.12 ± 0.04 and 0.93 ± 0.15 m w.e., respectively, while the average ablation amounts during JAS and OND are −1.58 ± 0.19 and −1.32 ± 0.17 m w.e., respectively.
According to the linear regression results of the deseasonalized GMC series (Figure 5), it is shown that from OND 2018 to JAS 2023, glaciers in the basin exhibit a persistent loss trend, with a seasonal variation rate of −0.21 ± 0.03 m w.e.∙yr−1 and an annual variation rate of −0.83 ± 0.12 m w.e.∙yr−1.

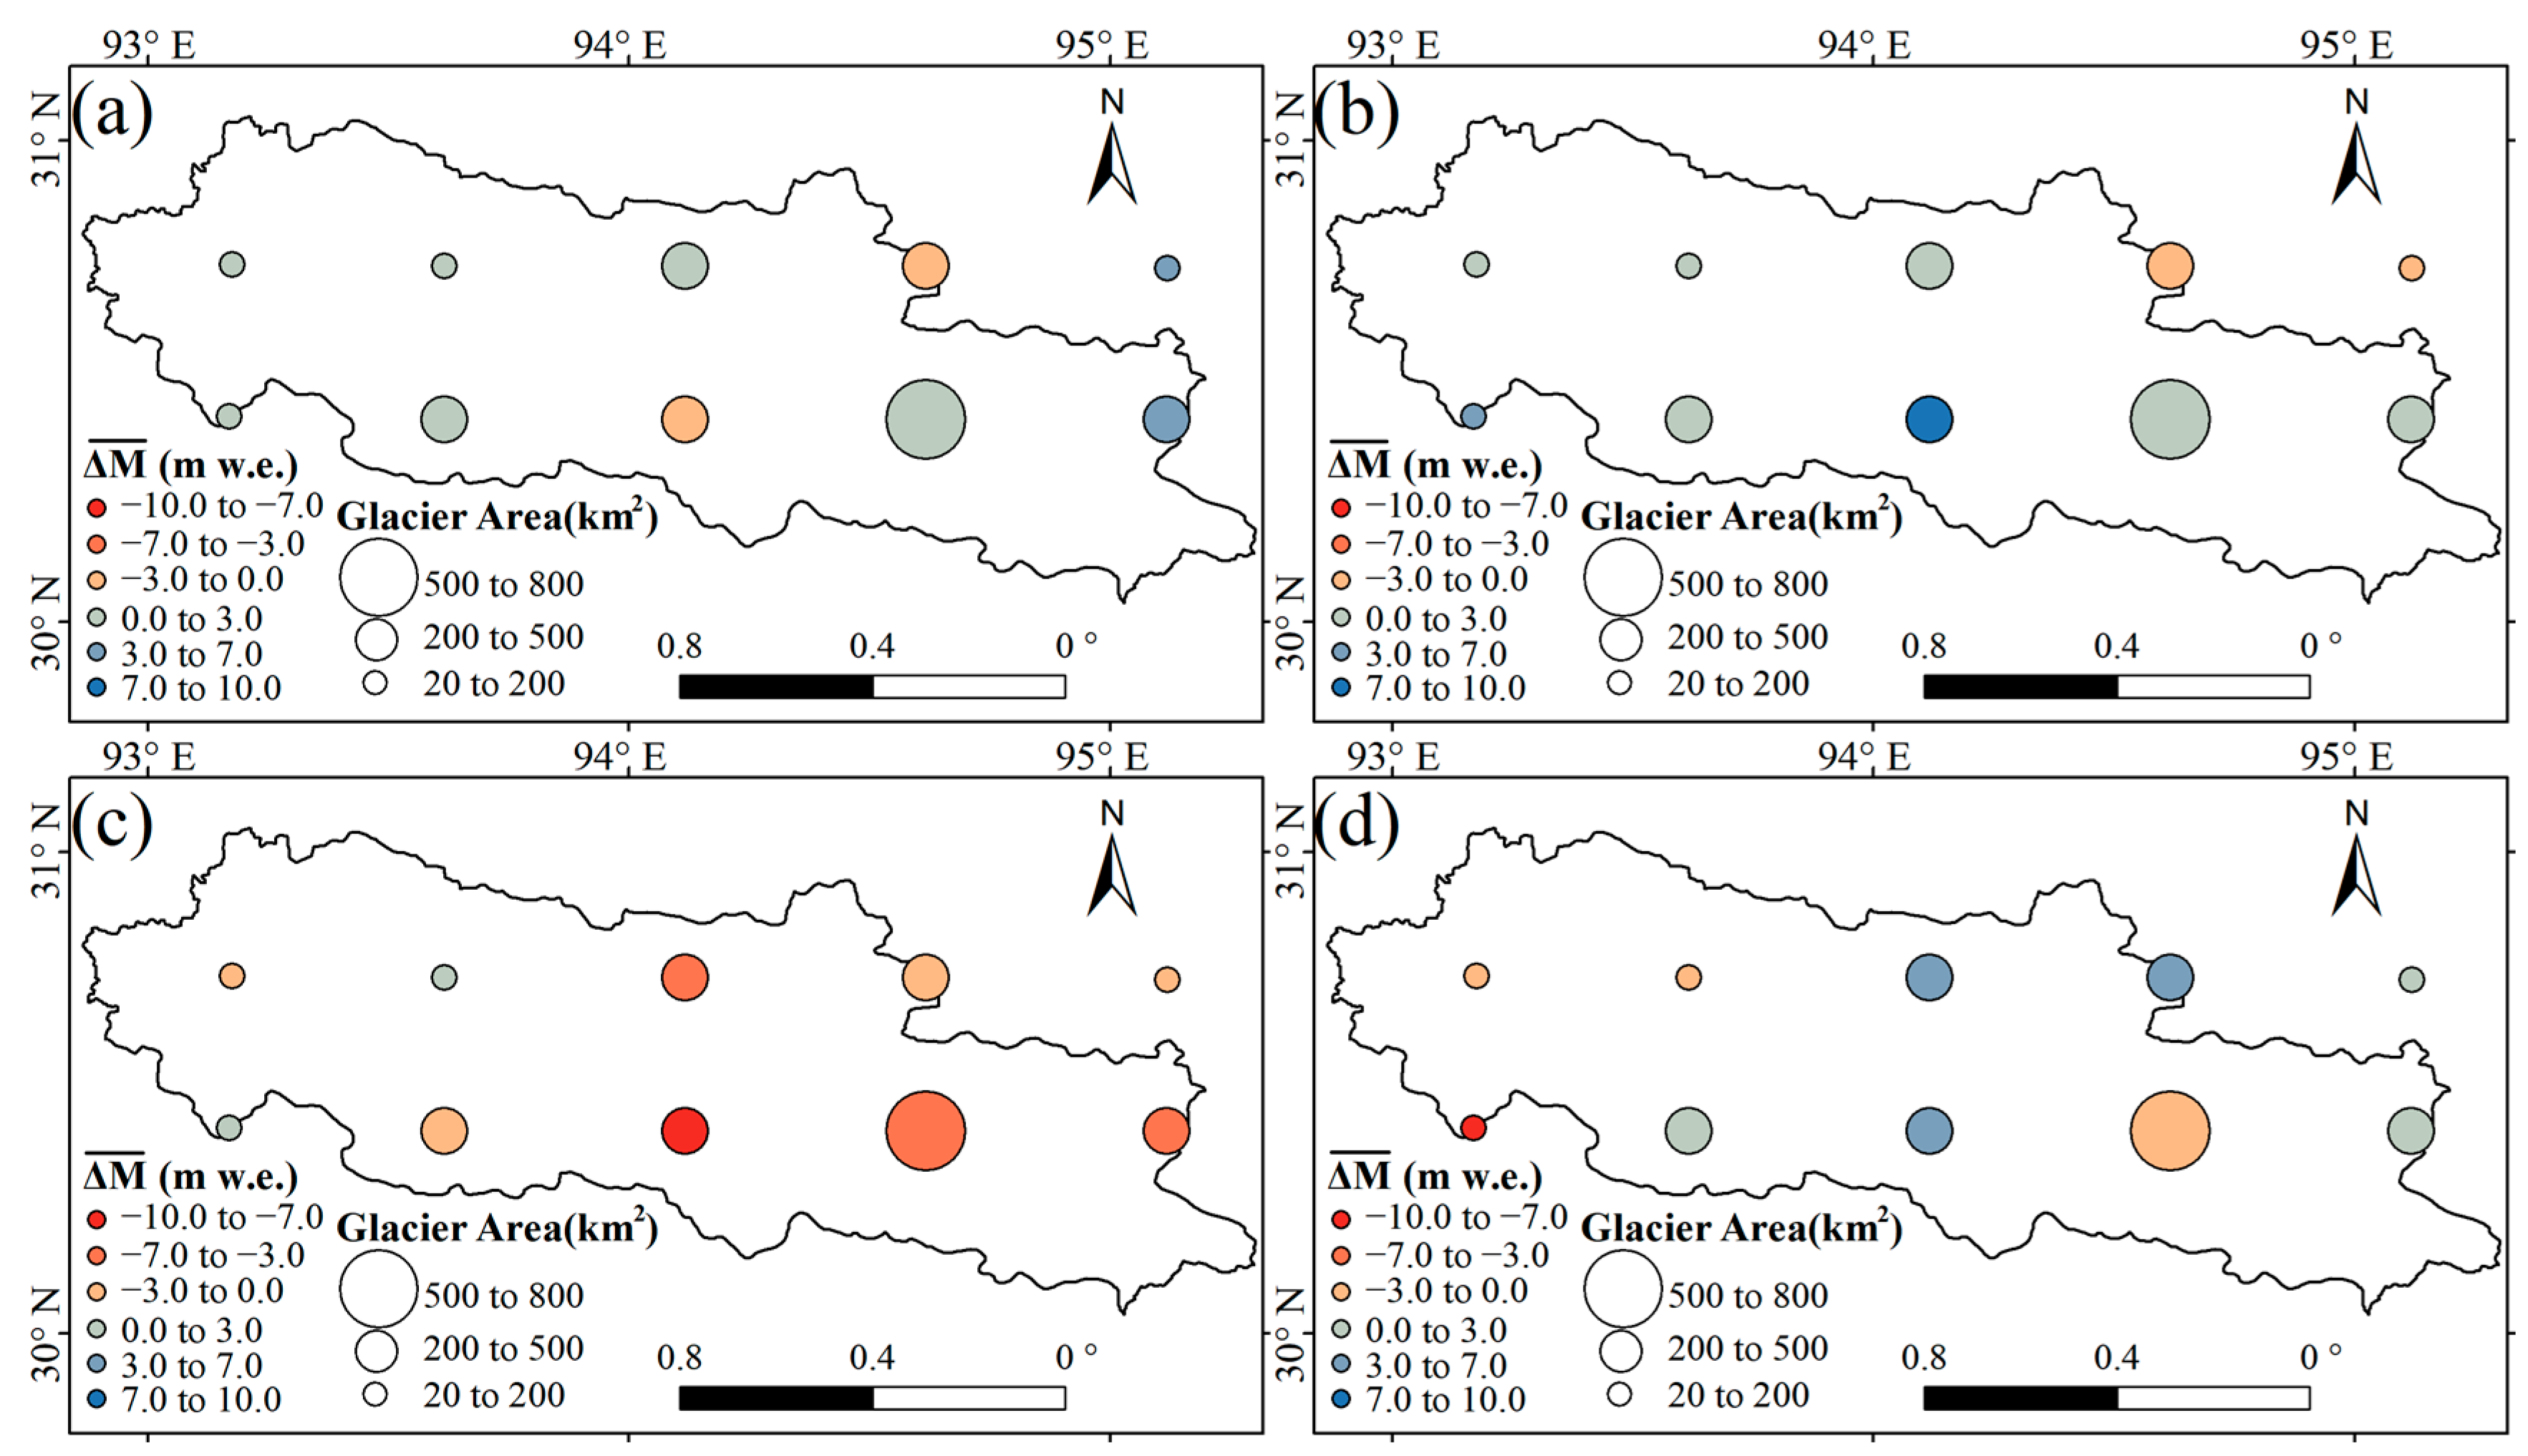
4.2. Spatial Distribution of Glacier Change

As shown in Figure 6a, 80% of the glaciers in the basin are distributed between 4200 m and 5900 m. In terms of the average seasonal GMC ( G M C ¯ ), with reference to the ALOS DEM, the equilibrium line altitude of glacier variations in the study area is located at approximately 5400 m. With increasing elevation, glacier ablation gradually decreases, while the accumulation increases. Seasonal variations in the glaciers are mainly observed below 4700 m and generally decrease with increasing elevation (Figure 6b), with an average | M | ¯ of 1.52 m w.e. above 4700m and 4.84 m w.e. below 4700 m. Glacier changes in different seasons vary across elevation zones. Specifically, in OND, there is slight mass accumulation (about 1.74 m w.e.) between 3900 m and 4900 m, while mass loss (about −2.7 m w.e.) occurs between 4900 m and 5700 m. In JAS, noticeable mass loss (about −6.56 m w.e.) is observed between 4300 m and 5100 m. In AMJ, marked mass accumulation (about 3.49 m w.e.) is found in 4500–5300 m. In JFM, there is mass accumulation (about 2.48 m w.e.) between 4100 m and 5500 m. In areas below 3800 m where glacier distribution is sparse, the larger seasonal variation may be due to factors such as avalanches, glacier surge and debris cover [49], and errors from sparse measurement points, which make seasonal change estimates in these regions potentially unreliable [28].
Similarly, from the seasonal variation in the glacier mass ( M ¯ ) in 0.5° × 0.5° grid cells (Figure 7a–d), it can be found that glacier changes exhibit a marked spatial non-uniformity across different seasons. In JFM, M ¯ ranges from −1.34 m w.e. to 4.64 m w.e. (Figure 7a), with mass accumulation primarily occurring in the eastern and western regions and a small amount of mass loss in the central area. In AMJ, M ¯ ranges from −2.26 m w.e. to 8.79 m w.e. (Figure 7b), with widespread mass accumulation in the central and western parts of the basin. In JAS, almost all glaciers in the basin experience mass loss, with M ¯ ranging from −10.87 m w.e. to 0.91 m w.e. (Figure 7c). Additionally, the mass loss of the central and eastern glaciers is more intense than of other regions. In OND, the glacier accumulation areas exceed the ablation areas, but the southeastern region, where glaciers are most abundant, remains in a state of loss, with M ¯ ranging from −8.33 m w.e. to 5.04 m w.e. (Figure 7d). Through visual observation, we find that the glacier changes throughout the year are primarily concentrated in the central and eastern regions where glaciers are more prevalent, with ablation being the greatest during JAS.

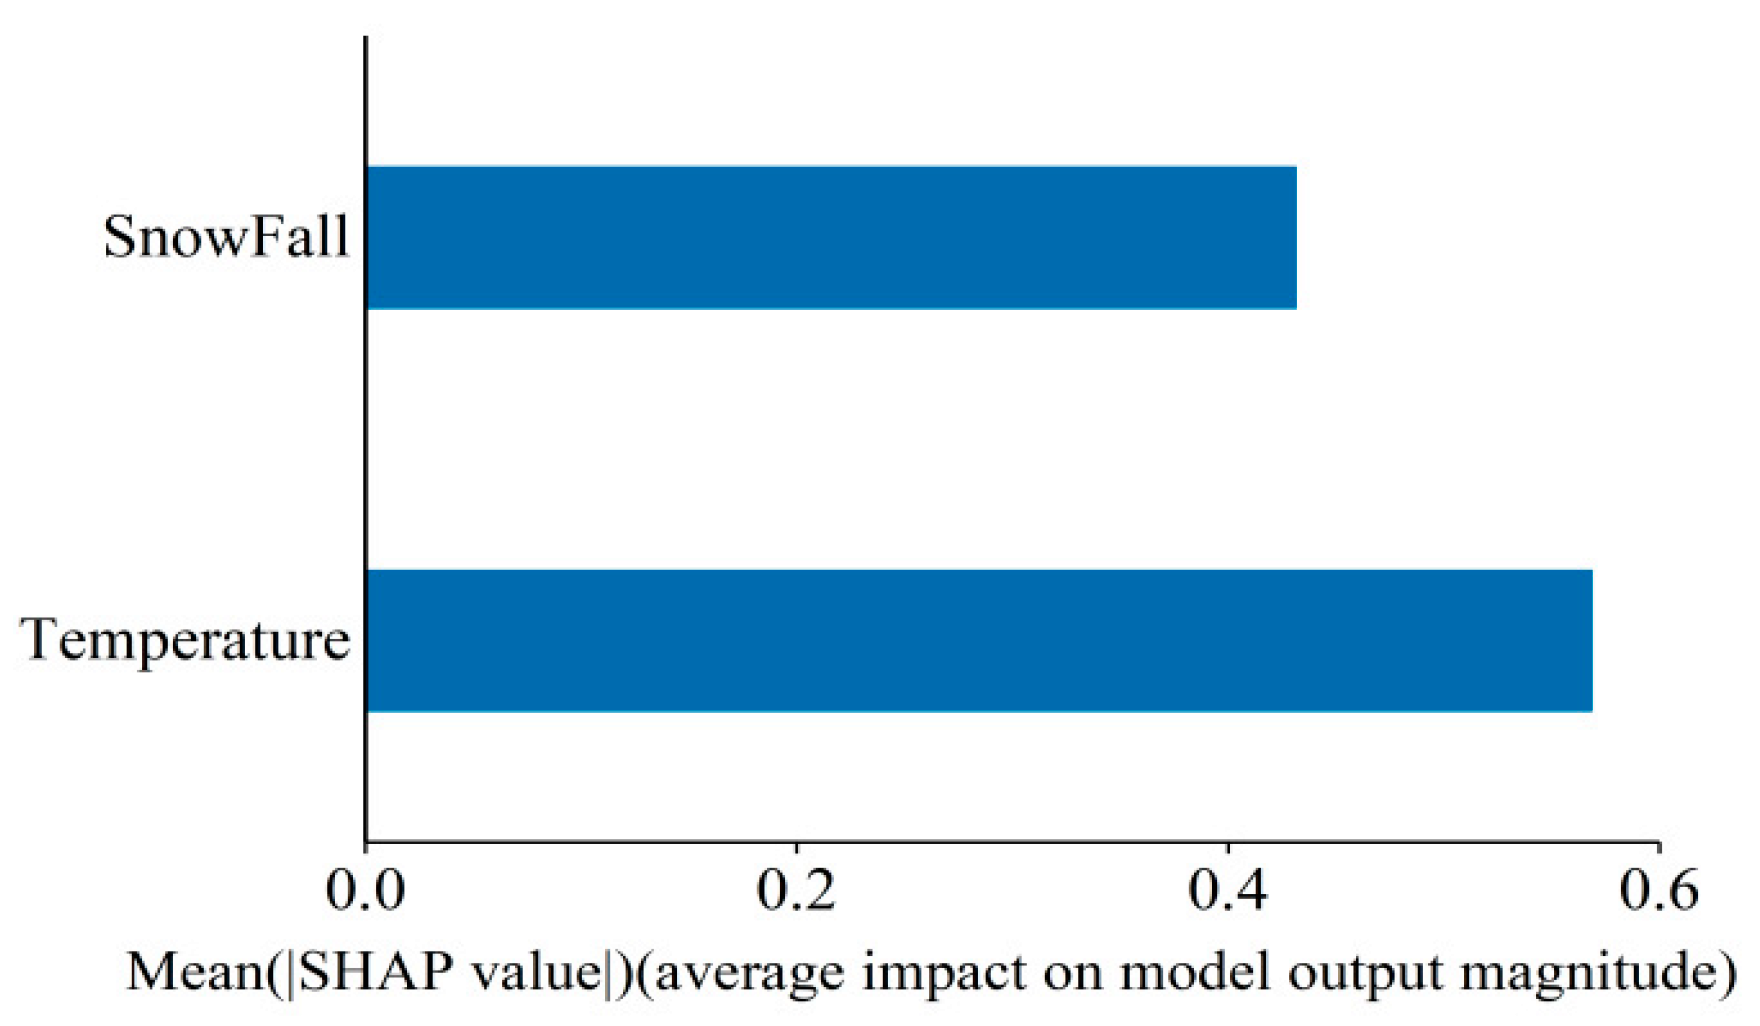
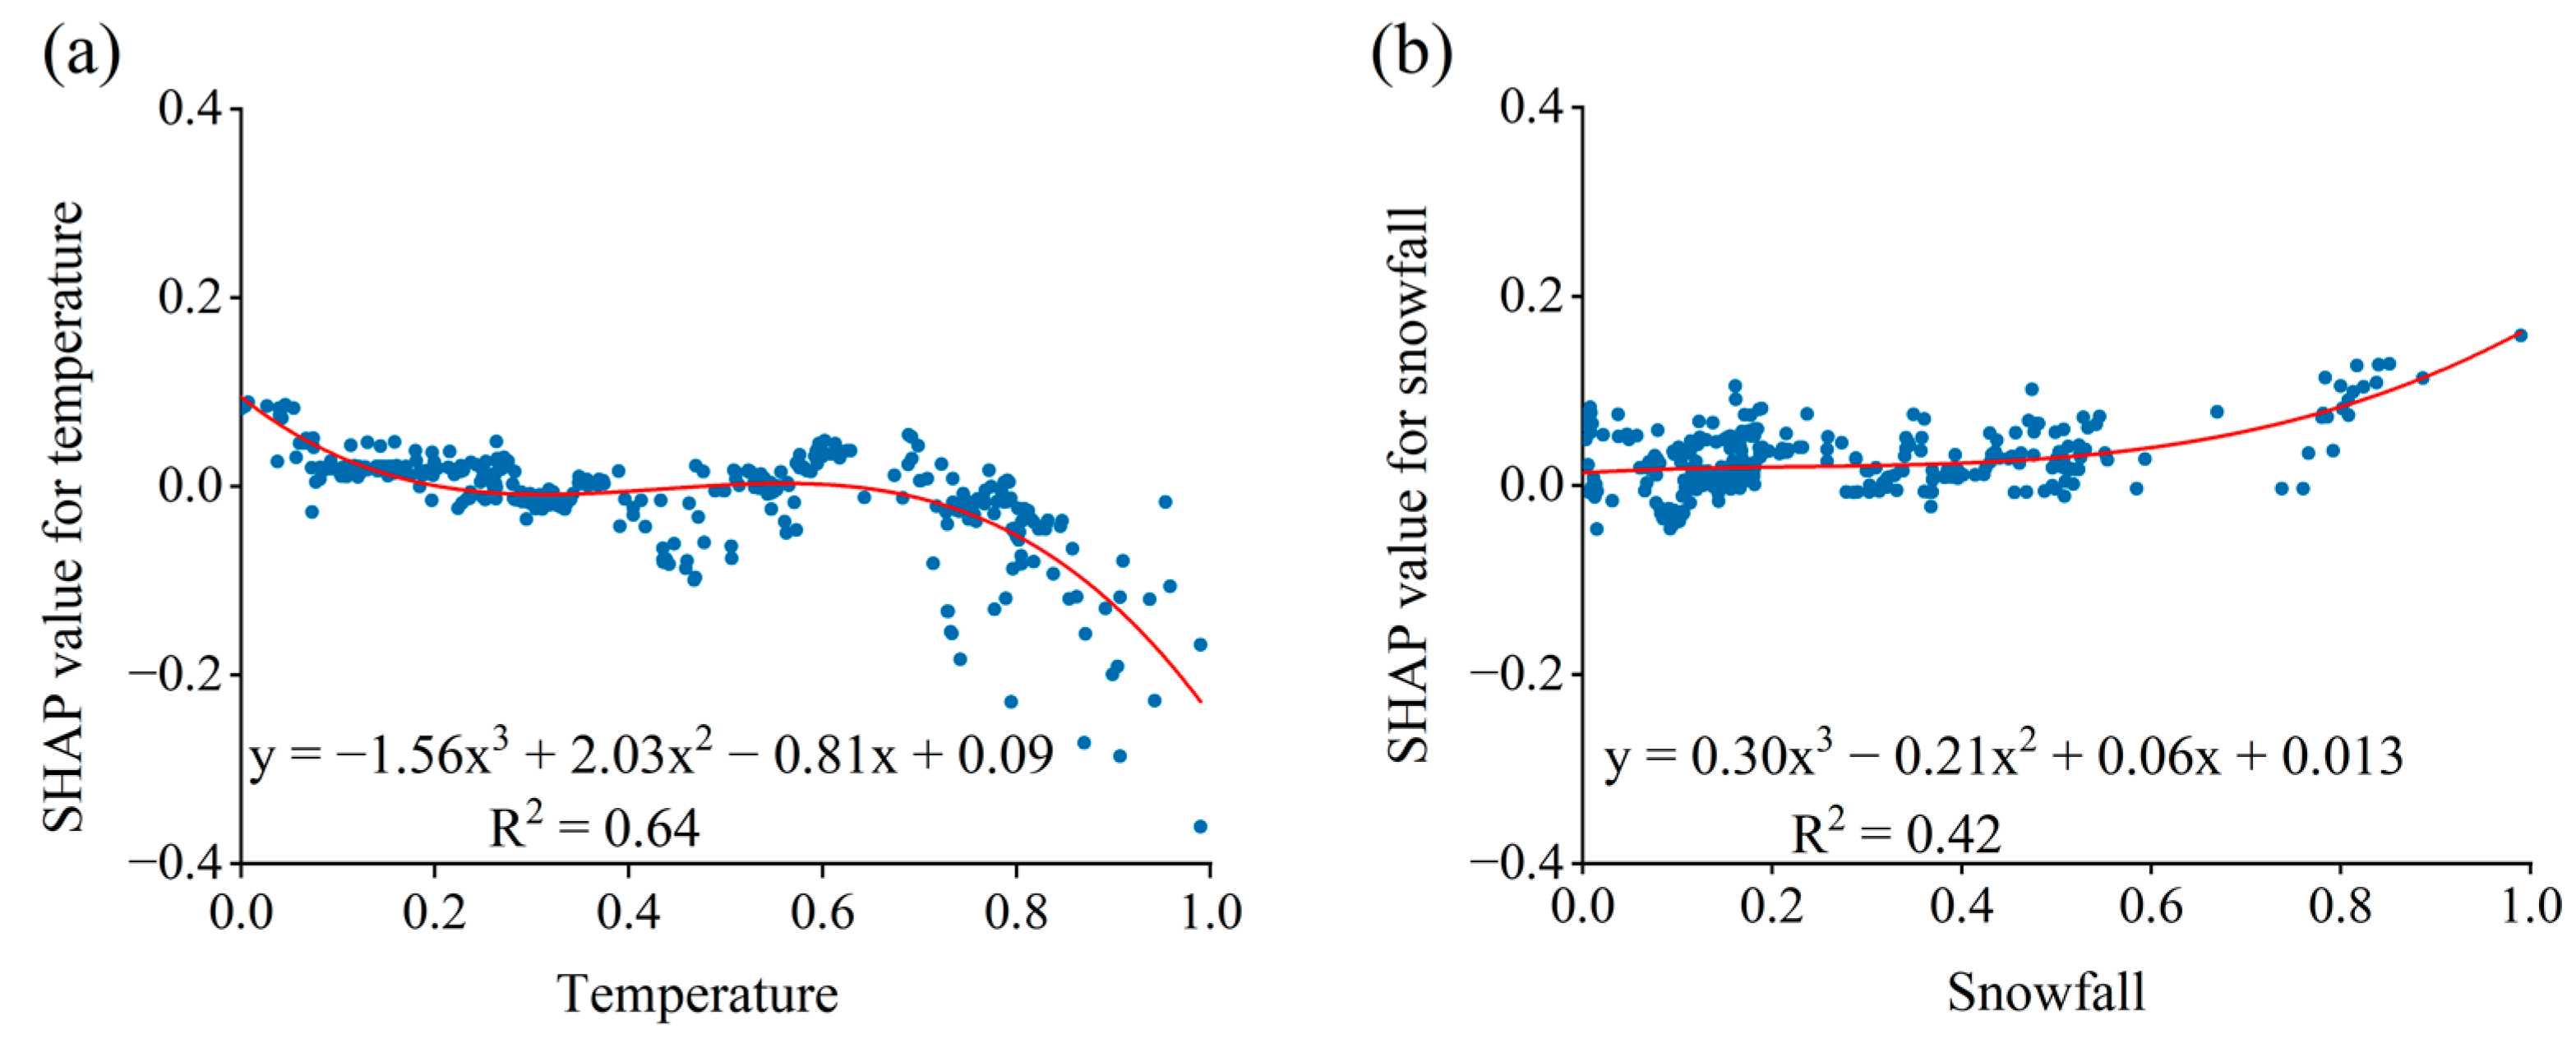
4.3. Analysis of Influencing Factors of Glacier Changes

This study focuses on the elevation range of 3900–6000 m, which covers 95% of the total glacial area. We input the GMC, temperature, and snowfall data, which were statistically recorded at 100 m elevation intervals during the study period, into the XGBoost model for a multifactor regression analysis. Then, the SHAP model was used to obtain the SHAP values of the meteorological drivers (Figure 8) and the scatter plot of these SHAP values (Figure 9).
According to the model results, the SHAP values of temperature and snowfall are 0.57 and 0.43, respectively, indicating that temperature has a greater impact on the GMC than snowfall in the study area. The scatter plots of the SHAP values of the driving factors show nonlinear relationships of temperature and snowfall with the GMC. Specifically, the temperature and the GMC exhibit a cubic polynomial relationship, with a fitting degree (r2) of 0.64. The fitted curve shows an overall decreasing trend, with a more pronounced decrease in the ranges where the normalized temperature is below 0.2 or above 0.7. This suggests that in extremely high- and low-temperature environments, the influence of temperature variations on glaciers is enhanced. Snowfall and the GMC also follow a cubic polynomial relationship, but the fitting degree is lower (r2 = 0.42), and the trend shows a monotonic increase. The trend becomes more pronounced when the normalized snowfall exceeds 0.6, indicating that as snowfall increases, glaciers tend to grow, and extreme snowfall conditions favor glacier accumulation. Because GMC is not only affected by meteorological factors, but also by topography, glacier dynamics, and glacier surface characteristics, the fitting degree between temperature, snowfall, and GMC is relatively low.

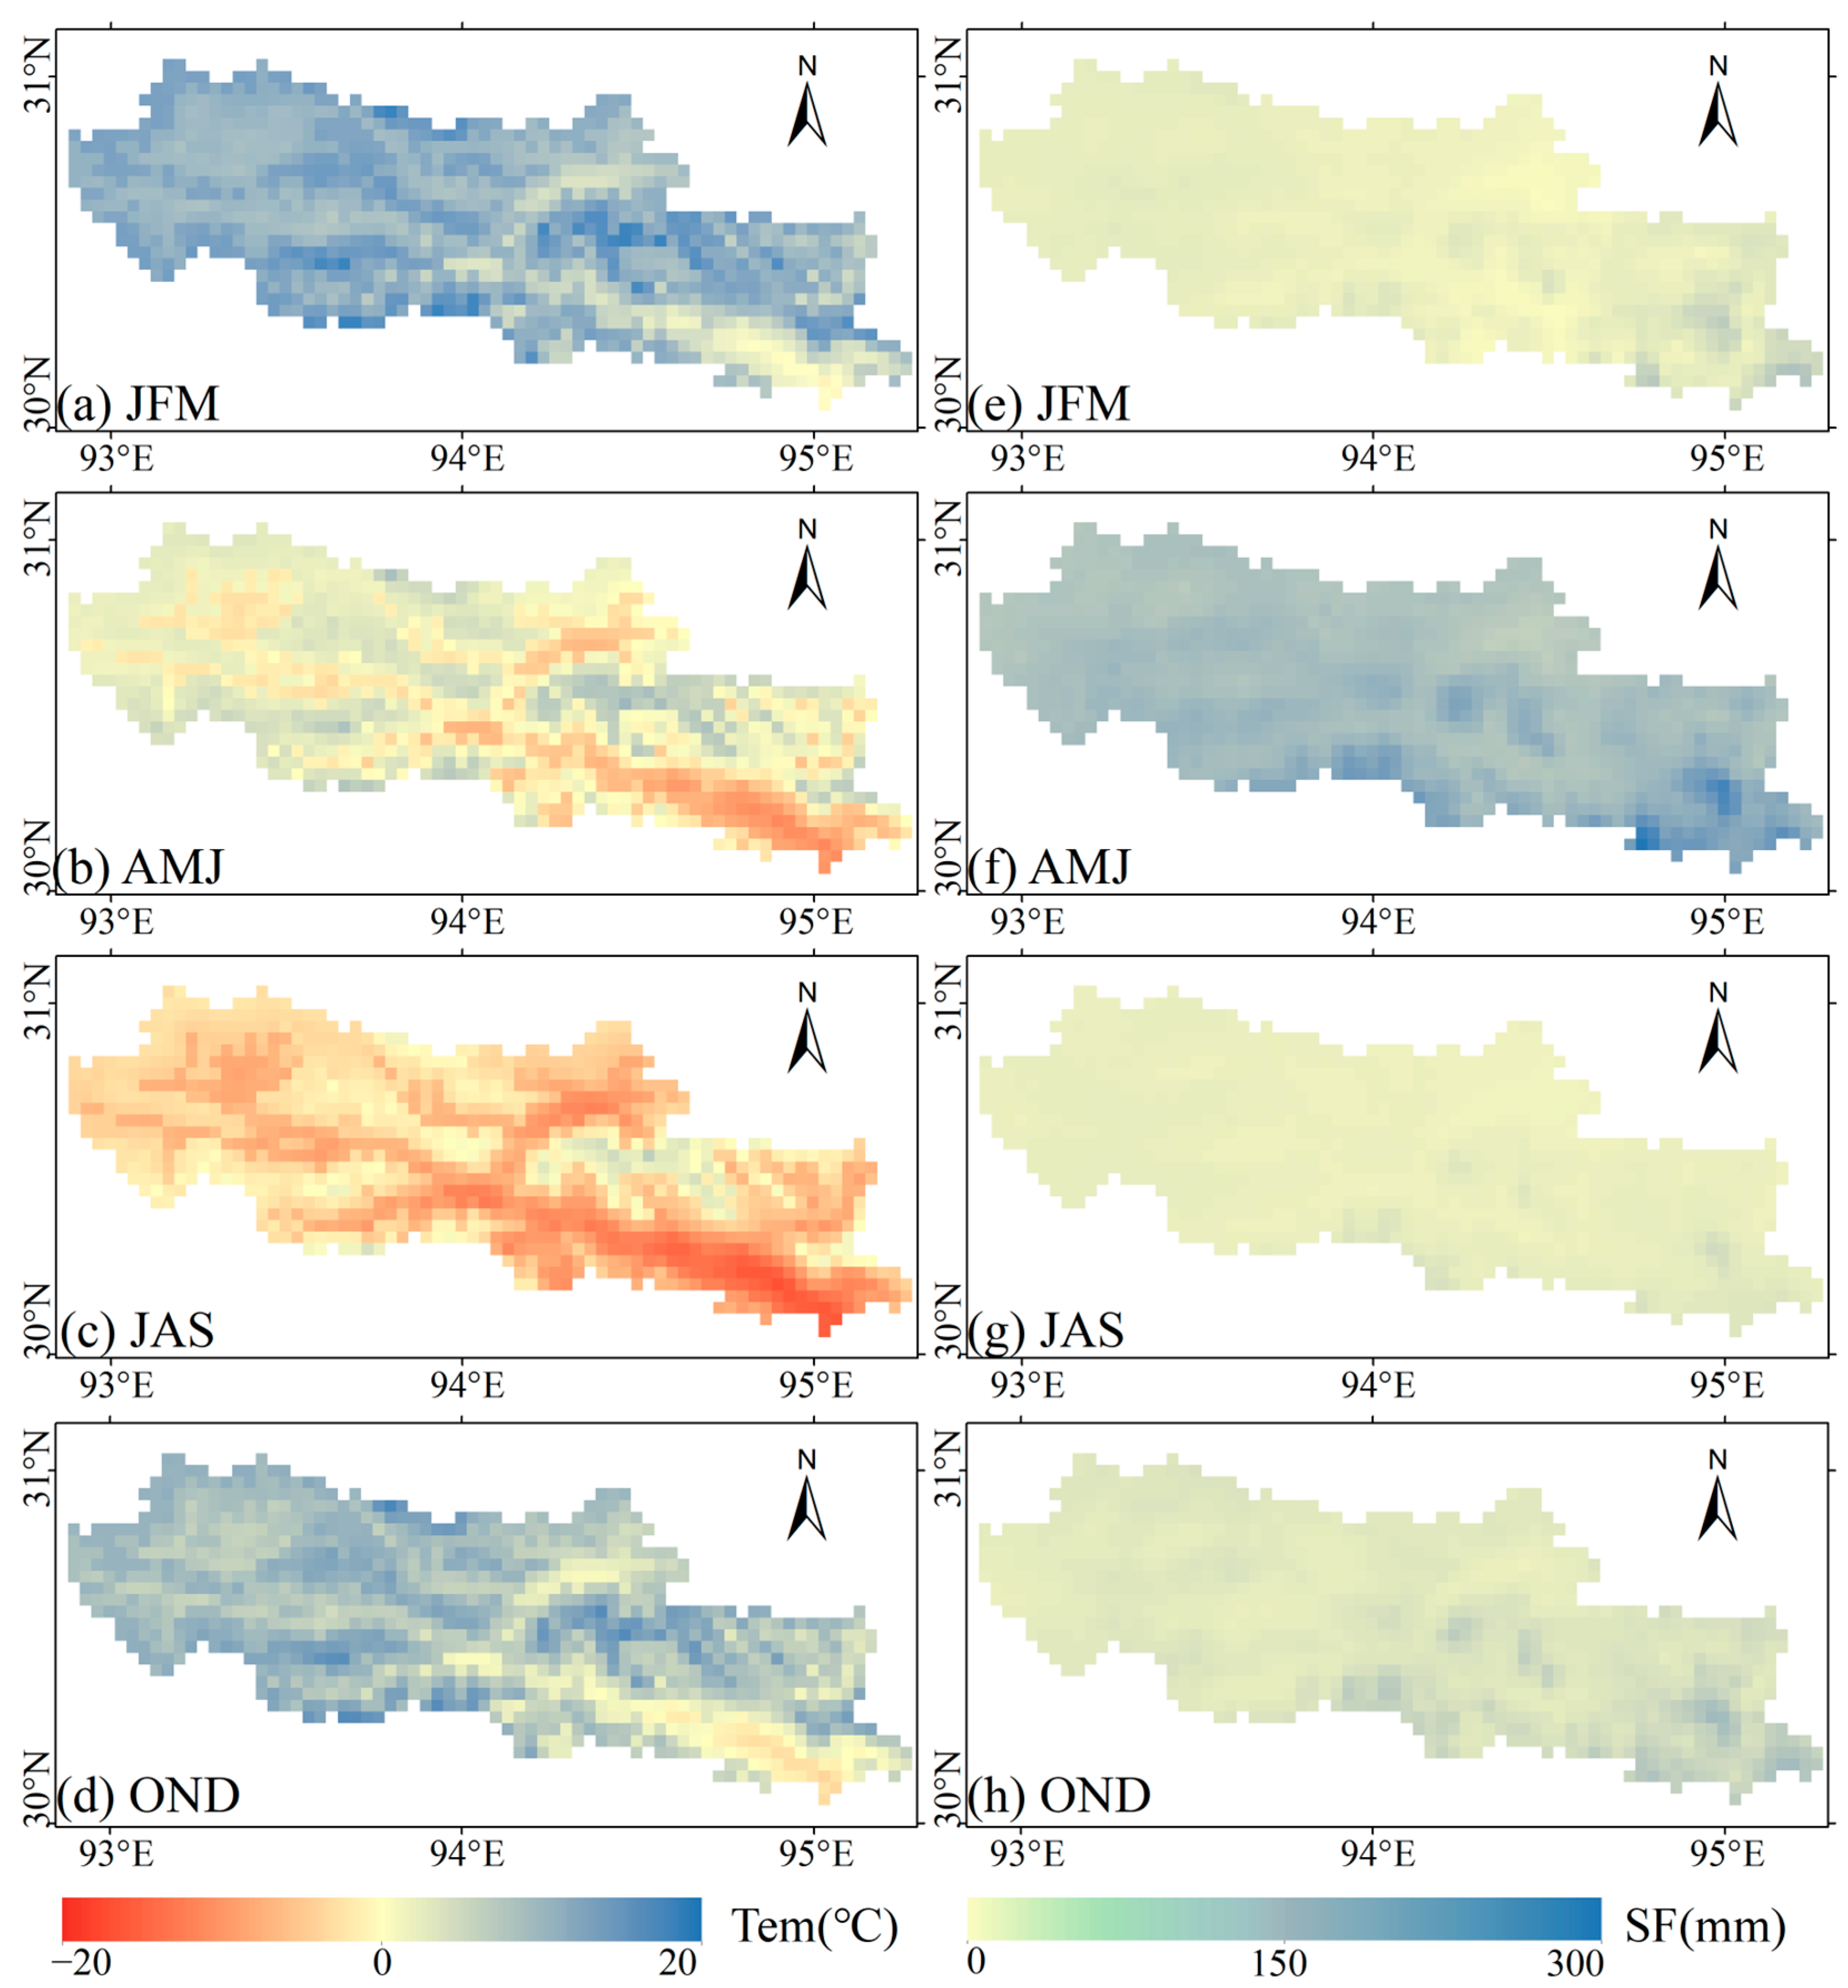
4.4. Characteristics of Climate Change in the Study Area

During the study period, the climate in the Yigong Zangbo River Basin exhibited distinct seasonal variations (Figure 10). During the glacier accumulation phase, i.e., JFM, the average temperature remained at −12.8 °C, and the accumulated snowfall reached 33.6 mm. In AMJ, the average temperature rose to −2.2 °C, and snowfall increased dramatically to 144.9 mm. In contrast, during the glacier melting period, i.e., JAS, the average temperature was 3.4 °C, and the accumulated snowfall decreased to 31.9 mm. In OND, the average temperature dropped to −9.1 °C, while the accumulated snowfall remained at 56.1 mm.
In each season, there are also differences in the spatial distributions of meteorological elements, generally varying from the northwest to the southeast. As shown in Figure 11, the temperature in JFM is generally lower, and due to the mountain terrain, the snowfall is mainly in the eastern region. In AMJ, the temperature in the eastern valleys is relatively higher, and while the overall snowfall is higher, the eastern and central–eastern areas receive more snowfall compared with other regions. In JAS, the temperature is higher, and the snowfall is less. In OND, the temperature in the eastern valleys is relatively higher, but the snowfall is less.

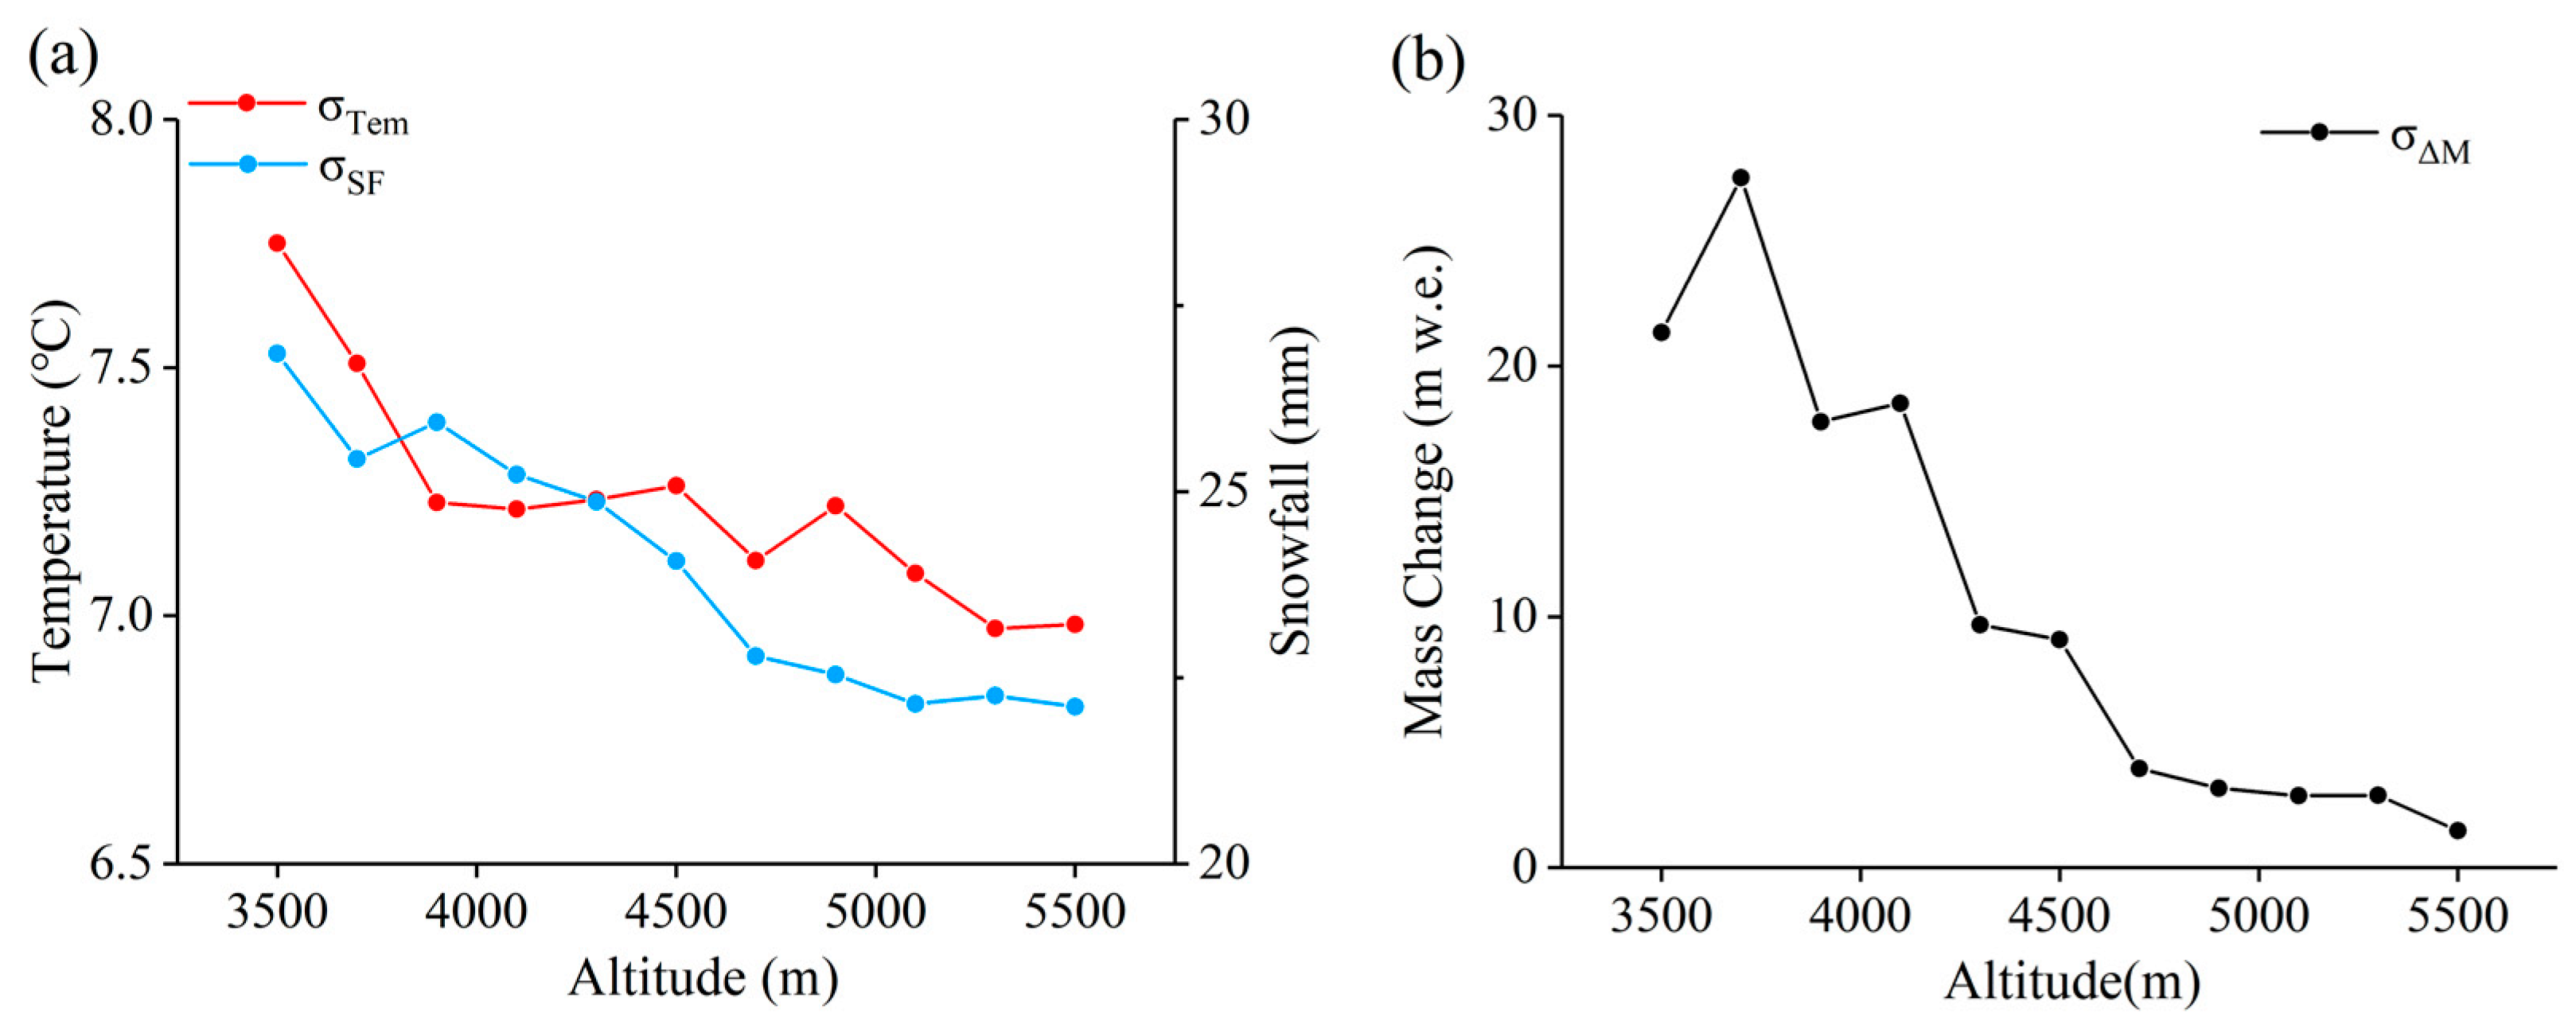
4.5. Uncertainties of Glacier Mass Change

The uncertainties in the GMC estimates were quantified by using standard deviation ( σ M ), which incorporates errors from mountain glacier density ( σ f ) and elevation variation ( σ H ) [28]. Since M = f × H , σ M can be estimated by using Equation (7).
σ M i = ( σ f × H i ) 2 + ( f × σ H i ) 2 ( i = O N D   2018 , , J A S   2023 )
where σ f is 0.06 [45], and σ H i is estimated from three error sources: systematic error ( σ s y s ), random error ( σ b i n ), and penetration error ( σ p e n ), as expressed by Equation (8).
σ H i = σ s y s i 2 + σ b i n i 2 + σ p e n 2
The systematic error ( σ s y s i ) of the ICESat data was estimated as the standard error of the median value of each beam h i in the non-glacial stable areas during season i, σ s y s i = σ h i / N i . σ h i denotes the standard deviation of the median value of h i , and N i represents the number of ICESat-2 beams in season i. We changed the starting value of 100 m elevation bin to 3000 m, 3025 m, 3050 m, and 3075 m, and we took the standard deviation of H i as the random error σ b i n i caused by uneven footprint distribution on the glacier. Based on the estimates, σ s y s i ranges from 0.15 m to 0.96 m, σ b i n i ranges from 0.01 m to 0.63 m, and the penetration error σ p e n is 0.93 m. Considering these three sources of errors, σ H i ranges from 0.94 m to 1.47 m, and σ M i ranges from 0.81 m w.e. to 1.38 m w.e.

5. Discussion

5.1. Spatio-Temporal Characteristics of Glacier Changes

The glaciers in the study area are classified as spring accumulation-type glaciers [5], exhibiting remarkable seasonal variations. During the accumulation period, low temperature and snowfall in JFM result in substantial glacier accumulation. From February, the temperature gradually increases, exceeding 0 °C by the end of May. However, the considerable snowfall in AMJ contributes additional mass to the glaciers and prevents melting during the early monsoon [7]. During the ablation period, the high temperatures lead to glaciers melting, while snowfall plays a mitigating role. Since JAS is the period with the highest temperature and the least snowfall, it becomes the most intense ablation period of the year. Notably, despite the average temperature dropping below freezing in OND, the surface temperature in the glacier ablation zone remains above 0 °C most of the time based on surface temperature data from the TRIMS LST-TP (Thermal and Reanalysis Integrating Moderate-resolution Spatial-seamless LST—Tibetan Plateau) [50]. The sparse snowfall and the higher glacier surface temperature during this period jointly result in a negative mass balance. This situation is similar to glacier behavior in the Karakoram Mountains [28], illustrating the complexity of the response of glacier mass to climate change. In terms of interannual variations, the glaciers in the study area display continuous retreat, with an annual average ablation rate of −0.83 ± 0.12 m w.e.∙yr−1. This result is consistent with previous research [51], which reported that from 2011 to 2020, the ablation rates of glaciers in the East Yigong and SETP regions are −0.77 ± 0.20 m w.e.∙yr−1 and −0.78 ± 0.12 m w.e.∙yr−1, respectively. The results of this study show that the glaciers in the region are still experiencing significant mass loss, which began in 2018. While the relatively short time span of 2018-2023 may be considered short for analyzing annual glacier trends, it still provides valuable data for observing short-term glacier dynamics. Particularly, when combined with the results of previous studies, it helps us to better understand the latest trends of glacier change and provide references for further research. In addition, ICESat-2, launched in 2018, provides high precision and spatial coverage data for our research, providing a new perspective for assessing the rate of change in recent years. In future, we will continue to track glacier changes and work to incorporate more data into analysis to gain a more complete understanding of the impact of climate change on glaciers.
The seasonal variations of glaciers in the study area mainly occur below 4700 m and generally decrease with increasing altitude. This may be related to the altitude-dependent seasonal fluctuations in temperature and snowfall. This study analyzed the monthly average temperature and the snowfall amount from 2018 to 2023 at 200 m elevation intervals and calculated the standard deviation of these time series. According to the standard deviation results (Figure 12a), the monthly variation rates of temperature and snowfall gradually decrease with increasing altitude, suggesting that the variations of temperature and snowfall are greater in low-altitude regions, while they are relatively smaller in high-altitude regions. This result is generally consistent with the trend in the distribution of glacial seasonal variation along the elevation gradient (Figure 12b). The spatial differences in meteorological elements caused by the topography of the basin could be the primary reason for the spatial non-uniformity in glacier changes. During the accumulation period, the relatively lower temperature and the higher snowfall in valley regions lead to the substantial development and accumulation of the glaciers in the eastern areas. During the ablation period, due to the high temperature and the low snowfall, almost all areas experienced mass loss. The relatively high air temperature combined with a surface temperature above 0 °C led to considerable mass loss in the southeastern glaciers.

5.2. Meteorological Drivers of Glacier Changes

Recent research has underscored the pivotal roles of temperature and snowfall in regulating glacier dynamics in the SETP [7]. These meteorological elements directly influence the accumulation and melting process of glaciers, thereby affecting the overall mass balance and long-term evolution of glaciers. This study deepens the understanding of the synergistic effects of these driving factors on GMCs and explores more detailed functional relationships of temperature and snowfall with GMCs.
The results show that temperature is the main meteorological factor affecting glacier dynamics, which may be closely related to the attributes of temperate maritime glaciers and unique climatic conditions in the study area. Given the relatively high temperature in the SETP, the glacier mass balance is particularly sensitive to temperature variation [7]. Recent studies have also suggested that glacier retreat in the SETP is primarily driven by climate warming [52,53], particularly exacerbated by the shift from snowfall to rainfall during the monsoon season [7]. According to the station observations collected in this study, the annual average temperature in the basin shows an increasing trend from 2018 to 2023 at a rate of 0.09 ± 0.06 °C yr−1. Notably, this trend varies considerably throughout the year, with temperature variation rates of −0.007 ± 0.16 °C yr−1 from January to June and 0.20 ± 0.15 °C yr−1 from July to December. The interannual fluctuation of snowfall is large, and no clear trend has been observed. This conclusion further corroborates that the temperature increase during the monsoon season is a key factor exacerbating the loss of glacier mass. This is similar to the situation at the Alps, where the primary factor controlling the annual mass balance is summer mass loss, which is associated with increased temperatures from June to September [8].
Our study further indicates that there is a cubic polynomial functional relationship of the GMC with temperature and snowfall. The results show that even if the changes in temperature and snowfall are the same, the response of the GMC may vary depending on the climate context in which these changes occur. In climate environments with higher or lower temperatures and snowfall (extreme environments), glaciers are more sensitive to changes in temperature and snowfall, which may be related to the feedback mechanisms of glacier surfaces with respect to climate change. Temperature and precipitation patterns are important factors triggering the albedo feedback on glacier surfaces [54]. In a melting environment, as temperature rises, precipitation shifts from snow to rain, causing snow cover to thin, which reduces surface albedo, leading to increased energy absorption and further acceleration of melting. In an accumulation environment, temperature affects glacier accumulation by regulating snowfall and ice formation processes. Moreover, snowfall not only replenishes glaciers with necessary water but also impacts the energy balance, as snow can reflect sunlight and reduce absorption, further promoting glacier accumulation. Therefore, different climate environments enhance glacier feedback, making their mass balance more sensitive to temperature and snowfall variations.

6. Conclusions

In this study, we employed multi-source remote sensing data, including the ICESat-2 and ALOS DEM, to extract the interannual and seasonal changes in glaciers in the Yigong Zangbo River Basin from 2018 to 2023. The spatio-temporal characteristics of glacier changes were analyzed by using the STL method, and the synergistic impacts of meteorological elements on glacier variations in the basin were explored by combining the XGBoost model and the SHAP model. This study attempted to understand the relationships of various climate drivers, such as temperature and snowfall, with glacier changes at short timescales. The main conclusions are as follows.
From 2018 to 2023, the glaciers in the Yigong Zangbo River Basin display an annual trend of ablation at the rate of −0.83 ± 0.12 m w.e.∙yr−1, which is consistent with previous research [51] in 2011–2020, indicating that the glaciers in the study region are still undergoing greater mass loss.
The seasonal variation in glaciers in the study area exhibits marked differences in different seasons. JFM and AMJ are identified as two mass accumulation seasons, with average changes of 2.12 ± 0.04 m w.e. and 0.93 ± 0.15 m w.e., respectively. JAS and OND are recognized as two ablation seasons, with average changes of −1.58 ± 0.19 m w.e. and −1.32 ± 0.17 m w.e., respectively. The result suggests that glacier accumulation in JFM and AMJ is related to low temperature and snowfall, especially in JFM, the annual minimum temperature leads to the maximum accumulation, while glacier ablation in JAS and OND is related to higher temperature, and the annual maximum temperature in JAS leads to the maximum ablation. Although the air temperature in OND is lower than 0 degrees, the glacier surface temperature is higher than 0 degrees, resulting in its melting state.
Glacier changes show more pronounced seasonal differences in low-altitude regions below 4700 m, with variations generally decreasing as altitude increases, which is related to the monthly fluctuation of temperature and snowfall with the change in altitude. Influenced by the topography of the study area, the spatial distribution of meteorological factors results in the spatial non-uniformity of seasonal glacier changes.
The impact of temperature on glacier changes is greater than that of snowfall, and temperature is the main meteorological factor affecting glacier change in the study area. Both temperature and precipitation exhibit complex cubic polynomial relationships with the GMC, which may be related to the feedback mechanisms of glacier surfaces with respect to climate change.
These findings provide critical data for understanding glacier dynamics and their response to climate change and are vital for ensuring the ecological security and sustainable water resource management of downstream regions. Moreover, these insights provide a valuable scientific basis for the international community to cope with global climate change and achieve sustainable development.

Author Contributions

W.N., methodology, writing, and data sources. Q.D., validation and editing. X.Z., analysis and coding. K.W., review and editing. Y.L., coding and investigation. Y.W., investigation. P.G., supervision. Q.L., data sources. T.Z., analysis. All authors have read and agreed to the published version of the manuscript.

Funding

This research was funded by the National Natural Science Foundation of China (Grant No. 42130306, 42230508).

Data Availability Statement

Data are contained within the article.

Acknowledgments

The 2023 meteorological forcing datasets used in this study were supported by dataset producer Y.J.

Conflicts of Interest

The authors declare that they have no competing interests.

References

  1. Immerzeel, W.W.; Lutz, A.F.; Andrade, M.; Bahl, A.; Biemans, H.; Bolch, T.; Hyde, S.; Brumby, S.; Davies, B.; Elmore, A. Importance and vulnerability of the world’s water towers. Nature 2020, 577, 364–369. [Google Scholar] [CrossRef] [PubMed]
  2. Yao, T.; Bolch, T.; Chen, D.; Gao, J.; Immerzeel, W.; Piao, S.; Su, F.; Thompson, L.; Wada, Y.; Wang, L. The imbalance of the Asian water tower. Nat. Rev. Earth Environ. 2022, 3, 618–632. [Google Scholar] [CrossRef]
  3. Zhang, G.; Bolch, T.; Chen, W.; Crétaux, J.-F. Comprehensive estimation of lake volume changes on the Tibetan Plateau during 1976–2019 and basin-wide glacier contribution. Sci. Total Environ. 2021, 772, 145463. [Google Scholar] [CrossRef]
  4. Pritchard, H.D. Asia’s shrinking glaciers protect large populations from drought stress. Nature 2019, 569, 649–654. [Google Scholar] [CrossRef]
  5. Yang, W.; Yao, T.; Guo, X.; Zhu, M.; Li, S.; Kattel, D.B. Mass balance of a maritime glacier on the southeast Tibetan Plateau and its climatic sensitivity. J. Geophys. Res. Atmos. 2013, 118, 9579–9594. [Google Scholar] [CrossRef]
  6. Gardelle, J.; Berthier, E.; Arnaud, Y.; Kääb, A. Region-wide glacier mass balances over the Pamir-Karakoram-Himalaya during 1999–2011. Cryosphere 2013, 7, 1263–1286. [Google Scholar] [CrossRef]
  7. Jouberton, A.; Shaw, T.E.; Miles, E.; McCarthy, M.; Fugger, S.; Ren, S.; Dehecq, A.; Yang, W.; Pellicciotti, F. Warming-induced monsoon precipitation phase change intensifies glacier mass loss in the southeastern Tibetan Plateau. Proc. Natl. Acad. Sci. USA 2022, 119, e2109796119. [Google Scholar] [CrossRef]
  8. Gharehchahi, S.; Ballinger, T.J.; Jensen, J.L.; Bhardwaj, A.; Sam, L.; Weaver, R.C.; Butler, D.R. Local-and regional-scale forcing of glacier mass balance changes in the swiss alps. Remote Sens. 2021, 13, 1949. [Google Scholar] [CrossRef]
  9. Veettil, B.K.; Kamp, U. Glacial lakes in the andes under a changing climate: A review. J. Earth Sci. 2021, 32, 1575–1593. [Google Scholar] [CrossRef]
  10. Luo, L.-H.; Ke, C.-Q.; Fan, Y.-B.; Wang, Z.-F. Accelerated glacier mass loss in the southeastern Tibetan Plateau since the 1970s. Adv. Clim. Chang. Res. 2023, 14, 372–386. [Google Scholar] [CrossRef]
  11. Li, G.; Lin, H. Recent decadal glacier mass balances over the Western Nyainqentanglha Mountains and the increase in their melting contribution to Nam Co Lake measured by differential bistatic SAR interferometry. Glob. Planet. Chang. 2017, 149, 177–190. [Google Scholar] [CrossRef]
  12. Yao, T.; Pu, J.; Lu, A.; Wang, Y.; Yu, W. Recent glacial retreat and its impact on hydrological processes on the Tibetan Plateau, China, and surrounding regions. Arct. Antarct. Alp. Res. 2007, 39, 642–650. [Google Scholar] [CrossRef]
  13. Ke, C.-Q.; Lee, H.; Han, Y.-F. Glacier Change in the Yigong Zangbo Basin, Tibetan Plateau, China. Korean J. Remote Sens. 2019, 35, 491–502. [Google Scholar]
  14. Wang, Q.; Duan, H.; Liu, N.; Du, Z.; Wang, P.; Yi, B.; Xu, J.; Huang, J.; Zhang, Y.; Yao, X. Change of moraine-dammed glacial lakes and simulation of glacial lake outburst flood in the Yi’ong Zangbo River basin. Front. Earth Sci. 2022, 10, 881285. [Google Scholar] [CrossRef]
  15. Romshoo, S.A.; Murtaza, K.O.; Abdullah, T. Towards understanding various influences on mass balance of the Hoksar Glacier in the Upper Indus Basin using observations. Sci. Rep. 2022, 12, 15669. [Google Scholar] [CrossRef]
  16. Zhou, Y.; Li, Z.; Li, J.; Zhao, R.; Ding, X. Geodetic glacier mass balance (1975–1999) in the central Pamir using the SRTM DEM and KH-9 imagery. J. Glaciol. 2019, 65, 309–320. [Google Scholar] [CrossRef]
  17. Ye, Q.; Zong, J.; Tian, L.; Cogley, J.G.; Song, C.; Guo, W. Glacier changes on the Tibetan Plateau derived from Landsat imagery: Mid-1970s–2000–13. J. Glaciol. 2017, 63, 273–287. [Google Scholar] [CrossRef]
  18. Li, H.; Wang, P.; Li, Z.; Wang, P.; Xu, C.; Liu, S.; Jin, S.; Zhang, Z.; Xu, L. Research on the changes of the Urumqi Glacier No. 1, Tianshan Mountains based on multi-source remote sensing data. J. Glaciol. Geocryol. 2021, 43, 1018–1026. [Google Scholar]
  19. Cheng, C.; Du, W.; Li, J.; Bao, A.; Ge, W.; Wang, S.; Ma, D.; Pan, Y. Spatiotemporal Variations of Glacier Mass Balance in the Tomur Peak Region Based on Multi-Source Altimetry Remote Sensing Data. Remote Sens. 2023, 15, 4143. [Google Scholar] [CrossRef]
  20. Lin, H.; Li, G.; Cuo, L.; Hooper, A.; Ye, Q. A decreasing glacier mass balance gradient from the edge of the Upper Tarim Basin to the Karakoram during 2000–2014. Sci. Rep. 2017, 7, 6712. [Google Scholar] [CrossRef]
  21. Li, G.; Li, Y.; Lin, H.; Ye, Q.; Jiang, L. Two periods of geodetic glacier mass balance at Eastern Nyainqentanglha derived from multi-platform bistatic SAR interferometry. Int. J. Appl. Earth Obs. Geoinf. 2021, 104, 102541. [Google Scholar] [CrossRef]
  22. Ye, Q.; Zhang, X.; Wang, Y.; Zhang, Z.; Hu, Y.; Zhu, L. Monitoring glacier thinning rate in Rongbuk Catchment on the northern slope of Mt. Qomolangma from 1974 to 2021. Ecol. Indic. 2022, 144, 109418. [Google Scholar] [CrossRef]
  23. Chen, W.; Yao, T.; Zhang, G.; Li, F.; Zheng, G.; Zhou, Y.; Xu, F. Towards ice-thickness inversion: An evaluation of global digital elevation models (DEMs) in the glacierized Tibetan Plateau. Cryosphere 2022, 16, 197–218. [Google Scholar] [CrossRef]
  24. Yue, L.; Shen, H.; Yu, W.; Zhang, L. Monitoring of historical glacier recession in yulong mountain by the integration of multisource remote sensing data. IEEE J. Sel. Top. Appl. Earth Obs. Remote Sens. 2018, 11, 388–400. [Google Scholar] [CrossRef]
  25. Laskar, A.H.; Bhattacharya, S.K.; Rao, D.K.; Jani, R.A.; Gandhi, N. Seasonal variation in stable isotope compositions of waters from a Himalayan river: Estimation of glacier melt contribution. Hydrol. Process. 2018, 32, 3866–3880. [Google Scholar] [CrossRef]
  26. Wang, K.; Kong, Y.; Pu, T.; Shi, X.; Pang, Z. Seasonal variations of a glacier river runoff components as relative to changes of air temperature and precipitation in southeast Tibetan Plateau. Appl. Geochem. 2024, 162, 105909. [Google Scholar] [CrossRef]
  27. Xue, Y.; Hong, X.; He, X.; Kang, S.; Wang, S.; Ding, Y. An evaluation of TLS-based glacier change assessment in the central Tibetan plateau. Int. J. Digit. Earth 2024, 17, 2375527. [Google Scholar] [CrossRef]
  28. Xu, X.; Wang, W.; Huang, D.; Hu, X.; Fu, W. Assessment of interannual and seasonal glacier mass changes in the Karakoram during 2018–2022 using ICESat-2 data. J. Hydrol. 2023, 626, 130223. [Google Scholar] [CrossRef]
  29. Shen, C.; Jia, L.; Ren, S. Inter-and intra-annual glacier elevation change in high mountain Asia region based on ICESat-1&2 data using elevation-aspect bin analysis method. Remote Sens. 2022, 14, 1630. [Google Scholar] [CrossRef]
  30. Su, B.; Xiao, C.; Chen, D.; Huang, Y.; Che, Y.; Zhao, H.; Zou, M.; Guo, R.; Wang, X.; Li, X. Glacier change in China over past decades: Spatiotemporal patterns and influencing factors. Earth-Sci. Rev. 2022, 226, 103926. [Google Scholar] [CrossRef]
  31. Wang, R.; Liu, S.; Shangguan, D.; Radić, V.; Zhang, Y. Spatial heterogeneity in glacier mass-balance sensitivity across High Mountain Asia. Water 2019, 11, 776. [Google Scholar] [CrossRef]
  32. Niu, S.; Sun, M.; Wang, G.; Wang, W.; Yao, X.; Zhang, C. Glacier Change and Its Influencing Factors in the Northern Part of the Kunlun Mountains. Remote Sens. 2023, 15, 3986. [Google Scholar] [CrossRef]
  33. Yao, T.; Thompson, L.; Yang, W.; Yu, W.; Gao, Y.; Guo, X.; Yang, X.; Duan, K.; Zhao, H.; Xu, B. Different glacier status with atmospheric circulations in Tibetan Plateau and surroundings. Nat. Clim. Chang. 2012, 2, 663–667. [Google Scholar] [CrossRef]
  34. Lundberg, S.M.; Lee, S.-I. A unified approach to interpreting model predictions. Adv. Neural Inf. Process. Syst. 2017, 30, 4765–4774. [Google Scholar]
  35. Li, Z. Extracting spatial effects from machine learning model using local interpretation method: An example of SHAP and XGBoost. Comput. Environ. Urban Syst. 2022, 96, 101845. [Google Scholar] [CrossRef]
  36. Zhang, X.; Gou, P.; Chen, W.; Li, G.; Huang, Y.; Zhou, T.; Liu, Y.; Nie, W. Spatiotemporal distribution characteristics of ecosystem health and the synergetic impact of its driving factors in the Yangtze River Delta, China. Environ. Sci. Pollut. Res. 2023, 30, 85184–85197. [Google Scholar] [CrossRef]
  37. Utkin, L.; Konstantinov, A. Ensembles of random SHAPs. Algorithms 2022, 15, 431. [Google Scholar] [CrossRef]
  38. Shi, Y.; Liu, S. Estimation on the response of glaciers in China to the global warming in the 21st century. Chin. Sci. Bull. 2000, 45, 668–672. [Google Scholar] [CrossRef]
  39. Markus, T.; Neumann, T.; Martino, A.; Abdalati, W.; Brunt, K.; Csatho, B.; Farrell, S.; Fricker, H.; Gardner, A.; Harding, D. The Ice, Cloud, and land Elevation Satellite-2 (ICESat-2): Science requirements, concept, and implementation. Remote Sens. Environ. 2017, 190, 260–273. [Google Scholar] [CrossRef]
  40. Du, W.; Liu, X.; Guo, J.; Shen, Y.; Wang, L.; Chang, X. Analysis of the melting glaciers in Southeast Tibet by ALOS-PALSAR data. TAO Terr. Atmos. Ocean. Sci. 2019, 30, 7. [Google Scholar] [CrossRef]
  41. Yang, K.; Jiang, Y.; Tang, W.; He, J.; Shao, C.; Zhou, X.; Lu, H.; Chen, Y.; Li, X.; Shi, J. A High-Resolution Near-Surface Meteorological Forcing Dataset for the Third Pole Region (TPMFD, 1979–2022); National Tibetan Plateau/Third Pole Environment Data Center: Beijing, China, 2023. [Google Scholar]
  42. Arendt, A.; Bliss, A.; Bolch, T.; Cogley, J.; Gardner, A.; Hagen, J.-O.; Hock, R.; Huss, M.; Kaser, G.; Kienholz, C. Randolph Glacier Inventory–A Dataset of Global Glacier Outlines: Version 6.0: Technical Report, Global Land Ice Measurements from Space. 2017. Available online: http://www.glims.org/RGI/randolph60.html (accessed on 2 June 2024).
  43. Nuth, C.; Kääb, A. Co-registration and bias corrections of satellite elevation data sets for quantifying glacier thickness change. Cryosphere 2011, 5, 271–290. [Google Scholar] [CrossRef]
  44. Farinotti, D.; Longuevergne, L.; Moholdt, G.; Duethmann, D.; Mölg, T.; Bolch, T.; Vorogushyn, S.; Güntner, A. Substantial glacier mass loss in the Tien Shan over the past 50 years. Nat. Geosci. 2015, 8, 716–722. [Google Scholar] [CrossRef]
  45. Huss, M. Density assumptions for converting geodetic glacier volume change to mass change. Cryosphere 2013, 7, 877–887. [Google Scholar] [CrossRef]
  46. Cleveland, R.B.; Cleveland, W.S.; McRae, J.E.; Terpenning, I. STL: A seasonal-trend decomposition. J. Off. Stat. 1990, 6, 3–73. [Google Scholar]
  47. Zhang, J.; Ma, X.; Zhang, J.; Sun, D.; Zhou, X.; Mi, C.; Wen, H. Insights into geospatial heterogeneity of landslide susceptibility based on the SHAP-XGBoost model. J. Environ. Manag. 2023, 332, 117357. [Google Scholar] [CrossRef]
  48. Chen, T.; Guestrin, C. Xgboost: A scalable tree boosting system. In Proceedings of the 22nd ACM SIGKDD International Conference on Knowledge Discovery and Data Mining, San Francisco, CA, USA, 13–17 August 2016; pp. 785–794. [Google Scholar]
  49. Ragettli, S.; Bolch, T.; Pellicciotti, F. Heterogeneous glacier thinning patterns over the last 40 years in Langtang Himal, Nepal. Cryosphere 2016, 10, 2075–2097. [Google Scholar] [CrossRef]
  50. Ji, Z.; Xiaodong, Z.; Wenbin, T.; Lirong, D.; Jin, M.; Xu, Z. Daily 1-km All-Weather Land Surface Temperature Dataset for Western China (TRIMS LST-TP; 2000–2021) V2; National Tibetan Plateau Data Center: Beijing, China, 2019. [Google Scholar]
  51. Zhao, F.; Long, D.; Li, X.; Huang, Q.; Han, P. Rapid glacier mass loss in the Southeastern Tibetan Plateau since the year 2000 from satellite observations. Remote Sens. Environ. 2022, 270, 112853. [Google Scholar] [CrossRef]
  52. Zhou, Y.; Li, X.; Zheng, D.; Li, Z. Evolution of geodetic mass balance over the largest lake-terminating glacier in the Tibetan Plateau with a revised radar penetration depth based on multi-source high-resolution satellite data. Remote Sens. Environ. 2022, 275, 113029. [Google Scholar] [CrossRef]
  53. Zhu, M.; Yao, T.; Yang, W.; Xu, B.; Wu, G.; Wang, X. Differences in mass balance behavior for three glaciers from different climatic regions on the Tibetan Plateau. Clim. Dyn. 2018, 50, 3457–3484. [Google Scholar] [CrossRef]
  54. Johnson, E.; Rupper, S. An examination of physical processes that trigger the albedo-feedback on glacier surfaces and implications for regional glacier mass balance across high mountain Asia. Front. Earth Sci. 2020, 8, 129. [Google Scholar] [CrossRef]
Figure 1. (a) Overview of the study area, (b) distribution of the ICESat-2 points in the study area, and (c) the location of the study area on the Tibetan Plateau.
Water 16 02617 g001
Figure 2. Technical flowchart. “GMC” denotes glacier mass changes, “DEM” the digital elevation model, “RGI” the Randolph Glacier Inventory data, “STL” the seasonal-trend decomposition using LOESS, and “SHAP” the Shapley additive explanations.
Water 16 02617 g002
Figure 3. A schematic diagram of the XGBoost model. The red arrow denotes the selected direction of the tree, the yellow circle denotes the selected node, the green circle denotes the unselected node.
Water 16 02617 g003
Figure 4. Glacier mass change (GMC), seasonal mass difference ( M S T L ), and trend and seasonal components after the STL decomposition.
Water 16 02617 g004
Figure 5. Deseasonalized GMC series X ( X i = T i + ε i ) .
Water 16 02617 g005
Figure 6. (a) Average seasonal GMC relative to ALOS DEM ( G M C ¯ ) and glacial area with altitude, and (b) average seasonal variation in glacier mass ( M ¯ ) at different altitudes.
Water 16 02617 g006
Figure 7. Seasonal variation in glacier mass ( M ¯ ) in (a) JFM, (b) AMJ, (c) JAS, and (d) OND.
Water 16 02617 g007
Figure 8. SHAP values of the meteorological drivers for the GMC.
Water 16 02617 g008
Figure 9. Scatter plots of the SHAP values of (a) temperature and (b) snowfall and their functional relationships with the GMC.
Water 16 02617 g009
Figure 10. (a) Monthly average temperature and accumulated precipitation within the study region (2018–2023); seasonal average (b) temperature and (c) precipitation. “Tem” denotes temperature, “TP” denotes total precipitation, and “SF” denotes snowfall.
Water 16 02617 g010
Figure 11. Seasonal averages of (ad) temperature and (eh) snowfall from 2018 to 2023.
Water 16 02617 g011
Figure 12. Variations in the standard deviations of the (a) temperature ( σ T e m ), snowfall ( σ S F ), and (b) seasonal variation in glaciers ( σ Δ M ) with altitude.
Water 16 02617 g012
Disclaimer/Publisher’s Note: The statements, opinions and data contained in all publications are solely those of the individual author(s) and contributor(s) and not of MDPI and/or the editor(s). MDPI and/or the editor(s) disclaim responsibility for any injury to people or property resulting from any ideas, methods, instructions or products referred to in the content.

