Article

Investigating the Energy Dissipation Mechanism of Piano Key Weir: An Integrated Approach Using Physical and Numerical Modeling

1
Nanjing Hydraulic Research Institute, Nanjing 210029, China
2
Key Laboratory of Water Governance of the Taihu Lake Basin, Ministry of Water Resources, Nanjing 210029, China
*
Author to whom correspondence should be addressed.
Water 2024, 16(18), 2620; https://doi.org/10.3390/w16182620
Submission received: 17 August 2024 / Revised: 6 September 2024 / Accepted: 12 September 2024 / Published: 15 September 2024

Abstract

:
The enormous energy carried by discharged water poses a serious threat to the Piano Key Weir (PKW) and its downstream hydraulic structures. However, previous research on energy dissipation in PKWs has mainly focused downstream effects, and the research methods have been largely limited to physical model experiments. To deeply investigate the discharge capacity and hydraulic characteristics of PKW, this study established a PKW model with universally applicable geometric parameters. By combining physical model experiments and numerical simulations, the flow pattern of the PKW, the discharge at the overflow edges, and the variation in the energy dissipation were revealed for different water heads. The results showed that the discharge of the side wall constitutes the majority of the total discharge at low water heads, resulting in a relatively high overall discharge efficiency. As the water head increases, the proportion of discharge from the inlet and outlet keys increases, while the proportion from the side wall decreases. This change results in less discharge from the side wall and a consequent reduction in the overall discharge efficiency. The PKW exhibits superior energy dissipation efficiency under low water heads. However, this efficiency exhibits an inverse relationship with an increasing water head. The overall energy dissipation efficiency can reach 40% to 70%. Additionally, the collision of the water flows inside the outlet chamber and the mixing of the overflow jet play a primary role in energy dissipation. The findings of this study have significant implications for hydraulic engineering construction and PKW operational safety.

1. Introduction

In the context of the heightened global emphasis on sustainable development, advancements in water resource management and flood control technology are paramount. The global management of water resources confronts increasingly frequent extreme climate events and escalating demands, necessitating the adoption of more sophisticated and dependable hydraulic engineering technologies [1,2]. PKW, as a novel type of overflow weir, holds significant practical importance in this regard. The distinctive design of a PKW not only enhances its efficacy in flood control but also substantially improves the efficiency of water resource utilization. Its modular structure simplifies construction processes, reduces maintenance costs, and aligns with the pressing demands of green engineering and sustainable development. Therefore, from the perspective of the water conservancy industry, there is an urgent need to promote and conduct comprehensive research on PKWs to address the challenges confronting global water resource management.
The energy dissipation problem is the key to the safety of dam construction and is also one of the key technical difficulties in water conservancy engineering construction [3]. As a drainage structure, PKW has a strong discharge capacity; the discharged water carries strong energy [4]. The problem of flood discharge and energy dissipation is prominent, and improper handling of energy dissipation problems can cause significant harm to PKW itself and the downstream riverbed [5].
The PKW was first proposed by Lempérière and Ouamane in 2003. It aims to advance technology in flood control and spillway design. The Hydrocoop Hydroelectric Company in France collaborated with the University of Biskra to develop this innovative weir. This design consists of repeated and interlocking units, which enhance its functionality and efficiency in various hydraulic applications. Since the proposal of PKW, a large amount of research has been conducted on the discharge capacity and hydraulic characteristics [6,7] and has promoted its development from concept to engineering application. In terms of the hydraulic characteristics of PKWs, Machiels et al. examined the effect of weir thickness on hydraulic characteristics by constructing a large-scale PKW model in 2011. Their findings indicated that the blocking effect of the weir thickness could impact the discharge capacity of the inlet key. In 2012, Dabling et al. performed a comparative study on the hydraulic characteristics of PKWs under free- and submerged-outflow conditions through model experiments. Regarding the calculation of the discharge capacity of PKWs, Lempérière et al. proposed an empirical formula in 2011 that estimates discharge capacity based on the water head. Subsequently, Leite Ribeiro et al. introduced a method for evaluating the discharge capacity of PKWs in 2012, which uses the discharge amplification ratio between PKWs and sharp crest weirs. They analyzed 304 datasets to derive a formula for calculating the discharge amplification ratio. Currently, the commonly used formula for calculating discharge capacity reflects the positive relationship between the discharge coefficient and discharge capacity. In terms of engineering applications, the first PKW was constructed in 2006 on the Goulours Dam in France. There were over 30 PKWs have been built globally, with 11 projects in Vietnam, 4 projects in France, and others in Algeria, Australia, Burkina Faso, the United Kingdom, India, South Africa, Switzerland, and Sri Lanka. With the establishment of PKW projects worldwide, energy dissipation has become another key issue in the application of PKW.
Many studies have been conducted on energy dissipation and erosion prevention of PKW, mainly using prototype observations, physical experiments and numerical simulations. Regarding the downstream effects of PKWs, Binit Kumar et al. [8] studied the development of terrain erosion downstream of PKW through physical model experiments and discovered that the erosion depth was 40–80% of the weir height under different water heads and that the addition of a solid apron downstream can effectively reduce the erosion depth. Justrich et al. [9] investigated unhindered scour formation and the corresponding ridge generation caused by PKWs through physical model experiments and provided a general estimation of the equilibrium scour and ridge dimensions. Shen et al. [10] investigated the impacts of different upstream wave crest shapes on the downstream energy dissipation of PKWs through experiments, revealing that a flat crest was the most efficient configuration in terms of energy dissipation, and established an empirical equation to predict the residual energy downstream. R. Eslinger et al. [11] studied the energy dissipation downstream of four different width ratios of A-type PKWs through physical model experiments and proposed equations for the water head H/P and width ratio Wi/Wo to predict the remaining energy downstream. Rajaei et al. [12] investigated the downstream scour of trapezoidal and rectangular PKWs. The results showed that rectangular PKWs effectively reduce scour by nearly 10% as compared to linear weirs, whereas this is 19% with trapezoidal PKWs. Li et al. [13] conducted three-dimensional computational fluid dynamics simulations on Type A PKWs. The results indicated that at low water heads, the turbulent kinetic energy in the outlet key was higher, while that in the inlet key was lower. As the water head increased, the region of elevated turbulent kinetic energy gradually shifted downstream of the PKW. Deepak Singh et al. conducted physical model experiments to study the energy dissipation process of A- and B-type PKWs with 12 different geometric parameters under free flow [14,15]. The results showed that A- and B-type PKWs have higher energy dissipation efficiencies under a low water head and that the energy dissipation efficiency of A- and B-type PKWs can be improved by about 6.67% and 6.43% after setting steps in the outlet key.
Generally, research on the energy dissipation of PKWs has mainly focused on the downstream. The downstream energy dissipation measures need to be determined based on the specific downstream terrain, such as setting up a dissipation pool, a stepped spillway, and a static water tank to consume the energy of the discharged water. There is relatively little research on the energy dissipation problem of the PKW itself. Due to the overhangs of the upstream and downstream, the PKW itself has a certain energy dissipation effect [16]; the quantitative and qualitative analysis of the energy dissipation of the PKW itself is of great research value. In addition, the main research method for energy dissipation of PKWs is physical model experiments. Although it is considered the best analysis method for PKW research [17], which can well analyze the energy changes in the upstream and downstream of PKWs, relying solely on physical model experiments is insufficient for fully understanding the energy changes in the internal keys of PKWs. Numerical simulation can effectively analyze the energy changes inside PKW.
In order to investigate the energy dissipation mechanism of PKWs, this study established a PKW model with universally applicable geometric parameters by referring to the previous research results. The research method employed a combination of physical modeling experiments and numerical simulations. The flow pattern of PKW, the discharge at the overflow edges, and the variation in the energy dissipation were revealed under different water heads, ultimately clarifying the energy dissipation mechanism of the PKW.

2. Materials and Methods

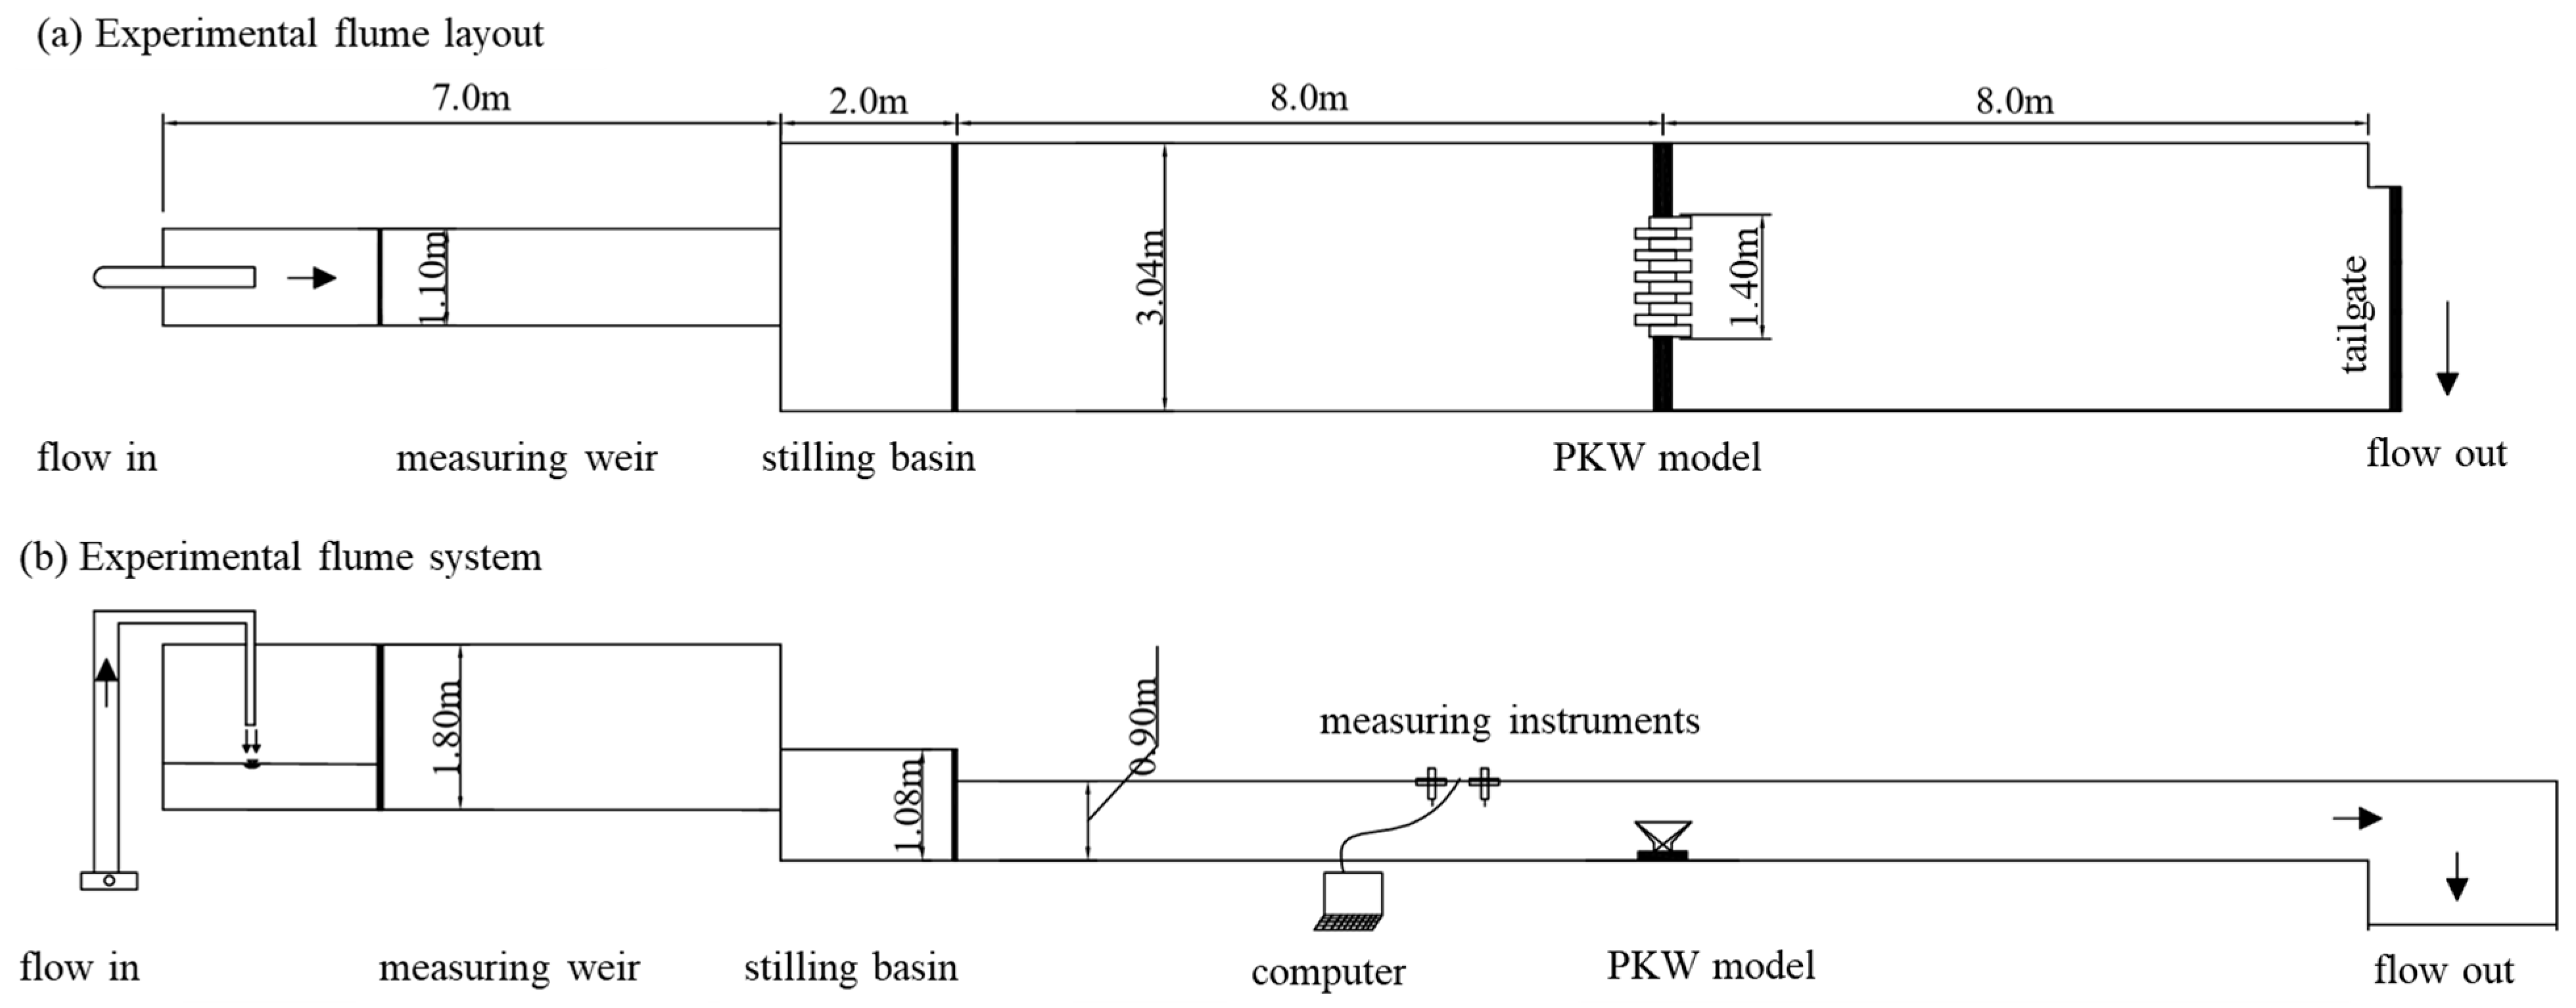
2.1. Experimental Setup
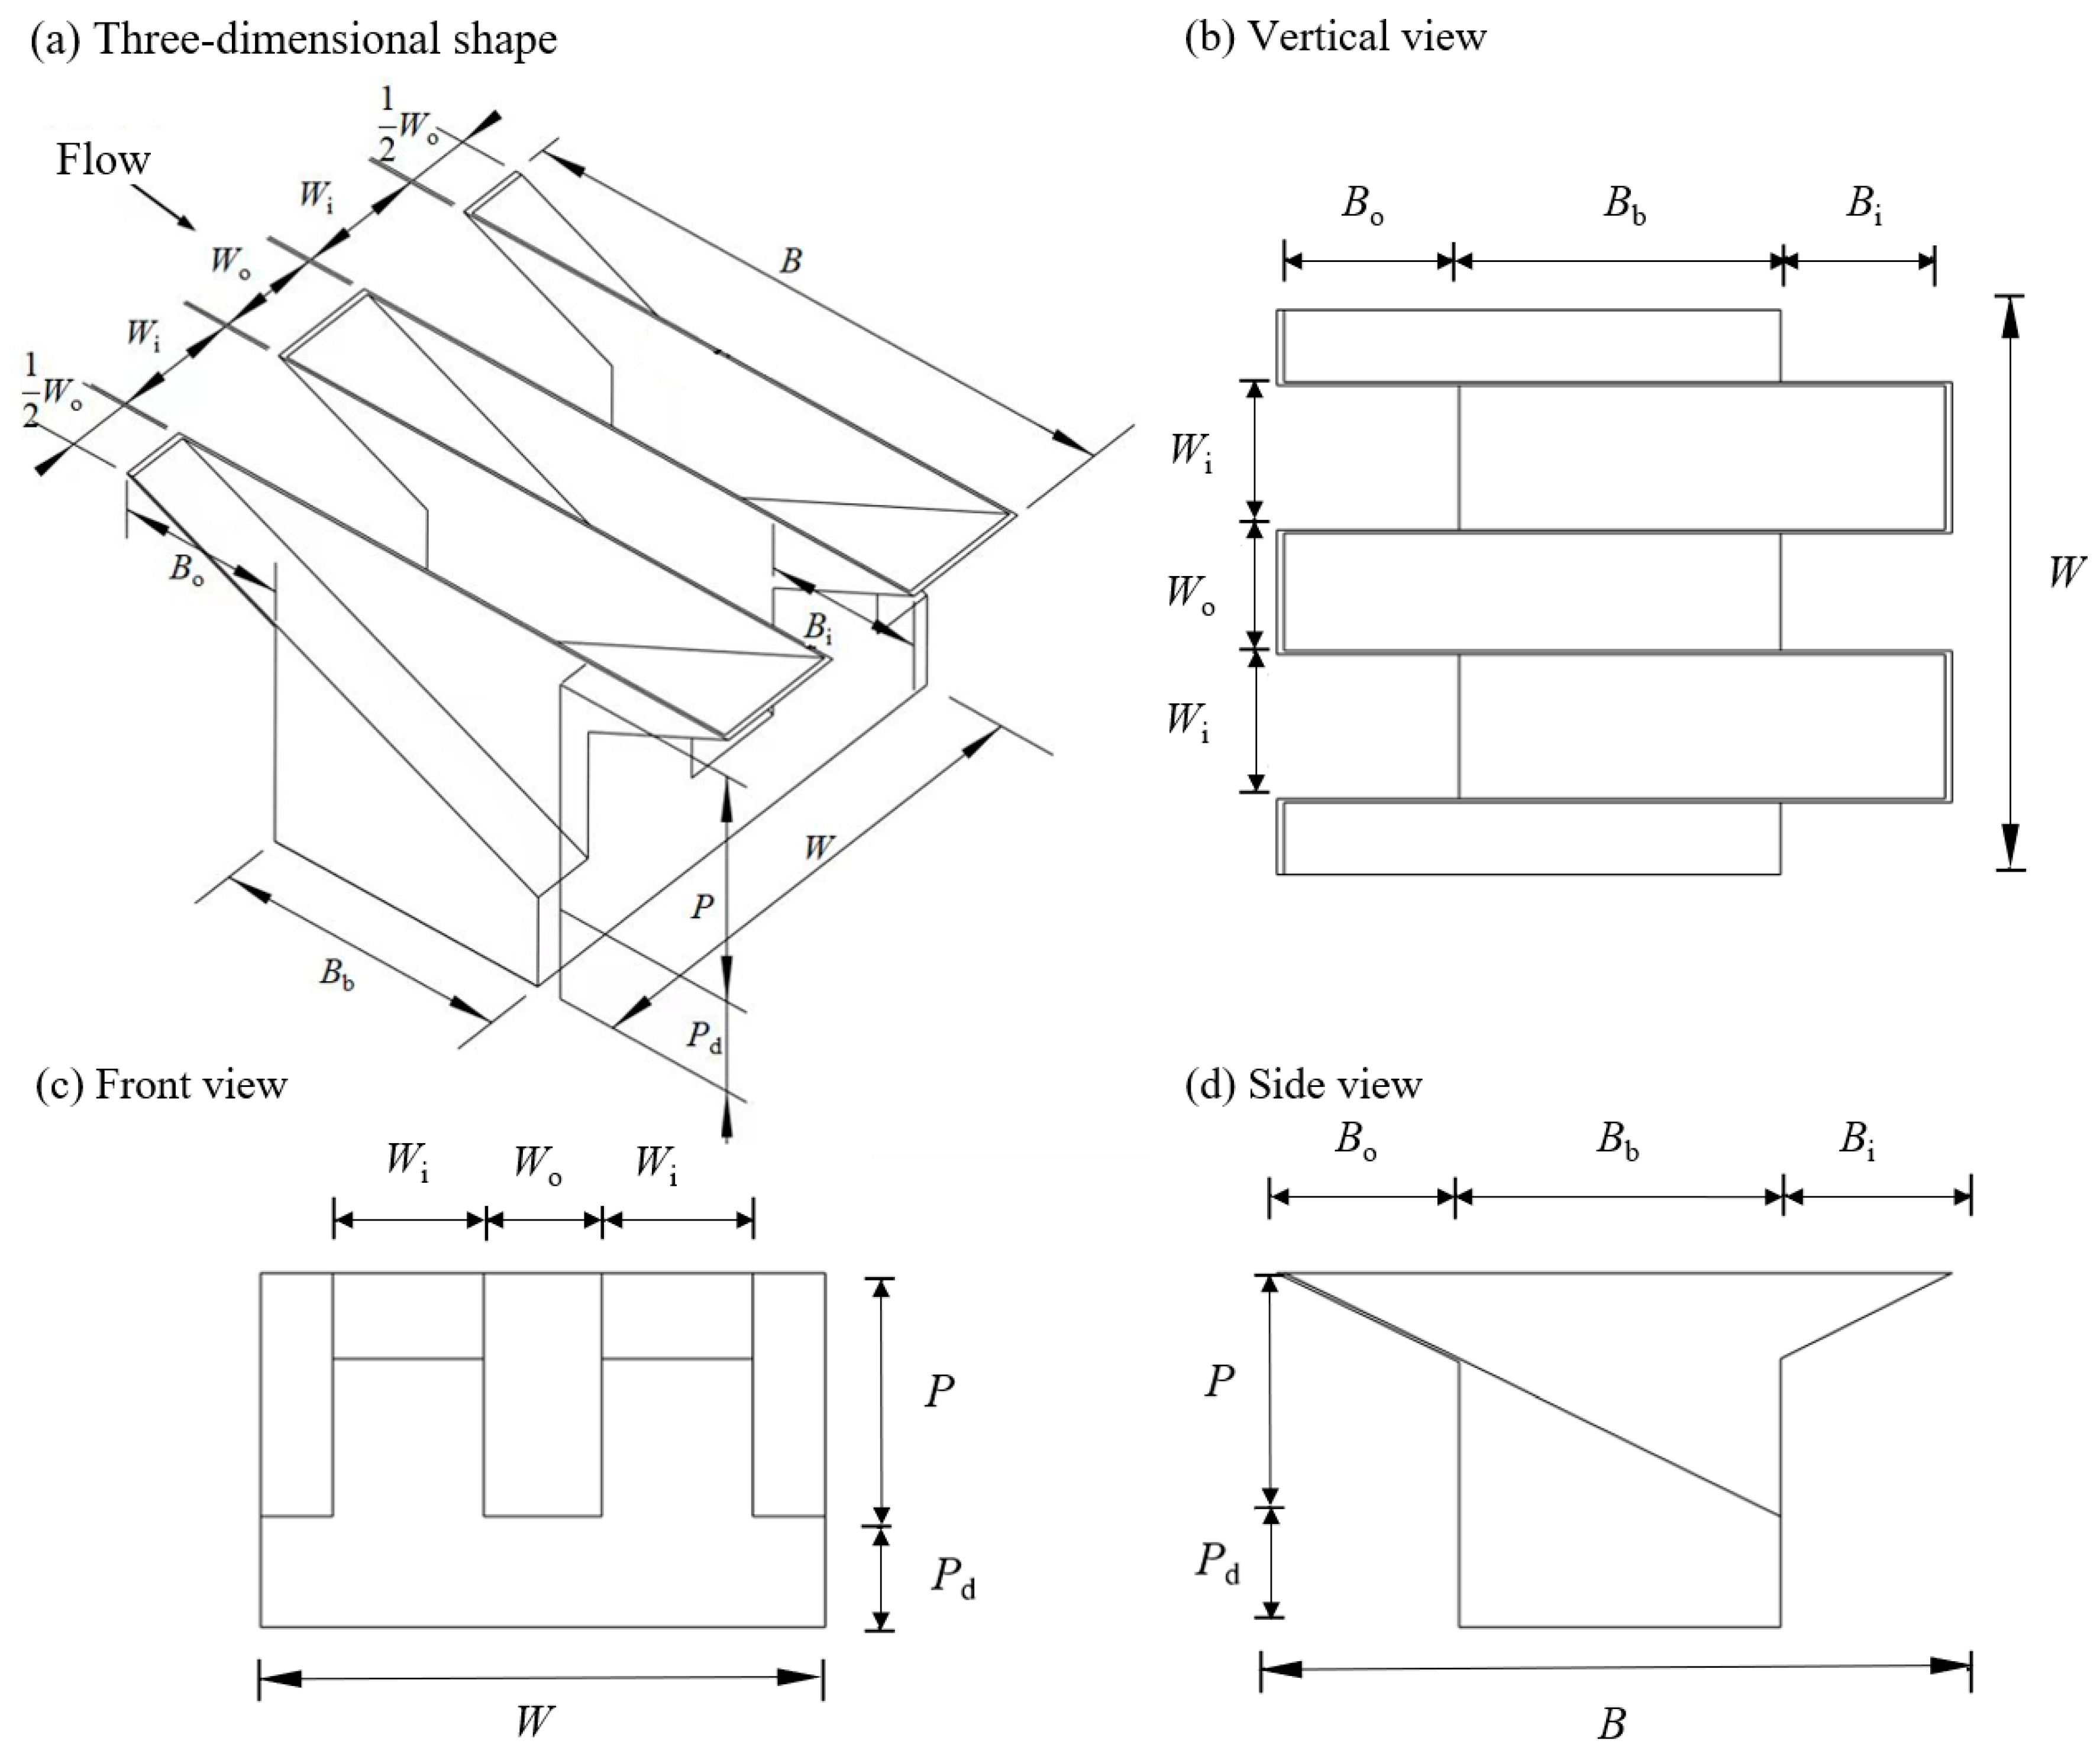
The experimental flume model test included the water supply system, measuring weir, stilling basin, upstream channel, measuring instruments, downstream channel, water supply equipment, and tailgate control system [18]. During the experiment, water from an underground reservoir was pumped through the supply pipeline, and the valves on the pipeline were adjusted to control the discharge. The water then flowed freely over the measuring weir into the stilling basin, where it stabilized before flowing over a spillway and into the downstream flume. The water flowed through an 8 m-long channel to reach the PKW model, then overflowed the model and traveled through another 8 m-long channel before eventually flowing back into the underground reservoir. The entire water flow formed a closed-loop system. The experimental measurements included upstream discharge, water level, and flow velocity. The upstream discharge was measured by a measuring weir, with a measurement range from 15 L/s to 200 L/s. The water level was measured by a water level sensor with an accuracy of ±0.1 mm. The flow velocity was assessed by a photoelectric velocimeter. This instrument comprised a collector, propeller, wireless signal transmitter, receiver, and computer software system. It offered a measurement accuracy of 0.01 cm/s. Figure 1 shows the experimental layout.
The model coordinate system was established with the projection point of the PKW inlet end at the bottom as the origin. The water flow direction is the X-coordinate, the transverse flow direction is the Y-coordinate, and the vertical upward direction is the Z-coordinate.

2.2. PKW Model

The PKW model in the experiment was used to analyze the hydraulic characteristics and discharge capacity. In order to ensure the universality of the experimental results, it was necessary to determine the structural type, the main dimensionless parameter ratios, and some geometric parameters of the PKW model during the production process [19], including the total crest length to weir width ratio L/W, the water head H/P, the inlet and outlet width ratio Wi/Wo, the overhang length ratio Bo/Bi, the cycles N, the length of side wall B, and the overhang angles Si and So. This study determined the parameters of the PKW by referring to and analyzing the research results on structure parameters and actual engineering parameters [20,21]. Figure 2 shows the main geometric parameters of the Type A PKW.
In terms of the type of PKW model, among nearly 30 PKW engineering worldwide, A-type structures account for 20 [22], B-type structures for 2, C-type structures for 1, and D-type structures for 1, with A-type PKWs occupying 67% [23]. In this study, the PKW was designed as a Type A. In engineering, the minimum weir height of A-type PKWs is 1.8 m, the maximum is 6 m, and the average height is approximately 3.45 m [24]. In this study, the actual engineering height of the A-type PKW was scaled based on a geometric ratio of 1:15 to meet the criterion of geometric similarity, ultimately determining the weir height P of 0.23 m for the model. Ouamane considered the ratio of inlet width to outlet width Wi/Wo to be an important parameter affecting the discharge capacity. Lempérière indicated that the optimal Wi/Wo for discharge efficiency is 1.25 [25]. In this study, the PKW’s Wi/Wo was determined to be 1.25. The ratio of the upstream and downstream overhang length Bo/Bi primarily affects the slope of the key bottom [13]. Based on existing projects, the most widely adopted design considers symmetrical overhangs Bo/Bi =1.00 [26]. In this study, the PKW’s Bo/Bi was determined to be 1.00. The upstream and downstream overhang angles Si and So primarily affect the discharge capacity of the side walls. Research suggests that when the tangent value of Si and So falls between 0.33 and 0.66, the discharge capacity of the PKW is optimum. Based on Bo/Bi and P, this study determined a tangent value of 0.53 for the Si and So of the PKW model. The total crest length to weir width ratio L/W of the PKW is a major parameter affecting the discharge capacity. Lempérière recommended using L/W around 5 to achieve the optimal balance between the discharge capacity and the structural construction investment [27]. In this study, the PKW’s L/W was determined to be 5.00. Regarding the cycles N in the PKW, while too few cycles can affect its hydraulic characteristics, too many cycles can increase the degree of mutual interference of water flows within the chambers. Research conducted in foreign laboratories indicates that the optimal number of chambers is between five and six [28]. In this study, the PKW was designed with five cycles.
According to the analysis of the parameters of the PKW mentioned above, a model of an A-type PKW was fabricated for the experiment with five cycles, featuring overhangs both upstream and downstream. The dimensional parameters of the model are as follows: L/W = 5.00, Bo/Bi = 1.06, Wi/Wo = 1.25, and Tan Si = Tan So = 0.53. Finally, the dimensions of the PKW model were determined based on the width and height of the flume, as presented in Table 1.
The energy dissipation rate η is used as a characterization parameter for the energy dissipation characteristics of the PKW [29]. The energy dissipation rate is the ratio of the energy loss of the upstream and downstream sections to the total energy of the upstream sections [30]; the expression is as follows:
η = E 1 E 2 E 1 × 100 %
E 1 = Z 1 + h 1 + α 1 v 1 2 2 g
E 2 = h 2 + α 2 v 2 2 2 g
In the formula, E1 and E2 represent the total water head of the upstream and downstream cross-sections (m); Z1 is the height difference between the upstream and downstream bottom (m); h1 and h2 are the average water depths (m) of the upstream and downstream sections; α1 and α2 are the velocity correction coefficients for the upstream and downstream sections, where α1 = α2 = 1; v1 and v2 respectively represent the average flow velocity of the upstream and downstream sections (m/s); and g is the gravitational acceleration (m/s2).

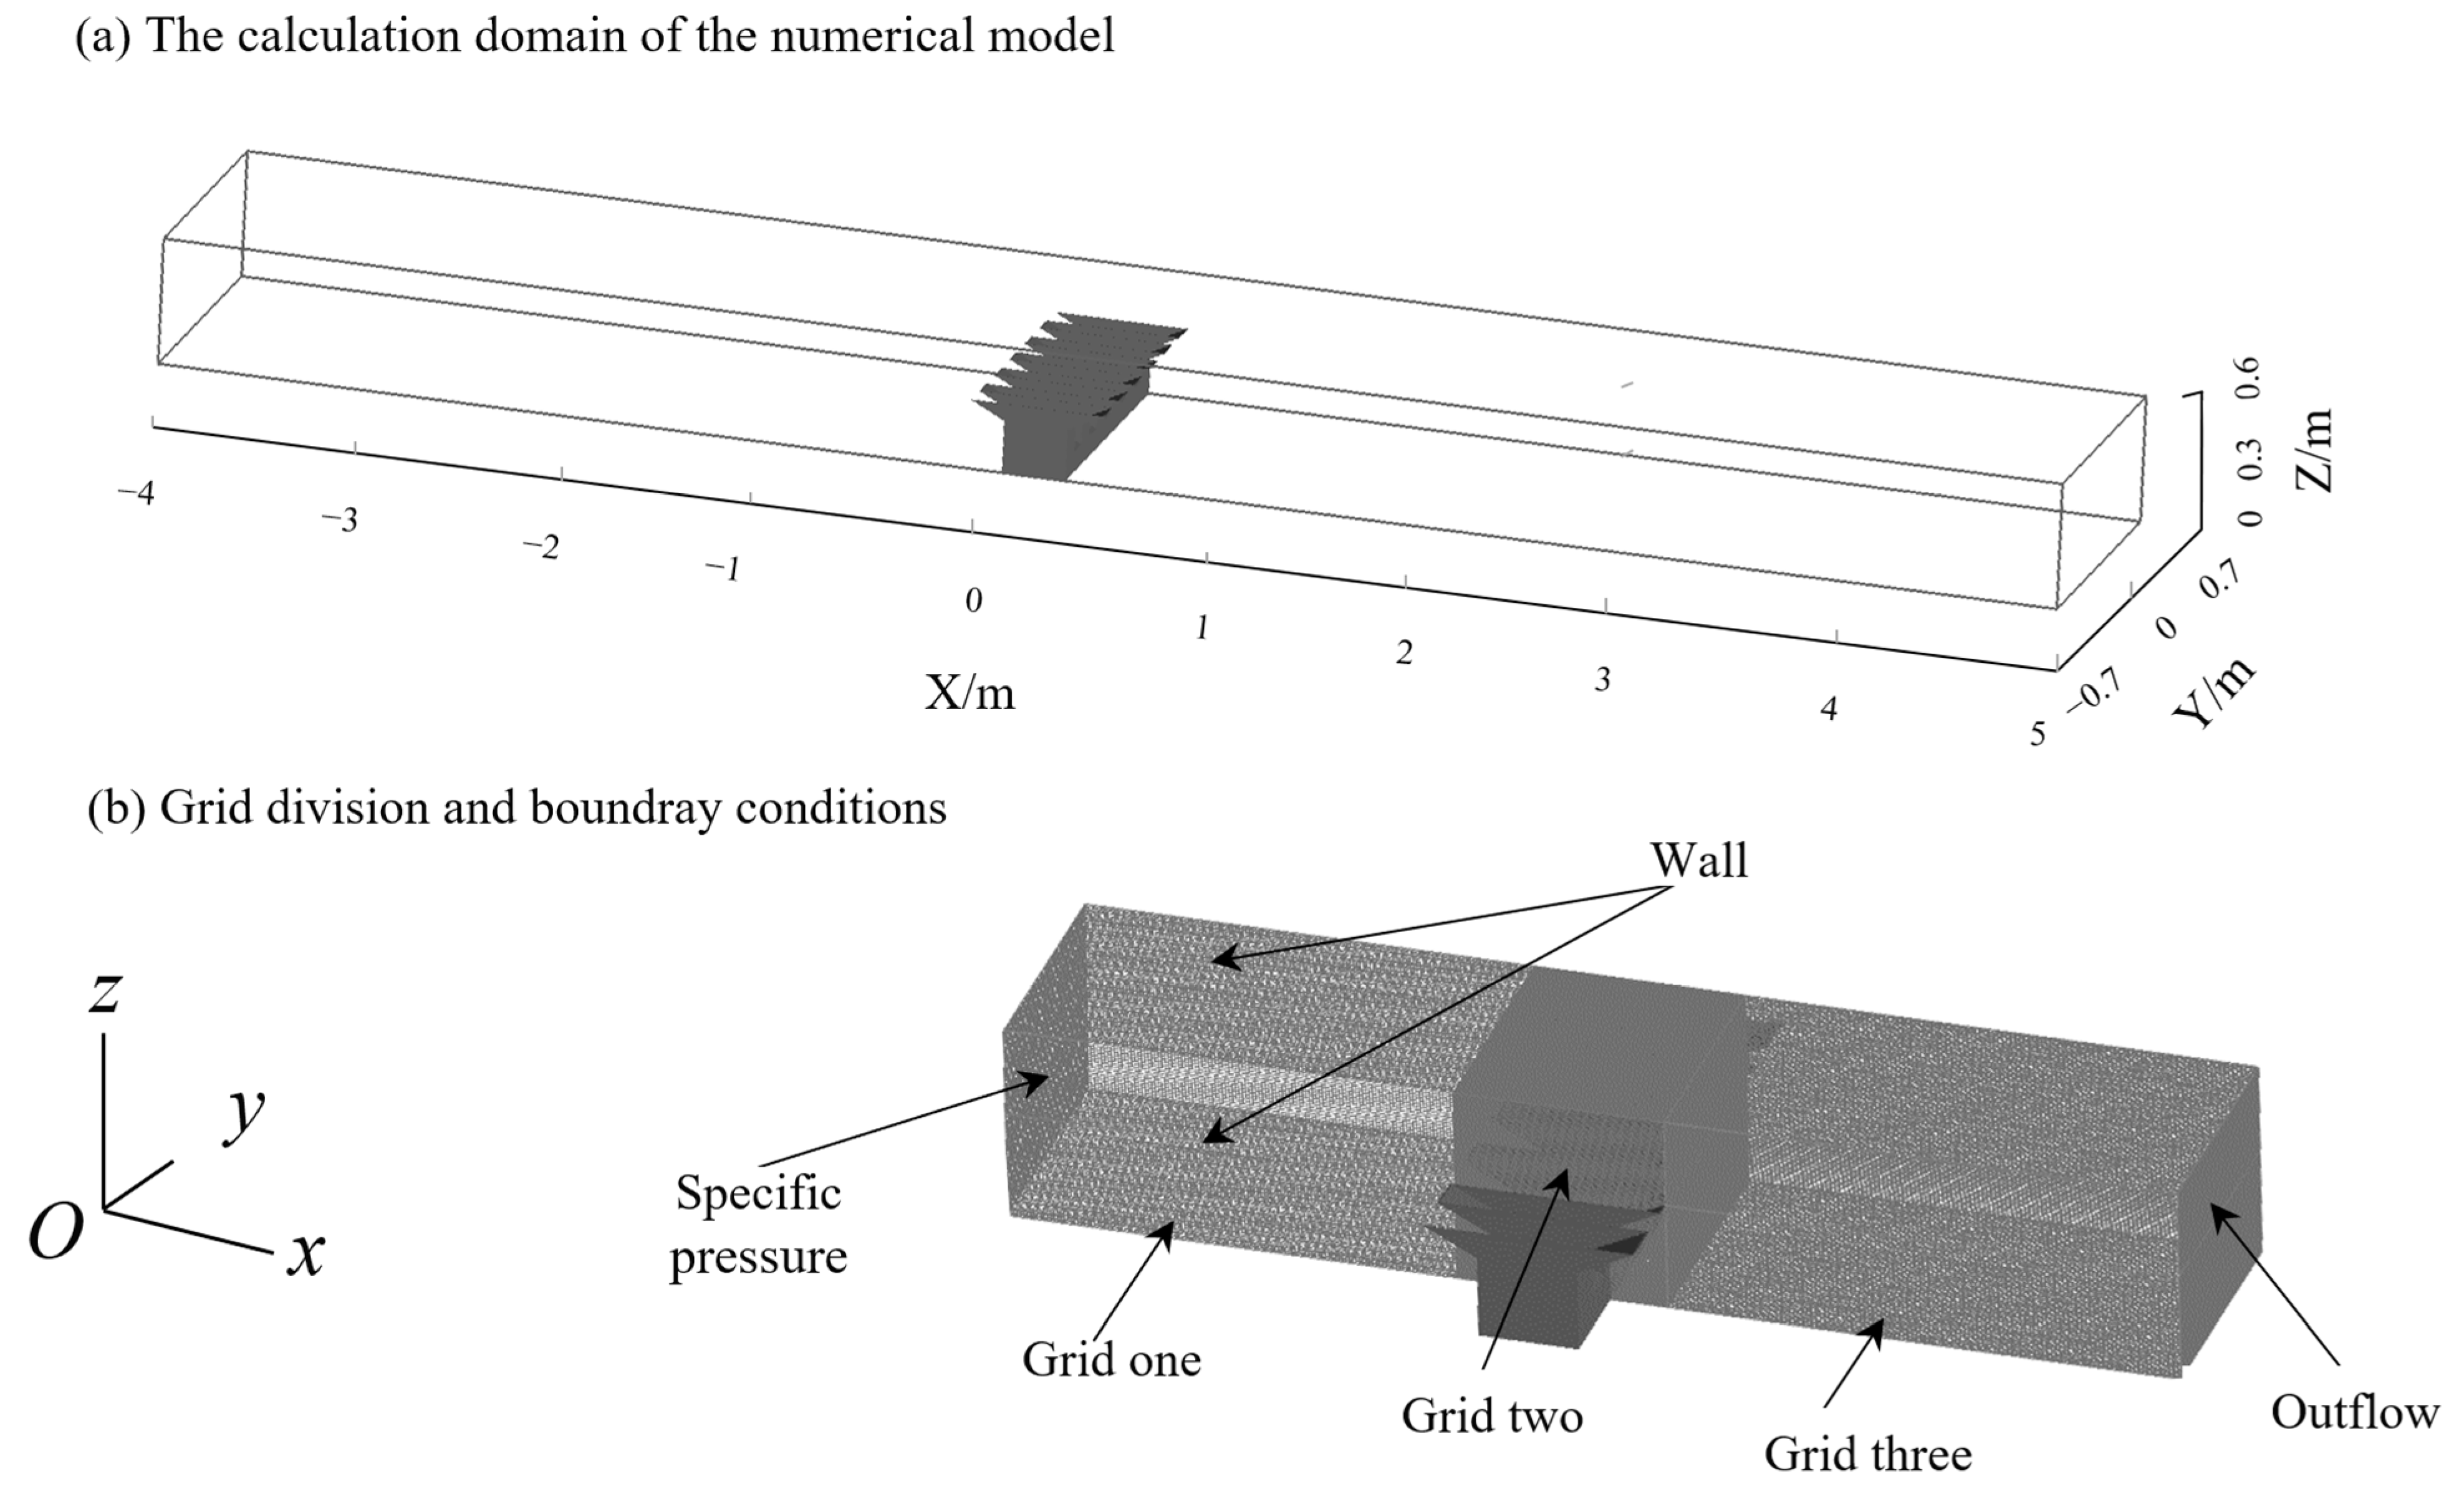
2.3. Numerical Setup

The numerical model was built by SOLIDWORKS 2021 and simulated by computational fluid dynamics software (FLOW-3D 11.2). The simulation domain was divided into three regions: the upstream channel region, the PKW, and the downstream channel region. During modeling, the total width was consistent with the width of the experimental flume. The upstream channel was 4 m long to minimize the influence of water flow fluctuations on the simulation of the PKW, while the downstream channel was 5 m long to ensure unrestricted flow of water. The dimensional parameters of the numerical model for the PKW were identical to the physical model experimented, with a weir width of 1.40 m, a total length of 0.63 m for the upstream and downstream sections, and a total weir height of 0.33 m. Figure 3 illustrates the numerical simulation domain and the model setup.
The flow patterns in both the upstream and downstream channel regions exhibited relative regularity with relatively sparse grid divisions. The critical areas of study are the PKW region and the region behind the weir, where denser grids were generated [31]. Specifically, the number of grids in the PKW region amounted to 1.0725 million.
In the simulation, a hexahedral-structured mesh division was employed to closely resemble the actual model and better ensure boundary conformity, thereby enhancing the accuracy of the simulation results [32]. The boundary conditions of the model were set as shown in Figure 3. The pressure inlet was set at the upstream inlet, along with the control of the water level. The outlet was set as the outflow, both sides of the walls and the bottom were set as walls, and the top was set as an atmospheric pressure boundary.

2.4. Initial Condition and Grid Convergence

In the simulation, the RNG k-ε model was used for turbulent flow modeling [13]. The RNG k-ε equations provide more reliable accuracy in simulating phenomena such as jet diffusion. The VOF method was employed for capturing the free surface [33]. This method constructs a free liquid surface using the fluid volume function α. When α = 0, it indicates that the area is in aqueous phase; when 0 < α < 1, it indicates that this is the interface where water and gas intersect; and when α = 1, it indicates that the area is in the gas phase. The VOF equation is as follows:
α t + u i α x i = 0
The fluid was set as water at a temperature of 20 °C. The initial water head conditions were determined based on the physical model’s experimental results, providing the upstream water level, which was set as the sum of the weir crest elevation and the total head above the weir.
In the numerical simulations, the grid accuracy was assessed using the Grid Convergence Index (GCI) [34]. The grid sizes were set at 9 mm, 7.5 mm, and 4 mm. Table 2 presents the GCI calculation results of Equation (5) under the water head H/P = 0.13.
G C I i + 1 , i = F s σ i + 1 , i f i r β 1
where Fs represents the safety factor of the grid, which is set to 1.25 in the grid scheme; |σ| denotes the absolute error, calculated as |σ| = (fif(i+1))/fi, where f represents the variable; r = Di/D(i+1), where D represents the size of the grid; and β represents the convergence accuracy, which is set to 1 for the first directive and 2 for the second directive.
The calculation results demonstrate that, as the grid size was refined and decreased, the Grid Convergence Index (GCI) of the simulated flow rate gradually diminished. When the grid size was 4 mm, the GCI of the grid was reduced to 1.09%, satisfying the accuracy requirements of the calculation. The simulation error of the discharge under this condition was merely 2.32%, affirming the reliability of the calculation results. Therefore, in all the models calculated in this study, the final grid division of the PKW area was carried out using a size of 4 mm.

3. Results and Discussion

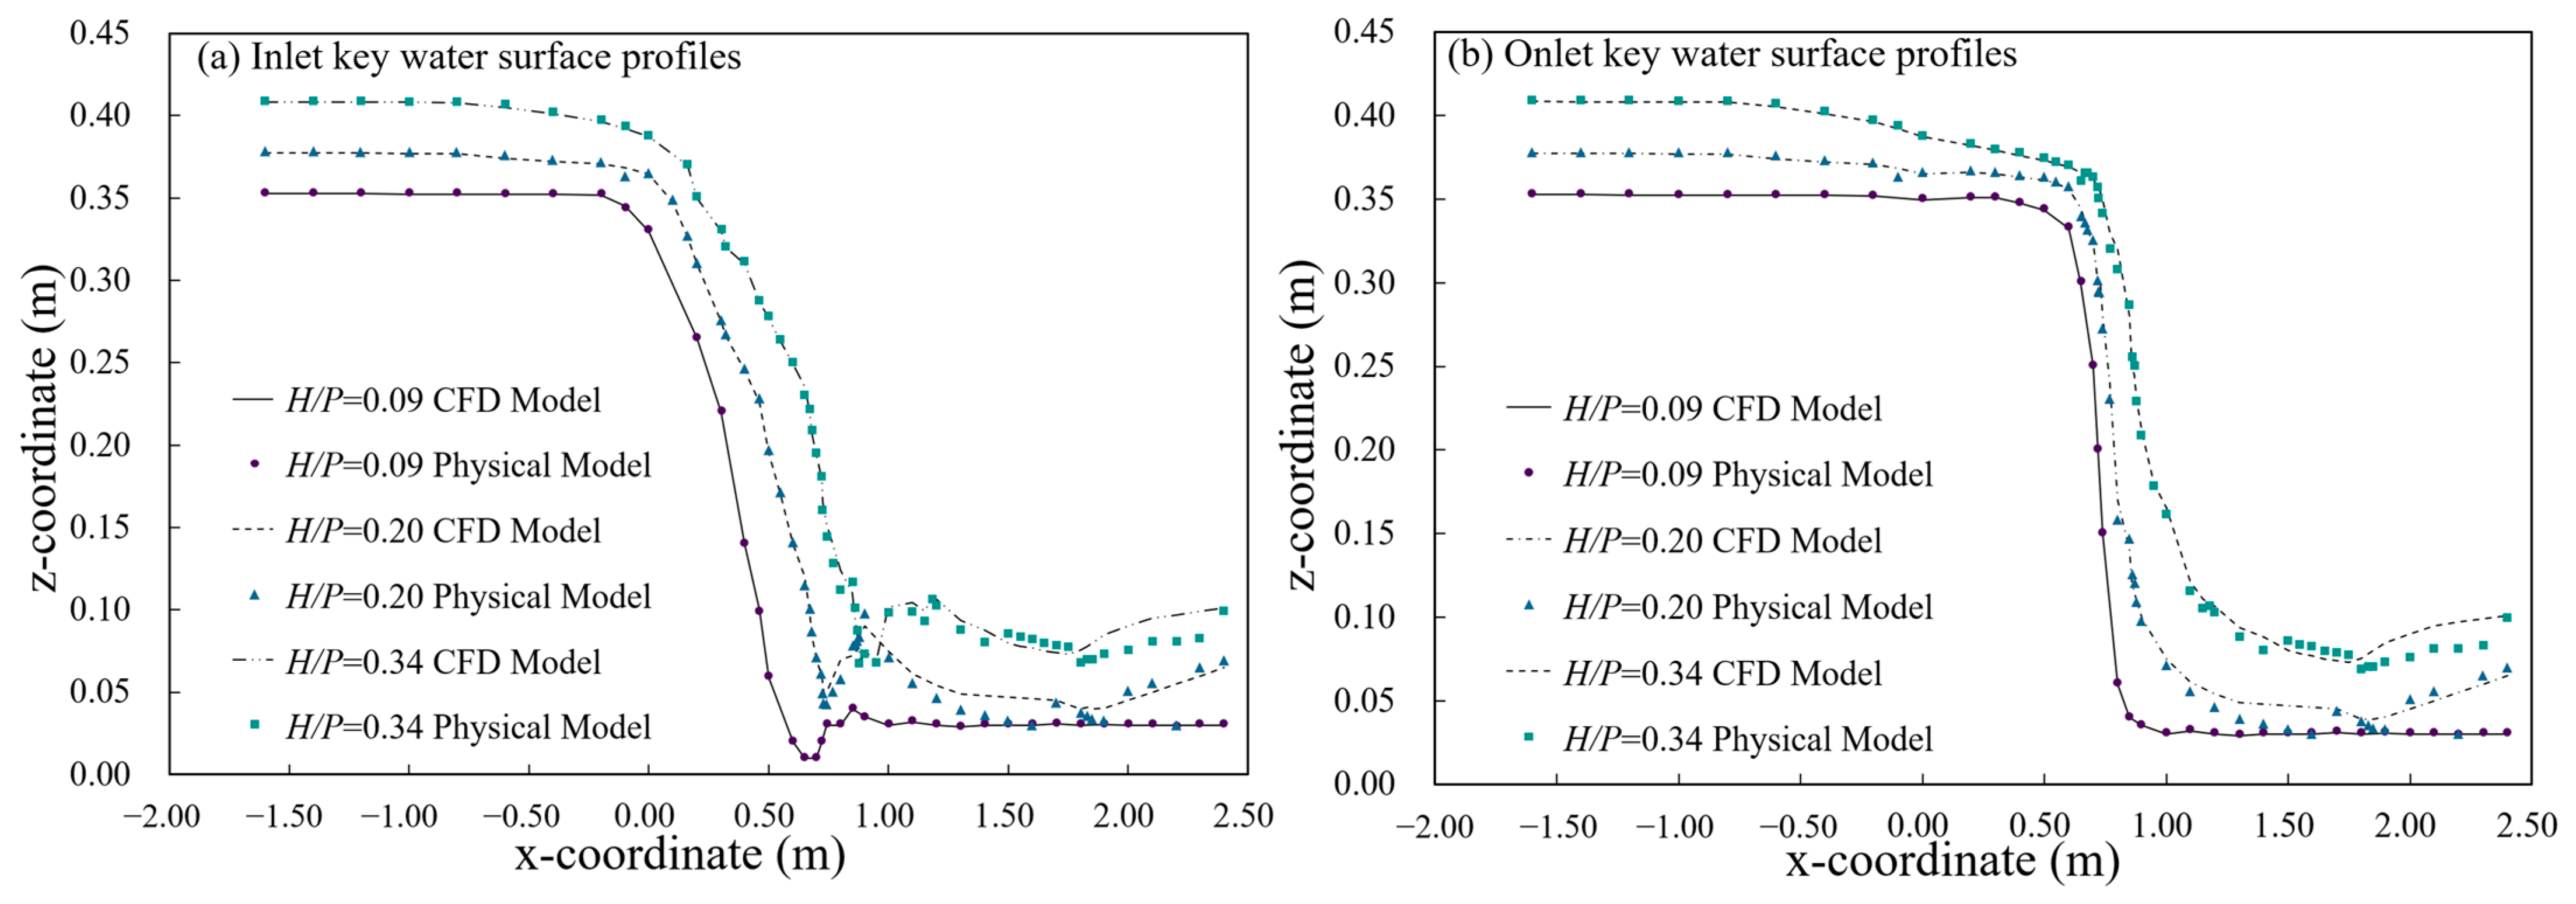
3.1. Verification of Discharge and Free Surface
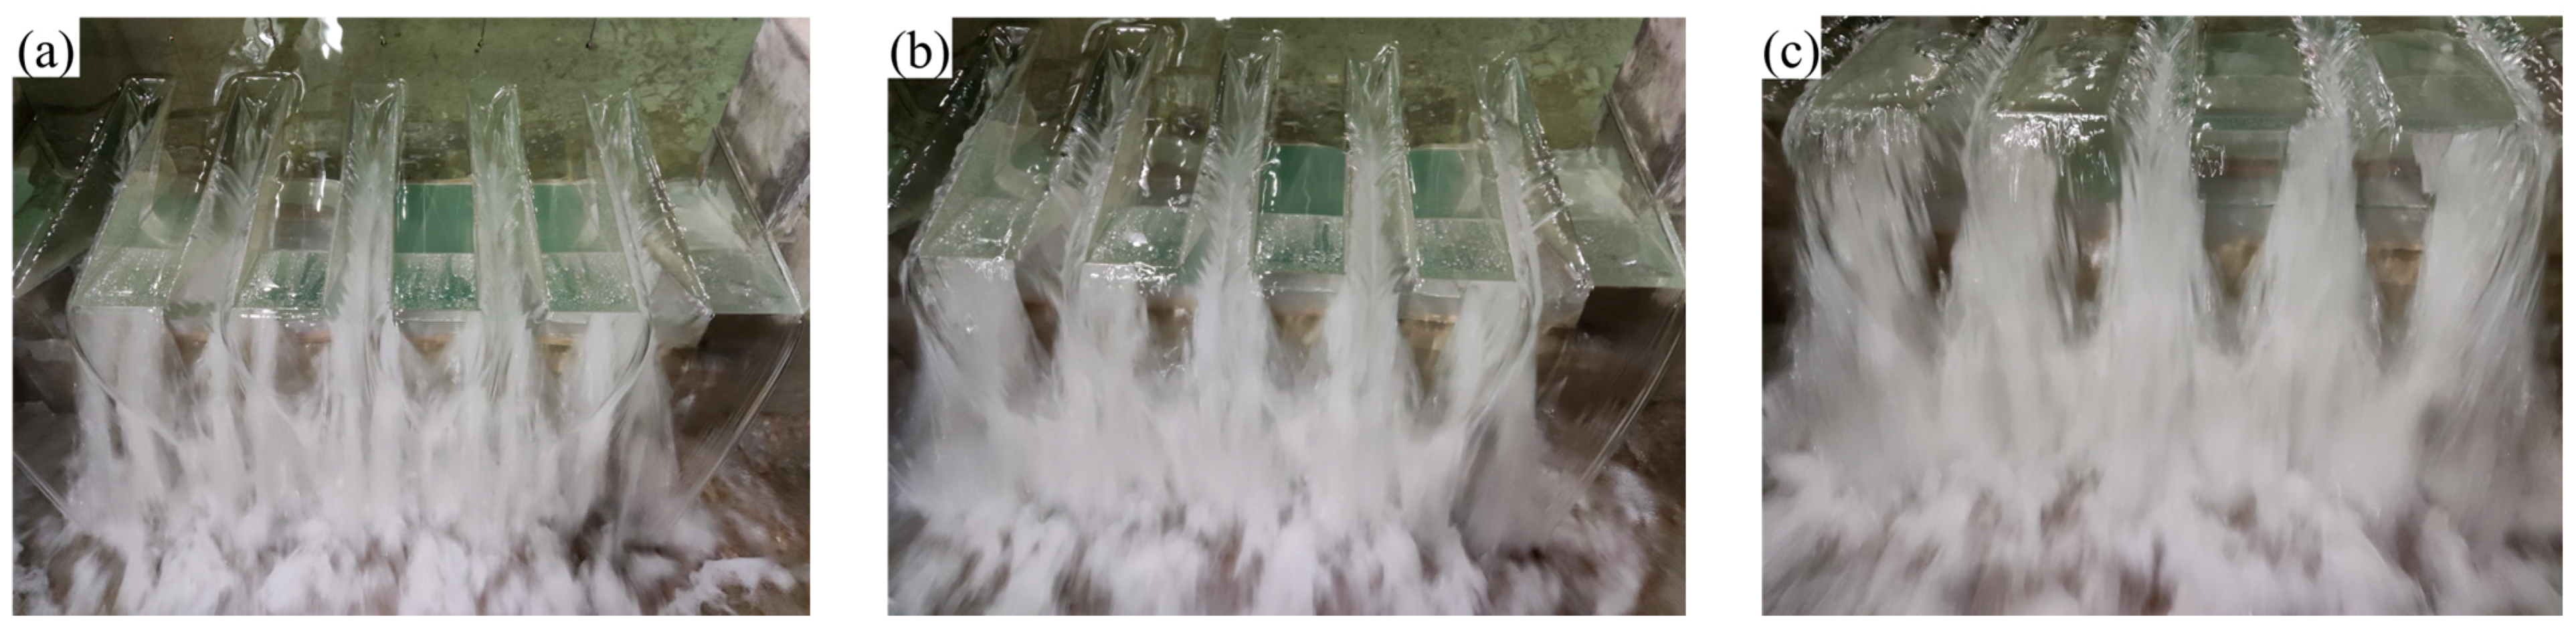
To verify the reliability of the numerical simulation in calculating the discharge of the PKW, the simulated results and experimental discharge under all conditions were compared. Table 3 shows the comparison.
From the comparison (Table 3), it can be seen that, under the same water head, the relative error between the simulated and experimental discharges of the PKW do not exceeding 5%; the numerical simulation in the discharge calculation is reliable.
Furthermore, accuracy verification was carried out by comparing the simulated and measured water surfaces of the inlet and outlet keys under three typical water head conditions, with H/Ps of 0.09, 0.20, and 0.34, respectively.
Figure 4 shows that the water surface profiles, both simulated and measured, are in good agreement under the three conditions. Among them, in the upstream channel, regardless of the low (H/P = 0.09), intermediate (H/P = 0.20), and high (H/P = 0.34) water head conditions, the water surface profiles are basically the same. In the downstream channel, the water surface profiles are in good agreement at the low water head, but there are some errors at the intermediate and the high water head conditions because, as the water head increases, the downstream water flow fluctuations gradually become chaotic, leading to measurement accuracy deviations in the measured results.
Overall, the discharge and water surface profiles between the simulated and measured values were in good agreement, and the reliability of the numerical simulation was high.

3.2. Flow Patterns

The flow pattern can visually show the water flow movement of the PKW; the experimental results of H/P = 0.09, H/P = 0.20, and H/P = 0.34 were used to analyze the flow pattern of the PKW (Figure 5).
The water in the inlet key of the PKW flows downstream along a steep slope and freely overflows at the end, at the same time, the water in the inlet key will also overflow from the side wall to the outlet key. The water in the outlet key mixes with the water from the side wall and flows downstream along a gentle slope. The flow pattern over the PKW is a mixture of forward and lateral flows, which have excellent energy dissipation and aeration capabilities.
There are water tongues through the inlet, the outlet key, and the side wall of the PKW. When the water head is low (H/P = 0.09), the inlet-key water tongue is smooth. When the upstream water head increases (H/P = 0.20), the water tongue becomes thicker, unstable, and gradually trembles from the previous pattern; the angle gradually increases; and the position falls further away. The water tongue from the outlet key diffuses downward and around and collides and mixes with the water tongue from the inlet key, which has a good energy dissipation and aeration ability; with the increase in the upstream water head (H/P = 0.34), the diffusion state of the water tongue becomes more intense and the flow pattern becomes more chaotic.
The water tongue of the side wall is thinner for H/P = 0.09; the adjacent water tongues enter the outlet key without interfering and fall into the front and middle of the outlet key. When the upstream water head increases, the water tongue of the side wall becomes thicker, adjacent water tongues collide with each other, and the collision area becomes larger.

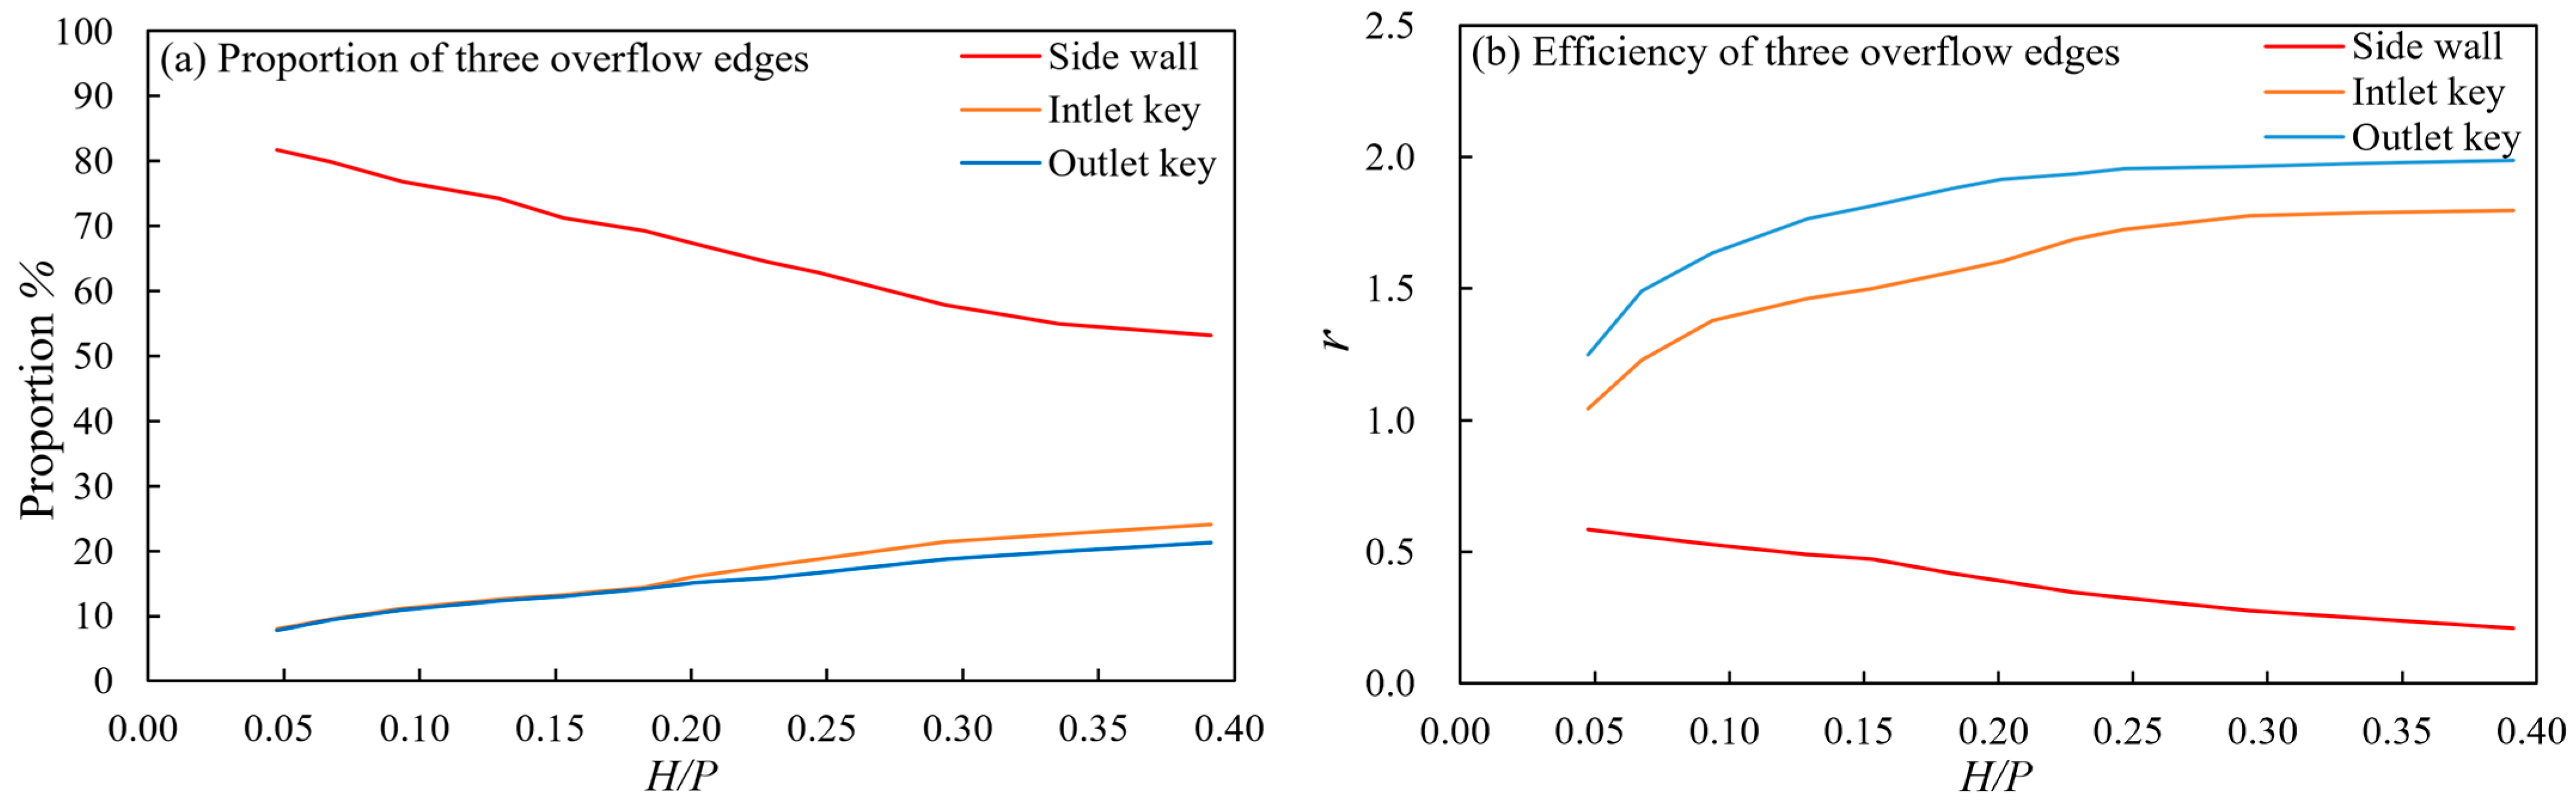
3.3. Discharge of Each Overflow Edges

From the flow pattern of the PKW, it can be observed that the mixing effect of water flow in the outlet key is strong, and the energy dissipation is excellent. The water in the outlet key consists of two parts: the overflow at the outlet key’s front edge and at the side wall. Therefore, clarifying the proportion of the overflow at the front edge of each part contributes to analyzing the overall energy dissipation. The overflow edges of the PKW are divided into three parts: the inlet, the outlet, and the side wall. In the numerical simulation, the area fraction method is used to calculate the proportion and efficiency of the three parts.
As shown in Figure 6, the discharge through the side wall is always the largest. For the water head H/P = 0.05, the proportion of discharge through the side wall reaches 80%, and the proportion of discharge at the inlet and outlet is about 10%. It indicates that, under the low water head, the discharge in the outlet key is mostly provided by the side weir overflow. As the upstream water head increases, the proportion of discharge through the side wall decreases, reaching its lowest proportion of 53% at H/P = 0.39. Conversely, the proportion of the inlet and outlet discharges increases, peaking at H/P = 0.39, in which the inlet constitutes 23% and the outlet constitutes 21% of the total discharge.
The length of the side wall is much longer than that of the edges of the inlet and outlet, and the proportion of the side wall discharge is the largest under different water heads, which also indicates that the discharge efficiency of the side wall determines the total discharge efficiency of the PKW. The discharge efficiency of the side wall is maximum at the low water head, gradually decreases with the increase in the water head. However, the discharge efficiency at the inlet and outlet is opposite to that of the side wall; when the water head increases, the discharge efficiency at the inlet and outlet increases. When the water head increases to a higher level, the discharge efficiency of each part tends to stabilize, which also explains why the discharge efficiency of the PKW tends to stabilize when the water head is higher.

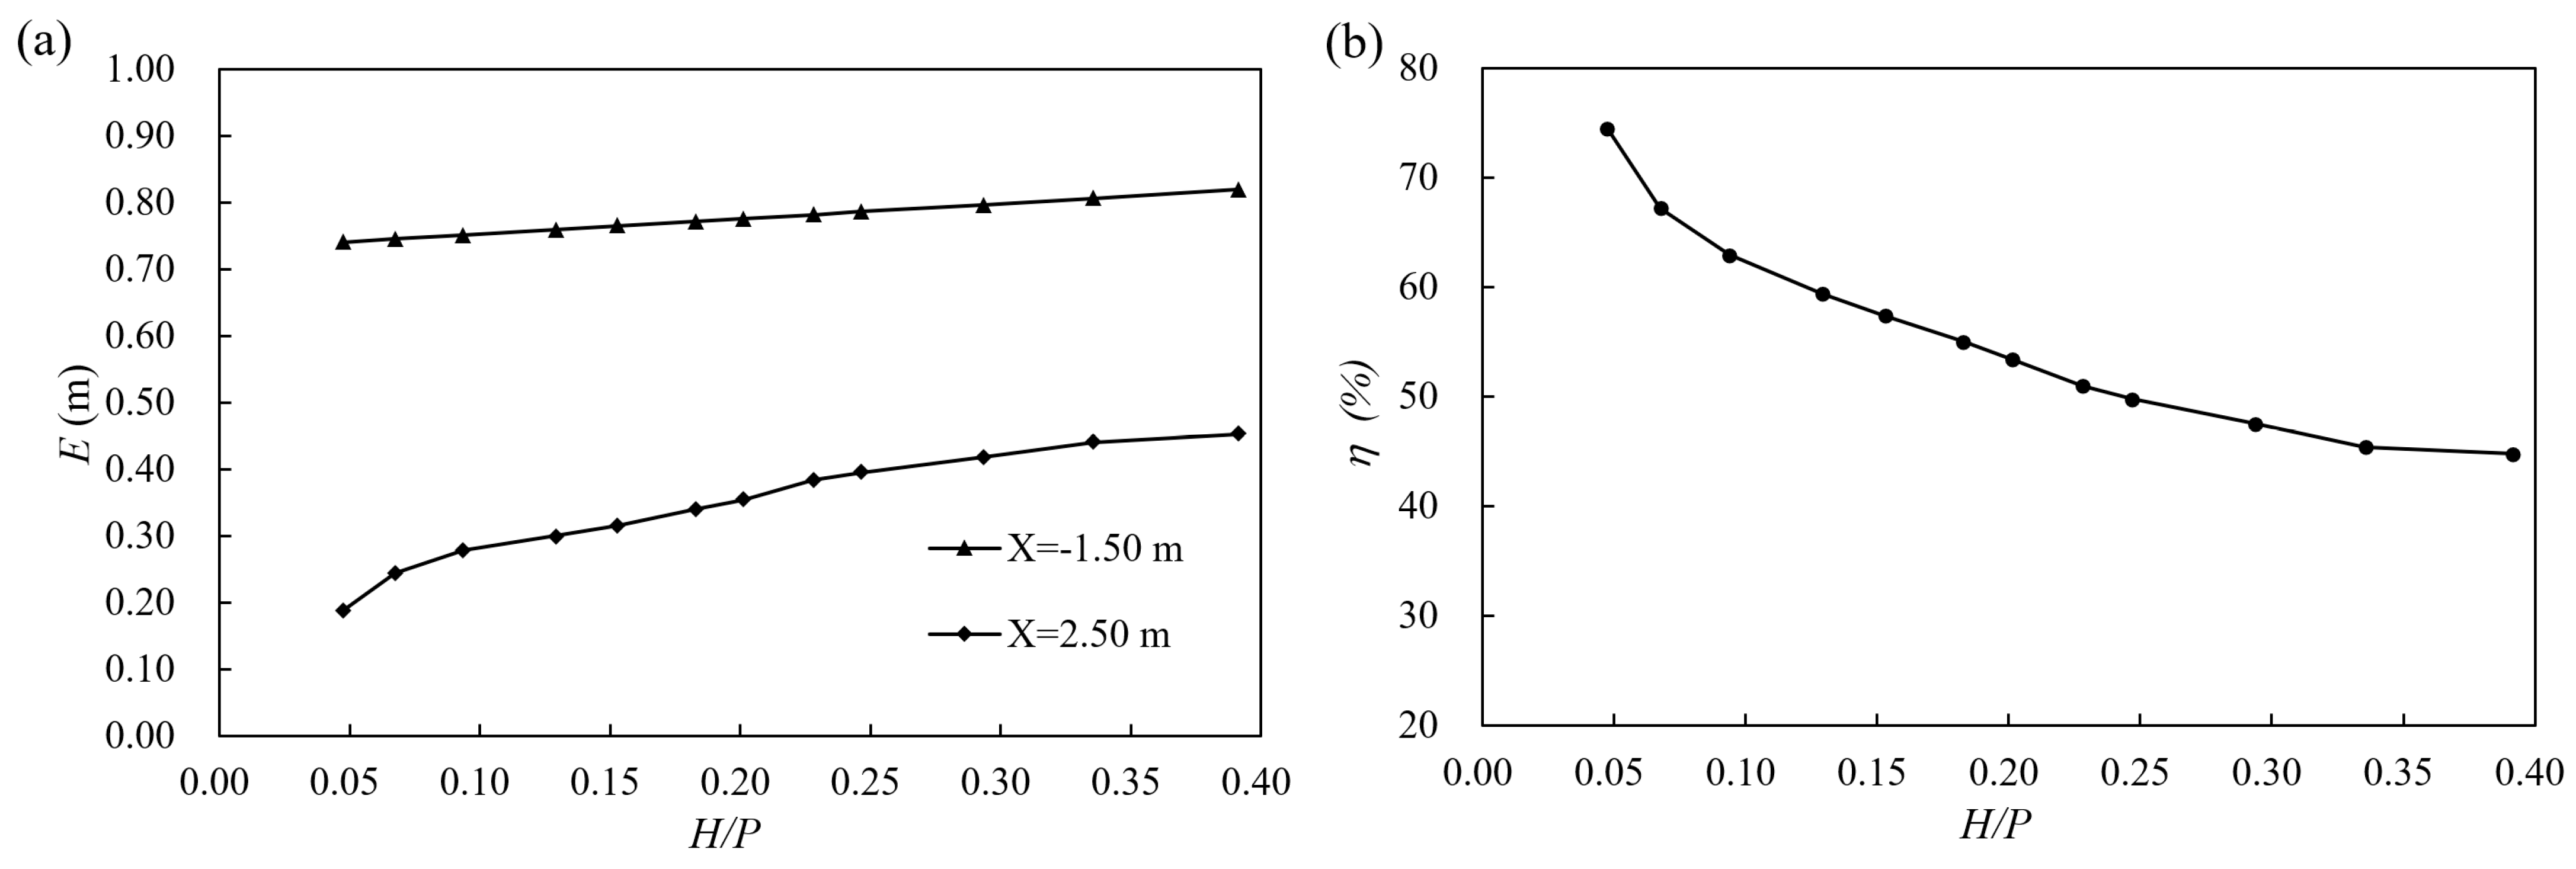
3.4. Energy Dissipation Characteristics

The water head is an important factor of the energy dissipation rate of the PKW. By selecting upstream and downstream characteristic sections and calculating the total energy of the different sections, the law of the energy dissipation rate under different water heads on the weir was analyzed.
As shown in Figure 7, the energy dissipation rate of the PKW is inversely proportional to the water head; as the water head increases, the energy dissipation rate gradually decreases, and the rate of decrease slows down. In this experiment, the maximum energy dissipation rate is 74.58% for H/P = 0.05, and the minimum energy dissipation rate is 44.80% for H/P = 0.39. When the water head is low, the proportions of discharge in the inlet and outlet keys are relatively small, while the proportion of discharge in the side wall is large. The collision and aeration effects of water flow from the side wall to the outlet key are strong, dissipating a large part of the energy. Therefore, when the water head is low, the energy dissipation rate of the PKW is higher.
When the water head increases, the discharges of the inlet and outlet keys increase, the friction effect of the wall on the water flow becomes weaker, the proportion of discharge of the side wall decreases, and the collision and the aeration effects become weaker; thus, the proportion of energy consumed decreases and therefore, the energy dissipation rate of the PKW decreases. However, the energy dissipation rate of the PKW remains above 40%; it still has a good energy dissipation effect.
To analyze the energy changes along the PKW, water flow sections X = −1.50 m, X = 0.00 m, X = 0.46 m, X = 0.63 m, and X = 2.50 m were selected. The water depths and flow velocities of the sections were measured, and the energy E of the sections were calculated. Figure 8 shows the energy variation curves along the route.
The regular energy along the PKW is basically consistent under all conditions. The potential energy of the section at X = −1.50 m is relatively high, the kinetic energy is relatively small, and the overall energy is relatively high. X = 0 m is the starting point of the inlet keys; with a slight decrease in the water level and a decrease in potential energy, the flow velocity increases, and the kinetic energy increases. The total energy decreases relative to X = −1.50 m. The energy dissipation rate is 1.50% for H/P = 0.07 and 2.38% for H/P = 0.39. X = 0.46 m is the end of the outlet key; due to the downward slope, the water level decreases and the flow velocity increases. Therefore, the potential energy decreases and the kinetic energy increases at the end of the outlet key, but the total energy is relatively small. The energy dissipation rate is 22.58% for H/P = 0.07 and 12.89% for H/P = 0.39. X = 0.63 m is the end of the inlet key: the water level slowly decreases in the inlet key, the potential energy of the section slowly decreases, and the flow velocity slowly increases. The overall energy is relatively high. The energy dissipation rate is 0.09% for H/P = 0.07 and 2.69% for H/P = 0.39. X = 2.50 m is the downstream channel: the water flows at the end of the PKW to the downstream water cushion, and the water tongue mixes and rubs in the air, consuming a large amount of energy. When the water tongue enters the downstream water, the water carries a large amount of kinetic energy, while the potential energy is smaller. The energy dissipation rate is 67.23% for H/P = 0.07 and 44.80% for H/P = 0.39.

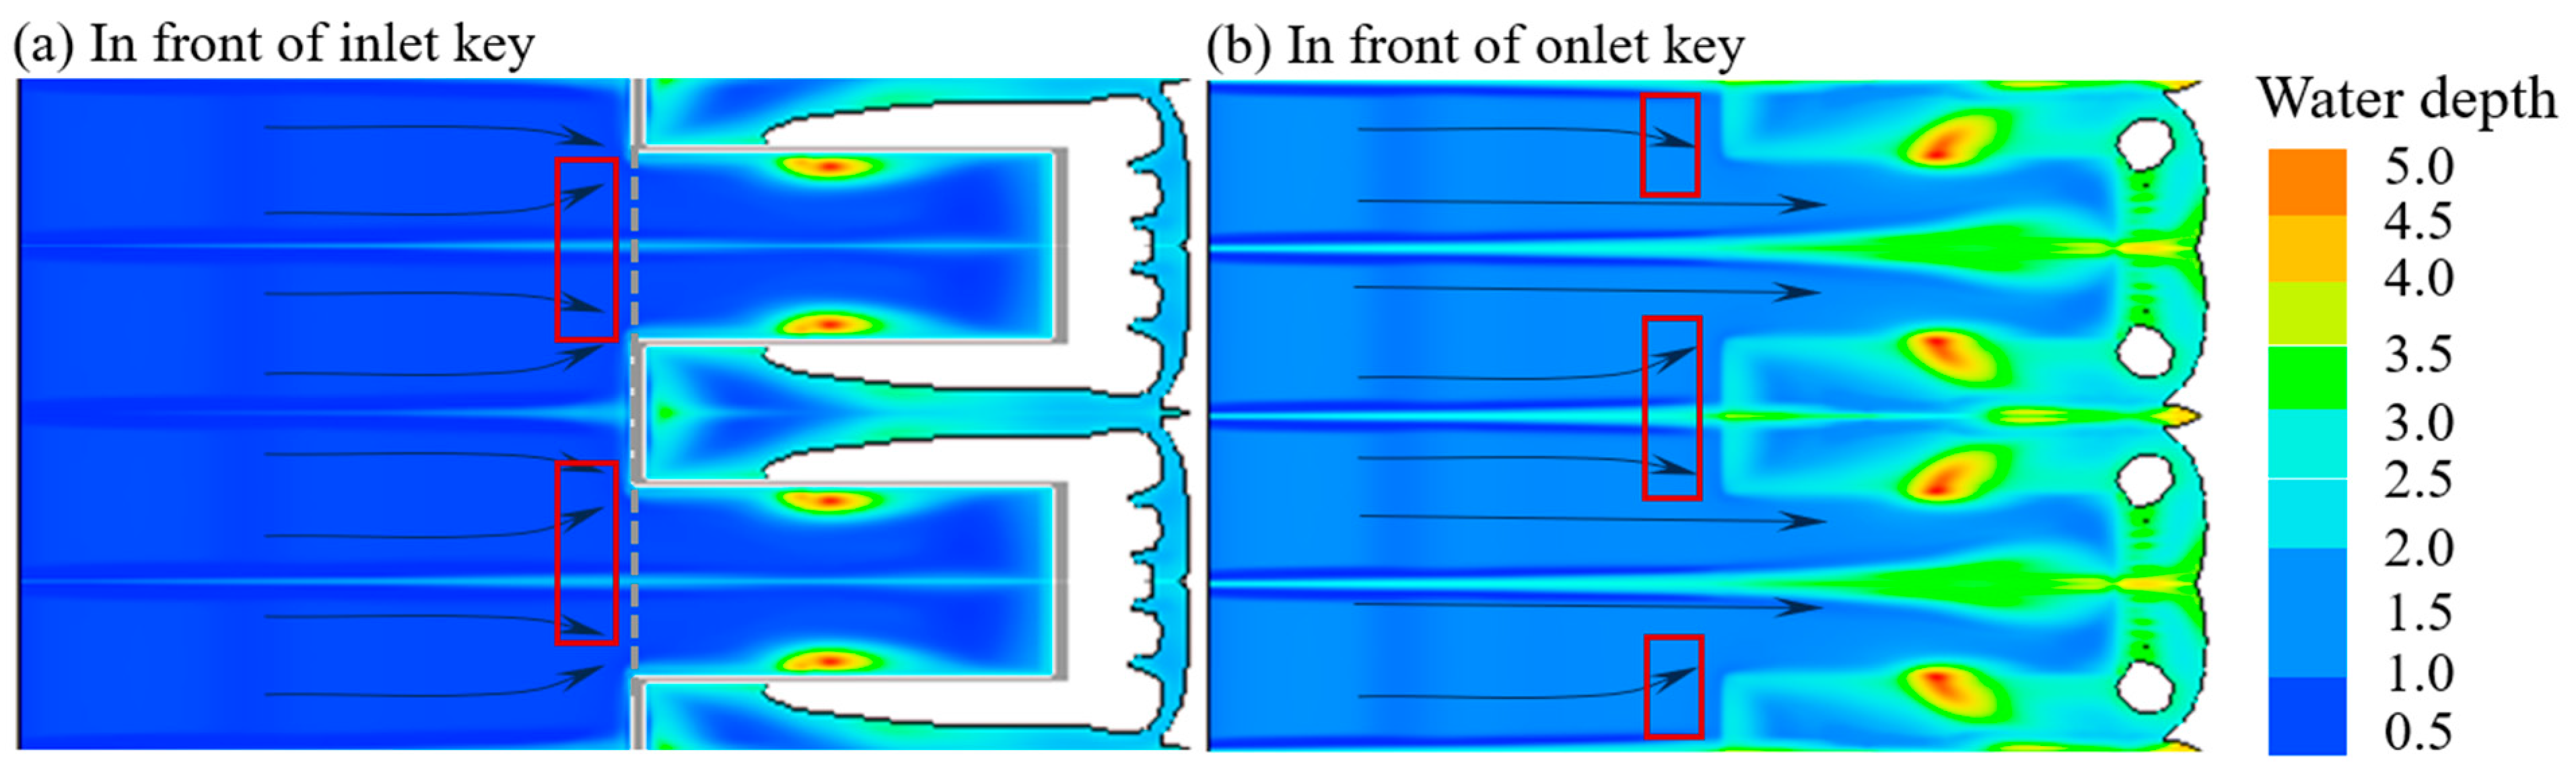
3.5. Energy Dissipation Mechanism

According to the analysis of the flow pattern and the energy changes of the PKW, the energy dissipation of the PKW can be divided into three stages. The first stage is the obstruction effect of the inlet of the weir: when the upstream water level does not reach the base height Pd, the weir body acts as a block, hindering the flow of water. When the upstream water level rises to the dam height Pd, the water flows into the inlet key, then the water level continues to rise to the total height P + Pd and the water flows into the outlet key. During the upstream water level rise, the front ends of the inlet and outlet keys continuously hinder the water flow (see Figure 9). The velocity vector of the upstream water flow in front of the PKW moves downward along the X coordinate. When passing through the PKW, the velocity vector shifts; based on the analysis of the energy changes in the section [35], the potential energy of the section decreases and the total energy decreases from the upstream section X = −1.50 m to the outlet key X = 0 m under the same water head.
The second stage of energy dissipation by the PKW mainly involves the collision and mixing of water flow inside the outlet key; the water passing through the inlet key; and a part of the water overflowing through the side wall to the outlet key, colliding and mixing with the water flow inside the outlet key.
The energy dissipation inside the outlet key is jointly influenced by the mixing of the adjacent side-wall water tongues and the collision between the drop in the side-wall water tongues and the water flow inside the outlet key. As shown in Figure 10a, when the water head is relatively low, the water tongue of the side wall is relatively thin and the collision range of the adjacent water tongues is small or even nonexistent. At this time, the collision effect of the adjacent water tongues is weak. However, for the drop in the side-wall water tongues, due to the large proportion of side wall discharge under the low water head, most of the side wall water tongues fall to the outlet key. The mixing effect of the water flow is strong; thus, the energy dissipation effect is strong. When the water head increases, as shown in Figure 10b, the position where the adjacent water tongues collide rises. The water tongues become thicker, and the range of collision becomes larger. This enhances the collision of the adjacent water tongues, consuming part of the energy released by the side wall water tongues. Simultaneously, as the water head increases, the water level in the outlet key rises. However, the proportion of discharge through the side wall decreases relatively. Consequently, the mixing effect between the drop in side-wall water tongues and the water flow inside the outlet key weakens, resulting in weaker energy dissipation. Overall, in the outlet key, energy dissipation occurs primarily through the side-wall water tongues falling under the low water head. Under the high water head, the energy dissipation involves both the collision of the adjacent side-wall water tongues and the dropping in the side-wall water tongues.
The third stage of energy dissipation in the PKW is the falling process of the water tongue. As shown in Figure 11, the turbulent kinetic energy distribution of the PKW for H/P = 0.23 shows that the shear of the water flow at the top of the weir (Z/P = 1.96) mainly occurs in the outlet key, especially at the front end of the outlet key and the intersection of the side-wall water tongues; the turbulent kinetic energy in the outlet key is relatively high. The turbulent kinetic energy in the inlet key is relatively small and areas with higher turbulent kinetic energy appear near the side wall. When the water flows downward, the ends of the inlet and outlet key flows are ejected and the area with higher turbulent energy also moves toward the downstream position of the PKW; the maximum value of turbulent energy occurs at the intersection of the inlet and outlet keys’ ejected water tongues. When the water tongues connect with the downstream water cushion, a vortex is generated at the collision point, raising the water surface; at this time, the turbulent kinetic energy is greater, and the flow pattern is more chaotic. Throughout the process, the energy loss at the downstream intersection is the greatest, and the turbulence dissipation is the greatest.
The water flow through the PKW at the end is ejected from the ends of the inlet and outlet keys; the water tongue rubs [36], mixes, and diffuses energy in the air and then dissipates the energy in the downstream water cushion. Due to the presence of the inlet and outlet keys, the positions of the water tongues in the two keys are different; water tongues at the ends of the inlet and outlet keys will cross each other during the falling process, continuing to dissipate the energy.

4. Conclusions

This study employed a combination of physical model experiments and numerical simulations, taking the basic model of the PKW to explore its sectional energy changes and energy dissipation. Specifically, we observed the flow patterns and measured the overall discharge volume through physical model experiments, combining numerical simulations to simulate the fine-flow field structure during discharge and calculate the discharge capacity of each overflow leading edge. The main conclusions obtained were as follows:
(1)
PKW is very efficient in dissipating energy, with an energy dissipation rate of 70% at the low water heads. As the water head increases, the energy dissipation effect weakens, with an energy dissipation rate of 40% at the high water heads.
(2)
The energy dissipation rates along the upstream and downstream of the PKW are relatively high, and the variation law of energy along the way was consistent under the different water heads. As the water head increases, the energy dissipation rate along the way decreases.
(3)
The energy dissipation of the PKW can be divided into three stages: the hindering of the upstream flow and decreasing the trend of increasing the flow velocity in front of the weir; the collision and mixing of water flow inside the outlet key reducing the energy; the water tongues diffusing, becoming aerated, and falling into the downstream, consuming most of the remaining energy.

Author Contributions

Conceptualization, Z.L., C.H. and Z.F.; data curation, Z.L., F.Y. and J.W.; formal analysis, Z.L.; funding acquisition, C.H.; investigation, Z.L. and C.H.; methodology, Z.L., C.H. and Z.F.; project administration, C.H.; software, Z.L., F.Y. and K.Y.; supervision, C.H.; validation, Z.L. and F.Y.; visualization, Z.L., K.Y. and K.H.; writing—original draft, Z.L. and C.H.; writing—review and editing, Z.L. and Z.F. All authors have read and agreed to the published version of the manuscript.

Funding

This research was funded by the National Key Research and Development Program of China (2022YFC3202603); the Guangxi Science and Technology Major Program (AA23062053); the Jiangsu Water Conservancy Science and Technology project (2022014); and the Central-Level Public Welfare Research Institutes Basic Research Business Expenses Special Funds (Y124002).

Data Availability Statement

The data presented in this study are available on request from the corresponding author.

Conflicts of Interest

The authors declare no conflict of interest.

References

  1. Vallarino-Castillo, R.; Negro-Valdecantos, V.; del Campo, J.M. A Systematic Review of Oceanic-Atmospheric Variations and Coastal Erosion in Continental Latin America: Historical Trends, Future Projections, and Management Challenges. J. Mar. Sci. Eng. 2024, 12, 1077. [Google Scholar] [CrossRef]
  2. Nageswaran, P.; Oetjen, J.; Harish, S.; Sriram, V.; Sundar, V.; Schüttrumpf, H. Buffer Blocks as Wave Energy Dissipators: Flow Depth Reduction. J. Mar. Sci. Eng. 2024, 12, 1145. [Google Scholar] [CrossRef]
  3. Haghiabi, A.H.; Nou, M.R.G.; Parsaie, A. The energy dissipation of flow over the labyrinth weirs. Alex. Eng. J. 2022, 61, 3729–3733. [Google Scholar] [CrossRef]
  4. Singh, D.; Kumar, M. Effect of the inlet-to-outlet key width ratio of Piano Key Weir on its hydraulic behaviour. Flow Meas. Instrum. 2023, 91, 102342. [Google Scholar] [CrossRef]
  5. Idrees, A.K.; Al-Ameri, R. Investigation of flow characteristics and energy dissipation over new shape of the trapezoidal labyrinth weirs. Flow Meas. Instrum. 2023, 89, 102276. [Google Scholar] [CrossRef]
  6. Machiels, O.; Erpicum, S.; Dewals, B.J.; Archambeau, P.; Pirotton, M. Experimental observation of flow characteristics over a Piano Key Weir. J. Hydraul. Res. 2011, 49, 359–366. [Google Scholar] [CrossRef]
  7. Anderson, R.M.; Tullis, B.P. Comparison of Piano Key and Rectangular Labyrinth Weir Hydraulics. J. Hydraul. Eng. 2012, 138, 358–361. [Google Scholar] [CrossRef]
  8. Kumar, B.; Ahmad, Z. Scour Downstream of a Piano Key Weir with and without a Solid Apron. J. Irrig. Drain. Eng. 2022, 148, 04021066. [Google Scholar] [CrossRef]
  9. Jüstrich, S.; Pfister, M.; Schleiss, A.J. Mobile riverbed scour downstream of a piano key weir. J. Hydraul. Eng. 2016, 142, 40160431–401604312. [Google Scholar] [CrossRef]
  10. Shen, X.; Oertel, M. Influence of Piano Key Weir Crest Shapes on Flow Characteristics, Scale Effects, and Energy Dissipation for In-Channel Application. J. Hydraul. Eng. 2023, 149, 04023010. [Google Scholar] [CrossRef]
  11. Eslinger, K.R.; Crookston, B.M. Energy Dissipation of Type a Piano Key Weirs. Water 2020, 12, 1253. [Google Scholar] [CrossRef]
  12. Rajaei, A.; Esmaeili Varaki, M.; Shafei Sabet, B. Experimental investigation on local scour at the downstream of grade control structures with labyrinth planform. ISH J. Hydraul. Eng. 2018, 26, 457–467. [Google Scholar] [CrossRef]
  13. Li, S.; Li, G.; Jiang, D.; Ning, J. Influence of auxiliary geometric parameters on discharge capacity of piano key weirs. Flow Meas. Instrum. 2020, 72, 101719. [Google Scholar] [CrossRef]
  14. Singh, D.; Kumar, M. Study of the Energy Dissipation over the Type-A Piano Key Weir. KSCE J. Civ. Eng. 2023, 27, 1568–1584. [Google Scholar] [CrossRef]
  15. Singh, D.; Kumar, M. Energy dissipation of flow over the type-B Piano Key Weir. Flow Meas. Instrum. 2022, 83, 102109. [Google Scholar] [CrossRef]
  16. Hu, H.; Qian, Z.; Yang, W.; Hou, D.; Du, L. Numerical study of characteristics and discharge capacity of piano key weirs. Flow Meas. Instrum. 2018, 62, 27–32. [Google Scholar] [CrossRef]
  17. Crookston, B.M.; Tullis, B.P. Hydraulic Design and Analysis of Labyrinth Weirs. II: Nappe Aeration, Instability, and Vibration. J. Irrig. Drain. Eng. 2013, 139, 371–377. [Google Scholar] [CrossRef]
  18. Li, S.; Li, G.; Jiang, D. Physical and Numerical Modeling of the Hydraulic Characteristics of Type-A Piano Key Weirs. J. Hydraul. Eng. 2020, 146, 06020004. [Google Scholar] [CrossRef]
  19. Yazdi, A.M.; Hoseini, S.; Nazari, S.; Fazeli, M. Numerical and experimental analysis of scour downstream of piano key weirs. Sādhanā 2022, 47, 189. [Google Scholar] [CrossRef]
  20. Vermeulen, J.; Laugier, F.; Faramond, L.; Gille, C.; Erpicum, S.; Laugier, F.; Boillat, J.-L.; Pirotton, M.; Reverchon, B.; Schleiss, A. Lessons learnt from design and construction of EDF first Piano Key Weirs. In Labyrinth and Piano Key Weirs; CRC Press: Boca Raton, FL, USA, 2011; pp. 215–224. [Google Scholar]
  21. Khanh, M.; Hien, T.; Hai, N.; Erpicum, S.; Laugier, F.; Boillat, J.-L.; Pirotton, M.; Reverchon, B.; Schleiss, A. Main results of the P.K weir model tests in Vietnam (2004 to 2010). In Labyrinth and Piano Key Weirs; CRC Press: Boca Raton, FL, USA, 2011; pp. 191–198. [Google Scholar]
  22. Ribeiro, M.L.; Pfister, M.; Schleiss, A.J.; Boillat, J.-L. Hydraulic design of a-type piano key weirs. J. Hydraul. Res. 2012, 50, 400–408. [Google Scholar] [CrossRef]
  23. Farhadi, H.; Sabzevari, T.; Moghadam, M.K.; Noroozpour, S. The Effect of the Central Angle and Height of Arced Piano Key Weir on the Discharge Coefficient. Iran. J. Sci. Technol. Trans. Civ. Eng. 2022, 47, 599–607. [Google Scholar] [CrossRef]
  24. Abhash, A.; Pandey, K.K. A review of Piano Key Weir as a superior alternative for dam rehabilitation. ISH J. Hydraul. Eng. 2020, 28 (Suppl. S1), 541–551. [Google Scholar] [CrossRef]
  25. Ouamane, A.; Erpicum, S.; Laugier, F.; Boillat, J.-L.; Pirotton, M.; Reverchon, B.; Schleiss, A. Nine years of study of the Piano KeyWeir in the university laboratory of Biskra “lessons and reflections”. In Labyrinth and Piano Key Weirs; CRC Press: Boca Raton, FL, USA, 2011; pp. 51–58. [Google Scholar]
  26. Shen, X.; Oertel, M. Comparative Study of Nonsymmetrical Trapezoidal and Rectangular Piano Key Weirs with Varying Key Width Ratios. J. Hydraul. Eng. 2021, 147, 04021045. [Google Scholar] [CrossRef]
  27. Leite Ribeiro, M.; Bieri, M.; Boillat, J.-L.; Schleiss, A.J.; Singhal, G.; Sharma, N. Discharge Capacity of Piano Key Weirs. J. Hydraul. Eng. 2012, 138, 199–203. [Google Scholar] [CrossRef]
  28. Lempérière, F. New labyrinth weirs triple the spillways discharge. Water Energy Int. 2011, 68, 77–78. [Google Scholar]
  29. Trucano, T.; Post, D. Verification and Validation in Computational Science and Engineering. Comput. Sci. Eng. 2004, 6, 8–9. [Google Scholar] [CrossRef]
  30. Deepak, S.; Munendra, K. Gene expression programming for computing energy dissipation over type-B piano key weir. Renew. Energy Focus 2022, 41, 230–235. [Google Scholar]
  31. Koken, M.; Aydin, I.; Ademoglu, S. An iterative hydraulic design methodology based on numerical modeling for piano key weirs. J. Hydro-Environ. Res. 2022, 40, 131–141. [Google Scholar] [CrossRef]
  32. Karimi Chahartaghi, M.; Nazari, S.; Mahmoodian Shooshtari, M. Experimental and numerical simulation of arced trapezoidal piano key weirs. Flow Meas. Instrum. 2019, 68, 101576. [Google Scholar] [CrossRef]
  33. Mohammad Karimi Chahartaghi, P.D.; Nazari, S.; Shooshtari, M.M. Experimental Study on Local Scour Downstream of Arced Piano-Key Weirs. J. Irrig. Drain. Eng. 2023, 149, 04023027. [Google Scholar] [CrossRef]
  34. Akbar, S.; Shadi, A.M. Hydromechanics of the Asymmetric Trapezoidal Piano Key and Labyrinth Weirs. J. Irrig. Drain. Eng. 2023, 149, 04023023. [Google Scholar]
  35. Seyedjavad, M.; Naeeni, S.O.; Saneie, M. Flow velocity pattern around trapezoidal piano key side weirs. Flow Meas. Instrum. 2020, 76, 101847. [Google Scholar] [CrossRef]
  36. Daneshfaraz, R.; Sadeghi, H.; Ghaderi, A.; Abraham, J.P. Characteristics of hydraulic jump and energy dissipation in the downstream of stepped spillways with rough steps. Flow Meas. Instrum. 2024, 96, 102506. [Google Scholar] [CrossRef]
Figure 1. Schematics of the PKW and the laboratory equipment.
Water 16 02620 g001
Figure 2. The main geometric parameters of the Type A PKW.
Water 16 02620 g002
Figure 3. Overview of the simulation region and settings.
Water 16 02620 g003
Figure 4. Comparison between the simulated and measured values of the water surface profiles under three water head conditions.
Water 16 02620 g004
Figure 5. Experimental flow pattern of the PKW for (a) H/P = 0.09, (b) H/P = 0.20, and (c) H/P = 0.34.
Water 16 02620 g005
Figure 6. (a) Discharge proportion and (b) discharge efficiency of the three overflow edges.
Water 16 02620 g006
Figure 7. Relationship between (a) the energy and (b) the energy dissipation rate with the water head.
Water 16 02620 g007
Figure 8. Energy variation curves along the route.
Water 16 02620 g008
Figure 9. The vector in front of (a) the inlet key and (b) the outlet key of the PKW.
Water 16 02620 g009
Figure 10. Water overflows through the side wall for (a) the low water head and (b) the high water head.
Water 16 02620 g010
Figure 11. The turbulence dissipation (a) at the top of the PKW and (b) at the bottom of the PKW.
Water 16 02620 g011
Table 1. Geometric sizes of the PKW (m).
ParametersSize
L7.000
W1.400
Wi0.135
Wo0.108
B0.640
Bo0.170
Bi0.170
Bb0.300
P0.230
Pd0.100
Table 2. The GCI calculation results for the three grid sizes under the water head H/P = 0.13.
Grid Size (mm)R = Di/Di+1Q (L/s)σGCI (%)
9--50.58----
7.51.252.295.393.73
41.8756.612.321.09
Table 3. Comparison between the simulated results and the experimental discharge.
GroupsH/PQEXP (L/s)QCFD (L/s)Relative Value %
10.0515.415.923.38
20.0725.026.301.56
30.0940.039.46−1.35
40.1360.058.61−2.32
50.1575.073.18−2.43
60.1890.087.92−2.31
70.2010099.74−0.26
80.23115113.77−1.07
90.25125124.13−0.69
100.30150151.641.09
110.34170165.77−2.49
120.39200197.28−1.36
Disclaimer/Publisher’s Note: The statements, opinions and data contained in all publications are solely those of the individual author(s) and contributor(s) and not of MDPI and/or the editor(s). MDPI and/or the editor(s) disclaim responsibility for any injury to people or property resulting from any ideas, methods, instructions or products referred to in the content.

