Article

Raindrop Size Distribution Characteristics of the Precipitation Process of 2216 Typhoon “Noru” in the Xisha Region

1
School of Atmospheric Sciences, Sun Yat-Sen University, Zhuhai 519082, China
2
Hainan Sansha Meteorological Bureau and Xisha National Climate Observatory, Sansha 573100, China
3
Southern Marine Science and Engineering Guangdong Laboratory, Zhuhai 519082, China
4
Guangdong Provincial Observation and Research Station for Climate Environment and Air Quality Change in the Pearl River Estuary, Zhuhai 519082, China
5
Guangdong Provincial Marine Meteorology Science Data Centre, Guangzhou 510640, China
6
Dongguan Meteorological Bureau, Dongguan Engineering Technology Research Center of Urban Eco-Environmental Meteorology, Dongguan 523888, China
*
Author to whom correspondence should be addressed.
Water 2024, 16(18), 2630; https://doi.org/10.3390/w16182630
Submission received: 13 August 2024 / Revised: 6 September 2024 / Accepted: 11 September 2024 / Published: 16 September 2024
(This article belongs to the Section Hydrology)

Abstract

:
This study focuses on the comparative analysis and research of the raindrop size distribution (DSD) in the outer rainband and inner rainband of Typhoon “Noru” in 2022, using the OTT-Parsivel raindrop spectrometer deployed on Yongxing Island, Sansha City. The results indicate that precipitation intensity is lower when composed mainly of small and medium raindrops and increases with the presence of larger raindrops. Stronger precipitation is associated with a higher number of large raindrops. Due to the interaction of cold and warm air masses, the raindrop concentration is higher, and the raindrop diameters are larger compared to Typhoons “LEKIMA” and “RUMBIA”. The entire process predominantly consists of numerous small- to medium-sized raindrops, characteristic of a tropical typhoon. The precipitation in the inner and outer rainbands exhibits consistent types, characterized by a unimodal raindrop size distribution with a narrow spectral width, typical of stratiform-mixed cloud precipitation, where stratiform precipitation constitutes a significant portion. Strong echo reflectivity factors are often associated with higher raindrop number concentrations and larger particle sizes. The Z-R relationship of the precipitation shows a smaller coefficient but a consistent exponent compared to the standard. The calculated shape parameter slope relationship is Λ = 0.02 μ 2 + 0.696 μ + 1.539 , providing a reference for localizing the Z-R relationship in the South China Sea.

1. Introduction

Typhoons are intense warm-core vortex systems that form in the tropical marine atmosphere, primarily due to high sea surface temperatures, high humidity, Earth’s rotation, and the Coriolis effect, often resulting in strong winds, heavy rainfall, and large waves. The South China Sea region, located at the junction of tropical and subtropical zones, has high sea temperatures and humidity. Its unique geographical and climatic conditions provide favorable conditions for typhoon formation. Typhoons severely affect the work and life of island residents and are one of the main weather disasters in the region. In typhoon forecasting, integrating the probability of tropical cyclone occurrence into a probabilistic forecast model can estimate the formation location and future affected areas of a tropical cyclone. Based on its development mechanisms, it can predict the future path and intensity of a tropical cyclone, estimate regions likely to experience heavy rainfall, and provide timely and accurate warnings to relevant departments to take necessary defensive measures to protect people’s lives and property. Hence, it is essential to focus on the intensity, regions of heavy rainfall, movement paths, and development mechanisms [1,2].
Recent research on typhoon rainfall focuses on radar and model predictions [3,4,5,6,7]. Quantitative precipitation forecasting during typhoons often uses the Z-R relationship (Z for radar reflectivity, R for rainfall rate). However, numerous studies have shown that the traditional Z-R relationship is not suitable for all precipitation scenarios, as it is influenced by factors such as region, terrain, environment, and precipitation cloud types. Therefore, many studies, both domestic and international, aim to localize the Z-R relationship [8,9,10]. Advances in observation equipment and techniques have led to the use of raindrop spectra as a crucial tool for studying cloud microphysical processes in precipitation. Raindrop spectrometers can measure high-speed moving objects, determining the total volume, size, intensity, and velocity of falling rain. Some experts have utilized raindrop spectra to study precipitation under various types [11], regions [12,13], and other variables. Recent studies also highlight their critical role in typhoon research. When typhoons bring heavy rainfall, variations in raindrop spectra can reveal crucial information about typhoon intensity, trajectory, and precipitation amounts. These fundamental data are essential for predicting typhoon strength, path, and impact areas. Additionally, raindrop spectrometers can delve into the microphysical processes and formation mechanisms of cloud precipitation within typhoons, providing mechanistic analyses. Ulbrich and Lee analyzed the raindrop size distribution characteristics of precipitation from typhoon “Helene” in 2000 [14]. They demonstrated the instability of the Z-R relationship for quantitative precipitation during typhoons. Wang et al. [15] studied the raindrop spectra during six typhoons that caused heavy rainfall in Shandong. Statistical relationships between parameters indicated differences between continental and maritime convective precipitation, with a more complex Z-R relationship. However, there was no significant difference in the Z-R relationship between continental and maritime convective precipitation processes. Zhu et al. [16] focused on analyzing the raindrop spectral characteristics of precipitation caused by the typhoon itself during the first phase of Typhoon Haikui and the second phase triggered by cold air intrusion, finding significant differences in the raindrop spectra between the two phases. Shen et al. [17] analyzed the microphysical characteristics of intense precipitation in typhoon rainbands using dual-polarization radar data, raindrop spectra, automatic weather station data, and wind profiler radar data. The study found distinct characteristics in the precipitation during the onset, peak, and weakening stages of Typhoon “LEKIMA” (Typhoon No. 1909). Feng et al. [18] used data from a disdrometer station, and the Z-R relationship of precipitation from the outer cloud systems during the landfall stage of Typhoon “RUMBIA” (Typhoon No. 1808) was analyzed and compared with relationships derived from radar and rain gauge measurements.
Tokay et al. [19] studied seven Atlantic hurricanes over three years and found that hurricanes are primarily composed of small to medium raindrops. Raindrops larger than 4 mm rarely occur unless hurricanes merge with mid-latitude frontal systems in the temperate stage. At the same reflectivity, the drop concentration, liquid water content, and rainfall rates of extratropical cyclones are lower than those of tropical cyclones. Okachi et al. [20] examined the impact of marine spray on rainfall measurements, drop size distribution (DSD), and rainfall intensity using coastal ocean observation towers, including data from Typhoon Maria (Typhoon No. 2005) in 2019. Their findings indicated a strong correlation between the proportion of marine spray in rainfall and its DSD characteristics under different rainfall intensities and horizontal wind speeds, demonstrating that DSD is a key factor for calculating actual rainfall intensity in open waters. Lyu et al. [21] and Suh et al. [22] investigated the microphysical characteristics of raindrops in the outer rainbands of Typhoon Mangkhut (Typhoon No. 1822) and the internal structure as it landed in southern China and the microphysical characteristics of the rainbands of Typhoon Conson (Typhoon No. 1825) as it passed through southern Korea. Both studies confirmed that the median volume diameter D 0 and normalized intercept parameter N w of the raindrop spectrum vary at different stages of typhoon development, and these two parameters are crucial for improving radar precipitation estimation. The aforementioned studies highlight the significance of raindrop spectrum characteristics in precipitation prediction. However, the aforementioned studies primarily derive data from coastal areas, often reflecting conditions influenced by terrestrial features post-landfall. Consequently, observations can be affected by topography, vegetation, and human interventions against typhoons, complicating the understanding of their natural development. In contrast, Yongxing Island, due to its remote geographical location, offers a unique perspective on raindrop spectral data. These data can be viewed as directly acquired from the open sea, minimizing surface influences during the typhoon’s development phase and providing a more accurate representation of its characteristics in a marine environment. The innovation of this research lies in focusing on marine raindrop spectral data for typhoons, aiming to fill existing gaps in South China Sea typhoon studies. This unique data source not only aids in understanding the dynamic characteristics of typhoons in the absence of topographic influence but also explores subtle changes in raindrop behavior during their development over the ocean, ultimately providing more precise parameters for future meteorological models.
From 26 to 28 September 2022, Typhoon “Aolu” caused overcast skies and heavy rainfall across the Xisha Islands, with localized downpours reaching up to 143.6 mm on Yongxing Island. Wind gusts of 9 to 11 on the Beaufort scale were recorded, with a maximum wind speed of 29.7 m/s (Category 11) at Beijiao. This extreme rainfall forced vessels to seek shelter, leading to substantial direct and indirect economic losses due to significant island inland flooding and the halting of a supply ship. This incident highlights the high research value of typhoons in the South China Sea, yet studies remain scarce due to previous observational limitations and difficulties in data acquisition. Furthermore, localized adaptations of the Z-R relationship for this region are rarely explored. Most existing research data focus on the raindrop spectrum collected after typhoon landfall, representing periods from peak to diminutive intensity, with limited observations from the ocean. This study collects raindrop spectrum data from Yongxing Island, where the island’s topography has minimal influence, effectively representing maritime observational data. Typhoon “Noru” (No. 2216) passed through the South China Sea after crossing Vietnam, having weakened in intensity but subsequently strengthened under local conditions. Its intensity reached super typhoon status while traversing the Xisha Sea, and it weakened as it moved westward due to unfavorable conditions in the central South China Sea. The raindrop spectrum data collected adequately cover the period of “Noru’s” development and subsequent weakening over the ocean, allowing for a more effective analysis of changes in raindrop size characteristics during different developmental stages of the typhoon at sea. This study aims to provide insights to enhance the prediction of typhoon-related precipitation in the South China Sea and support localized revisions of the Z-R relationship for the region.

2. Materials and Methods

The raindrop disdrometer currently installed on Yongxing Island in the South China Sea is a WUSH-PW precipitation phenomenon instrument, equipped with an OTT-Parsivel disdrometer. This device is a particle measurement sensor based on laser measurement, capable of measuring ground precipitation and obtaining its flux spectrum [23]. The instrument employs data from 32 diameter channels and 32 velocity channels, measuring diameters ranging from 0.2 to 25.0 mm and fall velocities from 0.2 to 20.0 m/s. Data utilized herein were sampled at 1 min intervals. To enhance data quality and minimize errors, records with raindrop counts below 10 were discarded. Quality control was subsequently applied to the data using the methods outlined by Bao-Jun C et al. [24]. Additionally, the data, post-quality control, were corrected using the axis ratio adjustment method proposed by Battaglia et al. [25].
To analyze the raindrop size distribution and its distribution function, the collected raindrop spectra data were used to calculate the raindrop number concentration based on the following relevant formula:
N ( D i ) = j = 1 32 n i j A Δ t V j Δ D i
In the formula, n i j represents the number of raindrops with diameters in the i th interval and fall velocities in the i th interval and fall velocities in the j th interval, A represents the sampling area ( m 2 ) , Δ t represents the sampling time interval (s), D i and Δ D i   represent the center diameter and width of the ith diameter interval, respectively (mm), and V j represents the velocity in the j th fall velocity interval (m/s). N D i denotes the raindrop number concentration within the diameter interval from D i to D i + Δ D i .
Using N D i , the rain rate R   mm / h and reflectivity factor intensity Z   mm 6 / m 3 can be calculated as follows:
Z = i = 1 32 N ( D i ) D i 6 Δ D i
R = 6 π 10 4 i = 1 32 j = 1 32 V j N ( D i ) D i 3 Δ D i
Existing research [26] indicates that the droplet size distribution follows a Gamma function and fits the raindrop spectra of convective and stratiform clouds better than the M-Palmer function. The Gamma function is as follows:
N ( D ) = N 0 D μ exp ( Λ D )
In the equation, D is the raindrop diameter mm , N 0 is the number concentration parameter mm 1 μ m 3 , µ is the shape parameter, and Λ is the slope parameter mm .
For the Gamma model, the n moment of the droplet size distribution is expressed as follows:
M n = D min D max D n N D d D = N 0 Γ μ + n + 1 Λ μ + n + 1
In this expression, Γ x is the Γ function [14]. Jin et al.’s [23] study on the raindrop size distribution characteristics in the Jianghuai region during summer utilized the 2nd, 3rd, and 4th moments of the droplet size distribution. Ultimately, they derived the following formula for calculating the mass-weighted mean diameter D m :
D m = M 4 M 3

3. Reliability of Raindrop Spectra Data

To verify the reliability of the raindrop size distribution data, the rain intensity data observed by the Xisha Climate Observatory funnel rain gauge were compared with the calculated rain intensity results (since the WUSH-PW disdrometer cannot directly measure rain intensity). During Typhoon Noru, the hourly rainfall on Yongxing Island observed by the rain gauge (RG) and the OTT disdrometer showed a consistent trend and magnitude (Figure 1), exhibiting a high correlation. These results align with Li et al.’s [27] previous reliability studies, indicating that the raindrop size distribution data accurately reflect real rainfall variations.

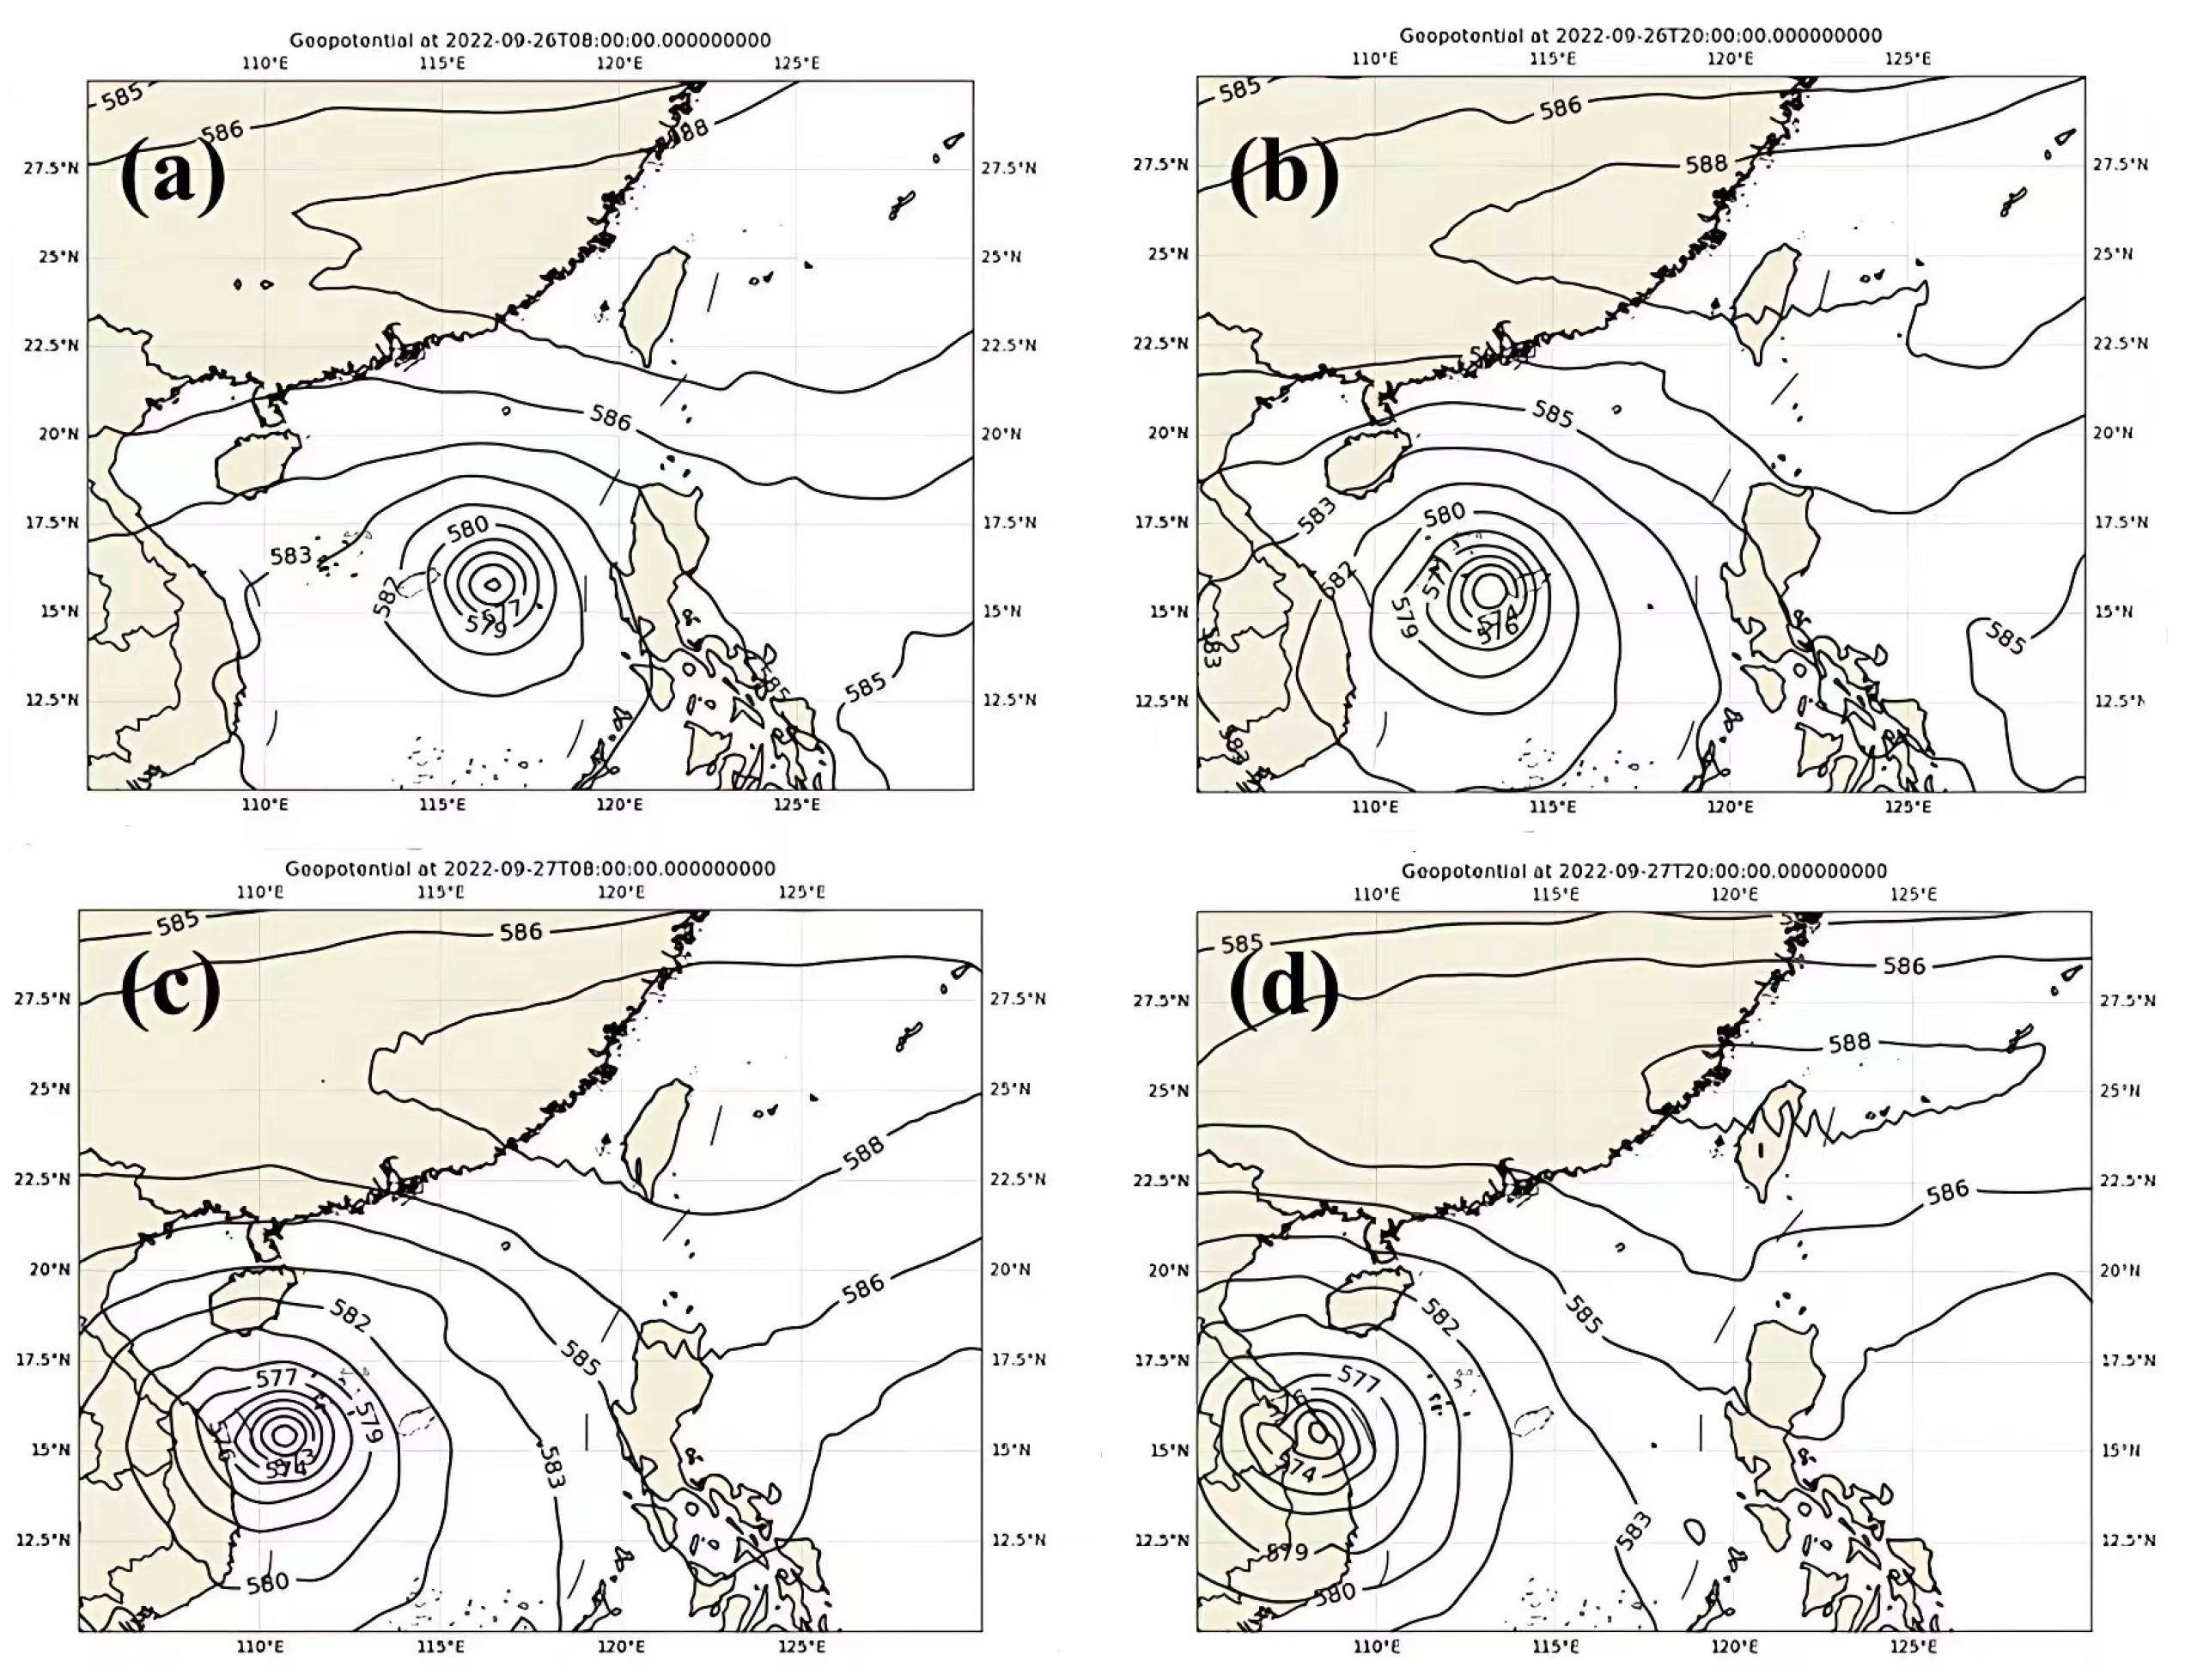
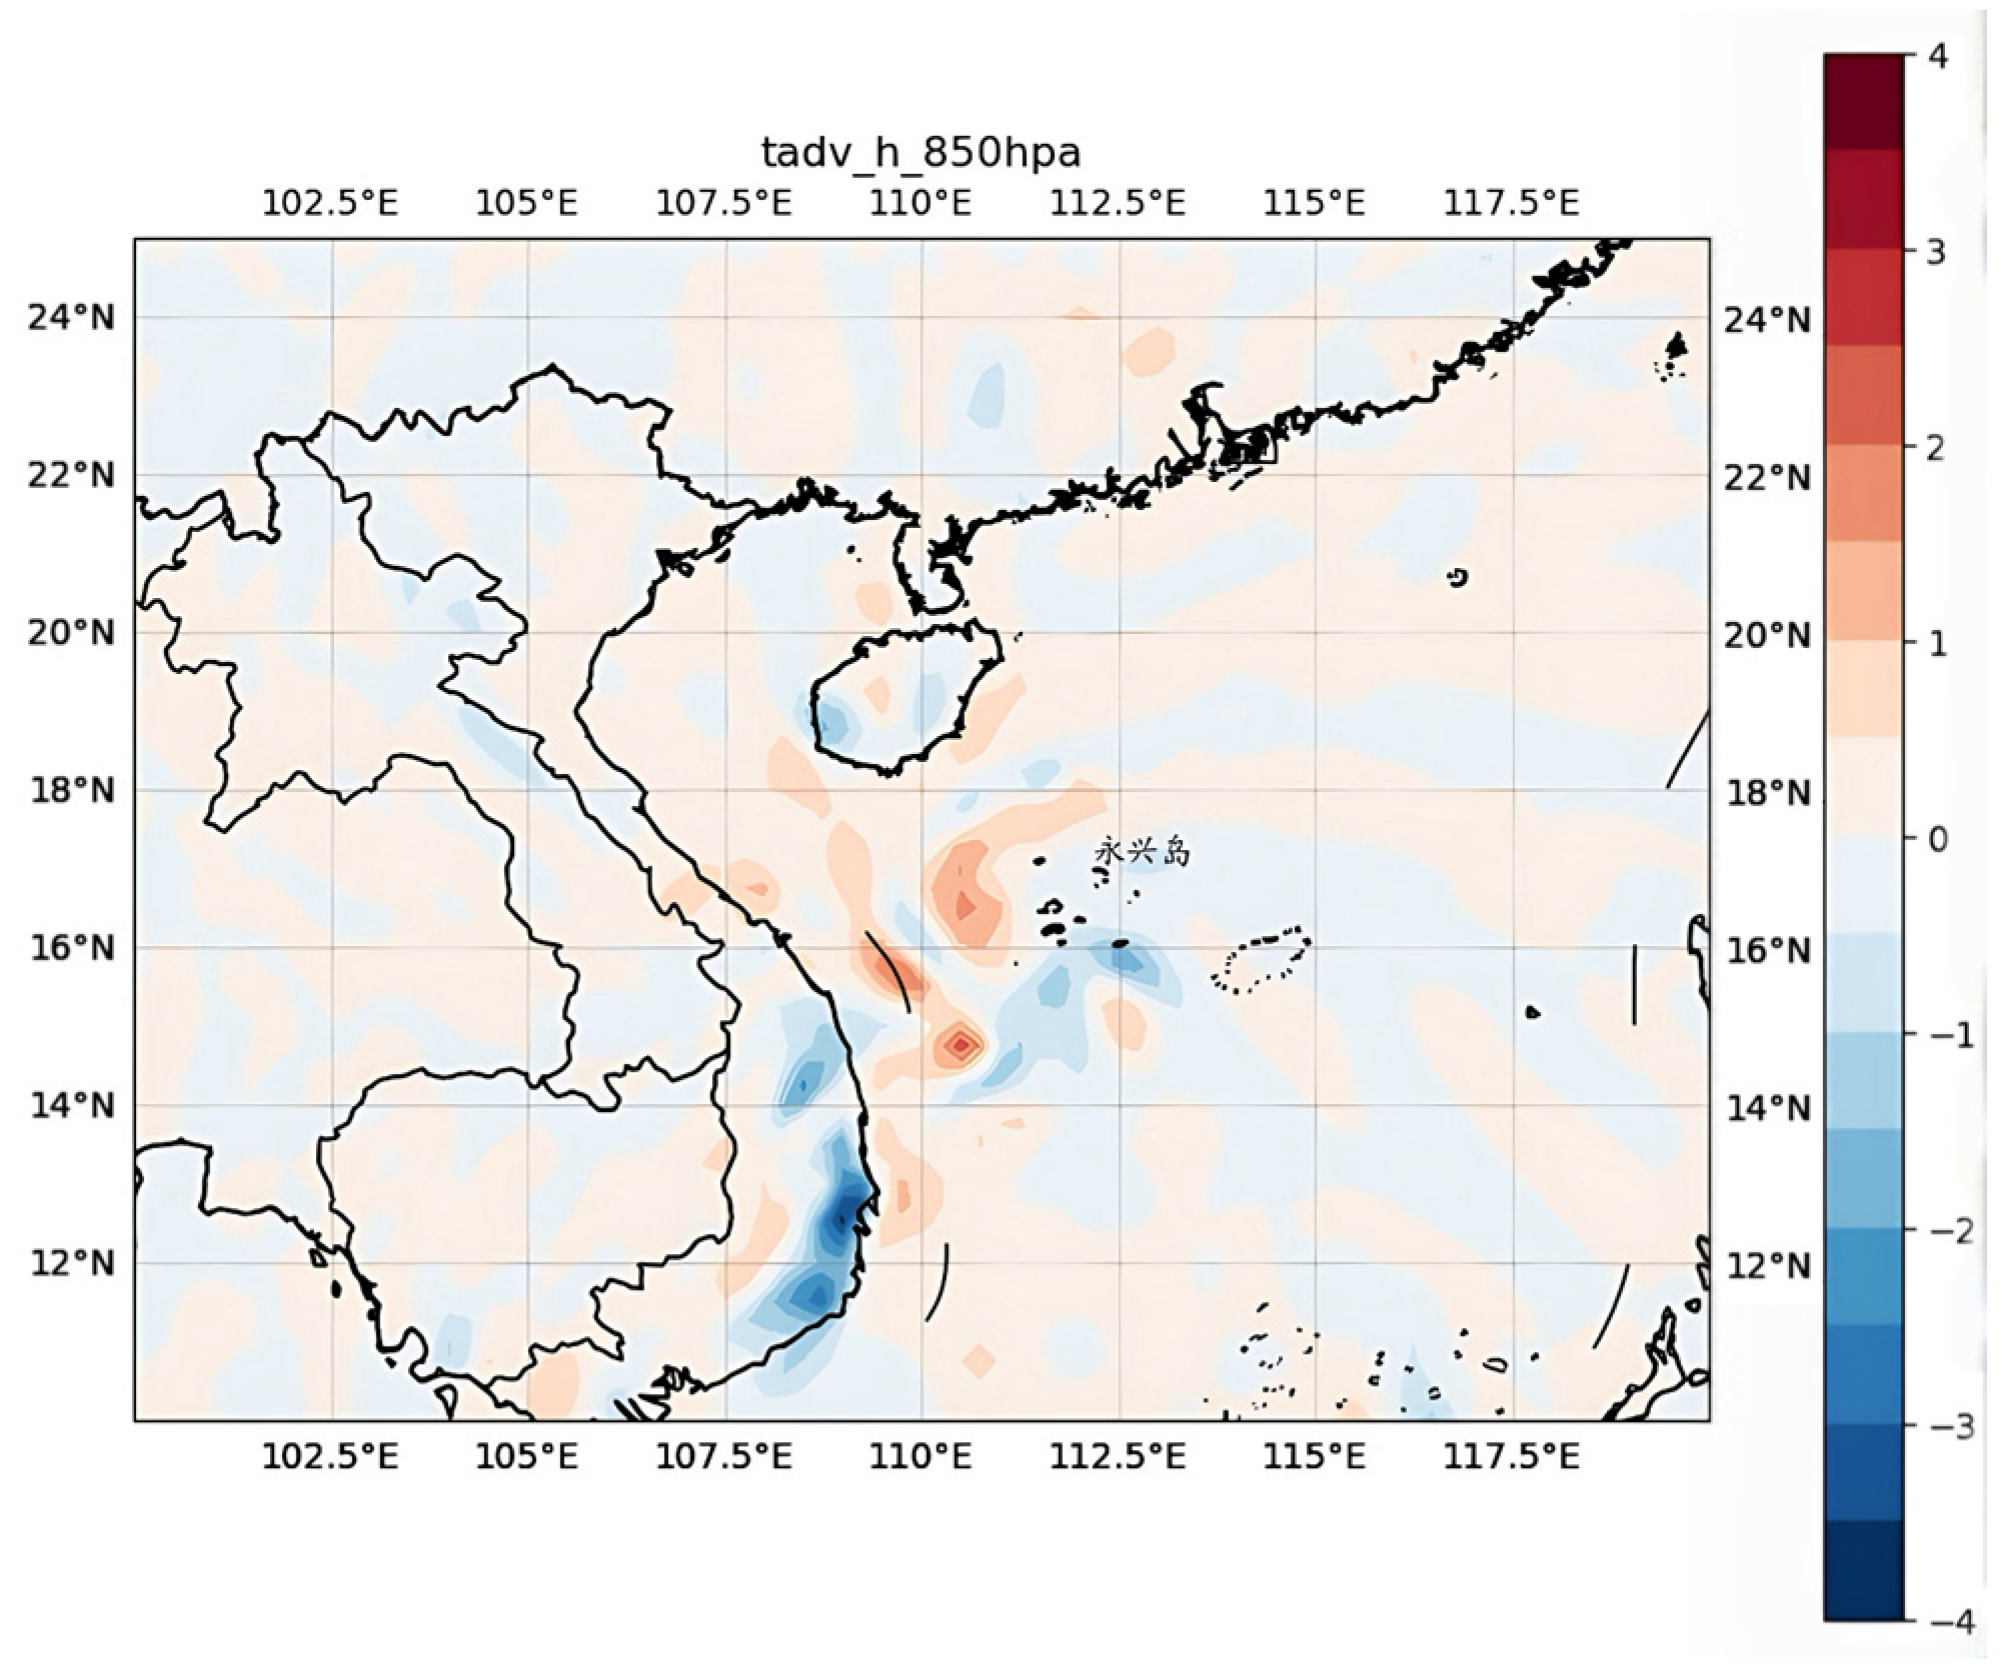
4. Typhoon Overview and Weather Background

Typhoon Noru (Typhoon No. 2216) formed over the eastern waters of the Philippines on the afternoon of 23 September. It rapidly intensified into a super typhoon on the night of 24 September and made landfall along the coast of Aurora Province in eastern Luzon, Philippines, at around 20:00 on 25 September. On the morning of 26 September, it moved into the central-eastern South China Sea and strengthened again into a super typhoon at around 02:00 on 27 September. It passed over the southern waters of Hainan Island during the day on 27 September and made landfall near Quang Nam Province, Vietnam, at around 04:30 on 28 September. Typhoon Noru was characterized by “high intensity, small eye, small area of strong winds, and a wide range of wind and rain impacts”. During its influence, the Xisha Islands experienced heavy rainfall. From 00:00 on 26 September to 00:00 on 28 September, the rainfall center among the islands was located on Yongxing Island, with a cumulative precipitation of 213.5 mm. Figure 2a shows the reflectivity map of Typhoon Noru’s DRP (UTC: 2022092700), with the RMW representing the diameter of the typhoon eye, approximately 60 km; (b) displays the typhoon reflectivity profile along the blue line. It can be observed that rainfall within the RMW is relatively low, with the main precipitation bands concentrated in the inner rainbands (<3 RMW) and the outer rainbands (>3 RMW).
At 20:00 on 26 September, 08:00 and 20:00 on 27 September, and 08:00 on 28 September. Form Figure 3a–d, the process of typhoon development over time is shown respectively. the ERA5 analysis of the 500 hPa height field revealed a strong development of the subtropical high, as indicated by the distribution of the 588-line. At 08:00 on 27 September, the subtropical high exhibited a pointed shape, with the ridge line located near 25° N and the 588-line extending westward to 110° E. The blocking effect of the subtropical high to the north of the typhoon intensified, and the northward component of the steering flow to the west of the subtropical high was stronger than expected, enhancing the steering flow. Consequently, the typhoon moved at a faster speed along a westward path, passing through the Xisha Islands region. During the typhoon’s development, it was influenced by strong northeasterly winds, and a moist tongue of pseudo-equivalent potential temperature was present at low levels, providing dynamic and thermodynamic conditions for precipitation. As a result, heavy rainfall occurred in the Xisha region and the maximum hourly rainfall during the process was 37.5 mm. By 08:00 on 28 September, the subtropical high had weakened, with the 588-line retracting eastward to around 117° E, and the typhoon had completed its landfall.

5. Analysis of Raindrop Spectral Variations in Typhoon “Noru”

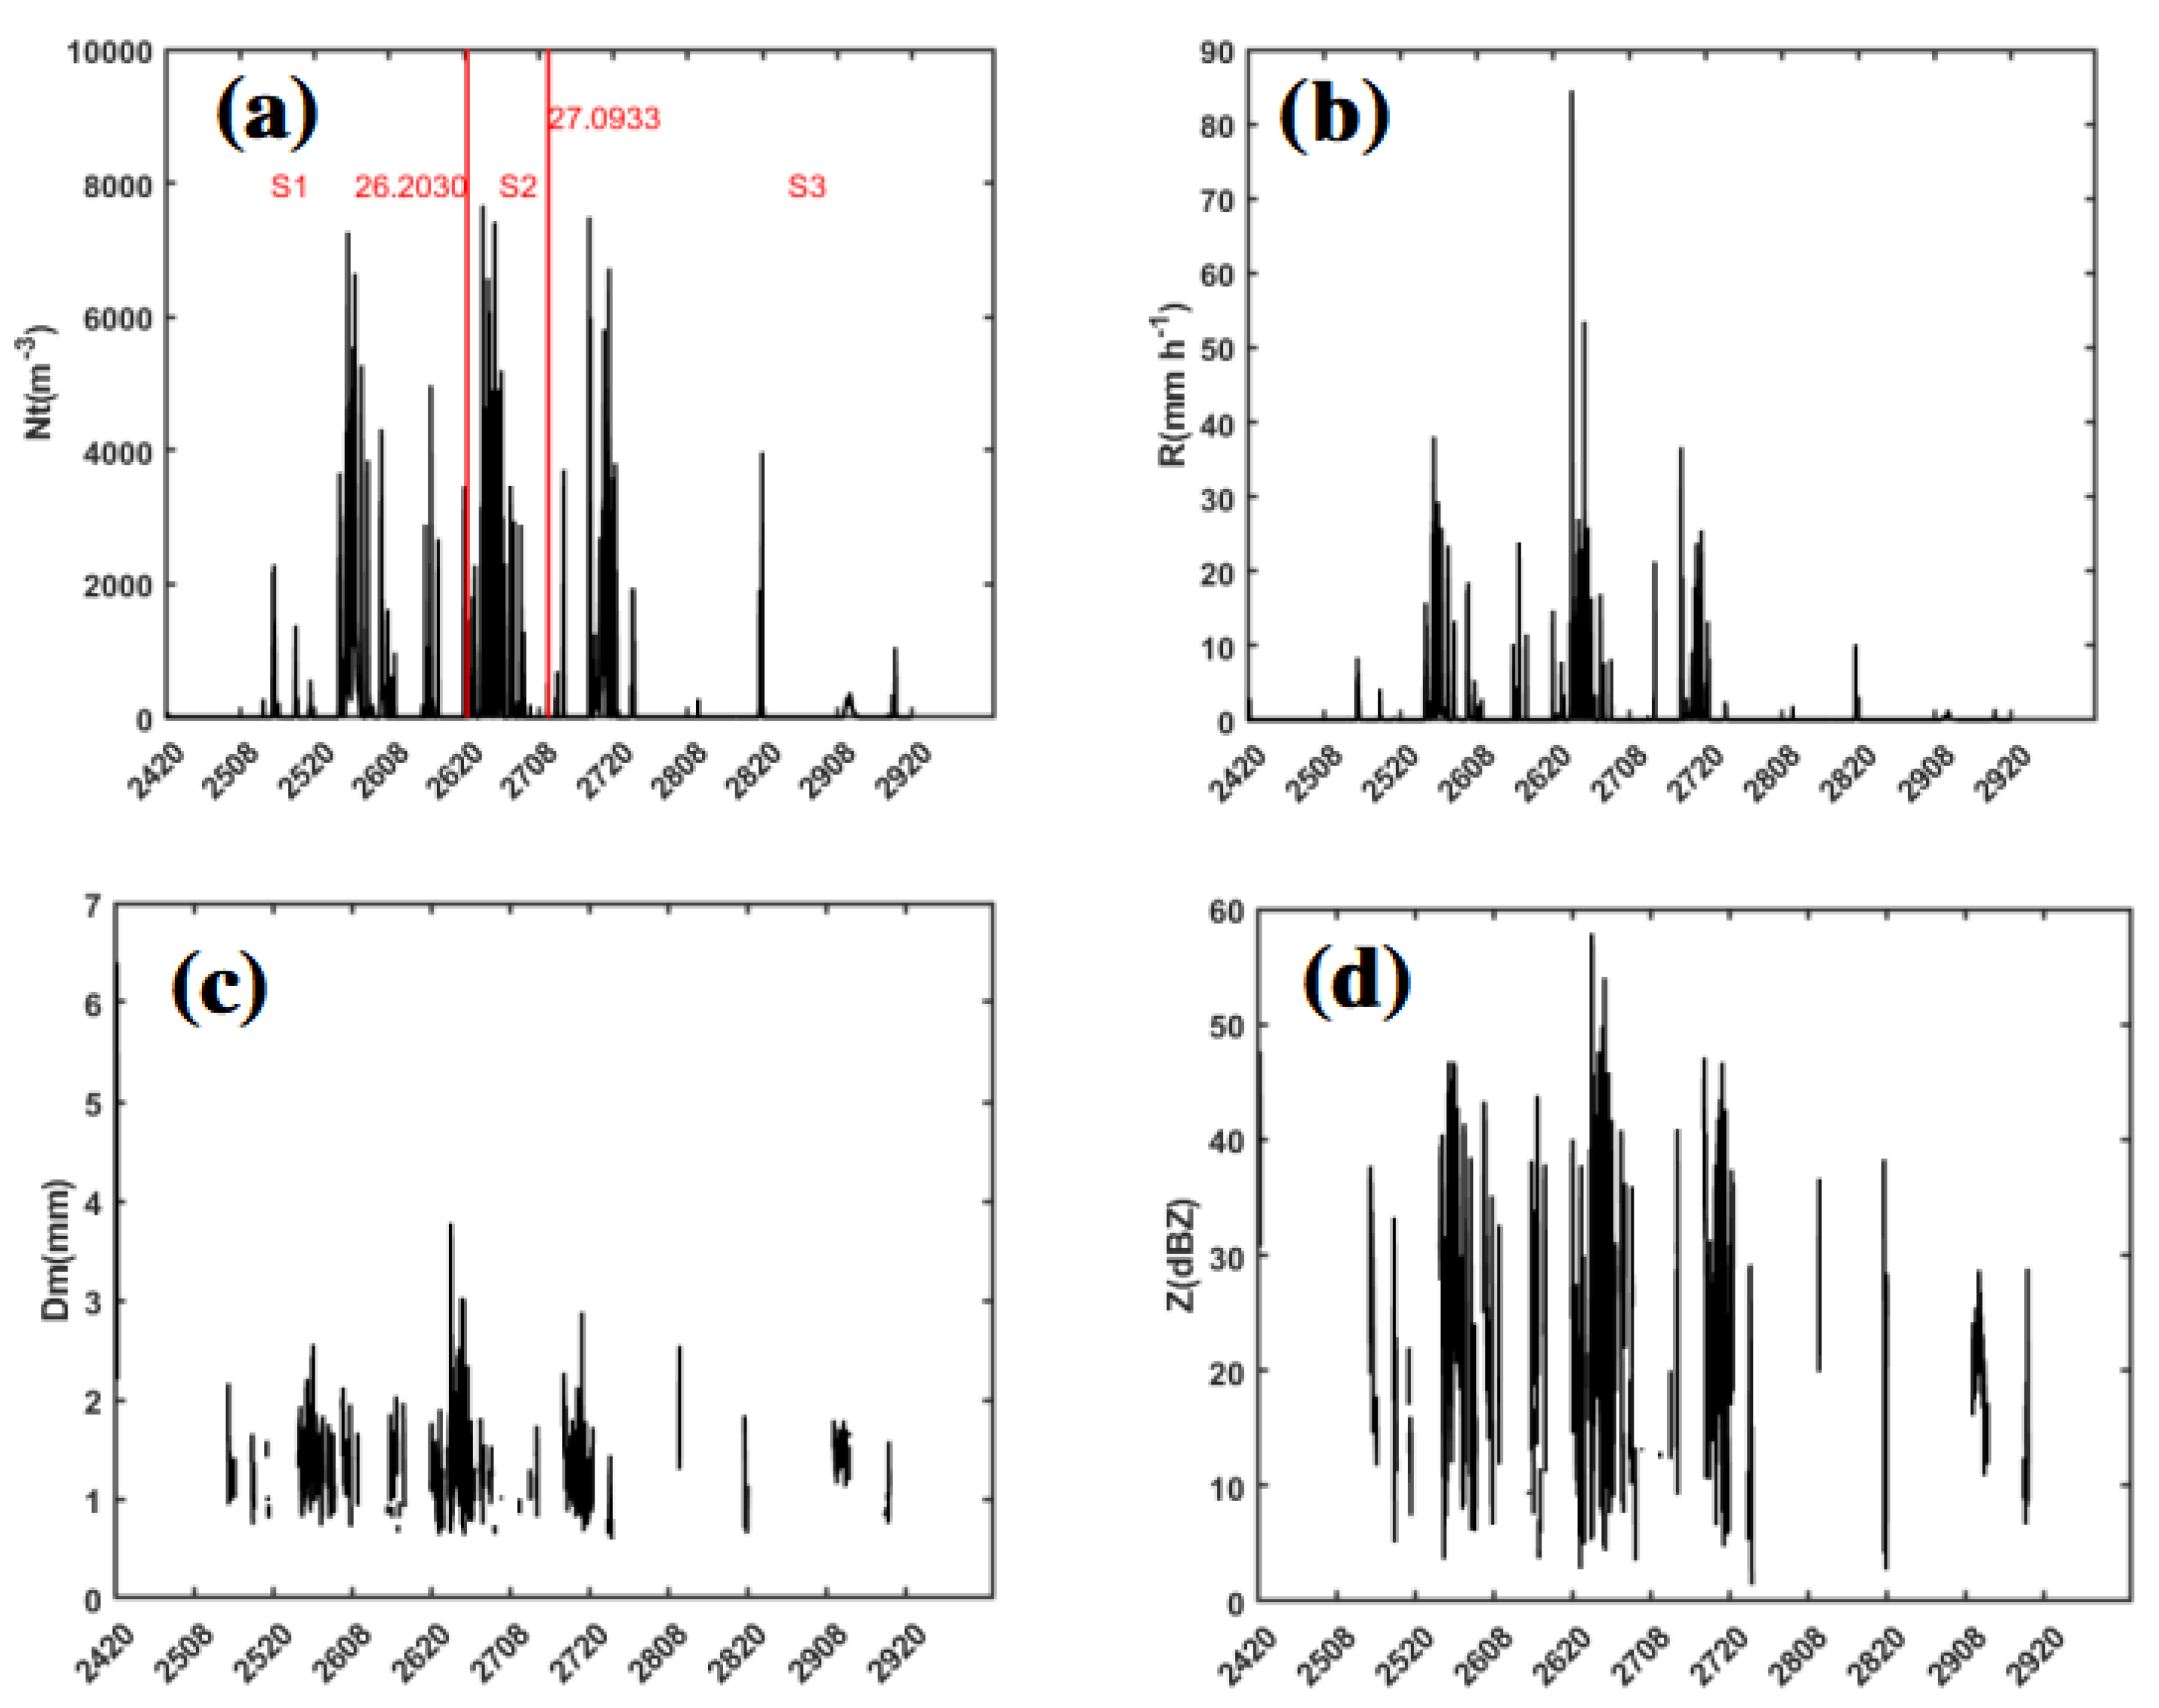
5.1. Temporal Variation in Raindrop Spectra

Affected by Typhoon “Noru”, Yongxing Island experienced primarily overcast weather with heavy rain from 25 to 28 September, with some periods reaching the level of torrential rain. The Central Meteorological Observatory provided data indicating a 280 km diameter for the seventh-level wind circle and an 80 km diameter for the tenth-level wind circle. The 80 km region corresponded well with the strongest echo. According to the Typhoon Noru DRP reflectivity map (UTC: 20220927-S054505-E071737) in Figure 2, the RMW is approximately 60 km. The area within 3 RMW (less than 180 km from the center) is defined as the inner rainband, while the area beyond 3 RMW (more than 180 km from the center) is defined as the outer rainband.
Based on whether Yongxing Island’s distance from the typhoon center exceeded 3 RMW, three stages were defined for the study of raindrop spectra during Typhoon “Noru”: S1 (08:00 on the 25th to 20:30 on the 26th), S2 (20:31 on the 26th to 09:33 on the 27th), and S3 (09:33 on the 27th to 20:00 on the 29th). Precipitation in the S1 and S3 stages is classified as outer rainband precipitation, while in S2, it is classified as inner rainband precipitation. In Figure 4, rainfall intensity R (b) calculated from raindrop spectra data shows peaks in all three stages. In S1 and S3, the rainfall intensities are similar, while S2 shows slightly higher values. The total raindrop concentration Nt (a) is closely related to rainfall intensity. In S2, isolated minutes with higher rainfall intensity do not show significant changes in raindrop concentration, suggesting larger raindrop diameters (c) in these minutes. S2 exhibits larger raindrop diameters compared to S1 and S3. Reflectivity Z (d) indicates that stronger reflectivity corresponds to higher raindrop concentration and greater rainfall intensity. In S2, raindrop diameter often correlates with reflectivity intensity.
During the precipitation process of Typhoon “Noru,” most raindrop diameters ranged between 1.0 and 2.1 mm. Specifically, raindrop diameters in S1 and S3 were mostly within 1.0 to 2.0 mm, while a significant portion in S2 ranged from 1.5 to 2.6 mm. This indicates that the raindrop diameters in the typhoon’s inner rainband were larger than those in the outer rainband. Additionally, the raindrop diameters and concentrations during Typhoon “Noru” were significantly larger than those observed during the landfall of Typhoon “LEKIMA” and “RUMBIA”. Based on previous research shown in Table 1, there is no significant correlation between the size and quantity of raindrop morphology and typhoon intensity. The rainfall intensity ( R ) is primarily proportional to the mean concentration ( Nt ) and the mean raindrop diameter ( Dm ). However, compared to ( Nt ), larger raindrops contribute more significantly to the precipitation intensity ( R ).
Analysis of the 850 hPa temperature advection in S2 indicates that the northwest quadrant of the typhoon center was influenced by cold air (Figure 5). The interaction between cold and warm air masses led to torrential rain in the Xisha region during this period. The convergence of cold and warm advection resulted in a clearly unstable region. Additionally, strong moisture transport favored the occurrence of heavy precipitation. The combination of cold and warm air enhanced convective precipitation, leading to larger raindrops. These larger raindrops, influenced by various microphysical processes during their descent, resulted in more fragmented raindrops, thus contributing to the differences observed between Typhoon “Noru” and Typhoon “LEKIMA” and “RUMBIA”. Additionally, a higher number of raindrops and larger raindrop diameters may be associated with the typhoon’s underlying surface being oceanic rather than terrestrial. Moreover, during this event, raindrop diameters did not exhibit a decreasing trend with increasing rainfall intensity, which contrasts with the findings of previous research by Lv et al. [28].

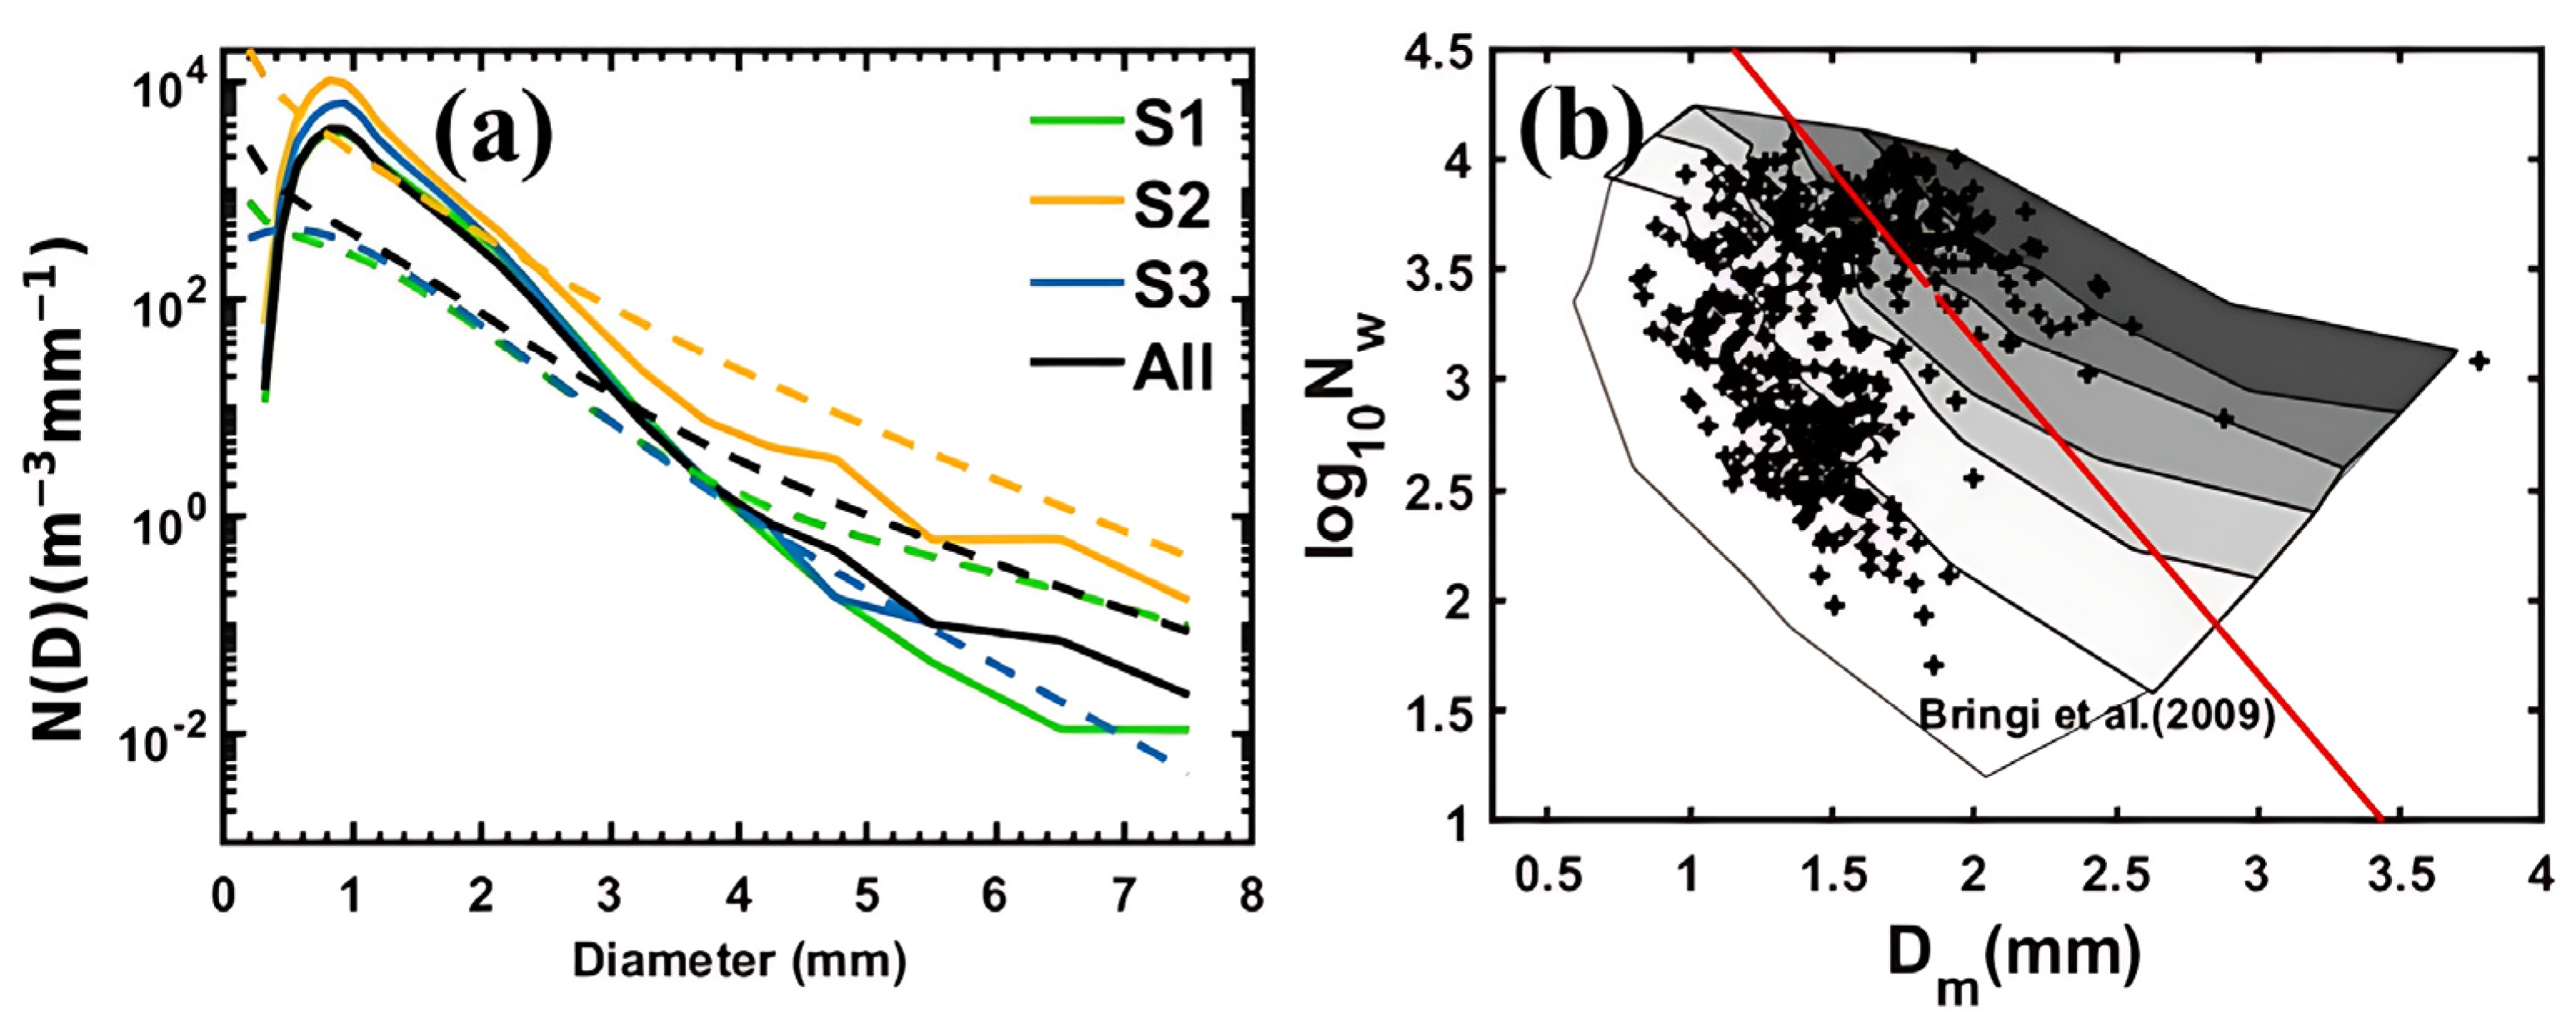
5.2. Mean Raindrop Size Distribution Characteristics and Gamma Fitting Analysis

Further analysis of the raindrop number concentration–diameter distribution for this event (Figure 6) reveals that the raindrop diameters for both outer and inner rainbands are primarily concentrated between 0.6 and 1.4 mm. All three stages exhibit a wide spectral width. The maximum particle diameters in S1 and S3 are around 4 mm, while in S2, they reach approximately 5 mm, with a higher number concentration compared to the other two stages. In all three stages, as the raindrop diameter increases, the particle concentration gradually decreases, resulting in a unimodal curve.
The precipitation in all three stages exhibits a wide spectral width, primarily consisting of small- to medium-sized particles, characteristic of tropical typhoon precipitation. However, the particle diameters during Typhoon “Noru” are similar to those observed in some extratropical typhoon precipitations. The Gamma fitting analysis indicates that the raindrop spectrum for this event does not fit the Gamma model well. The spectrum is unimodal, with the peak concentrated in the range of small to medium raindrops. Although there are more small to medium raindrops, the spectral width is large, indicating that the precipitation distribution is characteristic of stratiform-mixed cloud precipitation.
The scatter plot of generalized raindrop number concentration N w versus mass-weighted mean diameter D m also confirms that the precipitation during this event is characteristic of stratiform-mixed cloud precipitation, with a larger proportion of stratiform cloud precipitation compared to convective cloud precipitation.

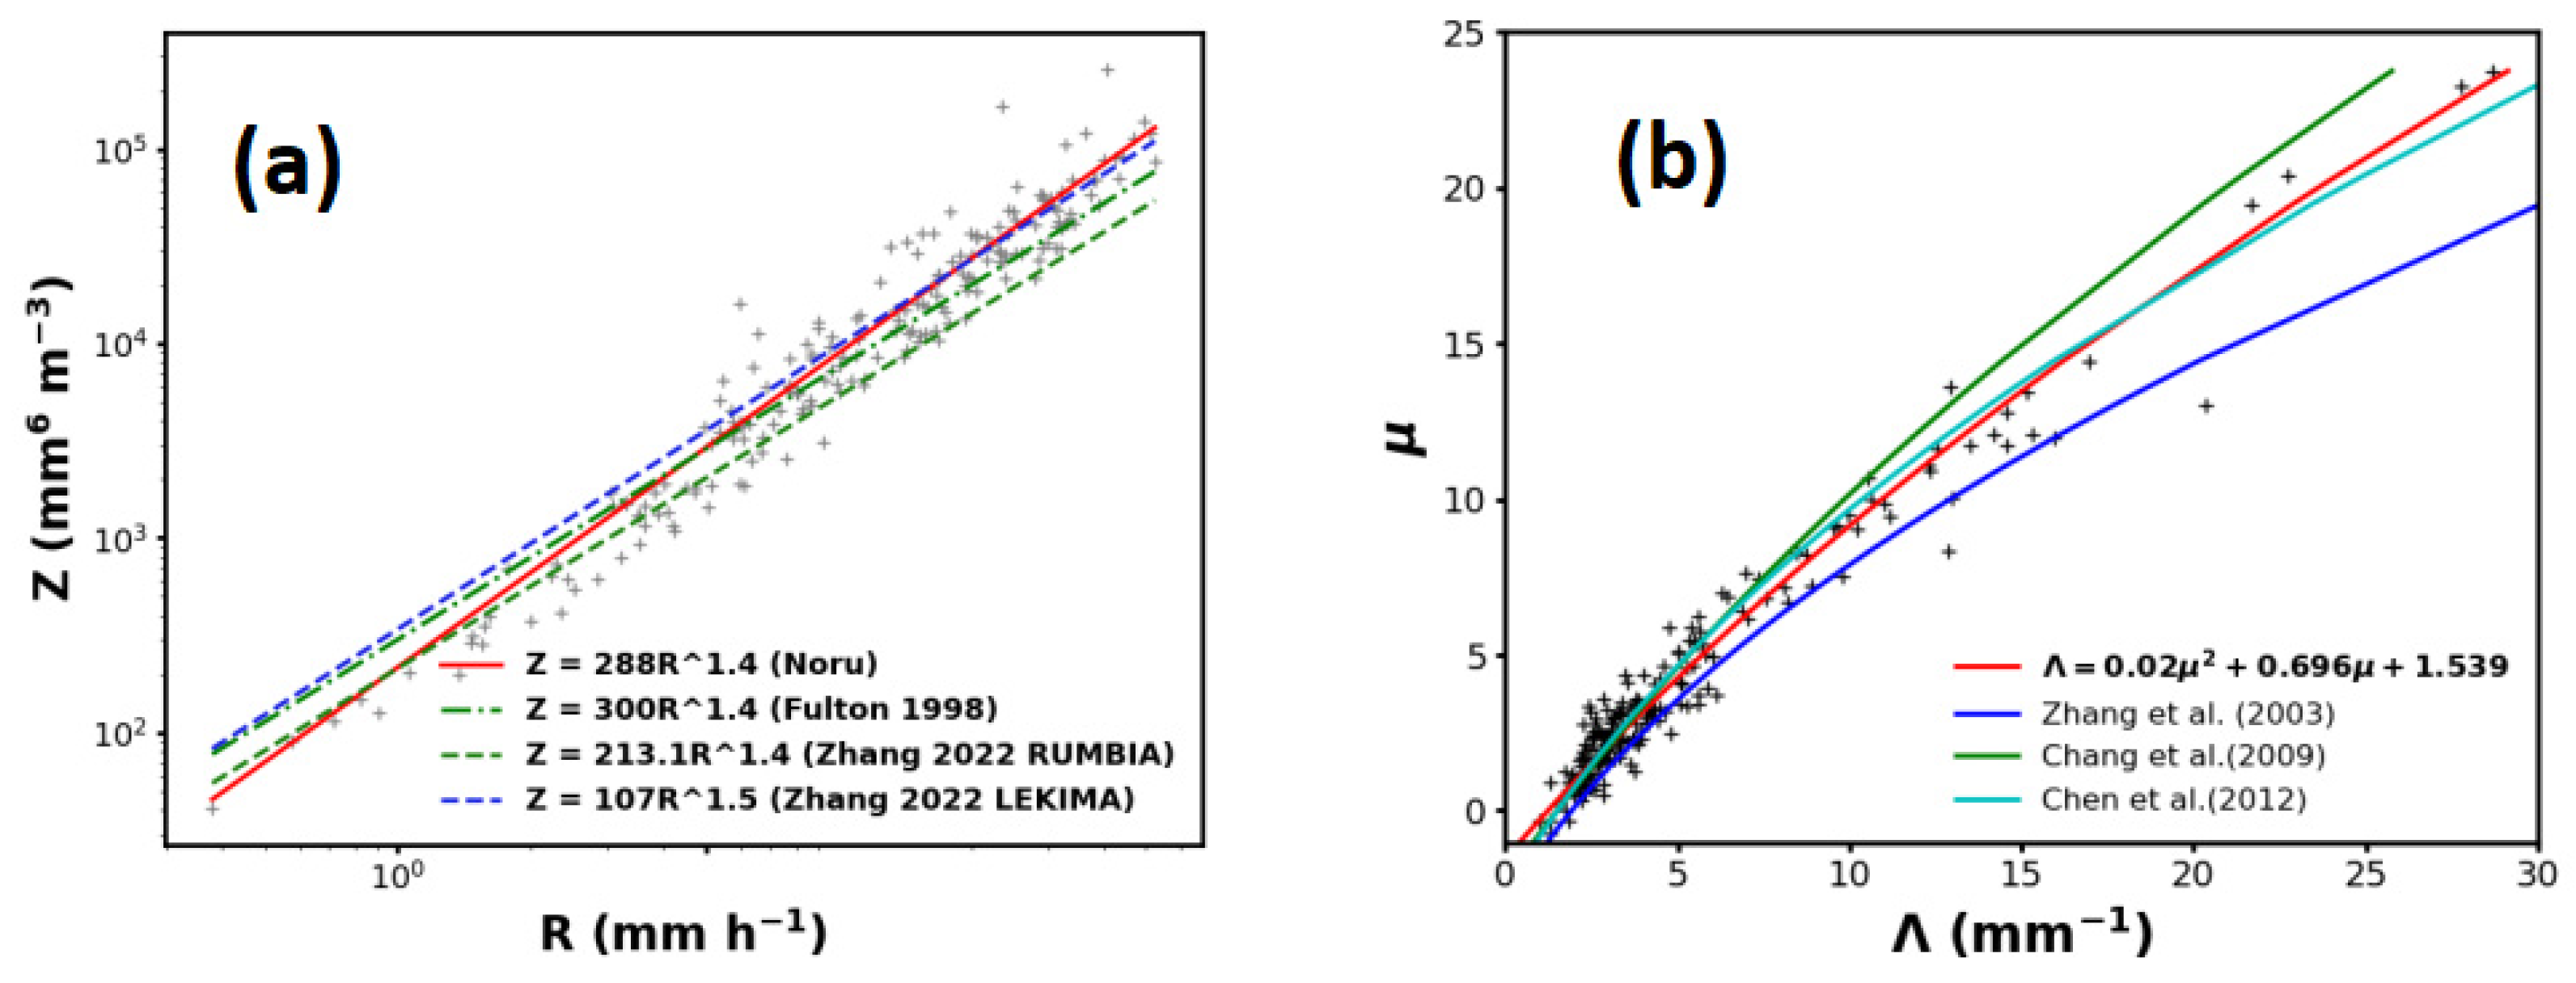
5.3. Analysis of the Z-R Relationship and μ-Λ Relationship in Raindrop Size Distribution

The Z-R relationship for precipitation associated with the entire typhoon in the Yongxing region was fitted (Figure 7a). The fitting shows that the exponent ( Z = 288 R 1.4 ) is consistent with the standard relationship ( Z = 300 R 1.4 ), while the coefficient is slightly lower, suggesting that using the standard Z-R relationship may lead to a slight underestimation of precipitation. The green dashed line represents the Z-R relationship for rainfall from Typhoon Tempest, as studied by Zhang at el. [9], with a lower coefficient of 213.1 and a consistent exponent of 1.40. The gamma distribution indicates that Typhoon Tempest exhibits stratiform-mixed cloud precipitation characteristics, similar to those of Typhoon Aolu, which may explain the identical exponent in their Z-R relationships. As previously noted, stratiform clouds constitute a larger proportion of Typhoon Aolu’s precipitation compared to convective clouds, potentially accounting for the coefficient differences. The Z-R relationship indicates that, for equal R values, Typhoon Aolu’s rainfall corresponds to stronger echoes and larger raindrop diameters, aligning with earlier findings. The blue dashed line represents the Z-R relationship for Typhoon Lekima’s rainfall, showing a smaller coefficient but a larger exponent. Given that Typhoon Lekima predominantly features convective clouds in its early stages and stratiform clouds later, it can be inferred that variations in raindrop diameter significantly influence the differences in Z-R relationships, with a greater impact than the number of raindrops.
Obtaining the μ - Λ relationship for this process through observations, and diagnosing the value of Λ from model forecasts, the following formula can be used:
A = 10 6 Γ ( 7 + μ ) N 0 2.33 / ( 4.67 + μ ) [ 33.31 Γ ( 4.67 + μ ) ] ( 7 + μ ) / ( 4.67 + μ )
b = 7 + μ 4.67 + μ
μ relates to the particle shape, while Λ is associated with the particle diameter.
Figure 7b illustrates that variations in precipitation particle quantity and diameter, influenced by different regions, seasons, and systems, lead to distinct Λ - μ relationships derived from the calculations. The measured result is Λ = 0.02 μ 2 + 0.696 μ + 1.539. Using the aforementioned formula, we can substitute the diagnosed values from the model forecasts into this result to derive A and b, thereby establishing a new Z-R relationship to correct the existing one. Further studies are needed to calculate and fit the Z-R relationship for different seasons, precipitation types, and influencing systems in the same region to improve the accuracy of local radar precipitation estimates.

6. Conclusions

This study analyzed and researched the precipitation and raindrop spectrum characteristics during various stages of Typhoon “Noru” (Typhoon 2216) as it traversed the Xisha region. The results indicate the following:
  • When precipitation is primarily composed of small- and medium-sized raindrops, the rainfall intensity is relatively low. When larger raindrops increase in number, the rainfall intensity grows. Stronger precipitation corresponds to a higher number of large raindrops. There is no significant correlation between raindrop size and quantity and the intensity of the typhoon. The rainfall intensity ( R ) is primarily proportional to the mean number concentration ( Nt ) and the mean raindrop mass diameter ( Dm ). The influence of the mean raindrop mass diameter ( Dm ) on the rainfall intensity ( R ) is greater than that of the mean number concentration ( Nt ).
  • Due to the interaction of cold and warm air masses, the precipitation during Typhoon “Noru” features high raindrop concentrations and large diameters. While the raindrop diameters suggest characteristics of a temperate typhoon, the overall composition consisting mainly of small- to medium-sized raindrops indicates tropical typhoon features, with a lower proportion of large raindrops. Additionally, the presence of more raindrops and larger raindrop diameters may be associated with the underlying surface being oceanic rather than terrestrial.
  • The inner and outer rainbands of Typhoon “Noru” exhibit similar precipitation types, characterized by a unimodal raindrop spectrum with a narrow width. The precipitation process is dominated by small- and medium-sized raindrops, indicative of stratiform-mixed cloud precipitation, with a significant proportion of stratiform cloud precipitation that fits poorly with the Gamma distribution. Strong echo intensities often correlate with high raindrop concentrations and larger particle sizes.
  • The Z-R relationship for Typhoon Noru’s precipitation shows a lower coefficient compared to the standard Z-R relationship, with a consistent exponent, resulting in the radar underestimation of precipitation. Based on previous studies, comparative analysis suggests that variations in raindrop diameter under different precipitation characteristics of typhoons significantly influence the Z-R relationship, with the contribution of raindrop diameter being greater than that of raindrop quantity. The μ - Λ relationship is Λ = 0.02 μ 2 + 0.696 μ + 1.539 , which can be integrated into forecasting models to refine the Z-R relationship, making it essential to conduct comparative studies on the Z-R relationship for similar path typhoons to improve radar estimates of typhoon precipitation accuracy.
Unlike raindrop spectrum data from landfalling typhoons, this study fills the gap in understanding the raindrop distribution characteristics of oceanic typhoons unaffected by land surfaces. While similarities exist between raindrop spectra of oceanic and coastal typhoons, notable differences are observed, with oceanic typhoons exhibiting a greater quantity and larger diameter of raindrops. This research enhances our understanding of the microphysical characteristics of oceanic typhoon raindrop spectra, which is crucial for model process parameterization and radar quantitative precipitation estimation. However, the limited sample size presents certain constraints, necessitating the collection of more data and comparative analyses with radar observations in future studies.

Author Contributions

Methodology, G.W. and C.H.; Data curation, L.Z.; Writing—original draft, G.W.; Writing—review & editing, L.L. All authors have read and agreed to the published version of the manuscript.

Funding

This study was supported by the National Key Research and Development Program of the People’s Republic of China (Grant No. 2023YFC3008002), the National Natural Science Foundation of the People’s Republic of China (Grant Nos. U21A6001 and 42075059), and the specific research fund of the Innovation Platform for cademicians of Hainan Province.

Data Availability Statement

Data will be made available on request.

Conflicts of Interest

The authors declare no conflict of interest.

References

  1. Chen, L.; Meng, Z.; Cong, C. A summary of the study on the falling area of typhoon rainstorm. J. Mar. Meteorol. 2017, 37, 1–7. [Google Scholar] [CrossRef]
  2. Choi, J.W.; Cha, Y. Tropical cyclone occurrence probability forecasting model in the western north pacific. Trop. Cyclone Res. Rev. 2016, 5, 23–31. [Google Scholar]
  3. Minghua, S.; Yihong, D.; Jianrong, Z.; Hui, W.U.; Jin, Z.; Wei, H. Experimental study on the prediction of typhoon “Meihua” using a mesoscale air sea coupling model. Acta Oceanol. Sin. 2014, 33, 123. [Google Scholar]
  4. Lin, C.; Linli, Z.; Nan, L.; Wenzhe, W. Analysis of Circulation Characteristics and Causes of Continuous Rainy Weather under the Influence of Typhoon Lionrock. Jilin Agric. Second. Half Mon. 2018, 3. Available online: https://qikan.cqvip.com/Qikan/Article/Detail?id=675921785 (accessed on 10 August 2024).
  5. Lin, Y.; Liu, A. Relationship between typhoon heavy rainstorm in Fujian and circulation situation field. In Proceedings of the 2008 Annual Meeting of the Chinese Meteorological Society, Changsha, China, 18–20 November 2008. [Google Scholar]
  6. Shen, Y.; Li, Y.; Fan, K. Evaluation of the effectiveness of radar precipitation estimation products during the 2021 Meiyu and typhoon periods in Zhejiang Province. Meteorol. Zhejiang Prov. 2023, 44, 17–22. [Google Scholar]
  7. Xu, L.; Yu, Z.; Qiu, J.; Li, Y.; Wu, M. Comparative analysis of multimodal precipitation forecast evaluation before and after the landfall of super typhoon “Lekima”. Meteorol. Sci. 2020, 40, 12. [Google Scholar]
  8. Sai, C.; Yafei, Z.; Jia, G.; Yunping, C.; Lin, C. Research on the correction of weather radar Z-R relationship using raindrop spectrum. Strait Sci. 2021, 6. [Google Scholar]
  9. Zhang, Q.; Liu. D.; Lv, X.; Liu, Z. Characteristics of raindrop spectrum and Z-R relationship of different types of rainstorm in Huaibei area. J. Meteorol. 2022, 80, 967–985. [Google Scholar]
  10. Yuxin, Z.; Huibang, H.; Shiyu, G.; Jianbing, T.; Wenting, T. Raindrop spectrum characteristics and Z-R relationship of different precipitation cloud systems in summer at the southern foot of Qilian Mountains. Arid. Zone Res. 2021, 38, 10. [Google Scholar]
  11. Xie, Y.; Chen, Z.; Dai, J.; Hu, P. Analysis of Raindrop Spectrum Characteristics of Several Types of Heavy Precipitation in Shanghai Area. Meteorol. Sci. 2015, 35, 353–361. [Google Scholar]
  12. Yang, J.; Chen, B.; Han, Y.; Li, P. Statistical characteristics of raindrop spectra in different regions of Shanxi Province. Meteorol. Sci. 2016, 36, 88–95. [Google Scholar]
  13. Zhao, C.; Zhang, L.; Liang, H.; Li, L. Analysis of Raindrop Spectrum Characteristics in Summer in Mountainous and Plain Areas of Beijing. Meteorol. Phenom. 2021, 47, 830–842. [Google Scholar]
  14. Ulbrich, C.W.; Lee, L.G. Rainfall Characteristics Associated with the Remnants of Tropical Storm Helene in Upstate South Carolina. Weather. Forecast. 2001, 17, 1257–1267. [Google Scholar] [CrossRef]
  15. Wang, J.; Zheng, L.; Wang, H.; Liu, C. Statistical characteristics and regional differences of raindrop spectra of six typhoon storms in shandong province. J. Appl. Meteorol. 2023, 34, 475–488. [Google Scholar]
  16. Zhu, H.; Yang, Z.; Wang, D.; Yu, J. Comparative analysis of precipitation characteristics of two typhoons entering inland areas. J. Meteorol. 2019, 77, 14. [Google Scholar]
  17. Shen, G.; Gao, A.; Li, J. Application of Raindrop Spectrum and Dual Polarization Radar Data in a Heavy Precipitation Process. Meteorological 2021, 47, 737–745. [Google Scholar]
  18. Feng, W.; Shi, L.; Wang, Z.; Huang, X.; Yang, L.; Zhang, L. Application of Raindrop Spectrometer Data in Rainfall Estimation of Typhoon Wipha. Meteorological 2021, 47, 389–397. [Google Scholar]
  19. Tokay, A.; Bashor, P.G.; Habib, E.; Kasparis, T. Raindrop size distribution measurements in tropical cyclones. Mon. Weather. Rev. 2008, 136, 1669–1685. [Google Scholar] [CrossRef]
  20. Okachi, H.; Yamada, T.J.; Baba, Y.; Kubo, T. Characteristics of Rain and Sea Spray Droplet Size Distribution at a Marine Tower. Atmosphere 2020, 11, 1210. [Google Scholar] [CrossRef]
  21. Lyu, J.J.; Xiao, H.W.; Du, Y.C.; Sha, L.N.; Deng, Y.Q.; Jia, W.K.; Niu, S.J.; Zhou, Y.; Pang, G.Q. Variations of Raindrop Size Distribution and Radar Retrieval in Outer Rainbands of Typhoon Mangkhut (2018). J. Meteorol. Res. 2022, 36, 500–519. [Google Scholar] [CrossRef]
  22. Suh, S.H.; Kim, H.J.; You, C.H.; Lee, D.I. Raindrop size distribution of rainfall system indirectly affected by Typhoon Kong-Rey (2018) passed through the southern parts of Korea. Atmos. Res. 2021, 257, 105561. [Google Scholar] [CrossRef]
  23. Jin, Q.; Yuan, Y.; Liu, H.; Shi, C.; Li, J. Analysis of Raindrop Spectrum Characteristics between Jianghuai in Summer. J. Meteorol. 2015, 73, 11. [Google Scholar]
  24. Chen, B.J.; Wang, Y.; Ming, J. Microphysical Characteristics of The Raindrop Size Distribution in Typhoon Morakot (2009). J. Trop. Meteorol. 2012, 18, 10. [Google Scholar]
  25. Battaglia, A.; Rustemeier, E.; Tokay, A.; Blahak, U.; Simmer, C. PARSIVEL Snow Observations: A Critical Assessment. J. Atmos. Ocean. Technol. 2010, 27, 333–344. [Google Scholar] [CrossRef]
  26. Niu, S.; Jia, X.; Sang, J.; Liu, X.; Lu, C.; Liu, Y. Distributions of Raindrop Sizes and Fall Velocities in a Semiarid Plateau Climate: Convective versus Stratiform Rains. J. Appl. Meteorol. Climatol. 2010, 49, 632–645. [Google Scholar] [CrossRef]
  27. Li, L.; Sun, H.; Yang, M.; Du, C.; Fan, X.; Lu, Y.; Yin, J. Raindrop spectrum quality control method based on speed and quantity thresholds. Meteorological 2022, 48, 8. [Google Scholar]
  28. Tong, L.; Kang, L.; Penglei, F. Observation and Study on the Characteristics of Wind and Rain Droplet Spectra on the Landing Platform [EB/OL]; China Science and Technology Paper Online: Beijing, China, 2020. [Google Scholar]
  29. Thurai, M.; Bringi, V.N.; May, P.T. Drop Shape Studies in Rain Using 2-D Video Disdrometer and Dual-Wavelength, Polarimetric Cp 2 Radar Measurements in South-East Queensland, Australia. 2009. Available online: https://ams.confex.com/ams/34Radar/webprogram/Paper155443.html (accessed on 10 August 2024).
  30. Zhang, G.; Vivekanandan, J.; Brandes, E.A.; Meneghini, R.; Kozu, T. The shape–slope relation in observed gamma raindrop size distributions: Statistical error or useful information? J. Atmos. Oceanic Technol. 2003, 20, 1106–1119. [Google Scholar] [CrossRef]
  31. Chang, W.; Wang, T.C.; Lin, P. Characteristics of the raindrop size distribution and drop shape relation in typhoon systems in the western pacific from the 2d video disdrometer and ncu c-band polarimetric radar. J. Atmos. Oceanic Technol. 2009, 26, 1973–1993. [Google Scholar] [CrossRef]
Figure 1. During the influence of Typhoon Noru from 25 to 29 September 2022, the hourly rainfall on Yongxing Island in Xisha was compared using data from the rain gauge (RG) and the OTT disdrometer. The correlation coefficient (CC), standard deviation (SD), absolute bias (ab.bia (%)) and root mean square error (RMSE) were used as metrics for comparison.
Water 16 02630 g001
Figure 2. (a) shows the reflectivity map of Typhoon Noru’s DRP (UTC: 20220927-S054505-E071737), with the RMW representing the diameter of the typhoon eye, approximately 60 km. (b) displays the typhoon reflectivity profile along the blue line. It can be observed that rainfall within the RMW is relatively low, with the main precipitation bands concentrated in the inner rainbands (<3 RMW) and the outer rainbands (>3 RMW).
Water 16 02630 g002
Figure 3. The 500 hPa geopotential height fields derived from ERA5 reanalysis data, depicting snapshots at various times: (a) 20:00 on 26 September, (b) 08:00 on 27 September, (c) 20:00 on 27 September, and (d) 08:00 and 20:00 on 28 September.
Water 16 02630 g003
Figure 4. Temporal evolution of (a) total raindrop concentration Nt / mm 1 · m 3 , (b) rainfall intensity R / ( mm · h−1), (c) mass-weighted mean diameter D m / mm , and (d) radar reflectivity factor Z (dBZ) during Typhoon “Noru” at Yongxing station from 25 to 29 September 2022. S1 indicates the phase when the typhoon center is approaching Yongxing Island but is more than 180 km away, representing the outer rainband (>3 RMW); S2 indicates the phase when the typhoon center is less than 180 km away from Yongxing Island, representing the inner rainband (<3 RMW); S3 indicates the phase when the typhoon center is moving away from Yongxing Island, more than 180 km away, representing the outer rainband (<3 RMW). The red lines in panel (a) mark the phase divisions, with red numbers indicating their corresponding times, where 26.2030 means 20:30 on the 26th and 27.0933 means 09:33 on the 27th.
Water 16 02630 g004
Figure 5. Temperature advection at 850 hPa at 08:00 UTC on 27 September 2022. The Chinese in the picture represents the place name where the equipment is located, and its position in the picture represents the location where the equipment is installed.
Water 16 02630 g005
Figure 6. (a) Mean raindrop spectra distribution for S1, S2, and S3 (solid lines) and their Gamma function fits (dashed lines); (b) scatter plot of generalized raindrop number concentration N w versus mass-weighted mean diameter D m , with the red solid line representing the regression line for stratiform rain by Bringi et al. [29].
Water 16 02630 g006
Figure 7. (a) Z-R relationship calculated from raindrop spectrum data during Typhoon “Noru” (The red line represents the Z-R relationship of Typhoon “Noru”, the green line is the classical Z-R relationship, cited from Fulton, and the green and blue dashed lines are cited from Zhang et al. [9]) and (b) μ - Λ relationship (The red line represents the results obtained from the study of Typhoon Oulu, the deep blue represents the results obtained by Zhang et al. [30] in statistical analysis of raindrop spectra that conform to gamma distribution, the green represents the results obtained by Chang et al. [31] in statistical analysis of typhoons in the western Pacific, and the sky blue represents the results obtained by Chen et al. [24] in analyzing the rainfall process of a single typhoon MORAKOT. From the results, it can be seen that the two studies on individual typhoons have similar results).
Water 16 02630 g007
Table 1. Average raindrop spectral characteristics at different precipitation stages of Typhoons Noru, RUMBIA, and LEKIMA.
TyphoonIntensity at Landfall (Through)Different StagesMean Concentration
(Nt/mm−1·m−3)
Mean Raindrop Diameter (Dm/mm)Rainfall Intensity
(R/mm·h−1)
NoruLevel 17,
Super typhoon
S2 (heavy precipitation)1457.21.5619.07
S1, S3 (weak precipitation)1240.71.1514.98
LEKIMALevel 16,
Super typhoon
Heavy precipitation686.00.9813.10
Weak precipitation259.80.802.60
RUMBIALevel 10,
Severe tropical storm
Heavy precipitation931.00.9213.76
Weak precipitation1161.00.602.52
Disclaimer/Publisher’s Note: The statements, opinions and data contained in all publications are solely those of the individual author(s) and contributor(s) and not of MDPI and/or the editor(s). MDPI and/or the editor(s) disclaim responsibility for any injury to people or property resulting from any ideas, methods, instructions or products referred to in the content.

