Abstract
As the scale of the marine economy continues to expand, the problems of environmental pollution and the over-exploitation of marine resources have become increasingly severe. The purpose of this study is to realize the sustainable growth of the marine economy, the rational utilization of resources, and the coordinated development of environmental protection. Method: This research first adopts the system dynamics (SD) model. It then uses the entropy method to weigh the evaluation indicators and create a coupling coordination degree (CCD) assessment simulation of the marine economic–resource–ecological environment. We use the created SD model to build and simulate four standard scenarios: current, economic, resource, and environmental. Finally, we propose suitable recommendations for the long-term development of the marine economy based on the coordination evaluation results of the CCD model. Results: Results show the following: (1) In the immediate term, the economic scenario is poorly coordinated, whereas the environmental scenario is more effectively coordinated. However, in the long-term development process, the resource scenario is reasonably well coordinated. (2) Priority attention must be given to improving the energy mix and protecting the natural environment to promote the sustainable development of the marine economy. (3) To achieve a virtuous cycle between marine economic development and environmental protection, governments, businesses, and all sectors of society need to work together to formulate and implement relevant policies and initiatives.
1. Introduction
With the global emphasis on sustainable development and the depletion of marine resources [1,2], people have become increasingly concerned about how to use and manage marine resources more effectively while protecting the marine environment [3,4,5,6]. China has large ocean areas, and the marine sector is a significant aspect of the country’s economic development [7]. According to the “2024 China Marine Economic Statistical Bulletin”, the national marine GDP reached CNY 9909.7 billion in 2023, accounting for 7.9% of the total GDP. However, the rapid development of the marine economy has led to problems such as overfishing and illegal fishing in some sea areas, resulting in the continuous depletion of marine resources and the deterioration of the ecological environment [8]. The excessive use of fossil fuels has negatively affected the environmental quality in China, and pollutants such as marine garbage and chemical wastewater have caused serious damage to the marine ecosystem and affected the development of marine industries [9]. The “2023 China Marine Ecological Environment Bulletin” reported that in 2023, 455 marine pollution sources in the country discharged approximately 7.76 billion tons of sewage, with an estimated 3.2 billion cubic meters of marine garbage dumped. Indeed, marine pollution has significantly impacted the development of China’s marine economy [10].
To promote the sustainable growth of the marine industry, China has passed numerous environmental and marine resource protection policies in recent years [11]. For example, the “Law of the Sea” and other relevant laws and regulations were promulgated, a marine management system was established, and the protection and rational use of marine resources were strengthened [12]. Many marine protected areas were also established to protect coral reefs, marine ecosystems, and marine biodiversity, as well as promote the restoration and protection of the marine ecological environment [13]. Measures were taken to strengthen marine pollution prevention and control, promote the building of a marine environmental monitoring network, strengthen cleanup emergency response capabilities for marine oil pollution, and ensure the cleanliness and safety of the marine environment [14]. Moreover, investments in marine scientific research have increased, marine scientific and technological innovations are being promoted, and marine resource survey and assessment capabilities have been enhanced to support the scientific and effective protection and consumption of marine resources.
However, scientific decision-making necessitates a thorough grasp of the economic, resource, and environmental subsystems as well as the key factors that interact with them under various policies [15]. On the one hand, the marine economic–resource–ecological environment (ERE) is a complicated system with several interactions. The system dynamics (SD) model can consider issues such as marine economic development, resource exploitation, and environmental preservation, aiding in the analysis of these elements and revealing the overall evolution law of the system. At the same time, the creation of the marine ERE system is typically a long-term process that must consider the impact and changes over various time periods. The SD model is suitable for long-term prediction and simulation, helping decision makers formulate sustainable development strategies and plans [16]. On the other hand, there are complex feedback mechanisms in the marine ERE system, and changes in a certain factor may cause reactions in other parts of the system [17]. The SD model can capture these feedback effects, help researchers understand the nonlinear characteristics of system behavior, and help avoid unexpected results. At the same time, the marine ERE SD model can provide a scientific basis for governments and management departments to support decision making and implementation. By simulating the effects of different policy measures, the model can evaluate their impacts on the marine economy, resource utilization, and environmental protection, providing decision makers with more comprehensive information [18,19].
2. Literature Review
The marine ERE system is affected by a variety of factors, such as the marine ecological environment, climatic factors, and marine topography, the interaction of which complicates the operation of the system [20]. A coupling coordination degree (CCD) analysis, which can vividly express the relationship between systems, has been widely used in the study of economic management. Various models have been used to analyze the coupling effect between multiple factors, including the environmental Kuznets curve (EKC), double exponential model [21], nonlinear dynamics model [22], coupling degree model, gray correlation degree analysis, dynamic coupling model, vector autoregressive (VAR) model [23], spatial regression model [24], and ArcGIS center of gravity curve optimization classification. Among these, the CCD model (CCDM) is notable for its simplicity and ease of calculation. It uses coupling degree to explain the interrelationship between several subsystems and employs the coordination development degree for a comprehensive evaluation of the whole system. Owing to its intuitive results, the CCDM has been widely used in empirical research on the coupling development level of various systems, including the environment, economy, social development, urbanization, agriculture, industry, transportation, population, across different scales and regions. To date, scholars have conducted various research on mathematical model construction, simulation, index construction.
First, the marine ERE system is complicated and characterized by numerous dynamic relationships. Various methodologies have been developed and implemented to analyze the performance and functioning of composite systems. The primary objective of these studies was to offer recommendations for system coordination, albeit with differing focal points. These studies can be categorized according to three aspects. First, an index system was established to assess the coordination level of composite systems. Luiz C Terra Dos Santos (2023) utilized a five-sector sustainable development model to evaluate the environmental, economic, and social factors of the circular economy across three economic blocs from 2000 to 2020 [25]. Jing Zhaorui (2020) used a complex network approach to create a system of evaluation indexes for sustainable growth that prioritizes social harmony, economic progress, and environmental enhancement. They conducted a dynamic system analysis of China’s RBC (Shuozhou) development process up to 2016. A comparison of individual social, economic, or environmental subsystems revealed that the entire socioeconomic environmental system exhibits the highest connectivity and information transfer efficiency [26]. Wang Yuanhui (2023) likewise developed an SD model for the ERE system. The model evaluated ERE system coordination under various trade-off scenarios by establishing and applying a CCDM based on weight ranking. Furthermore, the author optimized the ERE system in Xining, the largest city on the Qinghai–Tibet Plateau [27].
Second, researchers have developed numerous mathematical models to analyze the causes of important elements in complex systems. Liu Fan (2020) developed a co-equation model using data from China’s coastal regions between 2001 and 2020. The study investigated the relationship between marine environmental contamination, aquatic product commerce, and the coastal fisheries economy in China. A matrix correction framework was used to study the interplay of variables and determine their level of interaction [28]. In 2022, Sun Jing determined a way to establish the carrying capacity of marine ecosystems. He based the method on the analytic hierarchy process (AHP) and entropy theory to examine carrying capacity from different points of view. Between 2008 and 2017, a dynamic analysis was performed on data from Shandong Province [29]. Guo Jing (2022) used the energy-based model and data envelopment analysis to assess the marine economic efficiency of 11 coastal areas in China from 2007 to 2017. The researcher also looked at the spatiotemporal evolution trend of marine economic efficiency and built a spatial Durbin model to understand the relevant elements and mechanisms at work [30].
Third, other studies have focused on modeling and predicting dynamic outcomes for composite systems. SD is a common method to deal with such problems. Other research focuses on modeling and predicting dynamic outcomes for composite systems. Cao (2022) developed a framework for assessing integrated regional resource restoration, utilizing an SD model to simulate relationships in human–environment systems [31]. Based on data on Wuhan City from 2000 to 2015, Xing (2019) established a CCDM of ERE SD and power system coordination with an emphasis on the SD method [32].
In summary, although the ERE SD development method is often used to study the influencing factors, interactions, and dynamic changes of different complex systems, the study of marine ERE systems is rarely involved. The index system method of marine sustainable development assessment can effectively integrate multiple factors affecting the ERE system into a comprehensive index. However, this approach does not adequately reflect the dynamic interactions between these factors. The marginal contribution of this paper lies, first, in the prediction analysis of the coordinated development system of the marine ERE using the SD and CCD models, which enriches the theoretical research mechanism of the sustainable development of China’s marine economy. Therefore, the dynamic model of the marine ERE system is established in this study. Second, the evaluation model of the marine ERE CCD is established. Finally, this study provides feasible suggestions for the sustainable development of the marine economy.
In conclusion, research on marine ERE systems is rare despite the frequent use of the ERE SD development approach to study the influencing variables, relationships, and dynamic changes of many complex systems. While the indicator system approach of marine sustainable development evaluation may effectively incorporate many aspects influencing the ERE system into a single indicator, this method does not adequately capture the dynamic interactions among these components. To study the marine ERE system in depth, comprehensive dynamic models, system analysis, comprehensive evaluation, and other methods must be used to reveal the relationships and interactions between different elements. By establishing dynamic models, the changing trends in various elements in the marine system can be simulated and predicted, thereby providing a scientific basis for formulating effective management strategies and sustainable development planning. To achieve this goal, this work first developed a dynamic model of the marine ERE system, followed by a model for evaluating marine ERE coupling coordination. Finally, we present reasonable proposals for the steady growth of the marine economy.
The marginal contributions of this paper are as follows: (1) SD and the coupled coordinated development model are used to predict and analyze the coordinated development of the marine ERE system. The SD method can better reflect the internal structure and dynamic evolution of complex systems, while the coupled coordinated development model helps reveal the interaction and influence among different elements. (2) By combining these methods, researchers can more comprehensively consider the complex relationship between the marine economy, environment, and resources, as well as predict and evaluate the future development trend of the system. This comprehensive analysis method enriches the theoretical research mechanism of sustainable development of our country’s marine economy and provides a more scientific reference for relevant decision making. (3) The research results also help deepen the understanding of the coupled coordinated development mechanism in the marine field and provide new ideas for exploring the paths and measures to promote the sustainable development of marine ERE. Through system-level analysis and prediction, we can better grasp the regularity and sustainability of marine development and make deeper theoretical and practical contributions to the coordinated development of the marine economy and ecological environment.
3. Research Methods and Data Sources
3.1. SD Model
3.1.1. ERE System
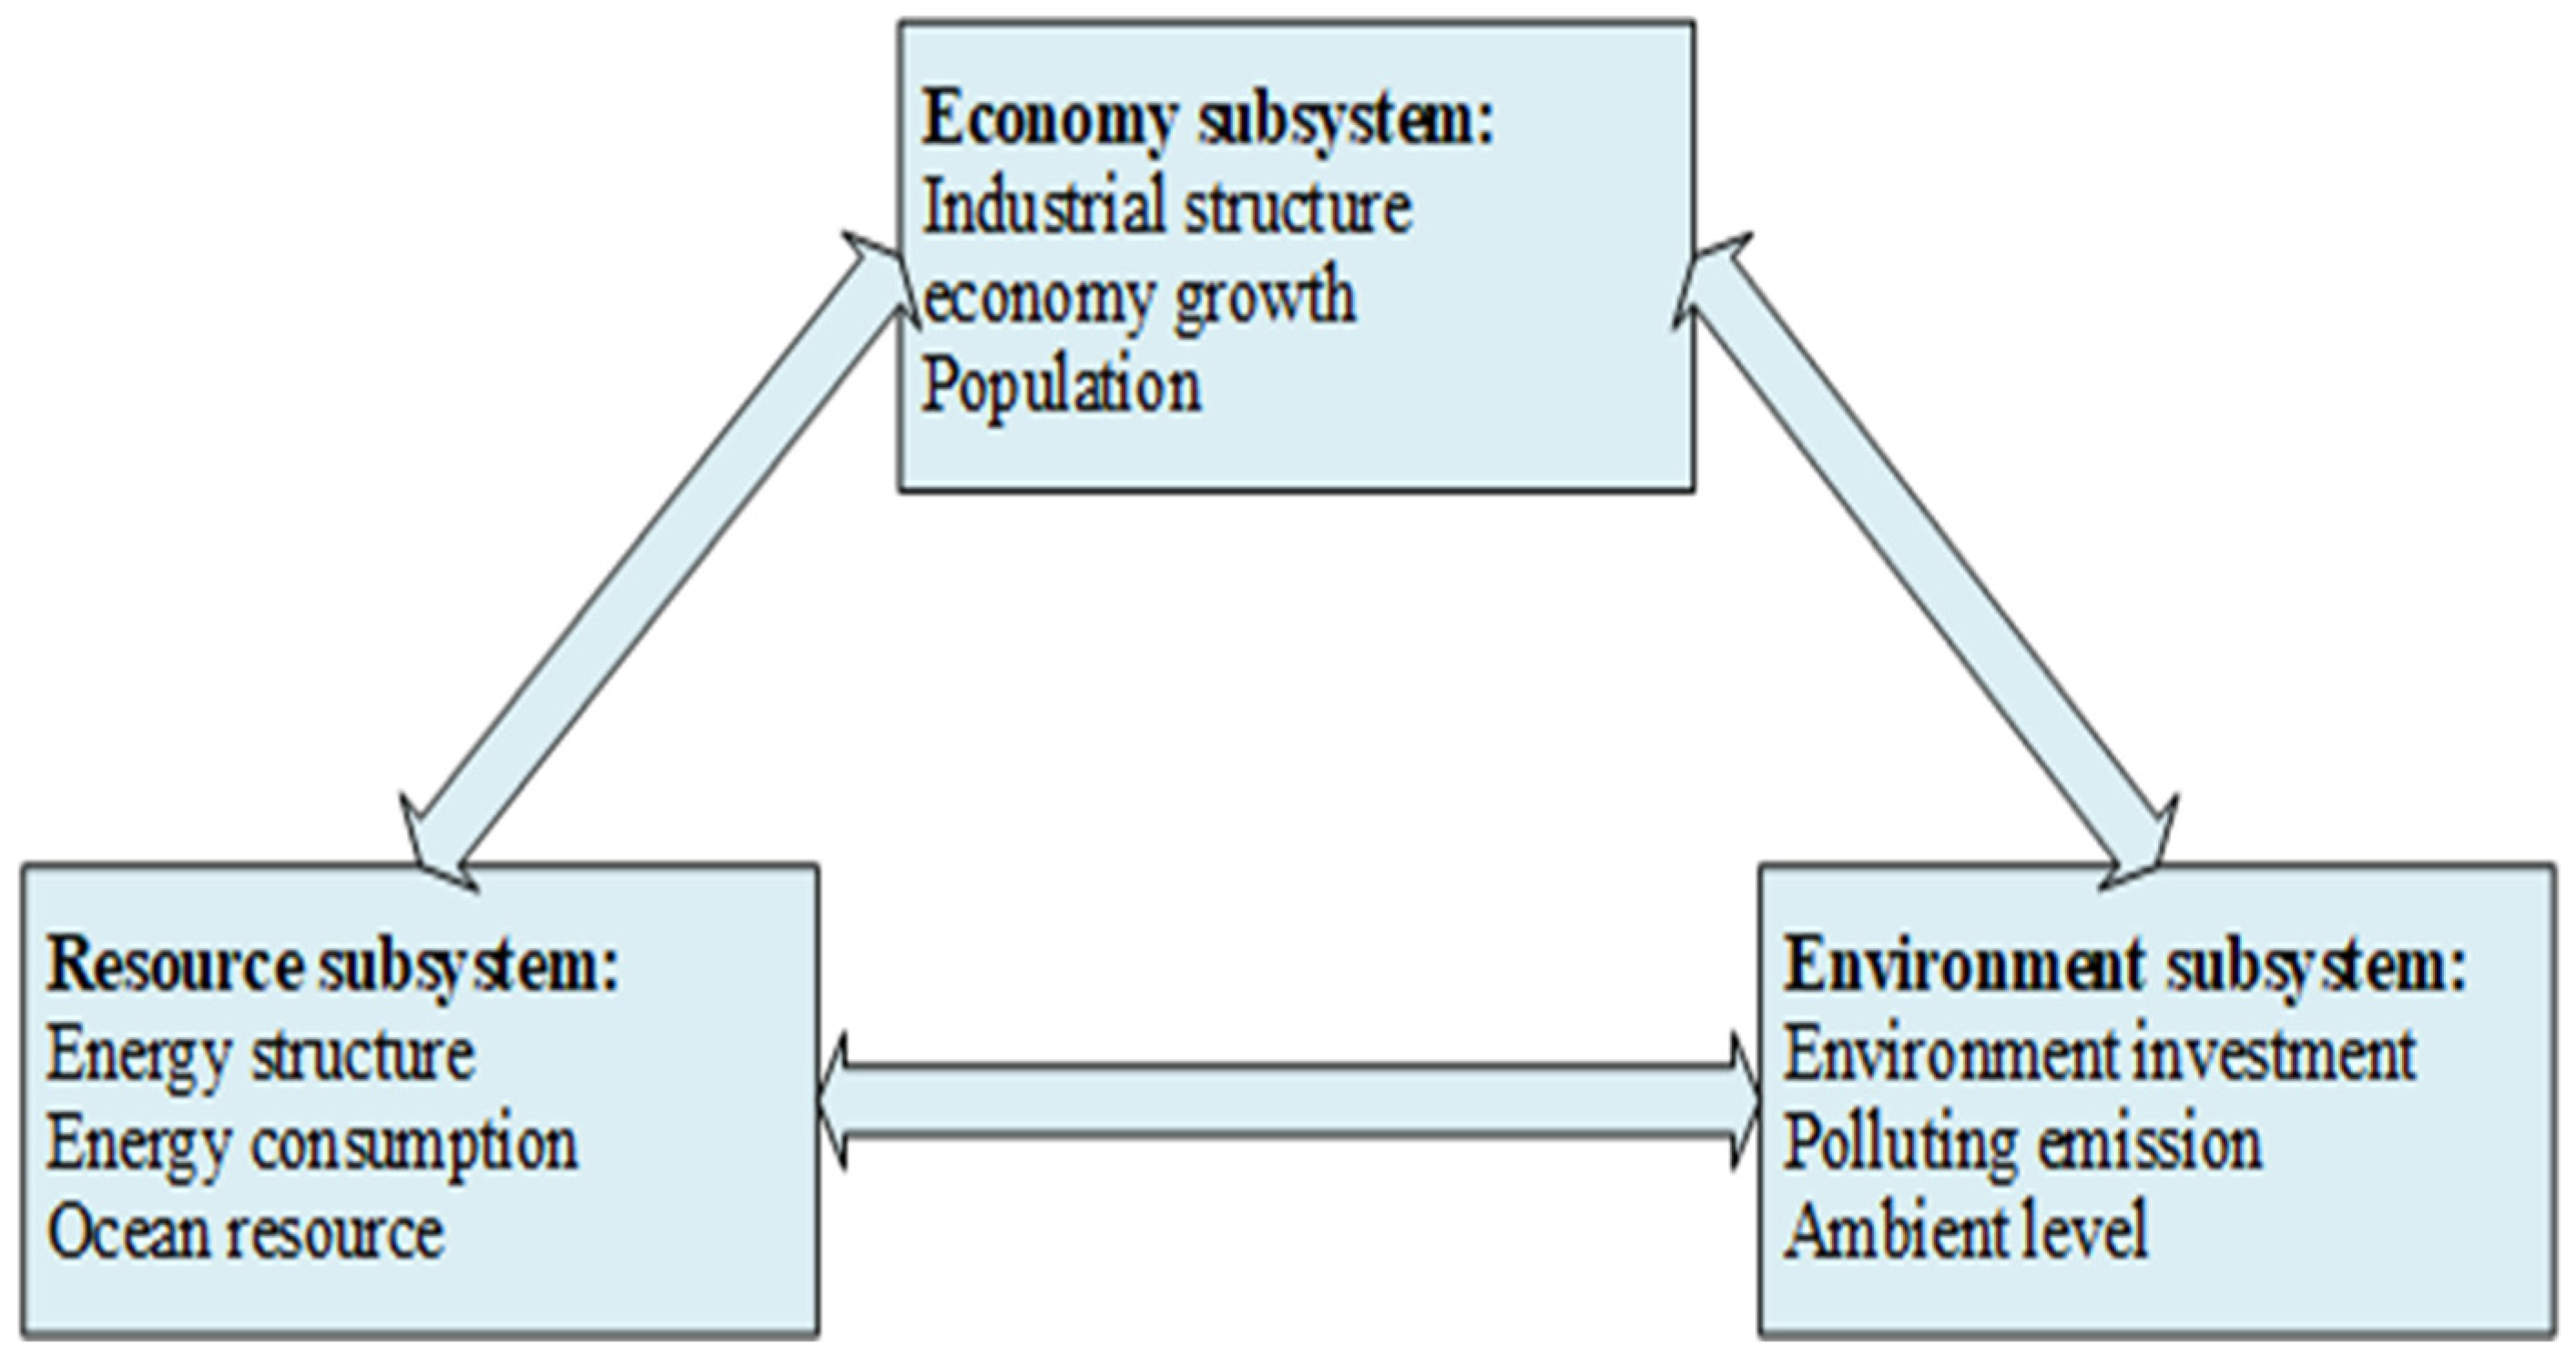
The marine ERE system considers the influence of diverse marine economic activities on the development and usage of marine resources and economic advantages, as well as the impact of these activities on the marine ecological environment and its sustainability assessment. When studying the marine ERE system, the complex interactions of various factors must be considered comprehensively. Marine economic activities involve many variables, including the marine industrial structure, marine economic growth, and the number of persons employed in the marine sector. These activities compete and clash with the development and exploitation of marine resources and have an impact on the marine environment, causing problems such as water quality deterioration and biodiversity loss. These influencing elements have a relationship (Figure 1).
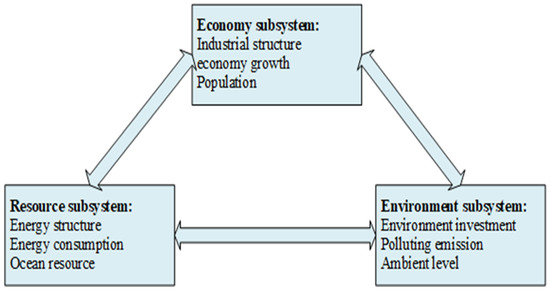
Figure 1.
Structure and main feedback sources of the marine ERE system.
The marine resource subsystem is a complex, multi-level system that includes a variety of resource types and ecological processes [33,34]. We further classify these subsystems into biological resources (e.g., fish, seaweed), abiotic resources (e.g., minerals, energy), and ecological service systems (e.g., coral reefs, wetlands). While marine resource extraction and use have provided enormous economic benefits, they have also caused significant environmental damage. The growth of marine resources, such as fishing, offshore oil and gas exploitation, and tourism [35], immediately provides a great number of jobs and helps many coastal towns. The expansion of marine resources has fueled the growth of corresponding industry sectors, including processing and manufacturing, shipbuilding, and port logistics, as well as the diversification and comprehensive development of the overall economy [36,37]. Marine resource products, such as seafood, minerals, and energy, are important parts of international trade, facilitating the flow and economic interconnection of global markets [38,39]. However, these factors have also caused ecological damage and marine environmental pollution [40]. For example, human activities such as offshore project construction, extraction activities, and pollution can destroy marine habitats (e.g., coral reefs, seagrass beds, mangroves), leading to a decline in biodiversity [41]. The extraction and burning of fossil fuels increase greenhouse gas emissions and exacerbate global climate change, causing marine environments to become more acidic and threatening coral reefs and shellfish [42].
The marine economic subsystem comprises the collection of economic activities and industries associated with the development and use of marine resources. It includes the development, use, and preservation of marine resources, as well as a wide range of economic and social activities [43,44]. The primary fields are fishery, shipping, marine energy, marine tourism, marine biological medicine, and marine mineral resources [45,46]. The marine economic system has not only aided economic and technological progress but has also contributed significantly to resource utilization, environmental protection, and sociocultural development [46]. Through integrated management and sustainable development strategies, marine economic systems will bring long-term, sustainable benefits to human society [47]. At the same time, various marine economic activities, such as fisheries, marine transportation, and marine energy development, provide numerous jobs for coastal communities and related industries, including fisheries, tourism, shipbuilding, and research. They also promote the development of many industrial chains; the growth of related industries such as manufacturing, information technology, and services; and the growth of local and national economies [48].
The marine environmental subsystem is a significant part of the marine economic system because it is dedicated to maintaining the marine ecological environment, monitoring marine ecological changes, managing marine pollution, and ensuring the sustainable use of marine resources. It includes a wide range of actions and initiatives, from natural ecosystem protection to the application of environmental management laws, all with the goal of preserving healthy and functional marine ecosystems to enable the long-term development of other marine economic activities. Xu (2023) and Xin (2022) conducted an analysis on the influence of marine energy consumption and economic growth on greenhouse gas emissions and climate change. They also investigated the importance of emission reduction policies and technological innovation in environmental protection [49,50]. Delphi Ward (2022) and Guo (2022) assessed the impacts of marine resource exploitation on ecosystems and biodiversity and explored strategies for sustainable resource management and conservation [51,52]. Sun (2022) and Zhou (2023) studied the impact of marine energy development on local jobs and economies and how it balances economic growth and social development with environmental protection [29,53]. The effective operation of the marine environmental subsystem is crucial for maintaining the marine ecological environment, ensuring the sustainable utilization of resources, and promoting the healthy development of the marine economy. Through scientific management and collaborative cooperation, we can achieve a virtuous cycle of the marine environment and economy and help build a sustainable marine economic system. These studies provide a scientific basis for understanding the environmental impacts of marine energy consumption and economic growth, providing important references for managers and policymakers to formulate sustainable development policies and conservation measures.
3.1.2. SD Model
The SD model is a mathematical modeling method for investigating the behavior of dynamic systems. It can help us understand and predict the interactions and evolutionary laws between various elements in complex systems and has many advantages: (1) Comprehensive analysis: The SD model can comprehensively consider the complex relationship between marine economic activities, resource development and utilization, and environmental protection. By establishing a mathematical model, it reveals the causal relationship among various elements and helps managers fully understand the system operation mechanism. (2) Predictive analysis: SD can make a dynamic model of the marine ERE system, which can then be used to compare how different policies and measures affect system development, predict future development trends, and give a scientific basis for decision-making. (3) Sensitivity analysis: SD can analyze the impact of changes in system elements on stability and sustainability, identifying critical factors and weak links. (4) System optimization: Using the SD model, solutions may be compared and optimized across many scenarios to determine the best development route and accomplish the coordinated growth of the marine economy, resource exploitation, and environmental protection. (5) Decision support: The SD model is a systematic decision support tool that can assist government departments and firms in developing long-term development plans and management policies for the sustainable growth of the marine ERE system. As a result, it has considerable application prospects in evaluating the sustainable development of the marine ERE, helping us better understand and deal with complex challenges in the marine system while also promoting sustainable growth in the marine field.
3.1.3. VENSIM-PE Software
This research project applies the SD modeling software Vensim-PE (http://vensim (accessed on 12 July 2024) to determine the interaction of various factors in the marine ERE system, as well as simulate the influence of current ERE settings on the long-term development of China’s marine economy. We use data from 2011 to 2020 as samples and extend the simulations to 2050. In that example, the time boundary of the model is in the 2011–2050 period (i.e., 40 years) with a step length of one year. Furthermore, the SD model produces reliable and accurate findings through a comprehensive and scientific modeling approach.
3.2. Evaluation of the Coupling Coordination Degree
3.2.1. Data Source and Pre-Processing
We gather statistics for this research from the China Fishery Statistical Yearbook (2010–2022), China Marine Statistical Yearbook (2010–2022), and China Urban Statistical Yearbook (2010–2022). Using the two formulas below, we standardize the indicators to make conclusions comparable and avoid the effect of dimensions.
(1) Raw data preprocessing
Quantifying the original data is an important step in building a CCDM. The main reasons are as follows: first, the original data often have different scales and units. Through quantification, different data types can be unified into the same standard range, which is conducive to the comparison and analysis of the model. Second, the original data may have missing values, outliers, and other problems. Through quantification, the impact of these problems can be reduced, and the stability and reliability of the model can be improved. Finally, quantification can reduce the data dimension and number of features, thereby reducing the time and computational cost of model training
Positive indicator:
Negative indicator:
where maxXj and minXj are the maximum and minimum, respectively, of indicator j in all years; Xij and rij are the original and standardized values of indicator j in year i. A positive indicator implies that a higher value corresponds to a more favorable outcome for the system’s development, and vice versa.
(2) To assure accuracy in data processing, zero values in the data after standardized processing must be eliminated. Therefore, a global translation operation on the data is required, that is, each data point is redefined as X′ij = x′ij + α. To maximize the retention of the original data information, the value of α should be as small as possible, because when the value of α is small, the response of the system is more stable. By reducing the value of α, the sensitivity of the model to the input data can be reduced, and system fluctuation in the face of noise or uncertainty can be reduced, thereby improving the stability of the model. For this reason, we choose α = 0.0001 in this study.
Proportion (P) of indicator j in year i:
Information entropy (e) of each indicator j:
Entropy redundancy (e) of each indicator j:
Weight (W) of each indicator j:
Evaluation of level (L) of indicator j in year i:
Comprehensive level (CL) of subsystem in year i:
In a subsystem, we use either Formula (1) or (2) to compute rij, where n represents the number of indicators, and m represents the number of years. We use Formulas (3) and (4) to calculate the weights for each indication and apply Formulas (7) and (8) to calculate the total level of each subsystem.
3.2.2. Coupling Coordination Degree Model
The CCDM is a model that can describe the overall operating characteristics of the system by considering the interactions and influences among various subsystems in system analysis and design. This model can not only reveal the relationships among various subsystems but also evaluate the overall performance and efficiency of the system. The main reasons for choosing the CCDM in this study are as follows: (1) There are complex relationships and interactions among the marine ERE. The various parts are coupled with one another, and changes in one part will have an impact on other parts. Therefore, the CCDM can better reveal the internal connection and influence mechanism between them. (2) The development of the marine ERE system is a dynamic process. With the passage of time, the status and relationship of each element will change. The CCDM can dynamically simulate the system and better reflect the process of system evolution. (3) The CCDM can comprehensively evaluate the marine ERE system, including its stability, sustainability, and coordination. Through CCDM evaluation, scientific basis and reference suggestions can be provided for relevant decision making. (4) The CCDM can be used for system analysis and evaluation and provide decision support and policy suggestions for relevant managers and decision makers. Through simulation and evaluation, paths and measures can be provided for the coordinated development of the marine ERE system [54,55]. The standard formula below shows the CCDM for three subsystems [56,57,58]:
where C denotes the connection degree, and f (X), g (Y), and h (Z) represent the comprehensive levels of the marine economy, resource, and environment subsystems, respectively. Sias calculates the values of f(X), g(Y), and h(Z), as shown in Formula (8). D is the CCDM, and T is the overall development of the maritime ERE system, including subsystem contributions. The research presented here assigns equal priority to each subsystem in the coordinated development of the marine ERE system, resulting in α = β = γ = 1/3.
Often, scholars subjectively categorize the CCDM into different levels after calculation. In this study, the quartile method is utilized for CCDM classification, which may provide a more objective approach to assessing CCDM levels. Table 1 displays the breakdown of the CCDM based on this method.

Table 1.
The division of the development stages of the marine ERE system is important.
3.2.3. Indicator Construction
Based on our previous investigation and the SD model framework we developed, we establish an index system to comprehensively assess the development level and coupling relationship of each subsystem within the marine ERE system. On the one hand, indicator selection should ensure that the evaluation indicators can cover the key elements of each subsystem of the marine ERE system to reflect its overall development status; on the other hand, the mutual influence and correlation between different indicators should be considered to avoid selecting independent or highly repetitive indicators and thus fully reflect the coupling relationship within the system. Table 2 shows the indicator architecture, which includes 19 indications. The marine economic subsystem shows how developed the marine economy is through four indicators: the total value of the marine environment’s output, the pattern of the marine industry’s three sectors, and the fund income of marine academic institutions [59]. The marine resources subsystem measures the development potential of marine resources using indicators such as aquaculture area, wetland area, marine fishing output, marine aquaculture output, and sea salt production. The marine environmental subsystem reflects the growth status of the marine environment through indicators such as the direct discharge of a large amount of industrial wastewater into the marine environment, the amount of wastewater outlets discharged into the ocean, the types of marine nature reserves in coastal areas, and storm tide disaster areas (Table 2).
Table 2.
The indicator system used to assess the CCD of the marine ERE system.
4. The Modeling of the SD Model of the Marine ERE System
4.1. The Conceptualization of the Marine ERE System
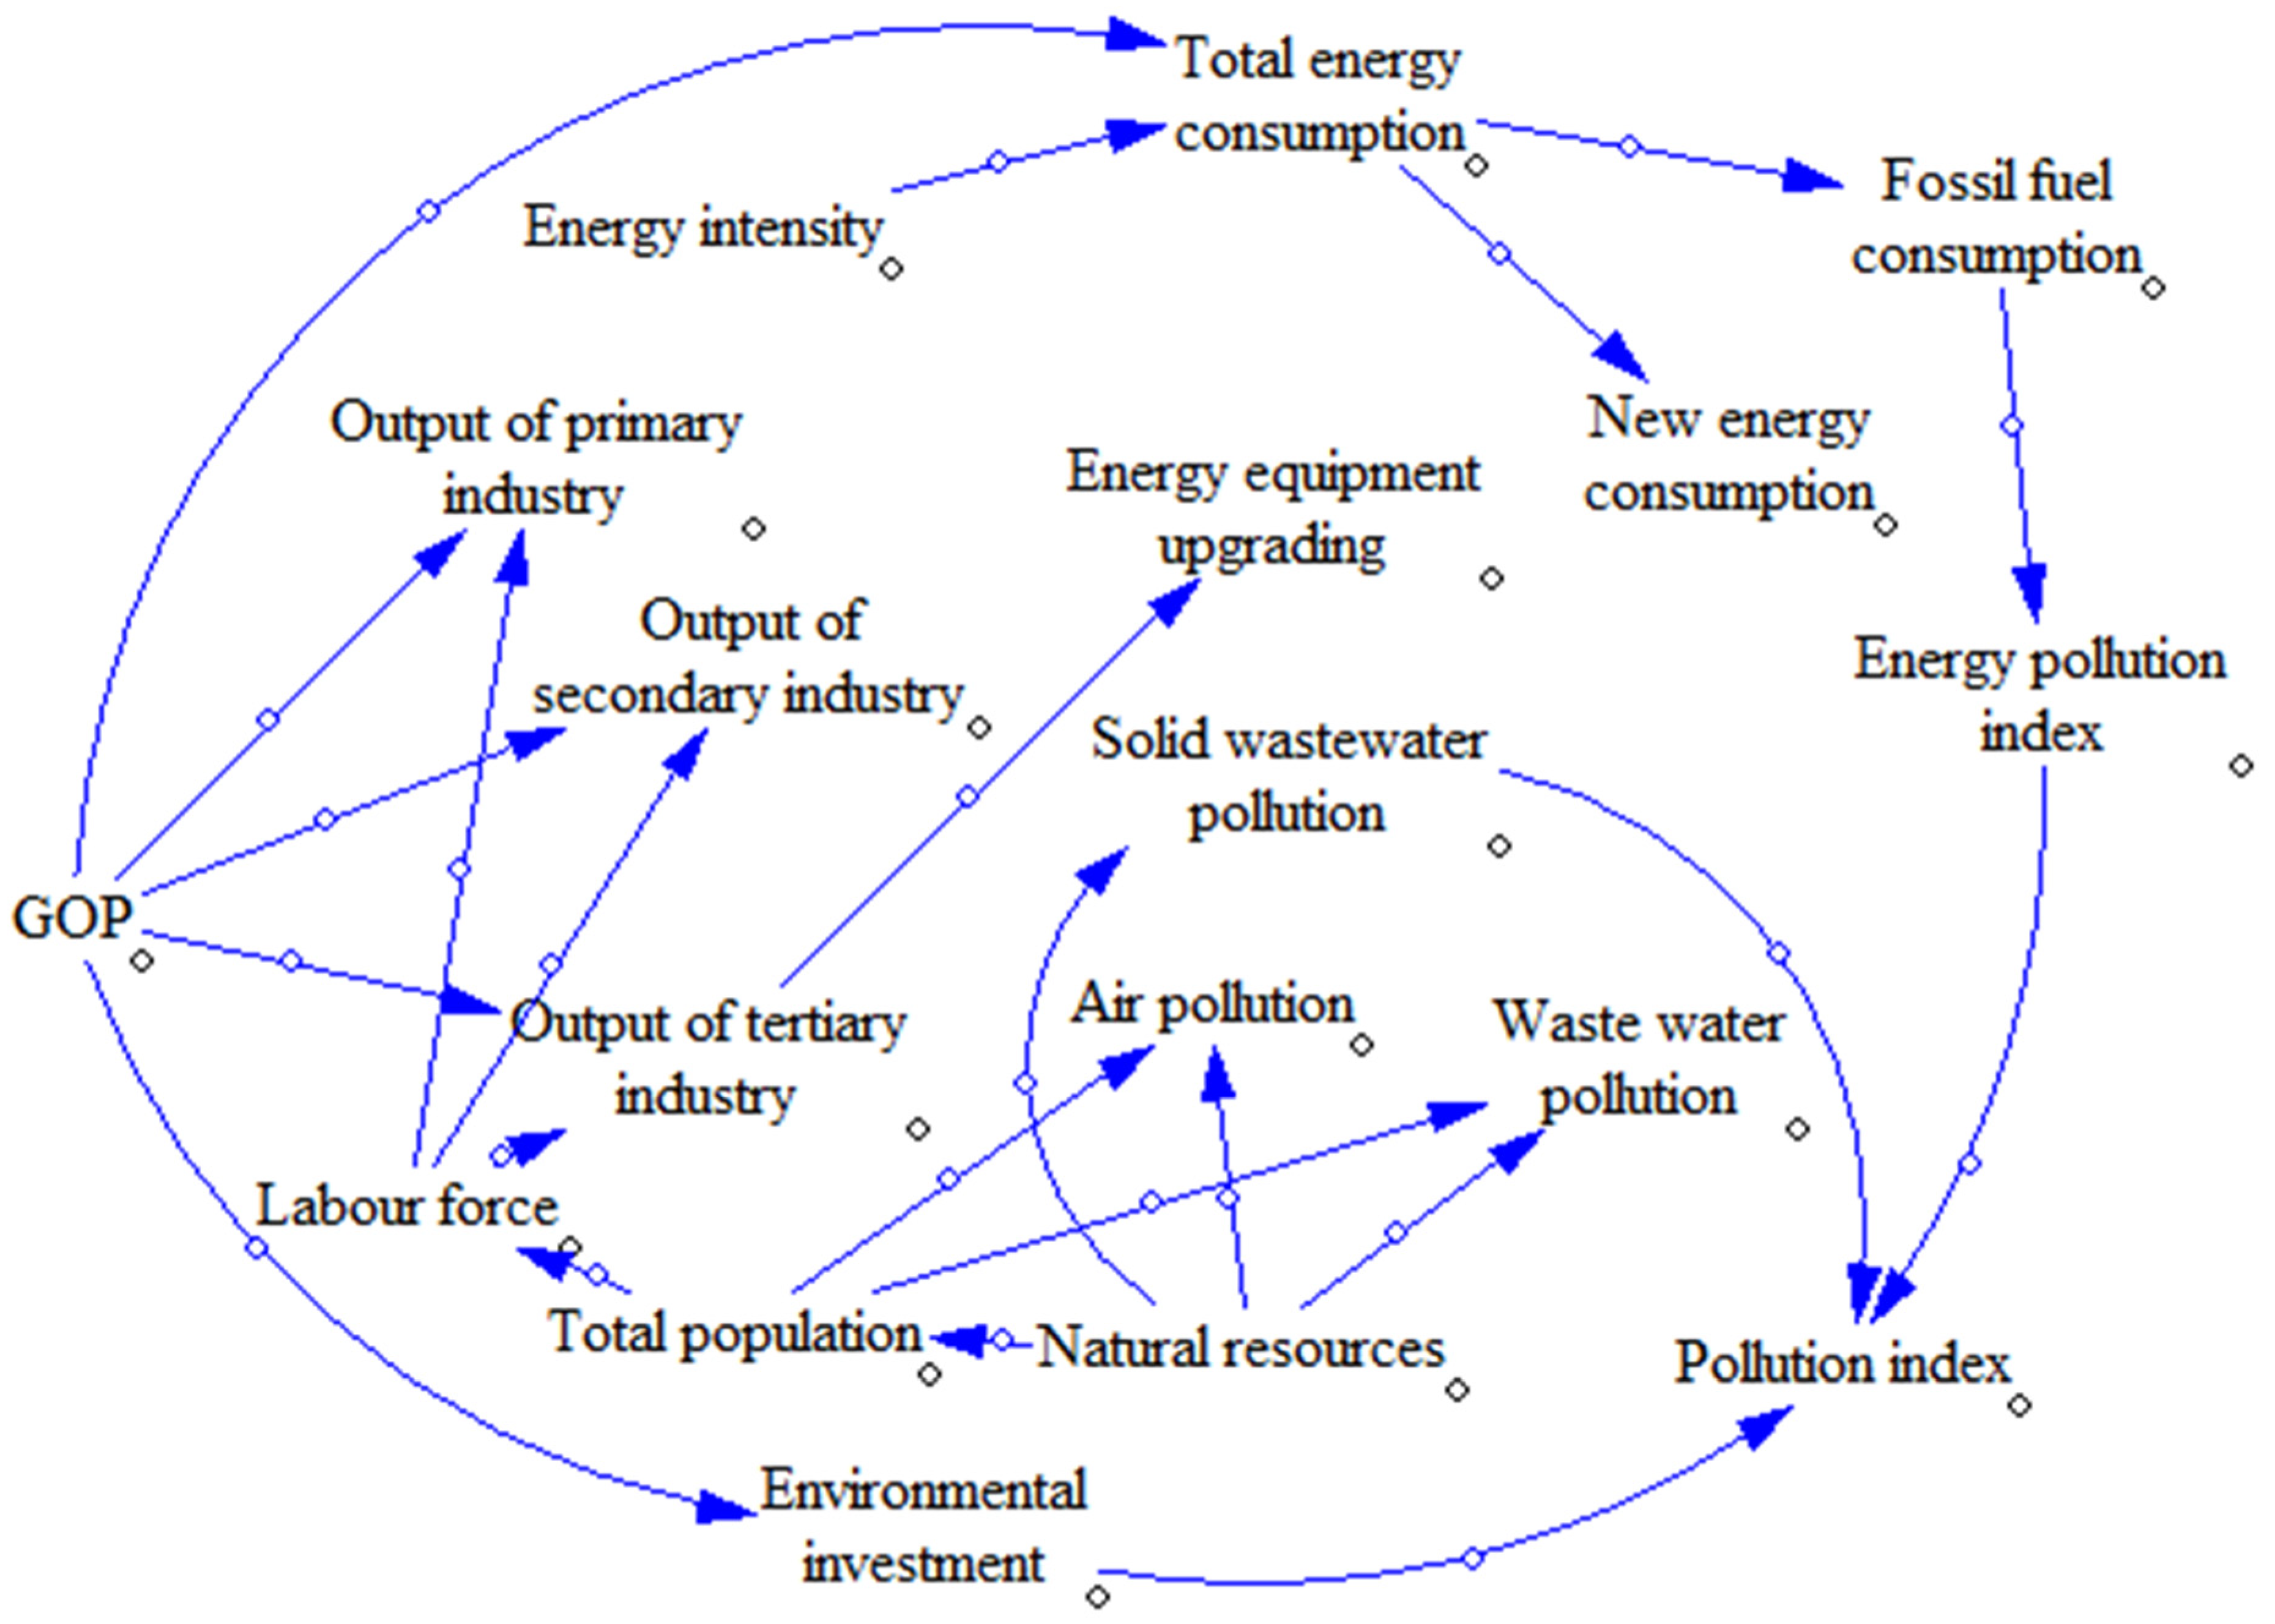
Based on the above discussion of the marine ERE system structure, the SD model of the coupled and coordinated development of China’s marine ERE is built using VENSIM, and a causal relationship diagram is drawn (Figure 2).
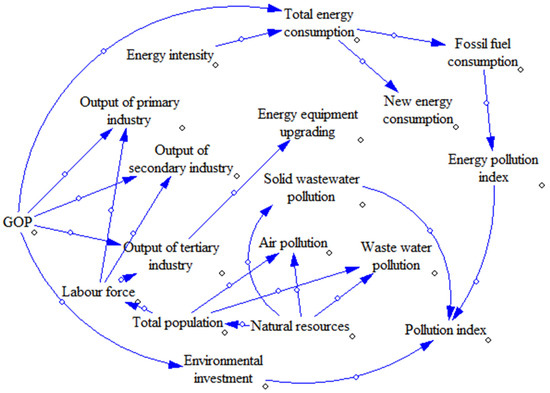
Figure 2.
Causal loop diagrams of the marine ERE system.
The causal relationship diagram contains three core elements: economy, resources, and environment. The marine economy, comprising the marine primary, marine secondary, and marine tertiary industries, forms the core of this causal relationship diagram. Labor and capital have an impact on the development of the marine industry. The development of the marine secondary industry may result in high pollution. The current study identifies a feedback loop between marine economic development, energy consumption, and environmental pollution. Another path shows the opposite process. The declining state of the marine environment could hinder the growth of the marine economy or endanger human health. However, boosting investment in maritime environmental protection or streamlining the industrial structure can help bridge the gap between economic development and environmental protection. The response path is as follows: marine environment, energy consumption, and marine economic development.
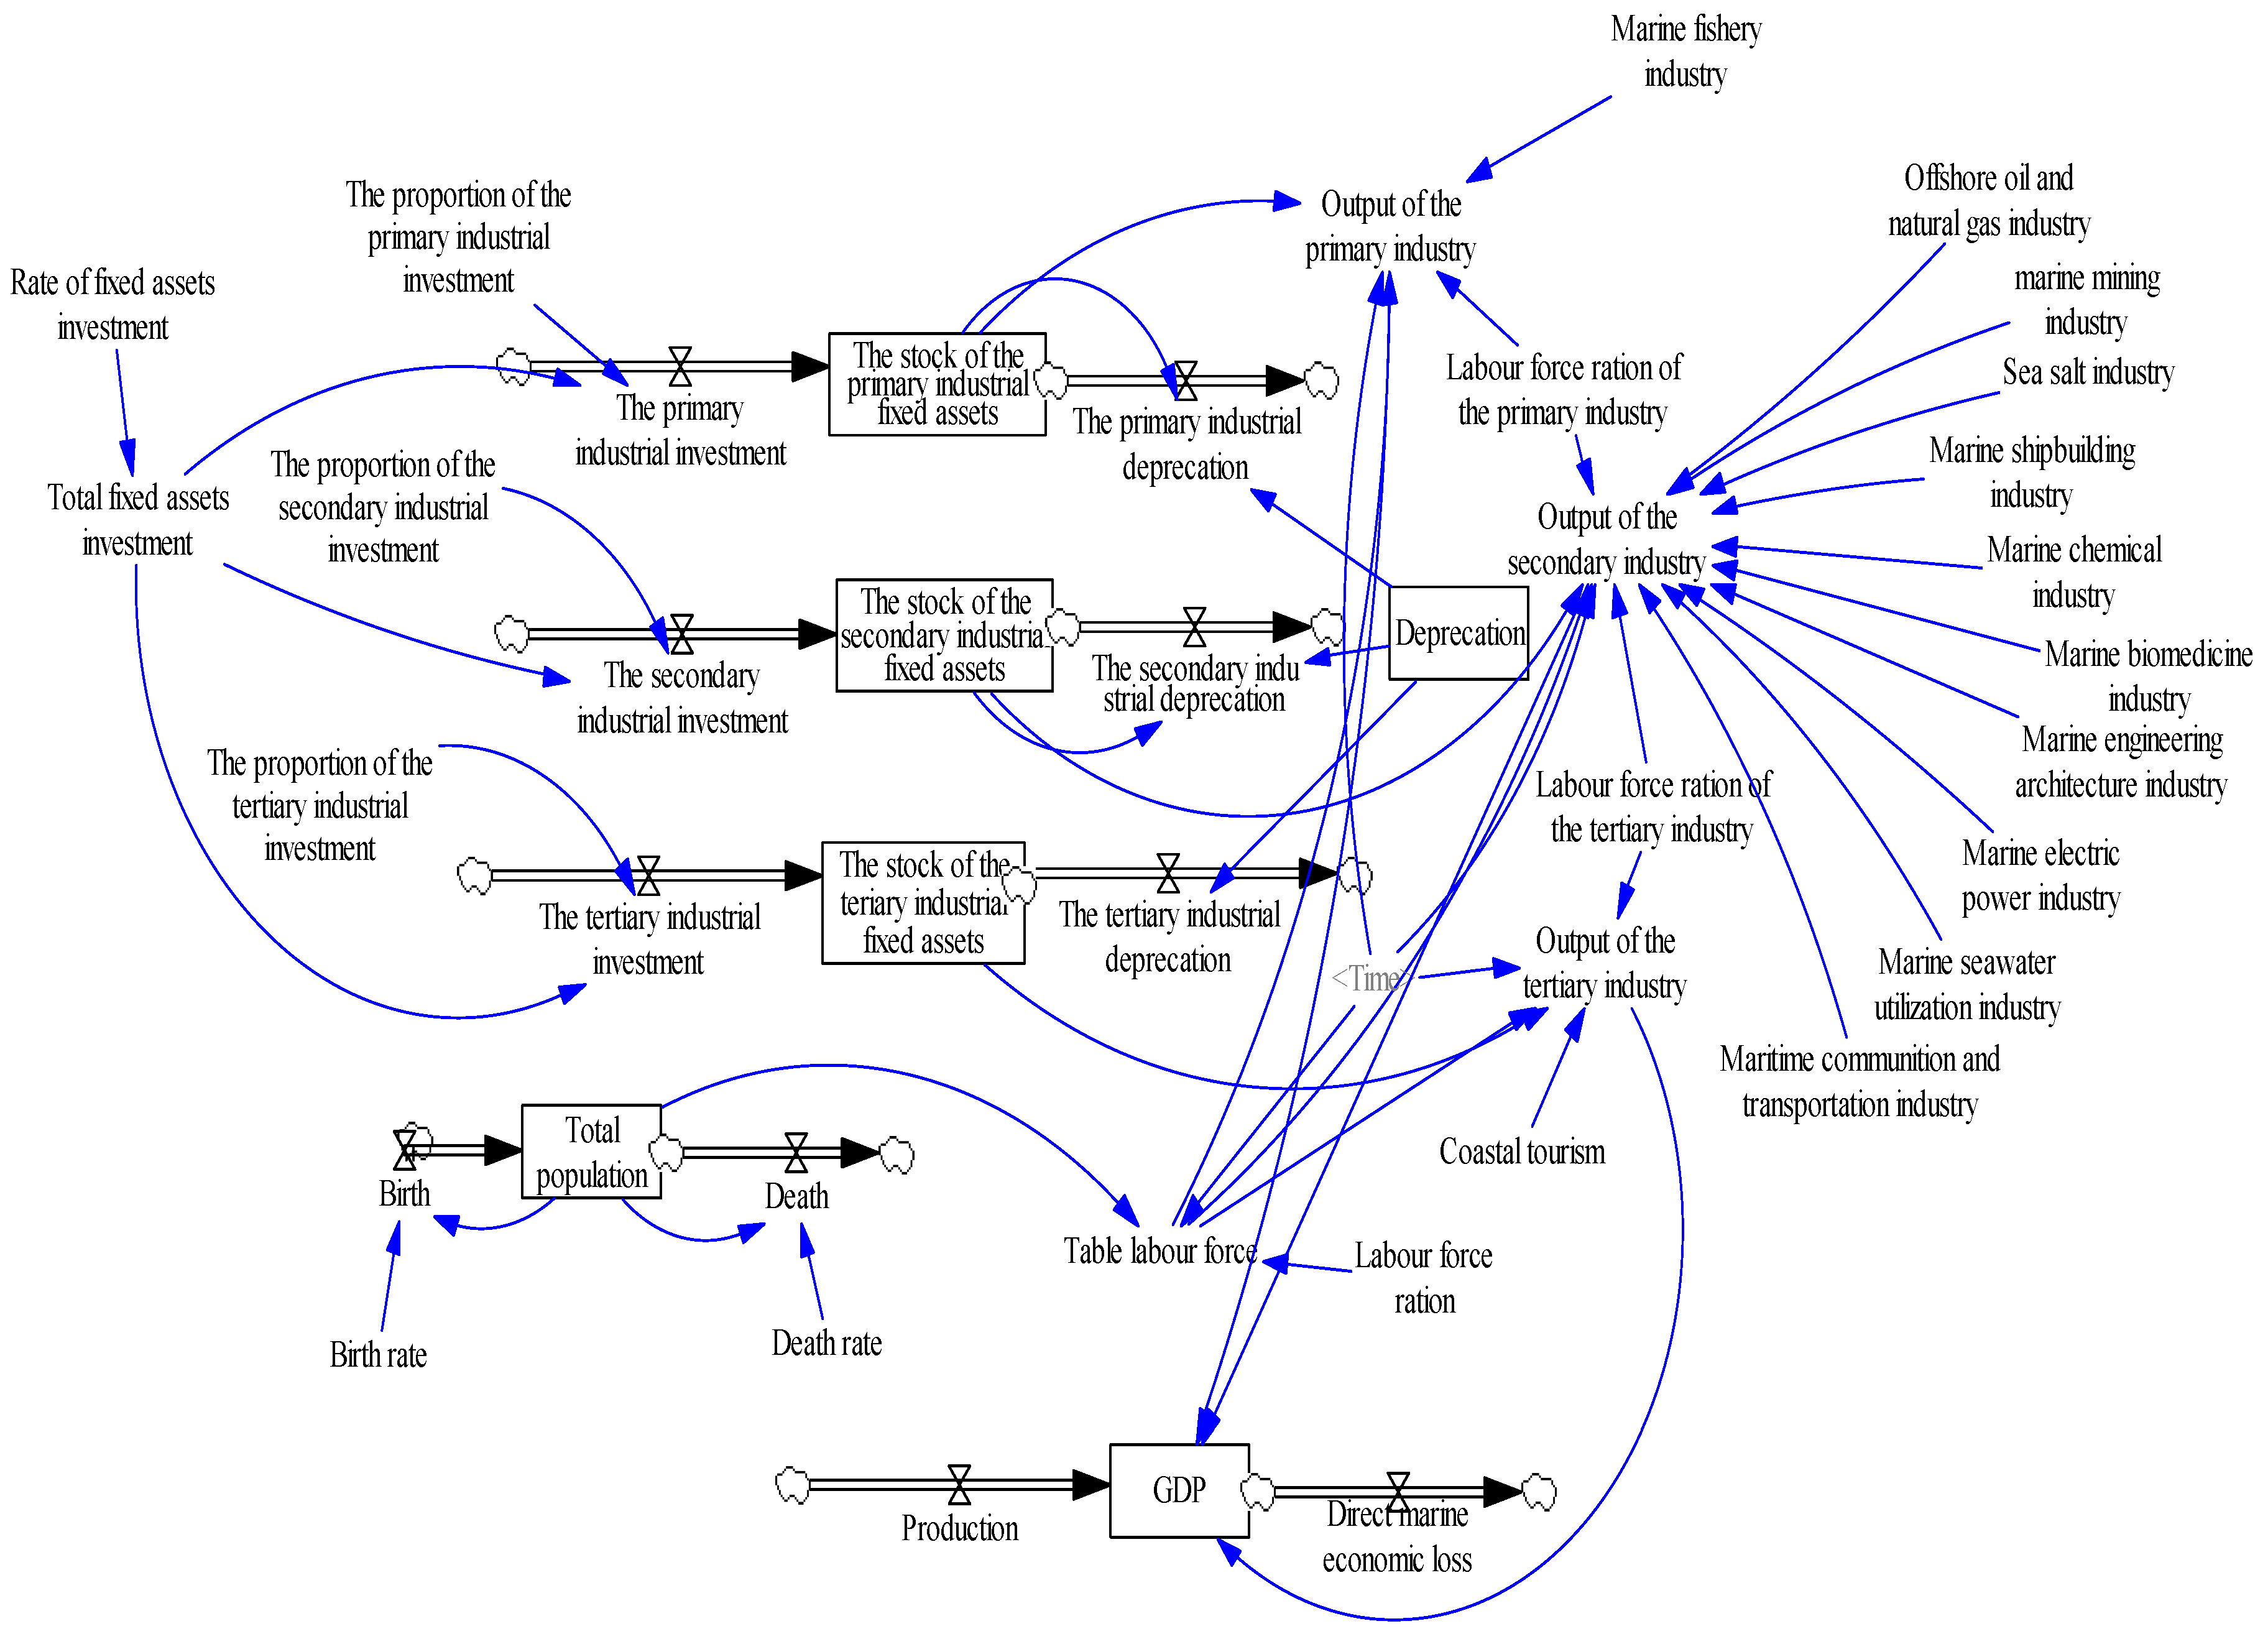
4.2. Establish Stock Flow Diagram (SFD)
The stock flow diagram (SFD) is a commonly used graphical tool in the SD method, used to describe the relationship between the stock and flow of various factors in the system. In the SFD, the stock represents the amount of material or information accumulated in the system, while the flow represents the flow rate of these materials or information. Through the SFD, we can clearly see the interaction between elements in the system, which helps us better understand the behavior and change trends in the system. The SFD helps reveal the cause-and-effect relationship in the system and provides an important reference for formulating effective policies and decisions. Based on the cause-and-effect relationship in Figure 2, the SFDs of the economic, environmental, and resource subsystems were established, respectively, in Figure 3, Figure 4 and Figure 5.
(1) Economic subsystem
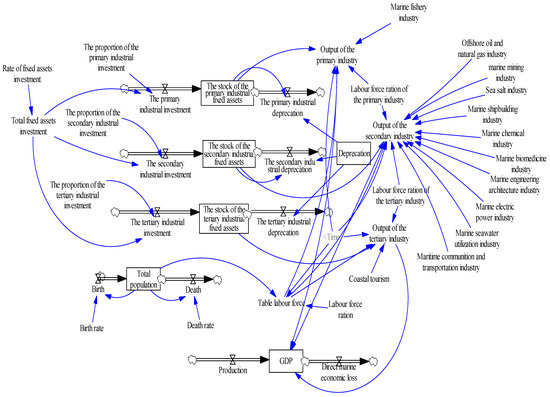
Figure 3.
The SFD of the marine economy subsystem.
Figure 3.
The SFD of the marine economy subsystem.
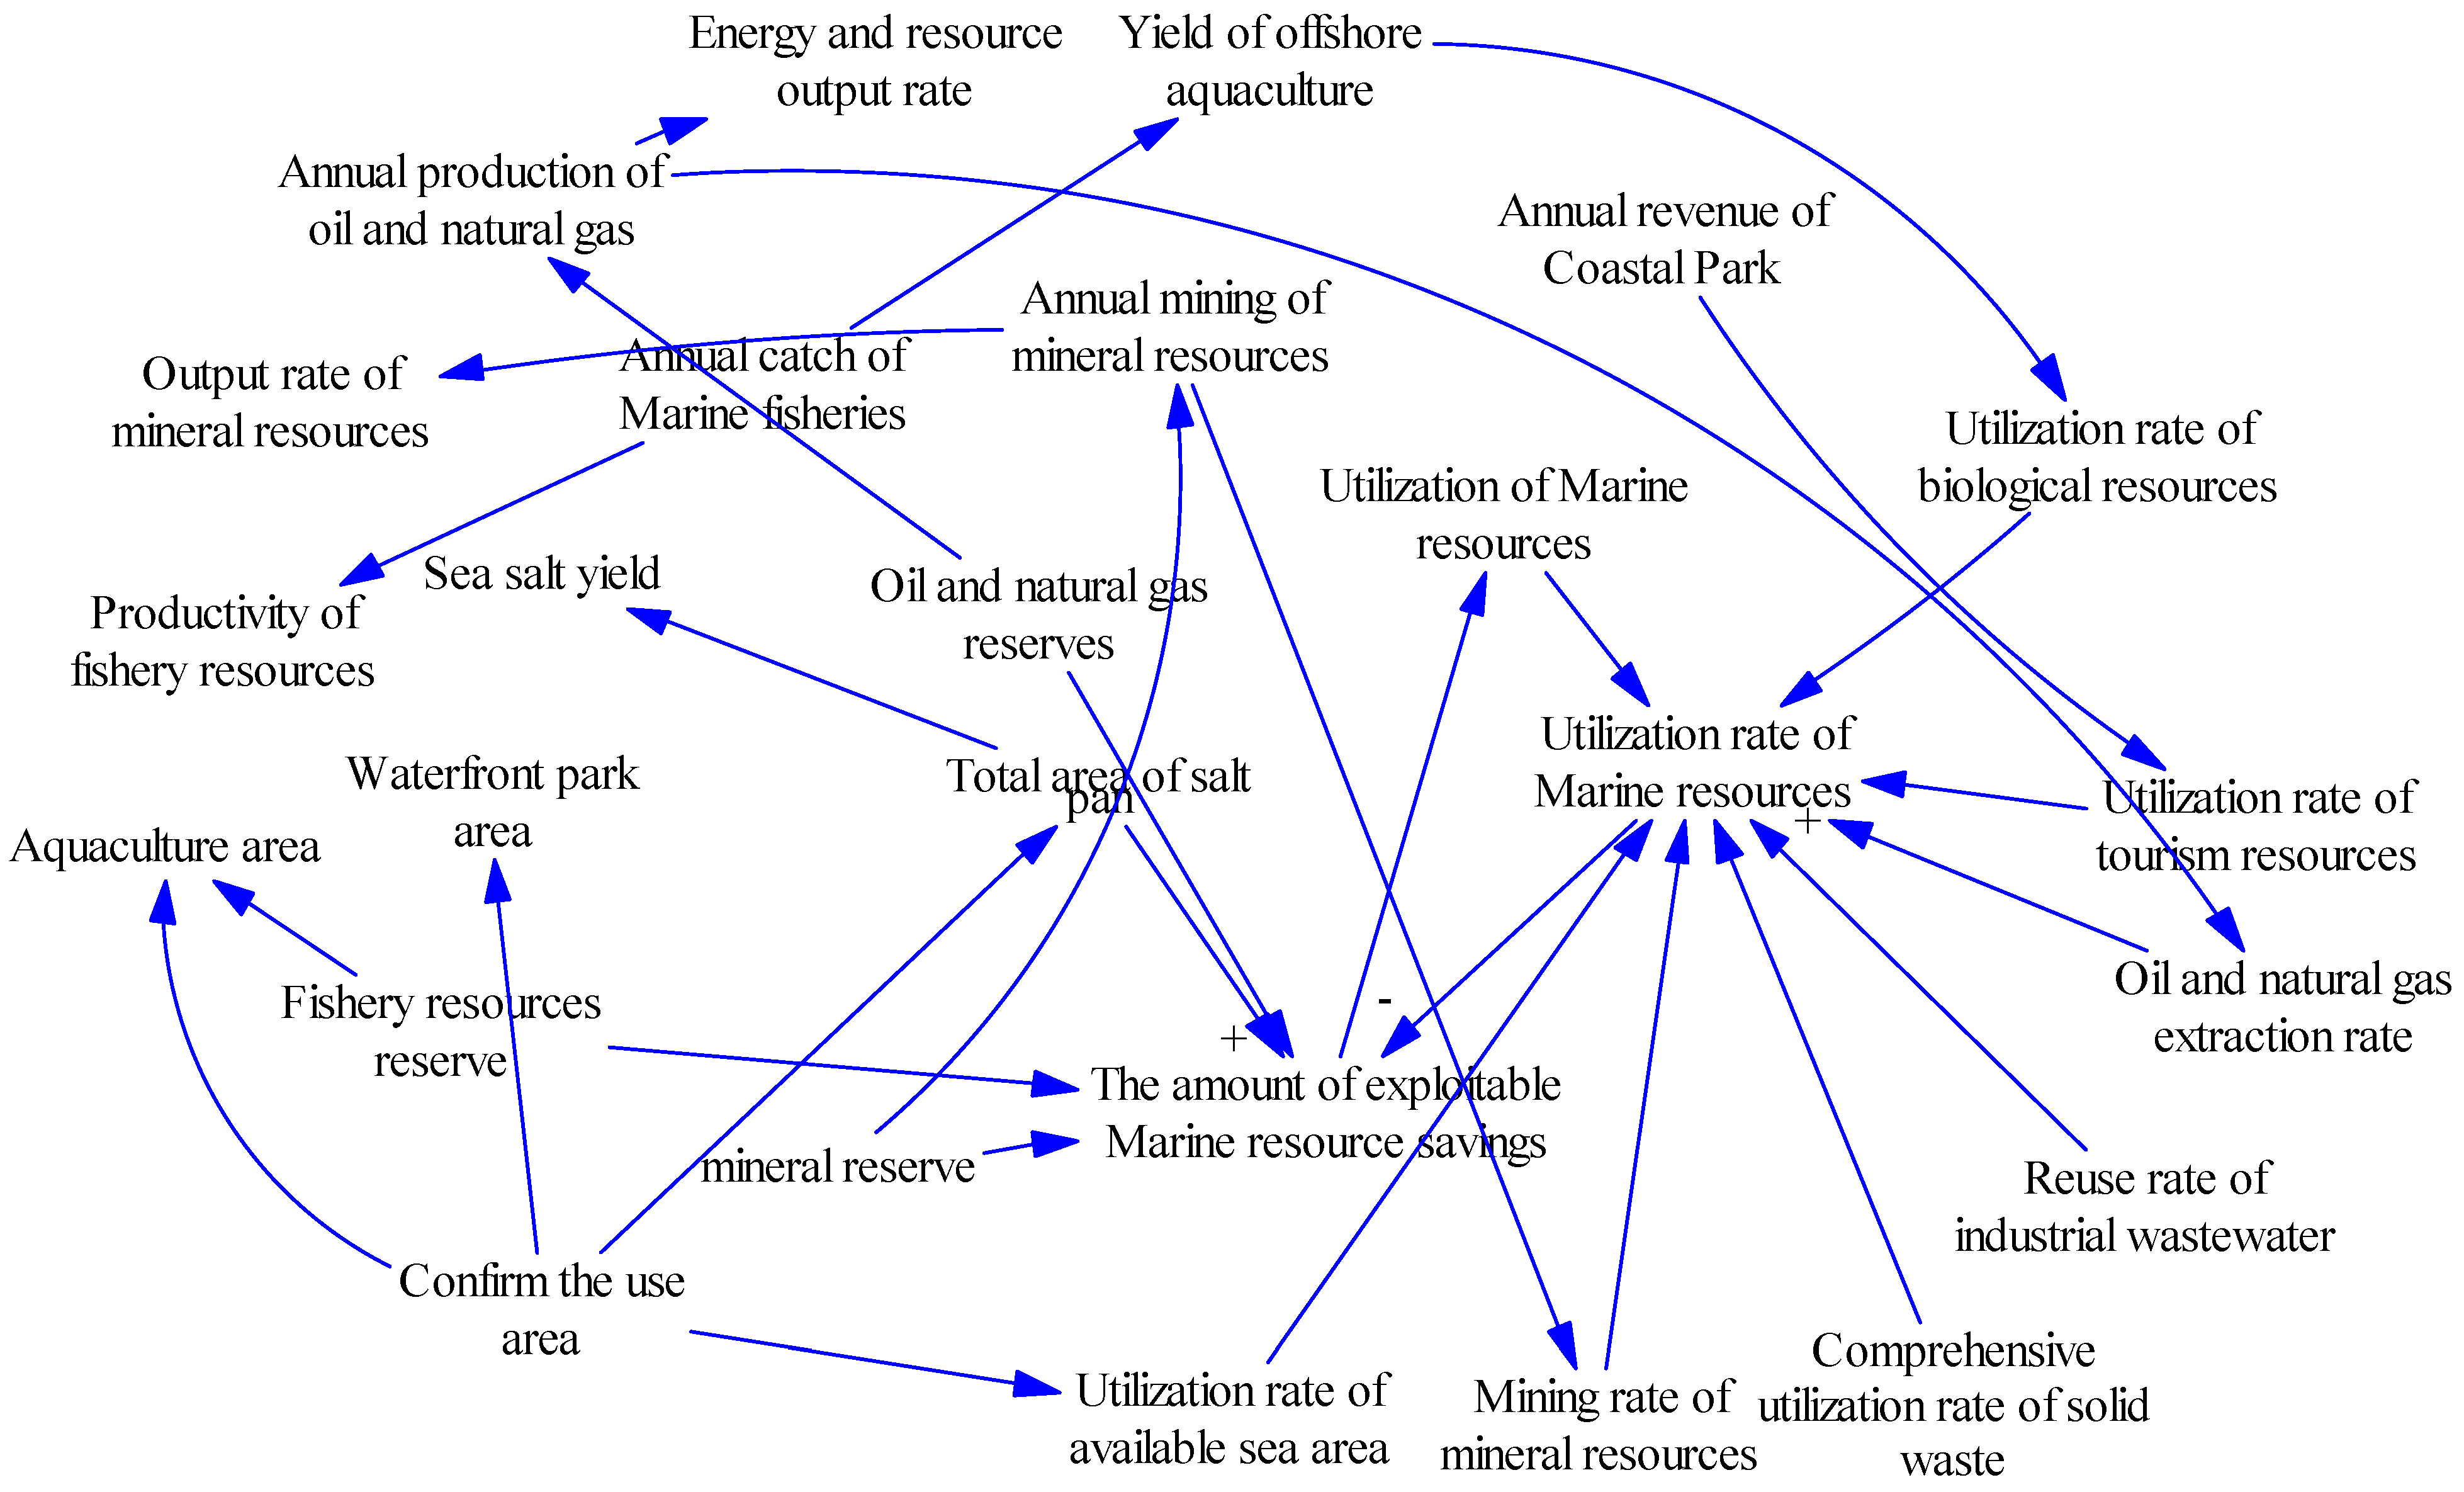
(2) Resource subsystem
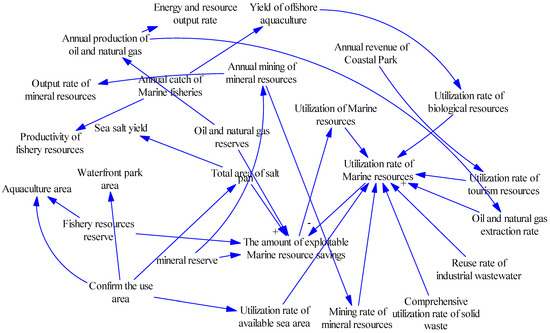
Figure 4.
The SFD of the marine resource subsystem.
Figure 4.
The SFD of the marine resource subsystem.
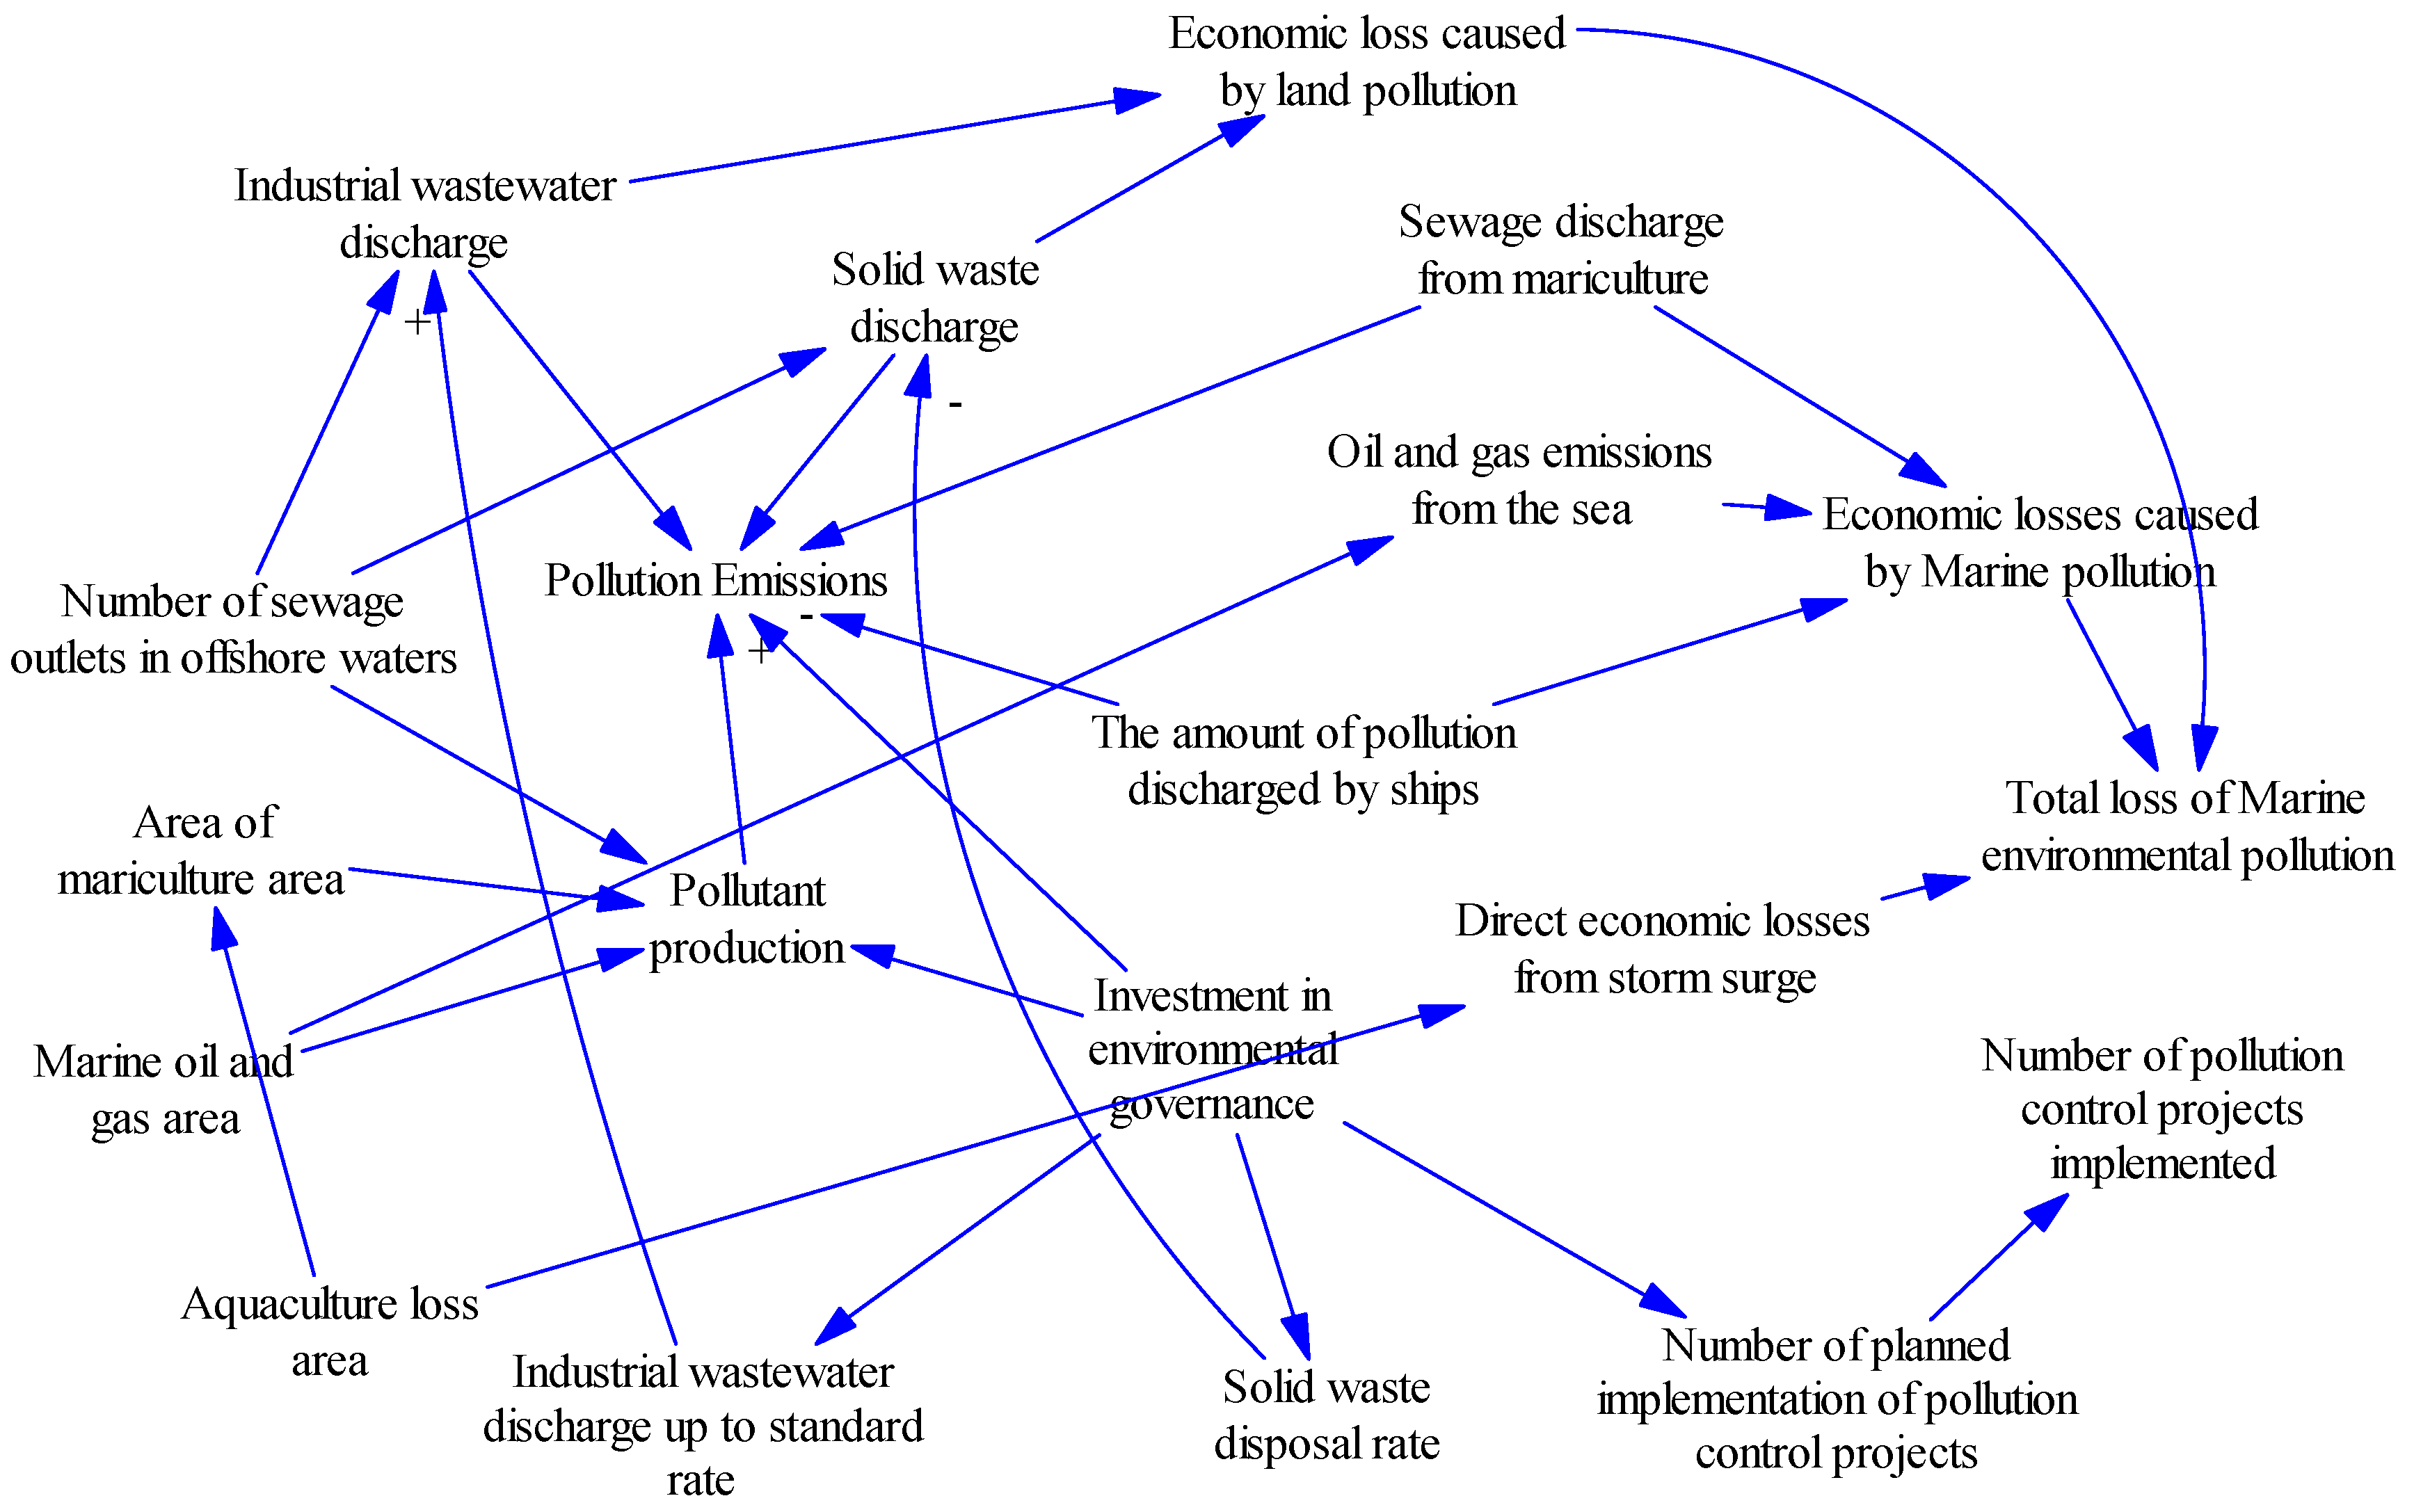
(3) Environmental subsystem
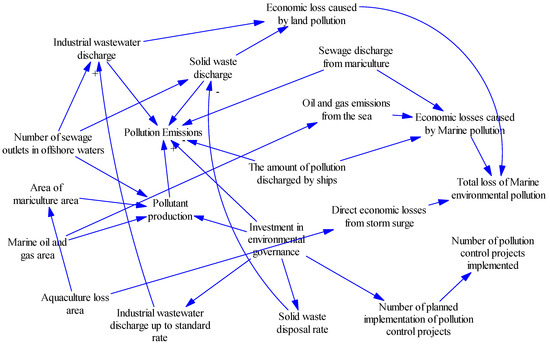
Figure 5.
The SFD of the marine environmental subsystem.
Figure 5.
The SFD of the marine environmental subsystem.
4.3. Model Testing and Scenario Design
4.3.1. Model Run Check
The model running test includes two aspects: structure running test and dimension consistency test. Referring to the research by Yaman (1996), this study uses the model check tool to test the structure of the model [60]. The result demonstrates that the model is OK, which means that the structure of the model is correct, and all relations and equations are correctly defined without internal logic errors. The model is tested with the Unites Check tool, and the Unites is OK, indicating that all equations and calculations in the model have dimensional consistency. This means that the units of all variables in the model coordinate with one another, and there is no case of unit mismatch. Therefore, the model constructed in this paper passes the running test.
4.3.2. Model History Check
Compare the historical data with the simulation results of each variable after running to examine the overall prediction accuracy and effectiveness of the model. The error of the simulation results of the SD is controlled within 10% to improve the accuracy of the model, reduce uncertainty, increase credibility, and ensure its effectiveness. This allows the model to be better applied to the analysis and decision-making process of practical problems. According to the characteristics of the system model, three variables, namely, GOP, wastewater discharge, and aquaculture area, are selected for historical testing, representing the economic system, environmental system, and resource system, respectively. The simulation interval is the 2010–2022 period, representing the historical value, simulation value, and relative error of the variables. The results are shown in Table 3. In particular, the relative errors are all within 10%, which means there is a small deviation between the simulation results and actual observation values, and the model can better describe the dynamic characteristics and change laws of the system. In this case, we can compare the prediction ability of the trust model to better analyze and understand the system’s behavior. We find that the model constructed in this study can truly reflect the development status of China’s marine ERE system, and the model simulation effect is good.
Table 3.
Historical test results.
4.3.3. The Set of Different Development Scenarios
The marine economy, resources, and environment are inseparably connected, forming a complex and interdependent system. Marine resources form the foundation of the marine economy, which propels economic growth via the marine industrial chain. Marine resources, such as fisheries, minerals, and energy, provide the foundation and support for the marine economy. These resources, directly or indirectly, supply human production and living needs while promoting the growth of the social economy. However, environmental concerns frequently accompany the growth and consumption of maritime resources. Overfishing consumes fishery products, marine pollution disrupts the ecological balance of the ocean, and the marine ecosystem faces rising strain. Therefore, maintaining the marine environment is crucial to achieving sustainable marine economic development. Only through the conservation of the marine environment can we use marine resources sustainably and ensure the steady expansion of the marine economy. To promote the development of the marine economy, it is essential to embrace sustainable resource utilization, environmental protection, and the coordinated development of economic benefits. This approach should prioritize green and sustainable development within the marine sector. Countries should strengthen cooperation, jointly formulate and implement relevant policies and measures, and work toward the coordinated development of the marine ERE, thereby contributing to the sustainable development of human society. In light of these realities, this study examines various development scenarios, on the basis of which we propose feasible policies and suggestions.
By changing the variables and settings in the existing SD model, this study assumes four development scenarios: (1) Current scenario. This scenario maintains the original values of all parameters and variables and serves as a reference for other scenarios. (2) Economic scenario. We raise investment in economic development by raising the amount of fixed asset investment in the marine industry relative to the total investment. Meanwhile, China’s “14th Five-Year Plan” for marine economic growth focuses on scientific and technological innovation and industrial upgrading to support the transformation and upgrading of traditional maritime sectors. As a result, we strengthen the proportion of investment in the marine tertiary industry. (3) Resource scenario. This scenario emphasizes marine resources, mainly fishery resources. (4) Environmental scenario. This scenario emphasizes industrial structure adjustment and environmental protection investment. Investment should be increased in tertiary industries, environmental protection initiatives, and the upgrading of energy equipment.
4.4. Simulation Result
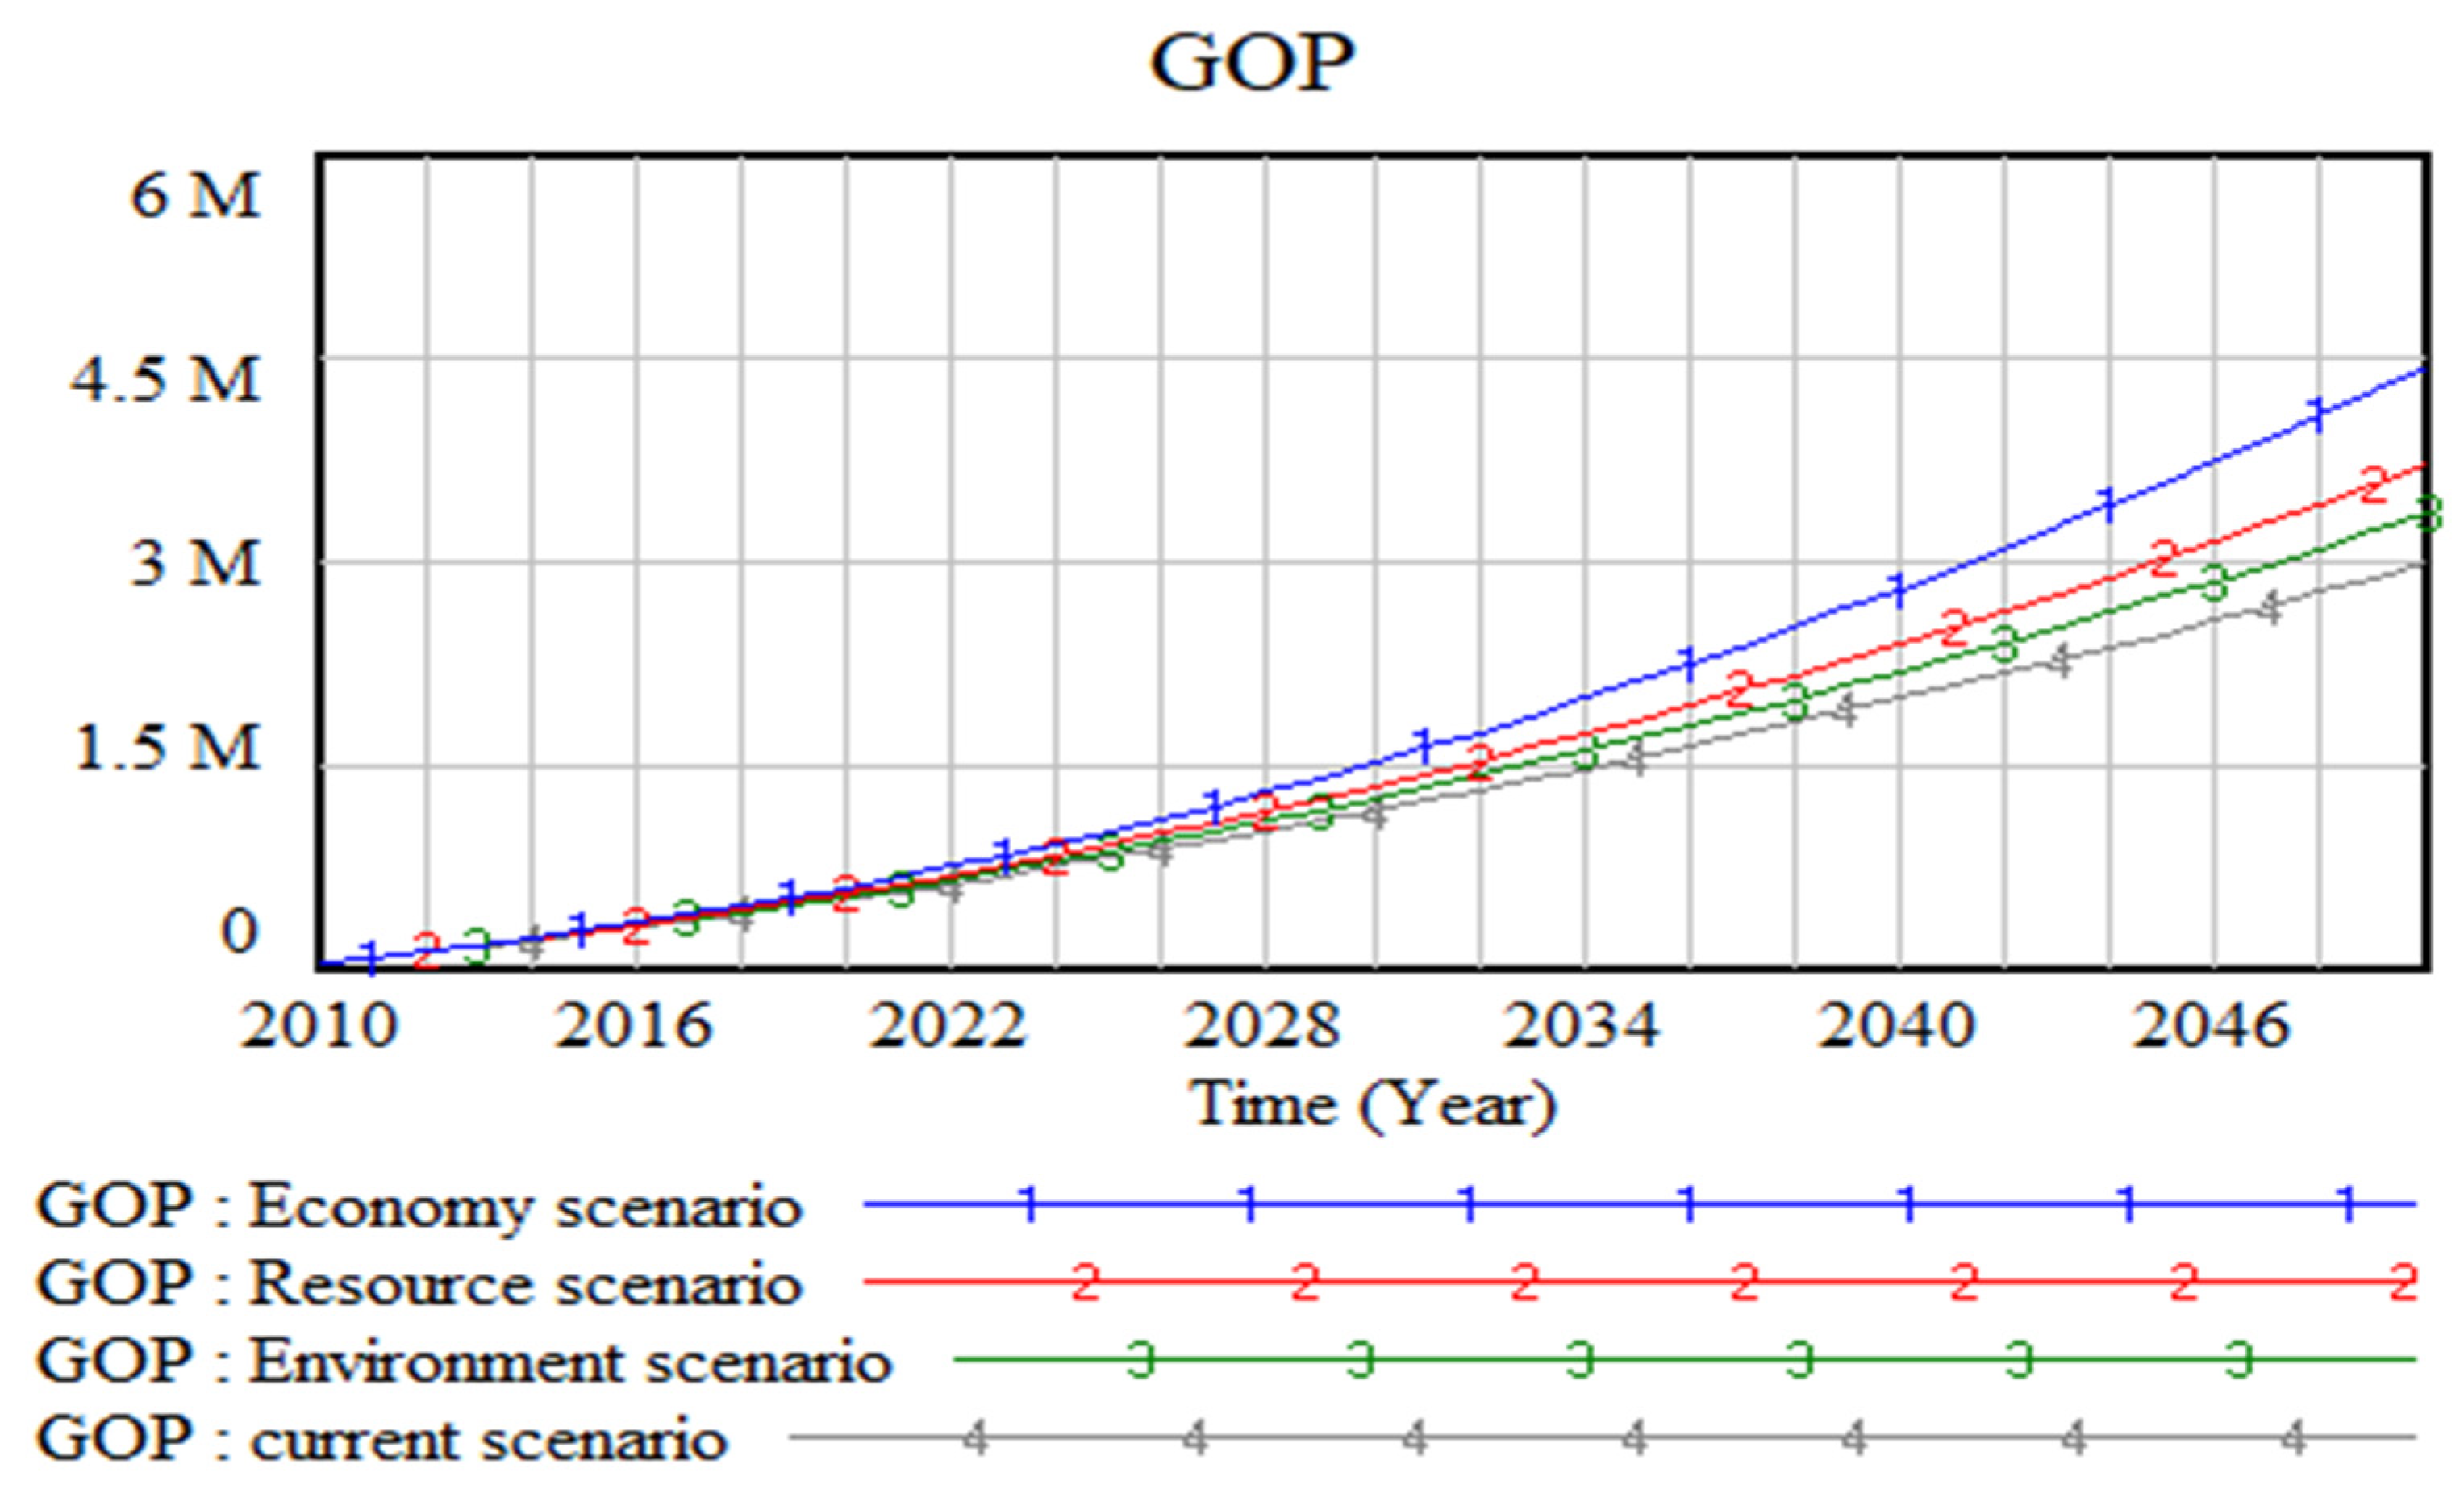
Figure 6 simulates the dynamic changes in the marine ERE system under different scenarios, with a particular focus on the evolution of the GOP under the economy, resources, environment, and current scenarios from 2010 to 2050. According to the results, the economic scenario has the highest level, followed by the resource scenario, while the current and environmental scenarios have lower levels. This result shows that the current society is relatively strong in economic development but still has weaknesses in resource utilization and environmental protection. From an economic perspective, increasing economic investment can promote economic growth and increase employment and industrial development. Especially in the case of a high current economic scenario, more economic investment is expected to accelerate economic improvement and raise the economic level. In the resource scenario, improving the energy structure will help improve environmental cleanliness, reduce resource waste and environmental pollution, and provide more sustainable support for economic development. By optimizing resource utilization, effective resource allocation can be achieved, and the healthy development of the economy can be promoted. However, in the environmental scenario, increasing environmental investment may bring certain GOP costs because environmental protection and governance often require a certain amount of funds, labor, and material resources. This may lead to a relatively low economic level in the short term. In the long run, however, protecting the environment and improving ecological conditions are also important components of sustainable development. Therefore, considering the three aspects of ERE, balance must be sought between economic growth and resource utilization; focus on sustainable development; actively promote economic transformation and upgrading; achieve a benign interaction between the economy, resources, and environment; and achieve a win–win situation for the economy and society.
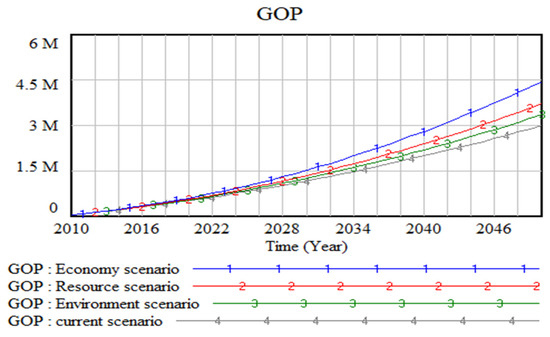
Figure 6.
Simulated results of GOP under different scenarios.
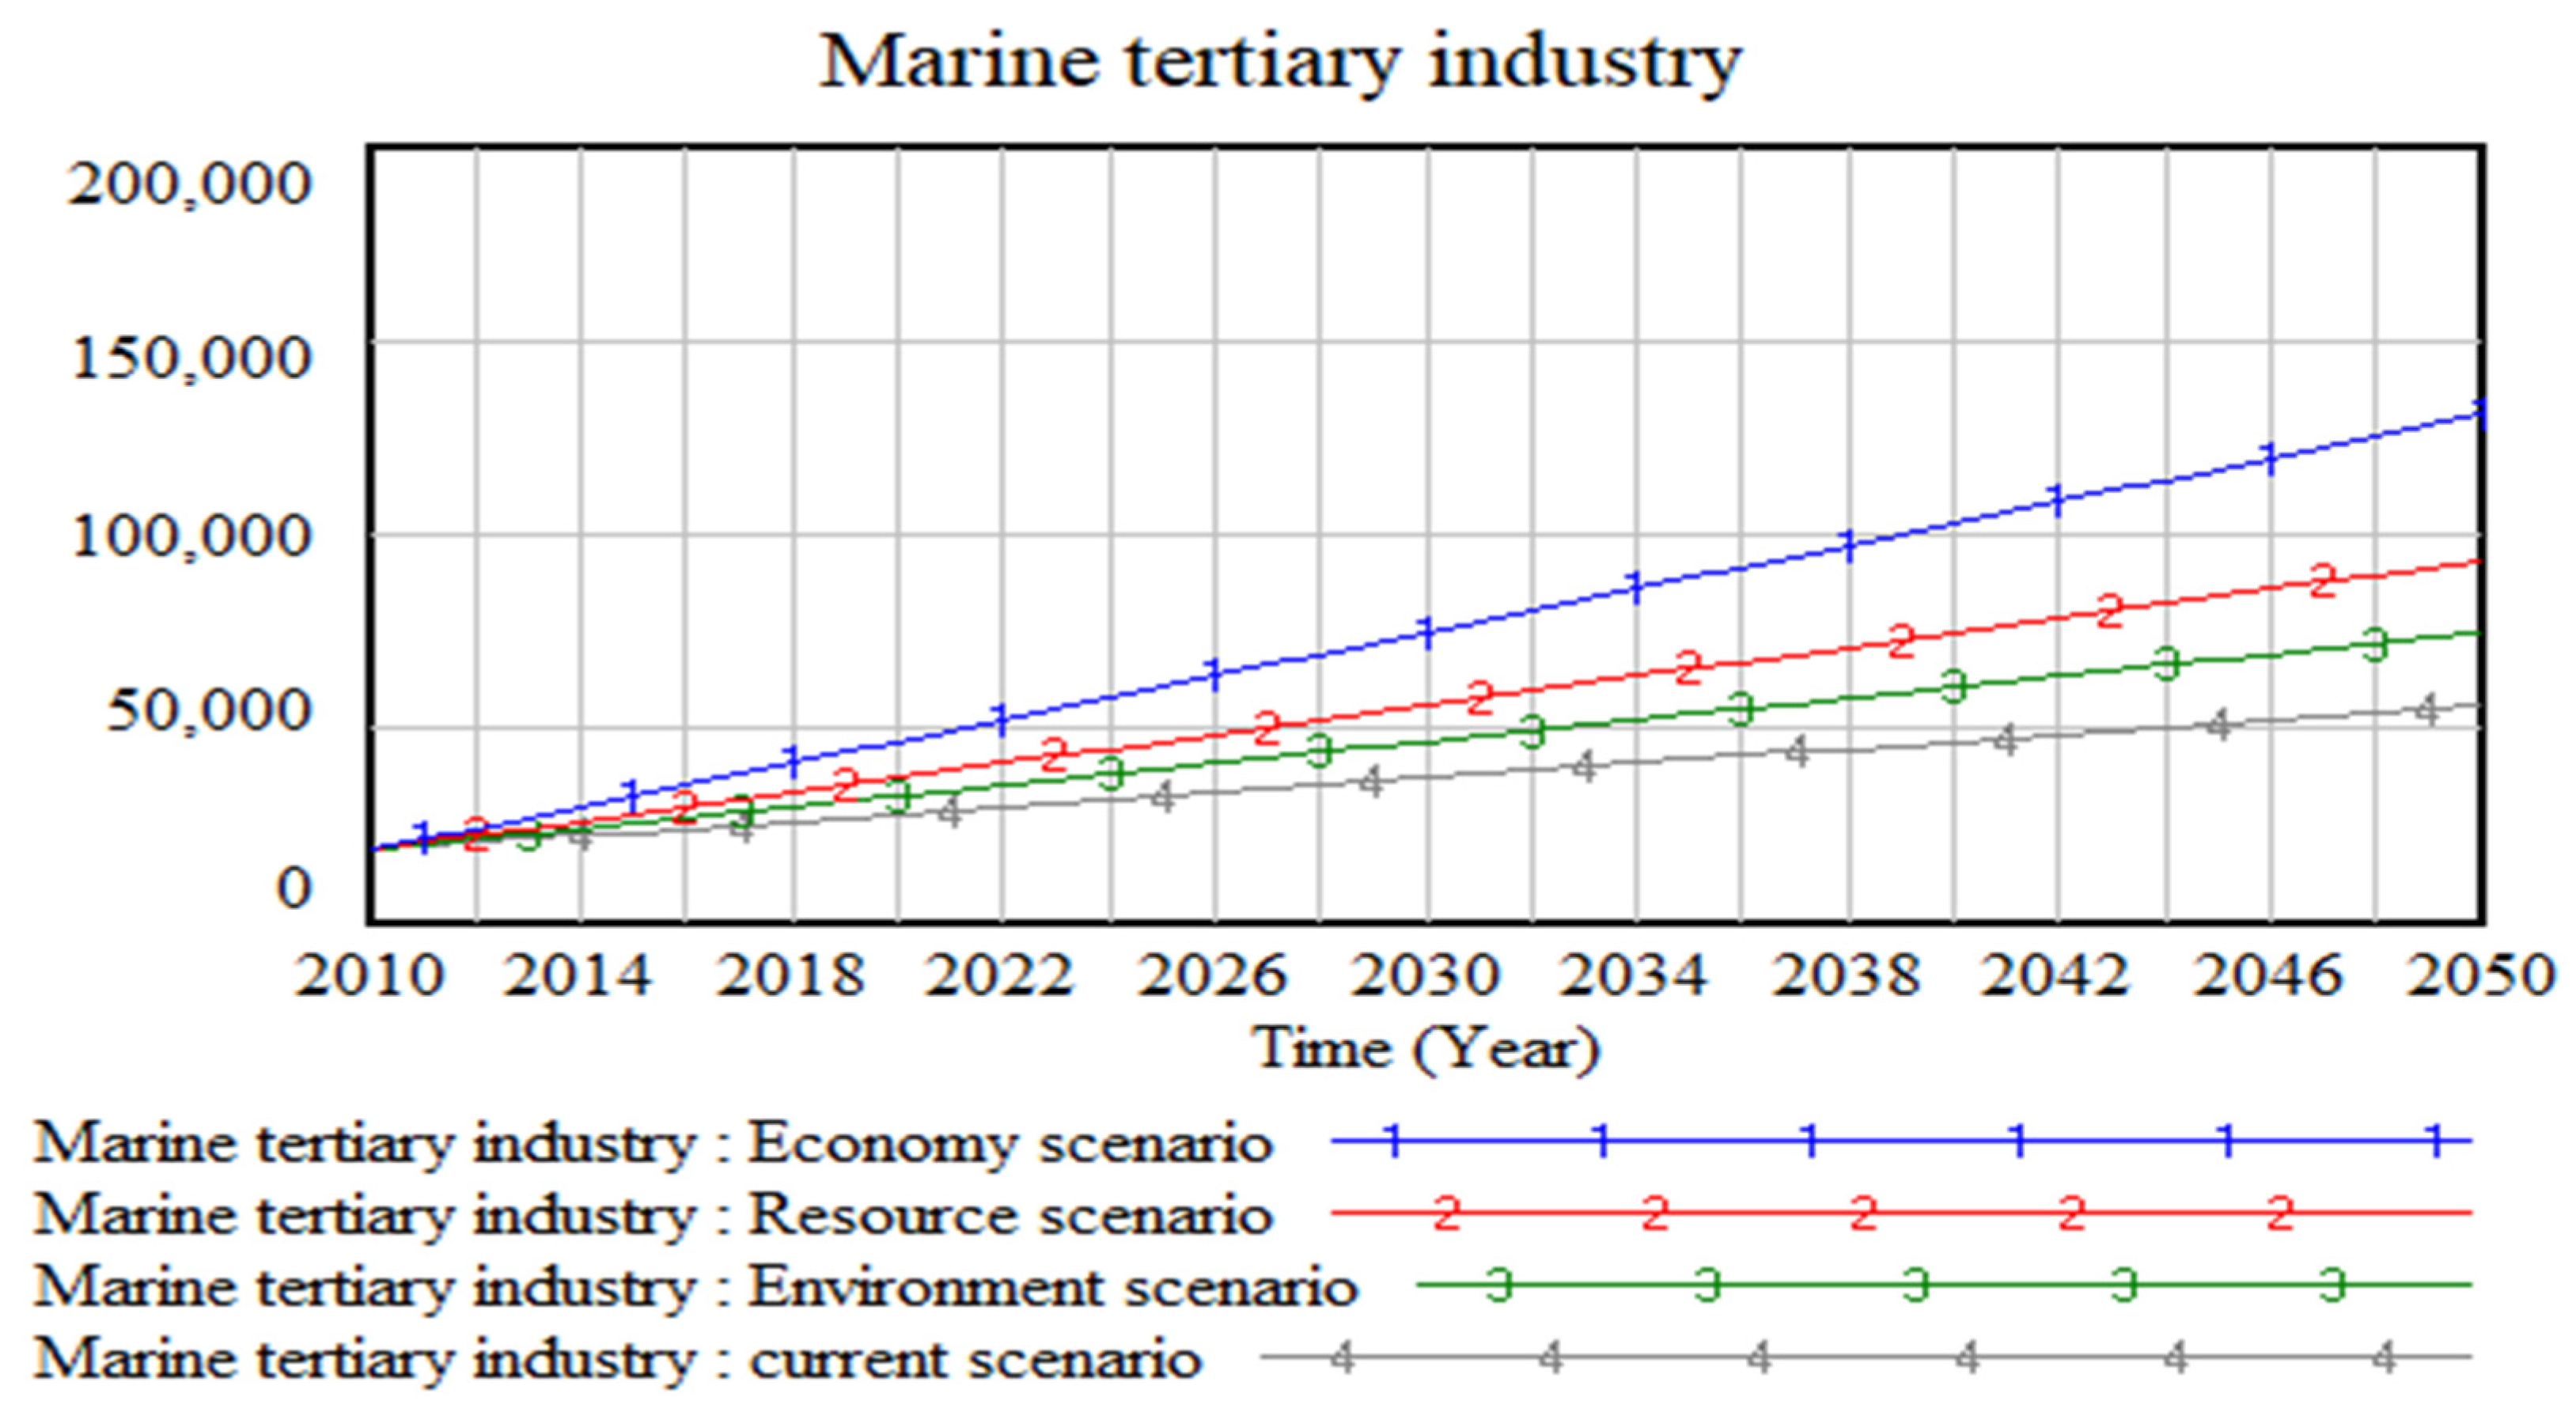
Figure 7 shows the changing patterns in the marine tertiary industry under different conditions. According to the statistics, the marine tertiary industry is experiencing sluggish expansion. The rapid development of this sector has accelerated economic growth. Simultaneously, promoting the growth of the marine tertiary sector can help improve and optimize the structure of the marine industry. As an important part of the marine economy, the marine tertiary industry holds significant potential for development. Accelerating the development of sectors such as marine tourism and marine cultural and creative industries can attract more investment and resources, extend and improve related industrial chains, and inject new vitality into the marine economy. At the same time, the development of the marine tertiary industry can drive the coordinated development of related industries, promote the optimization and adjustment of the marine industrial structure, and boost overall industrial competitiveness.
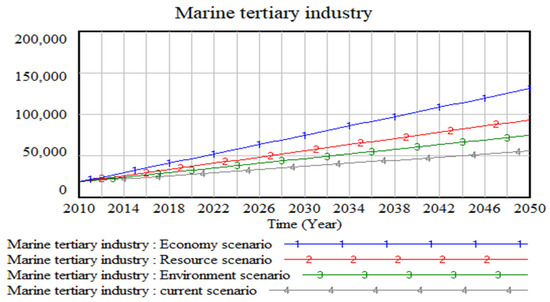
Figure 7.
Simulated results of marine tertiary industry under different scenarios.
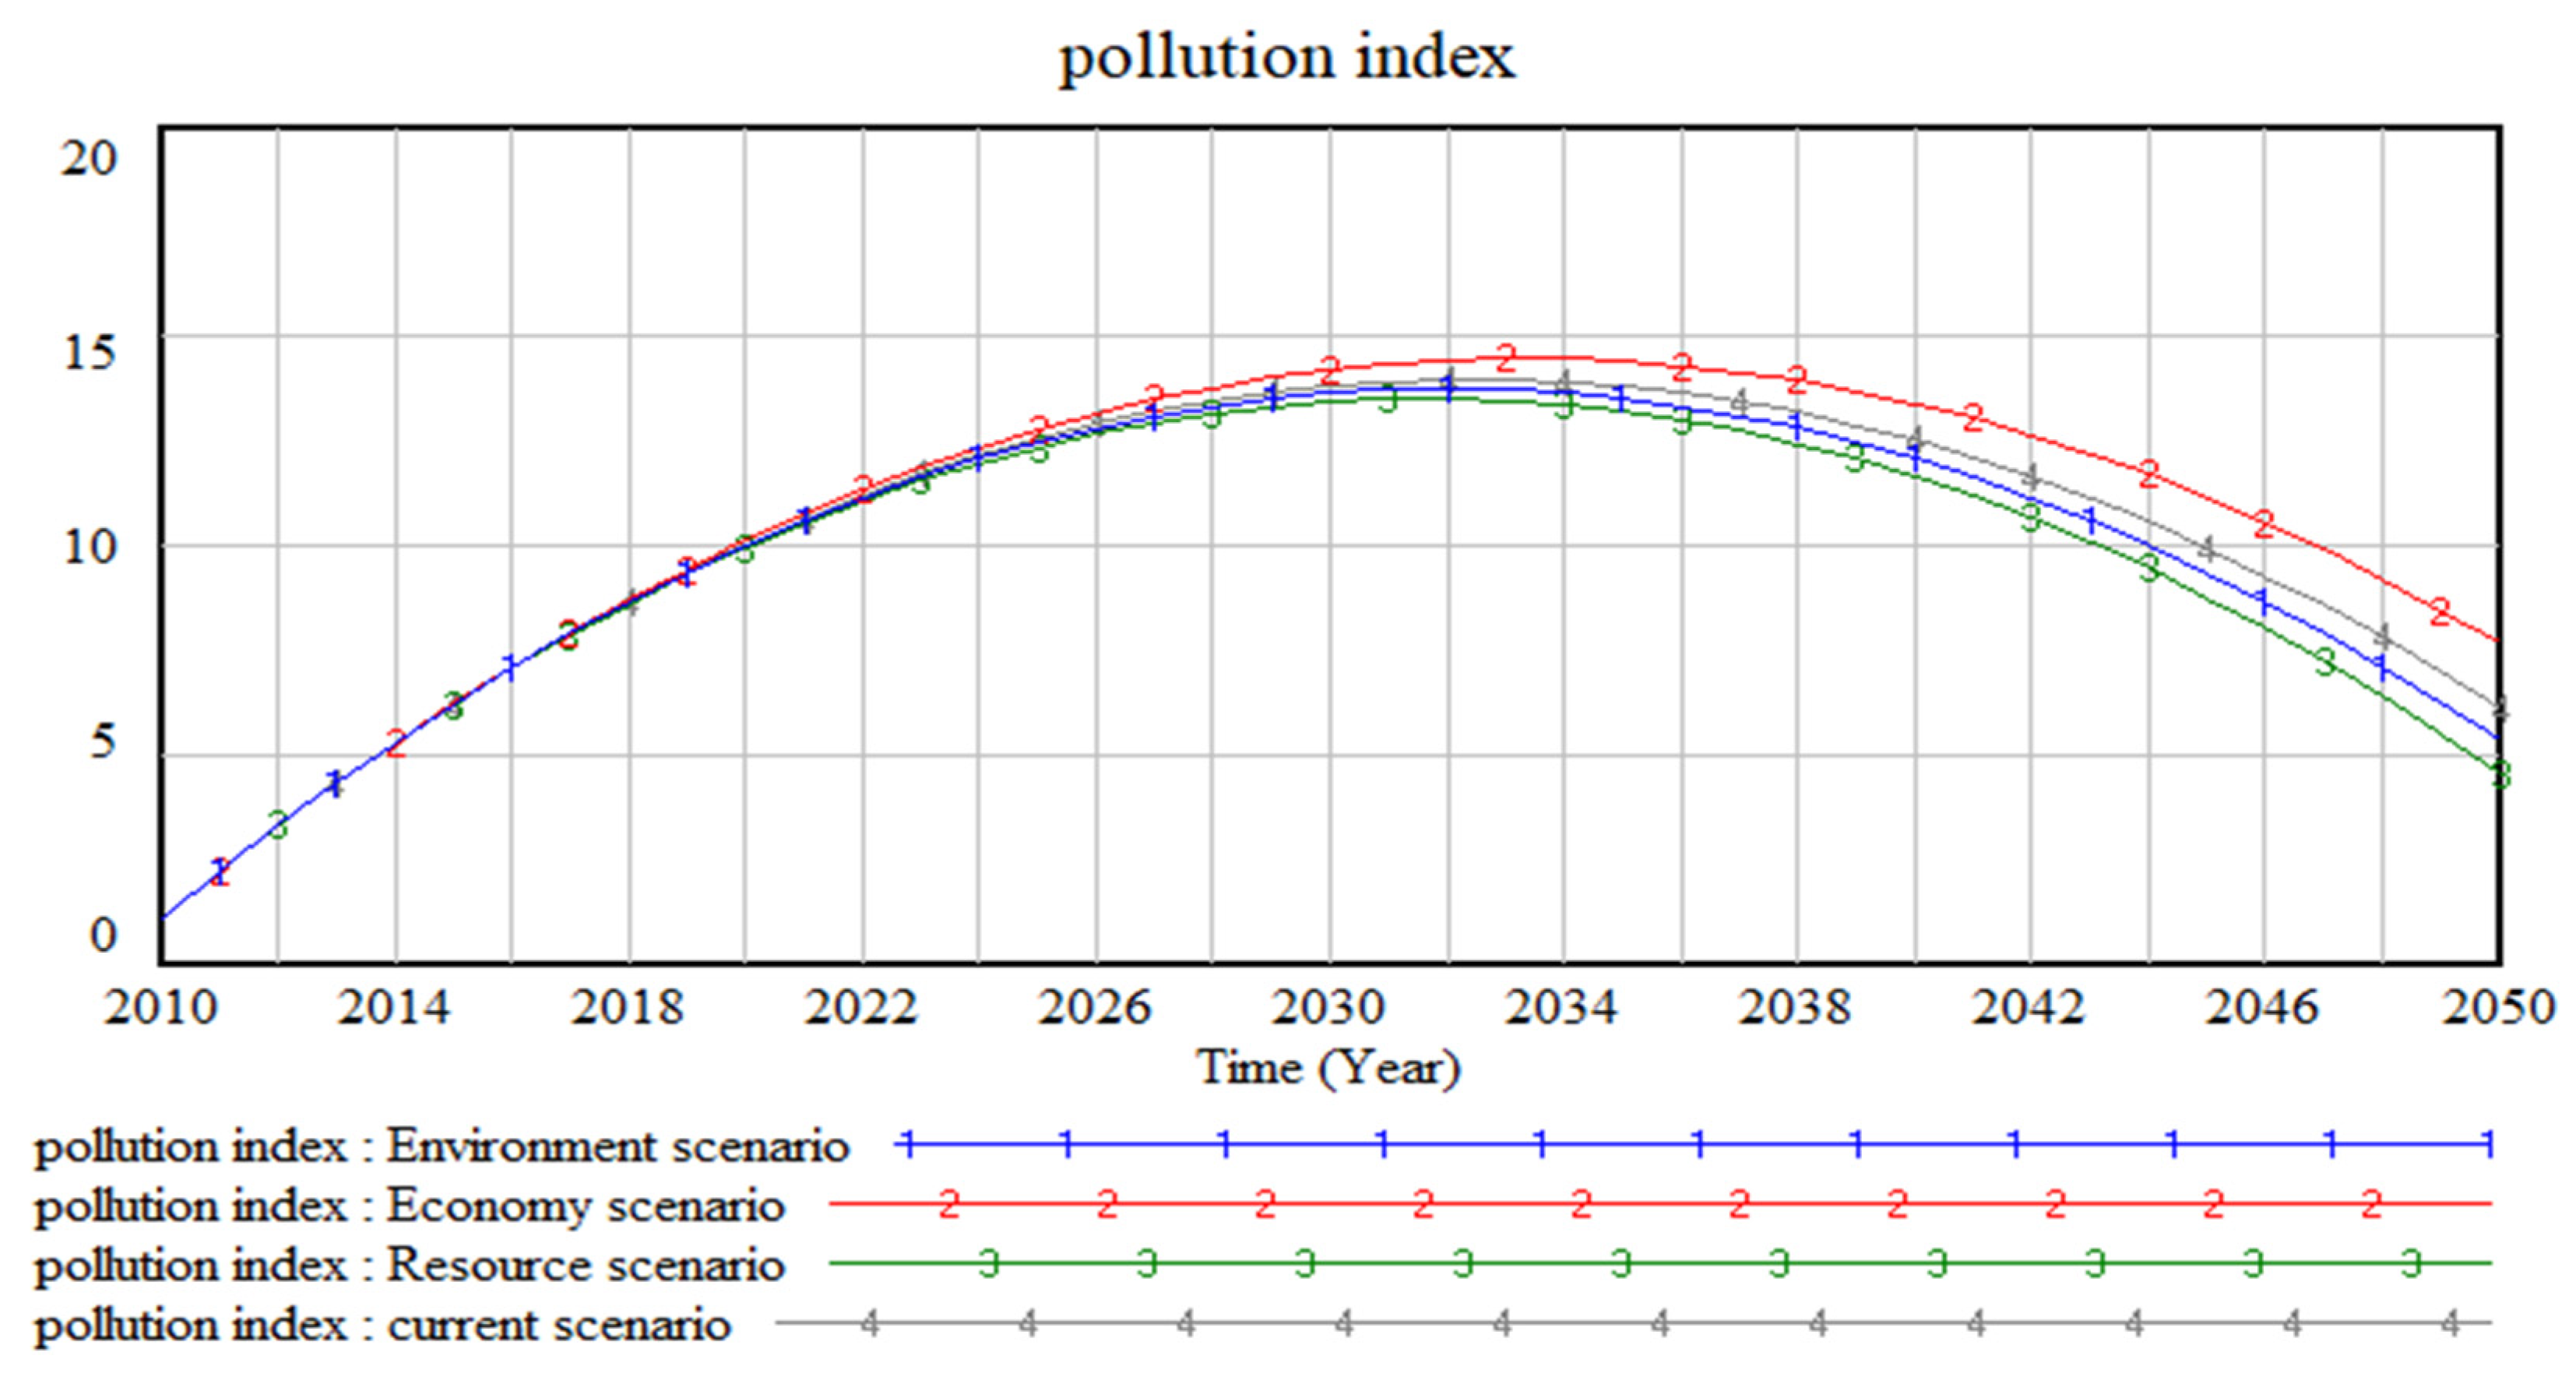
Figure 8 shows that from 2010 to 2050, the pollution index shows a trend of initially increasing and then decreasing across all scenarios–environmental, economic, resource, and current. This indicates that, over time, the pollution problem may worsen, thus attracting the attention of all sectors of society. Notably, the pollution index in the environmental scenario is relatively low, which reflects that the pollution level can be effectively controlled when environmental protection is prioritized. The pollution index in the economic scenario may be relatively high, possibly because economic development is often accompanied by industrialization and urbanization, which increase pollution emissions. The pollution index in the resource scenario may be affected by the method of resource exploitation and utilization, and if such method is not environmentally friendly, then the pollution index may rise. The pollution index in the current scenario reflects the combined effect of the current level of social and economic development and environmental protection measures.
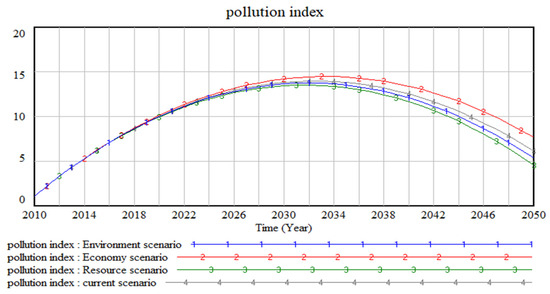
Figure 8.
Simulated results of the pollution index under different scenarios.
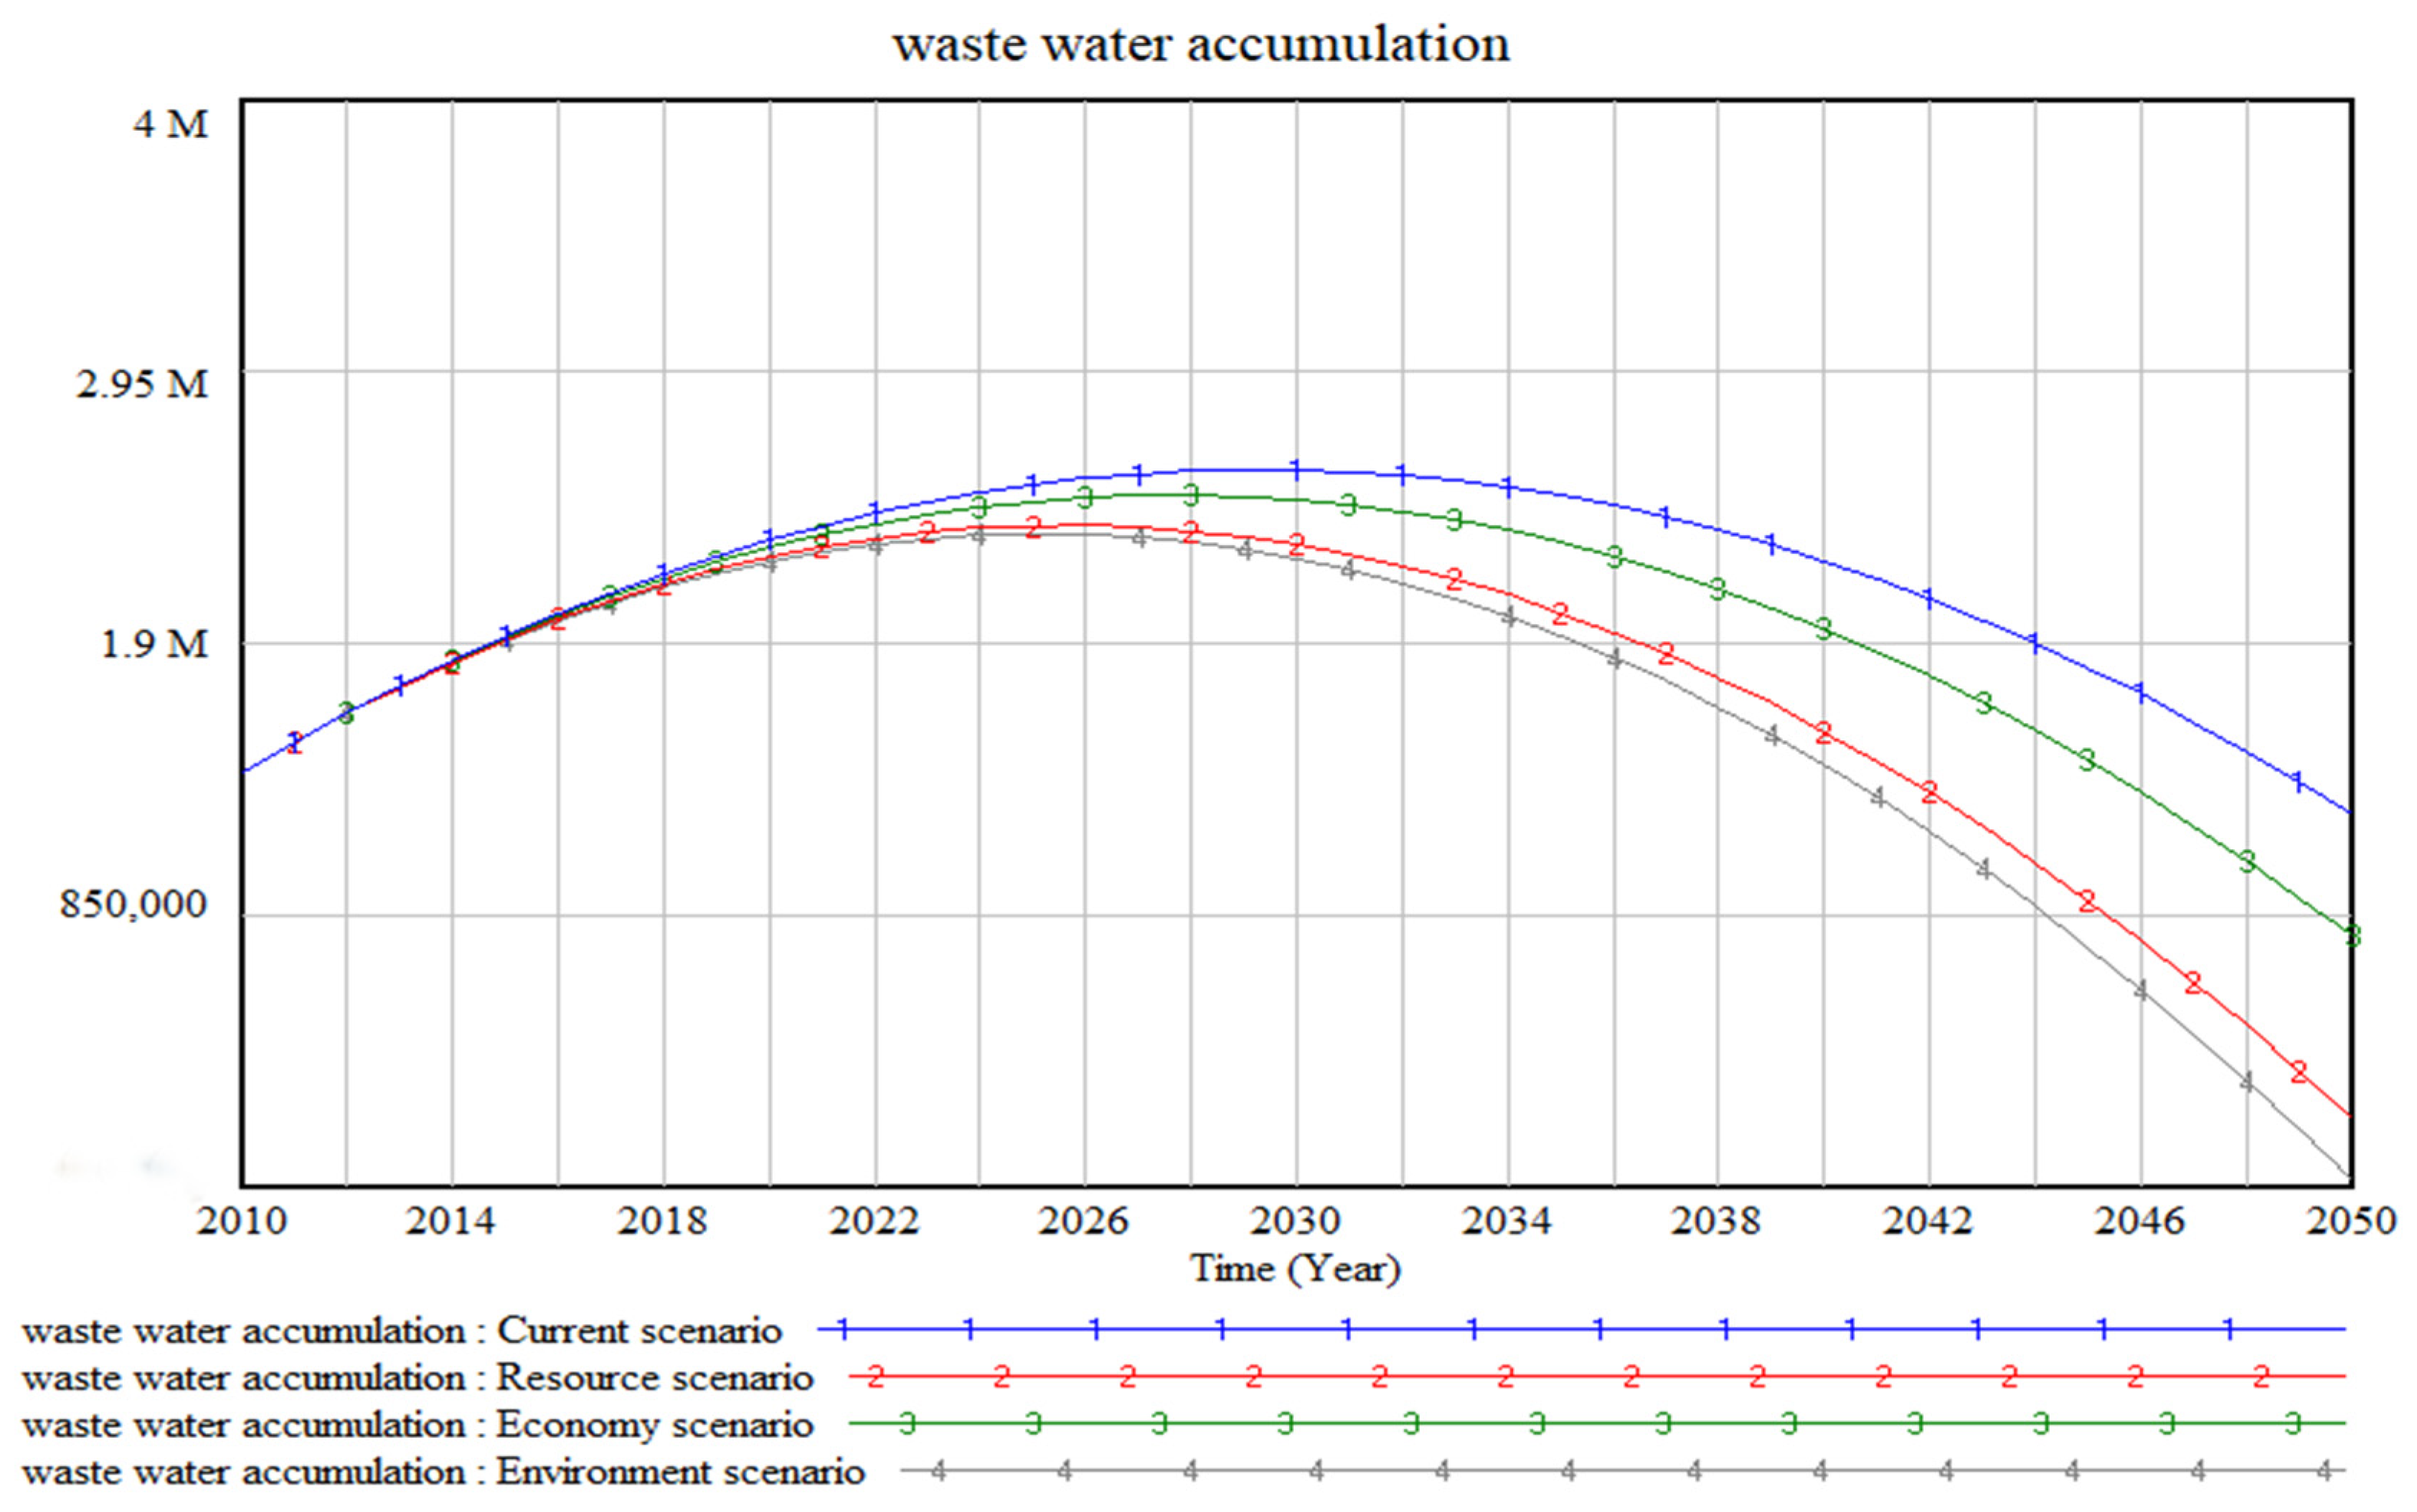
Figure 9 shows the trend of marine wastewater accumulation from 2010 to 2050. In the economic scenario, the amount of wastewater accumulated may be relatively high, suggesting that in the pursuit of economic growth, the environmental cost (i.e., long-term investment in wastewater treatment), may be overlooked. From an economic perspective, this neglect can lead to external diseconomy, in which the total cost to society exceeds the sum of private costs plus benefits. The resource scenario may show trends in wastewater accumulation under the more efficient use of resources, including wastewater treatment resources. The increase in wastewater accumulation usually has a negative impact on the environment, such as the deterioration of water quality and the destruction of ecosystems. These effects tend to have externalities; they are not directly reflected in market transactions, so the market cannot automatically correct these problems. In the environmental scenario, the amount of wastewater accumulated is relatively low, suggesting that through environmental policy interventions (e.g., stricter discharge standards, environmental regulations), market failures can be reduced and the environment protected from pollution.
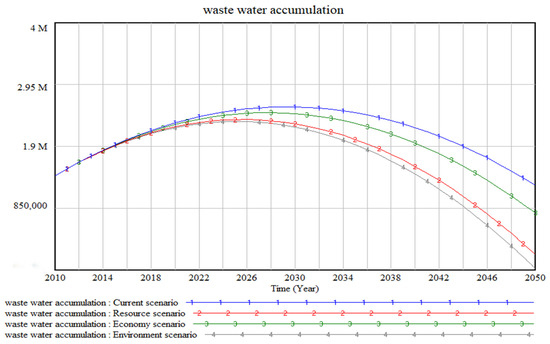
Figure 9.
Simulated results of wastewater accumulation under different scenarios.
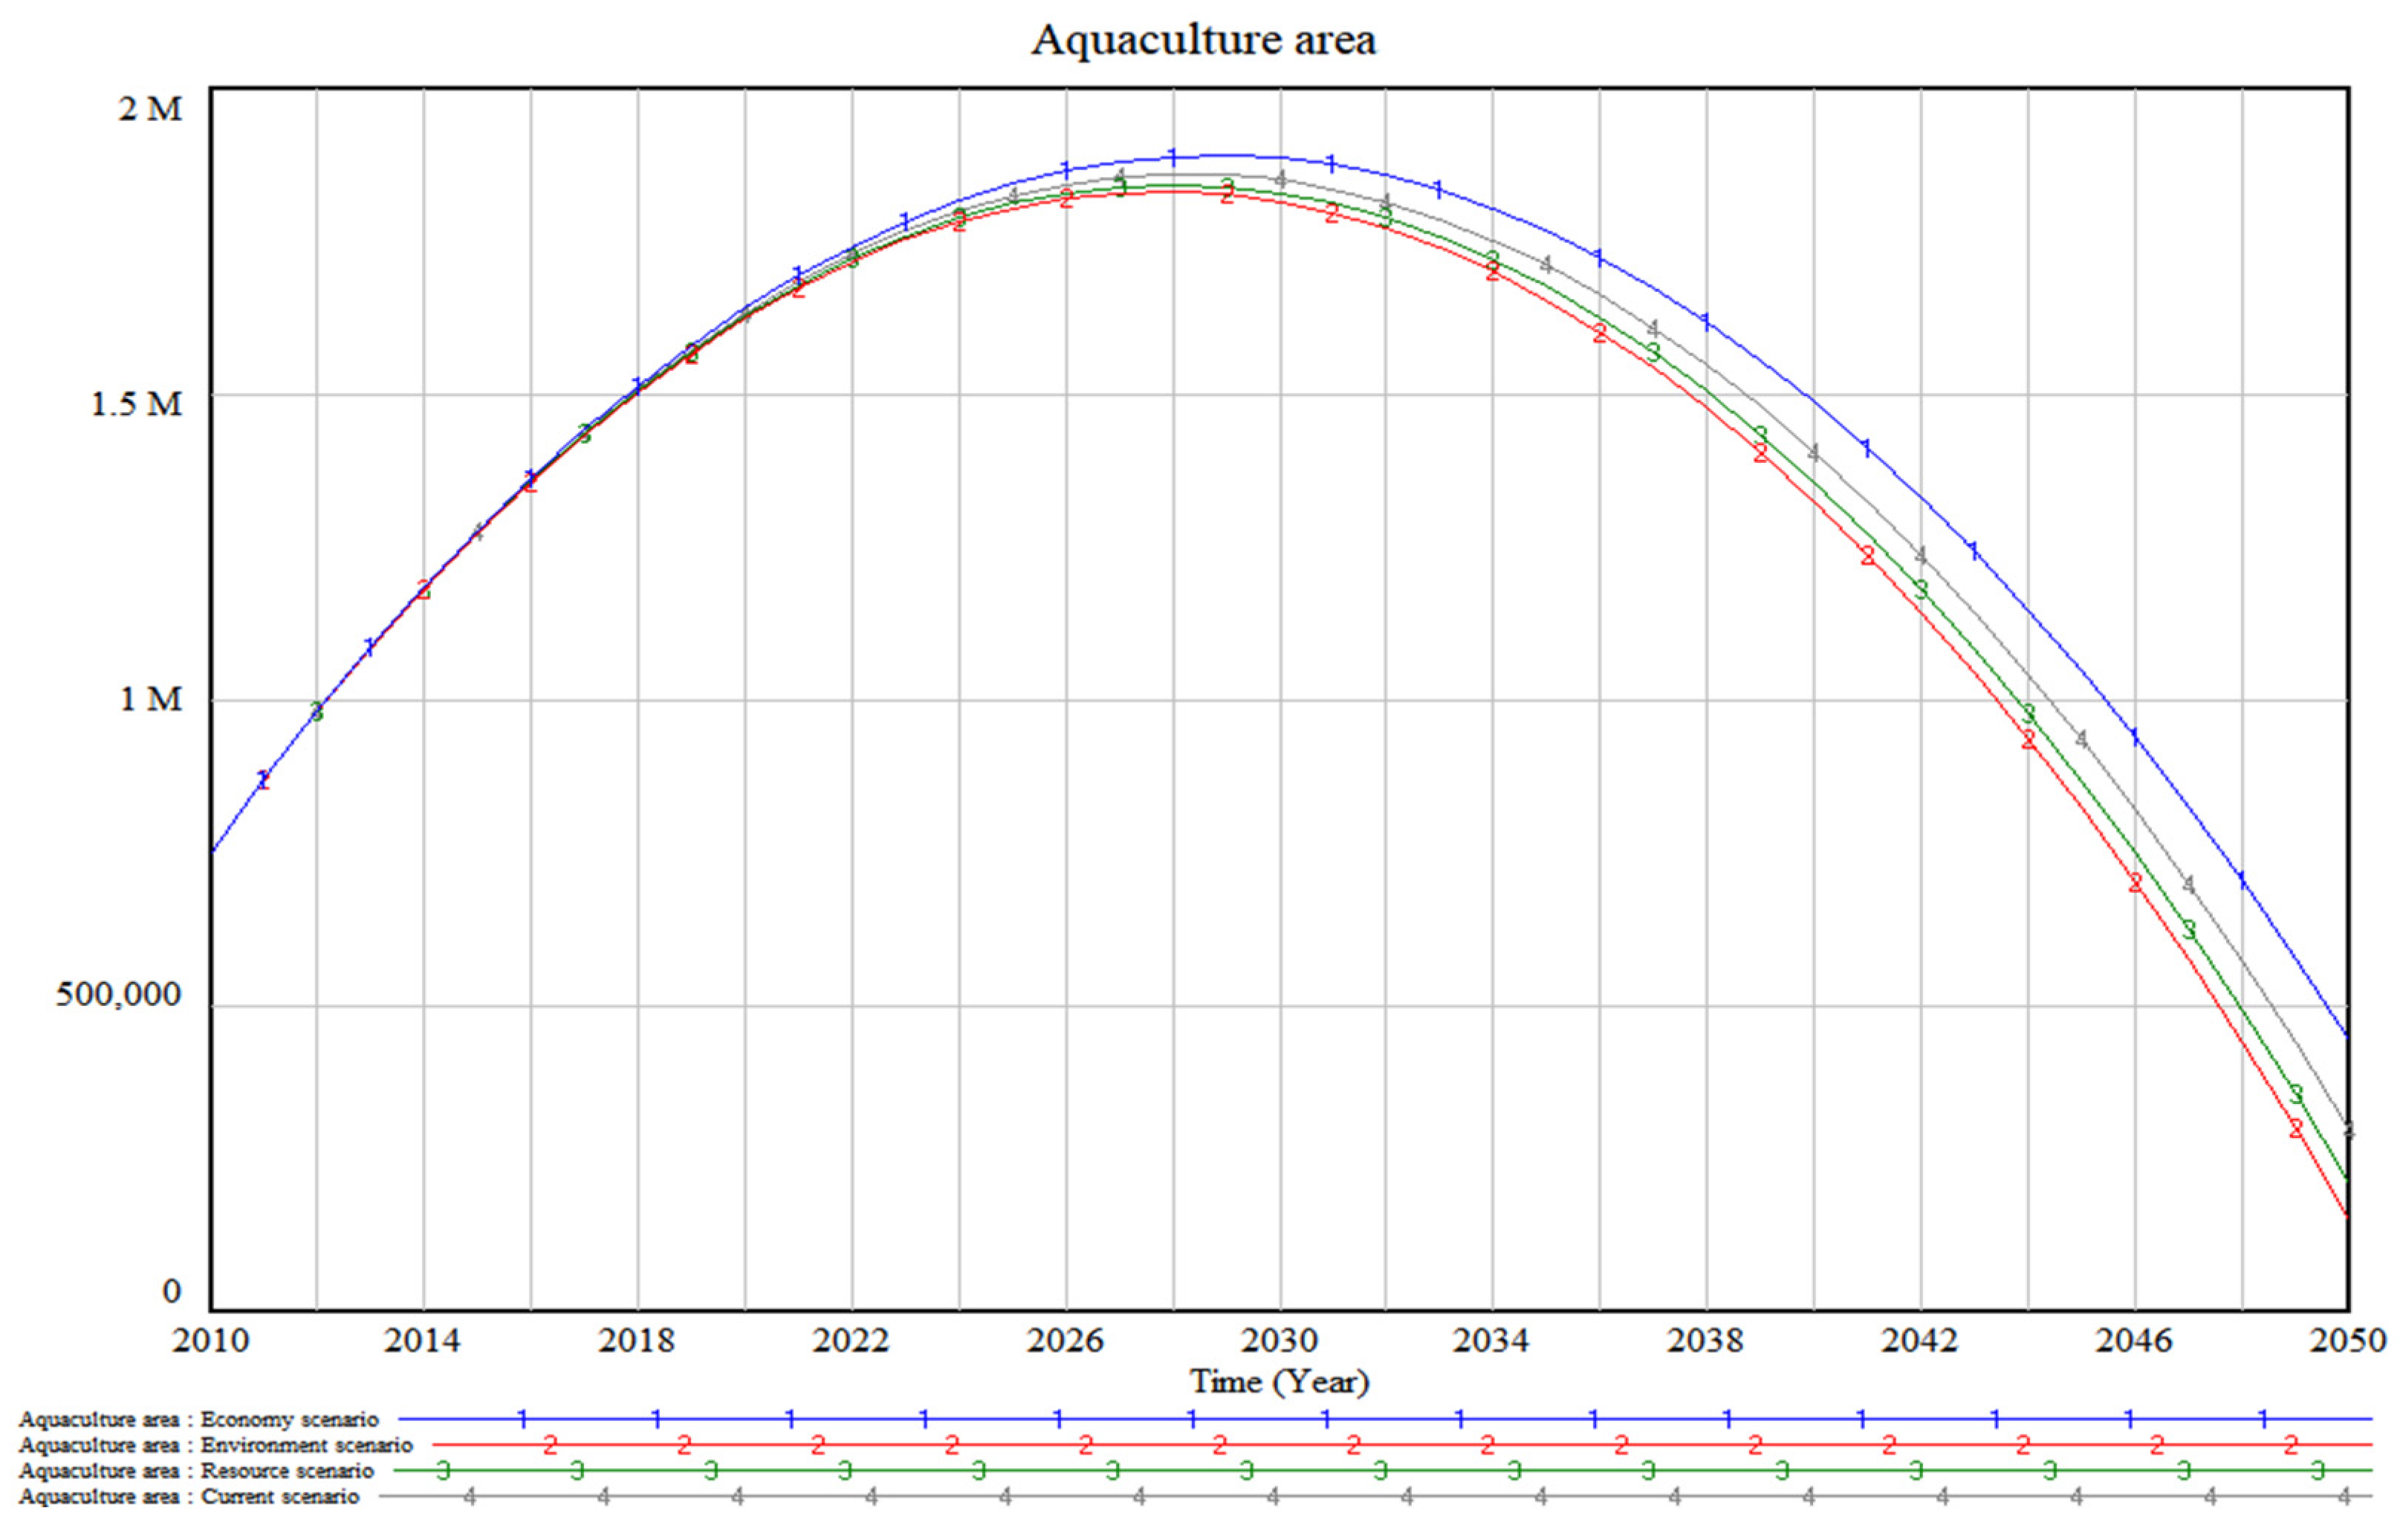
Figure 10 shows projected trends in the aquaculture area from 2010 to 2050 under different scenarios. Under the economic scenario, the aquaculture area shows a relatively significant growth trend, reflecting the increasing demand for aquatic products driven by economic growth and population increase. This trend suggests that the expansion of the aquaculture industry will likely help meet market demand and become a new driver of economic growth. However, by around 2030, the growth rate of consumer demand for aquatic products may slow down due to market saturation, resulting in a weakened impetus for further expansion of aquaculture areas. With regard to sustainability, the trends in aquaculture acreage under the current scenario are likely to fall between those observed in the economic and environmental scenarios. This indicates that while pursuing economic benefits, it is necessary to consider environmental and social costs to achieve sustainable development goals.
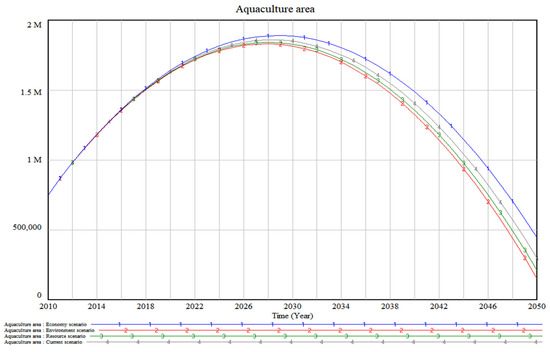
Figure 10.
Simulated results of the aquaculture area under different scenarios.
In conclusion, the marine ERE model developed in this study offers a more comprehensive depiction of the dynamic interplay among economic, resource, and environmental subsystems.
5. An Evaluation of the Coupling Coordination Degree
5.1. Development of Each Subsystem under Different Scenarios
Table 2 illustrates how the value of the marine industry has the highest index weight within the economic subsystem, followed by the marine tertiary industry, secondary industry, and completion of ship construction [30]. As a result, between 2010 and 2022, the economic advancement of the marine industry was an essential element in the evolution of China’s maritime sector, with the marine tertiary industry providing the fundamental push for the development of the economic subsystem. The rapid expansion of the marine economy not only fosters economic growth in coastal regions but also drives scientific and technological innovation while enhancing the sustainable utilization of marine resources. The economic upsurge of the marine industry serves as a potent driving force for the advancement of China’s maritime sector and is poised to continue playing a crucial role in the future. The development of the marine secondary industry and the construction of ships symbolize the establishment of maritime infrastructure, which serves as a fundamental catalyst for the growth of China’s marine economy. Ports and shipping are critical to the infrastructure of the marine economy. Modern port facilities and efficient shipping networks can significantly improve logistics efficiency and reduce transportation costs, thereby boosting international trade and economic growth. Many important ports in China, such as the Shanghai Port and Ningbo Zhoushan Port, are constantly upgrading and expanding, providing strong support for shipping.
Figure 11 depicts the growth of the economic subsystem under different scenarios. Over the next 30 years, the aggregate level of all scenarios will rise, with the increase rate accelerating after 2030. After 2030, the growth rate will accelerate significantly due to technological breakthroughs, policy improvements, and other factors. Driven by technology, policy, and market forces, the marine economy will develop into a new growth point for the global economy, bringing extensive economic, ecological, and social benefits.
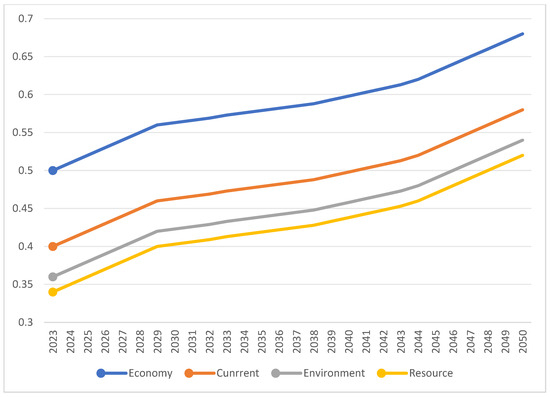
Figure 11.
Trends in the comprehensive level of the economy subsystem under different scenarios.
We select six indexes in the resource subsystem, with the mariculture and wetland areas exerting a greater influence. Through intensive and scientific management methods, mariculture can greatly improve the utilization efficiency of marine living resources. Compared to traditional fishing methods, it can produce marine products in a more controlled manner, reducing the dependence and pressure on wild populations. Wetlands are important ecosystems with various ecological functions, such as water purification, flood regulation, soil conservation, and biodiversity maintenance. They can effectively filter pollutants, improve water quality, and play a key role in maintaining the ecological balance of marine and coastal areas. Wetlands have a strong carbon capture capacity and can absorb and store large amounts of carbon dioxide, thus playing a key role in combating climate change. Protecting and restoring wetlands is one of the most effective ways to reduce greenhouse gas concentrations. The second is the production of marine fishing and farming. Fishing is one of the key sources of global protein supply, especially in developing countries, where many people’s diets derive important animal protein from products caught from marine environments. Reasonable fishing helps maintain the numbers of certain stocks, but overfishing can lead to the depletion of fish stocks and disrupt the balance of marine ecosystems. All scenarios in China showed an increasing trend during the simulation period (Figure 12).
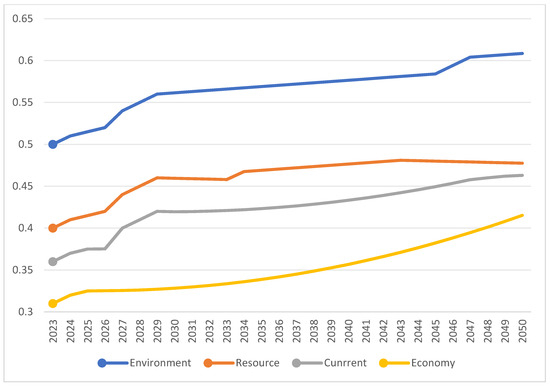
Figure 12.
Trends in the comprehensive level of the resource subsystem under different scenarios.
Figure 12 depicts how the marine economic subsystem develops under various scenarios. The aggregate level of all scenarios will rise over the next 30 years, with the rate of growth picking up after 2030. With the exception of the resource scenario, we rank the remaining possibilities as follows: environment, current, and economy. Combined with Figure 11, we see that the higher the economic system, the lower the resource system. This finding suggests that the progress of China’s marine economy is mainly dependent on resource extraction.
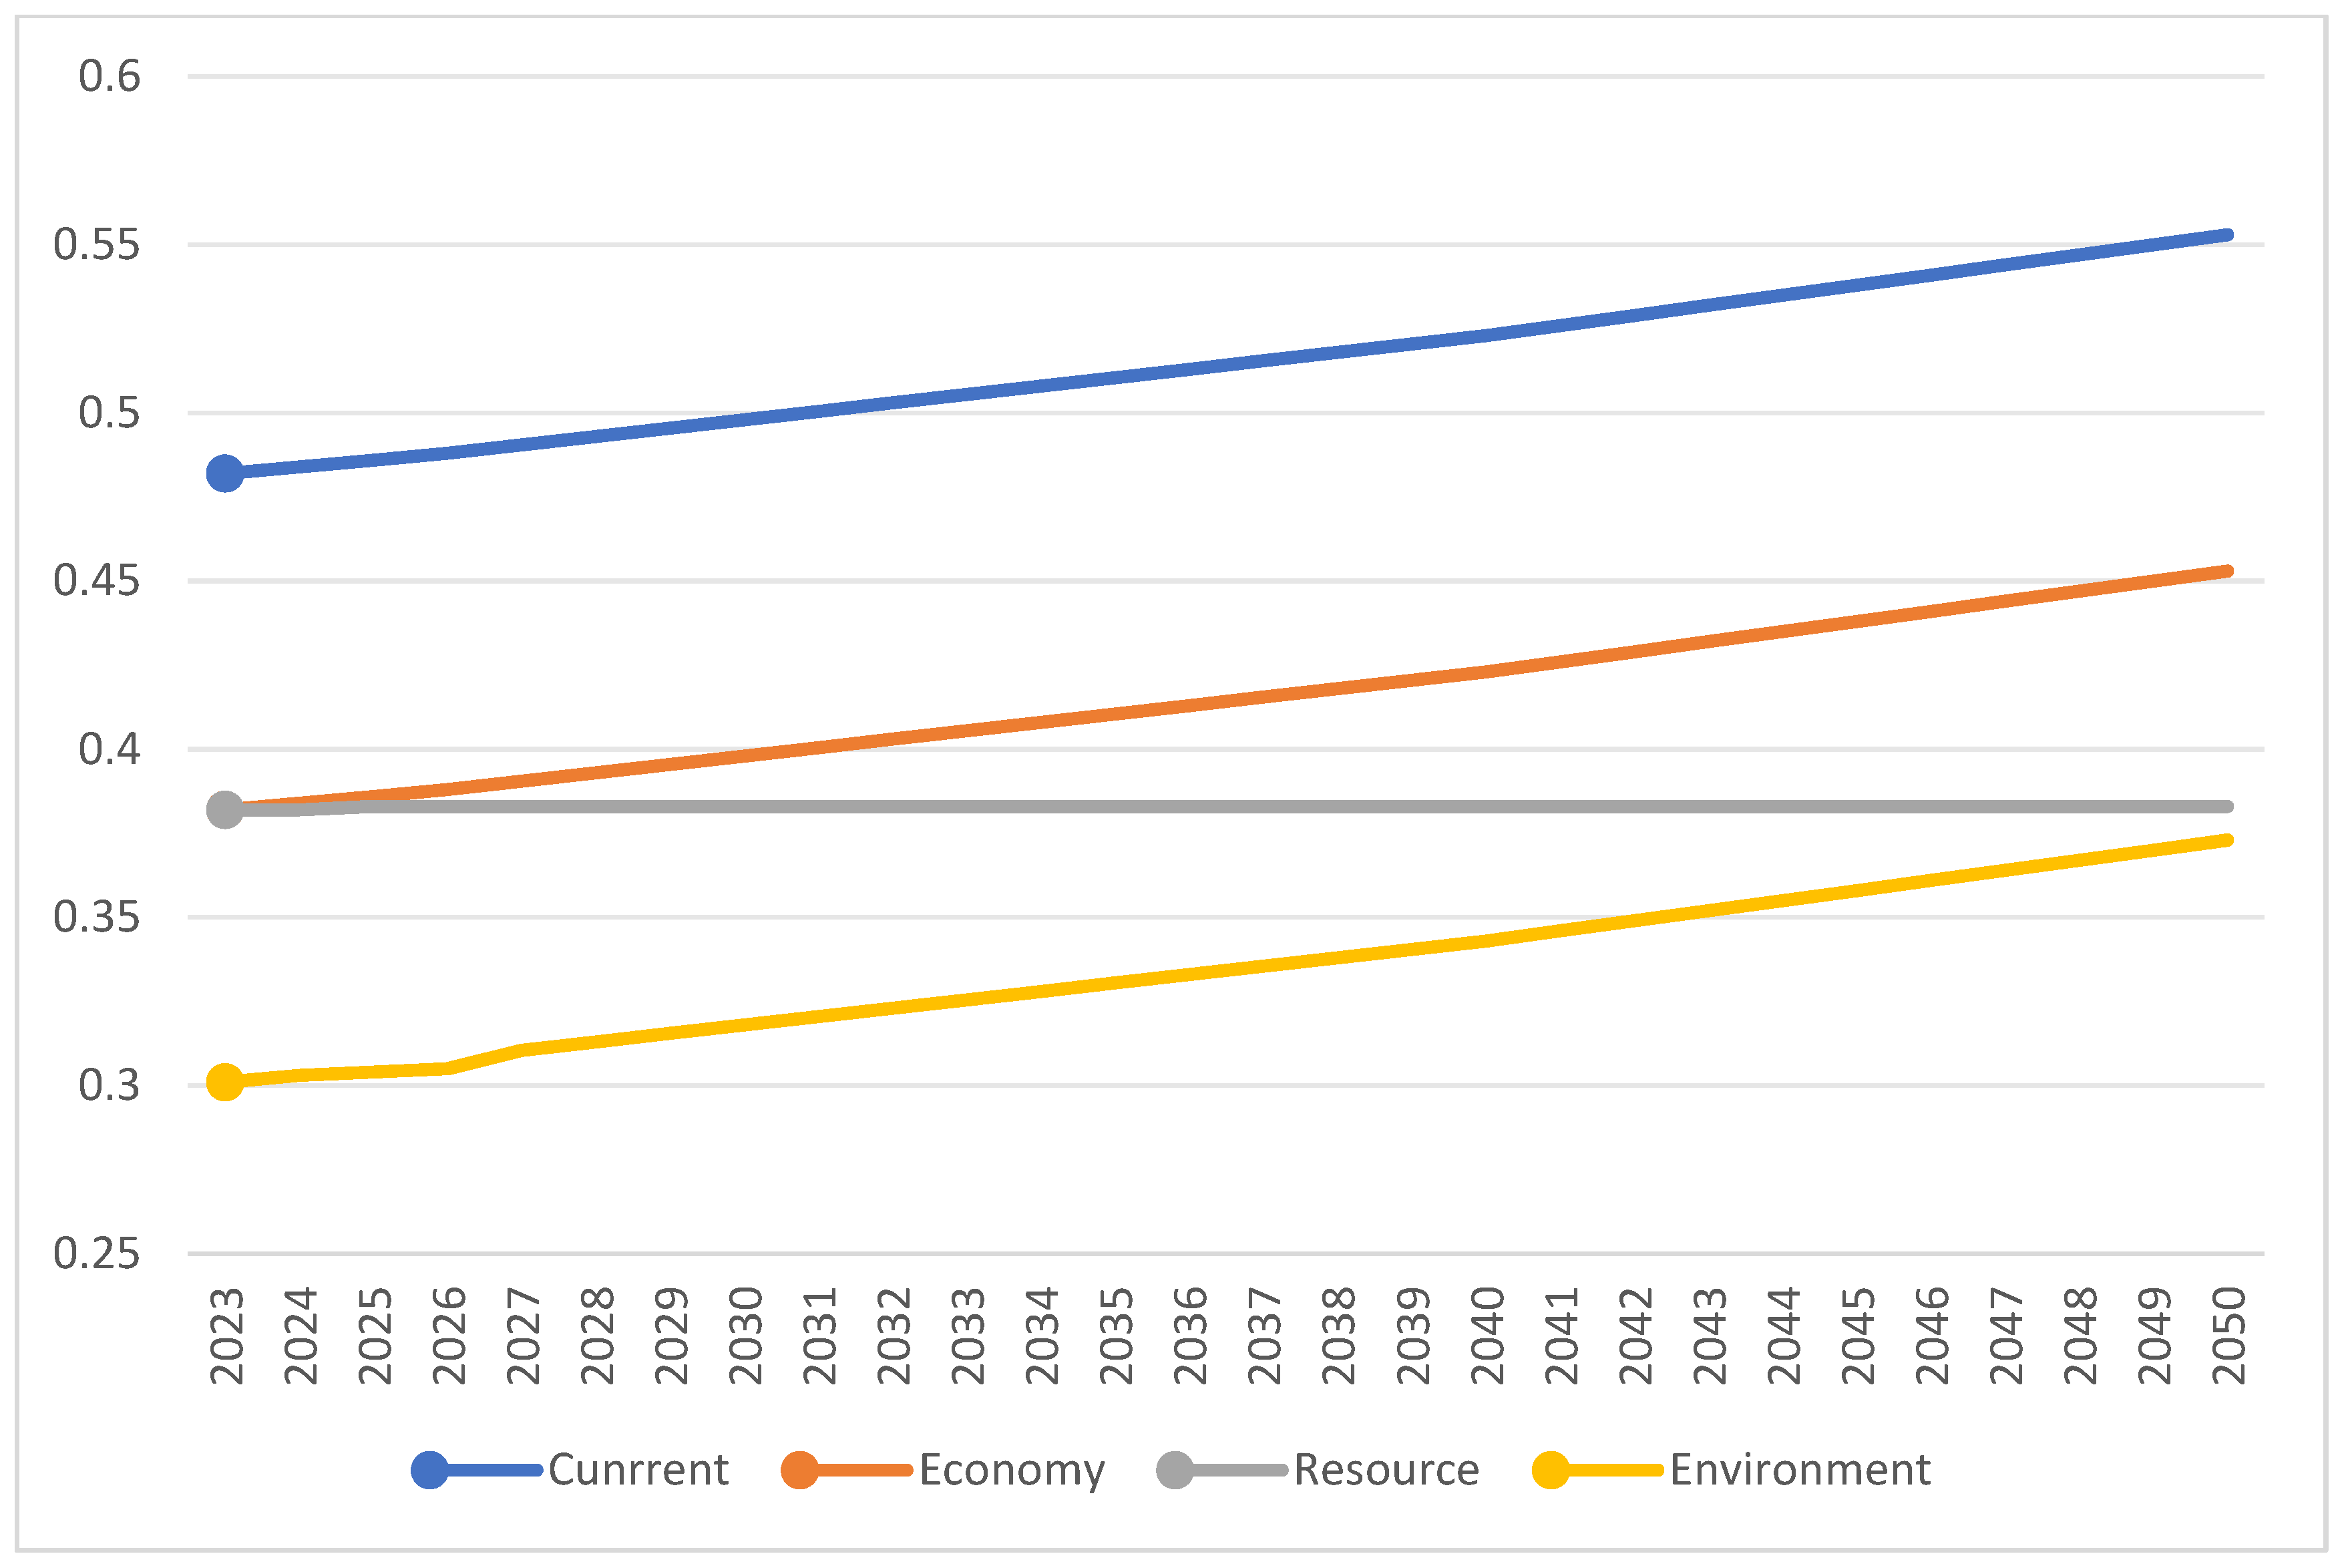
The marine environment subsystem is heavy, and the weights of the five indicators are level. The storm surge disaster area, number of sewage discharge outlets into the sea, marine type of nature reserves in coastal areas, and large-scale direct discharge of industrial wastewater all contribute to the comprehensive exploitation of industrial solid waste. Industrial solid waste is the most extensively used type of waste, and it plays a significant role in the marine environmental subsystem. The integrated use of industrial solid waste effectively protects the marine environment and brings significant economic and social benefits by reducing land-based pollution, promoting a circular economy, preventing marine litter and pollution, promoting sustainable development, and enhancing technological and management innovation. Storm surges not only affect human activities but also damage natural ecosystems. Wetlands and mangroves are important components of coastal ecosystems, and storm surges can lead to the destruction of plant and animal habitats in these areas. Storm surges can carry sediment and pollutants, causing water quality to deteriorate and affecting the survival of aquatic life. Powerful waves and rapid changes in the marine environment can cause damage to marine habitats in coastal and shallow waters, affecting biodiversity.
Figure 13 depicts how the comprehensive level of environmental subsystems changes from 2023 to 2050 under various scenarios. The outcomes, similar to the two other subsystems, follow an upward trend across all scenarios throughout the simulation period. The environmental scenario outperforms the economic scenario. The resource scenario marginally outperforms the current scenario, with the difference between the two increasing over time. We can link this discovery to the positive environmental consequences of continuous improvements in the energy mix.
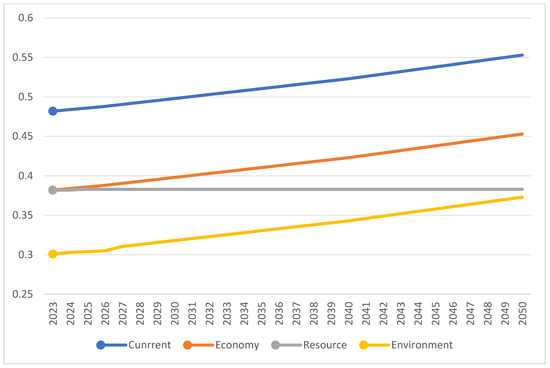
Figure 13.
Trends in the comprehensive level of the environment subsystem under different scenarios.
5.2. CCD Results Under Different Scenarios
The above data show that the evolutionary paths of marine subsystems vary across circumstances. Hence, a complete evaluation approach should be used to examine and compare the effectiveness of each strategy. As the marine ERE model has many complicated relationships, this study uses the CCDM from Section 3.2 to determine the degree of coupling and the best case scenario.
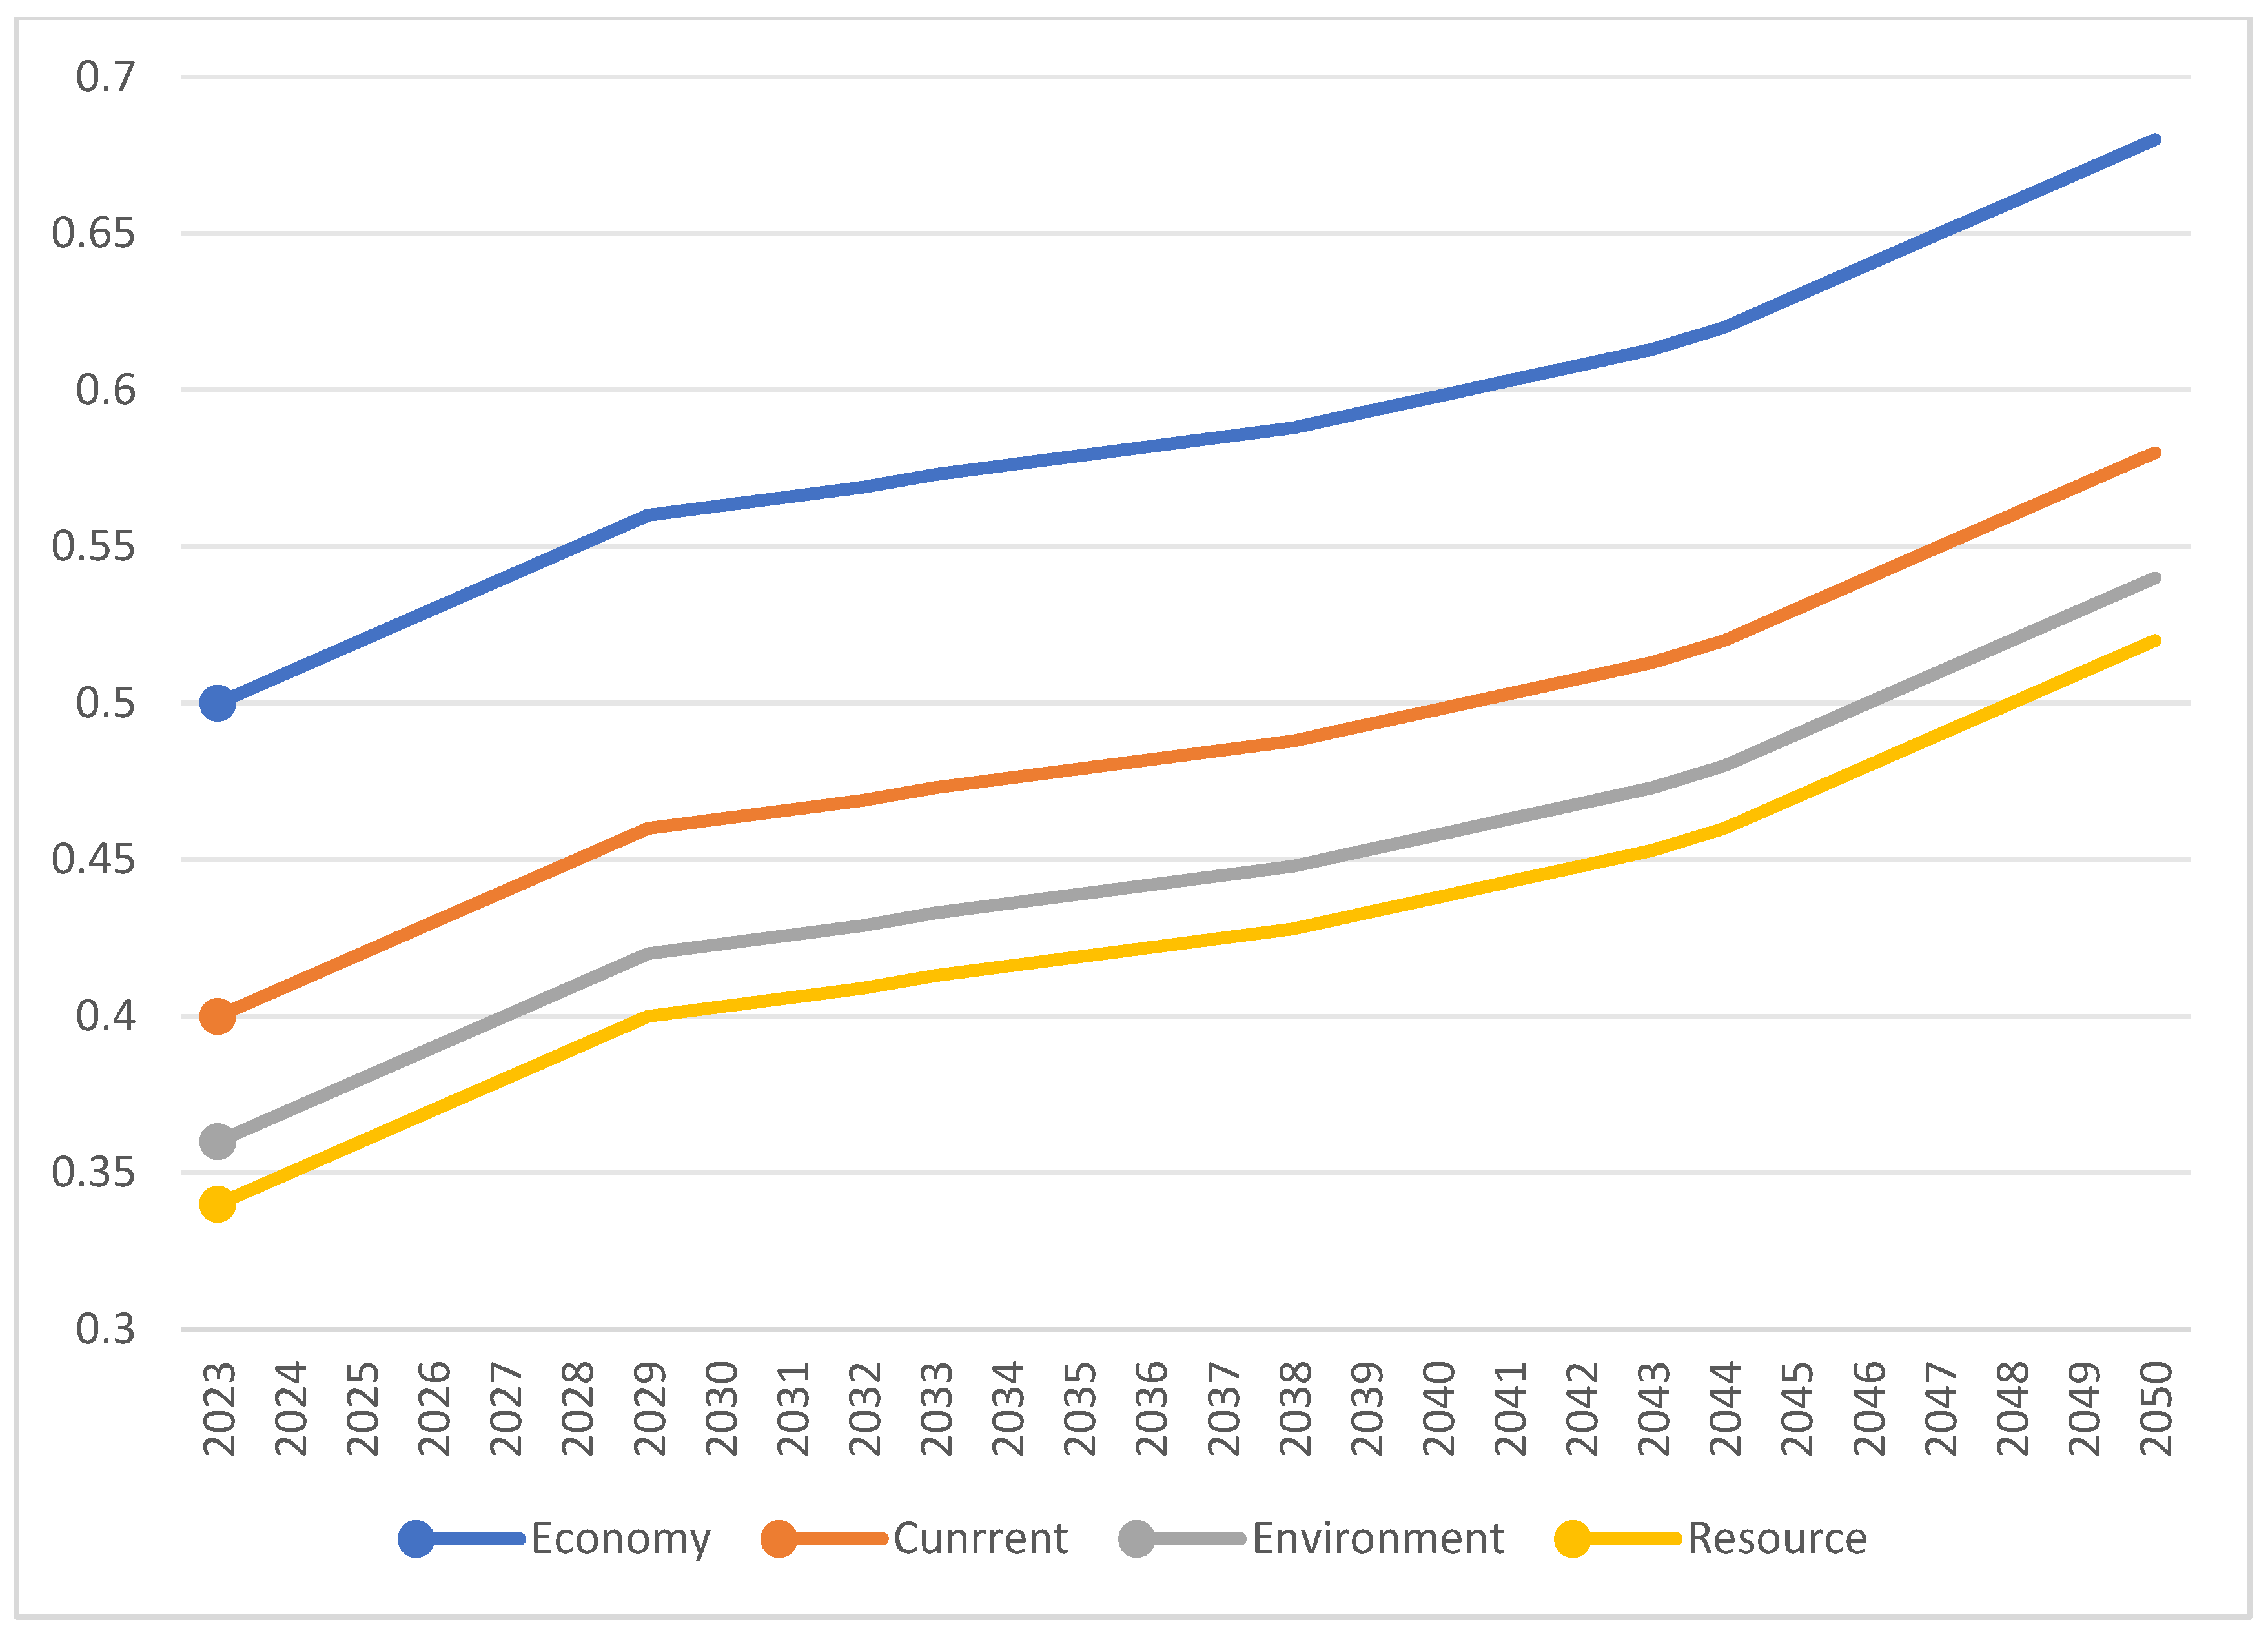
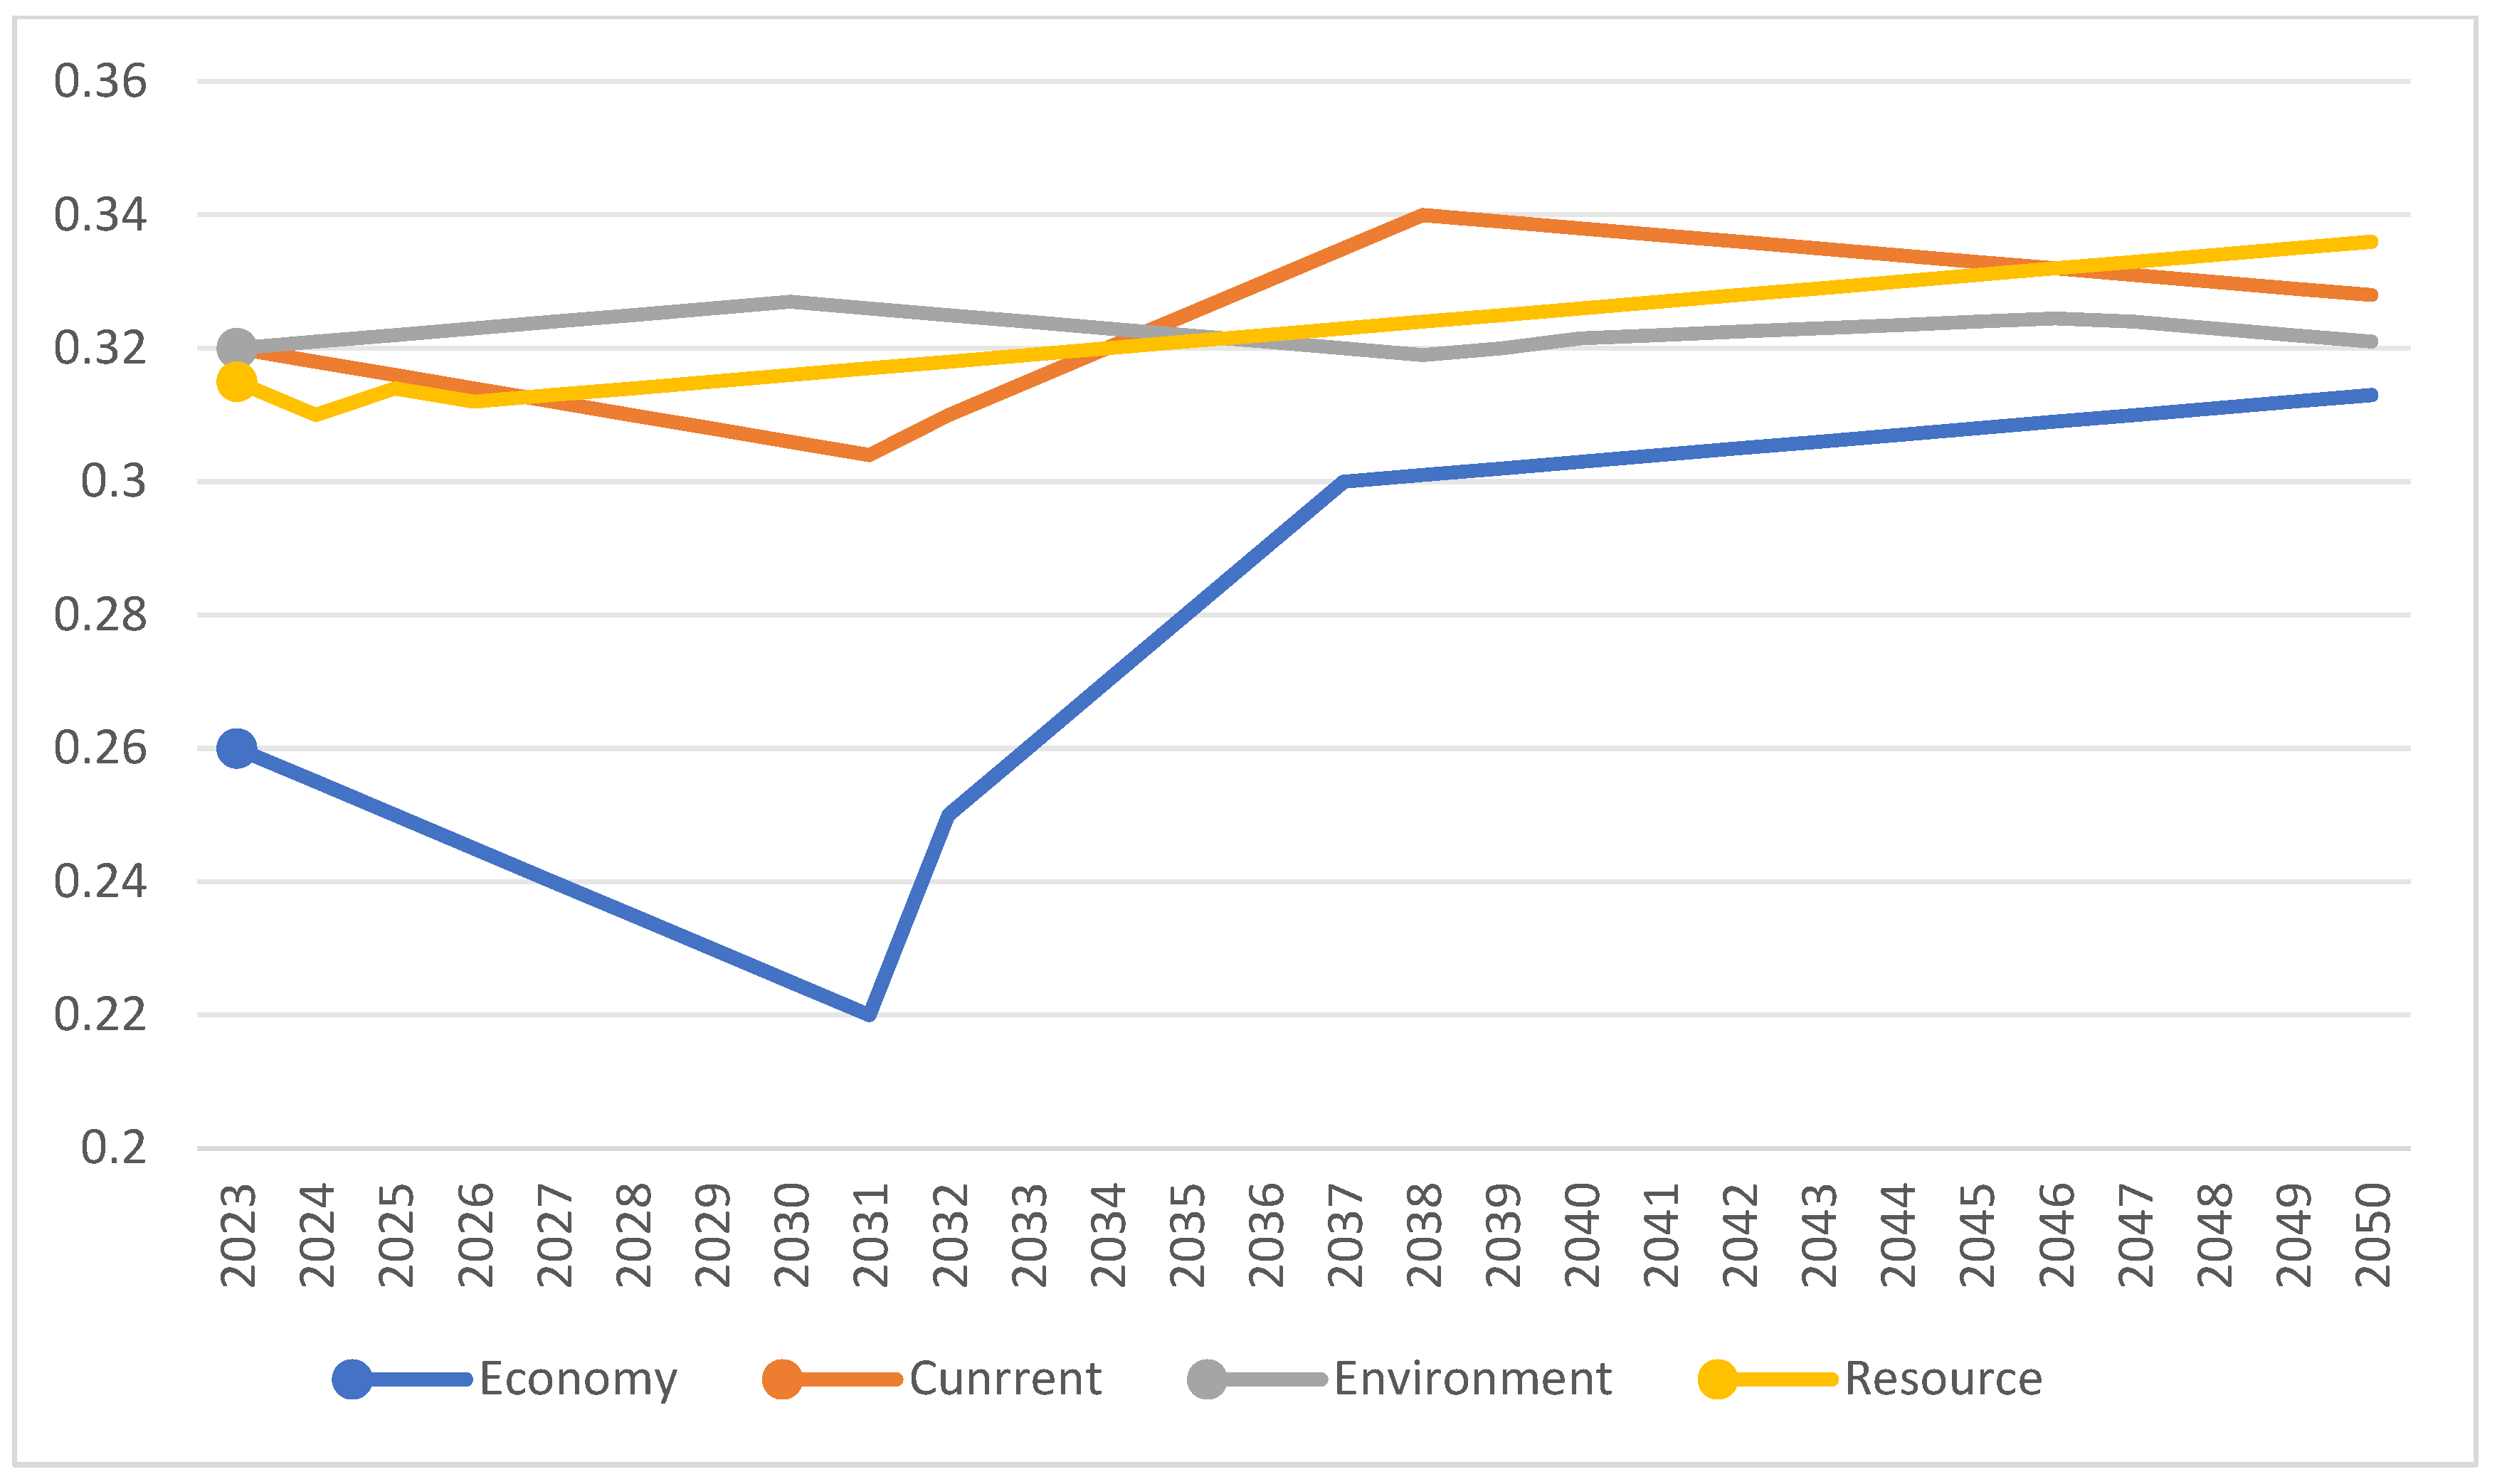
Figure 14 displays the pattern of coupling degree changes over the four scenarios, indicating the interaction of various subsystems. Clearly, the patterns in these four scenarios vary significantly. Although the total connectivity grows across the simulation period, the economic scenario remains at its lowest level. The other three possibilities fluctuate slightly but remain between 0.30 and 0.34. The resource scenario has the lowest degree of coupling at the start of the simulation interval, but it rapidly increases with time, eventually surpassing the environment and current scenarios in 2035. In the later stages, the general state of the environment and current condition fluctuates and eventually declines.
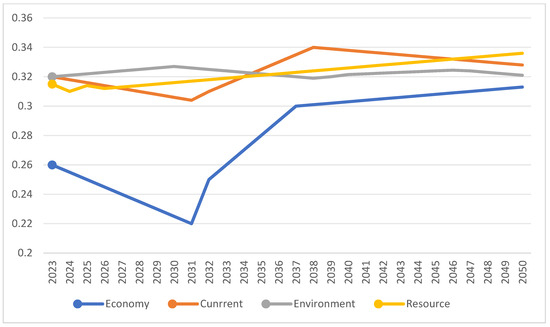
Figure 14.
Trends in the coupling degree under different scenarios.
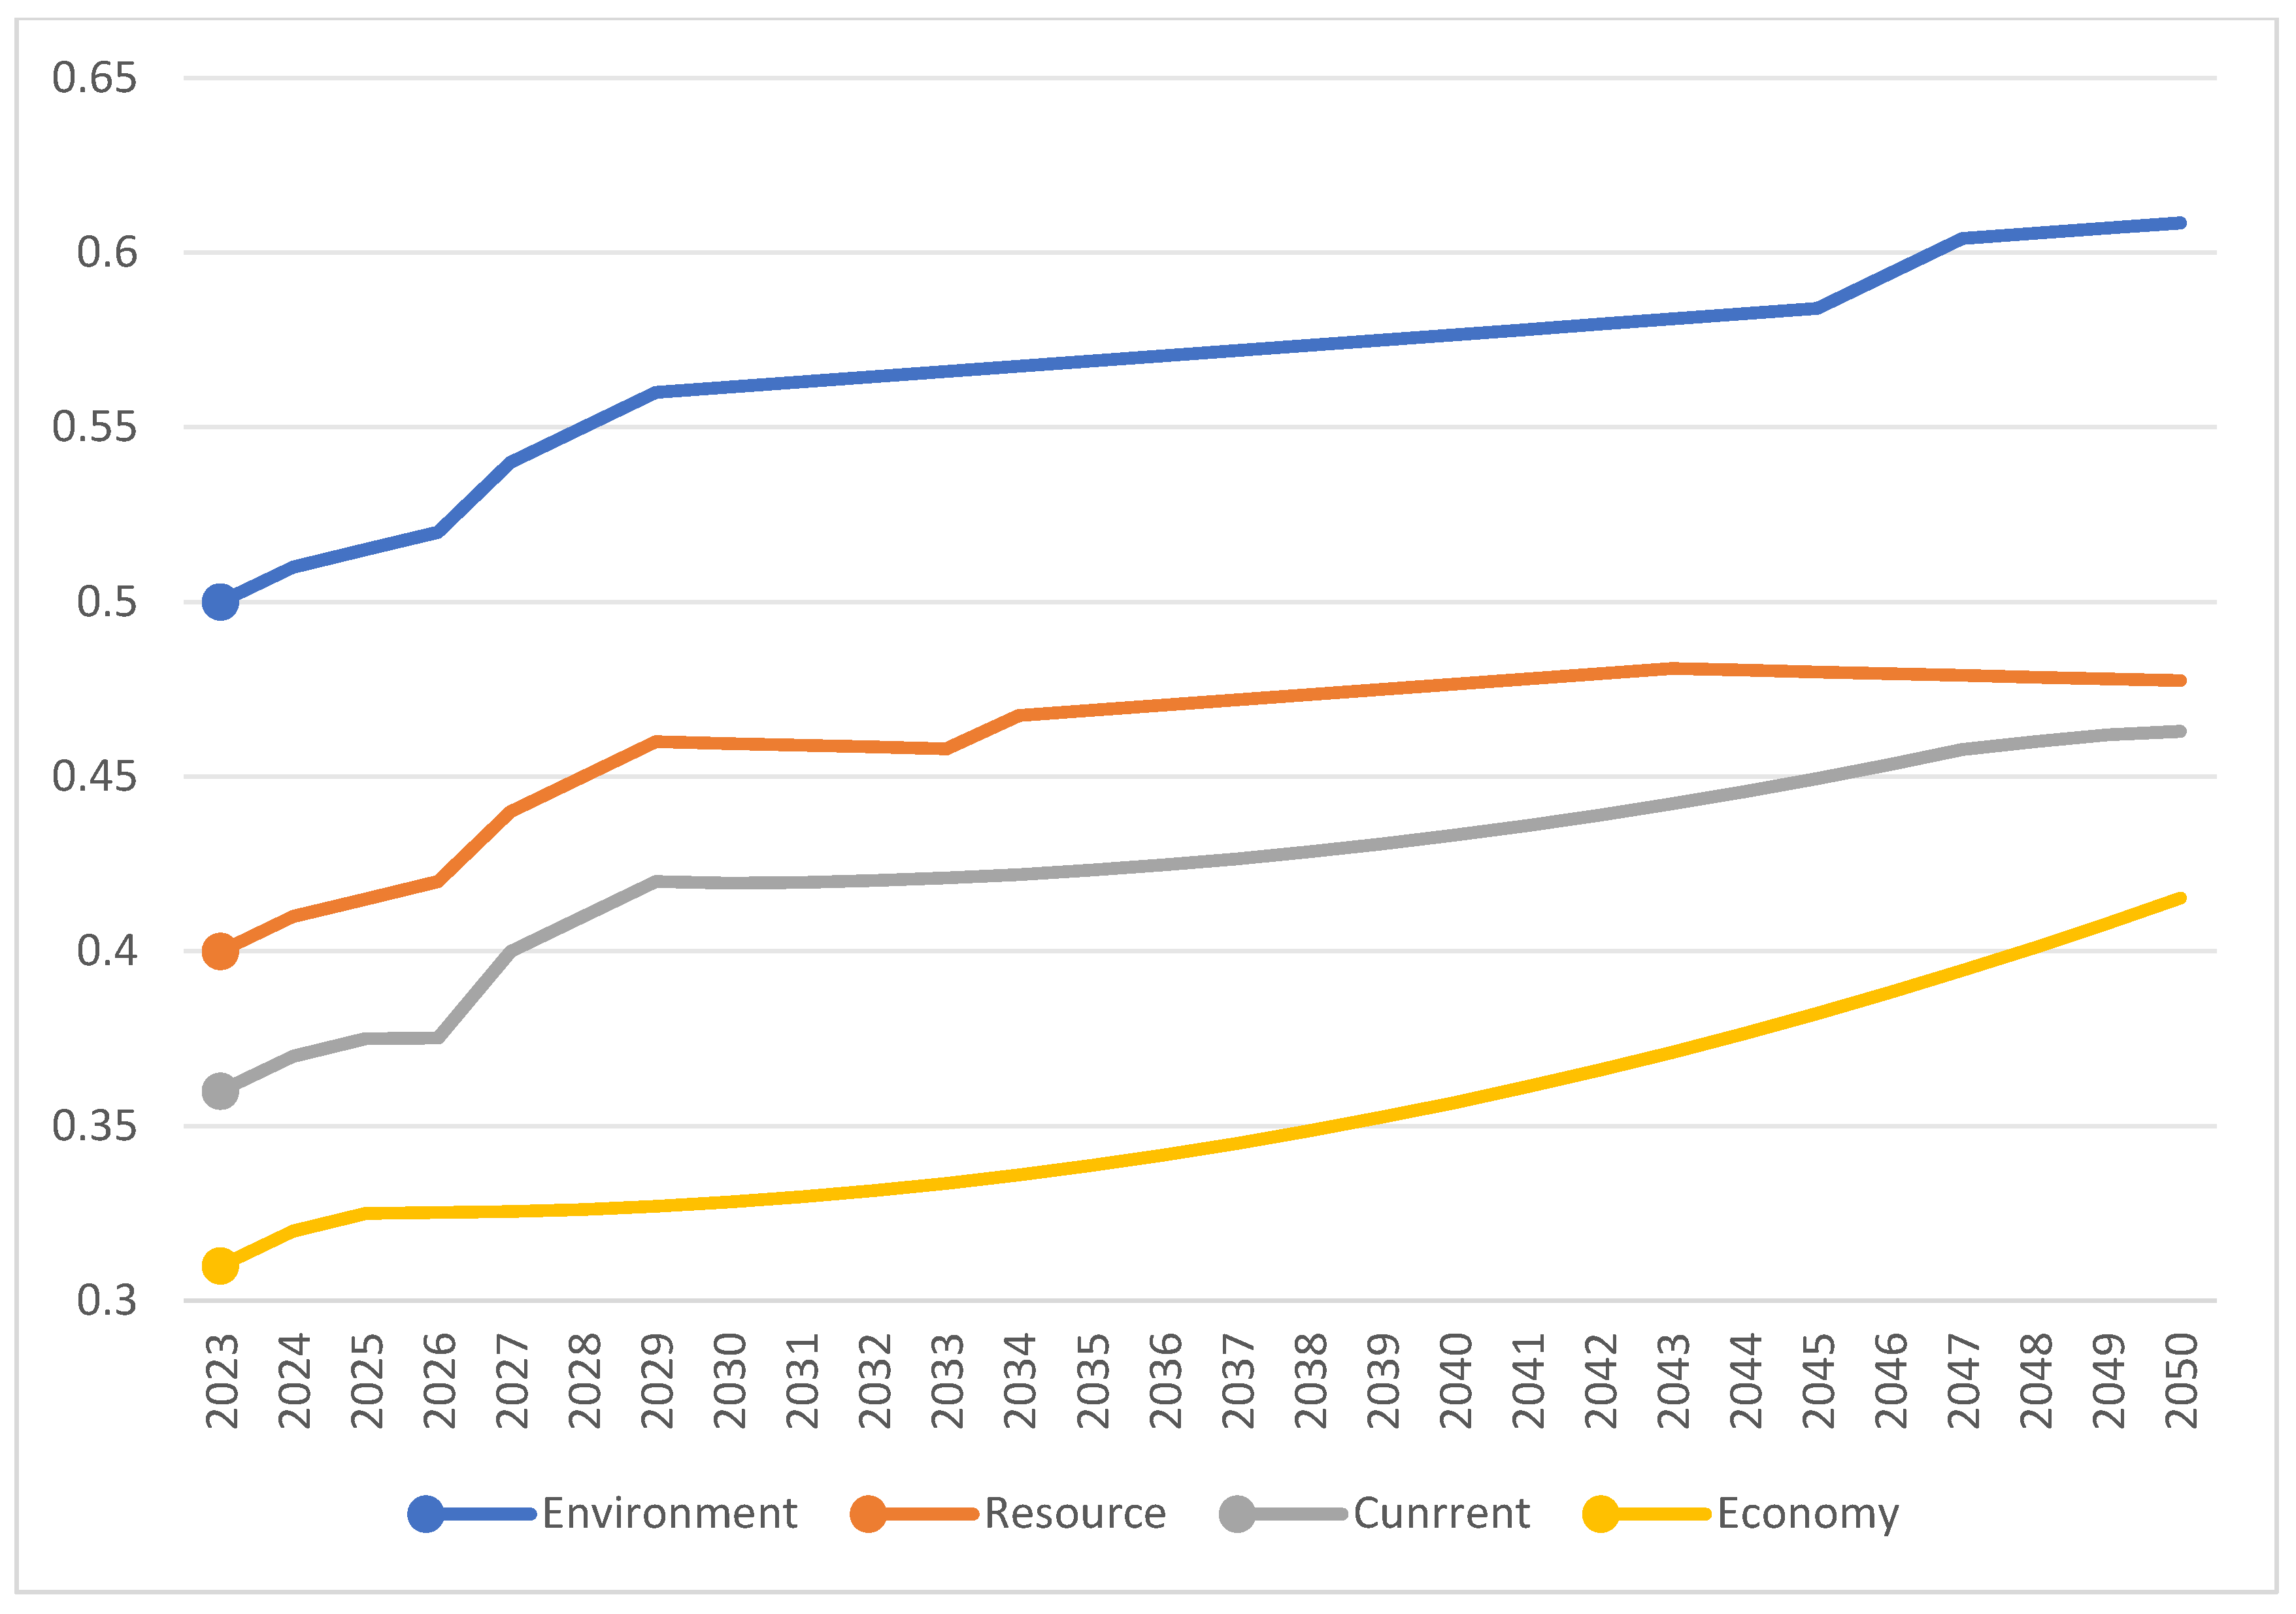
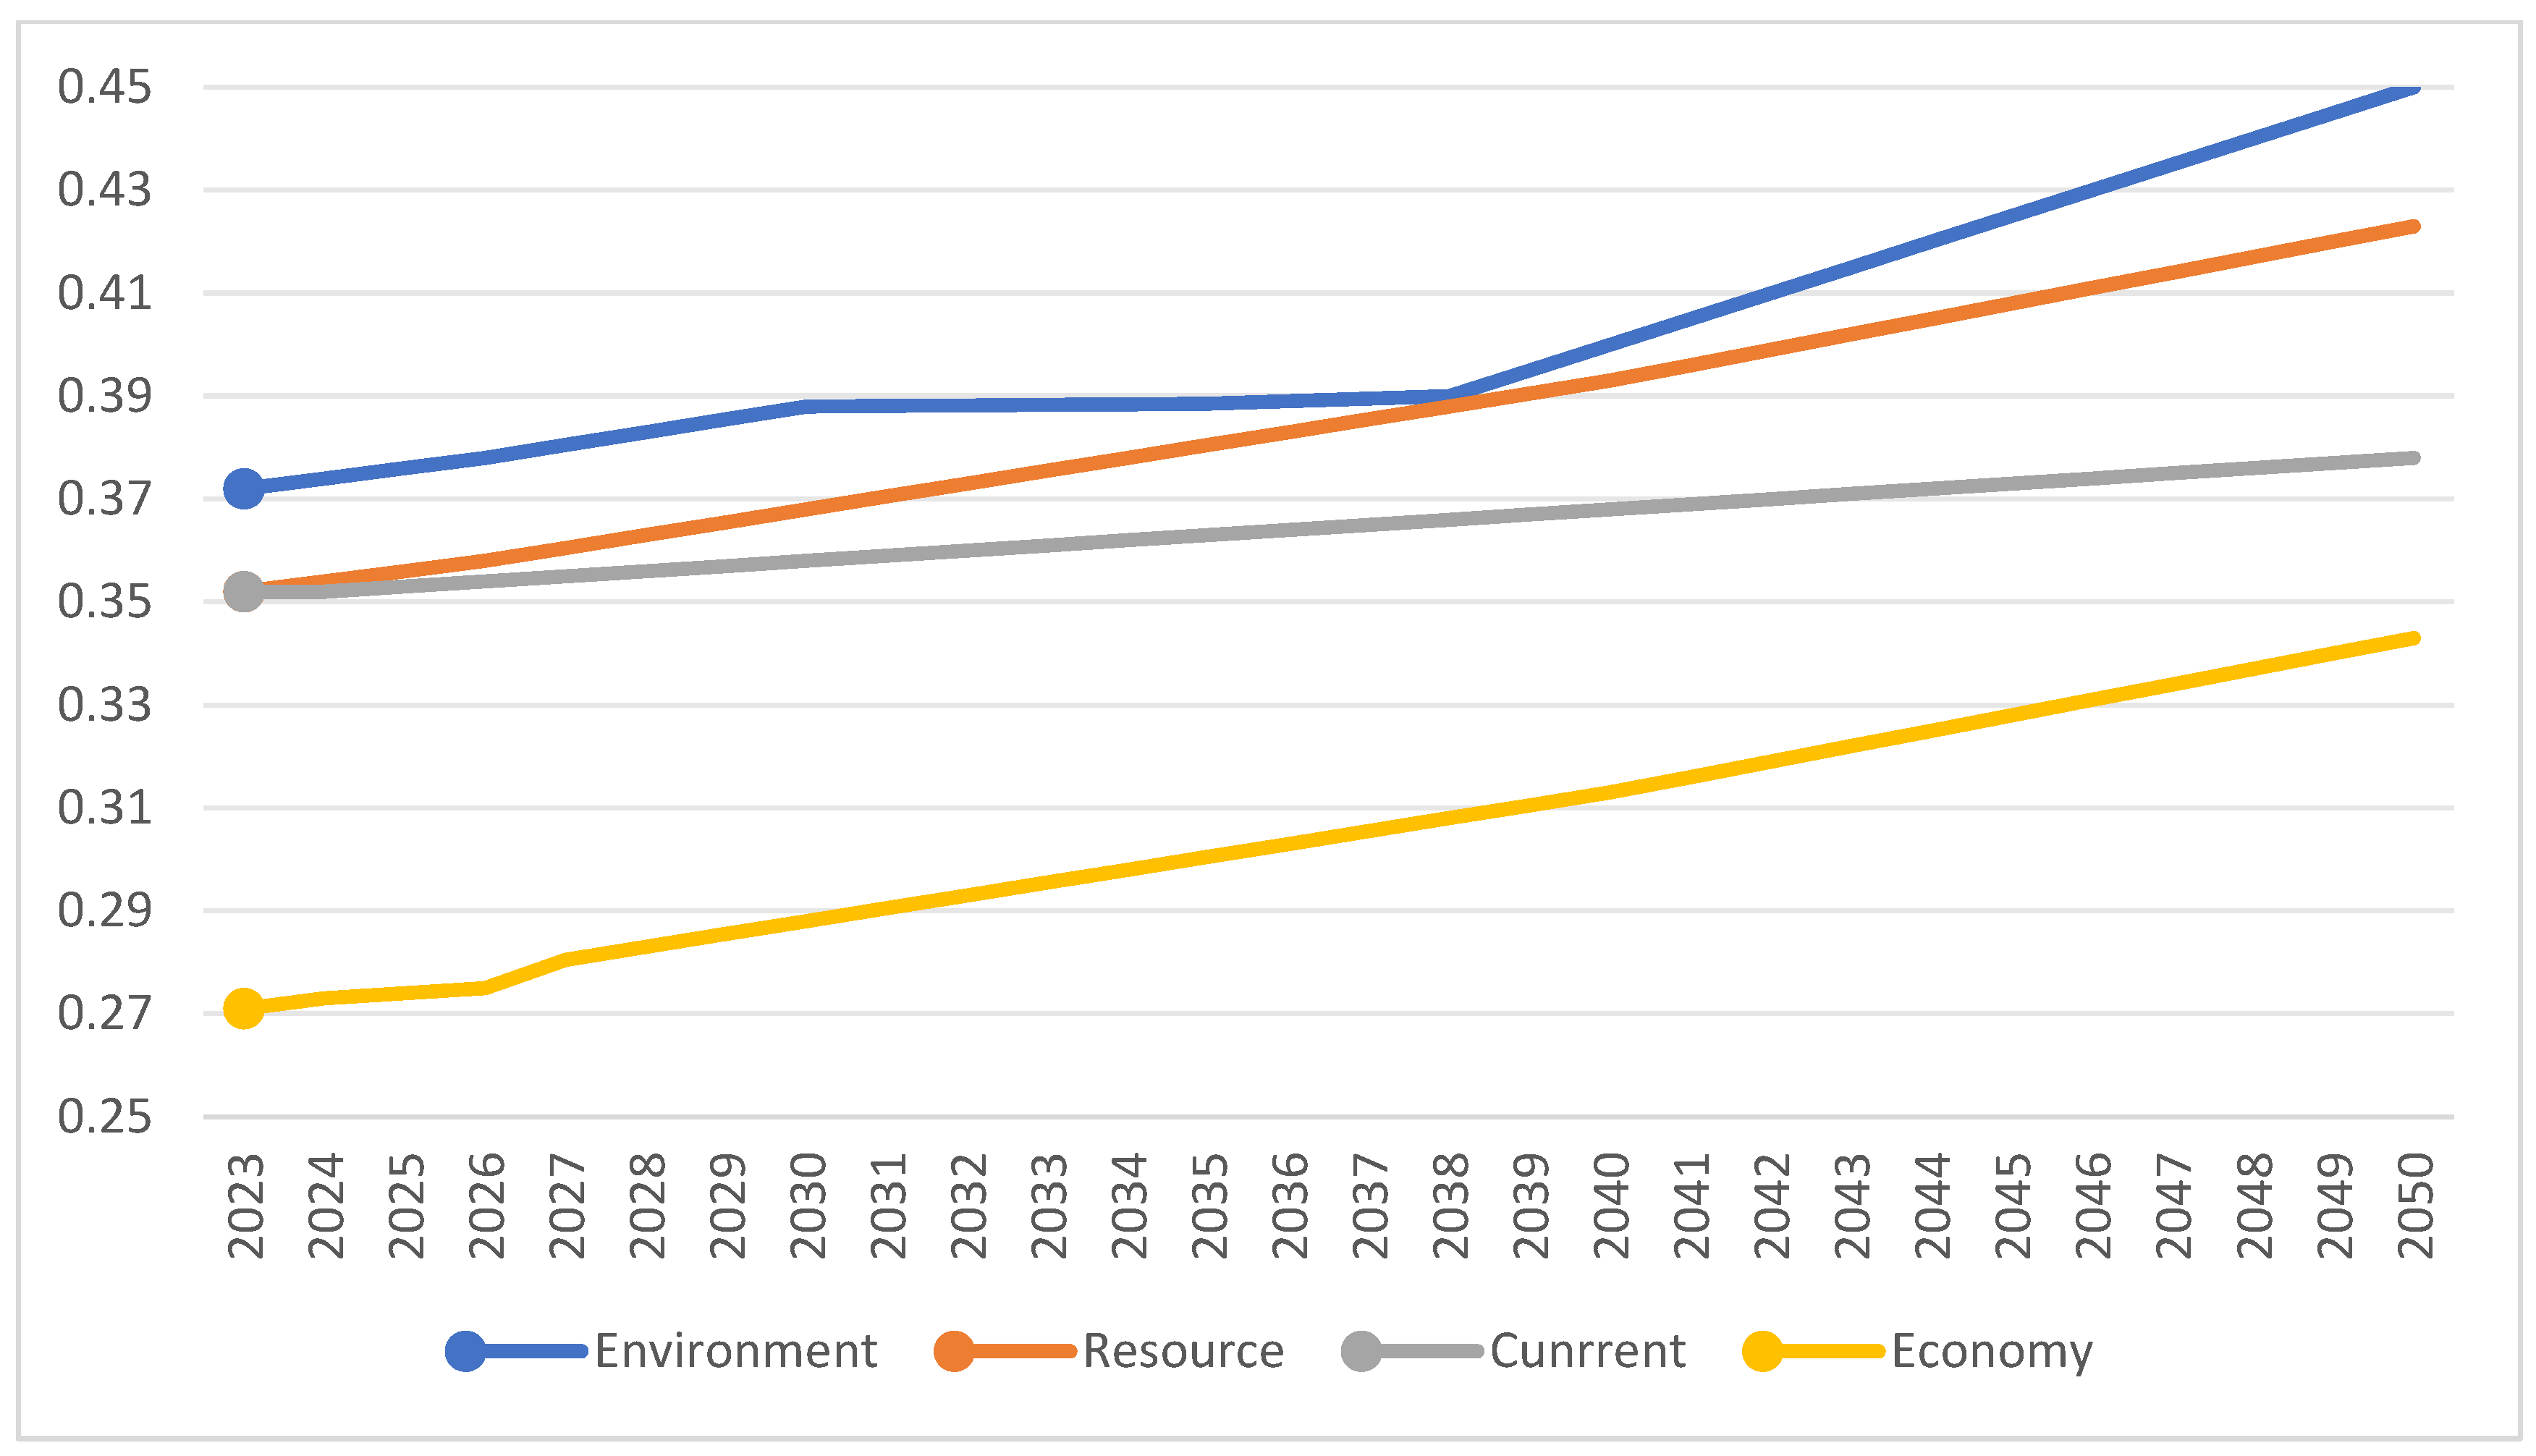
A comparison of the CCD under the four scenarios shows that, although there are some differences, the overall trend is consistent (Figure 14). The results in Table 3 show that all scenarios are slightly uneven during the simulation period. Figure 15 shows that weak coupling between the three subsystems is the primary cause of the low CCD level. We then investigate and comment on the evolution of CCD in each scenario.
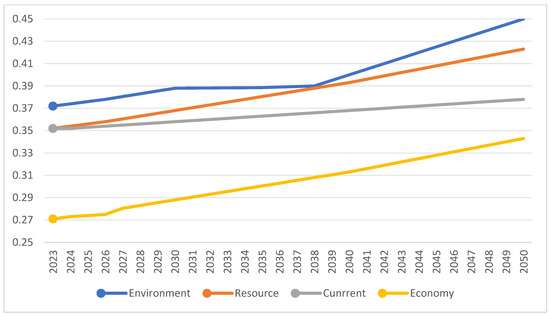
Figure 15.
Trends in the CCD under different scenarios.
- (1)
- Economic scenario: The CCD value grew from 0.28 to 0.32, the lowest among all scenarios. Throughout the simulation interval, the marine economic subsystem performed well, while the marine resources and environment subsystem performed poorly. These findings help clarify the lack of coupling phenomena depicted in Figure 14, demonstrating that an overemphasis on economic development will result in disorganized expansion in China’s maritime economy.
- (2)
- Resource scenario: In this scenario, the CCD value rose from 0.53 to 0.2 before finally reaching the ideal level. This expansion can be separated into two stages (Figure 15). Although the resource level in this scenario peaked between 2023 and 2050, the economic and environmental levels were relatively modest, resulting in a lesser coupling degree than the current and environmental scenarios (Figure 13). As the benefits of enhanced energy structure and natural environment become more obvious after 2023, we see an acceleration in the CCD value during this period.
- (3)
- Environmental scenario: In this scenario, the CCD value rose from 0.37 to 0.46 and remained in the optimal condition. The proportions of each component in this scenario stay high in comparison to other scenarios (Figure 10, Figure 11 and Figure 12). However, as the resource level decreases after 2035, coupling begins to gradually decrease (Figure 11).
6. Conclusions
6.1. Results
We investigated and appraised the simulation results of China’s marine industry system using the methods and theories of SD and the CCDM. We first used SD to create a system model that integrates the interactions of the marine ERE subsystems. We then evaluated the CCD under various circumstances using the developed CCDM. Specifically, our SD model adjusts parameters to replicate four typical scenarios: the maritime economy, resources, environment, and the present. This research aimed to clearly illustrate the interdependence of various components within the marine ERE system through a comparative analysis of these four scenarios and, ultimately, offer guidance for the sustainable development of the marine industry in other countries. This investigation’s conclusions reveal the following: (1) The SD model we developed can accurately replicate the dynamic interactions in the marine ERE system. (2) Different scenarios highlight different elements. Compared to the current scenario, the marine economic scenario promotes economic growth while harming the environment and resources. On the contrary, the resource and environmental scenarios are both beneficial to energy conservation and emission reduction but not to marine economic development. (3) The coupling levels of the various scenarios differ. In comparison to the current scenario, the economic scenario performs poorly, while the environmental scenario performs well. However, the resource scenario has a greater influence on the long-term coordinated growth of the urban ERE system.
These conclusions may differ from the research of other scholars in that this study focuses on the relationship between different factors. Some scholars may be more inclined to emphasize the importance of economic growth and believe that the development of the marine economy is a priority. They may believe that the development of the marine economy can create employment opportunities, promote industrial upgrading, and increase fiscal revenue, thereby driving the growth of the entire economy. Long-term economic development must be based on the sustainable use of the environment and its resources.
This view often focuses on the positive impact of economic development on social stability and the improvement of people’s lives. To achieve sustainability in the marine economy, China and governments around the world should take beneficial actions to promote diversification and technological innovation, rationally manage and efficiently use marine resources, effectively protect the marine ecological environment, and strengthen international cooperation and coordination, beginning with the economy, resources, and environment. These efforts will not only serve to foster the healthy development of the maritime sector but also contribute to the global aim of sustainable development.
6.2. Research Shortcomings
This study has some limitations that need to be improved in future research: (1) The complexity of model construction. The marine ERE system is a huge and complex system involving the interaction of multiple factors. The establishment of a dynamic simulation and evaluation model needs to consider the influence of various factors, making model construction very complicated. (2) Difficulty in data acquisition. The marine ERE system involves data from multiple fields, including economic data, resource data, and environmental data, among various others. The acquisition and organization of these data require considerable time and effort, and sometimes, the quality and integrity of the data cannot be guaranteed. (3) Uncertainty in parameter settings. Various parameters need to be set when building a model, but the values of some parameters may have certain uncertainties. Different parameter settings may lead to different simulation results, thus affecting the accuracy of the evaluation.
Author Contributions
Conceptualization, W.Y.; Methodology, X.W. All authors have read and agreed to the published version of the manuscript.
Funding
This research was funded by [Sino-Indonesian technical cooperations in coastal marine ranching, Asian Cooperation Fund Program] grant number [12500101200021002]; [Research on Trading System Based on Marine Carbon Sink Accounting in Guangdong Province, Guangdong Provincial Department of Education Youth innovative talent project] grant number [2023WQNCX022]; [Study on the value and realization of mangrove carbon Sink in Guangdong Province, Humanities and Social Sciences project, Guangdong Ocean University] grant number [030301522302]; [2024 Youth Innovation Talent Program in Ordinary Universities of Guangdong Province] grant number [2024WQNCX097]; And The APC was funded by [12500101200021002]. Information regarding the funder and the funding number should be provided.
Data Availability Statement
The data is included in the article. The data used are from Marine Information Network of PRC (http://www.nmdis.org.cn), Ministry of Ecology and Environment, PRC (https://www.mee.gov.cn).
Conflicts of Interest
The authors declare no conflict of interest.
References
- Zeller, D.; Palomares, M.L.; Pauly, D. Global Fisheries Science Documents Human Impacts on Oceans: The Sea Around Us Serves Civil Society in the Twenty-First Century. Annu. Rev. Mar. Sci. 2023, 15, 147–165. [Google Scholar] [CrossRef] [PubMed]
- Chen, J.; Chen, H.; Smith, T.F.; Rangel-Buitrago, N. Analyzing the impact and evolution of ocean & coastal management: 30 years in retrospect. Ocean Coast. Manag. 2023, 242, 106697. [Google Scholar] [CrossRef]
- Desiderius, C.P.M. Coastal and marine resource use conflicts and sustainable development in Tanzania. Ocean Coast. Manag. 2000, 43, 475–494. [Google Scholar]
- Qian, X. Research on the coordinated development model of marine ecological environment protection and economic sustainable development. J. Sea Res. 2023, 193, 102377. [Google Scholar] [CrossRef]
- Wang, S.; Li, W.; Xing, L. A Review on Marine Economics and Management: How to Exploit the Ocean Well. Water 2022, 14, 2626. [Google Scholar] [CrossRef]
- Li, J.-M.; Jiang, S.-S. How can governance strategies be developed for marine ecological environment pollution caused by sea-using enterprises?—A study based on evolutionary game theory. Ocean Coast. Manag. 2023, 232 (Suppl. C), 106447. [Google Scholar] [CrossRef]
- Zhang, K.; Tian, S.-Z.; Wu, Y.; Wu, J.; Liu, N.; Wang, D. Evaluation of China’s maritime power construction index and policy textual analysis. Mar. Econ. Manag. 2023, 6, 59–71. [Google Scholar] [CrossRef]
- Pata, U.K.; Erdogan, S.; Ozkan, O. Is reducing fossil fuel intensity important for environmental management and ensuring ecological efficiency in China? J. Environ. Manag. 2023, 329 (Suppl. C), 117080. [Google Scholar] [CrossRef]
- Yao, W.; Zhang, W.; Li, W. Promoting the development of marine low carbon through the digital economy. J. Innov. Knowl. 2023, 8, 100285. [Google Scholar] [CrossRef]
- Péquin, B.; Cai, Q.; Lee, K.; Greer, C.W. Natural attenuation of oil in marine environments: A review. Mar. Pollut. Bull. 2022, 176, 113464. [Google Scholar] [CrossRef]
- Ren, W.; Ji, J. How do environmental regulation and technological innovation affect the sustainable development of marine economy: New evidence from China’s coastal provinces and cities. Mar. Policy 2021, 128, 104468. [Google Scholar] [CrossRef]
- Kong, H.; Zhang, Y.; Zhang, Y.; Xu, Y.; Zhou, G.; Wang, S. Exploring Integrated Ocean Management Policy in China: Evolution, Challenges, and Prospects. Water 2024, 16, 1673. [Google Scholar] [CrossRef]
- Hu, W.d.; Liu, J.; Ma, Z.; Wang, Y.; Zhang, D.; Yu, W.; Chen, B. China’s marine protected area system: Evolution, challenges, and new prospects. Mar. Policy 2020, 115, 103780. [Google Scholar] [CrossRef]
- Li, Y. Legislation and Policy on Pollution Prevention and the Control of Marine Microplastics. Water 2022, 14, 2790. [Google Scholar] [CrossRef]
- Zou, W.; Yang, Y.; Yang, M.; Zhang, X.; Lai, S.; Chen, H. Analyzing efficiency measurement and influencing factors of China’s marine green economy: Based on a two-stage network DEA model. Front. Mar. Sci. 2023, 10, 1020373. [Google Scholar] [CrossRef]
- Allen, C.; Metternicht, G.; Wiedmann, T. National pathways to the Sustainable Development Goals (SDGs): A comparative review of scenario modelling tools. Environ. Sci. Policy 2016, 66, 199–207. [Google Scholar] [CrossRef]
- Schoenenberger, L.; Schmid, A.; Tanase, R.; Beck, M.; Schwaninger, M. Structural Analysis of System Dynamics Models. Simul. Model. Pract. Theory 2021, 110, 102333. [Google Scholar] [CrossRef]
- Perry, R.I.; Cury, P.; Brander, K.; Jennings, S.; Möllmann, C.; Planque, B. Sensitivity of marine systems to climate and fishing: Concepts, issues and management responses. J. Mar. Syst. 2010, 79, 427–435. [Google Scholar] [CrossRef]
- Wu, Y.; Li, H.; Gu, Y.; Hu, H.; Zhou, G.; Yuan, Q. How can the lead industry improve sustainability based on the resource-economy-carbon nexus system? Sustain. Prod. Consum. 2024, 49, 82–91. [Google Scholar] [CrossRef]
- Zhang, Y.; Zhu, T.; Guo, H.; Yang, X. Analysis of the coupling coordination degree of the Society-Economy-Resource-Environment system in urban areas: Case study of the Jingjinji urban agglomeration, China. Ecol. Indic. 2023, 146 (Suppl. C), 109851. [Google Scholar] [CrossRef]
- Xu, Y.; Chen, B.; Wu, J.; Dan, S.F.; Zhang, X.; Lu, D.; Duan, K. Comparative assessment of the environmental pollution and marine economic growth of Guangxi and China by using the environmental Kuznets curve fitting mode. Environ. Sci. Pollut. Res. Int. 2023, 30, 119406–119418. [Google Scholar] [CrossRef] [PubMed]
- Jin, Y.; Xie, K.; Liu, G.; Peng, Y.; Wan, B. Nonlinear dynamics modeling and analysis of a marine buoy single-point mooring system. Ocean Eng. 2022, 262, 112031. [Google Scholar] [CrossRef]
- Shao, Q.; Guo, G.; Junjie, K.; Kang, P. Environmental response to growth in the marine economy and urbanization: A heterogeneity analysis of 11 Chinese coastal regions using a panel vector autoregressive model. Mar. Policy 2021, 124, 104350. [Google Scholar] [CrossRef]
- Noble, M.M.; Harasti, D.; Pittock, J.; Doran, B. Linking the social to the ecological using GIS methods in marine spatial planning and management to support resilience: A review. Mar. Policy 2019, 108, 103657. [Google Scholar] [CrossRef]
- dos Santos, L.C.T.; Giannetti, B.F.; Agostinho, F.; Liu, G.; Almeida, C.M. A multi-criteria approach to assess interconnections among the environmental, economic, and social dimensions of circular economy. J. Environ. Manag. 2023, 342, 118317. [Google Scholar] [CrossRef]
- Jing, Z.; Wang, J. Sustainable development evaluation of the society–economy–environment in a resource-based city of China:A complex network approach. J. Clean. Prod. 2020, 263, 121510. [Google Scholar] [CrossRef]
- Wang, Y.; Song, C.; Cheng, C.; Wang, H.; Wang, X.; Gao, P. Modelling and evaluating the economy-resource-ecological environment system of a third-polar city using system dynamics and ranked weights-based coupling coordination degree model. Cities 2023, 133, 104151. [Google Scholar] [CrossRef]
- Liu, F.; Huang, Y.; Zhang, L.; Li, G. Marine environmental pollution, aquatic products trade and marine fishery Economy—An empirical analysis based on simultaneous equation model. Ocean Coast. Manag. 2022, 222, 106096. [Google Scholar] [CrossRef]
- Sun, J.; Miao, J.; Mu, H.; Xu, J.; Zhai, N. Sustainable development in marine economy: Assessing carrying capacity of Shandong province in China. Ocean Coast. Manag. 2022, 216, 105981. [Google Scholar] [CrossRef]
- Guo, J.; Yuan, X.; Song, W. Driving forces on the development of China’s marine economy: Efficiency and spatial perspective. Ocean Coast. Manag. 2022, 224, 106192. [Google Scholar] [CrossRef]
- Bao, C.; Wang, H.; Sun, S. Comprehensive simulation of resources and environment carrying capacity for urban agglomeration: A system dynamics approach. Ecol. Indic. 2022, 138, 108874. [Google Scholar] [CrossRef]
- Xing, L.; Xue, M.; Hu, M. Dynamic simulation and assessment of the coupling coordination degree of the economy–resource–environment system: Case of Wuhan City in China. J. Environ. Manag. 2019, 230, 474–487. [Google Scholar] [CrossRef]
- Chen, X.; Yu, Z.; Liang, C.; Di, Q. Where Is the Path to Sustainable Marine Development? Evaluation and Empirical Analysis of the Synergy between Marine Carrying Capacity and Marine Economy High-Quality Development. Water 2024, 16, 394. [Google Scholar] [CrossRef]
- Shao, W.; Xiong, Y.; Shi, D.; Xu, X.; Yue, W.; Soomro, M.A. Time dependent analysis of lateral bearing capacity of reinforced concrete piles combined with corrosion and scour. Ocean Eng. 2023, 282, 115065. [Google Scholar] [CrossRef]
- Yao, W.; Zhang, W.; Li, W.; Li, P. Measurement and Evaluation of Convergence of Japan’s Marine Fisheries and Marine Tourism. Sustainability 2022, 14, 9108. [Google Scholar] [CrossRef]
- Lebdioui, A. The political economy of moving up in global value chains: How Malaysia added value to its natural resources through industrial policy. Rev. Int. Political Econ. 2022, 29, 870–903. [Google Scholar] [CrossRef]
- Wang, S.; Lu, B.; Yin, K. Financial development, productivity, and high-quality development of the marine economy. Mar. Policy 2021, 130, 104553. [Google Scholar] [CrossRef]
- Ababouch, L.; Nguyen, K.A.T.; de Souza, M.C.; Fernandez-Polanco, J. Value chains and market access for aquaculture products. J. World Aquacult. Soc. 2023, 54, 527–553. [Google Scholar] [CrossRef]
- Huyen, N.T.T.; Hoa, T.T.M.; Ha, L.T. The Role of Knowledge-Sharing in Improving Marine Living Resources Towards Sustainable Blue Economy. J. Knowl. Econ. 2024, 195. [Google Scholar] [CrossRef]
- Zhong, H. Exploitation and utilization of marine resources and protection of marine ecology. IOP Conf. Ser. Earth Environ. Sci. 2019, 369, 012009. [Google Scholar] [CrossRef]
- Iyiola, A.O.; Akinrinade, A.J.; Ajayi, F.O. Effects of Water Pollution on Biodiversity Along the Coastal Regions. In Biodiversity in Africa: Potentials, Threats and Conservation; Springer: Singapore, 2022; pp. 345–367. [Google Scholar]
- Kibria, G.; Nugegoda, D.; Rose, G.; Haroon, A.Y. Climate change impacts on pollutants mobilization and interactive effects of climate change and pollutants on toxicity and bioaccumulation of pollutants in estuarine and marine biota and linkage to seafood security. Mar. Pollut. Bull. 2021, 167, 112364. [Google Scholar] [CrossRef] [PubMed]
- Qi, X. The conceptual framework of the national blue economic system: A multiagent perspective. Mar. Policy 2022, 145, 105287. [Google Scholar] [CrossRef]
- Restrepo-Gómez, D.C.; Zetina-Rejón, M.J.; Zepeda-Domínguez, J.A. Trends in marine fisheries social-ecological systems studies. Ocean Coast. Manag. 2022, 220 (Suppl. C), 106076. [Google Scholar] [CrossRef]
- Kedong, Y.; Liu, Z.; Zhang, C.; Huang, S.; Li, J.; Lv, L.; Su, X.; Zhang, R. Analysis and forecast of marine economy development in China. Mar. Econ. Manag. 2022, 5, 1–33. [Google Scholar] [CrossRef]
- Li, L.; Wu, B.; Patwary, A.K. RETRACTED ARTICLE: How marine tourism promote financial development in sustainable economy: New evidences from South Asia and implications to future tourism students. Environ. Sci. Pollut. Res. 2022, 29, 1155–1172. [Google Scholar] [CrossRef]
- Cochrane, K.L. Reconciling sustainability, economic efficiency and equity in marine fisheries: Has there been progress in the last 20 years? Fish Fish. 2021, 22, 298–323. [Google Scholar] [CrossRef]
- Andrews, N.; Bennett, N.J.; Le Billon, P.; Green, S.J.; Cisneros-Montemayor, A.M.; Amongin, S.; Gray, N.J.; Sumaila, U.R. Oil, fisheries and coastal communities: A review of impacts on the environment, livelihoods, space and governance. Energy Res. Soc. Sci. 2021, 75, 102009. [Google Scholar] [CrossRef]
- Xu, Y.; Lin, J.; Yin, B.; Martens, P.; Krafft, T. Marine fishing and climate change: A China’s perspective on fisheries economic development and greenhouse gas emissions. Ocean Coast. Manag. 2023, 245, 106861. [Google Scholar] [CrossRef]
- Bölük, G.; Mert, M. Fossil & renewable energy consumption, GHGs (greenhouse gases) and economic growth: Evidence from a panel of EU (European Union) countries. Energy 2014, 74, 439–446. [Google Scholar] [CrossRef]
- Guo, J.; Jiang, C.; Wang, Y.; Yang, J.; Huang, W.; Gong, Q.; Zhao, Y.; Yang, Z.; Chen, W.; Ren, H. Exploring ecosystem responses to coastal exploitation and identifying their spatial determinants: Re-orienting ecosystem conservation strategies for landscape management. Ecol. Indic. 2022, 138, 108860. [Google Scholar] [CrossRef]
- Ward, D.; Melbourne-Thomas, J.; Pecl, G.T.; Evans, K.; Green, M.; McCormack, P.C.; Novaglio, C.; Trebilco, R.; Bax, N.; Brasier, M.J.; et al. Safeguarding marine life: Conservation of biodiversity and ecosystems. Rev. Fish. Biol. Fish. 2022, 32, 65–100. [Google Scholar] [CrossRef] [PubMed]
- Zhou, Y.; Li, G.; Zhou, S.; Hu, D.; Zhang, S.; Kong, L. Spatio-temporal differences and convergence analysis of green development efficiency of marine economy in China. Ocean Coast. Manag. 2023, 238, 106560. [Google Scholar] [CrossRef]
- Li, Y.; Li, Y.; Zhou, Y.; Shi, Y.; Zhu, X. Investigation of a coupling model of coordination between urbanization and the environment. J. Environ. Manag. 2012, 98, 127–133. [Google Scholar] [CrossRef] [PubMed]
- Cheng, X.; Long, R.; Chen, H.; Li, Q. Coupling coordination degree and spatial dynamic evolution of a regional green competitiveness system—A case study from China. Ecol. Indic. 2019, 104, 489–500. [Google Scholar] [CrossRef]
- Tang, S.; Zhu, Y.; Wang, F.; Shen, N. Can Marketization Improve Sustainable Development in Northeastern China? Evidence from the Perspective of Coupling Coordination Degree Model. Discret. Dyn. Nat. Soc. 2022, 2022, 1–12. [Google Scholar] [CrossRef]
- Chen, X.; Zhou, F.; Hu, D.; Yi, G.; Cao, W. An improved evaluation method to assess the coordination between mineral resource exploitation, economic development, and environmental protection. Ecol. Indic. 2022, 138, 108808. [Google Scholar] [CrossRef]
- Liu, T.-L.; Song, Q.-J.; Lu, J.; Qi, Y. An integrated approach to evaluating the coupling coordination degree between low-carbon development and air quality in Chinese cities. Adv. Clim. Chang. Res. 2021, 12, 710–722. [Google Scholar] [CrossRef]
- Ma, P.; Ye, G.; Peng, X.; Liu, J.; Qi, J.; Jia, S. Development of an index system for evaluation of ecological carrying capacity of marine ecosystems. Ocean Coast. Manag. 2017, 144, 23–30. [Google Scholar] [CrossRef]
- Barlas, Y. Formal aspects of model validity and validation in system dynamics. Syst. Dynam. Rev. 1996, 12, 183–210. [Google Scholar] [CrossRef]
Disclaimer/Publisher’s Note: The statements, opinions and data contained in all publications are solely those of the individual author(s) and contributor(s) and not of MDPI and/or the editor(s). MDPI and/or the editor(s) disclaim responsibility for any injury to people or property resulting from any ideas, methods, instructions or products referred to in the content. |
© 2024 by the authors. Licensee MDPI, Basel, Switzerland. This article is an open access article distributed under the terms and conditions of the Creative Commons Attribution (CC BY) license (https://creativecommons.org/licenses/by/4.0/).