Article

Combined Toxic Effects and Mechanisms of Chloroacetic Acid and N-Nitrosodimethylamine on Submerged Macrophytes

Department of Environmental Science and Engineering, Fudan University, Shanghai 200433, China
*
Authors to whom correspondence should be addressed.
Water 2024, 16(18), 2689; https://doi.org/10.3390/w16182689
Submission received: 30 July 2024 / Revised: 7 September 2024 / Accepted: 15 September 2024 / Published: 21 September 2024
(This article belongs to the Section Biodiversity and Functionality of Aquatic Ecosystems)

Abstract

:
Disinfection by-products (DBPs) such as chloroacetic acids (CAAs) and N-Nitrosodimethylamine (NDMA) are prevalent pollutants in surface waters, particularly with the increasing use of chlorine-based disinfectants. The entry of these DBPs into water bodies may increase accordingly, posing ecological risks to aquatic life. To assess the toxic effects of CAAs and NDMA on submerged macrophytes, Vallisneria natans was exposed to different concentrations of CAAs (1.0, 10.0, and 100.0 μg L−1) and NDMA (0.1, 1.0, and 10.0 μg L−1). A RI value of <1 indicates that simultaneous exposure to CAAs and NDMA can produce an antagonistic effect. Both CAAs and NDMA adversely affect the photosynthetic system of plants. In the NDMA treatment group, chlorophyll a content decreases with increasing concentration, accounting for 96.03%, 60.80%, and 58.67% of the CT group, respectively. Additionally, it effectively triggers the plant’s antioxidant response, with significant increases in SOD, POD, and GSH levels. Among these, the combined treatment group AN2 (10 + 1 μg L−1) showed the most significant change in SOD activity, reaching 3.57 times that of the CT group. Ultrastructural changes also revealed stress responses in leaf cells and damage to organelles. Furthermore, metabolomics provided insights into the metabolic responses induced by CAAs or NDMA in V. natans leaves, where the composition and metabolism of lipids, fatty acids, cofactors and vitamins, amino acids, nucleotides, and some antioxidants were regulated, affecting plant growth. This study provides preliminary information for the ecological risk assessment of submerged plants by complex contamination with the disinfection by-products CAA and NDMA.

1. Introduction

In recent years, the advent of global health crises has significantly heightened every consumer’s awareness of personal health and hygiene. High-frequency surface disinfection has been identified as an effective measure to reduce virus transmission, which in turn has spurred a marked uptick in the utilization of disinfectants and ignited a burgeoning demand for personal cleaning and care products. Amidst the myriad of options available, chlorine has emerged as a prevalent agent for the disinfection of domestic wastewater and potable water. This substance has found extensive application in homes, workplaces, public thoroughfares, and even vehicles, particularly during the tumultuous period of the COVID-19 pandemic [1]. In a specific Asian nation, the consumption of disinfectants was projected to reach an astonishing 2000 tons in 2019. Remarkably, 48.7% of the population opted for chlorine-based disinfectants as their primary choice for sanitizing their homes [2]. By the end of 2020, global sales of disinfectants skyrocketed, culminating in a staggering USD 4.5 billion, up 30% from 2019 [3]. Chlorine-based disinfectants possess the potential to interact with natural organic matter (NOM), effluent organic matter from wastewater (EfOM), and inorganic halide ions, resulting in the formation of numerous toxic disinfection by-products (DBPs). Astonishingly, over 700 distinct DBPs have been documented. These include but are not limited to Trihalomethanes (THMs), Haloacetic Acids (HAAs), Haloketones (HKs), Haloacetonitriles (HANs), Halonitromethanes (HNMs), Nitrosamines (NAs), Halogenated Alcohols, Halogenated Amides, and a variety of Aromatic Halogenated DBPs [4]. Earlier research has revealed that the concentration of DBPs in municipal wastewater in Wuhan (China) can soar to as high as 77.8 μg L−1, and the level in surface water can peak at 8.8 μg L−1 [1]. The total concentration of DBPs in the tailwater from a sewage treatment facility in Wuxi, China, could escalate to 271.47 μg L−1 [5]. The authors of ref. [6] highlighted that various toxic and corrosive disinfectants inevitably find their way into aquatic ecosystems, posing significant threats to aquatic life. Similarly, ref. [7] also underscored the acute toxicity of chlorine-based disinfectants to these organisms. For instance, ref. [8] documented that the chlorinated DBP dibromomethane (LC50 = 0.590 mg L−1) can induce hemorrhagic swelling in the gills of pufferfish, eventually resulting in body rot. Moreover, Zhang and his colleagues reported that DBPs originating from chlorinated saline wastewater could inflict acute toxicity on marine organisms [9]. Given the disparate sensitivity of different trophic levels to DBPs, it becomes imperative to perform a series of bioassays on organisms spanning different trophic strata. Prior studies have demonstrated that a majority of the 17 examined DBPs—encompassing THMs, HAAs, and HANs—inhibit the growth of Scenedesmus sp., impair the swimming capabilities of Daphnia magna, and precipitate both mortality and abnormal development in zebrafish embryos [10]. A cumulative risk quotient (RQ) greater than 1.0 for all organisms indicates a high ecological risk posed by DBPs [10]. For instance, certain aromatic DBPs found in wastewater exhibit pronounced developmental toxicity and significant growth inhibitory effects, and these compounds could spell dire consequences for aquatic species [1].
Haloacetic acids (HAAs) are the second most prevalent class of DBPs, frequently cropping up in swimming pools, tap water systems, and various aquatic environments [11]. Among the myriad of aquatic species, microalgae emerge as being particularly sensitive to these DBPs. The presence of the DBPs in wastewater effluents poses high ecological risks, especially to phytoplankton [10]. A previous study has shown that HAAs in wastewater exhibit a high risk for green algae [12]. Chloroacetic acid (CAA) reigns supreme among the HAAs. The monitoring data of DBPs in the tailwater of a wastewater plant in Wuxi City, Jiangsu Province, China, indicated that CAA had the highest percentage concentration, 67.84 μg L−1 [5]. CAA is a formidable threat to aquatic life, boasting toxicity levels 25 to 40 times greater than those of acetic acid, dichloroacetic acid, and trichloroacetic acid [13]. Even brief exposure to low concentrations of CAA can unleash dramatic and potentially devastating effects on aquatic species [11]. For instance, ref. [13] demonstrated that exposure to CAA induced a cascade of detrimental effects in Microcystis aeruginosa, including lipid peroxidation, impaired photosystems, and altered ultrastructural features, ultimately triggering apoptosis. In addition, CAA was found to stimulate the synthesis and release of microcystin-LR and produce toxic secondary metabolites, posing potential risks to aquatic ecosystems. Similar results were found in Chlorella vulgaris, showing that low concentrations of CAA can lead to a reduction in the growth rate and chlorophyll a synthesis rate, while medium and high concentrations of CAA cause growth stagnation in the algae, ultimately leading to complete mortality.
The presence of N-nitrosamines, an emerging class of nitrogen-containing DBPs, in water resources has garnered widespread attention due to their alarming mutagenic and carcinogenic potential [14]. Toxicological studies have shown that N-nitrosamines are much more toxic to cells, damaging to the genome, and carcinogenic to organisms compared to their carbonaceous DBP counterparts, such as THMs and HAAs [15]. In addition to their occurrence as DBPs, N-nitrosamines can also form through a myriad of industrial processes that entail interactions with nitrogen oxides, nitrites, or nitrates [16]. Reports indicate that discharge samples from printed circuit board manufacturing, which utilize dithiocarbamate-based compounds, have shown N-nitrosodimethylamine (NDMA) concentrations as high as 4500 ng L−1 [17]. In previous investigations, NDMA emerged as the predominant nitrosamine detected in surface water [18,19]. NDMA concentrations ranging from 50 to 600 ng L−1 have been reported in surface waters influenced by WTPs in Los Angeles, CA, USA [18]. The Jialu River, a vital tributary of the Huaihe River in China, has been significantly impacted by the direct discharge of industrial and domestic wastewater, with NDMA concentrations of 31.7 ± 49.5 ng L−1 in river water, and the incidence of digestive cancers has been increasing among local residents [20]. An investigation mentioned that NDMA was ranked as one of the five priority pollutants with a high phytotoxicity effect through data analysis [21]. Therefore, it is also essential to investigate the long-term toxicological effects of NDMA on aquatic plants.
Aquatic plants, as the linchpins of primary productivity, are a crucial component of freshwater ecosystems. Their omnipresence and inherent immobility render them quintessential sentinels of aquatic contamination [22]. As mentioned above, while risk assessments for green algae and cyanobacteria in relation to CAAs have been conducted, there is a paucity of reports on the impact of these substances on submerged plants, as well as the lack of data on the long-term effects of NDMA on aquatic plants. In addition, CAAs usually coexist with NDMA in natural ecosystems, and previous single toxicity studies of CAAs or NDMA may not be representative of the actual environment because of interactions between pollutants, such as synergistic and antagonistic effects. Consequently, research on the long-term impacts of low-concentration DBPs deserves to be conducted, both individually and in combination, on the environmental behavior of submerged plants. Additionally, molecular mechanism investigations on submerged plants are required to elucidate the toxicological effects of CAAs and NDMA. This research aims to provide fundamental data for the ecological risk assessment and remediation of water bodies contaminated with composite disinfection by-products. This is of significant practical importance for maintaining the stability of aquatic ecosystems and will contribute to more effective regulation of DBP levels in water bodies, thereby protecting human health, aquatic organisms, and ecosystems. In this study, the test subject used to assess the individual and combined toxic effects of NDMA and CAAs was the widely dispersed submerged plant Vallisneria natans (Lour.). Specifically, this work used a combination of cytological, physiological, and metabolomic methods to examine the effects of various doses of CAAs and NDMA on the physiology and biochemistry of V. natans. This research: (1) investigates the effects on the photosynthetic system and antioxidant system of V. natans following exposure to CAAs and NDMA; (2) examines the ultrastructural alterations in the mesophyll cells of V. natans under pollutant-induced stress and evaluates the combined toxicity; and (3) identifies differentially expressed metabolites (DEMs) and the key pathways they are involved in. The findings from this study will furnish data on the prolonged effects of CAAs and NDMA on aquatic vegetation, bolstering efforts to regulate DBPs in aquatic ecosystems.

2. Materials and Methods

2.1. Materials and Reagents

The submerged macrophyte Vallisneria natans was chosen as a study subject because of its exceptional environmental tolerance and extensive prevalence in surface water. Plants were purchased from Jizhimei Co. (Shengzhou, Suqian, China). Following a thorough rinse with purified water, the plants were incubated in 1/10 Hoagland’s solution. Cultivation took place in a controlled growth chamber set at a constant temperature of 25 °C and under an illumination intensity of 80 μmol m−2 s−1, operating on a 12 h light and 12 h dark cycle. After 14 days, approximately 10 g of V. natans were carefully relocated to cylindrical Plexiglas containers for the ensuing experiments. CAA (purity > 99%) was purchased from TCA Biochemicals Co., Ltd. (Shanghai, China). NDMA (purity > 99%) was purchased from Aladdin Biochemical Technology Ltd. (Shanghai, China).

2.2. Experimental Design

The plants, with a fresh weight of 10.0 g, were cultured in 5 L Plexiglas containers filled with 4 L of 10% Hoagland’s solution and supplemented with 50 mm quartz sand. CAA and NDMA were meticulously dissolved in distilled water, then diluted to achieve final experimental concentrations of 1.0, 10.0, and 100.0 μg L−1 for CAA, and 0.1, 1.0, and 10.0 μg L−1 for NDMA. These concentrations corresponded to treatments labeled A1, A2, and A3 for CAA and N1, N2, and N3 for NDMA, respectively. The concentrations of the CAA and NDMA co-treated groups were 1.0 + 0.1, 10.0 + 1.0, and 100.0 + 10.0 μg L−1, which were recorded as AN1, AN2, and AN3. The group without pollutant treatment is the control group, labeled as the CT. The selected exposure concentrations were reflective of typical values found in WWTP effluent and surface waters. The plants were grown for 28 days under a regimented 12 h light and 12 h dark cycle at 25 °C. Light intensity was kept steady at 80 μmol m−2 s−1. Three parallels were set up for each experimental group, and at the conclusion of the experimental duration, plants were collected for subsequent analysis.

2.3. Determination of Plant Growth and Chlorophylls

In order to assess the growth of V. natans, changes in the root length and leaf length of V. natans samples were measured with calipers at the end of the experiment, and changes in fresh weight were measured with an electronic balance. To detect changes in the chlorophyll content of plant leaves, a 1.0 g fresh sample was taken and extracted using 15 mL of 95% ethanol protected from light for 24 h [23]. The absorbance of the resulting extract was then measured at wavelengths of 470, 649, and 665 nm using a UV spectrophotometer. The contents of chlorophyll a (Chl a), chlorophyll b (Chl b), and total chlorophyll (Chl a + b) were subsequently calculated in accordance with the previously established methodology [24].
C h l   a = 13.95 × D 665 6.88 × D 649
C h l   b = 24.96 × D 649 7.32 × D 665
C h l   ( a + b ) = C h l   a + C h l   b
C o n t e n t m g   g 1 = C V N / W
C: concentration of photosynthetic pigment (mg L−1); V: volume of the extraction solution (mL); N: dilution factor; W: weight of the plant sample (g).

2.4. Enzyme and Total Protein Extraction and Assay

Upon concluding the experiment, a 1.0 g (FW) sample of V. natans leaves was rinsed and rapidly frozen in liquid nitrogen. This frozen sample was then mixed with 9 mL of 0.1 mol L−1 PBS, pH 7.4. The resulting homogenate underwent centrifugation at 10,000× g for 20 min at a chilly 4 °C to extract the supernatant [25]. The activities of peroxidase (POD), superoxide dismutase (SOD), and catalase (CAT), along with the levels of the total protein (TP), malondialdehyde (MDA), and glutathione [26] were subsequently quantified in the supernatant using chemical assay kits procured from Suzhou Keming Company (Suzhou, China).

2.5. Microscopic Examination

After 28 days of exposure to pollutants, an ultrastructural examination of the mesophyll cells in V. natans was conducted. Samples were selected from the CT, A2, N2, and AN2 groups. The plant leaves were first immersed in a 2.5% glutaraldehyde solution for 24 h, followed by dehydration for 15 min each in 20%, 40%, 60%, 80%, and 90% ethanol solutions, respectively. Finally, the leaves underwent immersion in absolute ethanol for two intervals of 15 min each [27]. The samples were obtained in sections to observe the ultrastructure of the chloroplasts using a transmission electron microscope (HITACHI HT7800, Hitachinaka-shi, Japan).

2.6. Metabolomics Analysis

The plant specimens from the four distinct treatment groups (CT, A2, N2, and AN2) were preserved at −20 °C for subsequent metabolomic analysis. Metabolites were extracted from V. natans leaves following previously established methods [28], as detailed in the Supplementary Materials for metabolite extraction, quantification, and analysis. After separation using the Vanquish LC ultra-high-performance liquid chromatography (UHPLC) system, mass spectrometric analysis was performed using a Q Exactive series mass spectrometer (Thermo, Waltham, MA, USA) [29]. Data analysis included univariate statistical analysis, differential metabolite screening, differential metabolite correlation analysis, and KEGG pathway analysis.

2.7. Data Analysis

The combined toxicological impact of CAAs and NDMA was quantified utilizing the Abbott equation. The percentage (Cexp) indicates the expected inhibitory effect of the mixture of CAAs and NDMA, which was calculated from previous studies.
C e x p = A + B ( A B 100 )
The inhibitory effects of A and B (when exposed individually to the toxin), as well as the observed combined inhibitory effects, were all calculated using the formulas available in reference [30].
The inhibition ratio (RI) was determined based on the ratio of observed inhibition to expected inhibition (Cexp) [31,32]. The interaction of CAA with NDMA was analyzed using RI values.
R I = O b s e r v e d   I n h i b i t i o n C e x p
Data processing was conducted using OriginPro 2023 and SPSS 20.0 software (IBM, Armonk, NY, USA). The data are presented as mean ± standard deviation [33]. One-way analysis of variance (ANOVA) and Tukey’s test were utilized to determine the effects of DBP on the various experimental groups, with a significance level set at p < 0.05.

3. Results and Discussion

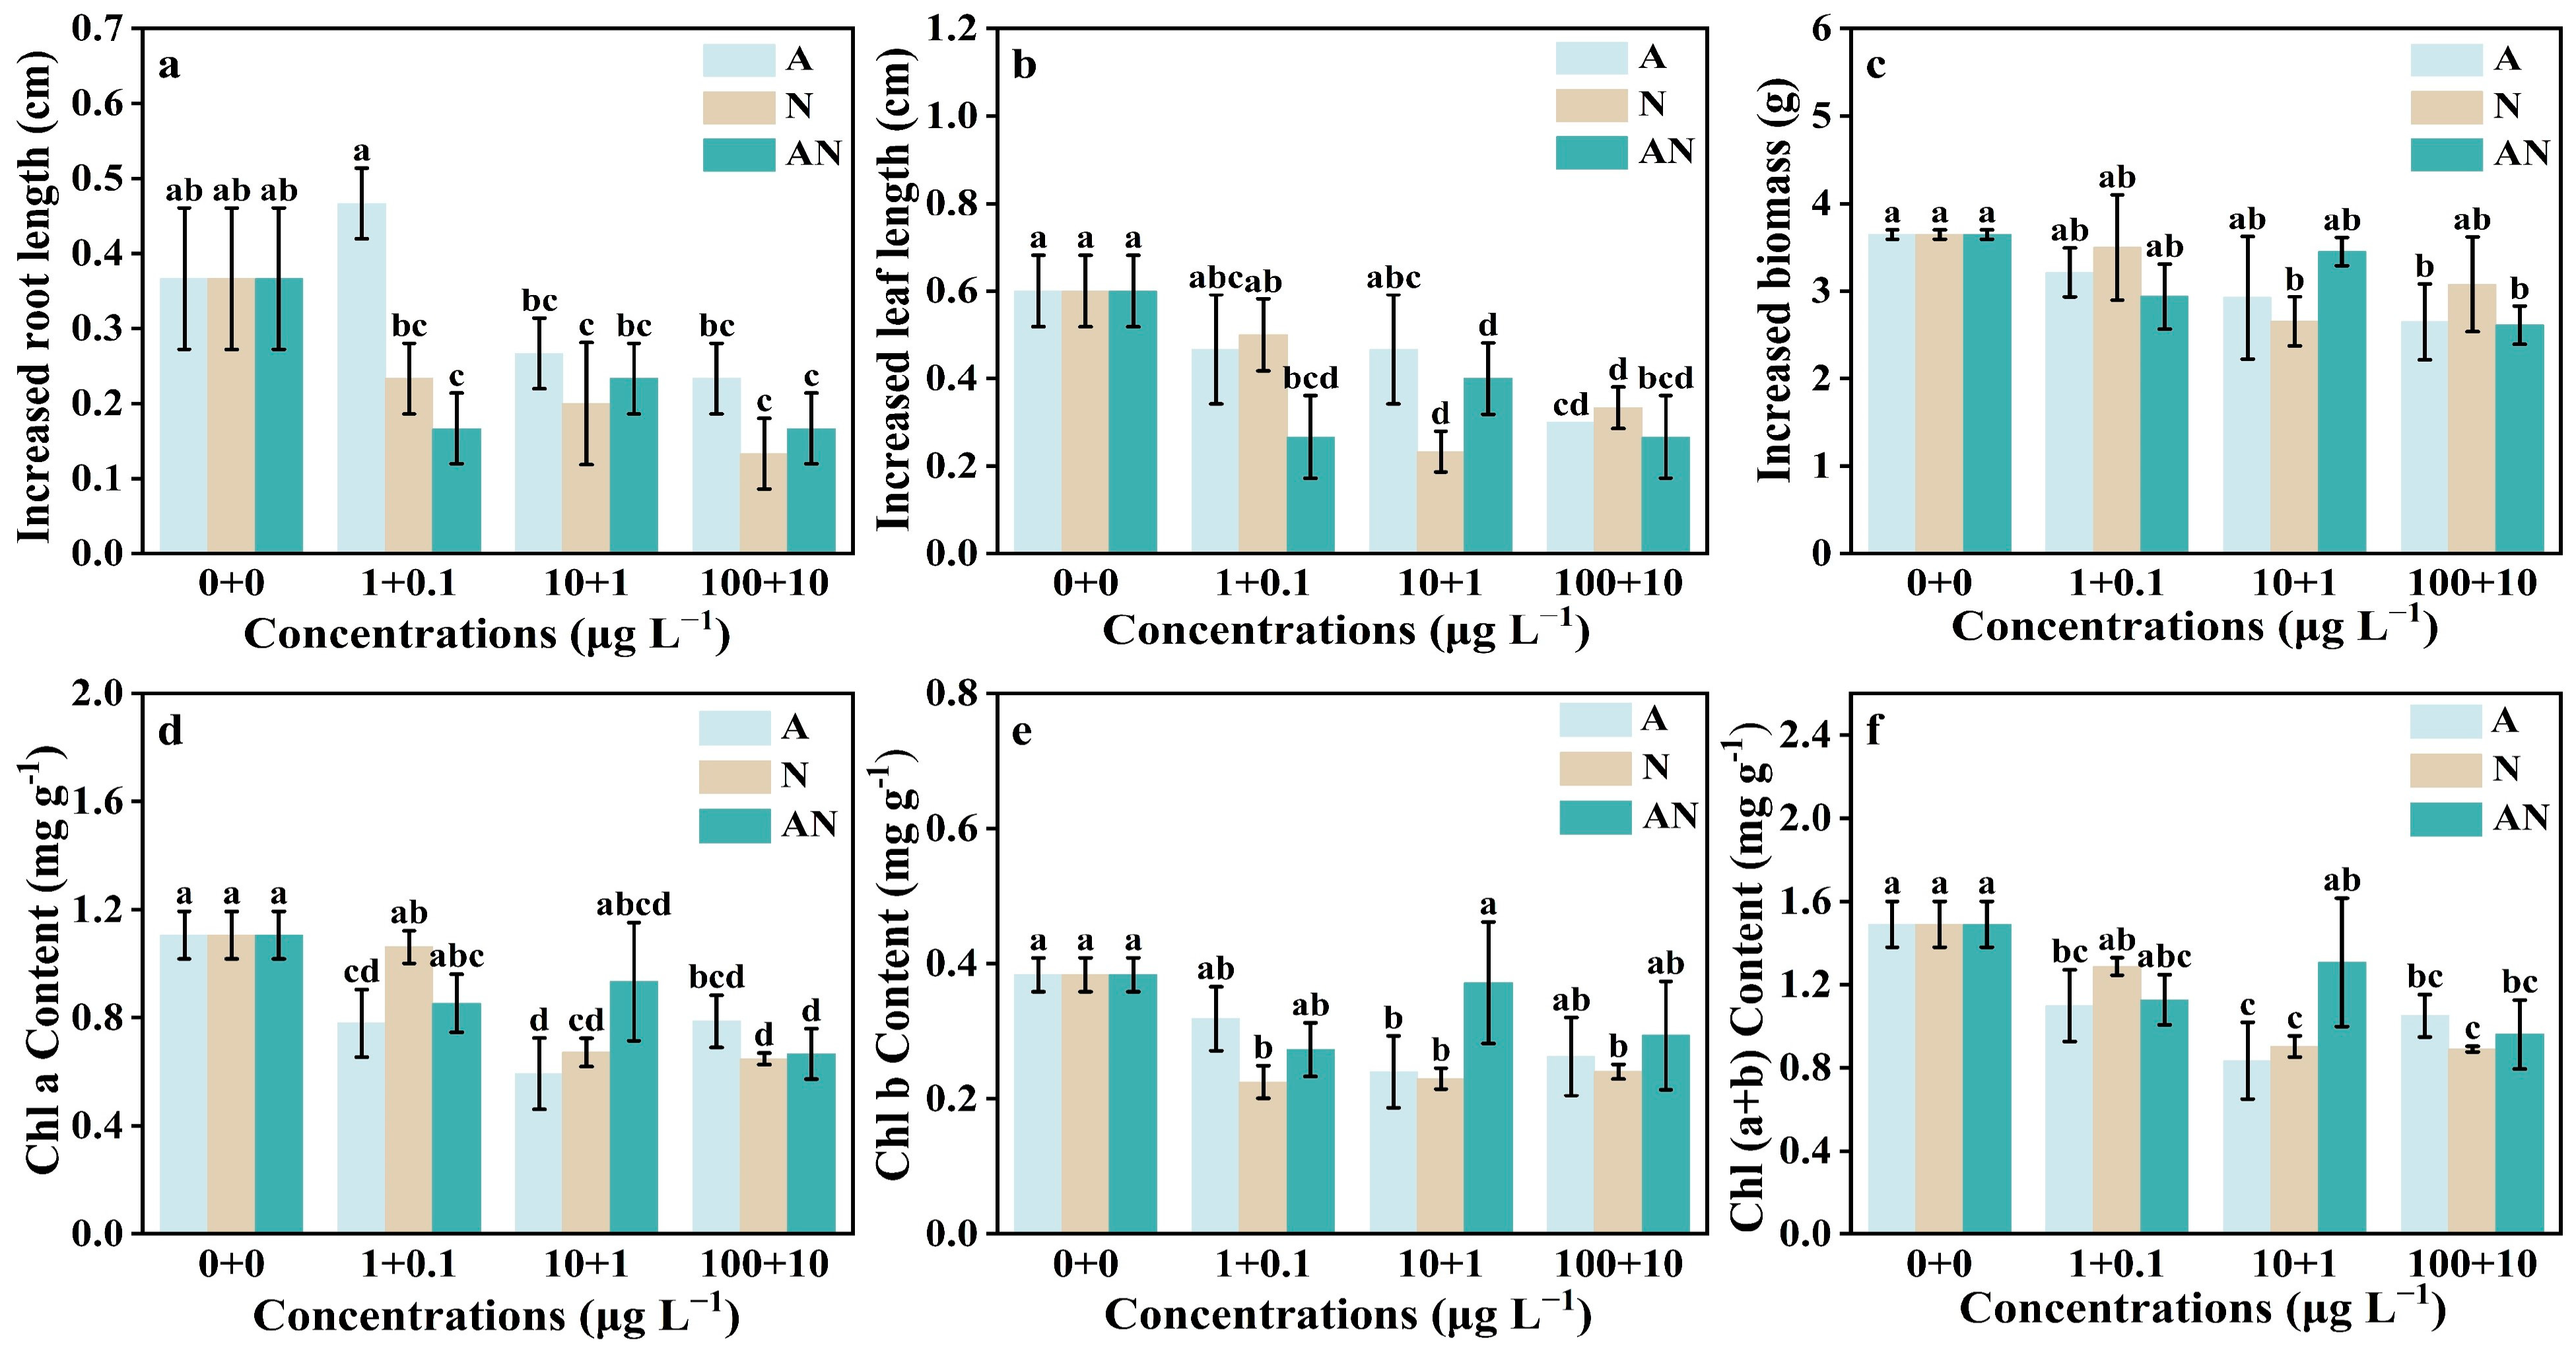
3.1. Impacts of CAA and NDMA on V. natans Growth and Chlorophylls

Figure 1a, Figure 1b, and Figure 1c show, respectively, the changes in the root length, leaf length, and fresh weight of aquatic plants on the 28th day under different CAA and NDMA treatment conditions. As illustrated, the growth of V. natans roots and leaves was significantly inhibited under CAA and NDMA treatments, except for the 1 µg L−1 CAA treatment group, which exhibited a slight promotion effect with regards to root growth. Compared to CAA treatment alone, NDMA exhibited a stronger inhibitory effect on root growth, with the N1, N2, and N3 treatment groups reaching 63.06%, 54.05%, and 36.04% of the root elongation length of the CT group, respectively. Furthermore, the combined treatment of CAA and NDMA appeared to exert a stronger inhibitory effect on the leaf growth of V. natans, with the AN1, AN2, and AN3 groups reaching 44.44%, 66.67%, and 44.44% of the leaf elongation length of the CT group, respectively. The pollutant treatments also tended to inhibit the increase in plant biomass, although the overall changes were not very pronounced.
Photosynthesis, a crucial physiological process in phototrophic organisms, is susceptible to environmental stressors [34]. This is due to the fact that chloroplasts are rich in oxygen and unstable pigments and are susceptible to ROS damage [35]. Plants treated with CAA and NDMA had their chlorophyll a chlorophyll b, and total chlorophyll concentrations measured, as shown in Figure 1d–f. A contrast emerges when juxtaposed with the control group, revealing that both single and combined treatment groups precipitate a diminution in chlorophyll a and chlorophyll b concentrations, indicating that CAA and NDMA adversely affected the photosynthesis process. The changes in chl a content in the NDMA treatment group showed a dose-dependent relationship. The higher the NDMA concentration, the lower the chl a content, accounting for 96.03%, 60.80%, and 58.67% of the CT group, respectively. In the combined CAA and NDMA treatment group, the levels of chlorophyll initially increased and then decreased. The chlorophyll content in the single treatment groups A2 and N2 is 0.83 mg g−1 and 0.90 mg g−1, respectively. In contrast, the combined treatment group AN2 (10 + 1) µg L−1 has a higher chlorophyll concentration of 1.31 mg g−1, possibly due to an antagonistic interaction between the two pollutants. Prior research has demonstrated that, in a brief amount of time, a low-concentration dose of CAA can dramatically lower the chlorophyll a content of cyanobacteria and chlorella [5,13]. In summary, the current investigation revealed a discernible decline in the chlorophyll content of V. natans upon exposure to CAA and NDMA.

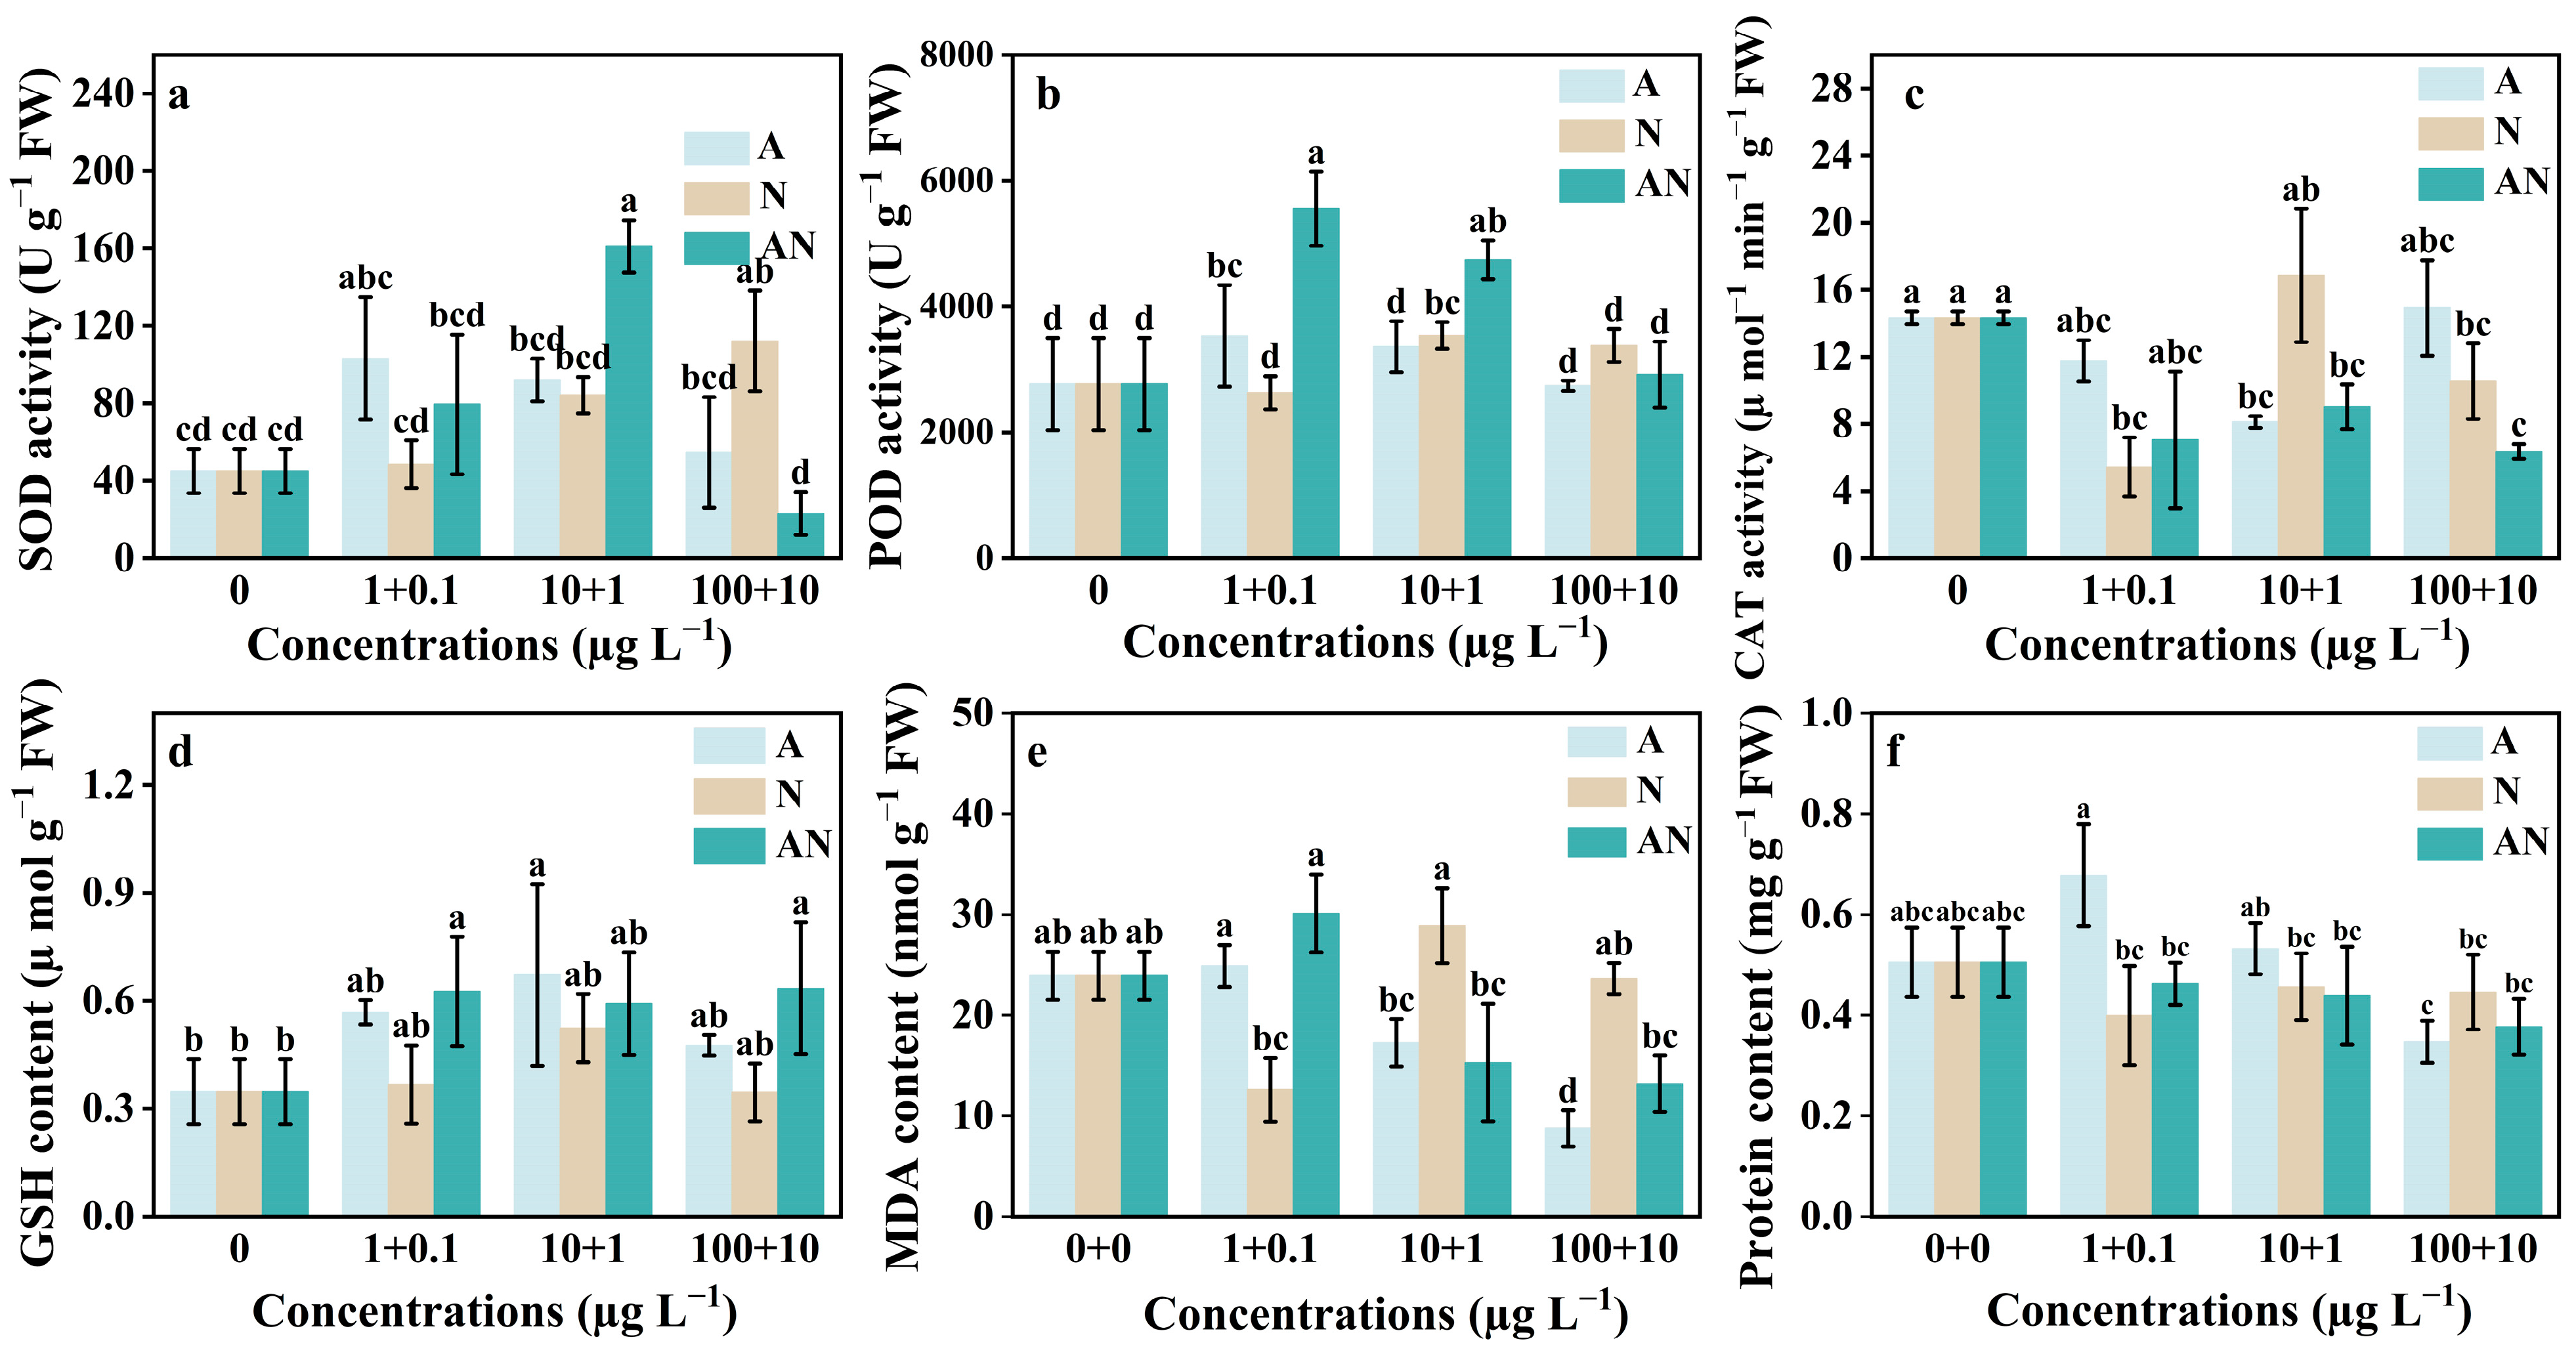
3.2. Oxidative Stress Response

Figure 2 shows the impact of varying dosages of CAA and NDMA concentrations on the antioxidant system of V. natans. The ROS produced by plants under stress can lead to lipid peroxidation [36]. SOD and POD serve as the first guardians against pollutant stresses, scavenging ROS and shielding organisms from pollutant-induced overproduction of ROS [37]. By the end of the trial, the SOD content in groups exposed to pollutant treatments was generally higher than the CT group. In the CAA-only treatment group, SOD activity decreased with increasing concentrations and was 228.98%, 204.21%, and 121.42% of the CT group, respectively. Conversely, in the NDMA treatment group, SOD activity increased with increasing concentrations and was 107.71%, 187.05%, and 249.09% of the CT group, respectively. In the combined treatment group, SOD activity initially increased and then decreased. Notably, the combined treatment group exposed to pollutants at concentrations of (10 + 1 μg L−1) demonstrated the most significant change in SOD activity, reaching 3.57 times that of the CT group. A comparable pattern was also noted in POD activity. POD enzyme activity was higher in pollutant-treated plants than in controls. The highest POD content was found in the group exposed to the combined treatment of pollutants at concentrations of (0.1 + 1 μg L−1), which had significantly higher levels of POD content than the individual treatment. This increase in POD, alongside a rise in SOD within the antioxidant system of V. natans under low concentrations of CAA and NDMA stress, illuminates the capacity of these plants to activate their antioxidant defenses.
The enhancement of CAT activity aids in the removal of excess H2O2. When V. natans’s antioxidant system is compromised and unable to fully eliminate the toxicity through enzyme production, enzyme activity significantly decreases. In this study, CAT activity was significantly reduced. In the combined treatment groups, CAT activity was 49.30%, 62.99%, and 44.34% of the CT group, respectively. The decrease in CAT may be attributed to its utilization in the scavenging of H2O2, or to the inactivation of proteins and enzymes within cells after exposure to highly toxic treatments. GSH is an effective antioxidant that facilitates cellular detoxification [38]. After exposure to single and co-existing pollutants in this experiment, GSH content increased slightly in the treated group compared to the CT group.
MDA, the product of membrane lipid peroxidation, starts to accumulate if ROS are not promptly eliminated [39]. The MDA content in the 1 + 0.1 µg L−1 combined treatment group significantly increased, suggesting that the antioxidant system was activated. However, in both the CAA treatment group and the combined treatment group, the MDA concentration decreased with increasing concentrations. The MDA levels were 104.02%, 72.15%, and 36.60% of the CT group for the CAA group, and 125.90%, 63.97%, and 55.13% of the CT group for the combined group, respectively, which might be attributed to cell membrane damage under more substantial stress. Figure 2f illustrates the variations in protein expression. As the concentration of pollutant treatment groups increased, the protein content decreased, suggesting that higher concentrations of CAA and NDMA induced oxidative stress, causing metabolic disorders in V. natans. It is also possible that photosynthesis is inhibited, resulting in obstructed nutrient accumulation in V. natans and a decrease in soluble protein content. As an illustration, a prior investigation revealed that polymetallic treatment decreased the total protein content of Elodea canadensis and Lemna minor, leading to metabolic disorders [40]. Additionally, treatment with PS-NPs and PCB-52 significantly reduced the soluble protein content in plant leaves, inducing an osmotic imbalance [41].

3.3. Evaluation of the Combined Toxicity of CAA and NDMA

The toxic effects of combined exposure were evaluated, as shown in Table 1. An inhibition ratio (RI) of less than 1 represents an antagonistic effect, a RI equal to 1 represents a simple additive effect, and a RI greater than 1 represents a synergistic effect. Using Chl (a + b) content as an indicator, the RI values are 0.67, 0.19, and 0.61, all of which are less than 1. These findings suggest that combined exposure to CAA and NDMA reduced the adverse effects on photosynthetic pigment content. When evaluating indicators such as SOD, GSH, and MDA, with a few exceptions, the RI values remained below 1, suggesting that there was generally an antagonistic relationship between CAA and NDMA. When CAA and NDMA were applied at 10 + 1 µg L−1, using total protein as an indicator, the RI value was greater than 1, indicating a synergistic effect on the increase in total protein content. However, the RI values for the other two groups were still significantly lower than 1. This result is similar to the interaction between PFOA and SD in V. natans [42]. Prior studies have verified that microcystin-LR and Cu together produce antagonistic implications on aquatic plants, and microcystin-LR can induce the generation of ROS [32], the same as CAA and NDMA. Overall, the interaction between CAA and NDMA primarily induced antagonistic effects in V. natans.

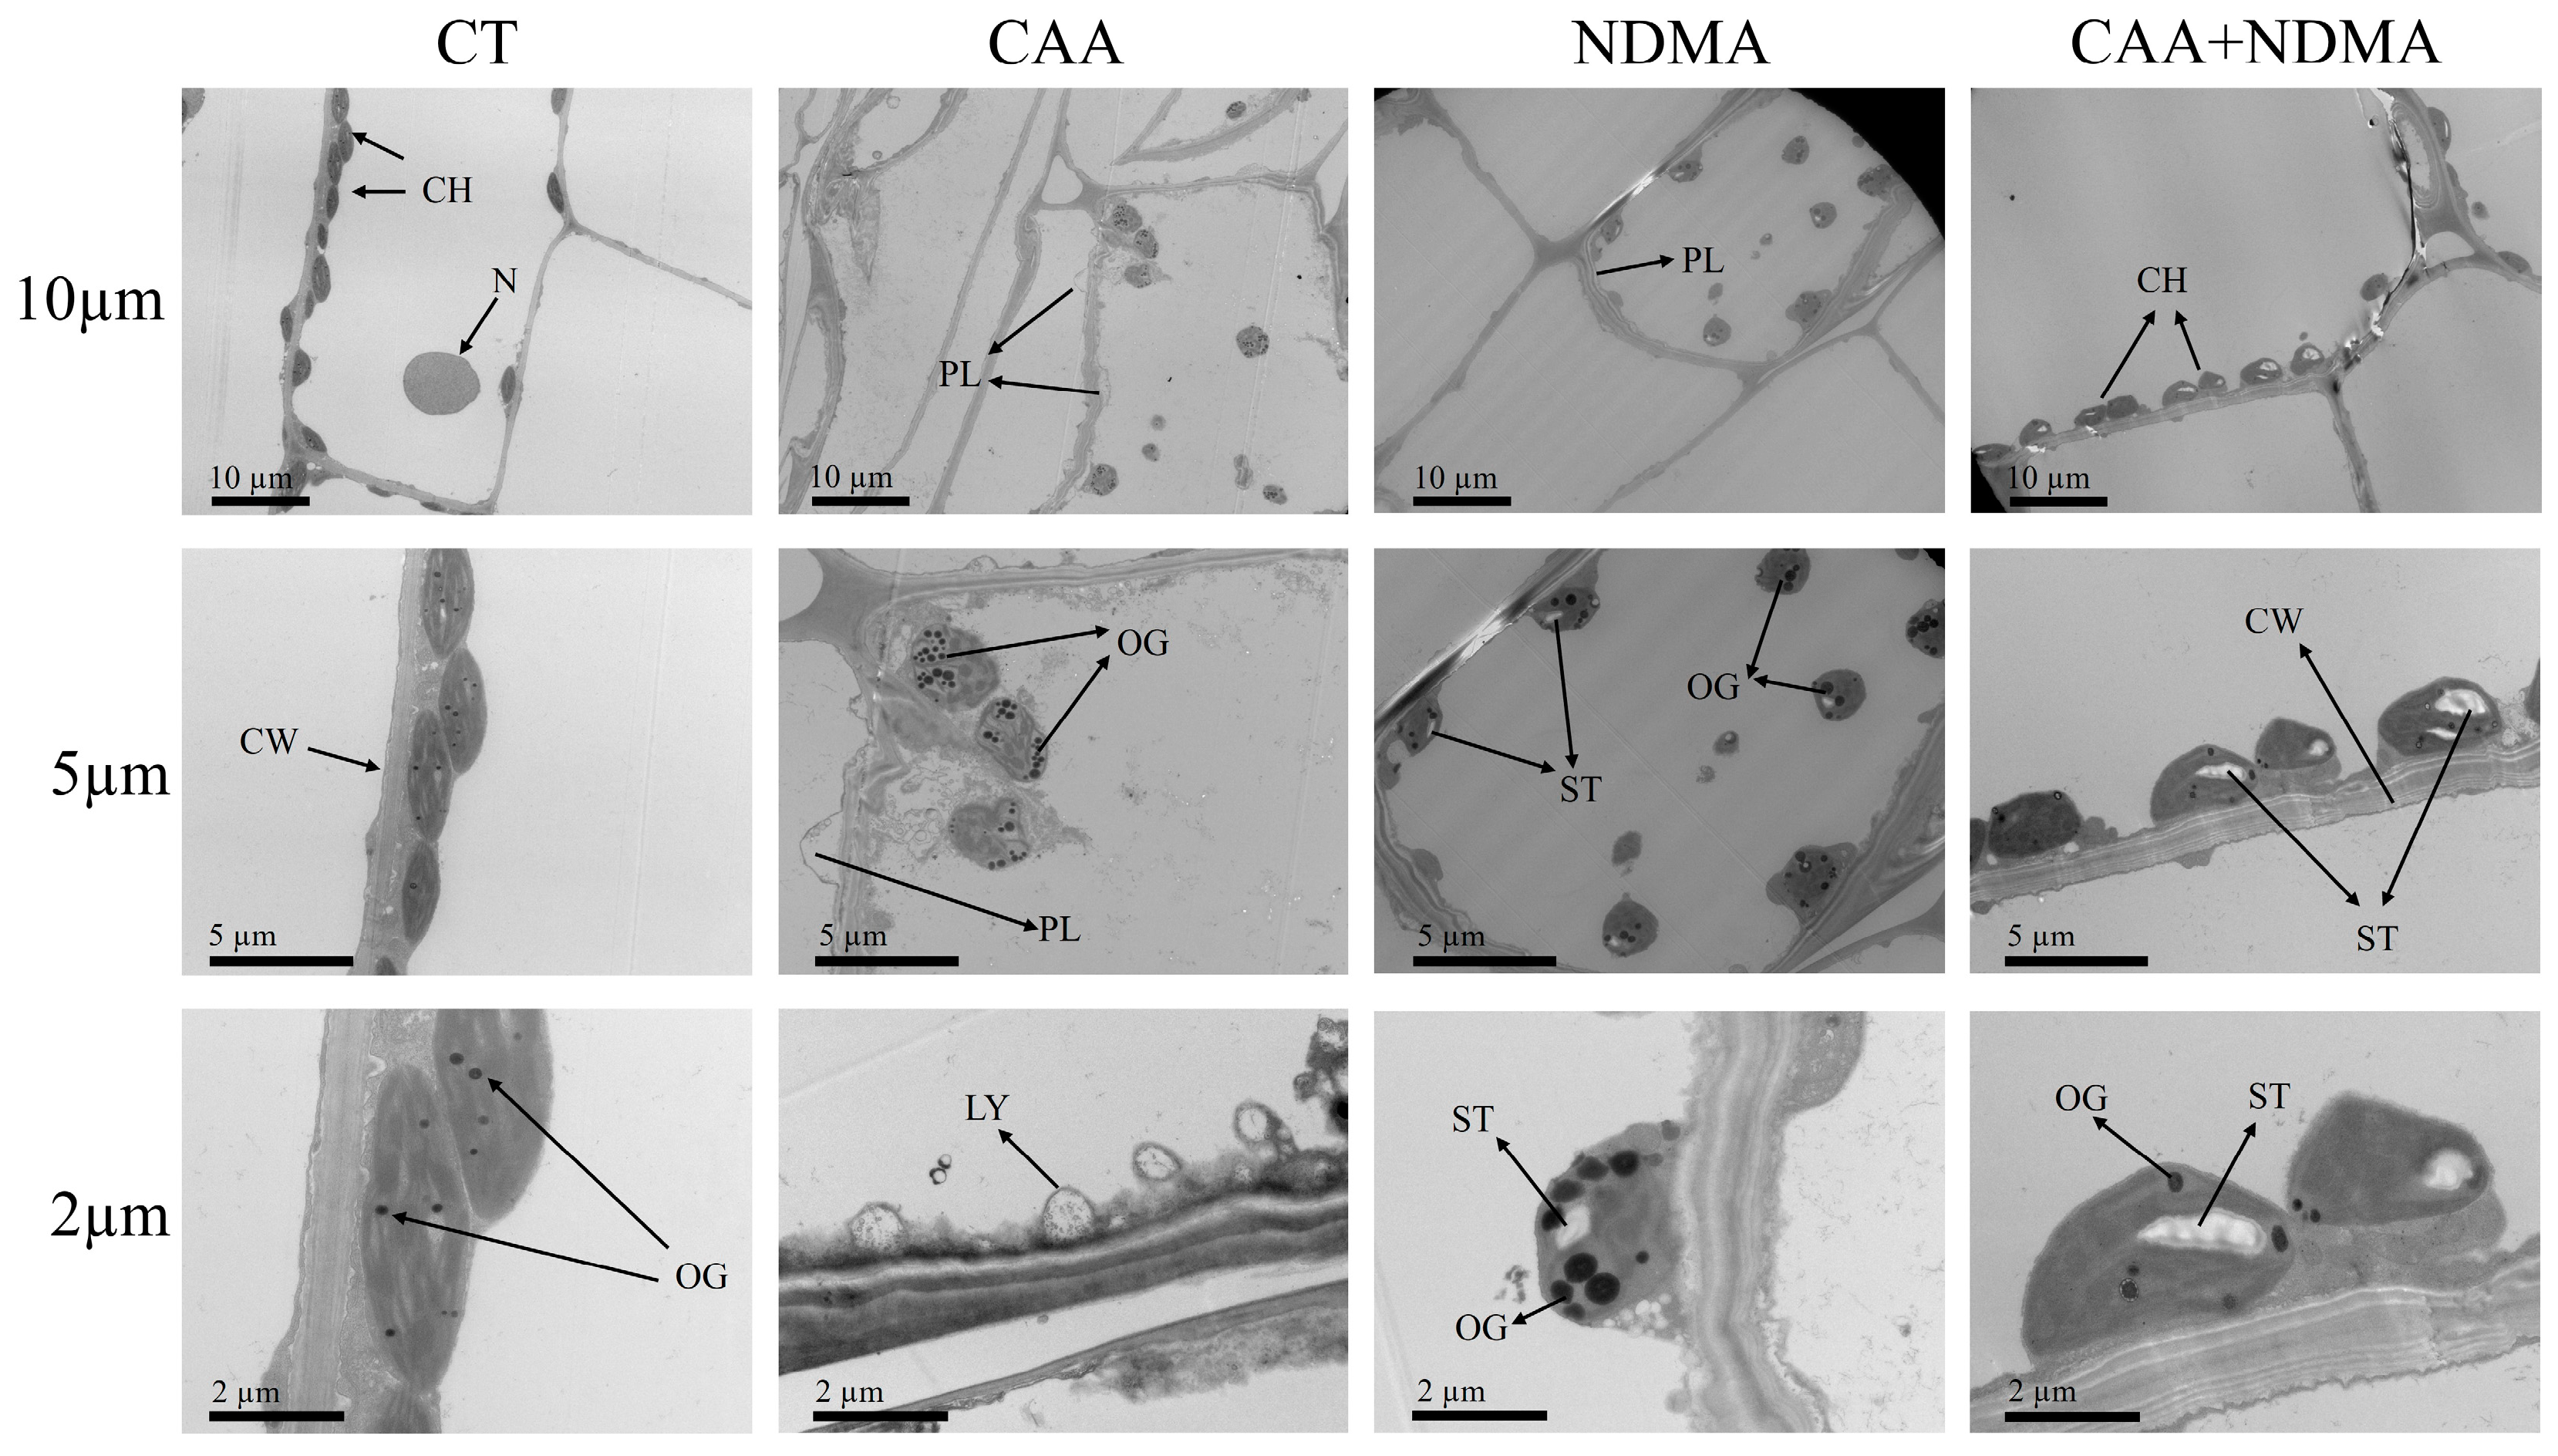
3.4. Ultrastructural Changes in the Mesophyll Cells of V. natans

Ultrastructural observations of V. natans leaf sections were conducted using a transmission electron microscope [43], as shown in Figure 3. Within the control group, the chloroplasts of the mesophyll cells were regular spindle-shaped organelles attached to the cell wall, with neatly arranged thylakoid stacks in the chloroplasts, transparent cell membranes, and a dense matrix. Under both individual and combined exposure to CAA and NDMA, certain degrees of plasmolysis and changes in chloroplast morphology occurred in the plant cells. The degree of plasmolysis was higher in the CAA group, with a greater number of lysosomes appearing and a notable rise in the quantity of osmiophilic granules in the mesophyll cells. These granules, accumulating in significant numbers, signal plant senescence and impending pathological alterations [44]. This indicates that under the stress of pollutants at certain concentrations, mesophyll cells exhibit a stress response, and the organelles within the mesophyll cells become damaged. Both the NDMA treatment group and the combined treatment group exhibited more numerous and larger starch granules. Plants use the generation of starch granules as a defense mechanism to increase their chances of surviving in harsh environments [45]. In the combined treatment group, the chloroplasts also exhibited a certain degree of deformation; however, the number of osmiophilic granules was not as high as in the groups treated separately with CAA and NDMA. This may be due to the antagonistic interaction induced by the combined presence of the two substances.

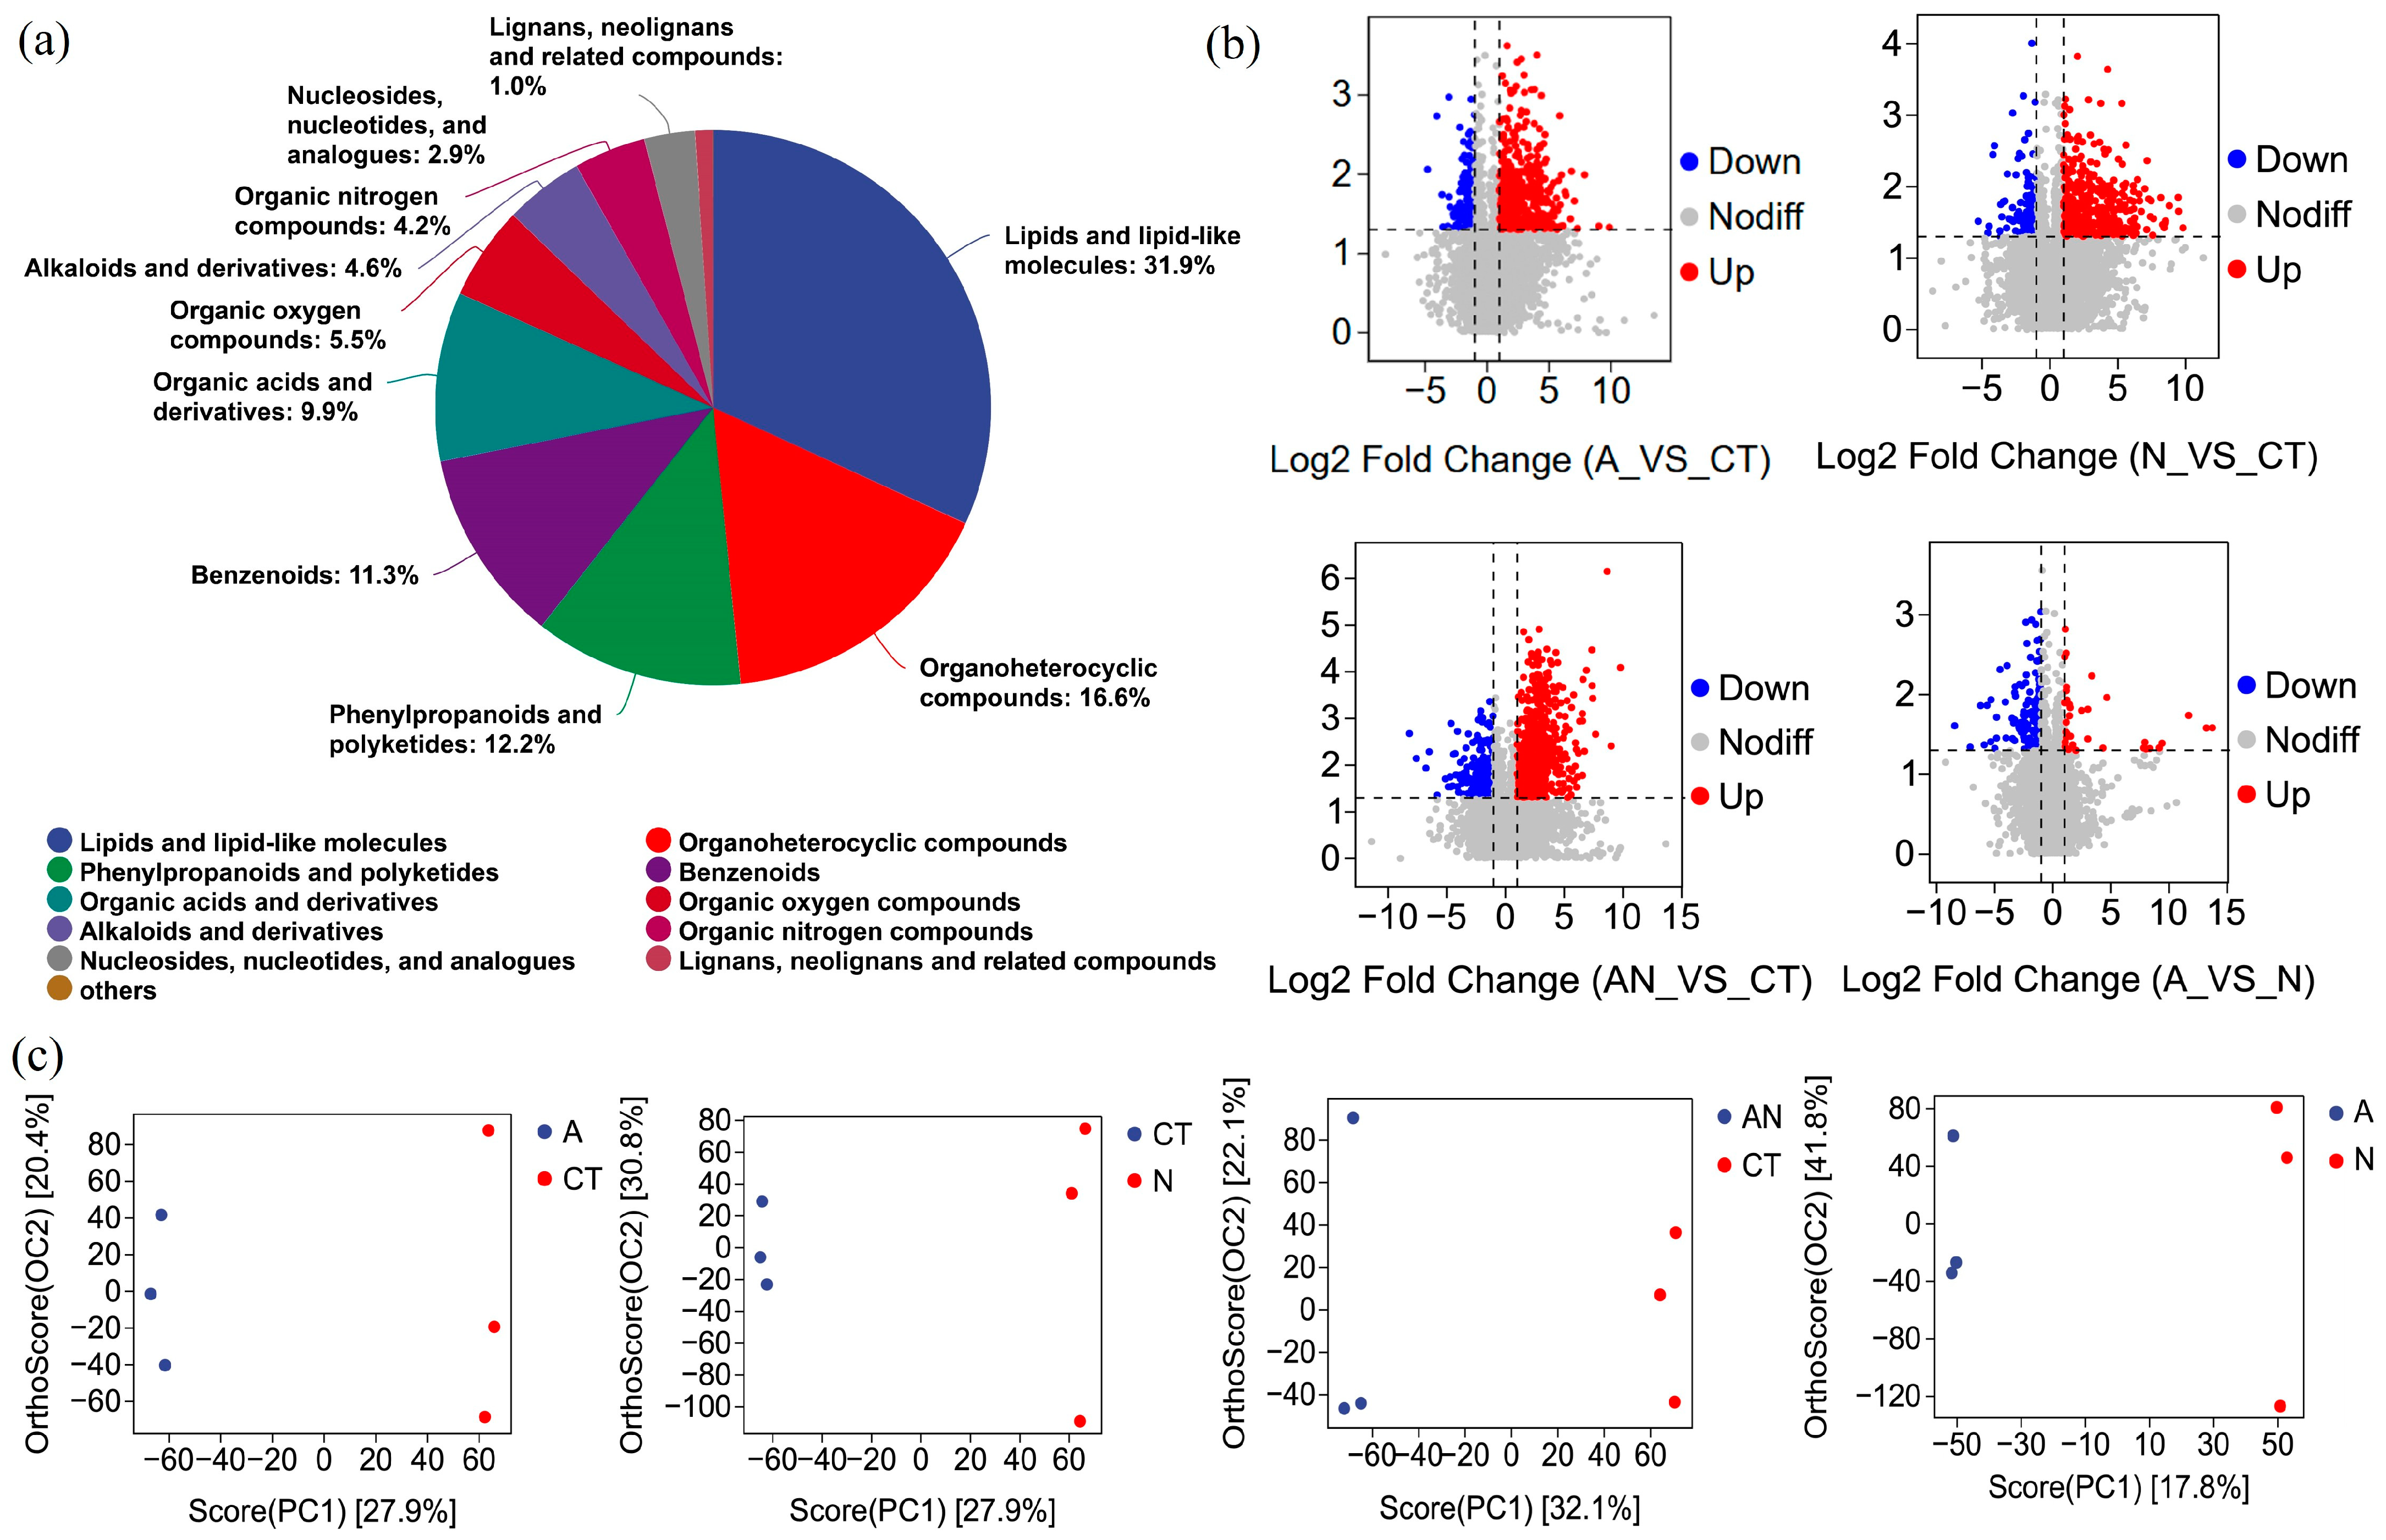
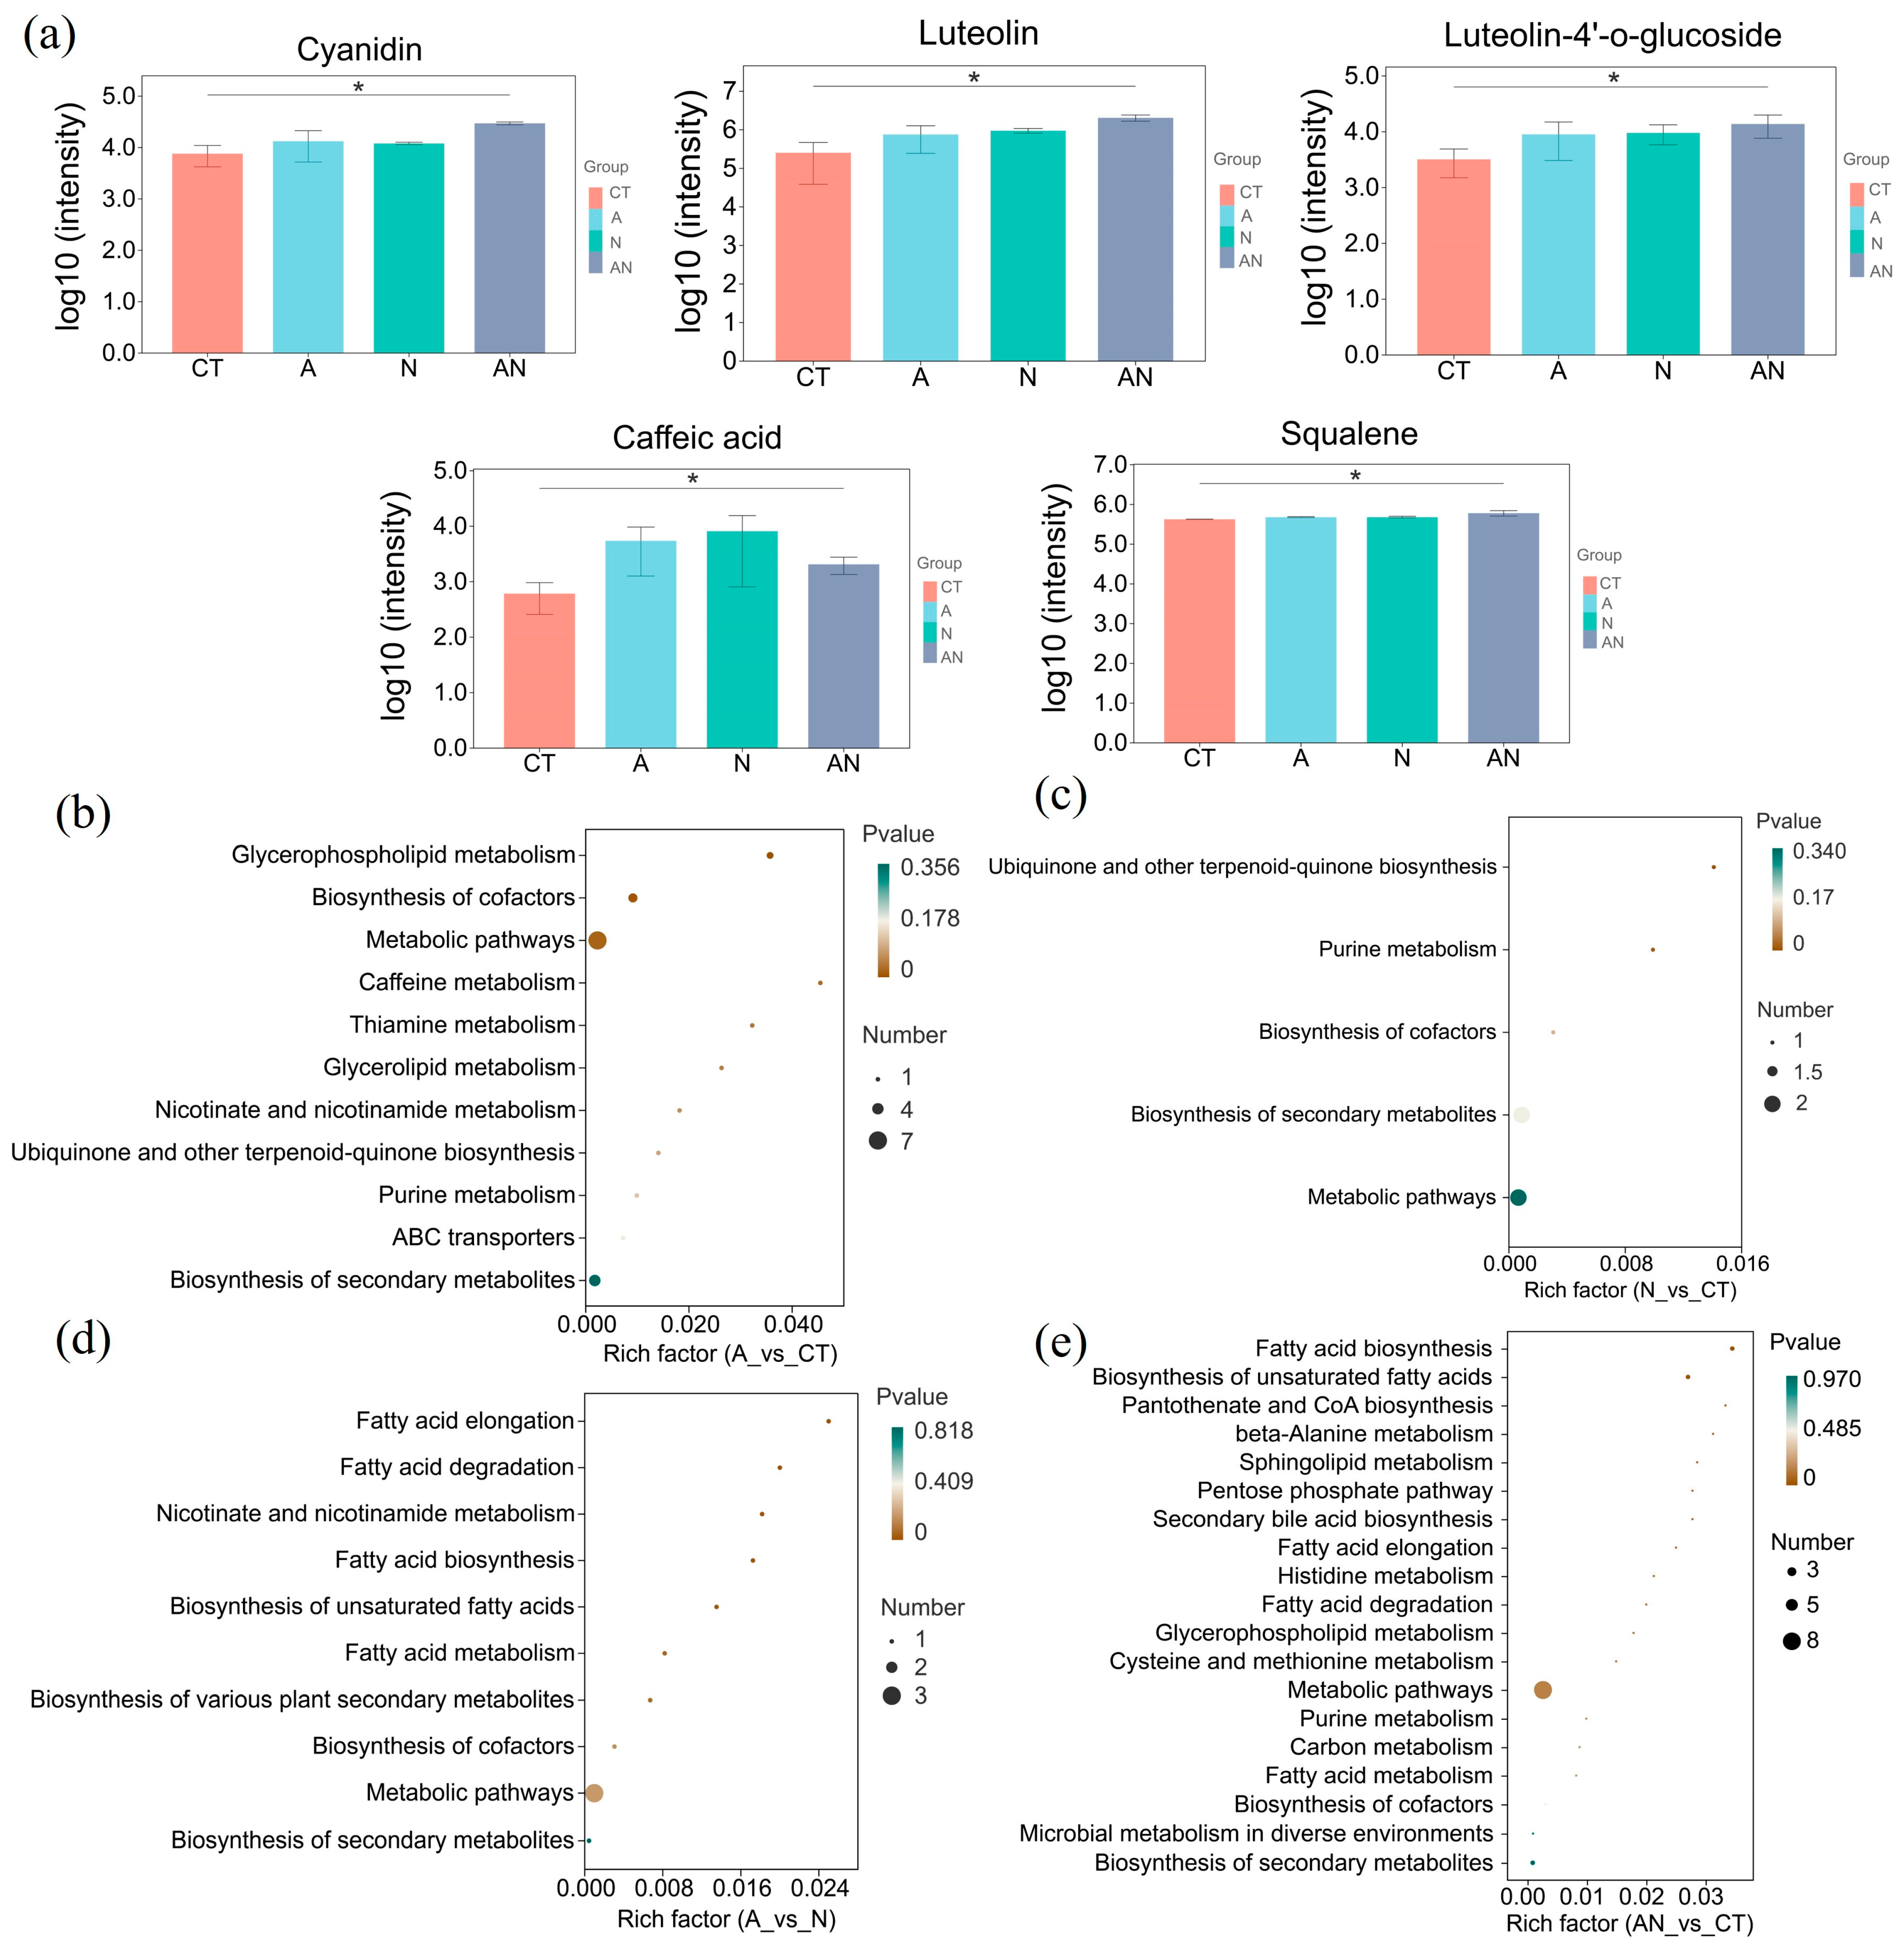
3.5. Metabolic Analysis of V. natans Leaves

To better understand the impact of CAA and NDMA, individually and in combination, on V. natans at the molecular level, a non-targeted metabolomics approach was used to identify and quantify metabolites of V. natans using data from UHPLC-Q-TOF MS (Figure 4). In Supplementary Text S3, the assessment information for the quality control of the metabolomics experiment is provided. From a comprehensive screening, it was found that 542 metabolites were encompassed across various treatments, among which 61 were differentially expressed metabolites (VIP > 1, p < 0.05). These primarily consisted of lipids and lipid-like molecules (31.9%), organic heterocyclic compounds (16.6%), phenylpropanoids and polyketides (12.2%), benzene and substituted derivatives (11.3%), organic acids and derivatives (9.9%), organic oxides (5.5%), alkaloids and derivatives (4.6%), organic nitrogen compounds (4.2%), nucleosides, nucleotides, and analogs (2.9%), and lignans, neolignans, and related compounds (1.0%). In Figure 4b, the distinctions in metabolites between different samples are presented using a unified statistical analysis method. When compared to the control treatment, a greater number of metabolites were upregulated rather than downregulated in plants exposed to pollution, indicating that both single and combined pollutants significantly affected the metabolites in V. natans leaves to different extents. Orthogonal Projections to Latent Structures Discriminant Analysis (OPLS-DA) was used to examine inter-group differences through multiple principal component analyses (Figure 4c). In this study, the pollutant-treated group and control group were easily distinguished from one another. The first principal component (PC1) and the second principal component (OC2) explained 27.9% and 20.4% of the features of the original dataset, respectively, in the comparison of group A with the CT group. In the comparison of group N with the CT group, PC1 and OC2 explained 27.9% and 30.8% of the features of the original dataset. In the comparison between the AN group and the CT group, PC1 and OC2 explained 32.1% and 22.1% of the features of the original dataset, respectively. These results indicate that CAA and NDMA altered the quantity and types of metabolites in V. natans leaves.
Metabolite functions and metabolome information were analyzed using the KEGG system to confirm notably impacted metabolic pathways (Figure 5). In this study, compared to the control group, CAA treatment significantly affected lipid metabolism pathways, including glycerophospholipid and glycerolipid metabolism, as well as nicotinate and nicotinamide metabolism and the ABC transporter pathway in V. natans leaves. Fatty acids and lipids constitute fundamental and indispensable elements of every plant cell. These molecules not only ensure structural stability and supply energy for numerous metabolic activities but also function as signaling agents [46]. New evidence on glycerol esters in plant stress response suggests that the remodeling of glycerol ester acyl groups is crucial for eliminating oxidized or impaired acyl chains, isolating cytotoxic fatty acids, liberating signaling lipids, and managing stress response mechanisms [47]. Additionally, the ABC transporters, which are involved in membrane transport, are primarily located on the plasma membrane and mediate the transport of carbohydrates, amino acids, phospholipids, and polypeptides. These regulatory actions serve a dual function in sustaining stress adaptability while enhancing the consumption of ROS. On the one hand, the plasma membrane provides reaction sites for eliminating excess ROS induced by CAA or NDMA. On the other hand, it can transport oxidized lipids from other parts of the cell to the membrane. This indicates that V. natans can respond to stress through cell membrane regulatory mechanisms. NDMA significantly impacts the purine metabolism pathway by disrupting nucleotide metabolism (Figure 5c). Exposure to NDMA leads to the downregulation of 1H-purine-6-amine (adenine). Adenine plays a crucial role in cellular respiration (biological oxidation), the formation of ATP and coenzymes NAD and FAD, and protein synthesis. A previous study has shown that under exposure to PFOA or PFOS, purine metabolism in birds is affected, suggesting the activation of DNA repair [29]. Therefore, it is hypothesized that V. natans can also respond to environmental stress through DNA repair mechanisms when exposed to NDMA. As shown in Figure 5d, compared to the CAA group, NDMA affected several lipid metabolism pathways, including fatty acid elongation, fatty acid degradation, fatty acid biosynthesis, and unsaturated fatty acid biosynthesis. Additionally, NDMA influenced nicotinate and nicotinamide metabolism, as well as the synthesis of various plant secondary metabolites. Furthermore, in contrast to the CT group, the combined use of CAA and NDMA had the most pronounced effect on lipid metabolism and affected amino acid metabolism, carbohydrate metabolism, purine metabolism, and carbon metabolic pathways (Figure 5e). Amino acids, the primary substances for protein synthesis, are essential to the physiological processes of plants [48]. The combined application of CAA and NDMA interferes with metabolic pathways linked to amino acids, such as arginine, beta-alanine, cysteine, and methionine. Chloroplasts are one of the main pathways of cysteine synthesis; therefore, the downregulation of cysteine may be due to damage to the chloroplasts in V. natans. Gluconate in carbon metabolism is upregulated, and carbon metabolism is the most crucial foundational metabolism within plants. It provides the carbon skeleton and energy required for the process of creating proteins, nucleic acids, and amino acids, all of which are indispensable elements in nitrogen metabolism. In summary, V. natans maintains homeostasis by regulating its basal metabolism.
Antioxidant defense systems are activated in response to the ROS triggered by CAA or NDMA. Beyond the affected antioxidant pathways described above, CAA or NDMA exposure affects five additional antioxidants, comprising three phenolic substances and two distinct metabolites (Figure 5a). Phenolic hydroxyl groups serve as hydrogen donors to neutralize accumulated ROS, and certain phenolics function as substrates for antioxidant enzymes during oxidative stress [29]. Exposure to CAA and NDMA results in a significant rise in the content of cyanidin, luteolin, and luteolin-4-O-glucoside. Cyanidin belongs to the class of bioflavonoids, and luteolin is also a major member of the flavonoid class of compounds. The primary physiological activities of flavonoids are their radical scavenging capacity and antioxidant ability. Luteolin-4-O-glucoside has also been demonstrated to possess strong antioxidant capabilities [49]. Similarly, when compared to the control group, treatment with either individual pollutants or a combination of pollutants led to a notable elevation in the levels of caffeic acid and squalene in the V. natans leaves. Caffeic acid has the capacity to upregulate the production of the antioxidant glutathione [50]. Meanwhile, caffeic acid plays a crucial role in the biosynthesis of polyphenolic compounds, such as hydroxycinnamic acid [29]. This compound is a remarkable antioxidant, effectively preventing the oxidation of low-density lipoproteins, inhibiting lipid peroxidation, and reducing ROS. Squalene possesses a broad spectrum of biological activities and, beyond its antioxidant function, is increasingly reported as a stress protectant in plants [51]. The increase in these antioxidants’ concentrations indicates that V. natans responds to stress through antioxidant defense mechanisms.
Based on the regulation of metabolic products, four defense mechanisms against CAA or NDMA exposure were suggested for plants. These mechanisms include cell membrane regulation, antioxidant defense system activation, DNA repair, and fundamental metabolism regulation. In the future, a more in-depth analysis of toxicity mechanisms at the gene expression level will be conducted, offering insights into the overall functionality and dynamic changes of biological systems.

4. Conclusions

The present research thoroughly examined the physiological and biochemical reactions of V. natans to CAA and NDMA toxicity and combined toxicity. Both pollutants affected the photosynthetic system of V. natans and caused damage to the chloroplasts of the submerged plant. V. natans’s antioxidant system was triggered to counteract the stress-induced effects: the activity levels of POD and SOD enzymes, as well as the concentration of the antioxidant GSH, increased, while CAT activity was significantly inhibited. Furthermore, when using Chl (a + b), SOD, GSH, MDA, and TP as indicators, the interaction between CAA and NDMA on V. natans primarily exhibited antagonistic effects. Metabolomics indicated that lipids and lipid-like molecules comprised the highest proportion of all metabolites (31.9%). Additionally, the abundance of plant metabolites and metabolic pathways underwent changes, including fatty acid metabolism, biosynthesis of secondary metabolites, the metabolism of cofactors and vitamins, nucleotide pathways, amino acid pathways, and carbon pathways. The increased content of phenolic compounds and antioxidants such as caffeic acid demonstrated enhanced stress tolerance. Based on the regulation of metabolic products, this study suggested four defense mechanisms in plants subjected to CAA or NDMA exposure, including cell membrane regulation, antioxidant defense system activation, DNA repair, and regulation of fundamental metabolism. This research provides a broader perspective on the ecological effects of the DBPs CAA and NDMA on submerged aquatic plants in an aquatic environment and offers scientific evidence for their ecological risk assessment. Furthermore, our research findings support controlling DBP levels in aquatic environments to ensure environmental safety and public health by optimizing disinfection processes (such as using more ultraviolet or ozone disinfection compared to chlorination), enhancing watershed wastewater management, and regularly monitoring DBP levels and water quality changes.

Supplementary Materials

The following supporting information can be downloaded at: https://www.mdpi.com/article/10.3390/w16182689/s1, Figure S1: positive ion mode QC sample total ion flow map overlay spectrum. The horizontal coordinate indicates the retention time of each peak and the vertical coordinate indicates the intensity value of the peak; Figure S2: correlation analysis plot of QC samples. The x-axis and y-axis represent the QC samples. Each dot in the grid represents an ion peak (metabolite) extracted from the QC samples, with the x-axis and y-axis representing the logarithmic values of the ion peak signal intensities. The values in the plot are the correlation coefficients, with a coefficient greater than 0.9 indicating a very strong correlation; Figure S3: QC Relative Standard Deviation (RSD) Plot. The horizontal axis represents the RSD values, while the vertical axis represents the proportion of the number of peaks relative to the total number of peaks in the QC samples.

Author Contributions

Conducting experiments and writing—original draft preparation, K.H.; data analysis, K.H. and H.H.; investigation, A.L.; writing—review & editing, H.W. and X.H.; supervision, Z.Z. and H.W. All authors have read and agreed to the published version of the manuscript.

Funding

This research was funded by ABA Chemicals.

Data Availability Statement

The original contributions presented in the study are included in the article/Supplementary Materials, further inguiries can be directed to the corresponding author/s.

Acknowledgments

We sincerely thank Zheng Zheng and Hanqi Wu for their valuable guidance and insightful feedback throughout the study. We would also like to thank the technicians at the laboratory of Fudan University Taihu Lake Experimental Base for their help during the experimental process.

Conflicts of Interest

The authors declare no conflict of interest.

References

  1. Li, Z.G.; Song, G.F.; Bi, Y.H.; Gao, W.; He, A.; Lu, Y.; Wang, Y.W.; Jiang, G.B. Occurrence and distribution of disinfection by products in domestic wastewater effluent, tap water, and surface water during the SARS-CoV-2 Pandemic in China. Environ. Sci. Technol. 2021, 55, 4103–4114. [Google Scholar] [CrossRef]
  2. Guo, J.; Liao, M.F.; He, B.S.; Liu, J.; Hu, X.M.; Yan, D.; Wang, J. Impact of the COVID-19 pandemic on household disinfectant consumption behaviors and related environmental concerns: A questionnaire-based survey in China. J. Environ. Chem. Eng. 2021, 9, 106168. [Google Scholar] [CrossRef]
  3. Lewis, D. COVID-19 Rarely Spreads through Surfaces. So Why Are We Still Deep Cleaning? Nature 2021, 590, 26–28. [Google Scholar] [CrossRef]
  4. Chuang, Y.H.; Szczuka, A.; Mitch, W.A. Comparison of Toxicity-Weighted Disinfection Byproduct Concentrations in Potable Reuse Waters and Conventional Drinking Waters as a New Approach to Assessing the Quality of Advanced Treatment Train Waters. Environ. Sci. Technol. 2019, 53, 3729–3738. [Google Scholar] [CrossRef]
  5. Zhang, Y.; Cheng, Z.; Xiao, F.; Wu, H.; Zou, H. Effects of disinfection by-products in sewage treatment plant effluent on the growth and physiology of Chlorella vulgaris. Huanjing Huaxue-Environ. Chem. 2023, 42, 370–378. [Google Scholar] [CrossRef]
  6. Chu, W.H.; Shen, J.; Luan, X.M.; Xiao, R.; Xu, Z.X. Study on secondary risk of water environment under enhanced disinfection of wastewater treatment plant during epidemic prevention and control. Water Wastewater Eng. 2020, 56, 1–5. [Google Scholar]
  7. Nabi, G.; Wang, Y.; Hao, Y.J.; Khan, S.; Wu, Y.F.; Li, D.M. Massive use of disinfectants against COVID-19 poses potential risks to urban wildlife. Environ. Res. 2020, 188, 109916. [Google Scholar] [CrossRef]
  8. Wang, L.Y.; Zhang, X.; Chen, S.S.; Meng, F.B.; Zhang, D.Y.; Liu, Y.; Li, M.; Liu, X.; Huang, X.; Qu, J.H. Spatial variation of dissolved organic nitrogen in Wuhan surface waters: Correlation with the occurrence of disinfection byproducts during the COVID-19 pandemic. Water Res. 2021, 198, 117138. [Google Scholar] [CrossRef]
  9. Liu, J.Q.; Zhang, X.R. Comparative toxicity of new halophenolic DBPs in chlorinated saline wastewater effluents against a marine alga: Halophenolic DBPs are generally more toxic than haloaliphatic ones. Water Res. 2014, 65, 64–72. [Google Scholar] [CrossRef]
  10. Cui, H.J.; Chen, B.Y.; Jiang, Y.L.; Tao, Y.; Zhu, X.S.; Cai, Z.H. Toxicity of 17 Disinfection By-products to Different Trophic Levels of Aquatic Organisms: Ecological Risks and Mechanisms. Environ. Sci. Technol. 2021, 55, 10534–10541. [Google Scholar] [CrossRef]
  11. Melo, A.; Ferreira, C.; Ferreira, I.M.P.L.V.O.; Mansilha, C. Acute and chronic toxicity assessment of haloacetic acids using. J. Toxicol. Environ. Health Part A 2019, 82, 977–989. [Google Scholar] [CrossRef]
  12. Li, Z.G.; Liu, X.Y.; Huang, Z.J.; Hu, S.Y.; Wang, J.J.; Qian, Z.Y.; Feng, J.F.; Xian, Q.M.; Gong, T.T. Occurrence and ecological risk assessment of disinfection byproducts from chlorination of wastewater effluents in East China. Water Res. 2019, 157, 247–257. [Google Scholar] [CrossRef]
  13. Ye, J.; Ni, J.W.; Tian, F.X.; Ji, X.Y.; Hou, M.F.; Li, Y.T.; Yang, L.; Wang, R.X.; Xu, W.W.; Meng, L. Toxicity effects of disinfection byproduct chloroacetic acid to Microcystis aeruginosa: Cytotoxicity and mechanisms. J. Environ. Sci. 2023, 129, 229–239. [Google Scholar] [CrossRef]
  14. Breider, F.; Aquillon, C.G.; von Gunten, U. A survey of industrial N-nitrosamine discharges in Switzerland. J. Hazard. Mater. 2023, 450. [Google Scholar] [CrossRef]
  15. Plewa, M.J.; Kargalioglu, Y.; Vankerk, D.; Minear, R.A.; Wagner, E.D. Mammalian cell cytotoxicity and genotoxicity analysis of drinking water disinfection by-products. Env. Mol. Mutagen. 2002, 40, 134–142. [Google Scholar] [CrossRef]
  16. Krauss, M.; Longrée, P.; Dorusch, F.; Ort, C.; Hollender, J. Occurrence and removal of N-nitrosamines in wastewater treatment plants. Water Res. 2009, 43, 4381–4391. [Google Scholar] [CrossRef]
  17. Chuang, Y.H.; Shabani, F.; Munoz, J.; Aflaki, R.; Hammond, S.D.; Mitch, W.A. Comparing industrial and domestic discharges as sources of N-nitrosamines and their chloramine or ozone-reactive precursors. Environ. Sci.-Water Res. Technol. 2019, 5, 726–736. [Google Scholar] [CrossRef]
  18. Zhou, Q.L.; McCraven, S.; Garcia, J.; Gasca, M.; Johnson, T.A.; Motzer, W.E. Field evidence of biodegradation of N-Nitrosodimethylamine (NDMA) in groundwater with incidental and active recycled water recharge. Water Res. 2009, 43, 793–805. [Google Scholar] [CrossRef]
  19. Wang, W.F.; Ren, S.Y.; Zhang, H.F.; Yu, J.W.; An, W.; Hu, J.Y.; Yang, M. Occurrence of nine nitrosamines and secondary amines in source water and drinking water: Potential of secondary amines as nitrosamine precursors. Water Res. 2011, 45, 4930–4938. [Google Scholar] [CrossRef]
  20. Ma, F.J.; Wan, Y.; Yuan, G.X.; Meng, L.P.; Dong, Z.M.; Hu, J.Y. Occurrence and source of nitrosamines and secondary amines in groundwater and its adjacent Jialu River Basin, China. Environ. Sci. Technol. 2012, 46, 3236–3243. [Google Scholar] [CrossRef]
  21. Yan, Z.G.; Wang, W.L.; Zhou, J.L.; Yi, X.L.; Zhang, J.; Wang, X.N.; Liu, Z.T. Screening of high phytotoxicity priority pollutants and their ecological risk assessment in China’s surface waters. Chemosphere 2015, 128, 28–35. [Google Scholar] [CrossRef]
  22. Liu, N.A.; Wu, Z.H. Growth and antioxidant response in Ceratophyllum demersum L. under sodium dodecyl sulfate (SDS), phenol and joint stress. Ecotox Environ. Safe 2018, 163, 188–195. [Google Scholar] [CrossRef]
  23. Ren, L.M.; Gao, Y.; Hu, Z.X.; Jiang, X.; Yang, L.Y. The Growth of and Its Epiphytic Biofilm in Simulated Nutrient-Rich Flowing Water. Water 2022, 14, 2236. [Google Scholar] [CrossRef]
  24. Lichtenthaler, H.K.; Wellburn, A.R. Determinations of total carotenoids and chlorophylls a and b of leaf extracts in different solvents. Biochem. Soc. Trans. 1983, 11, 591–592. [Google Scholar] [CrossRef]
  25. Hong, J.; Huang, X.; Wang, Z.; Luo, X.; Huang, S.; Zheng, Z. Combined toxic effects of enrofloxacin and microplastics on submerged plants and epiphytic biofilms in high nitrogen and phosphorus waters. Chemosphere 2022, 308, 136099. [Google Scholar] [CrossRef]
  26. Gai, Y.; Liu, B.; Ma, H.; Li, L.; Chen, X.; Moenga, S.; Riely, B.; Fayyaz, A.; Wang, M.; Li, H. The methionine biosynthesis regulator AaMetR contributes to oxidative stress tolerance and virulence in Alternaria alternata. Microbiol. Res. 2019, 219, 94–109. [Google Scholar] [CrossRef]
  27. Li, H.M.; Li, Q.; Luo, X.; Fu, J.; Zhang, J.B. Responses of the submerged macrophyte Vallisneria natans to a water depth gradient. Sci. Total Environ. 2020, 701. [Google Scholar] [CrossRef]
  28. Liu, N.; Zhu, L.Z. Metabolomic and Transcriptomic Investigation of Metabolic Perturbations in Oryza sativa L. Triggered by Three Pesticides. Environ. Sci. Technol. 2020, 54, 6115–6124. [Google Scholar] [CrossRef]
  29. Li, P.; Oyang, X.; Xie, X.; Li, Z.; Yang, H.; Xi, J.; Guo, Y.; Tian, X.; Liu, B.; Li, J.; et al. Phytotoxicity induced by perfluorooctanoic acid and perfluorooctane sulfonate via metabolomics. J. Hazard. Mater. 2020, 389, 121852. [Google Scholar] [CrossRef]
  30. Abbott, W.S. A method of computing the effectiveness of an insecticide. J. Econ. Entomol. 1925, 18, 265–267. [Google Scholar] [CrossRef]
  31. Gatidou, G.; Thomaidis, N.S. Evaluation of single and joint toxic effects of two antifouling biocides, their main metabolites and copper using phytoplankton bioassays. Aquat. Toxicol. 2007, 85, 184–191. [Google Scholar] [CrossRef]
  32. Wang, Z.; Zhang, J.G.; Li, E.H.; Zhang, L.; Wang, X.L.; Song, L.R. Combined toxic effects and mechanisms of microsystin-LR and copper on Vallisneria Natans (Lour.) Hara seedlings. J. Hazard. Mater. 2017, 328, 108–116. [Google Scholar] [CrossRef] [PubMed]
  33. Du, W.C.; Gardea-Torresdey, J.L.; Ji, R.; Yin, Y.; Zhu, J.G.; Peralta-Videa, J.R.; Guo, H.Y. Physiological and biochemical changes imposed by CeO2 nanoparticles on wheat: A life cycle field study. Environ. Sci. Technol. 2015, 49, 11884–11893. [Google Scholar] [CrossRef] [PubMed]
  34. Bai, F.; Jia, Y.L.; Yang, C.P.; Li, T.L.; Wu, Z.X.; Liu, J.; Song, L.R. Multiple physiological response analyses aid the understanding of sensitivity variation between Microcystis aeruginosa and Chlorella sp. under paraquat exposures. Environ. Sci. Eur. 2019, 31, 1–17. [Google Scholar] [CrossRef]
  35. Sharma, A.; Kumar, V.; Shahzad, B.; Ramakrishnan, M.; Sidhu, G.P.S.; Bali, A.S.; Handa, N.; Kapoor, D.; Yadav, P.; Khanna, K.; et al. Photosynthetic response of plants under different abiotic stresses: A review. J. Plant Growth Regul. 2020, 39, 509–531. [Google Scholar] [CrossRef]
  36. Gill, S.S.; Tuteja, N. Reactive oxygen species and antioxidant machinery in abiotic stress tolerance in crop plants. Plant Physiol. Biochem. 2010, 48, 909–930. [Google Scholar] [CrossRef]
  37. Li, M.Y.; Ma, X.X.; Wang, Y.R.; Saleem, M.; Yang, Y.; Zhang, Q.M. Ecotoxicity of herbicide carfentrazone-ethyl towards earthworm in soil. Comp. Biochem. Phys. C 2022, 253, 109250. [Google Scholar] [CrossRef]
  38. Zhang, J.W.; Huang, D.Y.; Deng, H.; Zhang, J.B. Responses of submerged plant Vallisneria natans growth and leaf biofilms to water contaminated with microplastics. Sci. Total Environ. 2022, 818, 151750. [Google Scholar] [CrossRef] [PubMed]
  39. Liu, N.; Zhong, G.D.; Zhou, J.N.; Liu, Y.L.; Pang, Y.J.; Cai, H.; Wu, Z.H. Separate and combined effects of glyphosate and copper on growth and antioxidative enzymes in Salvinia natans (L.) All. Sci. Total Environ. 2019, 655, 1448–1456. [Google Scholar] [CrossRef] [PubMed]
  40. Torok, A.; Gulyas, Z.; Szalai, G.; Kocsy, G.; Majdik, C. Phytoremediation capacity of aquatic plants is associated with the degree of phytochelatin polymerization. J. Hazard. Mater. 2015, 299, 371–378. [Google Scholar] [CrossRef]
  41. Pan, T.; Chen, X.K.; Kong, C.M.; Gao, D.D.; Liu, W.J.; Liao, H.P.; Junaid, M.; Wang, J. Single and combined toxicity of polystyrene nanoplastics and PCB-52 to the aquatic duckweed Spirodela polyrhiza. Sci. Total Environ. 2023, 901, 166482. [Google Scholar] [CrossRef] [PubMed]
  42. Zhang, W.Z.; Li, Q.; Yang, Y.X.; Yu, Y.J.Z.; Li, S.; Liu, J.; Xiao, Y.X.; Wen, Y.L.; Wang, Q.C.; Lei, N.F.; et al. Joint toxicity mechanisms of perfluorooctanoic acid and sulfadiazine on submerged macrophytes and periphytic biofilms. J. Hazard. Mater. 2023, 458, 131910. [Google Scholar] [CrossRef] [PubMed]
  43. Bond, T.; Templeton, M.R.; Kamal, N.H.M.; Graham, N.; Kanda, R. Nitrogenous disinfection byproducts in English drinking water supply systems: Occurrence, bromine substitution and correlation analysis. Water Res. 2015, 85, 85–94. [Google Scholar] [CrossRef]
  44. Zhao, C.Y.; Liu, C.L.; Zhang, Y.; Cui, Y.T.; Hu, H.T.; Jahan, N.; Lv, Y.; Qian, Q.; Guo, L.B. A 3-bp deletion of WLS5 gene leads to weak growth and early leaf senescence in rice. Rice 2019, 12, 1–13. [Google Scholar] [CrossRef]
  45. Thalmann, M.; Santelia, D. Starch as a determinant of plant fitness under abiotic stress. New Phytol. 2017, 214, 943–951. [Google Scholar] [CrossRef]
  46. Lim, G.H.; Singhal, R.; Kachroo, A.; Kachroo, P. Fatty Acid- and Lipid-Mediated Signaling in Plant Defense. Annu. Rev. Phytopathol. 2017, 55, 505–536. [Google Scholar] [CrossRef]
  47. Yu, L.; Zhou, C.; Fan, J.; Shanklin, J.; Xu, C. Mechanisms and functions of membrane lipid remodeling in plants. Front. Plant Sci. 2021, 107, 37–53. [Google Scholar] [CrossRef]
  48. Lian, Y.; Liu, W.; Shi, R.; Zeb, A.; Wang, Q.; Li, J.; Zheng, Z.; Tang, J. Effects of polyethylene and polylactic acid microplastics on plant growth and bacterial community in the soil. J. Hazard. Mater. 2022, 435, 129057. [Google Scholar] [CrossRef]
  49. Chen, T.; Luo, S.; Wang, X.; Zhou, Y.; Dai, Y.; Zhou, L.; Feng, S.; Yuan, M.; Ding, C. Polyphenols from Blumea laciniata Extended the Lifespan and Enhanced Resistance to Stress in Caenorhabditis elegans via the Insulin Signaling Pathway. Antioxidants 2021, 10, 1744. [Google Scholar] [CrossRef]
  50. Li, X.N.; Shang, N.Y.; Kang, Y.Y.; Sheng, N.; Lan, J.Q.; Tang, J.S.; Wu, L.; Zhang, J.L.; Peng, Y. Caffeic acid alleviates cerebral ischemic injury in rats by resisting ferroptosis via Nrf2 signaling pathway. Acta Pharmacol. Sin. 2023, 45, 248–267. [Google Scholar] [CrossRef]
  51. Rico, C.M.; Wagner, D.C.; Ofoegbu, P.C.; Kirwa, N.J.; Clubb, P.; Coates, K.; Zenobio, J.E.; Adeleye, A.S. Toxicity assessment of perfluorooctanesulfonic acid (PFOS) on a spontaneous plant, velvetleaf (Abutilon theophrasti), via metabolomics. Sci. Total Environ. 2024, 907, 167894. [Google Scholar] [CrossRef] [PubMed]
Figure 1. Variations in growth and photosynthetic characteristics of V. natans when exposed to CAA, NDMA, and their combination. Increased root length (a); Increased leaf length (b); Increased biomass (c); Contents of Chl a (d); Chl b (e); Chl (a + b) (f). Different lowercase letters such as a, b, c, and d indicate statistically significant differences between treatments (p < 0.05).
Water 16 02689 g001
Figure 2. Variations in the V. natans leaf antioxidant system when exposed to CAA, NDMA, and their combination. SOD (a), POD (b), CAT (c), GSH (d), MDA (e), TP (f). Different lowercase letters such as a, b, c, and d indicate statistically significant differences between treatments (p < 0.05).
Water 16 02689 g002
Figure 3. Variations in the ultrastructure of V. natans subjected to CAA and NDMA. Chloroplast (CH), nucleolus (N), plasmolysis (PL), cell wall (CW), osmiophilic granules (OG), starch (ST), and lysosomes (LY).
Water 16 02689 g003
Figure 4. (a) Metabolite identification from all samples were analyzed. (b) Volcano plots illustrating differentially expressed metabolites (DEMs). FC: fold change. Positive values of log2 fold change represent upregulated DEMs, indicated by red dots, while negative values represent downregulated DEMs, indicated by blue dots. (c) OPLS-DA score plots. Score [PC1] and other score [OC2] correspond to principal components 1 and 2, respectively. The distribution of samples in the plot indicates the extent of metabolite differences between groups.
Water 16 02689 g004
Figure 5. (a) Alterations in the essential antioxidant composition within V. natans leaves were observed. Between groups * indicates the significance of the difference between the four groups, p < 0.05. (be) Enrichment analysis of altered metabolites in V. natans leaves subjected to CAA and NDMA exposure. The X-axis denotes the rich factor, while the Y-axis signifies the pathway names. The size of the bubbles corresponds to the quantity of DEGs involved, and the closer the bubbles are to brown, the higher the degree of enrichment in metabolic pathways.
Water 16 02689 g005
Table 1. The ratio of inhibition (RI) resulting from combined exposure to CAA and NDMA.
IndicatorsCAA (μg L−1)ANDMA (μg L−1)BAN (μg L−1)Observed Inhibition (%)Cexp (%)RI
1.0026.26 0.1013.60 1.00 + 0.1024.36 36.29 0.67
Chl (a + b)10.0044.08 1.0039.40 10.00 + 1.0012.30 66.11 0.19
100.0029.52 10.0040.29 100.00 + 10.0035.49 57.92 0.61
1.00−128.96 0.10−7.70 1.00 + 0.10−76.37 −146.59 0.52
SOD10.00−104.19 1.00−87.03 10.00 + 1.00−257.41 −281.90 0.91
100.00−21.41 10.00−149.06 100.00 + 10.0048.72 −202.39 −0.24
1.00−102.41 0.10−30.94 1.00 + 0.10−123.17 −165.03 0.75
GSH10.00−139.38 1.00−86.83 10.00 + 1.00−111.02 −347.23 0.32
100.00−69.66 10.00−23.18 100.00 + 10.00−126.18 −108.98 1.16
1.00−4.01 0.1047.39 1.00 + 0.10−25.89 45.28 −0.57
MDA10.0027.86 1.00−20.75 10.00 + 1.0036.03 12.89 2.80
100.0063.41 10.001.27 100.00 + 10.0044.87 63.87 0.70
1.00−34.19 0.1020.95 1.00 + 0.108.48 −6.08 −1.39
Protein10.00−5.33 1.009.66 10.00 + 1.0013.13 4.84 2.71
100.0031.29 10.0011.78 100.00 + 10.0025.42 39.38 0.65
Disclaimer/Publisher’s Note: The statements, opinions and data contained in all publications are solely those of the individual author(s) and contributor(s) and not of MDPI and/or the editor(s). MDPI and/or the editor(s) disclaim responsibility for any injury to people or property resulting from any ideas, methods, instructions or products referred to in the content.

