Article

Simulation and Analysis of Water Quality Improvement Measures for Plain River Networks Based on Infoworks ICM Model: Case Study of Baoying County, China

1
State Key Laboratory of Hydrology and Water Resources and Hydraulic Engineering Science, Nanjing 210029, China
2
Water Bureau of Baoying, Yangzhou 225899, China
3
Water Utilization Service Centre of Siyang, Suqian 223700, China
4
Water Resources Bureau of Yangzhou, Yangzhou 225001, China
*
Author to whom correspondence should be addressed.
Water 2024, 16(18), 2698; https://doi.org/10.3390/w16182698
Submission received: 29 August 2024 / Revised: 18 September 2024 / Accepted: 20 September 2024 / Published: 23 September 2024
(This article belongs to the Section Water Quality and Contamination)

Abstract

:
The water environment of plain river networks can be self-cleaning to a certain extent, but if the wastewater load exceeds a certain threshold, it can disturb the natural balance and cause water pollution. This underlines the importance of water pollution control measures. However, the development of water pollution control measures requires a large number of hydrological and hydrodynamic parameters and the establishment of corresponding relationships through modelling. Therefore, this study mainly used the Infoworks ICM model to construct a detailed hydrological–hydrodynamic water environment analysis model for the Yundong area of Baoying County, Yangzhou City, China, screened the main pollution source areas and pollution time periods of the typical rivers in the study area, and proposed effective improvement measures according to the actual situation of the study area. The results show that after the synergistic effect of multiple measures, the water quality can reach the Class III standard (GB3838-2002). This study can provide a reference for the water environment management and improvement of the plain river network and has good application prospects.

1. Introduction

In recent years, with the acceleration of socio-economic development and urbanisation, serious environmental and ecological problems have arisen in regional water bodies [1,2,3]. The global depletion of water resources highlights the importance of protecting water resources [4]. Located in the lower reaches of the Huaihe River, the Lixiahe region is the largest and lowest plain depression in the Huaihe River Basin. Due to the flat terrain and abundant water system, the plains river network is often a dense area of agricultural production, and the large use of chemical fertilisers and pesticides and the discharge of livestock and poultry breeding and domestic wastewater have increased the concentration of organic pollutants such as chemical oxygen demand (COD) and ammonia and nitrogen (NH3-N) in the water bodies of the plains river network. With the rapid development of social and economic development and the deepening of water environment management, the construction of ecological civilisation in the Lixiahe region is urgently needed to comprehensively manage the integrated impacts of point source pollution and surface–point source pollution on river water quality. It is urgent to ensure the long-term effective management of the water environment in the basin [5].
The management of the water environment in plains and depressions is a complex and crucial task, particularly in areas with dense water networks like the Lixiahe River area. The management of water environments in plain river network areas is a complex process involving the rational allocation of water resources, the control of pollution sources, and ecological restoration. It requires balancing water volume and quality to maintain self-purification, managing the impacts of droughts and floods, and addressing agricultural non-point source pollution through precision agriculture and ecological buffer zones. Industrial pollution is controlled by ensuring wastewater was properly treated, while domestic sewage, particularly in rural areas, is managed through decentralised treatment facilities. Ecological restoration efforts, including vegetation restoration and the creation of ecological floating islands, enhance water bodies’ natural purification capacities.
Mathematical models play an important role in water pollution management. They help managers deal with pollution problems scientifically and accurately by simulating the diffusion and transmission of pollutants, identifying pollution sources, optimising control measures, predicting water quality changes, and evaluating economic costs. Models can not only predict the behaviour of pollutants and water quality trends, but also evaluate the effects of different control solutions, thereby optimising water resource management strategies and providing decision support. In addition, mathematical models can also establish early warning systems in combination with real-time monitoring data, and simulate the impact of climate change on water quality, providing a scientific basis for long-term management planning. In recent years, numerous scholars have conducted extensive research on water quality simulation and water environment management in watersheds. Various models, such as the WASP model [6], QUAL2K model [7], Monte Carlo model [8], and InfoWorks ICM model [9], have been employed to analyse the primary pollution sources in watersheds, estimate pollution burdens, and simulate and assess the impact of non-point source pollution on river water quality. Zelazny et al. [10] employed the dynamic Water Quality Analysis Simulation Program (WASP) model to simulate the processes occurring along the longitudinal profile of the Dunajec River in Poland. The simulation results of pollutant diffusion along the riverbed offer crucial support for decision-makers [11]. Satish et al. [12] collected water quality, hydraulic, climate, and hydrological data of the Bhadra River Basin in India and used the QUAL2K model to simulate the water quality parameters of the river basin under different climate, pollution, and flow conditions, and evaluated the pollution level of the river basin. In addition, the global geographic information system (GIS) was combined with it to build a QUAL2K-GIS coupling model for the hydrological and water quality map of the Bhadra River Basin, which is beneficial for stakeholders and pollution control agencies to identify pollution hotspots and determine the amount of pollution reduction [13]. In response to the uncertainty generated during water quality data collection in the Songhua River Basin, Yang et al. [14] developed a novel water quality evaluation model by coupling the Monte Carlo model with the CRITIC and VIKOR methods. This approach addressed the limitations of traditional evaluation methods [15], expanded the capabilities of existing models, and provided a promising method for river water quality evaluation under uncertain environments. Additionally, by identifying water quality influencing factors such as total nitrogen (TN) and ammonia nitrogen (NH3-N) in the Songhua River Basin, this model offers control targets and directions for managers aiming to restore the functions of water ecosystems. This helps water quality managers to reliably assess water quality conditions and provide informed recommendations for water quality restoration [16]. Song et al. [17] utilised the InfoWorks ICM model to establish a hydraulic water quality model for Sanya City in China. After investigating the climate conditions, population, river distribution, and pollution conditions, they proposed a comprehensive management method. The implementation of this plan significantly reduced point source and non-point source pollution, with reductions of 87%, 84%, and 74% in COD, NH3-N, and TP, respectively. Through effective control of pollutant emissions, the water quality of regional rivers in Sanya has improved markedly.
Infoworks ICM (Integrated Catchment Modeling) 2021.6 is a comprehensive hydrological and hydraulic modelling software [18] designed for the simulation and management of water resources and drainage systems in urban areas and river basins [19]. Infoworks ICM exhibits a robust capability to simultaneously address hydrological (runoff generation) and hydraulic (flow movement) processes, facilitating end-to-end simulations from precipitation to riverine and drainage systems [20]. This integrated modelling proficiency proves particularly efficacious in managing complex catchments and urban drainage networks. The software’s support for three-dimensional modelling, coupled with seamless integration with geographic information systems (GISs) [21], enhances the accuracy and reliability of simulations. In addition, Infoworks ICM can combine real-time data for dynamic simulation and prediction, which is critical for emergency response and real-time urban drainage system management. The software can also simulate the migration and transformation of pollutants to provide a comprehensive water quality analysis [22]. However, the Infoworks ICM model faced challenges in addressing data quality, calibration difficulties, and potential uncertainties in simulating real-time pollution dynamics in the Lixiahe region.
In the simulation of water environments within river basins, it is crucial to comprehensively analyse the temporal and spatial distribution characteristics, as well as the load size, of both point source and non-point source pollution to ensure reliable results [23]. Point source pollution, such as wastewater discharge from industrial sites and sewage treatment plants, and non-point source pollution, like agricultural runoff and stormwater, both contribute to the overall pollution load in a river basin. However, many studies have tended to focus solely on non-point source pollution, overlooking significant sources like rural domestic waste, urban sewage, and industrial discharges. This omission has complicated the calibration of model parameters and reduced simulation accuracy [24]. Moreover, these models often failed to account for important processes such as pollutant adsorption onto sediments and deposition within the water body, which could significantly affect concentrations, particularly in slower water sections. Ignoring these mechanisms has hindered the accurate simulation of water quality changes and the temporal and spatial migration of pollutants along the river. Expanding the scope of models to include these factors is essential for improving the precision and realism of water quality simulations [25].
In this study, the surface and point source pollution loads, spatial and temporal pollutant distribution, and risk assessment were calculated using the Infoworks ICM model. This analysis transitioned from previous qualitative assessments to current quantitative conditions to propose best management practices (BMPs). The approach integrated non-engineering measures as the policy foundation to guide the effective implementation of engineering measures, ensuring the feasibility, cost-effectiveness, and durability of the BMPs. The in-stream loads of each pollutant were modelled by classifying the sources and investigating pollution levels. The spatial and temporal distribution characteristics of each pollutant were analysed, and the transformation of pollutants as they migrated with the water body was simulated. Additionally, this study assessed the risk of river pollution in the Lixiahe area (Baoying County) and proposed comprehensive planning and management measures. The results provide valuable insights for water environment management planning in plain river networks.

2. Materials and Methods

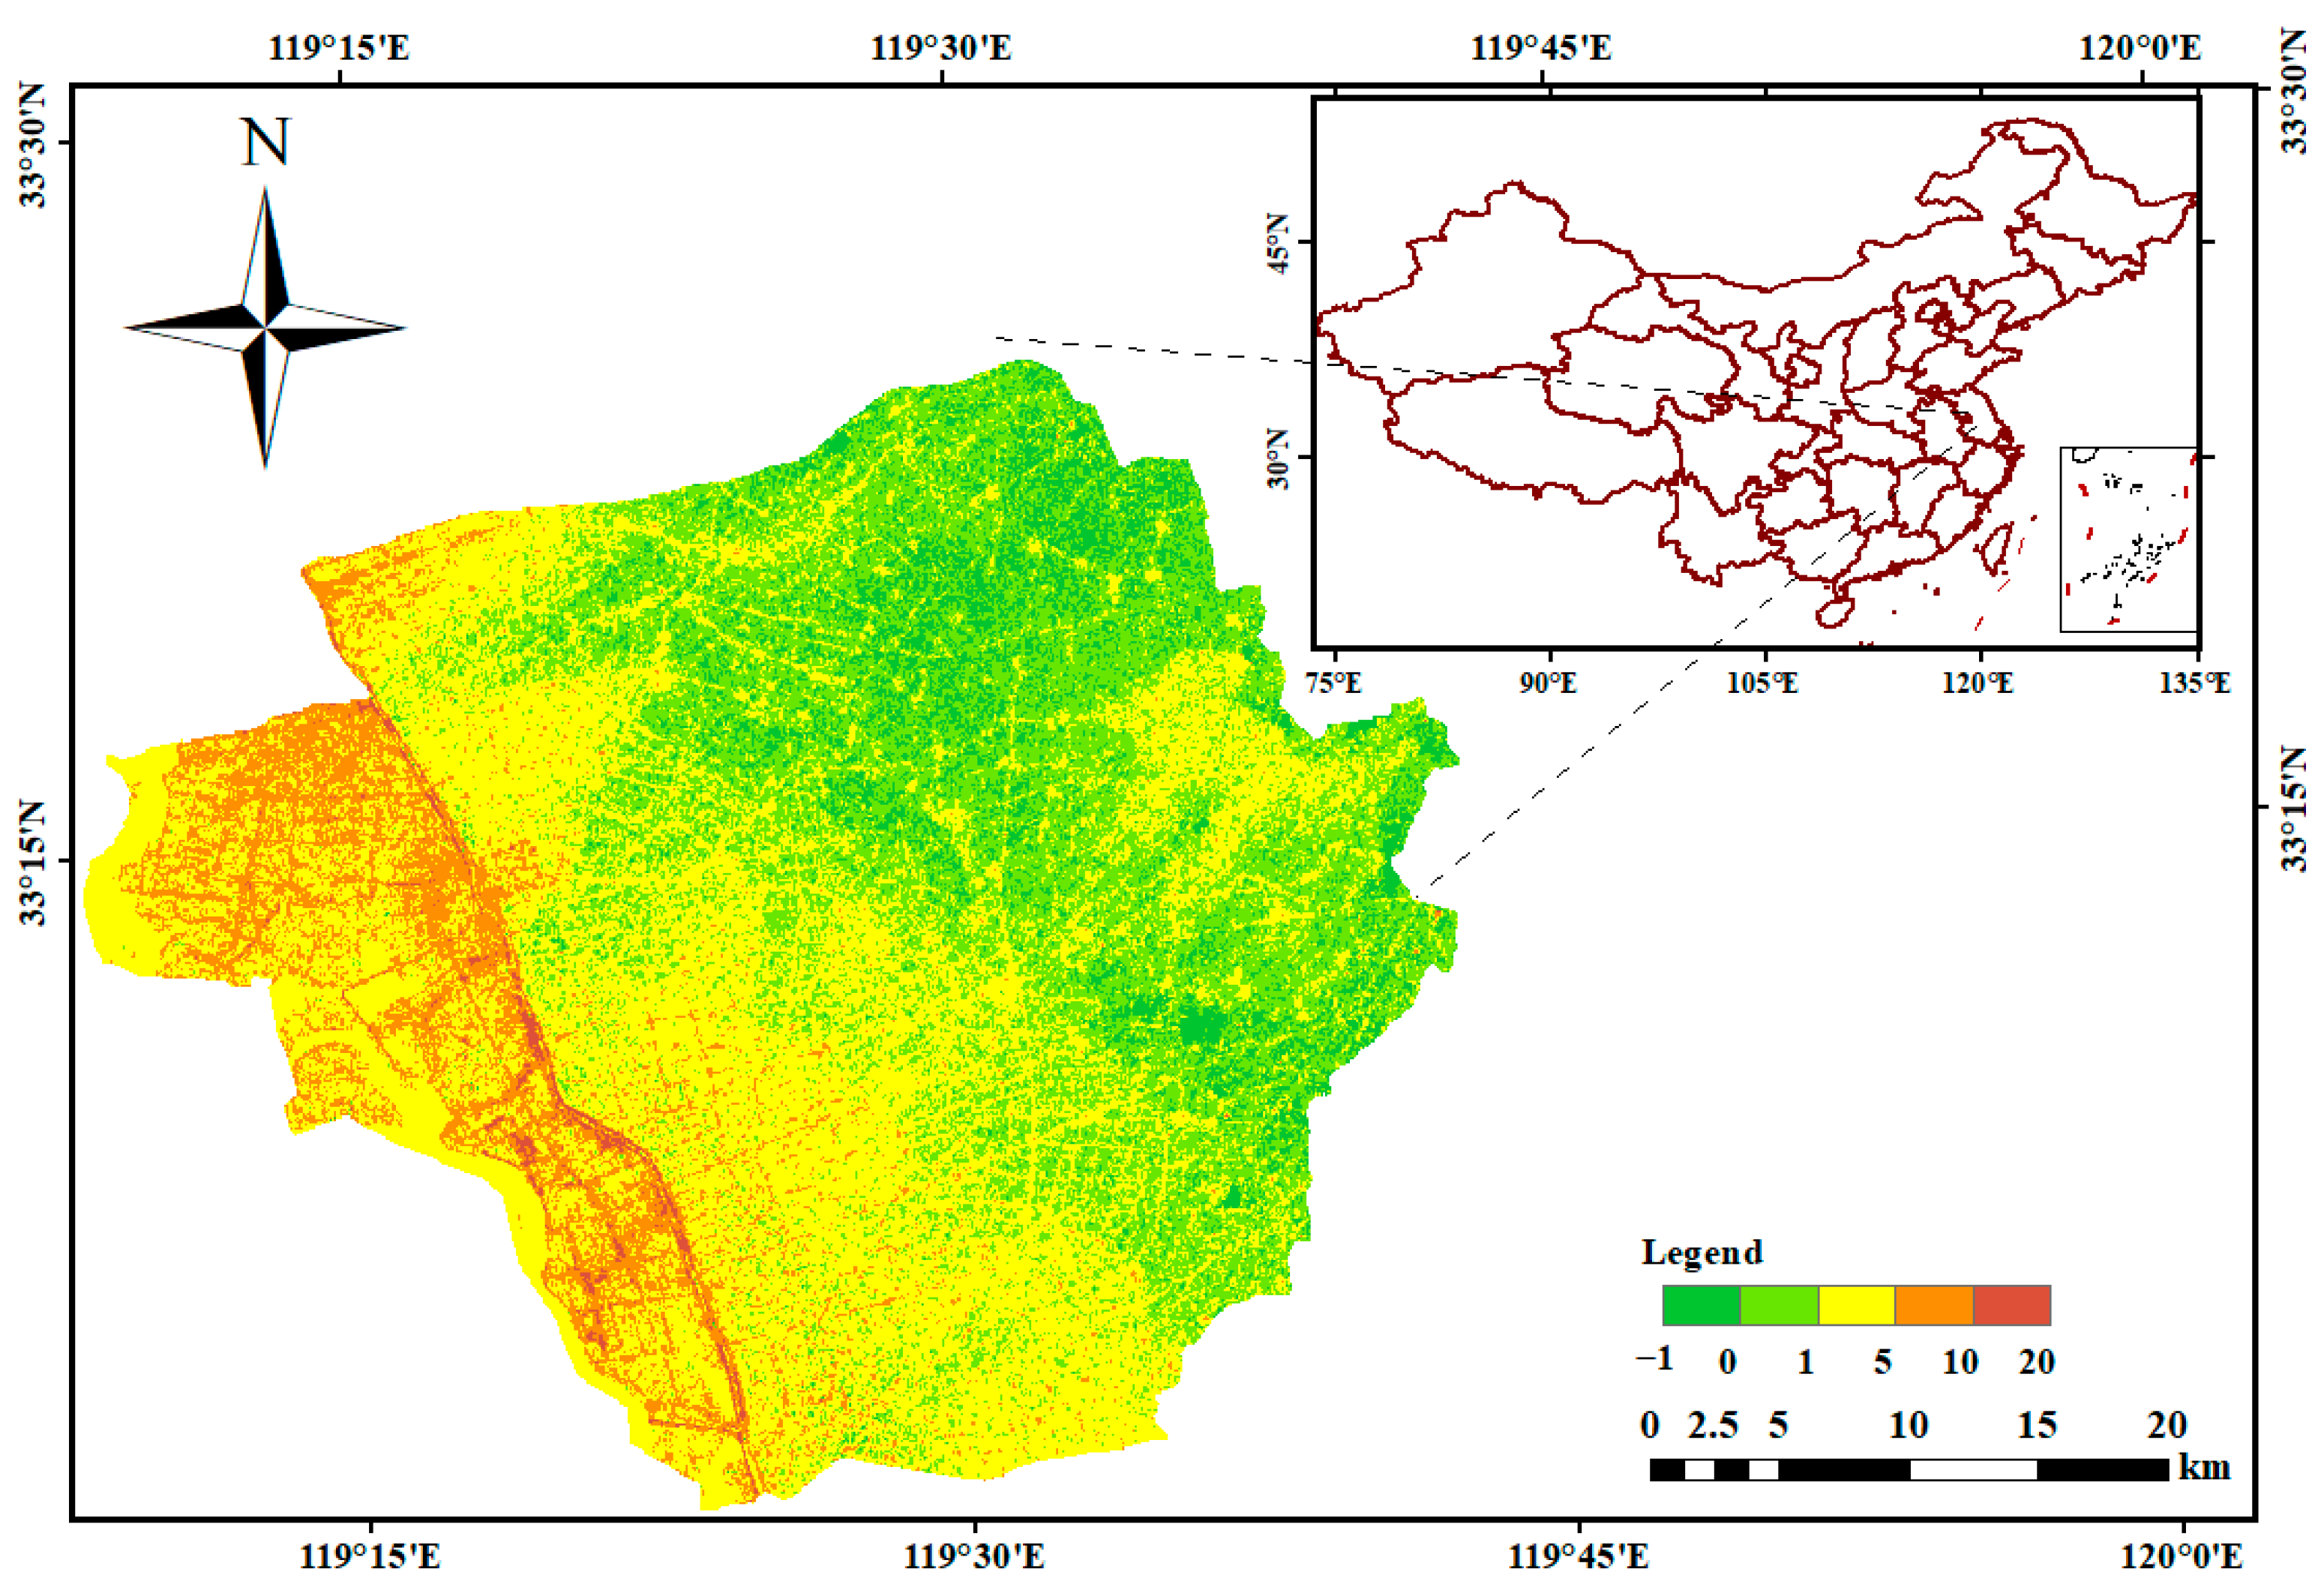
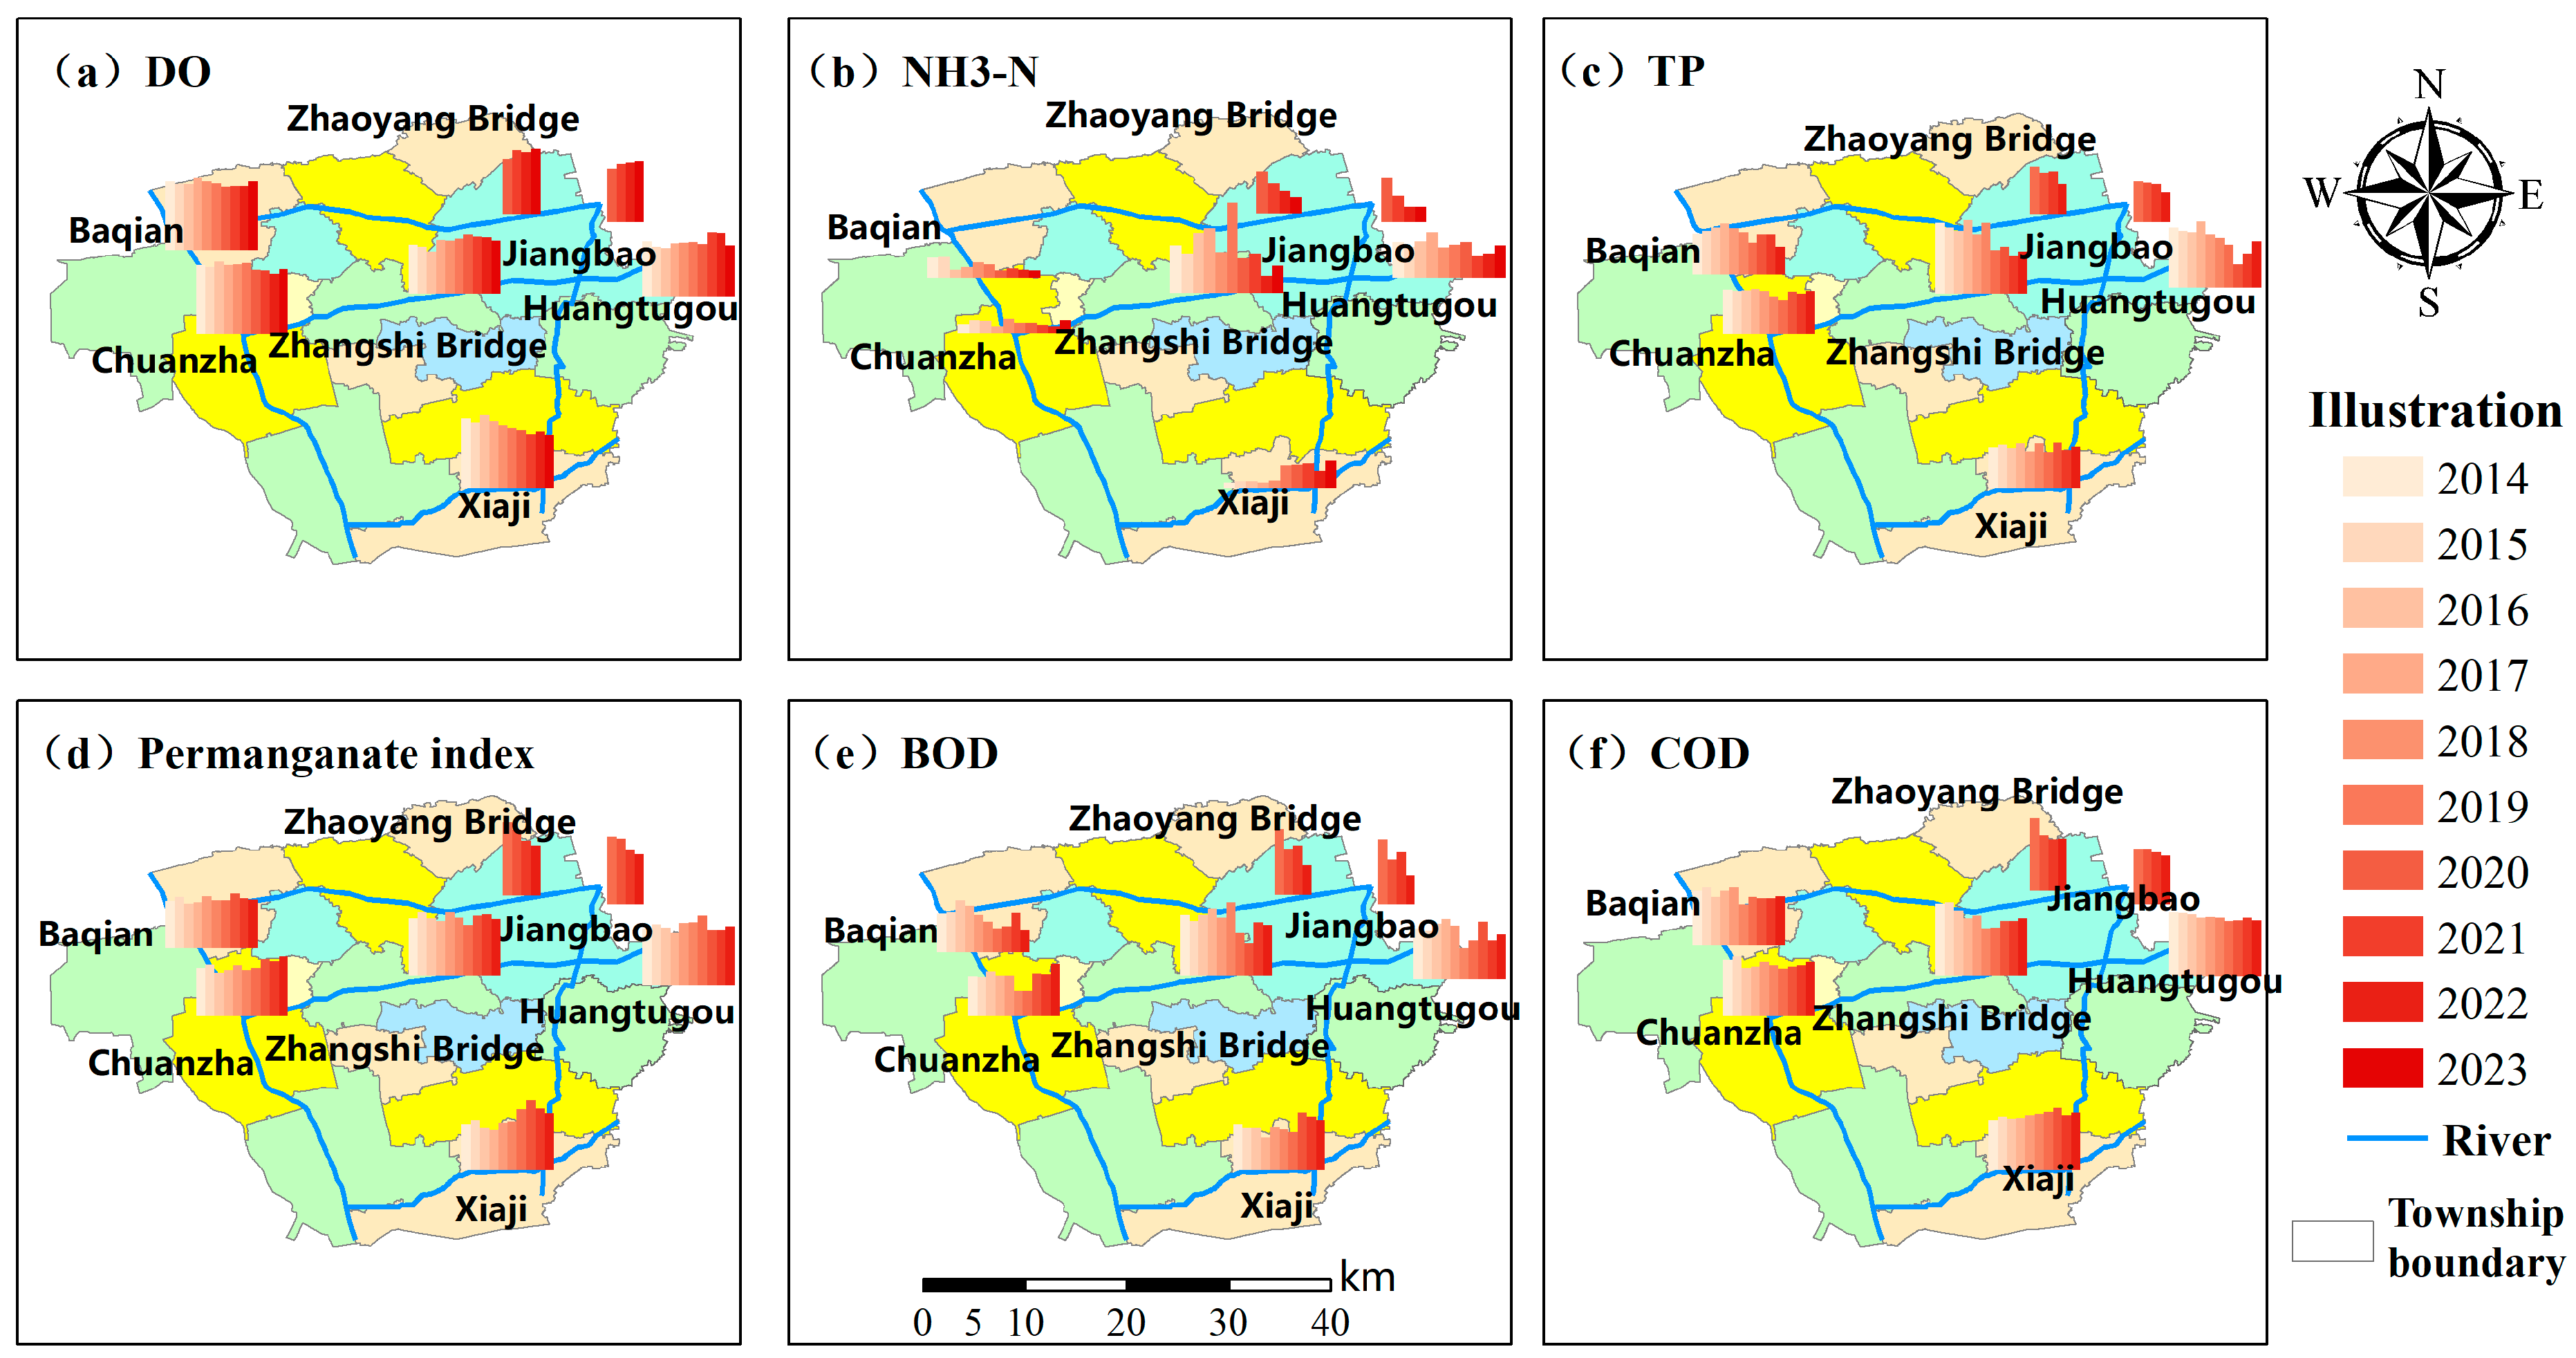
2.1. Investigation of the Study Area

The study site chosen for this research was Baoying County, located north of Yangzhou and downstream of the Huai River in China (33° N latitude, 119° E longitude), as shown in Figure 1, with a total area of 1467 km2. The region experiences an East Asian monsoon climate, characterised by an average annual rainfall of 951 mm. Baoying County is bisected by the Beijing–Hangzhou Grand Canal into the Yundong and Yunxi regions. The county features a dense river network, with 30 county-level and 377 township-level rivers, resulting in an average river density of 8.6 km/km2, indicative of abundant water resources. The total administrative area of the Yundong region is about 1190.18 km2, including 627.7 km2 of cultivated land, 1.56 km2 of garden area, 12.7 km2 of forest area, 0.01 km2 of grassland, 352.1 km2 of water area and water conservancy facilities land, and 281.6 km2 of other land.
This study focused on the Baoshe River, which is an important east–west drainage river in Baoying County, with a total length of 37.52 km and a drainage area of 284 km2. The Baoshe River irrigation area is the main irrigation area in Baoying County, covering an area of about 602.76 km2, with a designed irrigation area of 258.13 km2. The cultivated land area in the irrigation area is 253.4 km2, and the actual irrigation area is 252.8 km2. The irrigation area mainly grows rice, wheat, vegetables, and other crops, of which the grain planting area is about 415.06 km2. The Baoshe River Irrigation District currently has main canals such as the Daxi River, Songjing River, Baoshe River, Xiangyang River, Yingsha River, Dasanwang River, and Lufan River, with a total length of 170.4 km, and 58 branch canals with a total length of 245 km; the total length of the main and branch drainage ditches is 623.1 km. The irrigation district currently has 220 irrigation and drainage pump stations with an installed power of 8800 kw, a water-lifting capacity of 30 m3/s, and a drainage capacity of 125 m3/s; there are 210 other irrigation buildings and 270 drainage buildings. The current irrigation guarantee rate of the irrigation district is 75%, and 53.5 km2 of high-standard farmland has been built, and 6 km2 of efficient water-saving irrigation has been built. There are 832 water diversion outlets above the interface between the special pipes and group pipes, of which 702 water diversion outlets have water measurement facilities.
The water quality scope of this study is shown in Figure 2, with 7 monitoring sections, as shown in Table 1. The main water quality monitoring indicators of the section are dissolved oxygen (DO), ammonia nitrogen (NH3-N), total phosphorus (TP), permanganate index, biochemical oxygen demand (BOD), and chemical oxygen demand (COD). The evaluation was carried out with reference to the Class III water quality standard of the (GB3838-2002) [26]. If the water quality of each section reached or exceeded the Class III standard every year, it would mean that the water quality was good and the water body could be used for the secondary protection area of the centralised drinking water surface water source, the wintering grounds of fish and shrimp, the migration channel, the aquaculture area, etc. The specific water quality standard values of the (GB3838-2002) [26] are shown in Table S1.

2.2. Data Collection

To construct the InfoWorks ICM model requires a large amount of data, including climate conditions, population status, river distribution, vegetation, and water quality.
The development of the model necessitates extensive data, including topography, land use, rainfall, flow, and water quality metrics. The data utilised in this study were sourced from the Yangzhou Water Resources Bulletin (2013–2022), the Baoying County Statistical Yearbook (2022), and pertinent information provided by the Baoying County Water Affairs Bureau and the Baoying County Ecological Environment Bureau.

2.3. Methods

2.3.1. Construction of Hydraulic Model

The Infoworks ICM water quality model was constructed and calculated based on the hydrodynamic model. The Saint-Venant equations were used as the control equations for the unsteady flow in the river and pipe network models. The Saint-Venant equations consist of the continuity equation and the momentum equation. The specific formulas are shown in (1) and (2).
δ A δ t + δ Q δ x = 0
δ Q δ t + δ δ x Q 2 A + g A cos θ δ y δ X S 0 + Q Q K 2 = 0
where Q is the flow rate (m2/s); A is the cross-sectional area (m2); g is the acceleration of gravity (m/s2); θ is the horizontal angle; S0 is the slope of the riverbed; and K is the transport capacity, which can be calculated by the Manning formula.
The Horton model was used to calculate the infiltration of different types of underlying surfaces in the hydrological model. The specific formulas are shown in (3).
f = f c + f 0 f c e k t
where f0 is the initial infiltration rate (mm/h); fc is the final (limiting) infiltration rate (mm/h); k is the exponential term parameter (1/h); and t is the time (h).

2.3.2. Construction of Water Quality Model

The data reliability of the Infoworks ICM model directly affects the accuracy of its simulation results and faces challenges such as input data quality, model calibration and verification, uncertainty analysis, the consistency between real-time and historical data, and uncertainty in the pollutant input data. High-quality input data, adequate calibration and verification, multi-scenario sensitivity analysis, and the quantification and management of uncertainty are key to improving model reliability. By optimising data collection and processing methods, the model can provide more accurate decision support for water pollution management. The integration of pollution sources involves several steps: First, define and input data for point sources (such as urban and rural domestic sewage discharge sources) and non-point sources (such as agricultural runoff). Point source inputs include their location, emissions, and pollutant types, while non-point sources are defined through land use, rainfall data, and management practices. This study deals with surface and point source pollution, including urban and rural surface pollution. Urban surface pollution came from the deposition of pollutants on the surface during non-rainy days and the scouring effect of the early stages of rainfall; agricultural surface pollution mainly comes from the scouring effect of fertiliser applied to the farmland during rainfall. Point source pollution comes mainly from the direct discharge of domestic sewage in rural areas. Specific point source and surface source pollution calculation formulas are shown in Section S1 Supplementary Information.

2.3.3. Model Boundary

The model was constructed in the above way, and combined with a series of boundary data, it could be calculated and simulated. Due to the lack of historical measured rainfall data, this study analysed the effect of water quality improvement measures by changing the water quality of the river under the condition of a short-duration design rainstorm. Since water quality research usually targets non-extreme rainfall, this study selected the local 2 h short-duration design rainstorm with a return period of 0.25 years. The specific calculations are shown in Section S2 Supplementary Information.

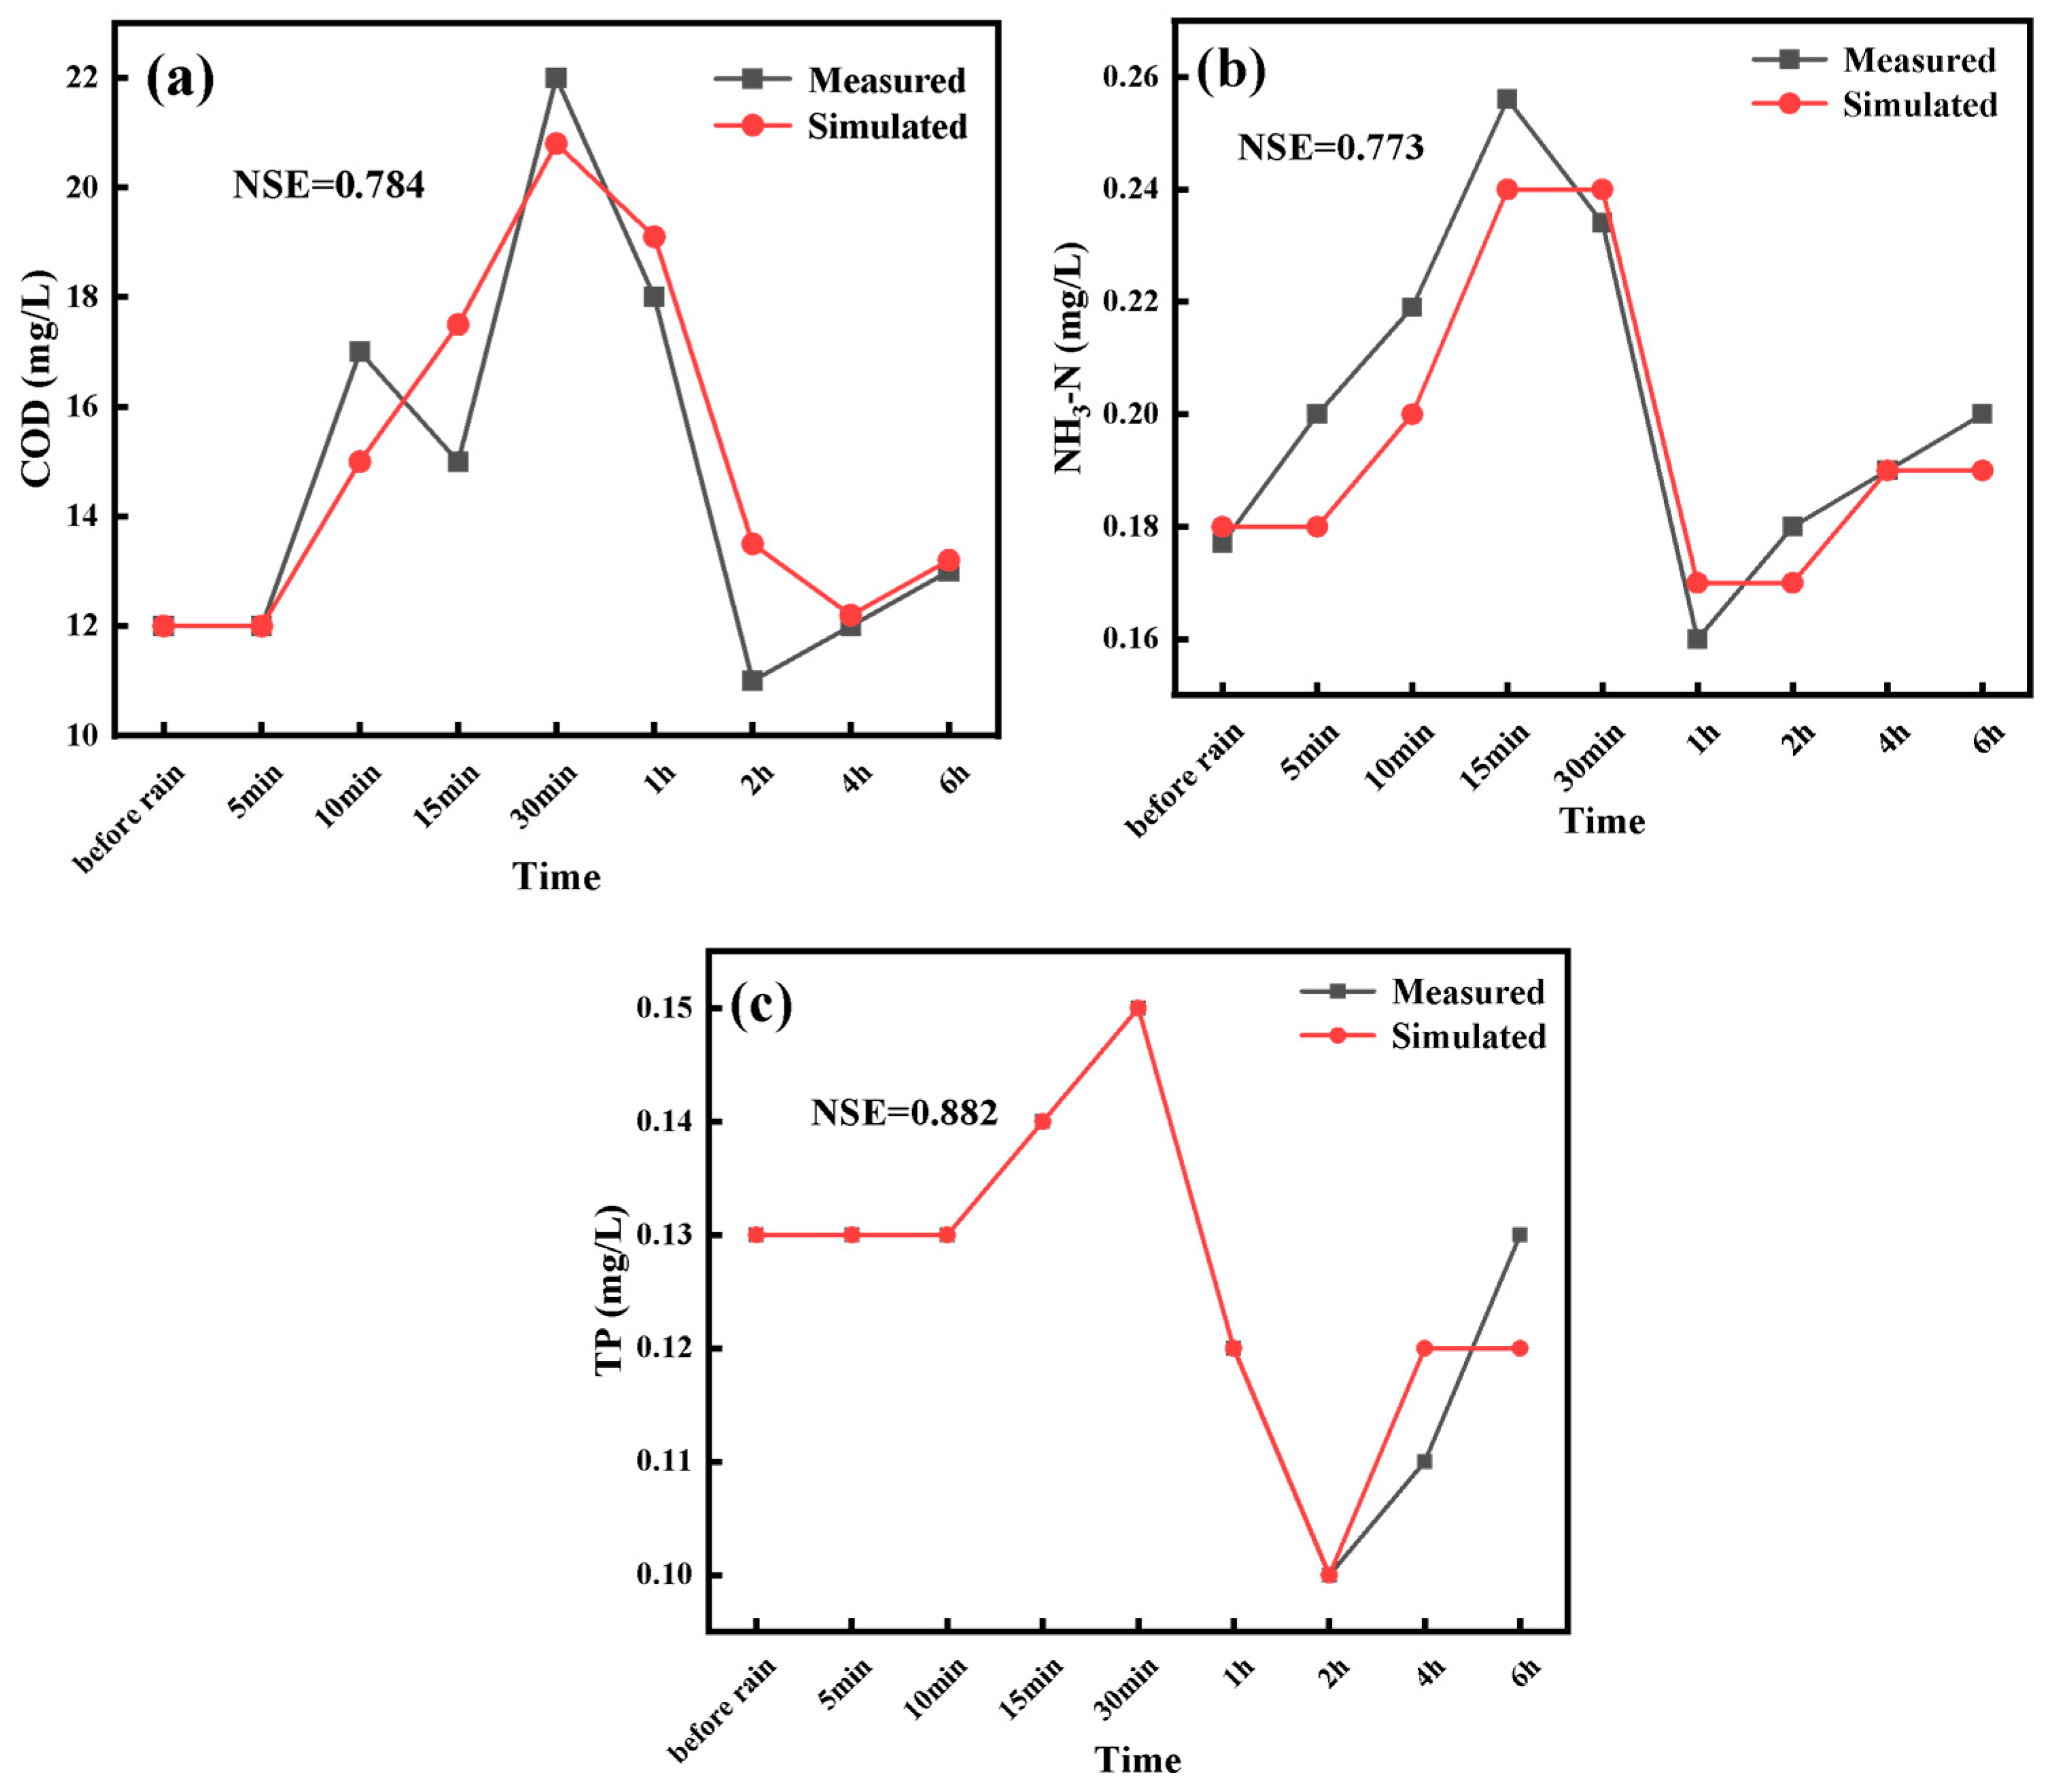
2.3.4. Model Calibration

According to the rainfall monitoring data of the Huangtugou section of the Baoshe River in the Baoying area in the Lixiahe area on 11 May 2024, the measured data are shown in the Table S2.
Efficiency coefficients were used to assess the difference between the predicted and measured data. The Nash–Sutcliffe Efficiency (NSE) coefficient is commonly used to verify the accuracy of hydrological model results [27]. It is calculated as follows:
N S E = 1 i = 1 n ( X i X i 0 ) 2 i = 1 n ( X i X j ) 2
where Xj represents the measured value, Xi0 represents the modelled value, and Xj represents the mean value of the monitored value.
The NSE coefficient ranges from negative infinity to 1. NSE values close to 1 indicate that the simulated values are in high agreement with the measured values, which proves that the simulation is desirable, and NSE coefficients in the range of 0.5 to 0.6 indicate that the model quality is completely reliable. If the NSE coefficient is between 0.65 and 0.86, the model quality is close to perfect [28].
After incorporating the aforementioned data into the model, the fitting results are shown in Figure 3. It can be seen from Figure 3 that the NSE coefficients of COD, NH3-H, and TP in the Baoshe River were 0.784, 0.773, and 0.882, respectively, which indicated that the water quality model fitted well and the model could be applied in this study.
The hydrological parameters and hydrodynamic parameters of this study all adopt the parameters recommended by the specifications or empirical parameters. The key parameters are shown in Section S3 Supplementary Information.

3. Results and Discussion

3.1. Current Status of Pollution Sources

In order to accurately reflect the water quality of each cross-section in the Lixia River area (Baoying County), the last ten years of water quality monitoring data from 2014 to 2023 by the Baoying County Bureau of Ecology and Environment were used for analysis. The main water quality monitoring indicators were DO, NH3-N, TP, permanganate index, BOD, and COD. The water quality was evaluated against the (GB3838-2002) [26] Class III water quality standards (Table S1), and if the water quality of each cross-section reached or was better than the Class III standards every year, it meant that its water quality was favourable.
As can be seen from Figure 4, except for the Zhangshi Bridge section of the Baoshe River, where the water quality of the water body was in water Class IV in 2014–2015, the water quality of all other sections was in water Class III, with an overall good water quality. In addition, all the water quality indicators in each section were analysed, and it was found that except for DO, the water quality indicators in each section were highly variable. Among them, the permanganate index and chemical oxygen demand at the Chuanzha and Baqian sections exhibited fluctuating upward trends from 2014 to 2020, with the concentrations decreasing after 2021; NH3-N, TP, and COD at the Huangtugou section showed fluctuating upward trends from 2014 to 2020; NH3-N at the Xiaji section showed fluctuating upward trends from 2014 to 2020, but the concentrations show an increasing trend after 2021; NH3-N, TP, and COD in the Huangtugou section exhibited a fluctuating decreasing trend in 2014–2020, but the concentrations showed an increasing trend after 2021; and NH3-N, TP, permanganate index, BOD, and COD in the Chaoyang Bridge and Jiangbao sections showed a more obvious decreasing trend in 2020–2023. The reason for the improvement in water quality after 2020 may have been that the outbreak of COVID-19 caused many factories to shut down or reduce production [9]. Due to restricted logistics and labour shortages, agricultural activities in Baoying County decreased, and the use of fertilisers and pesticides also fell, thereby reducing the water pollution caused by agricultural runoff.
Since the Zhangshi Bridge section of the Baoshe River was in water Class IV in 2014–2015, the two sections, Zhangshi Bridge (upstream of the Baoshe River) and Huangtugou (downstream of the Baoshe River), were analysed and studied as a priority. From Figure 5 and Figure 6, it can be seen that except for 2014 and 2015, Zhangshi Bridge was in Class IV water; in other years, the Zhangshi Bridge and Huangtugou section’s DO, NH3-N, TP, permanganate index, BOD, and COD could reach the III class. The water quality of the Baoshe River Basin was relatively good, but there were some fluctuations in water quality in different years. In the Zhangshi Bridge section, NH3-N, TP, and BOD showed a fluctuating increase in 2014–2019, and then decreased after 2020; the permanganate index and COD showed a fluctuating decrease in 2014–2023, of which DO was lowest in 2016, NH3-N and BOD were highest in 2019, TP was highest in 2017, and the permanganate index and COD were highest in 2015. The results showed that in terms of the water quality of the Zhangshi Bridge section from 2014 to 2023, although there was a certain improvement, it was not ideal, and there was still a certain fluctuation. Fluctuations in water quality occurred because heavy rains and floods washed pollutants into rivers, and droughts reduced flows and concentrated pollutants [20]. The Huangtugou section’s NH3-N, TP, permanganate index, BOD, and COD showed fluctuating and increasing change trends, of which the NH3-N, TP, and BOD were highest in 2017, the permanganate index was highest in 2020, and the COD was highest in 2014. The results showed that the water quality of the Huangtugou section was in Class III from 2014 to 2023, but there was no obvious improvement trend.
In terms of upstream and downstream water quality changes, the NH3-N, TP, permanganate index, BOD, and COD contents at the Huangtugou section were lower than those at the Zhangshi Bridge section upstream of the Baoshe River from 2014 to 2018, indicating that the water body of the Baoshe River had a certain self-purification ability from 2014 to 2018. However, in 2019 and later, the NH3-N, TP, permanganate index, BOD, and COD contents of the Huangtugou section in the downstream of the Baoshe River were higher than those of the Zhangshiqiao Bridge section in the upstream of the Baoshe River, which indicated that the pollution level of the water body increased and the self-purification ability of the water body became poorer, which resulted in the downstream pollution being worse than the upstream of the Baoshe River. The weakening of the river self-purification capacity was mainly due to the excessive pollution load from industry, agriculture, and domestic activities in Baoying County, which reduced the river’s ability to dilute and decompose pollutants. In addition, factors such as the overapplication of fertilisers, leading to ecological damage and eutrophication, further aggravated this decline [29]. In Baoying County, land use changes such as urban expansion and the conversion of wetlands and farmland to development have increased the amount of impervious surface, resulting in more pollutants entering water bodies through stormwater runoff. Agricultural practices, including the overuse of fertilisers and pesticides, inappropriate irrigation and drainage systems, and the expansion of livestock production, have increased concentrations of nitrogen, phosphorus, and other pollutants, leading to water eutrophication. Industrial activities, particularly wastewater discharge and illegal dumping from the chemical and manufacturing sectors, introduced heavy metals and organic pollutants into water bodies, further exacerbating water pollution. The combination of these factors has resulted in increased pollutant concentrations and deteriorating water quality.
The water quality at the Zhangshi Bridge and Huangtugou cross sections was analysed for the period January–December 2023, as shown in Figure 7a,b. The results showed that the DO, NH3-N, TP, permanganate index, BOD, and COD at Zhangshi Bridge section could reach the in Table S1 (GB3838-2002) [26], indicating that the water quality of the water body at the Zhangshi Bridge section in 2023 was good. It was worth noting that the DO concentration at the Zhangshi Bridge section was the lowest at 5.43 mg/L in July, and the NH3-N, TP, permanganate index, BOD, and COD concentrations were the highest at 0.41 mg/L, 0.11 mg/L, 5.4 mg/L, 2.8 mg/L, and 20 mg/L, respectively, which indicated that the water quality of the water body at the Zhangshi Bridge section was good in 2023. This indicated that the water quality of the Zhangshi Bridge section in July was worse than in other months. In addition, the water quality of the Huangtugou section in July reached the standard of Class IV water, which was also worse than other months, and the indicators that caused the unstable water quality of the Huangtugou section were NH3-N, permanganate index and COD, with concentrations of 1.36 mg/L, 7.2 mg/L, and 24 mg/L, respectively.

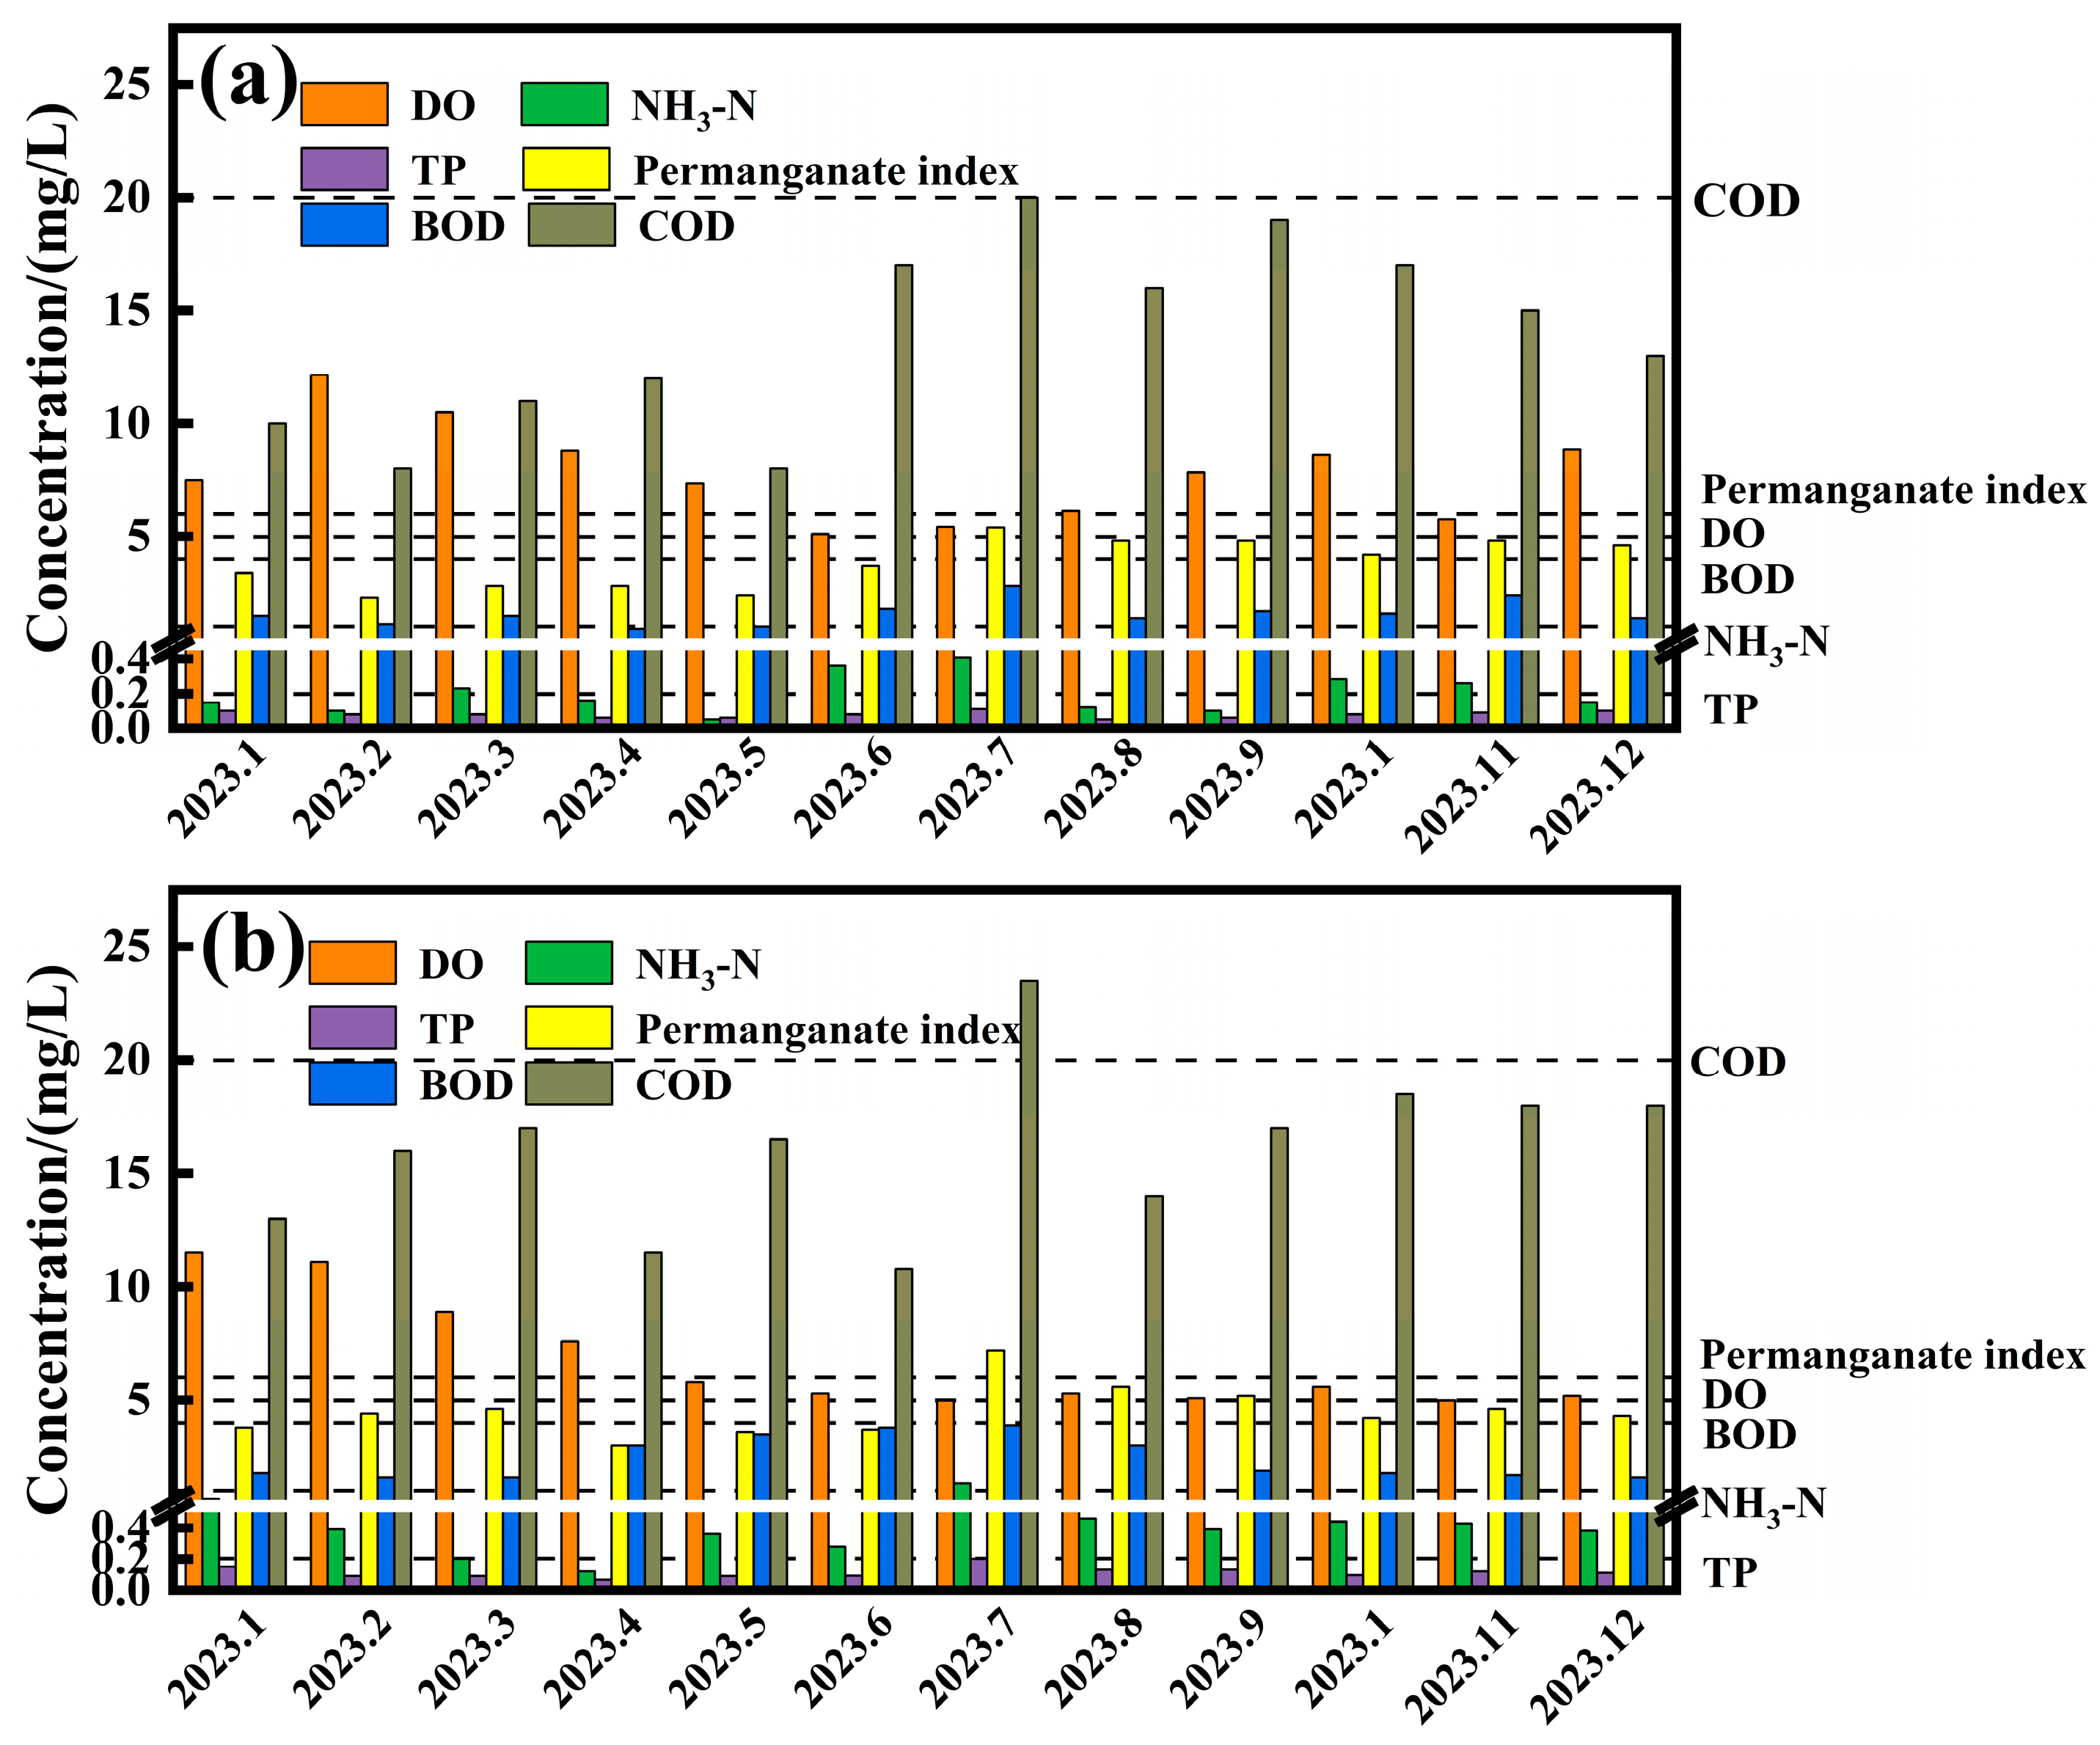
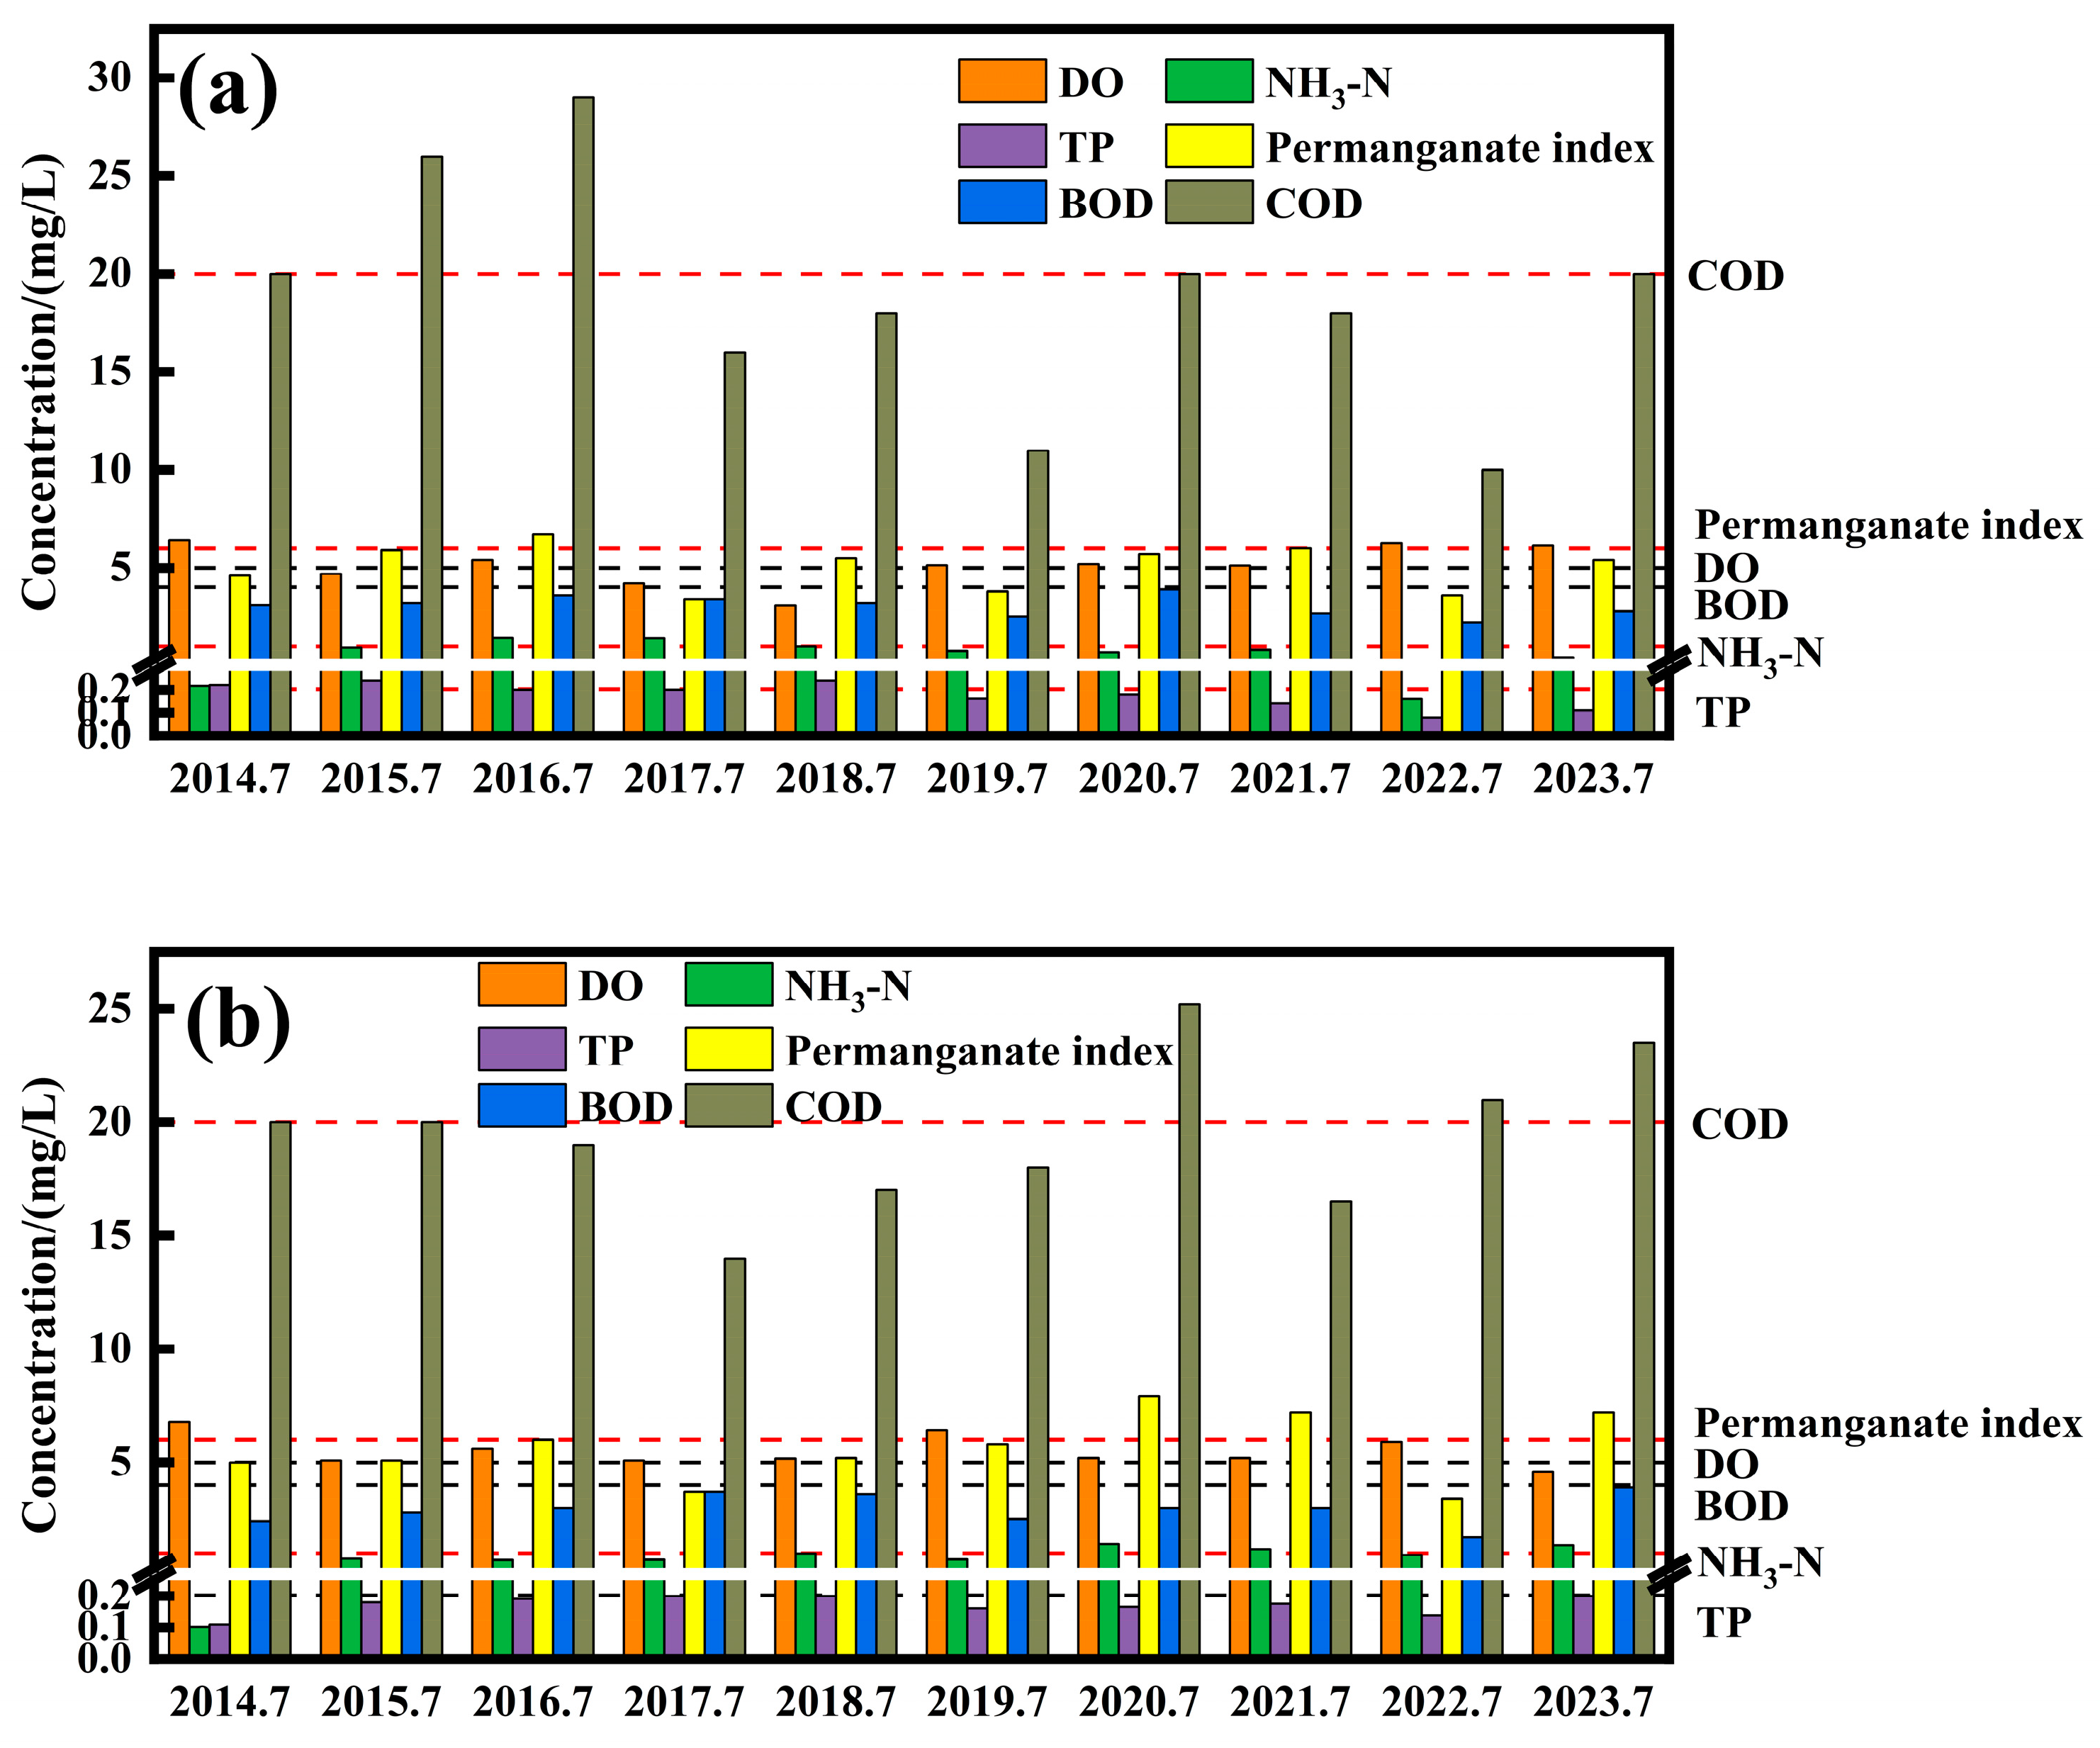
3.2. Analysis of Unstable Water Quality Compliance

In the Baoshe River Basin, the primary sources of industrial pollution were wastewater from the daily production activities of enterprises. Domestic pollution mainly arose from the wastewater generated by urban and rural residents, with key pollutants including COD, NH3-N, and TP [30]. Additionally, aquaculture wastewater, particularly from river crab farming, contributed to pollution in the basin. Agricultural wastewater was another significant source of pollution, primarily due to the extensive farmland, covering approximately 5.32 km2, and the lack of effective wastewater collection and treatment facilities at farmland outfalls. This resulted in high concentrations of TP and NH3-N in the drainage water from these agricultural areas. The pollution of the tributaries was mainly due to the interconnection between the tributaries of the Baoshe River; some pollutants discharged from the tributaries would eventually pollute the main river through the flow of water, resulting in the water quality of the Baoshe River failing to reach the standard; therefore, Table 2 examined the water quality of the tributary rivers of the Baoshe River, and only the water quality of the Wangzhi River and the Xidang River reached the standard of Class III, while the water quality of the rest of the tributaries failed to meet the standard of Class III. In summary, the sources of pollution affecting the quality of the water environment in the section area were aquaculture and rural domestic sources, and in order to fundamentally improve the quality of the water environment in the work area, effective measures must be taken to control aquaculture pollution and discharges from rural domestic sources in order to fundamentally eliminate the occurrence of water quality exceeding the standard.
As the water quality at the Zhangshi Bridge and Huangtugou sections was poor in July 2023, the water quality at these two sections was analysed for each July from 2014 to 2023, as shown in Figure 8. From Figure 8a, it can be seen that the main indicators of unstable water quality at the Zhangshi Bridge section were NH3-N, TP, permanganate index, and COD. The water quality non-compliance phenomenon mainly appeared in July 2014–2017, and the water quality of the water body was in Class IV. Specifically, in July 2014, the non-compliance indicator was TP with a concentration of 0.22 mg/L; in July 2015, the non-compliance indicators were TP and COD with concentrations of 0.24 mg/L and 26 mg/L, respectively; and in July 2016, the non-compliance indicators were NH3-N, permanganate index, and COD with concentrations of 1.43 mg/L, 6.7 mg/L and 29 mg/L, respectively. The non-compliance indicator for July 2017 was NH3-N with a concentration of 1.41 mg/L.
The water resources in the Yundong area of Baoying County are mainly used for agricultural irrigation, and July is the peak water use period for wheat harvesting and rice planting every year; wheat straw contains a large amount of organic matter, and after wheat harvesting, with the degradation of straw organic matter, nitrogen, phosphorus, etc., are released into the water, which causes water pollution. According to the literature, the direct soaking of wheat straw per 1 km2 leads to an increase of 82,500 kg of organic matter in the water [31]. In addition, the Yundong area of Baoying County has an artificial rice-sowing pattern, which involved sowing rice seeds into the field and introducing irrigation water into the sowing plots simultaneously with the use of pesticides and fertilisers, and discharging water containing nitrogen, phosphorus, and humus every other day, thus causing water pollution [32].
The main indicators of unstable water quality in the Huangtugou section were NH3-N, permanganate index, and COD. Before 2020, the water quality of the Huangtugou section was in the Class III water quality standard, and the phenomenon of non-compliance with the standard mainly occurred in 2020–2023, placing it in the Class IV standard [26]. The indicators of non-compliance were NH3-N, permanganate index, and COD in July 2020, with concentrations of 1.42 mg/L, 7.9 mg/L and 25.2 mg/L, respectively; NH3-N and permanganate index in July 2021, with concentrations of 1.18 mg/L and 7.2 mg/L, respectively; COD in July 2022, with concentration of 21 mg/L; and NH3-N, permanganate index, and COD in July 2023, with concentrations of 1.36 mg/L, 7.2 mg/L, and 24 mg/L, respectively. As for the indicators, all of them, except DO, showed a certain upward trend in 2014–2019, especially after 2020, mainly due to the expansion of the agricultural area and the increase in fertiliser application.

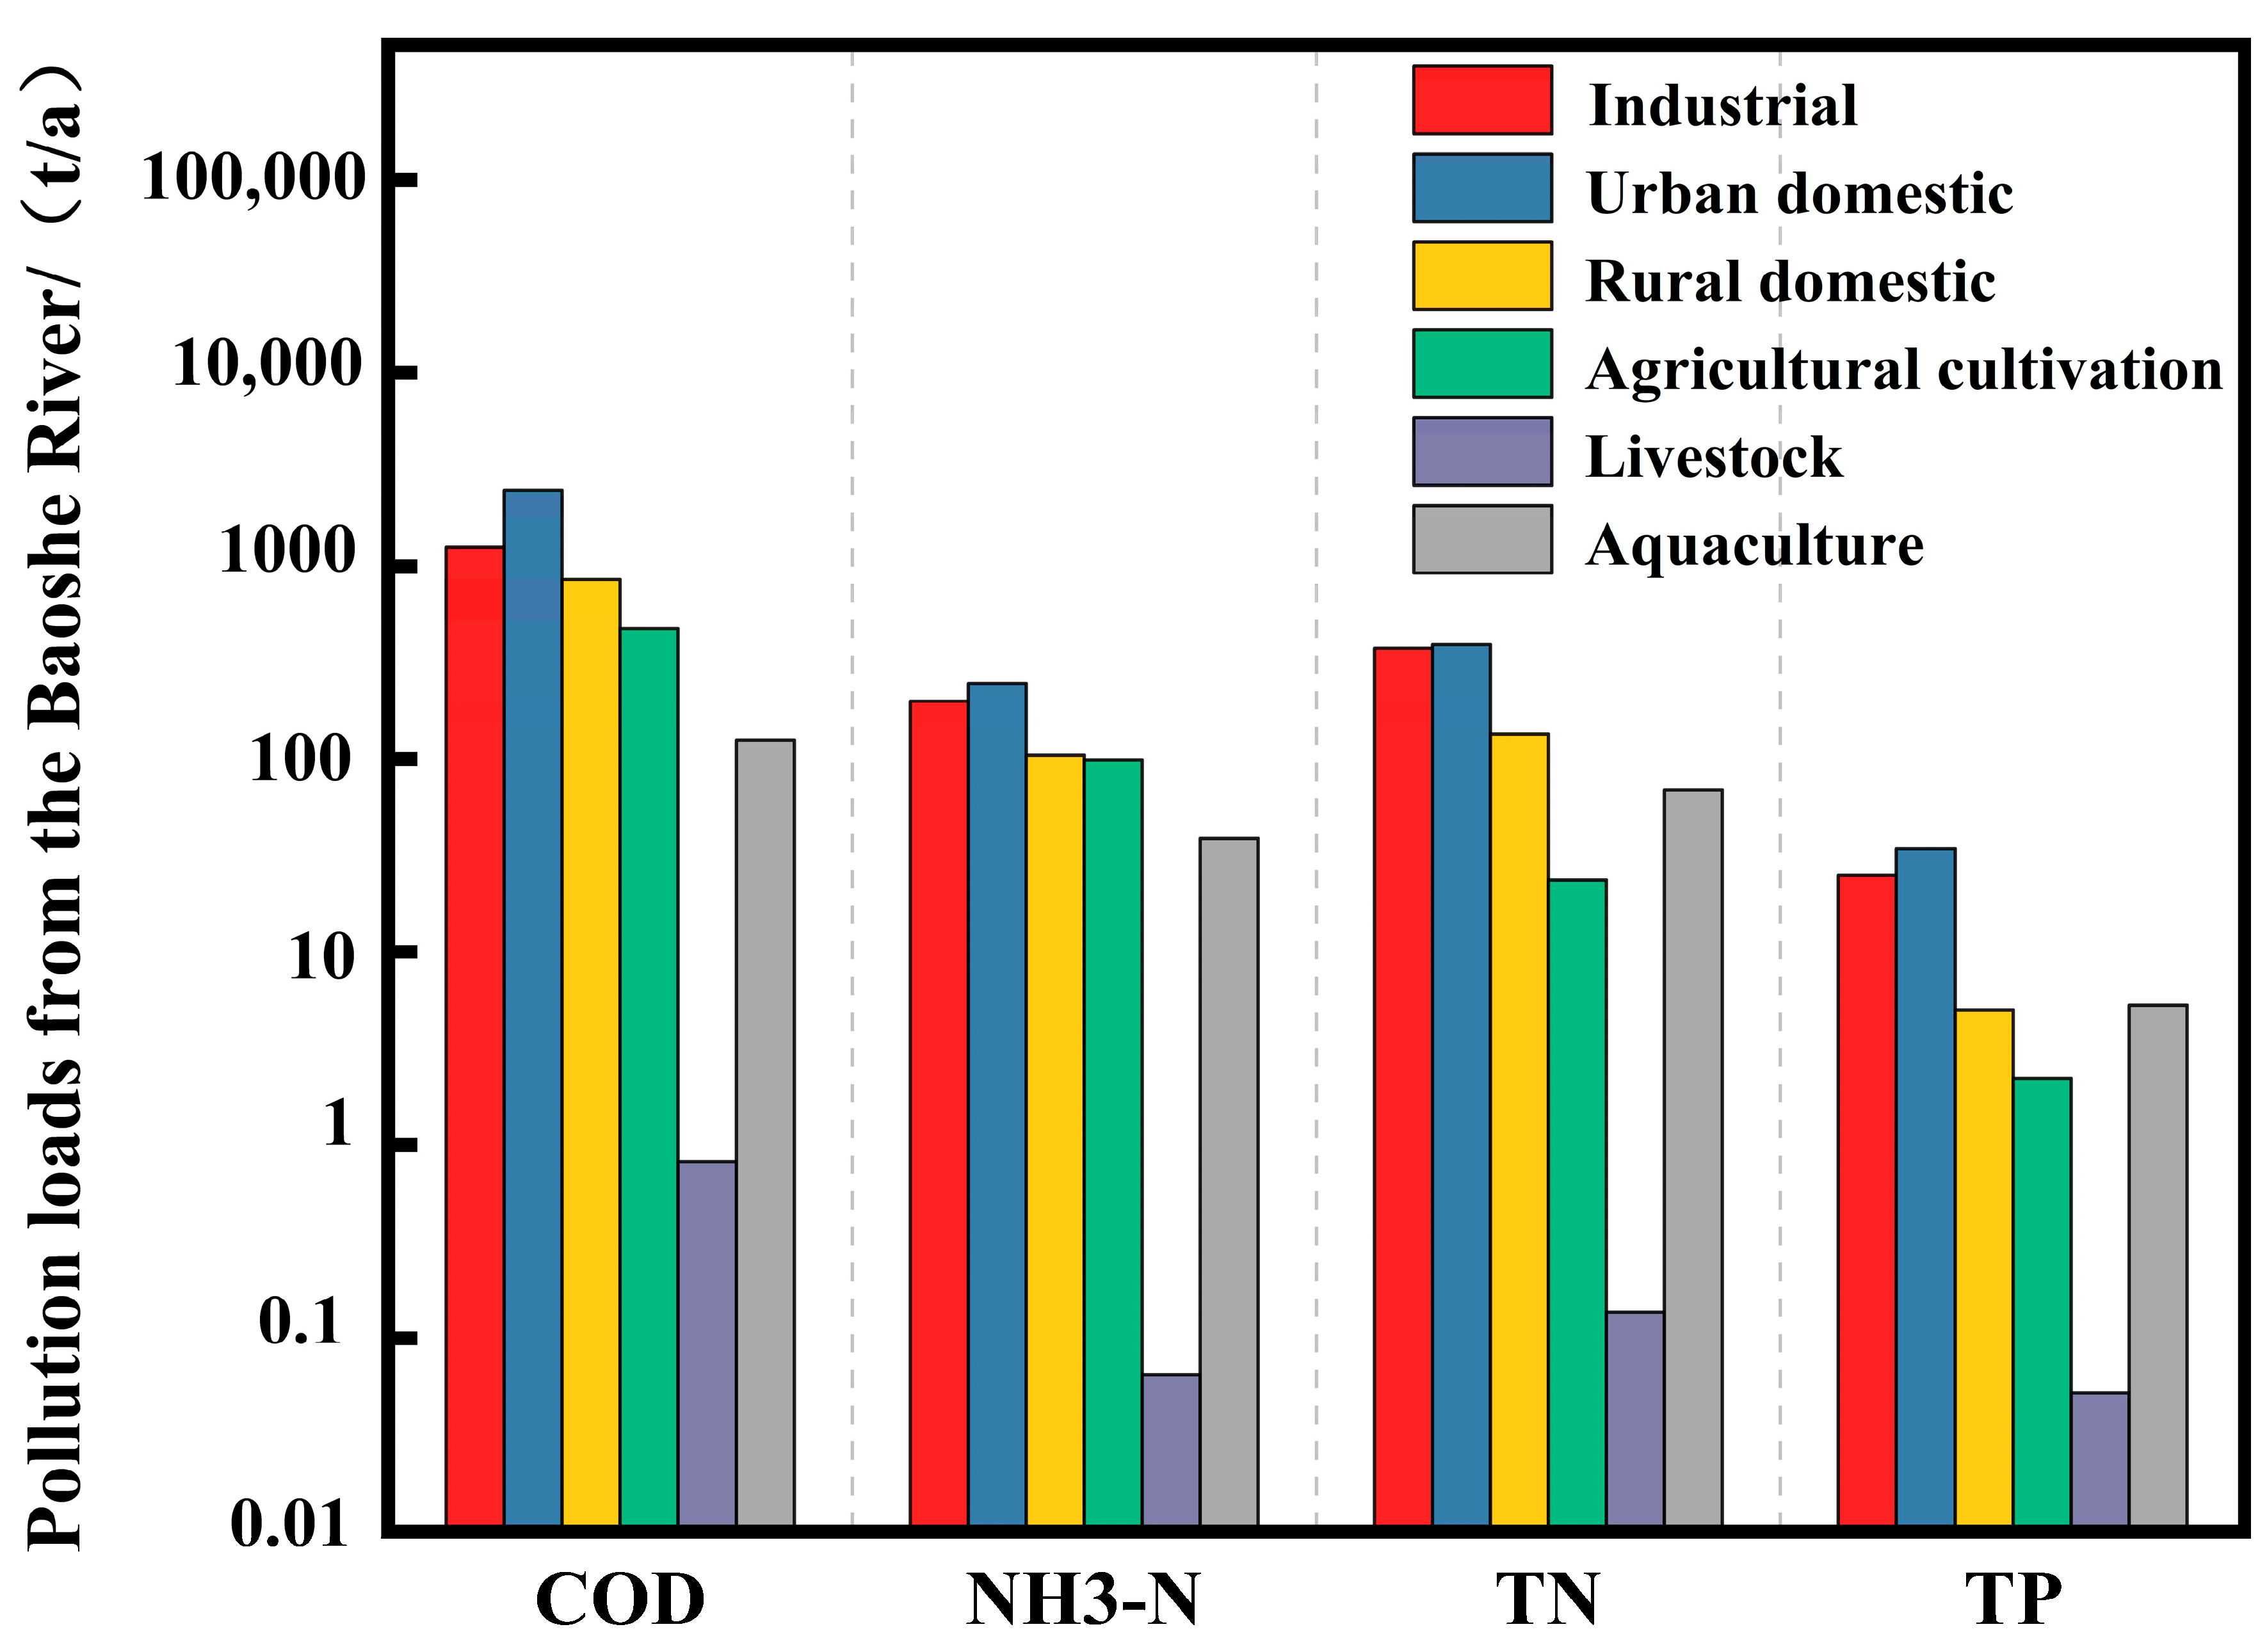
3.3. Analysis of Pollution Source Load

Pollution source loads entering the Baoshe River Basin by different routes were analysed as shown in Figure 9. The share of domestic pollution in the river load of the Baoshe River was the largest, reaching 55.74%, of which the contribution of urban domestic pollution load to the total river load was 42.69%, and the contribution of rural domestic pollution load to the total river load was 13.05%. The second was industrial pollution, accounting for 31.39%; there are four industrial parks within the Baoshe River: the Automobile Parts Industrial Park (with areas in the north and south), the Food Industry Concentration Zone, and the Sheyang Lake Town Industrial Park. A total of more than 170 industrial enterprises had settled in these parks. Additionally, agricultural cultivation pollution accounted for 7.26%. Although livestock and poultry farming and aquaculture contributed relatively less pollution compared to other sources, they still exerted a certain environmental pressure on the nearby waters. Urban domestic pollution contributes greatly to the overall pollution load, primarily due to a high population density, significant pressure on drainage systems, insufficient sewage treatment capacity, widespread pollution from everyday activities, poor waste management, and surface runoff carrying large amounts of pollutants into water bodies. As can be seen from the following figure, industrial pollution, urban and rural living pollution, and livestock and poultry breeding pollution all contribute to COD and TN; agricultural cultivation pollution contributes to COD and NH3-N, with annual discharges of 472.05 t and 99.13 t, respectively; and aquaculture pollution contributes to COD, TN, and NH3-N, with annual discharges of 125.80 t, 69.10 t, and 38.65 t, respectively. Nitrogen and phosphorus loss in the process of farmland cultivation also made a certain contribution to the pollution load of the river, which was related to the regional cultivation mode and the amount of fertiliser used; the cultivation of Baoying County is mainly based on rice, and the lost nitrogen and phosphorus very easily entered into the nearby water bodies through the flow of water; furthermore, the irrational habit of applying fertiliser was neglected in respect of the state of soil fertility, the nutrient demand of the crops, and the time and method of fertiliser application, resulting in the loss of nitrogen, phosphorus, and other pollutants. In addition, irrational fertilisation habits, the neglect of soil fertility status, crop nutrient requirements, fertiliser application times and methods, etc., resulted in excess nitrogen and phosphorus, further increasing the loss of nitrogen and phosphorus. Although aquaculture pollution accounts for a small proportion of the load of pollution into the lake within the working range of the Baoshe River, only about 10% of the nitrogen and 7% of the phosphorus in the aquaculture water were used by organisms. Long-term baiting will cause a large amount of nitrogen and phosphorus to be deposited at the bottom of the river, and this can be released into the water body when appropriate, becoming the main endogenous factor of eutrophication in the water body.

3.4. Results

As there was a stable external inflow in the study area during non-rainy days and the water quality was relatively good, the pollution in non-rainfall conditions came mainly from the direct discharge of domestic sewage in rural areas. However, in rainfall conditions, in addition to the direct discharge of domestic sewage, there was also surface source pollution input in Baoying County, which caused the water quality in the river to be significantly worse than that on non-rainfall days. Therefore, the period of severe pollution was concentrated in the rainy season after the previous multi-day drought, especially in the early stage of rainfall, when the pollutants accumulated on the surface during the non-rainfall conditions were washed into the surface runoff and then injected into the river. At the same time, as the surface source pollution load per unit area in the city was higher than in the rural area, the pollution load of the Baoshe River was also higher. Figure 10a,b is a comparison of pollutant fluxes in non-rainfall and rainfall conditions in two sections (Huangtugou and Xiaji) in Baoying County (represented by COD and NH3-N). The water quality in the river was basically stable in non-rainfall conditions. In rainfall conditions, with the entry of pollutants washed from the surface, the mass of pollutants passing through the river per unit time also increased. The total mass of COD passing through the Huangtugou section in 6 h in non-rainfall conditions was 5062 kg, while the mass passing through in 6 h in rainfall conditions was 7725 kg. The total mass of COD passing through the Xiaji section in 6 h in non-rainfall conditions was 1100 kg, while the mass passing through in 6 h in rainfall conditions was 2955 kg.
In addition, the results of the calculations also showed that the Baoshe River, due to its pathway through urban areas, had more surface source pollution loads entering it under rainfall conditions, and therefore the difference in COD mass flow loads between rainy and non-rainfall days was greater at the Huangtugou cross section compared to the Xiaji cross section.

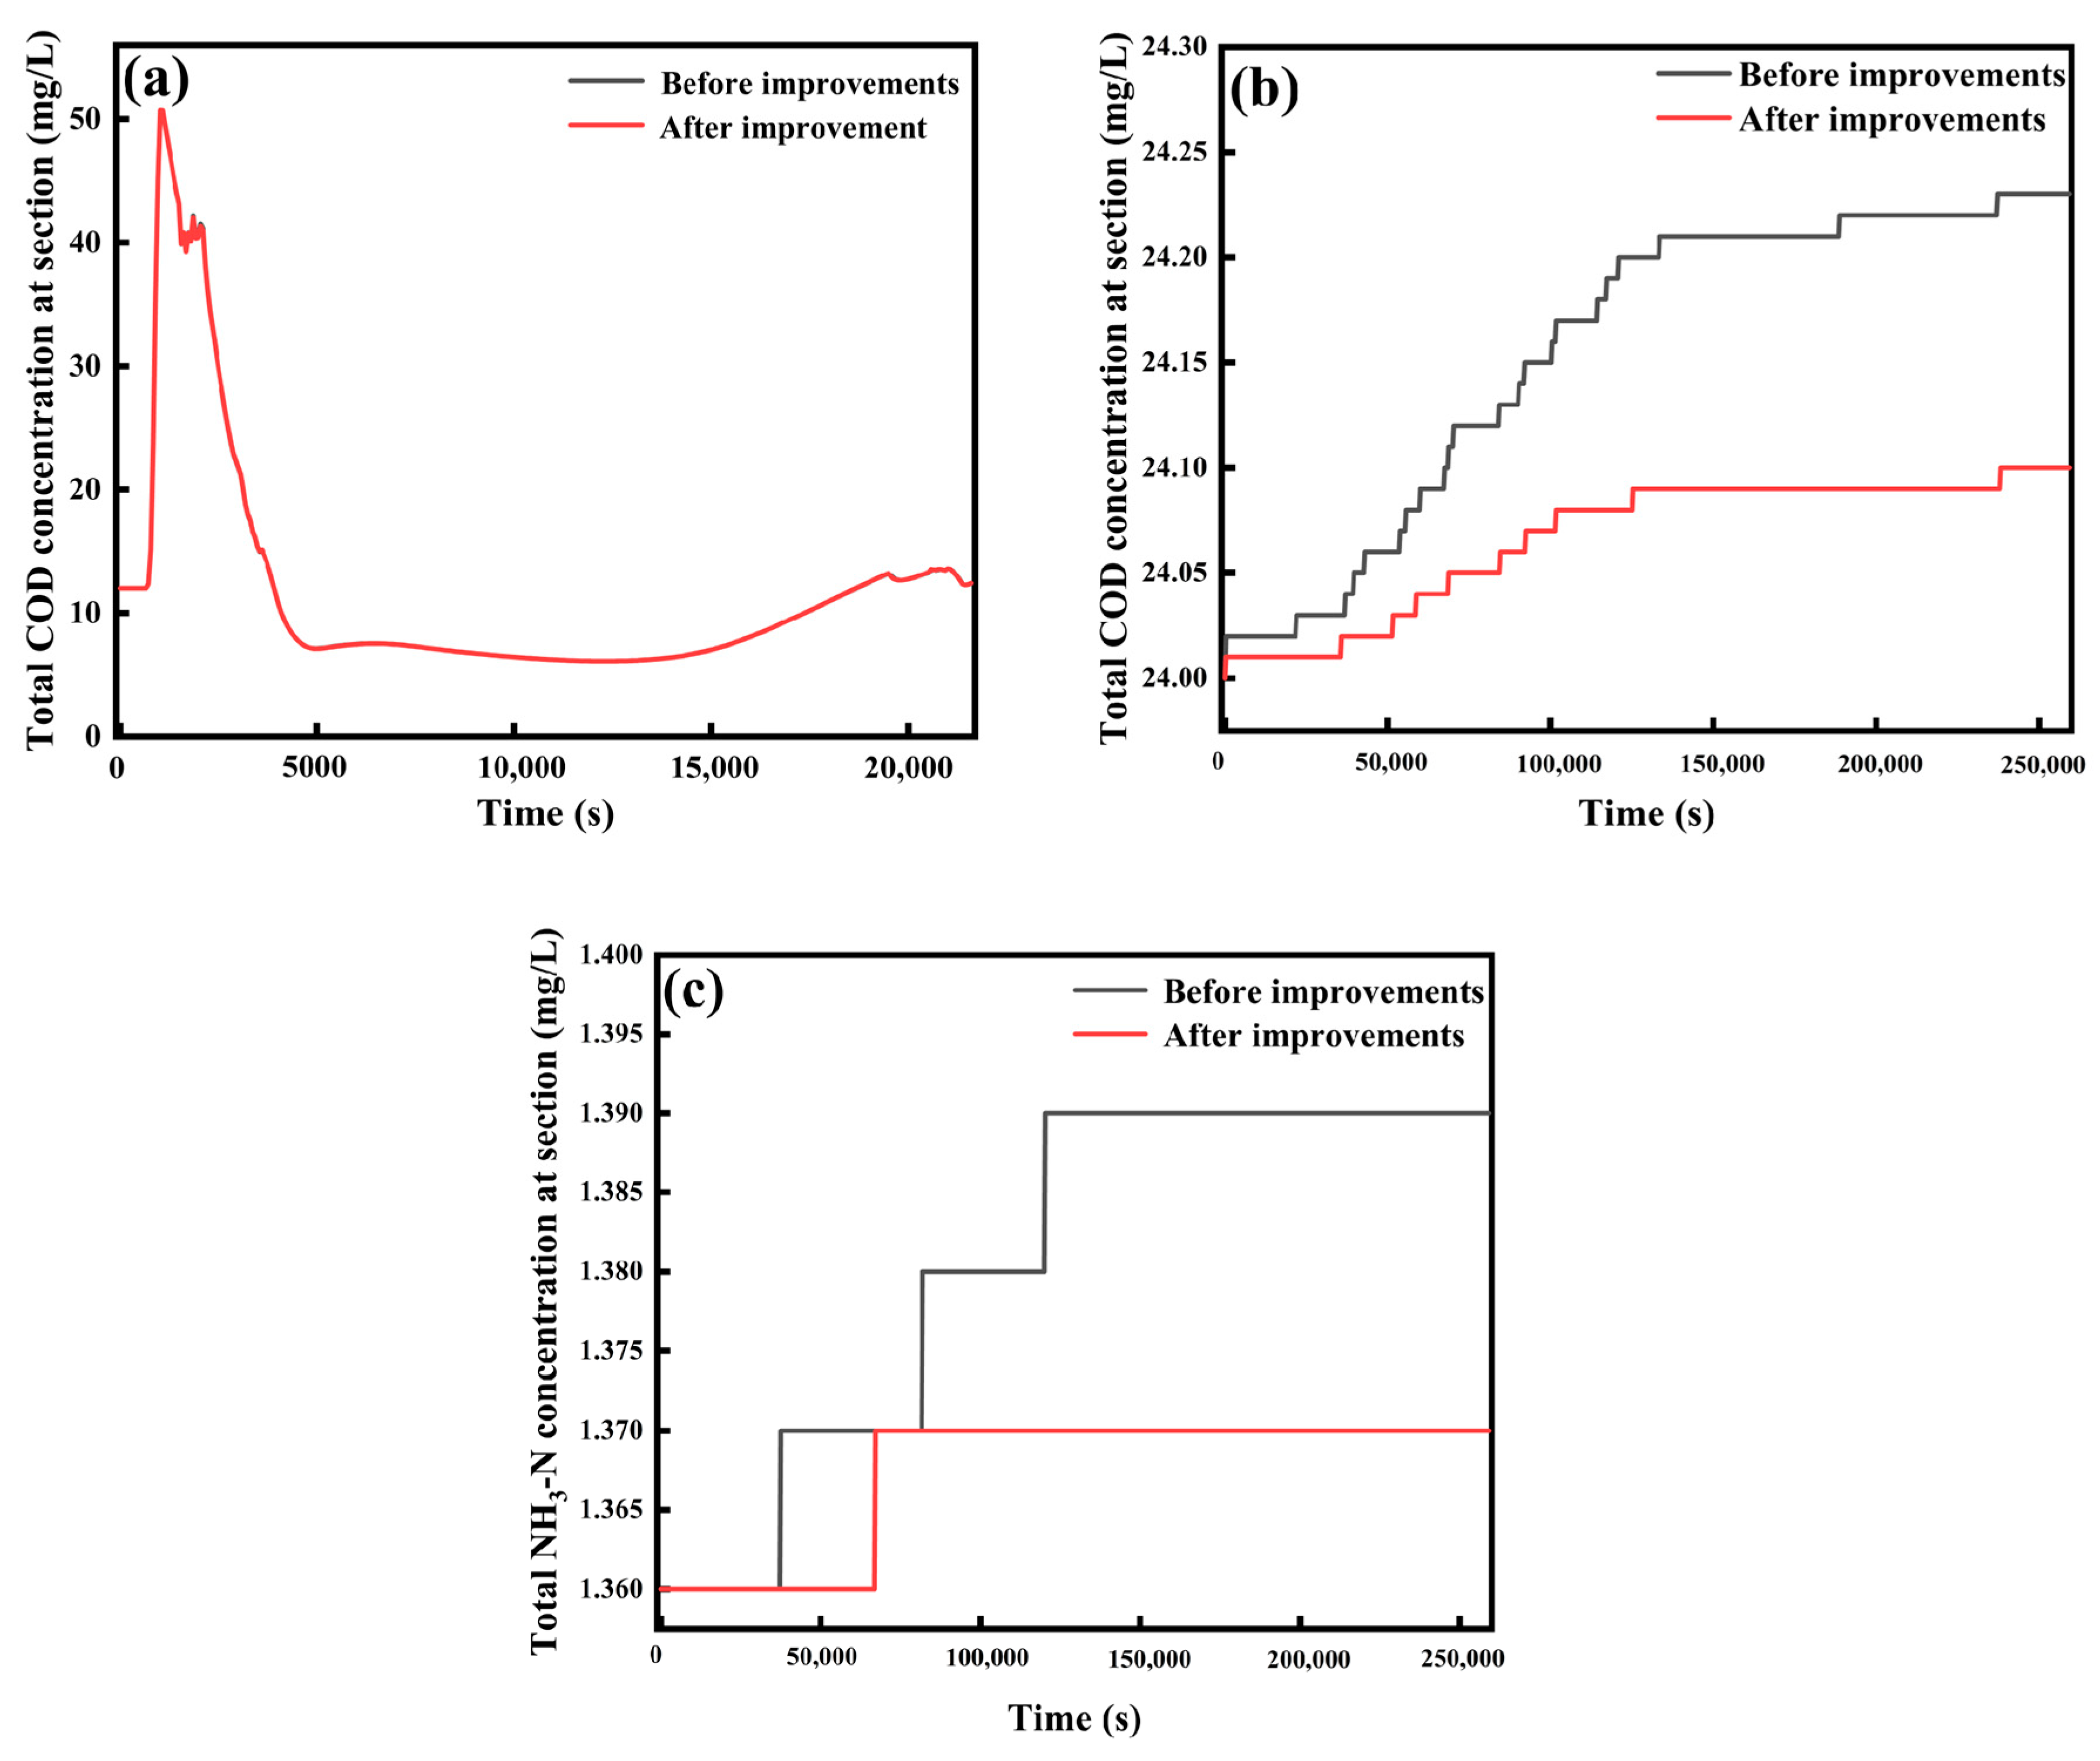
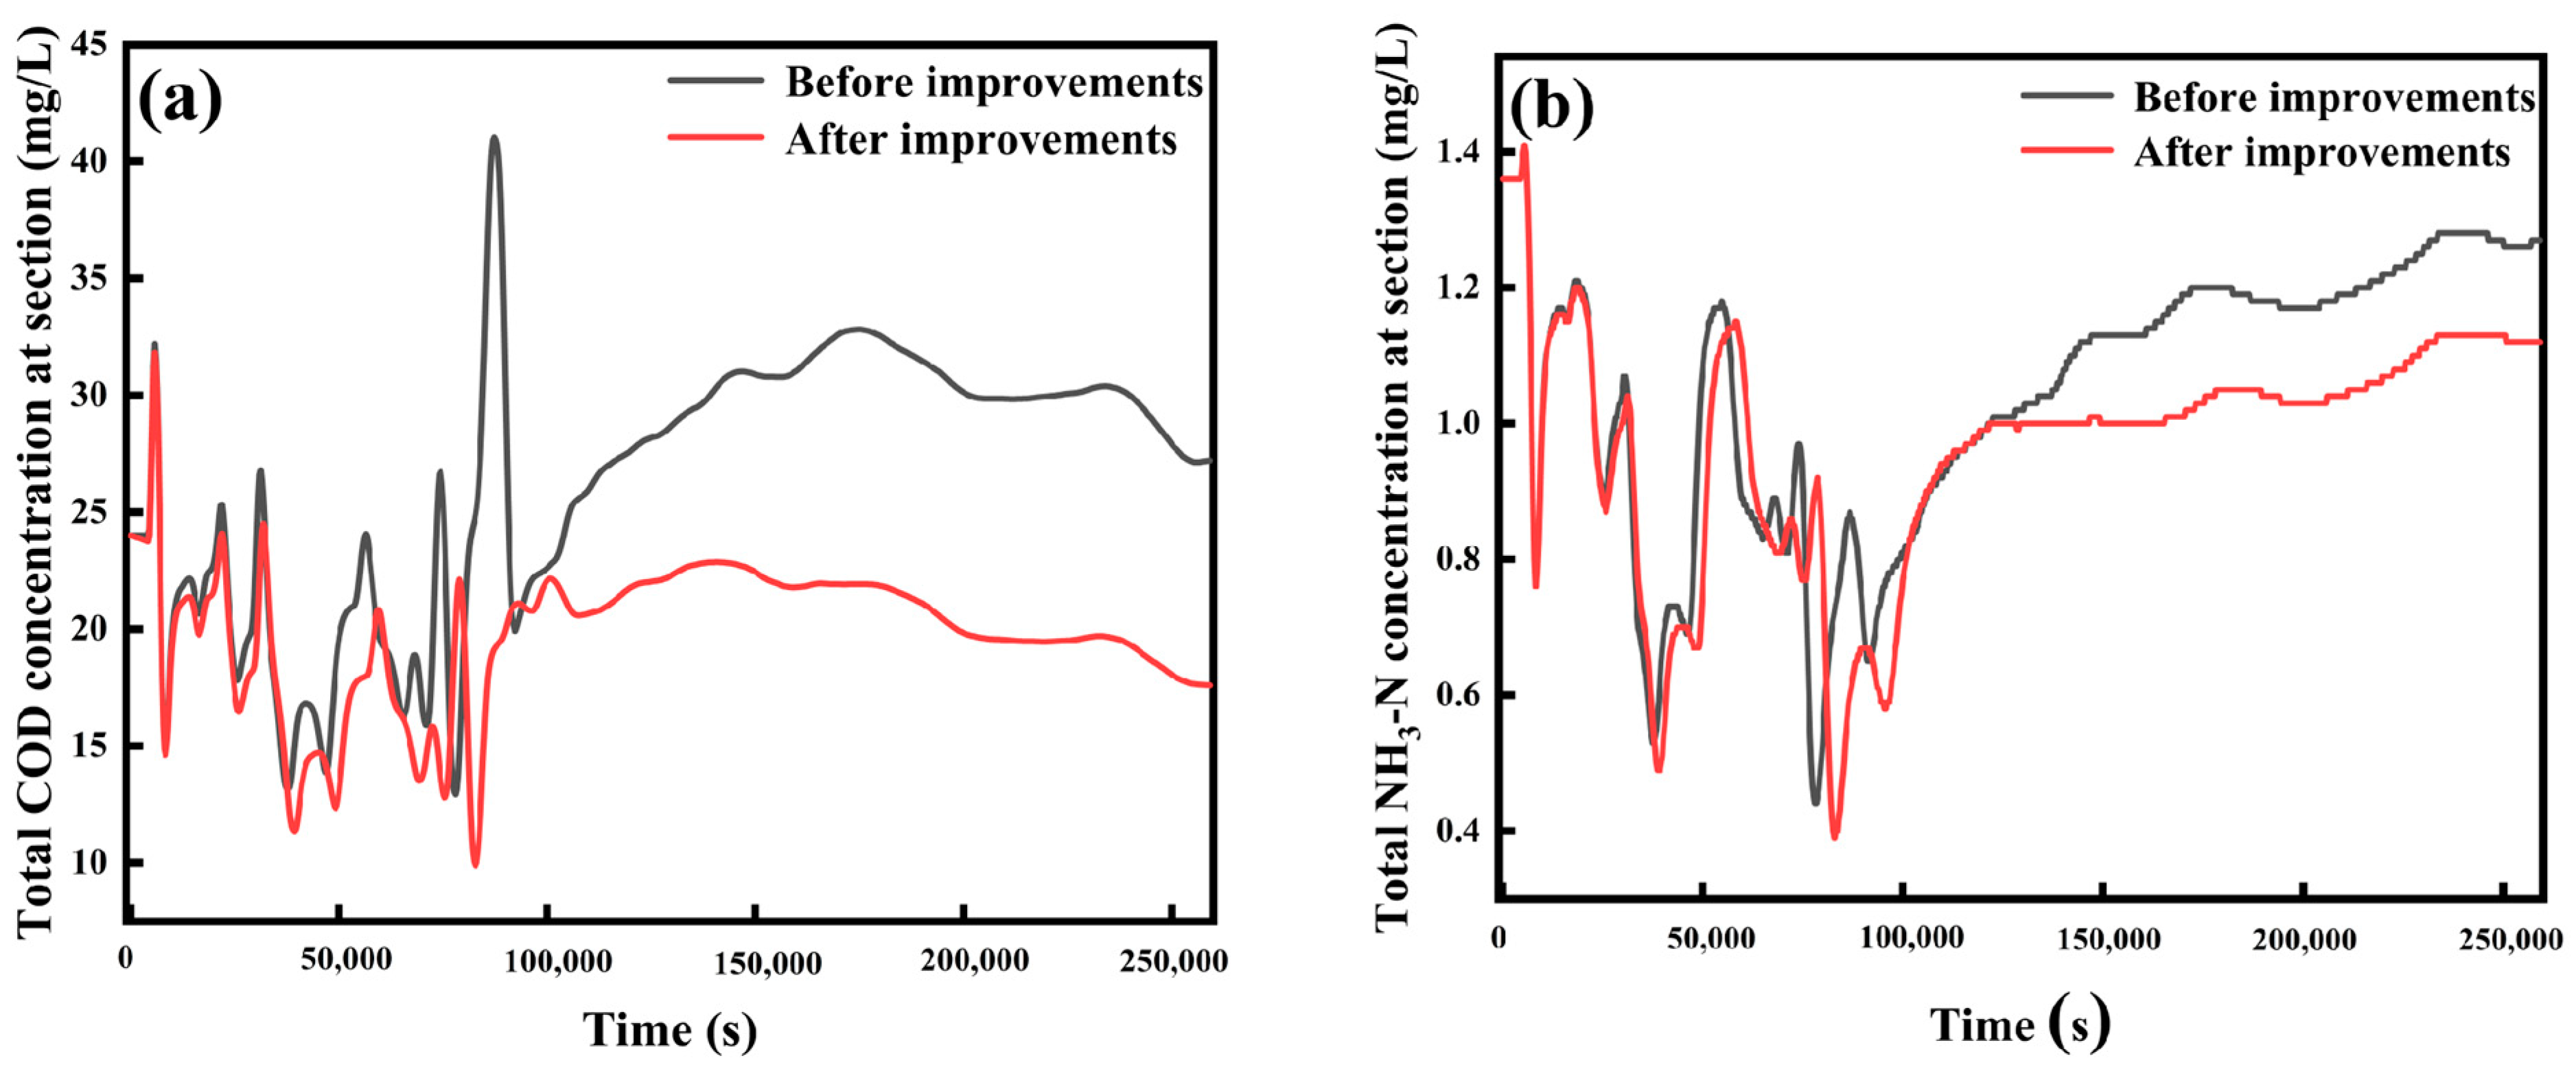
3.5. Improvement Measures

According to the water quality improvement technology of the plain river network, combined with the water quality pollution in the Yundong area of Baoying County, the water quality of the Baoshe River Basin was designed as a programme of measures, mainly from economic and social development, water resource use efficiency, water quality improvement, and ecological environmental protection considerations, targeted at the following four kinds of water quality improvement measures.

3.5.1. Low-Impact Development (LID)

Low-impact development (LID) has been considered a promising strategy to compensate for the hydrological and water quality impacts of urbanisation by simulating pre-development site hydrology through site design techniques [33]. LID, as an effective and environmentally friendly urban runoff management practice, has been capable of significantly reducing urban runoff pollution loads [34]. This strategy was first introduced by the U.S. Environmental Protection Agency in the 1990s and has been widely used in many cities [35]. Green infrastructures, such as bioretention cells, green roofs, and permeable pavements, are used for LID purposes [36]. However, the design and implementation of these green infrastructures need to be optimised for better performance [37]. In InfoWorks ICM, LID facilities were attached to the model as discrete elements and their performance modelled through a cell-based process. The model generalised each LID facility into a space consisting of multiple vertical layers, including a surface layer, a pavement layer, a soil layer, a storage layer, a culvert, and a drainage mat. The simulation is then achieved by estimating water quantity and quality in the different layers [38]. However, extreme weather events can severely impact LID facilities. Heavy rainfall can exceed their drainage capacity, causing flooding or overflows. Erosion and sediment accumulation can reduce their efficiency and require additional maintenance. Extreme temperatures can damage materials and affect the health of plants in facilities such as rain gardens and vegetated swales.
The implementation of LID in urban areas, mainly bioretention basins, rain gardens, and grassed swales, was set up as follows.
  • Ten per cent of green space was converted into bioretention basins, and 50 per cent of surface runoff was directed from impervious surfaces into bioretention basins for runoff and pollution control.
  • Ten per cent of green space was converted into rain gardens, and 30 per cent of surface runoff was directed from impervious surfaces into rain gardens.
  • Twenty per cent of green space was converted into grassed swales to act in the diversion and transfer of surface runoff.
  • The remaining 20% of impervious surface runoff was not controlled by sponge facilities and was discharged directly into the stormwater network.
The simulation results were obtained by importing the LID-related model parameters into the Infoworks ICM model. As shown in Figure 11, after adding LID-related measures to the Baoshe River watershed, the COD and NH3-N concentrations in the control section were significantly reduced under rainfall conditions, and the fluctuation of COD levels was also markedly diminished. An important function of LID is to intercept and treat organic pollutants in surface runoff through various green infrastructures, such as rain gardens, vegetated buffer strips, and green roofs [39]. Specifically, rain gardens intercept and degrade pollutants in stormwater runoff through physical filtration by plants and soil, while vegetated buffer strips, often rich in microbial communities, utilise organic matter as an energy source, converting it into harmless substances during metabolic processes [40]. Additionally, LID facilities create an environment conducive to microbial survival and reproduction by mimicking the functions of natural wetlands [41]. Wetland ecosystems typically possess strong organic matter degradation capabilities, so LID facilities excel at degrading organic pollutants in stormwater runoff, effectively reducing COD in the water body.
For NH3-N pollution in the water body, plants in the LID facility need to take up NH3-N as a nutrient during their growth process. As stormwater runoff passes through rain gardens, green roofs, or vegetated buffer strips, ammonia nitrogen is absorbed by plant root systems, thereby reducing the total amount of NH3-N entering the water body. Plants absorb nitrogen through photosynthesis, fixing it within their tissues, which prevents the further diffusion of nitrogen [42]. In addition to plant uptake, microorganisms in the LID system also play an essential role in reducing ammonia nitrogen. In LID facilities such as rainwater retention ponds and artificial wetlands, microorganisms convert NH3-N into nitrate (NO3) and nitrogen (N2) through nitrification and denitrification, with the latter being released into the atmosphere as a gas [43]. This process effectively reduces the amount of NH3-N in the water body and lowers the risk of eutrophication.

3.5.2. Reducing Fertiliser Application

The extensive use of chemical fertilisers in agricultural production has led to significant amounts of nutrients, such as nitrogen and phosphorus, entering water bodies, resulting in eutrophication. This has not only degraded the water quality but also contributed to the non-point source pollution of surface waters. However, given that the main industry in the Baoshe River Basin is traditional farming, it was essential to ensure normal crop growth while minimising the socio-economic impacts. Therefore, in this study, fertiliser application in the Baoshe River Basin was appropriately reduced by 30% to comparatively analyse the improvement in water quality under rainfall conditions following this reduction. The results, as shown in Figure 12, indicated that after a 30% reduction in fertiliser application, the COD concentration in the Baoshe River Basin did not improve significantly under rainfed conditions, whereas the NH3-N concentration was effectively controlled.
This was due to the fact that fertilisers are mainly composed of inorganic salts such as nitrates and phosphates, which do not directly affect COD values [44]. The sources of COD in the control section of the Baoshe River Basin were diverse and not limited to fertiliser application. Most of the COD originated from the discharge of sewage and industrial wastewater, with only a small portion resulting from agricultural fertilisers. These fertilisers were discharged into the river as agricultural runoff during rainfall [45], increasing the COD content in the water bodies of the Baoshe River Basin. If other organic pollutants were present in the agricultural runoff, even a reduction in fertiliser application would not significantly decrease the COD content in the water [46]. Therefore, simply reducing fertiliser application typically only reduced nutrient discharges such as nitrogen and phosphorus, preventing nutrient enrichment in the water body, but it was not effective in reducing COD levels. To reduce nutrient runoff in agriculture and aquaculture, several improvements can be made. In agriculture, implementing practices such as precision farming, which optimises fertiliser application based on crop needs, can minimise excess nutrient use. Additionally, adopting cover crops, buffer strips, and reduced tillage can enhance soil health and prevent erosion. In aquaculture, improving feed efficiency and incorporating waste treatment systems can reduce nutrient discharge into water bodies. Both sectors can benefit from integrated nutrient management strategies and regular monitoring to ensure sustainable practices and minimise environmental impacts. Therefore, to improve the overall water quality of the Baoshe River Basin, a combination of other improvement measures was usually required. In Baoying County, the government’s policies, publicity, and technical support for rational fertilisation may not be sufficient, and farmers lack the opportunities and resources to access scientific fertilisation techniques. Additionally, subsidy policies sometimes result in irrational fertiliser use and encourage overapplication. This study will assist the Baoying County government in developing programmes and policies for appropriate fertiliser application.

3.5.3. Reduction of Direct Rural Domestic Sewage Discharge

Since most of the population in Baoying County is in rural areas, and rural domestic sewage is the main source of pollution, the direct discharge of rural domestic sewage could be reduced by increasing the collection rate of rural domestic sewage. In this study, the rural domestic sewage discharge was reduced by 50%, and the COD concentration in the Baoshe River under rainfall conditions is exhibited in Figure 13a, which shows that there was no significant difference in the COD concentration before and after the reduction of domestic sewage discharge, and there was almost no effect on the water quality of the Baoshe River under rainfall conditions. This was due to the fact that surface pollution tends to be the dominant form of pollution under rainfall conditions, because rainfall triggers large amounts of surface runoff, which are capable of accumulating pollutants over a wide area of a water body [47]. Specifically, in rural areas, rainfall washed away fertilisers and pesticides applied to fields and carried pollutants into rivers, lakes, or other water bodies, and the nitrogen and phosphorus in fertilisers and pesticides can trigger eutrophication, leading to algal blooms and a deterioration in water quality [48,49].
Therefore, as the changes in pollutant concentrations in the water body under rainfall conditions were not obvious, for a comparative study, COD and NH3-N concentrations in the water body before and after rural domestic wastewater abatement under non-rainfall conditions were simulated, as shown in Figure 13b,c. The simulation results showed that pollutants flowing directly into the Baoshe River Basin under non-rainfall conditions were reduced, and there was a significant improvement in the water quality of the river. The dominance of point source pollution under non-rainfall conditions was mainly due to the fact that discharges from point source pollution sources usually had stable flow rates and concentrations, and in the absence of rainfall, these stable sources of discharges became the main source of pollution. At the same time, surface source pollution, such as agricultural runoff and urban surface runoff, usually depend on rainfall to flush pollutants into water bodies, so the impact of surface source pollution is significantly reduced in the absence of rainfall, making the relative contribution of point source pollution more prominent. Since point source pollution has a well-defined discharge location and a fixed discharge pathway, these pollutants are concentrated in the environment, leading to their dominance in pollution loads during non-rainfall periods. Additionally, point source pollution is usually easier to manage through direct and effective control measures, whereas surface source pollution is more difficult to control due to its dispersed nature and complexity, thus making it more likely to be the main focus of pollution problems during non-rainfall conditions [50]. Bearing in mind the fact that Baoying County has a humid subtropical climate and tends to receive frequent rainfall during the summer months, it was important to combine these efforts with other treatment measures to achieve an effective and comprehensive reduction of the pollutants in water bodies.

3.5.4. Ecological Floating Islands and Artificial Aeration

Ecological floating islands and artificial aeration measures could accelerate biochemical reactions in water, allowing pollutants to be absorbed and degraded more efficiently by microorganisms or aquatic plants [51]. Therefore, the DO process in the Infoworks ICM model was adjusted to simulate the effects of constructing ecological floating islands and adopting artificial aeration measures on the water quality of the Baoshe River Basin. Wastewater treatment plays a crucial role in managing both domestic and industrial pollution by removing contaminants from used water before it is released back into the environment or reused. For domestic pollution, wastewater treatment facilities remove organic matter, pathogens, and other pollutants from household sewage, helping to protect public health and maintain water quality. In industrial settings, wastewater treatment addresses pollutants from manufacturing processes, chemicals, and heavy metals, ensuring that discharged water meets environmental regulations and reducing the risk of contaminating water bodies. By effectively treating wastewater, these facilities helped safeguard ecosystems, preserve water resources, and support sustainable development. As can be seen from Figure 14, after the addition of ecological floating islands and the implementation of artificial aeration, the pollutant concentration in the downstream section of the Baoshe River under the rainfall condition was reduced, but the measure did not play an obvious role in reducing the first concentration peak of the pollutants after the rain, but only a rapid reduction of pollutants after entry into the river; this may be due to the fact that ecological floating islands are more effective in small to medium-scale water purification and may not be effective enough to produce significant results in large-scale water pollution situations due to the treatment capacity of the ecological floating islands [52]. The benefits of artificial aeration were often localised around the aeration site; in larger water bodies, the effects may not extend far from the aeration points, making it less effective as a widespread solution [53]. It was noteworthy that the pollutant concentration in the Baoshe River channel gradually decreased over time. Therefore, the pollutant concentrations in the Baoshe River channel gradually decreased over time, and the longer the time, the more the concentrations were reduced, and eventually the COD and NH3-N concentrations were reduced, and the water quality was improved from Class IV water to Class III water.

3.5.5. Synergy of All Measures

The Baoshe River Basin is mainly polluted by domestic sewage; domestic sewage comes from a variety of sources, including food waste, oils and fats, and detergents, resulting in a higher organic matter, nitrogen, and phosphorus content than other types of sewage and microorganisms such as pathogens, viruses, and parasites, which pose a significant threat to human health if discharged without proper treatment [54,55].
Since the previous water quality improvement measures were not obviously suitable for the Baoshe River Basin, four measures, namely LID, reduction of fertiliser use, reduction of the direct discharge of rural sewage, and ecological floating island/artificial aeration, were considered together, and the results of the simulated water quality are shown in Figure 15. Comparing the previous single treatment measures, it can be seen that the synergistic effect of all four measures had the most obvious water quality improvement with the best treatment effect, one which could effectively reduce COD and NH3-N by 31.12% and 17.76%, respectively, so that the water quality of the Baoshe River could be rapidly upgraded from Class IV water to Class III water. Chen et al. [56] used LID technology in the Infoworks ICM model to simulate Northern Beijing and proposed a comprehensive evaluation method to assess the resilience of water quality and quantity systems. The results showed that compared with the baseline scenario, the recovery levels of water quality and water quantity increased by 1%~4% and 0.04%~0.3%, respectively. Song et al. [17] used the Infoworks ICM model to simulate water quality improvement measures in the Yuechuan Bridge area of Sanya City, where pollution control measures were less effective due to the mainly mountainous and rural nature of the area, with reductions in surface source pollution of about 40% and inland waterway pollution of only 20%. Since the pollution sources in Baoying County are mostly point source pollution of urban and rural domestic sewage and rural non-point source pollution, it was necessary to improve and centralise the treatment of domestic wastewater in the future water resources quality management system to avoid the serious pollution of river water bodies in Baoying County. Therefore, since Baoying County is located in a flat river network area, which usually has a developed water system and many dry tributaries, after the water body is polluted by many sources of pollution, the subsequent treatment of the water body is complicated, and the large-scale water quality treatment project required a large amount of capital investment [57]; so it was necessary to carry out strict control of the sources of pollution, such as establishing sewage treatment plants, promoting clean production, etc., so as to control the discharge of sewage from the source.
These measures worked together through different pathways and principles to effectively reduce COD and NH3-N pollution in the Baoshe River Basin. Approaches such as LID and eco-floating islands focused on utilising the natural environment to purify the water body through the synergistic actions of plants, soil, and microorganisms [58]. Reduction in fertiliser application and a reduction in the direct discharge of rural domestic sewage controlled the generation of pollutants at the source and their pathways into water bodies [59]. Artificial aeration reinforced the natural degradation process in water bodies through technical means [60].
The combination of these measures improved the environment of the water bodies in the Baoshe River Basin on multiple levels, protected aquatic ecosystems, and prevented eutrophication and other forms of pollution. In the long term, the combined use of these measures not only helped to restore and maintain the ecological balance of the water bodies but also improved the quality of the environment for human habitation and contributed to the sustainable development of society.

4. Conclusions

In this study, after investigating the water quality, the composition of pollution sources, and the pollution situation in Baoying County over the past ten years, and taking into account the conditions of regional water resource endowment, economic and social development planning, and the existing ecological and environmental challenges, a hydrological–hydrodynamic-water environment model was constructed using the Infoworks ICM model. The key pollution sources of the representative rivers in the study area, as well as the pollution periods, were identified. Based on the actual situation in Baoying, agricultural wastewater should be prioritised, with a focus on addressing wastewater discharge from rice fields while simultaneously advancing other treatment solutions in parallel. This approach aims to ensure that both tributary and main stream water quality can meet the required standards. By adding LID technology, reducing fertiliser application, and minimising rural sewage direct discharge, along with implementing ecological floating islands and artificial aeration technology, the COD and NH3-N removal rates in the Baoshe River Basin reached 31.12% and 17.76%, respectively. This led to an improvement in the water quality compliance rate of the control section, with the effluent water quality reaching the Class III standard (GB 3838-2002) [26].
In addition to a detailed investigation and rigorous modelling analysis of the water quality status in Baoying County, this study also provided a predictive framework for evaluating the effectiveness of the proposed water quality improvement measures. This framework used non-engineering measures as the policy foundation to guide the effective implementation of engineering measures, ensuring the feasibility, cost-effectiveness, and durability of BMPs. By classifying pollution sources and investigating pollution levels, the in-stream loads of various pollutants were simulated. The results were intended to offer valuable references for policymakers and stakeholders in water environment management within the plain river network. By providing evidence-based recommendations, this study contributes to advancing sustainable water resource management practices and ensuring the long-term ecological health and resilience of aquatic ecosystems in the plain river network.

Supplementary Materials

The following supporting information can be downloaded at: https://www.mdpi.com/article/10.3390/w16182698/s1, Table S1: China Environmental Quality Standards for Surface Water (GB3838-2002) mg/L; Table S2: Pollutant concentration measurements at Huangtugou section; Table S3: Pollutant concentration measurements at Huangtugou section; Table S4: Statistics of domestic sewage direct discharge points and drainage flow; Table S5: Key parameters of point source pollution; Table S6: The key parameters of InfoWorks ICM model; Table S7: Concentration of pollutants at point sources after rate-setting; Table S8: Pollutant flows from point sources after calibration; Table S9: Pollutant flows from point sources after calibration; Figure S1: Simulation of 2-h rainfall process.

Author Contributions

Conceptualisation, Q.Z. and S.Y.; Validation, Q.Z., X.L. and X.C.; Investigation, Q.Z., X.L. and X.C.; Resources, K.F., D.Z., C.G., J.S., R.T. and Y.C.; Data curation, X.L., X.C. and S.Y.; Writing—original draft preparation, S.Y.; Writing—review and editing, Q.Z.; Funding acquisition, D.Z., F.C. and S.H. All authors have read and agreed to the published version of the manuscript.

Funding

This research was funded by the National Natural Science Foundation of China (No. U2240223, 41601529), the National Key Research and Development Programme of China (Grand Nos. 2017YFC0404503), and the research on key technologies for optimising water supply configuration and improving water quality in the Lixiahe region (Hj523033).

Data Availability Statement

The data presented in this study are available on request from the corresponding author. The data are not publicly available due to privacy.

Conflicts of Interest

The authors declare no conflicts of interest. The funders had no role in the design of the study; in the collection, analyses, or interpretation of data; in the writing of the manuscript; or in the decision to publish the results.

References

  1. Cui, Y.; Zhou, Y.; Jin, J.; Zhang, L.; Wu, C.; Ning, S. Coordinated development evaluation and diagnosis of regional water resources-social economy-ecological environment system based on mechanical model and risk matrix. J. Hydrol. 2024, 633, 131013. [Google Scholar] [CrossRef]
  2. Zhou, R.; Jin, J.; Wu, C.; Zhou, L.; Zhang, L.; Cui, Y.; Zhang, Y.; Zhou, Y. Connection number-based model for coordination development evaluation of regional water resources, social economy and ecological environment complex system. J. Environ. Manag. 2023, 339, 117913. [Google Scholar] [CrossRef] [PubMed]
  3. Zhou, J.-R.; Li, X.-Q.; Yu, X.; Zhao, T.-C.; Ruan, W.-X. Exploring the ecological security evaluation of water resources in the Yangtze River Basin under the background of ecological sustainable development. Sci. Rep. 2024, 14, 15475. [Google Scholar] [CrossRef] [PubMed]
  4. Scanlon, B.R.; Fakhreddine, S.; Rateb, A.; de Graaf, I.; Famiglietti, J.; Gleeson, T.; Grafton, R.Q.; Jobbagy, E.; Kebede, S.; Kolusu, S.R.; et al. Global water resources and the role of groundwater in a resilient water future. Nat. Rev. Earth Environ. 2023, 4, 87–101. [Google Scholar] [CrossRef]
  5. Kalogiannidis, S.; Kalfas, D.; Giannarakis, G.; Paschalidou, M. Integration of Water Resources Management Strategies in Land Use Planning towards Environmental Conservation. Sustainability 2023, 15, 15242. [Google Scholar] [CrossRef]
  6. Obin, N.; Tao, H.; Ge, F.; Liu, X. Research on Water Quality Simulation and Water Environmental Capacity in Lushui River Based on WASP Model. Water 2021, 13, 2819. [Google Scholar] [CrossRef]
  7. Mummidivarapu, S.K.; Rehana, S.; Singh, H. Application of QUAL2K Model for Water Quality Modeling of Bhadra River Stretch, India. In Fluid Mechanics and Hydraulics; Timbadiya, P.V., Patel, P.L., Singh, V.P., Barman, B., Eds.; Springer Nature: Singapore, 2023; pp. 567–579. [Google Scholar] [CrossRef]
  8. Seifi, A.; Dehghani, M.; Singh, V.P. Uncertainty analysis of water quality index (WQI) for groundwater quality evaluation: Application of Monte-Carlo method for weight allocation. Ecol. Indic. 2020, 117, 106653. [Google Scholar] [CrossRef]
  9. Zhou, J.; Pang, Y.; Wang, H.; Li, W.; Liu, J.; Luo, Z.; Shao, W.; Zhang, H. Sewage network operational risks based on InfoWorks ICM with nodal flow diurnal patterns under NPIs for COVID-19. Water Res. 2023, 246, 120708. [Google Scholar] [CrossRef]
  10. Żelazny, M.; Bryła, M.; Ozga-Zielinski, B.; Walczykiewicz, T. Applicability of the WASP Model in an Assessment of the Impact of Anthropogenic Pollution on Water Quality—Dunajec River Case Study. Sustainability 2023, 15, 2444. [Google Scholar] [CrossRef]
  11. Ji, K.; Li, W.; Hao, X.; Ouyang, W.; Zhang, Y. Transport dynamics of watershed discharged diffuse phosphorus pollution load to the lake in middle of Yangtze River Basin. Environ. Pollut. 2024, 344, 123221. [Google Scholar] [CrossRef]
  12. Mummidivarapu, S.K.; Rehana, S.; Rao, Y.R.S. Mapping and assessment of river water quality under varying hydro-climatic and pollution scenarios by integrating QUAL2K, GEFC, and GIS. Environ. Res. 2023, 239, 117250. [Google Scholar] [CrossRef] [PubMed]
  13. Fleming, P.M.; Stephenson, K.; Collick, A.S.; Easton, Z.M. Targeting for nonpoint source pollution reduction: A synthesis of lessons learned, remaining challenges, and emerging opportunities. J. Environ. Manag. 2022, 308, 114649. [Google Scholar] [CrossRef] [PubMed]
  14. Yang, X.; Chen, Z. A hybrid approach based on Monte Carlo simulation-VIKOR method for water quality assessment. Ecol. Indic. 2023, 150, 110202. [Google Scholar] [CrossRef]
  15. Tiyasha; Tung, T.M.; Yaseen, Z.M. A survey on river water quality modelling using artificial intelligence models: 2000–2020. J. Hydrol. 2020, 585, 124670. [Google Scholar] [CrossRef]
  16. England, J.; Angelopoulos, N.; Cooksley, S.; Dodd, J.; Gill, A.; Gilvear, D.; Johnson, M.; Naura, M.; O’Hare, M.; Tree, A.; et al. Best Practices for Monitoring and Assessing the Ecological Response to River Restoration. Water 2021, 13, 3352. [Google Scholar] [CrossRef]
  17. Song, W.; Wang, S.; Zhao, J.; Xu, S.; Zhou, X.; Zhang, Y. Comprehensive Treatment for River Pollution in a Coastal City with a Complex River Network: A Case Study in Sanya, China. Sustainability 2023, 15, 6830. [Google Scholar] [CrossRef]
  18. Wu, W.; Lu, L.; Huang, X.; Shangguan, H.; Wei, Z. An automatic calibration framework based on the InfoWorks ICM model: The effect of multiple objectives during multiple water pollutant modeling. Environ. Sci. Pollut. Res. 2021, 28, 31814–31830. [Google Scholar] [CrossRef]
  19. Bertrand, N.; Abily, M.; Lambert, M.; Delestre, O. Benefit of Coupling 1D-2D Model Over an Urban Area to Assess Runoff During a Storm Event. In Advances in Hydroinformatics; Gourbesville, P., Caignaert, G., Eds.; Springer Nature: Singapore, 2022; pp. 315–328. [Google Scholar] [CrossRef]
  20. Zhang, R.; Li, Y.; Chen, T.; Zhou, L. Flood risk identification in high-density urban areas of Macau based on disaster scenario simulation. Int. J. Disaster Risk Reduct. 2024, 107, 104485. [Google Scholar] [CrossRef]
  21. Agonafir, C.; Lakhankar, T.; Khanbilvardi, R.; Krakauer, N.; Radell, D.; Devineni, N. A review of recent advances in urban flood research. Water Secur. 2023, 19, 100141. [Google Scholar] [CrossRef]
  22. Jin, X.; Zhou, P.; Zhang, X.; Liu, C. A coupling 1D-2D model of urban flooding simulation based on improved vertical flow exchange method. Adv. Water Sci. 2023, 34, 218–226. [Google Scholar] [CrossRef]
  23. Li, Y.; Wang, H.; Deng, Y.; Liang, D.; Li, Y.; Gu, Q. Applying water environment capacity to assess the non-point source pollution risks in watersheds. Water Res. 2023, 240, 120092. [Google Scholar] [CrossRef] [PubMed]
  24. Anh, N.T.; Can, L.D.; Nhan, N.T.; Schmalz, B.; Luu, T.L. Influences of key factors on river water quality in urban and rural areas: A review. Case Stud. Chem. Environ. Eng. 2023, 8, 100424. [Google Scholar] [CrossRef]
  25. Wu, R.; Zhang, S.; Liu, Y.; Shi, X.; Zhao, S.; Kang, X.; Quan, D.; Sun, B.; Arvola, L.; Li, G. Spatiotemporal variation in water quality and identification and quantification of areas sensitive to water quality in Hulun lake, China. Ecol. Indic. 2023, 149, 110176. [Google Scholar] [CrossRef]
  26. GB3838-2002; Environmental Quality Standards for Surface Water. Ministry of Ecology and Environment, The People’s Republic of China: Beijing, China, 2002. Available online: https://big5.mee.gov.cn/gate/big5/www.mee.gov.cn/ywgz/fgbz/bz/bzwb/shjbh/shjzlbz/200206/t20020601_66497.shtml (accessed on 18 September 2024).
  27. Shin, S.; Her, Y.; Muñoz-Carpena, R.; Khare, Y.P. Multi-parameter approaches for improved ensemble prediction accuracy in hydrology and water quality modeling. J. Hydrol. 2023, 622, 129458. [Google Scholar] [CrossRef]
  28. Wang, M.; Duan, L.; Bai, Y.; Peng, J.; Wang, Y.; Zheng, B. Improved export coefficient model for identification of watershed environmental risk areas. Environ. Sci. Pollut. Res. 2023, 30, 34649–34668. [Google Scholar] [CrossRef]
  29. An, S.; Song, Y.; Fu, Q.; Qi, R.; Wu, Z.; Ge, F.; Lu, X.; An, W.; Han, W. Reclaimed water use improved polluted water’s self-purification capacity --Evidenced by water quality factors and bacterial community structure. J. Clean. Prod. 2023, 386, 135736. [Google Scholar] [CrossRef]
  30. Zhang, J.; Jiang, Y.; Zhang, H.; Feng, D.; Bu, H.; Li, L.; Lu, S. A critical review of characteristics of domestic wastewater and key treatment techniques in Chinese villages. Sci. Total Environ. 2024, 927, 172155. [Google Scholar] [CrossRef]
  31. Yang, G.; Pan, H.; Lei, H.; Tong, W.; Shi, L.; Chen, H. Dissolved organic matter evolution and straw decomposition rate characterization under different water and fertilizer conditions based on three-dimensional fluorescence spectrum and deep learning. J. Environ. Manag. 2023, 344, 118537. [Google Scholar] [CrossRef]
  32. Marin, E.; Rusănescu, C.O. Agricultural Use of Urban Sewage Sludge from the Wastewater Station in the Municipality of Alexandria in Romania. Water 2023, 15, 458. [Google Scholar] [CrossRef]
  33. Cao, Q.; Cao, J.; Xu, R. Optimizing Low Impact Development for Stormwater Runoff Treatment: A Case Study in Yixing, China. Water 2023, 15, 989. [Google Scholar] [CrossRef]
  34. Nazari, A.; Roozbahani, A.; Shahdany, S.M.H. Integrated SUSTAIN-SWMM-MCDM Approach for Optimal Selection of LID Practices in Urban Stormwater Systems. Water Resour. Manag. 2023, 37, 3769–3793. [Google Scholar] [CrossRef]
  35. Han, J.; Wang, C.; Deng, S.; Lichtfouse, E. China’s sponge cities alleviate urban flooding and water shortage: A review. Environ. Chem. Lett. 2023, 21, 1297–1314. [Google Scholar] [CrossRef]
  36. Nazarpour, S.; Gnecco, I.; Palla, A. Evaluating the Effectiveness of Bioretention Cells for Urban Stormwater Management: A Systematic Review. Water 2023, 15, 913. [Google Scholar] [CrossRef]
  37. Zamani, M.G.; Saniei, K.; Nematollahi, B.; Zahmatkesh, Z.; Poor, M.M.; Nikoo, M.R. Developing sustainable strategies by LID optimization in response to annual climate change impacts. J. Clean. Prod. 2023, 416, 137931. [Google Scholar] [CrossRef]
  38. Wang, J.; Zhou, X.; Wang, S.; Chen, L.; Shen, Z. Simulation and Comprehensive Evaluation of the Multidimensional Environmental Benefits of Sponge Cities. Water 2023, 15, 2590. [Google Scholar] [CrossRef]
  39. Hou, Y.; Wang, S.; Ma, Y.; Shen, Z.; Goonetilleke, A. Influence of landscape patterns on nitrate and particulate organic nitrogen inputs to urban stormwater runoff. J. Environ. Manag. 2023, 348, 119190. [Google Scholar] [CrossRef]
  40. Wang, L.; Lu, P.; Feng, S.; Hamel, C.; Sun, D.; Siddique, K.H.M.; Gan, G.Y. Strategies to improve soil health by optimizing the plant–soil–microbe–anthropogenic activity nexus, Agriculture. Ecosyst. Environ. 2024, 359, 108750. [Google Scholar] [CrossRef]
  41. Ahmed, A.A.Q.; McKay, T.J.M. Environmental and ecological importance of bacterial extracellular vesicles (BEVs). Sci. Total Environ. 2024, 907, 168098. [Google Scholar] [CrossRef]
  42. Sheikh, M.; Harami, H.R.; Rezakazemi, M.; Cortina, J.L.; Aminabhavi, T.M.; Valderrama, C. Towards a sustainable transformation of municipal wastewater treatment plants into biofactories using advanced NH3-N recovery technologies: A review. Sci. Total Environ. 2023, 904, 166077. [Google Scholar] [CrossRef]
  43. Wang, Y.; Liang, L.; Liu, J.; Guo, D.; Zhu, Z.; Dong, H. Impact of anaerobic digestion on reactive nitrogen gas emissions from dairy slurry storage. J. Environ. Manag. 2022, 316, 115306. [Google Scholar] [CrossRef]
  44. Magrí, A.; Carreras-Sempere, M.; Biel, C.; Colprim, J. Recovery of Phosphorus from Waste Water Profiting from Biological Nitrogen Treatment: Upstream, Concomitant or Downstream Precipitation Alternatives. Agronomy 2020, 10, 1039. [Google Scholar] [CrossRef]
  45. Estahbanati, M.R.K.; Kumar, S.; Khajvand, M.; Drogui, P.; Tyagi, R.D. Wastewater. In Biomass, Biofuels, Biochemicals; Pandey, A., Tyagi, R.D., Varjani, S., Eds.; Elsevier: Amsterdam, The Netherlands, 2021; pp. 121–162. [Google Scholar] [CrossRef]
  46. Luo, P.; Xin, C.; Zhu, Y.; Liu, Y.; Ling, J.; Wang, T.; Huang, J.; Khu, S.-T. Effect of Rational Fertilizer for Eggplants on Nitrogen and Phosphorus Pollutants in Agricultural Water Bodies. Processes 2023, 11, 579. [Google Scholar] [CrossRef]
  47. Xiao, Y.; Zhang, C.; Zhang, T.; Luan, B.; Liu, J.; Zhou, Q.; Li, C.; Cheng, H. Transport processes of dissolved and particulate nitrogen and phosphorus over urban road surface during rainfall runoff. Sci. Total Environ. 2024, 948, 174905. [Google Scholar] [CrossRef]
  48. Sahu, A.K.; Mir, S.; Nayak, B.; Baitharu, I. Chapter 13Sustainable management of eutrophication and problems associated with the algal toxin in ponds and lakes of rural areas. In Water Resources Management for Rural Development; Madhav, S., Srivastav, A.L., Izah, S.C., Hullebusch, E.V., Eds.; Elsevier: Amsterdam, The Netherlands, 2024; pp. 155–170. [Google Scholar] [CrossRef]
  49. Chakrabarty, S. Factors Leading to Disposal of Toxic and Hazardous Sacred Waste and Its Effect on Urban River Contamination: Case of Adi Ganga, Kolkata, India. In Perception, Design and Ecology of the Built Environment: A Focus on the Global South; Ghosh, M., Ed.; Springer International Publishing: Cham, Switzerland, 2020; pp. 183–263. [Google Scholar] [CrossRef]
  50. Xia, Y.; Zhang, M.; Tsang, D.C.W.; Geng, N.; Lu, D.; Zhu, L.; Igalavithana, A.D.; Dissanayake, P.D.; Rinklebe, J.; Yang, X.; et al. Recent advances in control technologies for non-point source pollution with nitrogen and phosphorous from agricultural runoff: Current practices and future prospects. Appl. Biol. Chem. 2020, 63, 8. [Google Scholar] [CrossRef]
  51. Qiao, P.; Wang, S.; Li, J.; Zhao, Q.; Wei, Y.; Lei, M.; Yang, J.; Zhang, Z. Process; influencing factors, and simulation of the lateral transport of heavy metals in surface runoff in a mining area driven by rainfall: A review. Sci. Total Environ. 2023, 857, 159119. [Google Scholar] [CrossRef]
  52. Wu, H.; Wang, R.; Yan, P.; Wu, S.; Chen, Z.; Zhao, Y.; Cheng, C.; Hu, Z.; Zhuang, L.; Guo, Z.; et al. Constructed wetlands for pollution control. Nat. Rev. Earth Environ. 2023, 4, 218–234. [Google Scholar] [CrossRef]
  53. Qin, S.; Zhong, M.; Lin, B.; Zhang, Q. Roles of Floating Islands in Aqueous Environment Remediation: Water Purification and Urban Aesthetics. Water 2023, 15, 1134. [Google Scholar] [CrossRef]
  54. Allen, D.J.; Huang, J.; Farrell, M.; Mosley, L.M. Novel insight into ammonium, phosphate, and iron(II) dynamics in the sediment porewater of a constructed wetland under artificial aeration through the diffusive equilibrium in thin films technique. Environ. Res. 2023, 236, 116746. [Google Scholar] [CrossRef]
  55. Zhong, L.; Ding, J.; Wu, T.; Zhao, Y.-L.; Pang, J.W.; Jiang, J.-P.; Jiang, J.-Q.; Li, Y.; Ren, N.-Q.; Yang, S.-S. Bibliometric overview of research progress, challenges, and prospects of rural domestic sewage: Treatment techniques, resource recovery, and ecological risk. J. Water Process Eng. 2023, 51, 103389. [Google Scholar] [CrossRef]
  56. Chen, L.; Guo, C.; Yu, Y.; Zhou, X.; Fu, Y.; Wang, S.; Ma, Y.; Shen, Z. Optimization of green infrastructures for sustaining urban stormwater quality and quantity: An integrated resilience evaluation. J. Hydrol. 2024, 640, 131682. [Google Scholar] [CrossRef]
  57. Hassan, F.; Prasetya, K.D.; Hanun, J.N.; Bui, H.M.; Rajendran, S.; Kataria, N.; Khoo, K.S.; Wang, Y.-F.; You, S.-J.; Jiang, J.-J. Microplastic contamination in sewage sludge: Abundance, characteristics, and impacts on the environment and human health. Environ. Technol. Innov. 2023, 31, 103176. [Google Scholar] [CrossRef]
  58. Peng, Z.-X.; He, Y.; Yu, L.-J.; Hao, Z.-Y.; Li, T.-M.; Gu, L.-K.; Wang, L. The influence of in situ purification system on pathogen in the river fed by the drainage of sewage plant. Environ. Sci. Pollut. Res. 2024, 31, 29930–29938. [Google Scholar] [CrossRef] [PubMed]
  59. Wang, M.; Jiang, T.; Mao, Y.; Wang, F.; Yu, J.; Zhu, C. Current Situation of Agricultural Non-Point Source Pollution and Its Control. Water Air Soil Pollut. 2023, 234, 471. [Google Scholar] [CrossRef]
  60. Chen, F.; Huang, T.; Wen, G.; Li, K. Impact of artificial mixing and oxygenation on bacteria in a water transfer reservoir: Community succession and the role in water quality improvement. Sci. Total Environ. 2024, 908, 168581. [Google Scholar] [CrossRef]
Figure 1. Region of the study.
Water 16 02698 g001
Figure 2. Distribution of water quality monitoring sections.
Water 16 02698 g002
Figure 3. Results of the calibration: (a) COD, (b) NH3-N, (c) TP.
Water 16 02698 g003
Figure 4. 10-year changes in water quality at controlled sections.
Water 16 02698 g004
Figure 5. Zhangshi Bridge, Huangtugou cross section trend of indicators in 2014–2023.
Water 16 02698 g005
Figure 6. Changes in water quality at controlled sections in 2014–2023: (a) Zhangshi Bridge, (b) Huangtugou.
Water 16 02698 g006
Figure 7. Changes in water quality at controlled sections in January–December 2023: (a) Zhangshi Bridge, (b) Huangtugou.
Water 16 02698 g007
Figure 8. Changes in water quality at controlled sections in July 2014–2023: (a) Zhangshi Bridge, (b) Huangtugou.
Water 16 02698 g008
Figure 9. In-stream loading map of different types of pollutants in the Baoshe River.
Water 16 02698 g009
Figure 10. A 6 h COD mass flow diagram through the Huangtugou section: (a) non-rainfall, (b) rainfall.
Water 16 02698 g010
Figure 11. LID simulation results: (a) COD, (b) NH3-N.
Water 16 02698 g011
Figure 12. Reducing fertiliser application: (a) COD, (b) NH3-N.
Water 16 02698 g012
Figure 13. Simulation results of reduction in direct rural domestic sewage discharge: (a) COD concentration in rainy days, (b) COD concentration in non-rainfall conditions, (c) NH3-N concentration in non-rainfall conditions.
Water 16 02698 g013
Figure 14. Simulation results of ecological floating islands and artificial aeration: (a) COD, (b) NH3-N.
Water 16 02698 g014
Figure 15. Simulation results of total measures (a) COD, (b) NH3-N.
Water 16 02698 g015
Table 1. Water quality monitoring section information.
No.Control UnitsSection NameSection Location
1The Grand Canal (Baoying Section)Baqian119.28, 33.27
2The Grand Canal (Baoying Section)Chuanzha119.31, 33.22
3Baoshe RiverZhangshi Bridge119.49, 33.25
4Baoshe RiverHuangtugou119.69, 33.29
5Datong RiverXiaji119.54, 33.08
6Daxi RiverChaoyang Bridge119.58, 33.33
7Dasanwang RiverJiangbao village119.62, 33.32
Table 2. Tributary water quality test results.
No.TributaryCOD
(mg/L)
NH3-N
(mg/L)
TP
(mg/L)
Permanganate Index (mg/L)Exceedance Factors
1Wangzhi140.9380.154.2/
2Zhongpai112.500.114.2NH3-N
3Daguan131.850.125.2NH3-N
4Suzhuang141.070.085.1NH3-N
5Dalu111.920.104.4NH3-N
6Qianjin111.680.134.4NH3-N
7Xidang150.3660.144.1/
8Huyang122.020.104.3NH3-N
9Zhangshidang141.360.094.1NH3-N
10Yingsha131.750.195.0NH3-N
11Nanchang240.3220.447.8COD, TP, permanganate index
Class III water quality standard (GB3838-2002) [26]2010.26
Disclaimer/Publisher’s Note: The statements, opinions and data contained in all publications are solely those of the individual author(s) and contributor(s) and not of MDPI and/or the editor(s). MDPI and/or the editor(s) disclaim responsibility for any injury to people or property resulting from any ideas, methods, instructions or products referred to in the content.

