Article

Spatiotemporal Variation and Influences of Acidification in the North Pacific, 1995–2019

College of Oceanography and Ecological Science, Shanghai Ocean University, Shanghai 201306, China
*
Authors to whom correspondence should be addressed.
Water 2024, 16(18), 2705; https://doi.org/10.3390/w16182705
Submission received: 24 August 2024 / Revised: 8 September 2024 / Accepted: 20 September 2024 / Published: 23 September 2024

Abstract

:
The continuous rise in atmospheric CO2 levels has led to persistent ocean acidification, which negatively impacts marine environments crucial for marine life and alters the chemical composition of seawater. This phenomenon carries significant implications for human society. Utilizing surface seawater pH data from the North Pacific spanning 1995 to 2019, this study investigates the overall and localized spatiotemporal variations in pH within the region, as well as the factors influencing these variations. Additionally, it conducts a quantitative analysis of the different influencing factors. The findings reveal a consistent downward trend in surface seawater pH in the North Pacific, decreasing from 8.073 to 8.029, with notable seasonal variations. The highest pH values are recorded in winter, followed by spring, with lower values in autumn and summer. Spatially, the pH values are higher in the northwest and lower in the southeast, with the most pronounced acidification occurring in the central and western regions, while other areas exhibit more uniform acidification levels. Spatial correlation analysis indicates that surface seawater pH in the North Pacific generally shows a negative correlation with sea surface temperature (SST), salinity (SSS), and chlorophyll-a concentration (chl a) and a positive correlation with dissolved oxygen (DO). Among these factors, SST exerts the greatest influence on seawater pH, followed by DO and SSS. The degree of acidification varies across different regions, and the dominant influencing factors differ accordingly. In the equatorial central region (A), the primary factors are chl a and SST; in the eastern regions of China and Japan (B) and the western region of Canada (C), DO and SSS are the main controlling factors. An interaction analysis of each pair of dominant factors using the geodetector shows that their respective contributions to regions A, B, and C are 70%, 90%, and 50%, respectively. Understanding the primary factors driving acidification in different regions can aid in comprehending the biological and environmental impacts of acidification in those areas and provide valuable insights for mitigating marine acidification.

1. Introduction

Since the Industrial Revolution, the oceans have absorbed nearly a quarter of the carbon dioxide (CO2) released by human activities, making them a critical buffer against climate change [1]. This absorption of CO2 has led to a process known as ocean acidification, where the pH of seawater decreases [2]. Seawater pH, a key indicator of changes in ocean acidity, has become a focal point of study for researchers worldwide.
Global records indicate that the average pH of surface seawater is decreasing at a rate of approximately 0.002 per year. However, this rate of decrease varies significantly across different latitudes and regions. Coastal waters, influenced by terrestrial inputs, upwelling, and biological activities, show significant pH variations at both surface and bottom layers. In contrast, the open ocean, driven primarily by rising CO2 levels, exhibits a more stable acidification rate [3,4]. Notable declines in surface seawater pH have been recorded in the South China Sea, Bohai Sea, and areas near the Yangtze River estuary [5,6]. Compared to the open ocean, coastal regions experience more pronounced pH declines. Research in the northeast and northwest Pacific indicates surface seawater pH is decreasing at rates of −0.0016 ± 0.0002 yr −1 and −0.0018 ± 0.0001 yr −1, respectively [7,8]. At the same latitude, the North Pacific’s surface seawater pH is declining faster than that of the North Indian Ocean, highlighting regional differences in ocean acidification [9,10].
Seawater pH is influenced by several environmental factors beyond atmospheric CO2. Temperature, salinity, and dissolved oxygen play significant roles in its variation. Chlorophyll-a concentration, representing phytoplankton biomass, indicates the ocean’s capacity to convert atmospheric CO2. Variations in chlorophyll-a can cause fluctuations in seawater pH. For instance, changes in salinity affect the carbonate equilibrium in seawater, thereby altering pH [11]. Salinity concentration also influences the regulatory function of seawater pH [12]. Phytoplankton respiration impacts pH, with changes in chlorophyll concentration reflecting these biological processes [13]. Monitoring data from the East China Sea, Bohai Sea, Yellow Sea, and tropical western Pacific demonstrate that chlorophyll concentration affects seawater pH [14,15]. Additionally, there is a close relationship between dissolved oxygen and seawater pH. Studies of the California Current have shown that intertidal water temperature and dissolved oxygen fluctuations can alter intertidal pH [16]. Other factors, such as typhoons, acid rain, El Niño, upwelling, eutrophication, and biological activities, also affect seawater pH to varying degrees [17,18,19].
The North Pacific, with its extensive and varied marine environments, possesses rich biological resources and unique geochemical characteristics. Understanding the distribution and influencing factors of seawater pH in this region is crucial for exploring ocean acidification. This study investigates the temporal and spatial variations in surface seawater pH and its influencing factors in the North Pacific based on data from 1995 to 2019.

2. Data and Methods

2.1. Data

This study utilizes data from the Copernicus Marine Service website (https://marine.copernicus.eu/) covering the period from 1995 to 2019. The dataset includes monthly averaged observations of sea surface temperature (SST), salinity (SSS), chlorophyll-a concentration (chl a), dissolved oxygen (DO), and pH levels. The data, which have been preprocessed and reanalyzed, pertain to surface layers with a depth of up to 30 m. It comprises a total of 195,570 data points with a resolution of 0.25° × 0.25°. Detailed precision for each parameter is outlined in Table 1.
Temperature and salinity data are sourced from global ocean analysis and forecasting datasets provided by the Copernicus Marine Service. These datasets, generated using multi-model ensemble methods (GLORYS2V4, FOAM GLOSEA5V13, C-GLORS, ORAS5), represent the physical state of the ocean. Chlorophyll-a concentration, dissolved oxygen, and pH data are derived from global ocean biogeochemical analysis and forecasting datasets, simulated using the PISCES biogeochemical model. The simulation values from PISCES align closely with Argo data, demonstrating high consistency. Both datasets effectively replicate the spatial and seasonal distribution characteristics of the parameters and are extensively used in research on ocean carbonate systems and long-term changes [20,21].
This study applies comparative analysis and empirical orthogonal function (EOF) methods to investigate the spatiotemporal distribution of pH in the North Pacific. It also examines the mechanisms influencing pH levels across different regions of the North Pacific and employs geodetector for a quantitative assessment of the primary influencing factors.

2.2. Method

2.2.1. EOF

The EOF analysis is a technique designed to examine structural features within matrix data and identify the primary spatiotemporal characteristics of the data. Initially introduced to meteorology and climate studies by Lorenz in the 1950s [22], EOF analysis has since become widely utilized in oceanography and various other fields. The fundamental concept of EOF analysis involves decomposing complex spatiotemporal variation patterns in a dataset into a set of simpler EOF modes through eigenvalue decomposition. These modes represent the principal patterns of variability in the data, thereby facilitating a clearer understanding and interpretation of the observed phenomena.

2.2.2. Geodetector

In spatial analysis, when an independent variable significantly impacts a dependent variable, there is typically a noticeable spatial similarity between the two. The Geographic Detector is a statistical method based on this premise, designed to identify spatial differentiation characteristics and uncover potential driving forces [23]. This method has been extensively used in fields such as natural disaster assessment, ecological environment evaluation, and monitoring in disadvantaged areas. Recently, its application in ocean science has shown promising results [24]. Geodetector comprises four main sub-detectors: Factor Detector, Interaction Detector, Risk Detector, and Ecological Detector. This study primarily utilizes the Factor Detector and Interaction Detector.
The Factor Detector assesses the explanatory power of selected factors on the dependent variable, quantified by the q value. The q value ranges from 0 to 1, with a value closer to 1 indicating a stronger explanatory power of the factor on the dependent variable. The formula used is:
q = 1 - h = 1 L N h σ h 2 N σ 2
where h = 1, …, L represents the partitions of the dependent variable or factor, Nh and N denote the number of units in partition h and the total area, σ h 2 and σ 2 represent the variances within partition h and the entire area, respectively.
The analysis is conducted across the following five scenarios in Table 2:

3. Results

3.1. Spatiotemporal Variability in the North Pacific Ocean

3.1.1. Annual and Seasonal Variation of pH

Over the past 25 years, the average surface pH of the North Pacific Ocean has been 8.051, with an interannual variation ranging from 8.073 to 8.029. The pH has decreased by 0.044, with an average annual decline rate of 0.0018 y−1, exhibiting a significant linear downward trend, as illustrated in Figure 1. This finding aligns closely with research conducted by Dore, Haugan, Feely, and others [7,25,26]. For instance, Dore’s study indicated that from 1998 to 2007, the surface seawater pH of the Pacific Ocean decreased at a rate of 0.0019 ± 0.0002 y−1. Similarly, Haugan’s research showed that the current rate of pH change, driven by the ocean’s absorption of anthropogenic CO2 emissions, is a decrease of 0.0015 y−1 [25]. Feely’s study also found that at several open ocean time series stations, the observed reduction in seawater pH was 0.0018 y−1 [26]. Overall, the surface pH of the North Pacific Ocean is on a declining trend (Figure 1a).
Figure 1b reveals that surface pH values exhibit distinct seasonal patterns within the same year, following the trend: winter (December–February) > spring (March–May) > autumn (September–November) > summer (June–August). Over the past 25 years, while pH values in different seasons have fluctuated, they generally present a similar linear downward trend. The seasonal variation shows the most significant decrease in spring, followed by summer, with the lowest decrease in autumn. Specifically, the pH value decreased by 0.0451 in spring, 0.0436 in summer, 0.0425 in winter, and 0.0409 in autumn. This aligns with the findings of Midorikawa in 2010 [8], which estimated a decrease in pH in the western North Pacific from 1983 to 2007, ranging from 0.0375 to 0.0525 in winter and from 0.02 to 0.0475 in summer. Regarding the trend of seasonal pH changes over many years, spring and summer exhibit more significant fluctuations, while autumn and winter show more stable patterns. Overall, there is a downward trend in the pH values of surface seawater across all four seasons, indicating a general tendency towards acidification of the surface waters in the North Pacific Ocean.

3.1.2. Spatial Distribution Characteristics of pH

The spatial distribution of surface seawater pH in the North Pacific Ocean (Figure 2) shows a general pattern of higher pH values in the northwest and lower values in the southeast. Over the years, the highest pH values have been observed between 36 and 48° N and 120–175° E, especially near the Sea of Japan. In the northern North Pacific, particularly near the Sea of Okhotsk and the Bering Strait, there has been a significant decline in pH values since 1999. The eastern equatorial Pacific, influenced by upwelling, sees low pH subsurface waters brought to the surface, resulting in the lowest surface pH values in that region.
Comparing data from six different years clearly illustrates a continuous decline in surface seawater pH, indicating ongoing acidification of the North Pacific surface waters. The spatial distribution of surface seawater pH in 1999, 2004, and 2009 appears consistent, with low pH values in the equatorial and high-latitude regions and higher pH values in the mid-latitude regions. Over time, the pH values show a stepwise decrease from west to east, with particularly pronounced acidification in the mid-western North Pacific, while other regions exhibit more uniform acidification. Specifically, pH values in the equatorial and high-latitude regions are transitioning towards those in the mid-latitude regions, a pattern similar to the spatial distribution of surface seawater pH at in situ temperatures as estimated by Li [27].

3.2. Influencing Factors of Surface Acidification in the North Pacific Ocean

In addition to the primary influence of CO2 emissions, seawater pH is also affected by various environmental factors such as temperature, salinity, chlorophyll, and dissolved oxygen. Given the significant acidification of surface seawater over the years, this study investigates the relationship between surface seawater pH and these environmental factors. Data verification revealed that each parameter follows a normal distribution. Pearson correlation analysis was used to further evaluate the influence of each environmental factor on surface seawater pH. As shown in Table 3, surface pH exhibits a negative correlation with temperature, salinity, and chlorophyll concentration and a positive correlation with dissolved oxygen. Among these factors, temperature shows the most significant relationship with seawater pH, with little seasonal variation in this correlation. Dissolved oxygen and salinity follow in significance, with chlorophyll concentration having the least correlation with surface pH. Additionally, the degree of correlation between these environmental factors and surface pH varies significantly across seasons, especially for salinity and dissolved oxygen in spring and chlorophyll concentration in autumn and winter.
To further understand the spatial relationship between pH and other factors, this study conducted a spatiotemporal analysis of the correlation coefficients between pH and four environmental factors: sea surface temperature (SST), salinity (SSS), chlorophyll-a (chl a), and dissolved oxygen (DO), using data from 1995 to 2019. As shown in Figure 3, over the past 25 years, the occurrence and development of acidification in the surface waters of the North Pacific exhibit significant spatiotemporal variability influenced by these environmental factors. The correlation coefficient between pH and SST is predominantly negative across most of the surface waters in the North Pacific, consistent with the strong negative correlation of −0.721 observed in Table 3. However, near the equatorial regions, there is a strong positive correlation (Figure 4a). The spatial distribution of the correlation between pH and SSS is mainly negative (Figure 4b), and a comparison with Figure 4a shows that the spatial correlation between pH and SSS is generally weaker than that between pH and SST, which also aligns with the results in Table 3. The spatial distribution of the correlation between pH and chl a is similar to that of SSS (Figure 4c). The spatial distribution of the correlation coefficients between pH and DO is opposite to that of SST; in regions where SST shows a negative correlation, DO mostly exhibits a positive correlation. Near the equatorial regions where SST shows a strong negative correlation, DO presents a clear negative correlation (Figure 4d).

3.2.1. SST

Table 3 and Figure 3a indicate that sea surface temperature (SST) exhibits a significant negative correlation with surface pH values across all seasons, with varying degrees of correlation strength. Among the seasons, summer shows the strongest negative correlation between SST and pH, with a correlation coefficient of −0.714. During summer, the extent of the negative correlation region is also the largest and most intense in color. In contrast, the other three seasons display relatively weaker correlations, with smaller and lighter-colored regions. Despite the predominant negative correlation across large areas, some regions exhibit positive correlations, particularly in the equatorial zone between 0 and 10°N and 150° E and 160° W. Studies such as those by Long have reported an opposite trend between sea surface pH and temperature in the northern South China Sea, while Midorikawa found that an increase in sea temperature contributes approximately 15% to the reduction in pH in the Northwest Pacific [8,28]. Additionally, research by González-Dávila, Raven, and Nakano suggests that increased water temperatures lead to decreased CO2 levels and increased pH, whereas lower temperatures are associated with reduced pH [29,30,31]. This indicates that the impact of temperature on surface seawater pH varies by region and time. These findings align with the conclusions of the present study. Temperature changes directly affect the dissociation constants of carbonic acid, with higher temperatures increasing the dissociation constants of weak acids in seawater. This results in a higher concentration of hydrogen ions (H+), thereby altering seawater pH. Temperature changes also indirectly impact the CO2-carbonate system, enhancing CO2 solubility, disrupting carbonate mineral transformations, and affecting the balance of CaCO3 precipitation and dissolution. This phenomenon is further influenced by the dissociation equilibrium of dissolved inorganic carbonates, leading to a decrease in pH and subsequent ocean acidification [11]. The distribution and variation of seawater temperature in open ocean areas play a crucial role in pH variations, showing trends that are often inversely related to temperature changes.

3.2.2. SSS

Compared to temperature, salinity is a more conservative parameter, yet it also significantly influences seawater pH. Salinity in seawater can vary due to factors such as evaporation, precipitation, and water mass mixing, leading to changes in pH across different periods and regions. Generally, the impact of salinity on pH is more pronounced in coastal areas compared to the open ocean. As illustrated in Table 3 and Figure 5, there is a widespread negative correlation between surface seawater pH and salinity, with pH decreasing as salinity increases. This negative correlation is notably more extensive in autumn and winter. In contrast, spring and summer exhibit both negative and positive correlations in specific regions, such as the equatorial coastal areas between 0 and 15° N and 120 and 160° E, as well as the central North Pacific between 25 and 45° N and 130° E and 160° W. During spring, the coastal areas along China’s shore show a positive correlation with salinity, explaining the relatively lower correlation coefficient for spring pH with salinity in Table 3. Research by Li Furong indicates that pH decreases as salinity increases from the shore to the open sea at the Yellow River estuary [32]. Similarly, Ke Dongsheng observed that while the impact of salinity on seawater pH is less pronounced than temperature, it still significantly affects pH in coastal and shelf areas [33]. Liu Xiaohui’s study also demonstrates a positive correlation between pH and salinity in the Yangtze River estuary [34]. Furthermore, Zeebe and Xiao Zhenglin emphasize that salinity is a crucial factor in carbonate chemical equilibrium and influences seawater pH accordingly [12,35].

3.2.3. Chl a

The variation in pH is also influenced by phytoplankton respiration. Research by Mattsdotter Björk highlights that chlorophyll-a has a significant impact on acidification, particularly in the Amundsen Sea and Ross Sea, suggesting that biological factors primarily drive acidification in the surface waters of marginal seas [36]. As shown in Table 3 and Figure 3c, chlorophyll-a (chl a) and pH generally exhibit a negative correlation across most regions of the North Pacific. However, the spatial distribution of this correlation varies by season. In spring and summer, positive correlations are observed in coastal regions of China and along the equatorial coastline. During autumn, positive correlations are noted in the central and eastern equatorial regions, while in winter, positive correlations appear along the northern Pacific coasts and the eastern equatorial coasts. These findings align with reports from various studies indicating a positive correlation between seawater pH and chlorophyll-a concentration in regions such as the East China Sea, Bohai Sea, Yellow Sea, and the tropical western Pacific. Outside these specific areas, however, chlorophyll-a and pH generally exhibit a negative correlation throughout other regions of the North Pacific. This outcome supports Nakano’s study, which reconstructed North Pacific sea surface pH using sea surface temperature (SST) and chlorophyll-a, revealing a negative correlation between sea surface pH and chlorophyll concentration. This negative correlation may be linked to the calcification processes of surface phytoplankton and corals [37,38,39,40,41,42].

3.2.4. DO

DO is a critical component of seawater and serves as a key indicator of marine chemical parameters and water quality. As demonstrated in Table 3 and Figure 3d, surface seawater pH generally exhibits a positive correlation with dissolved oxygen across most regions. This positive relationship is primarily attributed to the increased oxygen production by phytoplankton during spring through photosynthesis, coupled with higher water stability, where elevated dissolved oxygen levels are associated with higher surface seawater pH. Nevertheless, anomalies in this pattern are observed in the central North Pacific Ocean during spring, where surface seawater pH shows a significant negative correlation with dissolved oxygen. Moreover, in summer, autumn, and winter, strong negative correlations are noted in the equatorial region (0–10° N, 160° E–140° W). This phenomenon may be linked to the El Niño effect, which disrupts the growth conditions for phytoplankton by causing anomalous increases in temperature. This disruption reduces photosynthesis, thereby leading to decreased levels of dissolved oxygen and lower pH values in these regions [19].

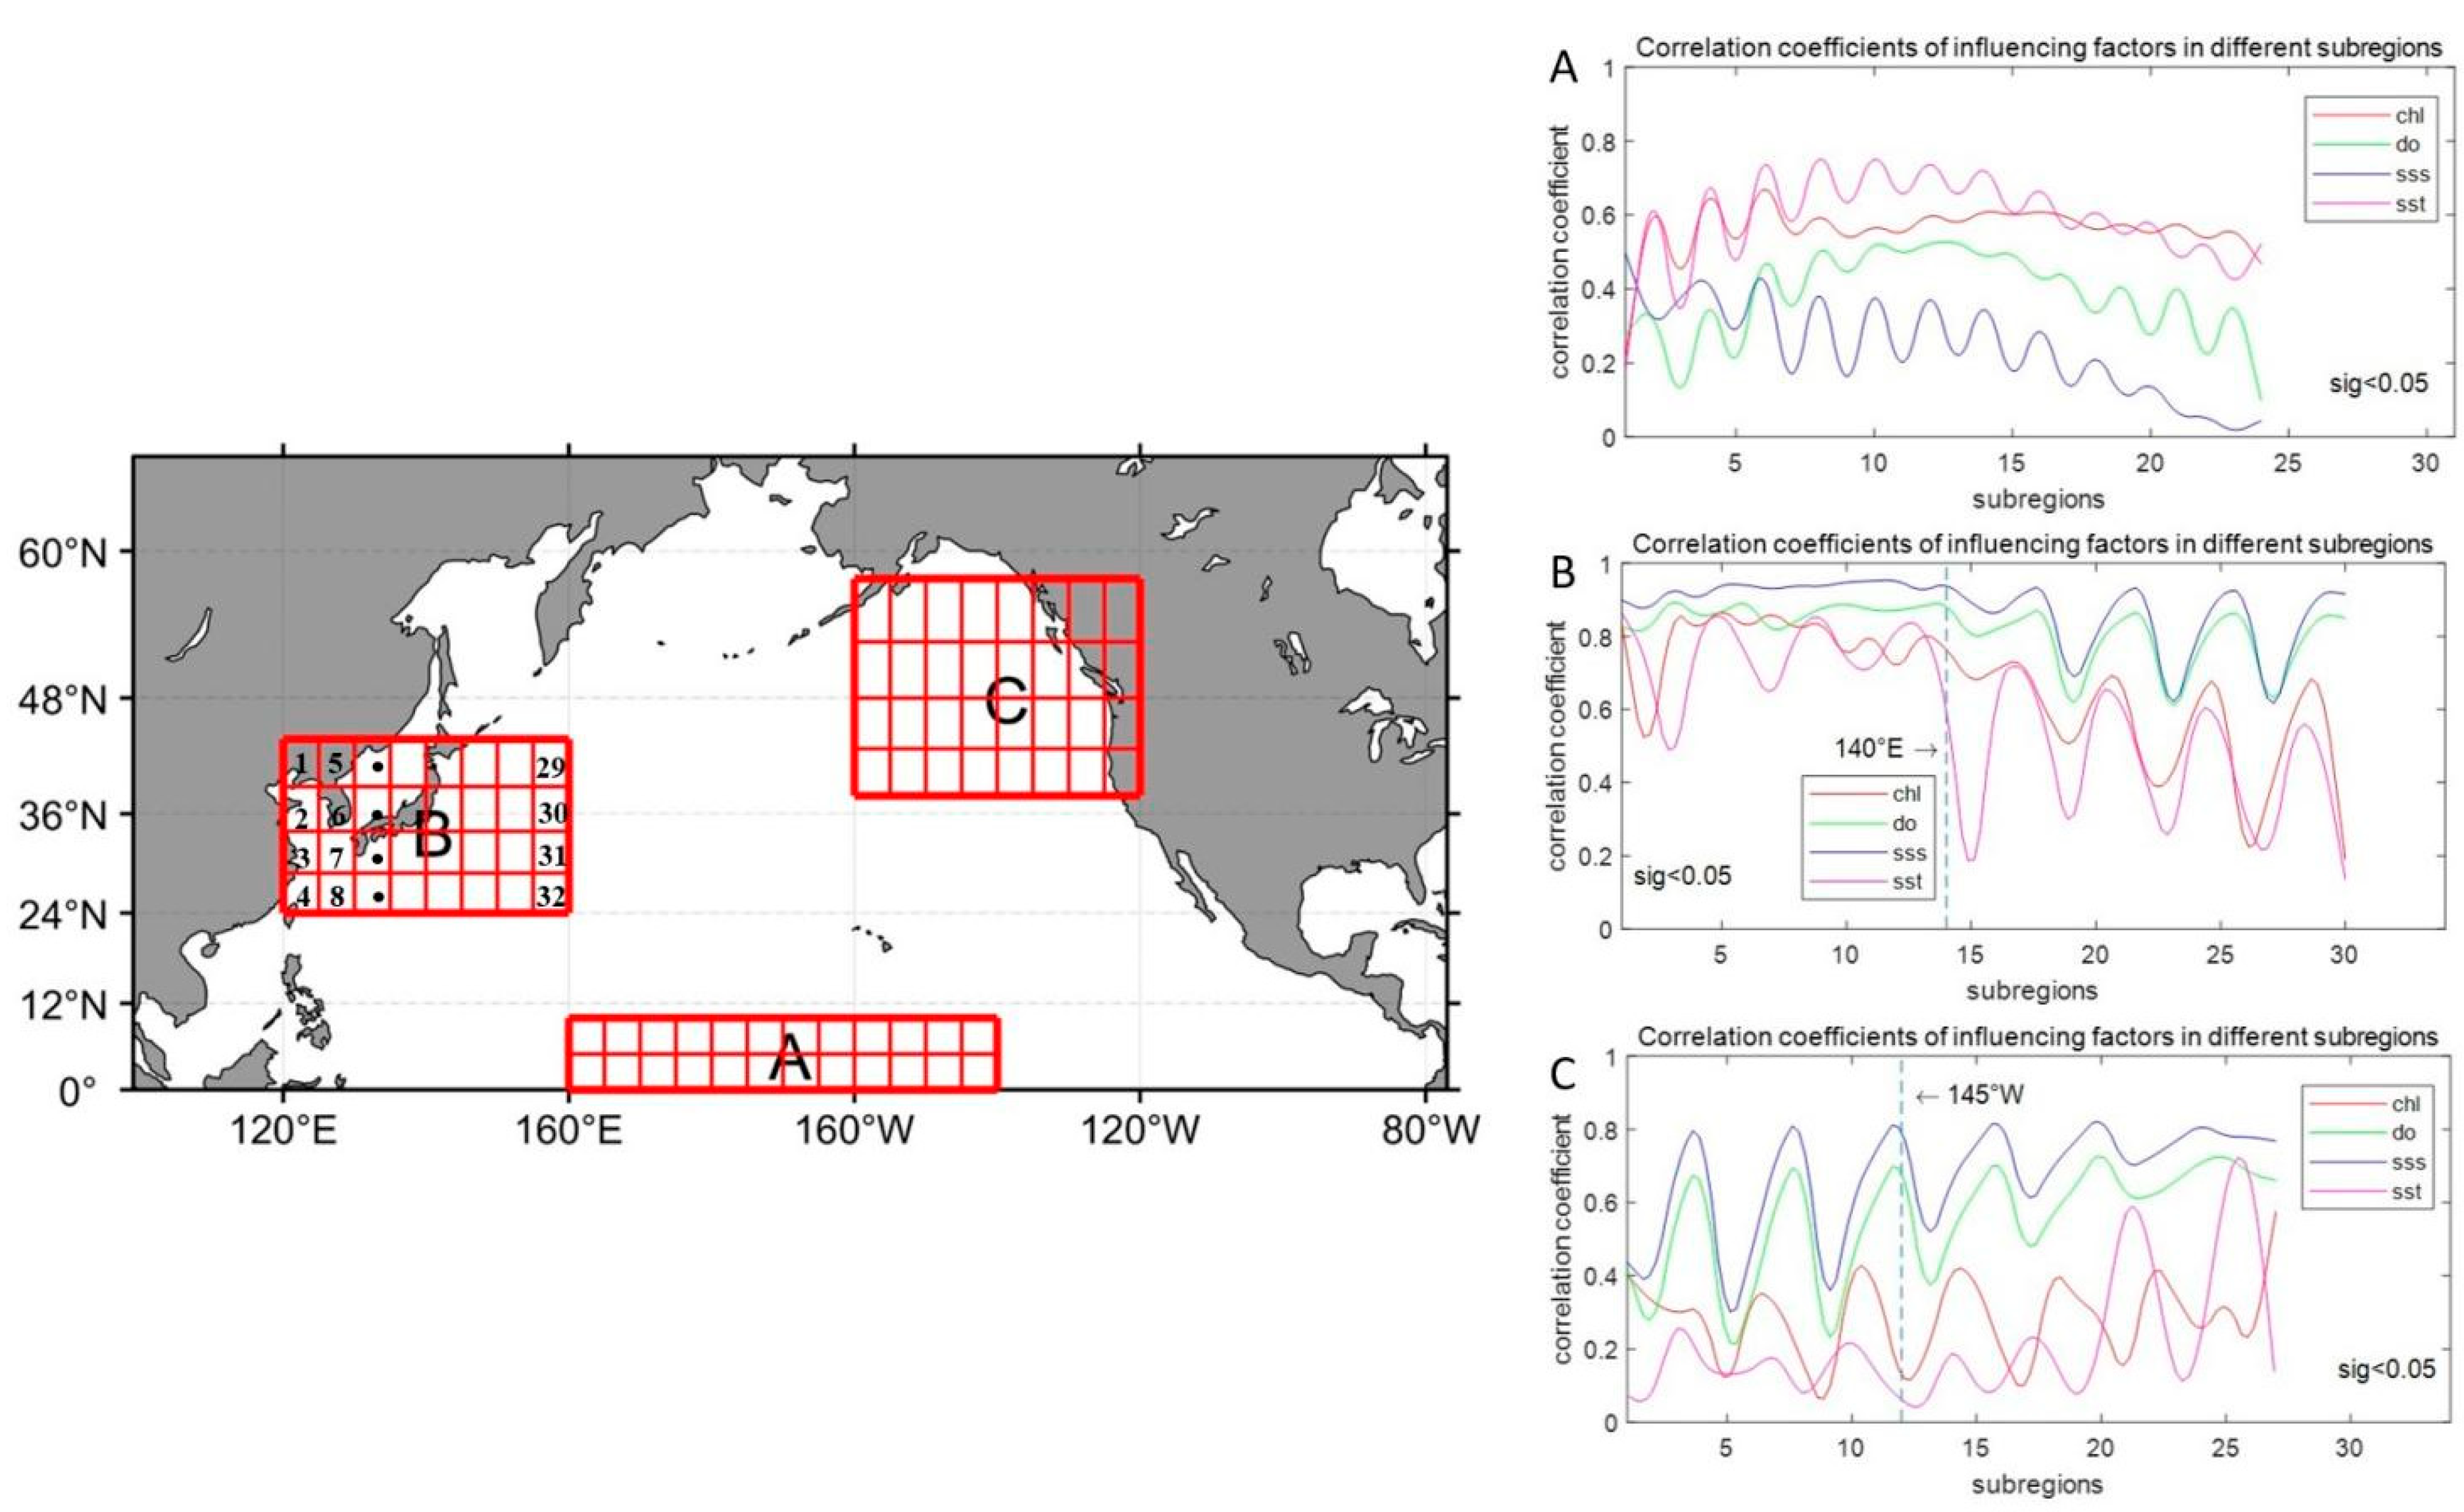
3.3. Spatiotemporal Variation of Typical Partitions

The temporal and spatial variations in pH levels across the North Pacific reveal that ocean acidification is influenced by diverse factors depending on the time and location. To investigate how these variations contribute to acidification, this study focuses on three key regions: the equatorial central area (A: 0–10°N, 160° E–140° W), the eastern China and Japanese seas (B: 24–44° N, 120–160° E), and the western Canadian waters (C: 38–58° N, 160–120° W). Using EOF analysis, we assess the primary patterns of variability in each region. Complementary correlation analysis and Geographic Detector methods are applied to quantify the impact of various controlling factors on acidification in these regions. This approach aims to provide a detailed understanding of how temporal and spatial dynamics shape acidification processes in the North Pacific.

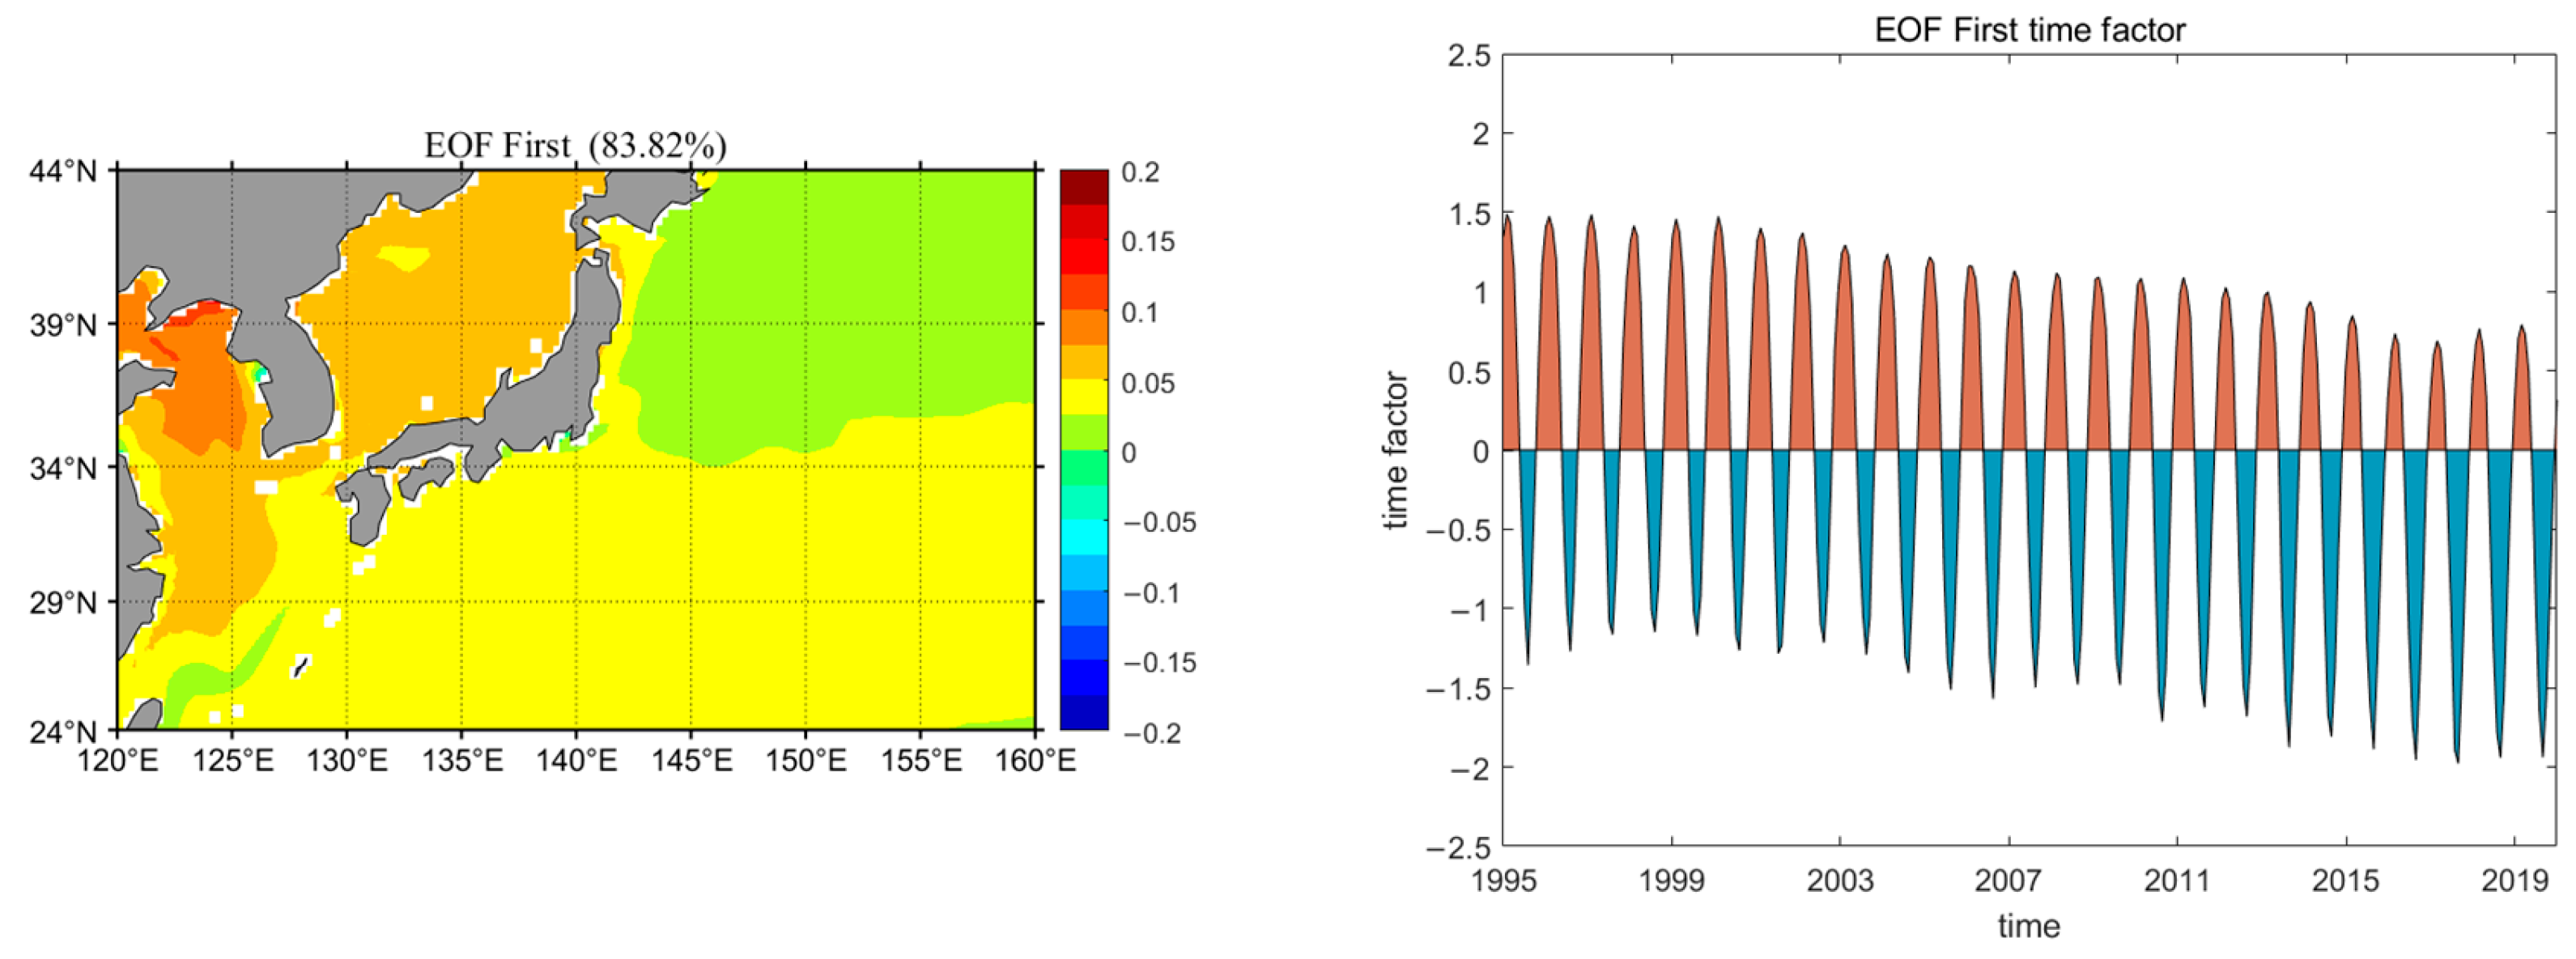
3.3.1. Equatorial Central Region

In the EOF spatial components for the equatorial central region, the first mode, which accounts for 56.37% of the EOF variance, displays a uniform phase shift across the area. This shift originates from a central point roughly around 169° E to 177° W and 0° to 1° N, with the amplitude decreasing radially outward. The second mode, contributing 14.32% of the EOF variance, exhibits anti-phase variations across the region, with 6° N and 164° W serving as the dividing line. In this mode, the positive phase center is shifted northwest relative to the first mode, while the negative phase center is situated in the eastern part of the region. This mode demonstrates a wavelike pattern in the amplitude of change propagating from the positive to the negative phase centers. Although the temporal components of both modes do not show distinct periodic patterns, the variation in the first mode’s temporal coefficient exhibits a strong resemblance to the El Niño phenomenon (Figure 6).

3.3.2. Eastern Regions of China and Japan

In the eastern China and Japanese seas, the first mode of the Empirical Orthogonal Function (EOF) analysis, which accounts for 83.82% of the variance, shows a uniform phase change across the entire region. This mode reveals that the amplitude of variation is notably greater in coastal areas compared to the open sea, with the Bohai Sea region experiencing the most significant changes. The second mode, contributing 6.78% of the variance, demonstrates an anti-phase variation between coastal and open sea regions. In this mode, the coastal areas near China exhibit a positive phase variation, while the Sea of Japan shows a negative phase variation. The amplitude of positive changes in the coastal regions is larger than the negative changes observed in the Sea of Japan. Both modes display strong periodicity in their temporal components, suggesting a stable pattern of pH changes over time. Notably, the temporal coefficient for the positive phase of the first mode is decreasing, whereas the coefficient for the negative phase is increasing. This trend indicates that the effects of certain ecological activities on acidification, particularly during the summer, are intensifying, potentially due to influences related to coral reef systems (Figure 7).

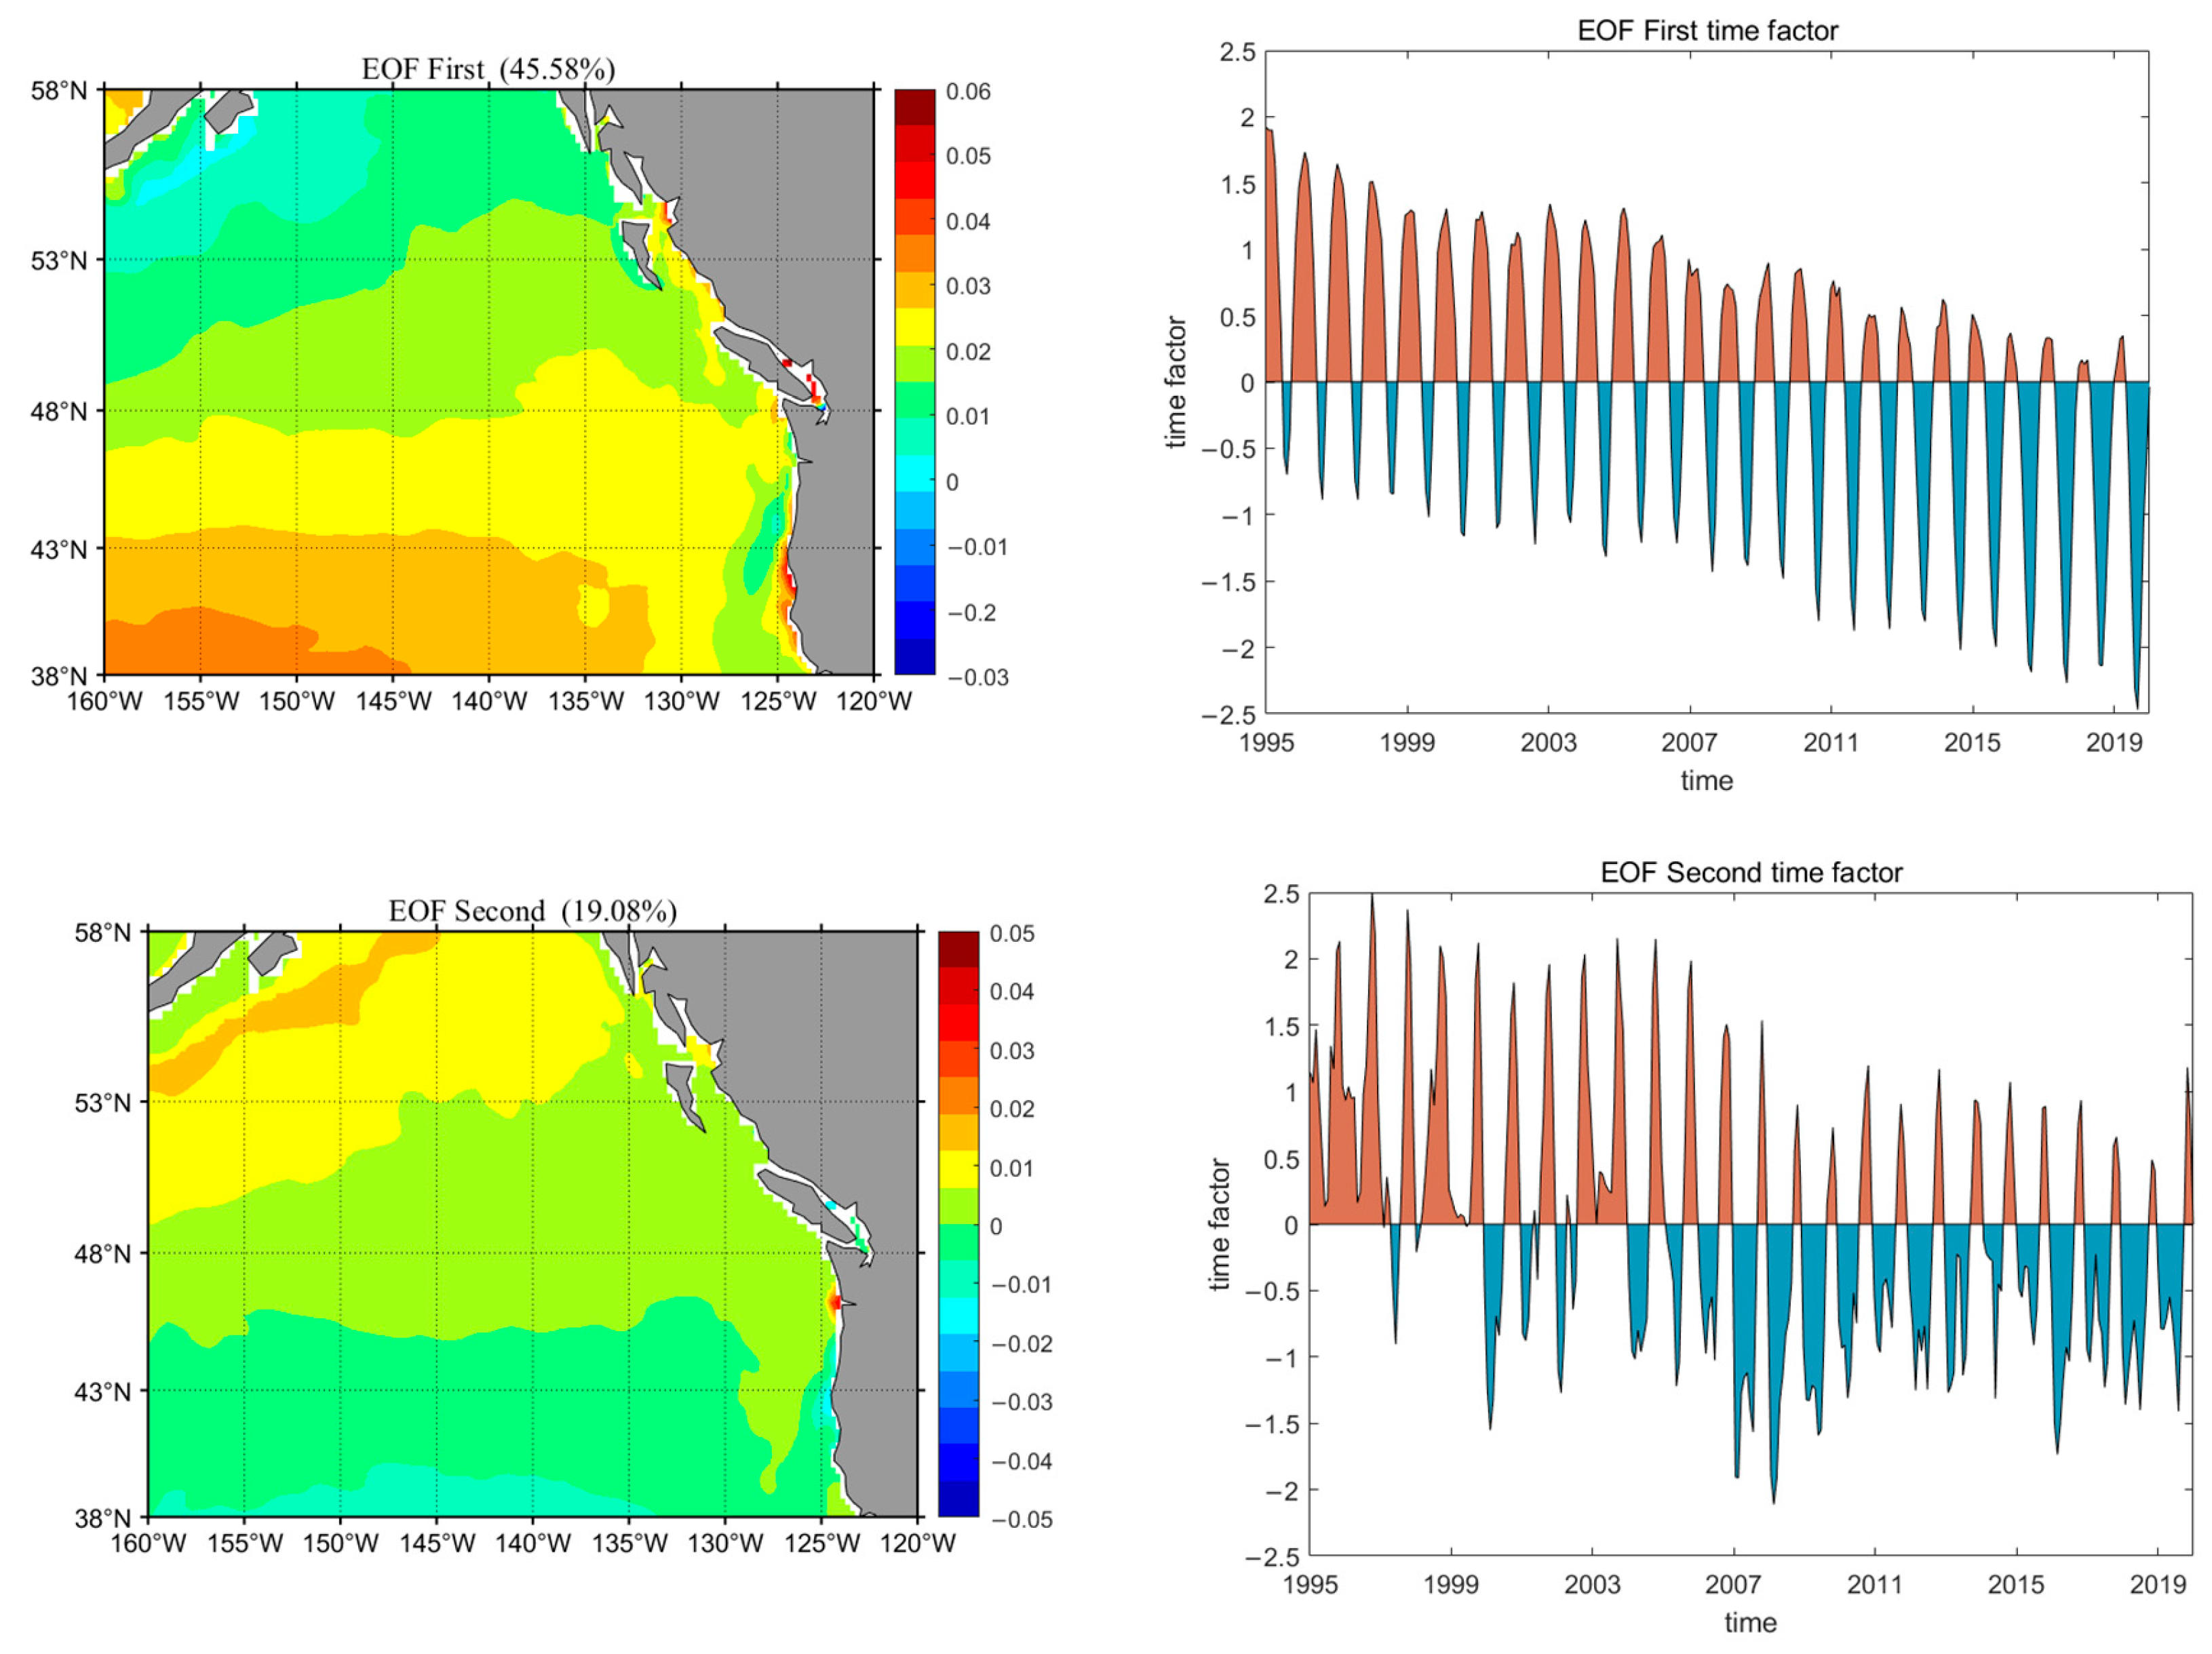
3.3.3. Western Region of Canada

In the western Canadian seas, the first mode of the EOF analysis, which accounts for 45.58% of the variance, reveals a uniform phase change throughout the region. Here, the amplitude of variation decreases systematically from south to north. The second mode, contributing 19.08% of the variance, exhibits an anti-phase variation with 45°N as the dividing line. In this mode, the amplitude of change increases progressively in both the northern and southern parts of the region. This could be influenced by the North Pacific Current and the Alaska Current, which bring chemical substances from the ocean floor to the surface waters. The temporal component of the first mode shows a strong periodic pattern, while the second mode demonstrates periodicity primarily beginning after 1999 (Figure 8).

3.4. Discussion of the Main Controlling Factors of Typical Partitions

Based on the results from Chapter 3, it is clear that the degree of acidification varies significantly across different regions of the North Pacific, with distinct environmental factors influencing acidification in each area. To better understand these spatial differences, regions A, B, and C were subdivided into 5° × 5° grid cells, with the northwest corner of each region designated as zone 1 and subsequent zones numbered sequentially from north to south. This resulted in 24 grid cells for region A and 32 grid cells each for regions B and C. Land-based grid cells were excluded from the analysis, and the remaining cells were examined to determine the correlation coefficients between pH and environmental factors such as temperature, salinity, chlorophyll a, and dissolved oxygen. All correlations were tested at a 95% confidence level, with pH correlations to temperature, salinity, and chlorophyll analyzed as absolute values.
Figure 9 illustrates that the primary factors influencing pH in region A are chlorophyll a and sea surface temperature (SST). In contrast, salinity (SSS) and dissolved oxygen (DO) are more significant in regions B and C. This trend is corroborated by the correlation coefficients observed in Figure 6, where chlorophyll a and SST, which are dominant factors in the first EOF mode for pH in region A, show distinct peaks. Similarly, Figure 7 reflects high correlation coefficients for SSS and DO in coastal areas with large pH first EOF mode amplitudes.
The line graphs reveal wave-like variations in pH amplitude from north to south in the eastern part of region A, with 140° E serving as a boundary. Figure 8 confirms that the spatial distribution of the decreasing amplitude of the pH first EOF mode from south to north aligns with the wave-like patterns observed in the SSS and DO line graphs. Additionally, the amplitude variation is more pronounced in the western part of the region compared to the eastern part, as reflected in the larger wave amplitudes observed in the western line graphs and smaller amplitudes in the east.

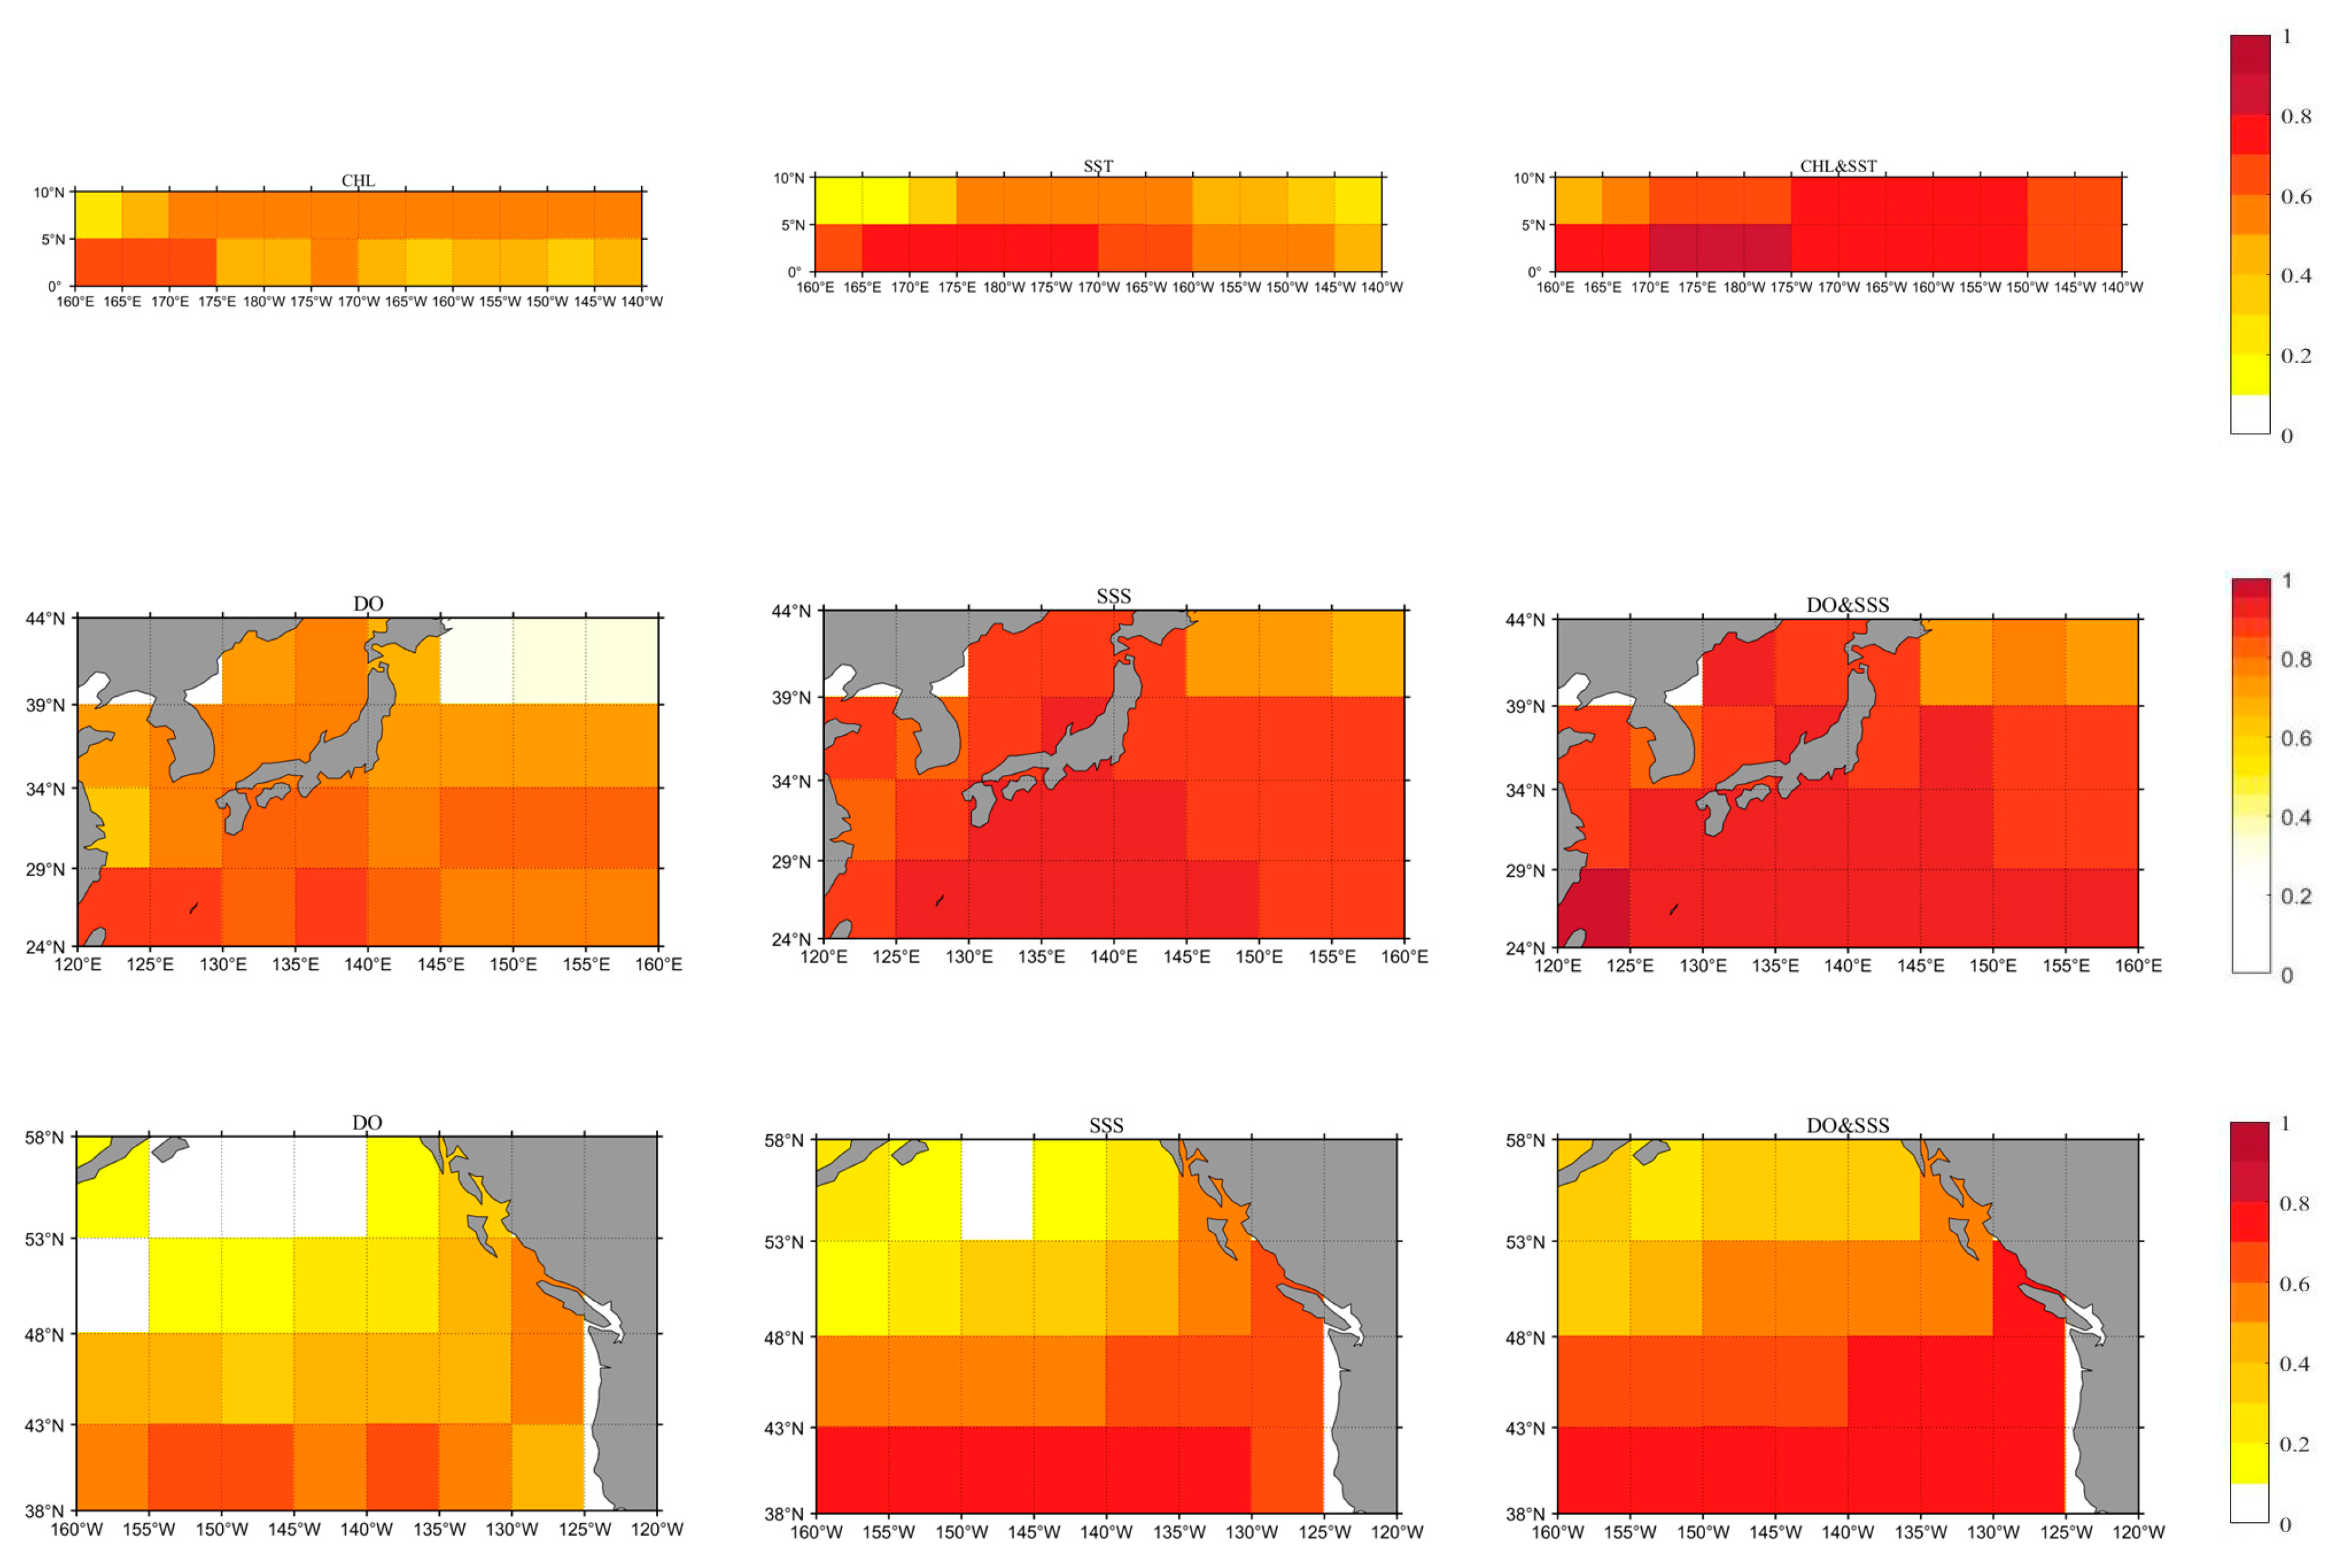
3.5. Quantitative Analysis of Main Control Factors

Figure 9 demonstrates that the correlation coefficients between pH and environmental factors in regions A, B, and C reveal distinct primary controlling factors for each area. However, the exact magnitude of these factors’ influence and the potential positive interactions between them are not yet clear. To address these questions, the next step involves employing a geographic detector to further explore and quantify these relationships in detail.
Figure 10 illustrates the results of the geographic detector analysis, revealing that the single-factor Q-values for the primary controlling factors, chlorophyll a (chl a) and sea surface temperature (SST) in Region A, fluctuate around 0.5. However, when these factors interact, the Q-value rises to approximately 0.7, showing significant improvements across various spatial grids. This indicates that the interaction between chl a and SST enhances the explanation of acidification, contributing to over 70% of the variation in Region A. In Regions B and C, the single-factor Q-values for dissolved oxygen (DO) are around 0.7 and 0.4, respectively, while salinity (SSS) shows Q-values of approximately 0.85 and 0.5. When these factors interact, the Q-values increase to 0.9 and 0.6, respectively, with similar enhancements observed across spatial grids. This suggests that the interaction between DO and SSS accounts for 90% and 50% of the acidification in Regions B and C, respectively. These findings underscore that the primary controlling factors of acidification differ among regions, and even when the factors are the same, their impact can vary significantly depending on the interactions and spatial context.

3.6. Discussion of A, B, and C Acidification Mechanisms

The acidification of Region A is primarily influenced by the El Niño phenomenon. El Niño is a periodic climate event that leads to a rise in sea surface temperatures, reducing the ocean’s ability to absorb CO2, which in turn accelerates the acidification process. During El Niño events, the ocean’s mixed layer becomes shallower, slowing the exchange of chemical substances at the surface, resulting in a cyclical fluctuation in acidification. This climate-driven factor causes Region A to exhibit a distinct seasonal and periodic decline in pH levels.
The acidification in Region B is more severe, particularly in areas close to the coast, where it is strongly linked to coastal upwelling and eutrophication. Upwelling brings CO2-rich and nutrient-laden deep waters to the surface, increasing CO2 concentrations and accelerating acidification. Furthermore, the peak of biological activity in summer, especially the respiration and calcification processes of coral reef systems, intensifies local acidification. Human activities, such as pollution and coastal development, exacerbate this effect, creating pronounced acidification hotspots in Region B.
The acidification mechanism in Region C is relatively complex and primarily influenced by the North Pacific Current and the Alaska Current. These currents transport deep-sea chemical substances, including CO2-rich waters, to the surface, leading to a stepped pattern of acidification across the region. Additionally, these currents affect the distribution of temperature and salinity, further driving the acidification process. The unique spatial distribution of acidification in Region C indicates that oceanic circulation plays a key role in its acidification dynamics.
In summary, the acidification mechanisms in Regions A, B, and C each display unique characteristics. Region A is largely driven by climate phenomena, Region B is significantly impacted by biological activity and human influences, and Region C is shaped by oceanic circulation processes. These varied acidification mechanisms provide valuable insights into the global processes of ocean acidification, offering important case studies for further understanding.

4. Conclusions

Based on reanalysis data from 1995 to 2019, this study explores the temporal and spatial variations in pH levels of surface waters in the North Pacific Ocean and examines the factors influencing these pH levels. The key findings are as follows:
(1)
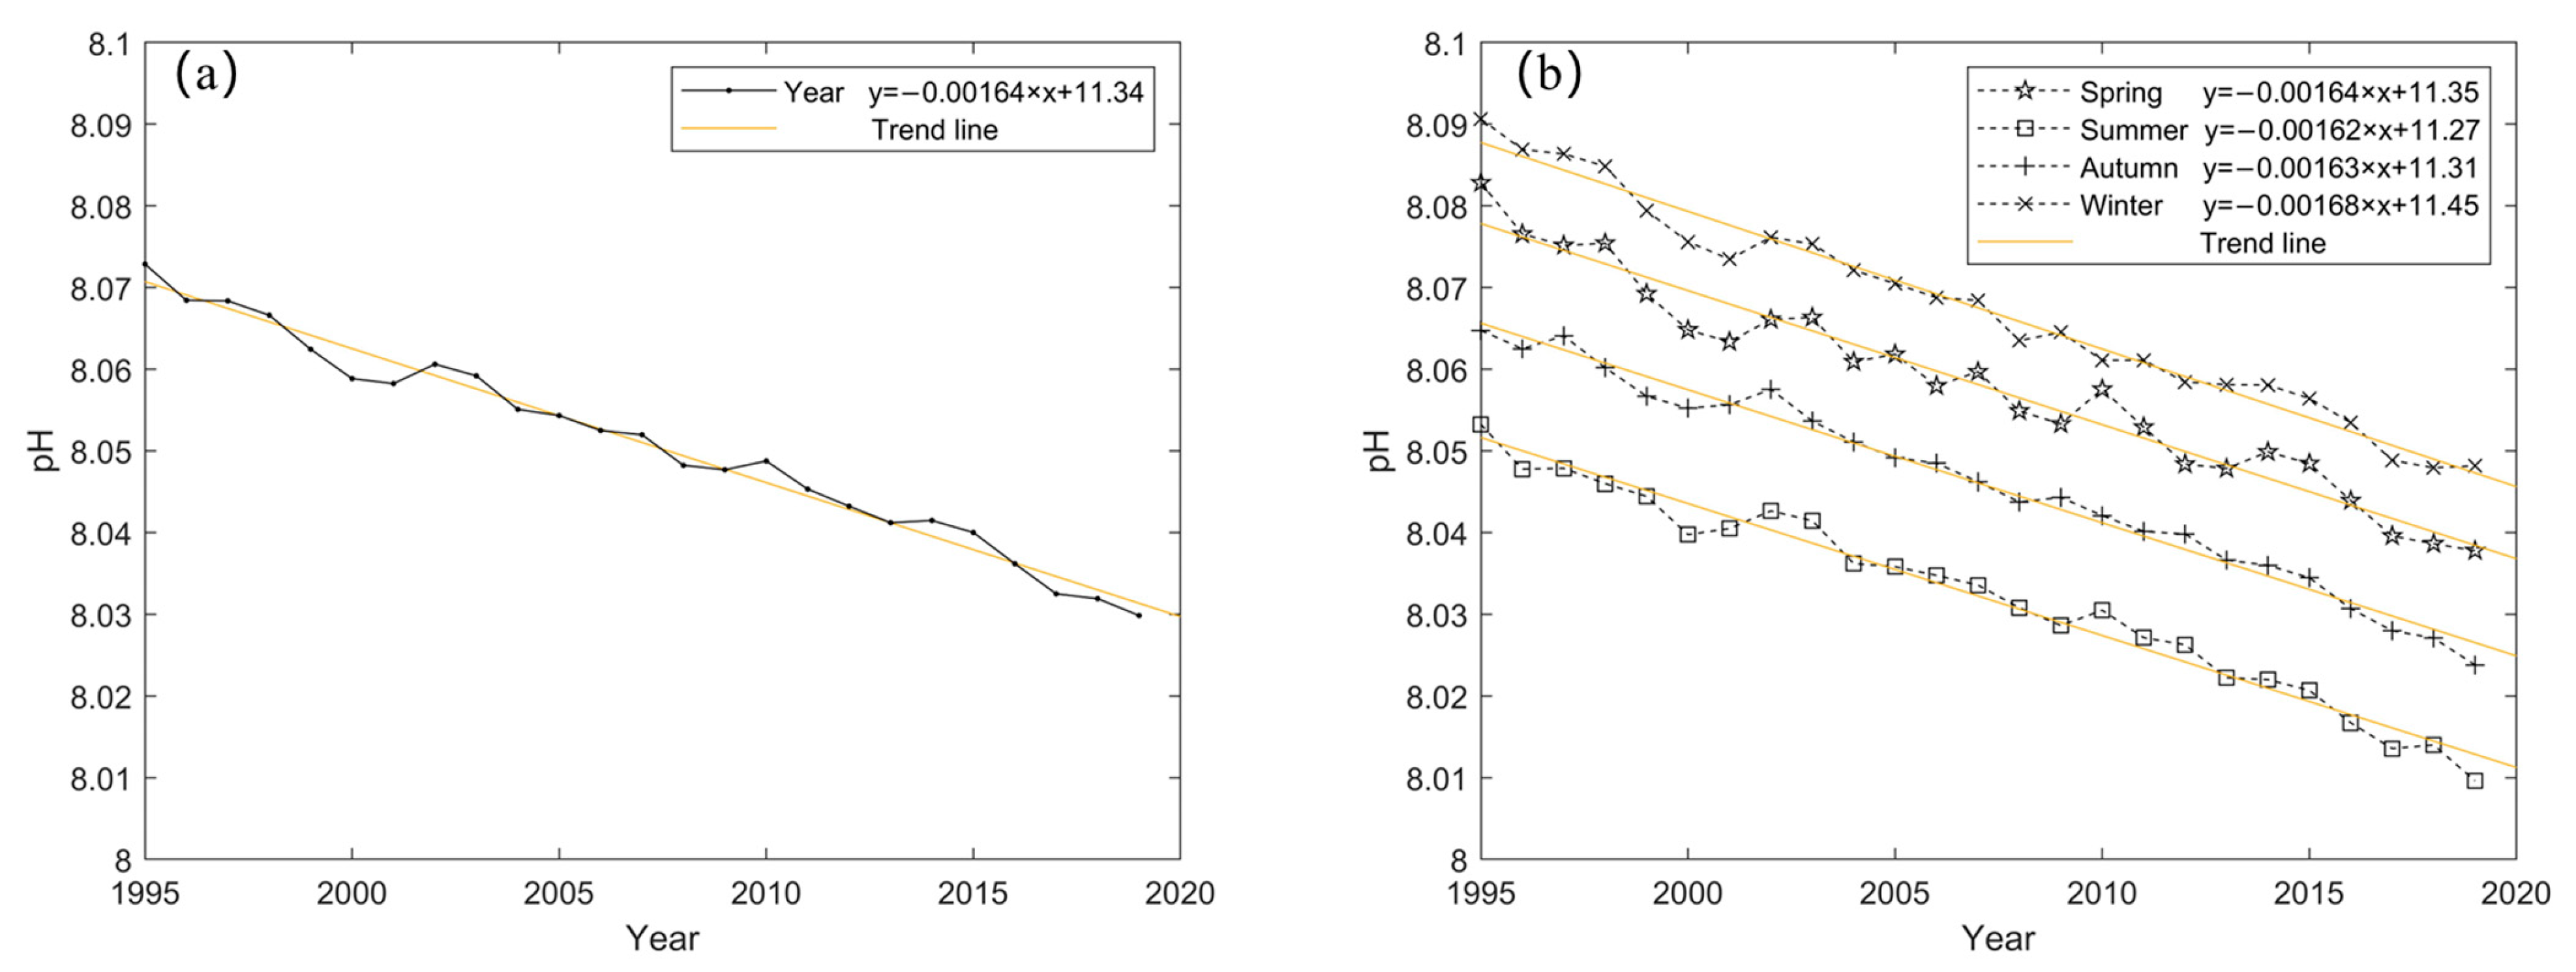
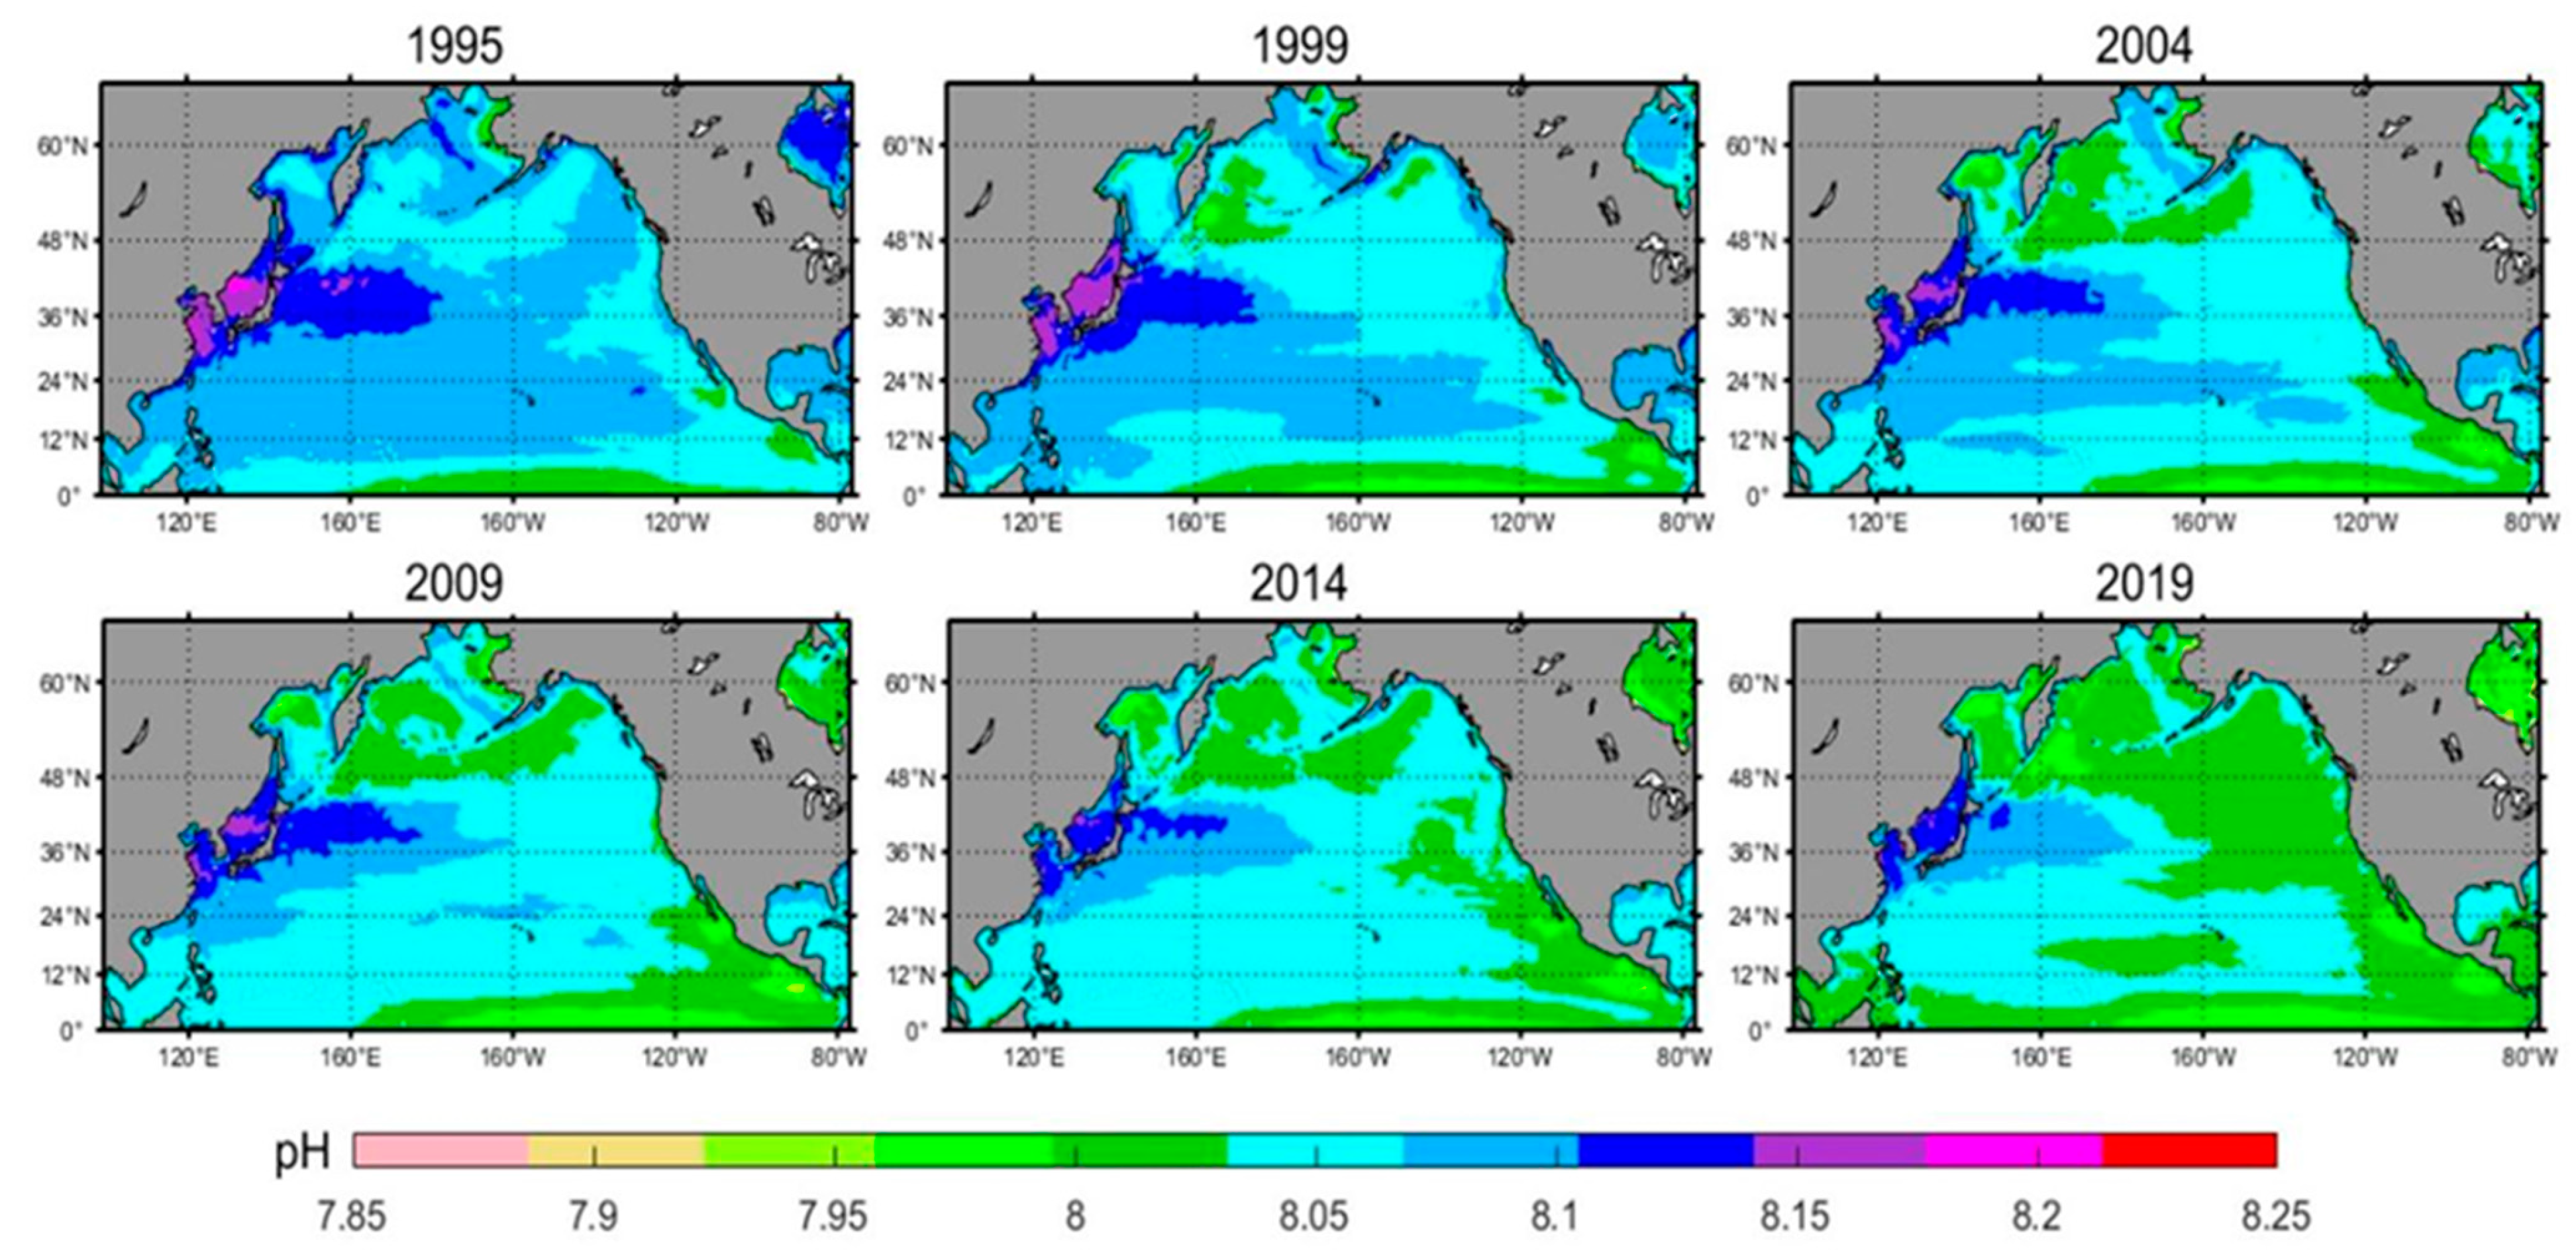
Surface water pH has decreased linearly by approximately 0.043 over the 25-year period. Seasonal variations reveal that pH levels peak in winter and reach their lowest point in summer. Spring and winter show the most significant changes, while summer and autumn exhibit more stable pH levels. The surface water pH displays a gradient from high in the northwest to low in the southeast. Over time, there is a noticeable stepwise decline in pH from west to east. Acidification is most severe in the central and western North Pacific, while other regions, particularly equatorial and high-latitude areas extending towards the central ocean, exhibit a more uniform level of acidification.
(2)
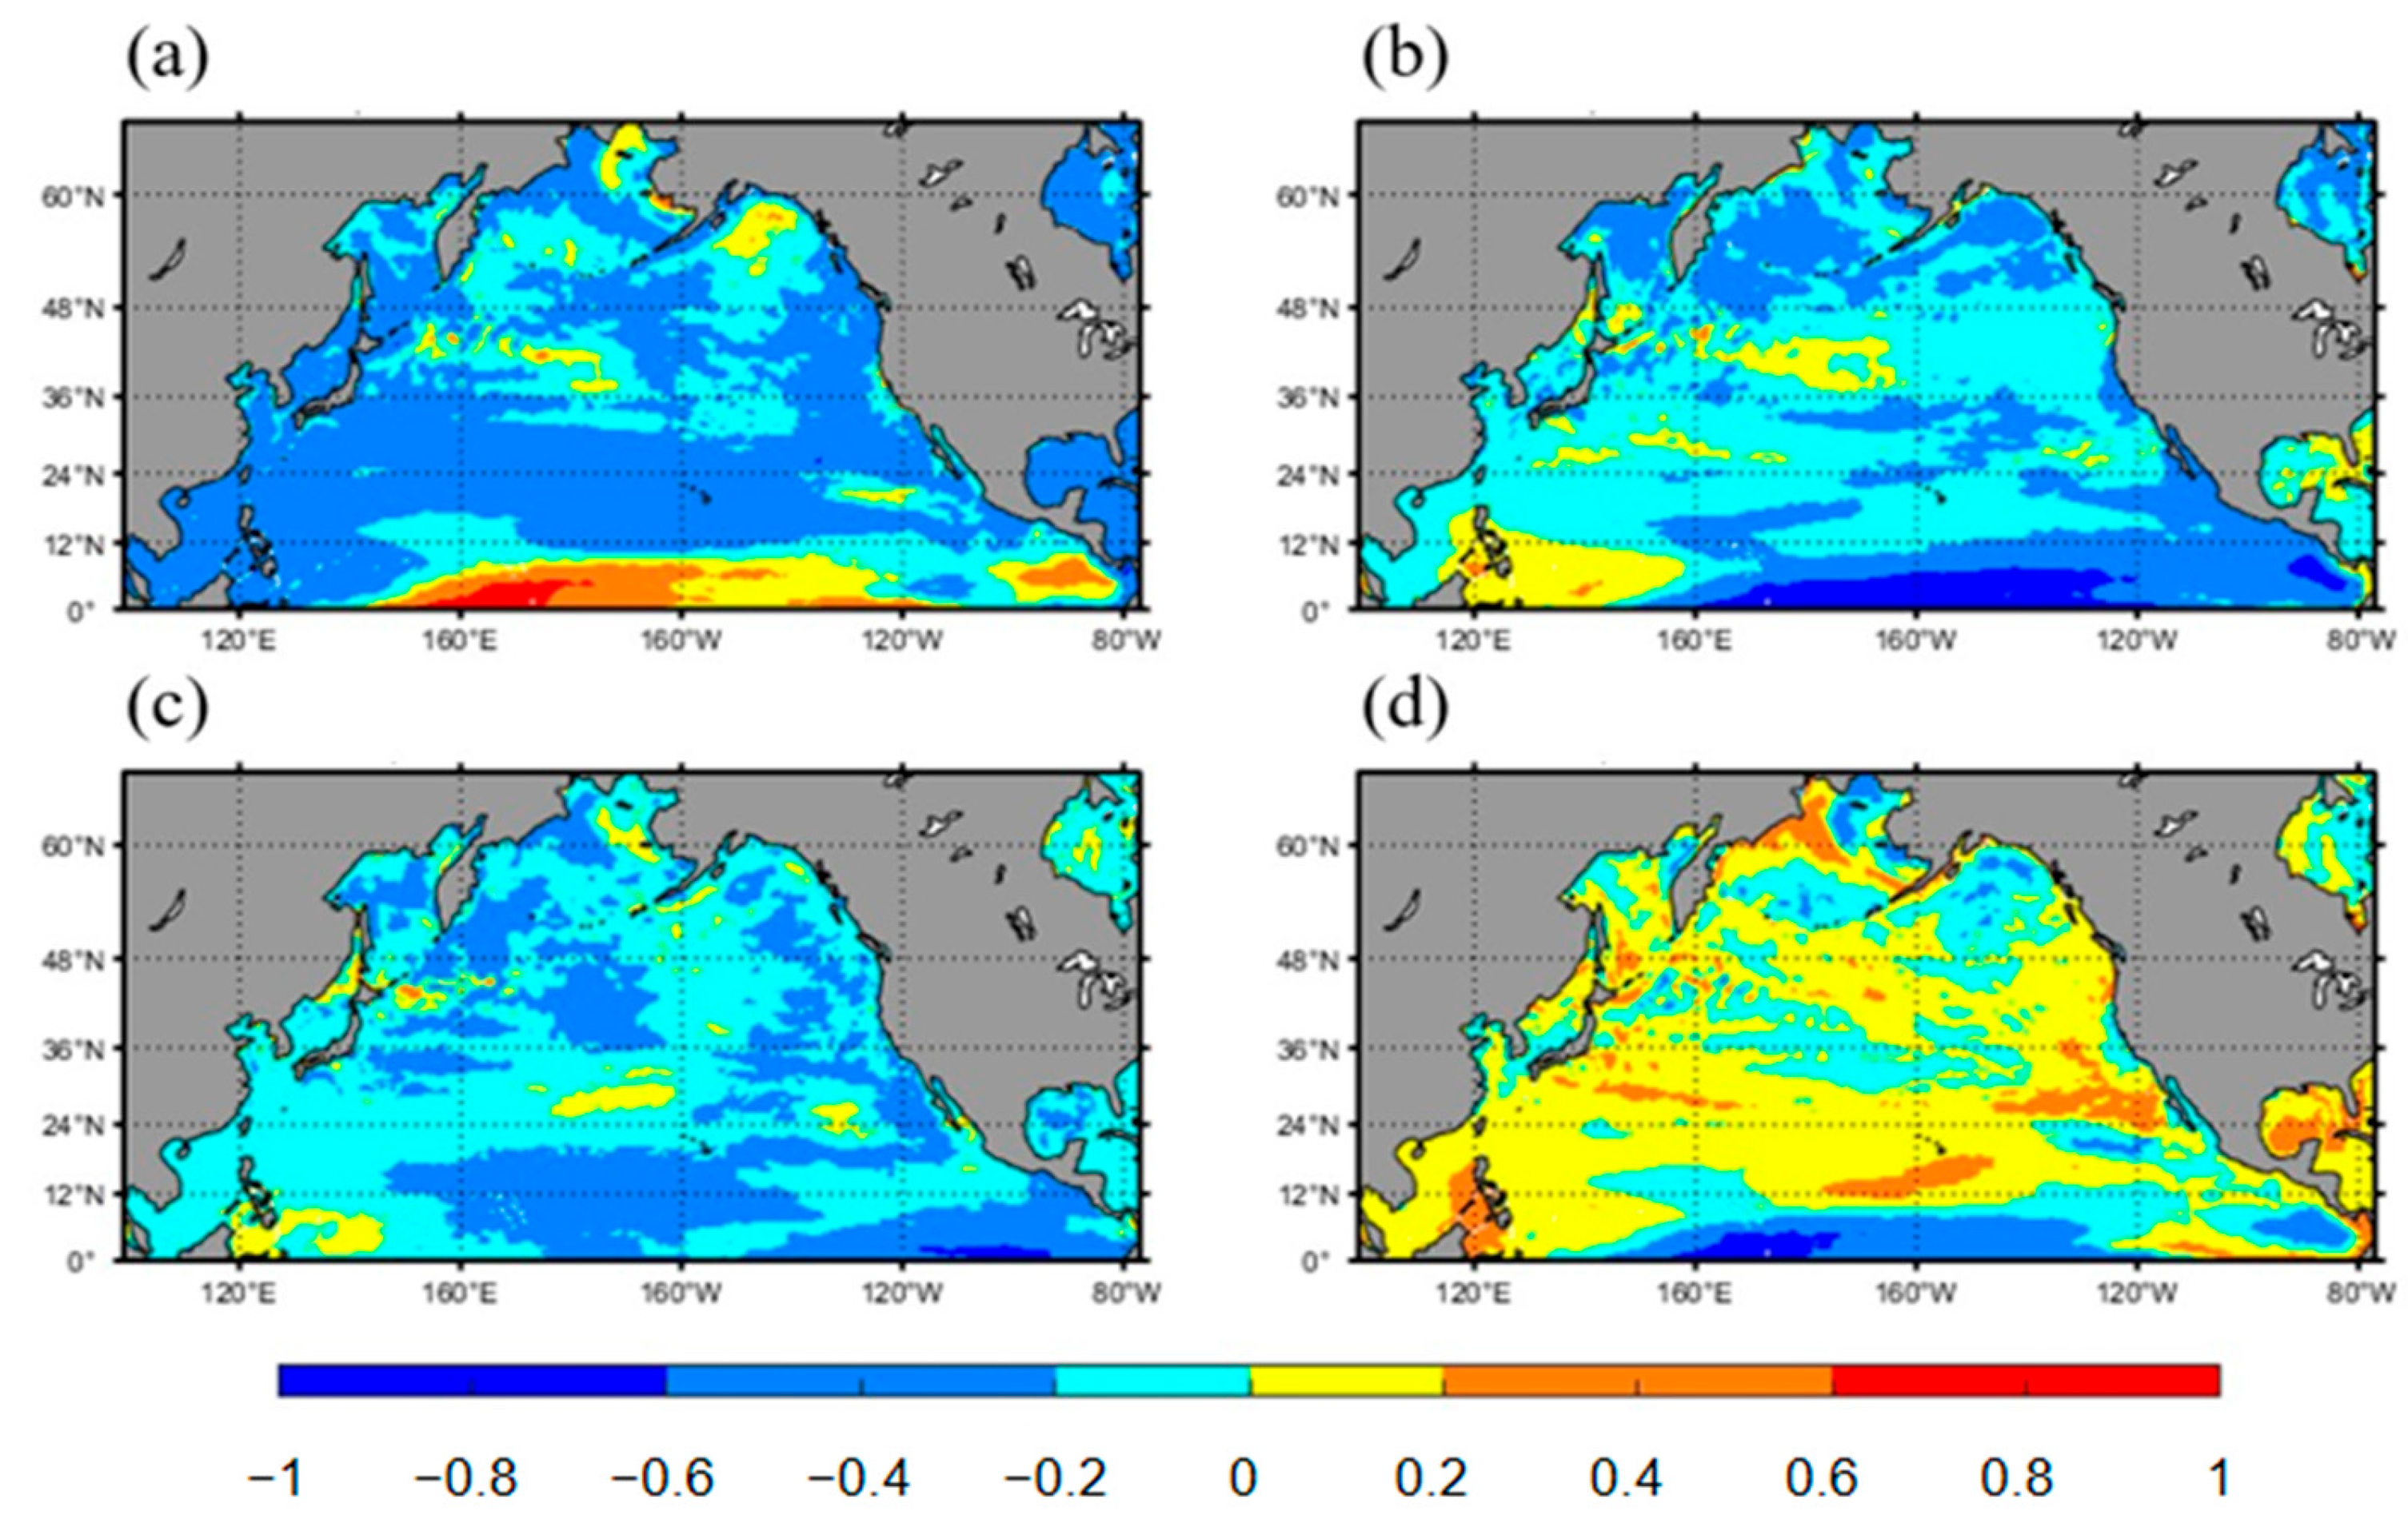
Beyond CO2 emissions, several environmental factors significantly impact surface water pH in the North Pacific. These include sea surface temperature (SST), salinity, chlorophyll-a concentration, and dissolved oxygen. The surface pH is negatively correlated with temperature, salinity, and chlorophyll-a concentration and positively correlated with dissolved oxygen. Among these factors, SST has the most pronounced effect on pH, followed by dissolved oxygen, salinity, and chlorophyll-a concentration.
(3)
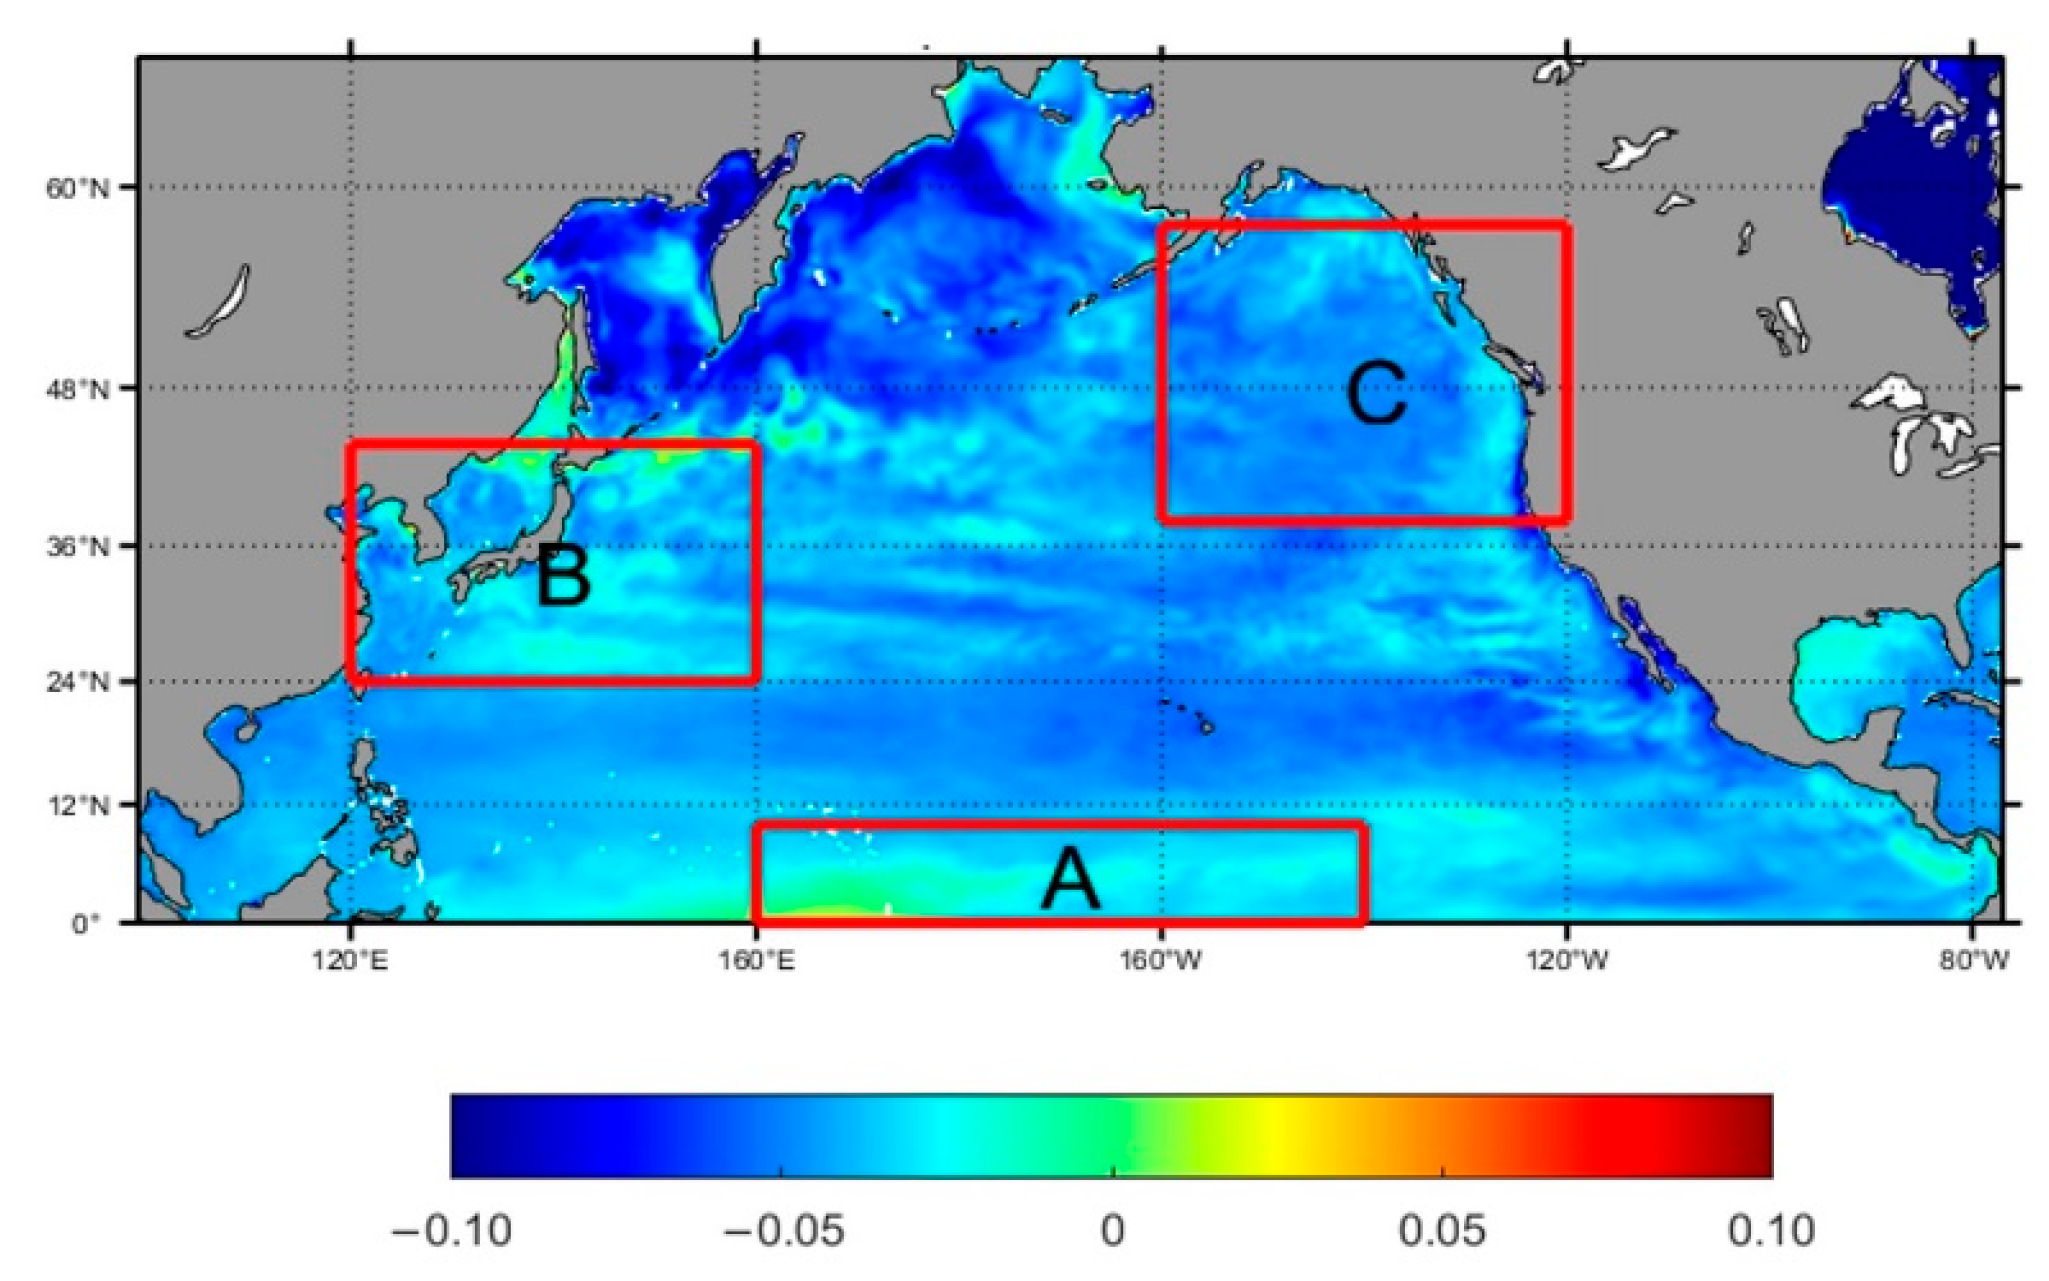
The acidification levels in regions A, B, and C exhibit distinct characteristics. Based on the EOF analysis results and the specific conditions of each sea area, it is found that the acidification in region A is primarily influenced by the El Niño phenomenon, showing a periodic downward trend. In Region B, coastal acidification is more severe due to upwelling or eutrophication. Furthermore, summer marine biological activities, such as coral reef systems and human activities, have exacerbated this effect. The stepped distribution of acidification in Region C is mainly influenced by the North Pacific Current and the Alaska Current.
(4)
The influence of these factors varies by region and over time. In Region A, chlorophyll-a and SST are the primary drivers of acidification, accounting for more than 70% of the changes when their interactions are considered. In Regions B and C, dissolved oxygen (DO) and salinity (SSS) are more influential, contributing approximately 90% and 50% of the acidification, respectively, when interactions are factored in.
These findings underscore the complexity of acidification processes and the need for region-specific management strategies to address the varying impacts of environmental factors on seawater pH. Moreover, understanding the dominant factors driving acidification in different regions can provide valuable insights for developing strategies to mitigate regional acidification and lay the groundwork for comprehensive ocean acidification management.

Author Contributions

X.W.: Methodology, Software, Writing—original draft preparation; J.W.: Validation, Supervision, Writing—review and editing; J.M.: Conceptualization, Writing—review and editing; J.L.: Supervision, Writing—review and editing. All authors have read and agreed to the published version of the manuscript.

Funding

This research received no external funding.

Data Availability Statement

The data presented in this study are available at https://marine.copernicus.eu/.

Conflicts of Interest

The authors declare no conflicts of interest.

References

  1. Hauri, C.; Gruber, N.; Plattner, G.K.; Alin, S.; Feely, R.A.; Hales, B.; Wheeler, P.A. Ocean acidification in the California current system. Oceanography 2009, 22, 60–71. [Google Scholar] [CrossRef]
  2. Watanabe, Y.W.; Li, B.F.; Yamasaki, R.; Yunoki, S.; Imai, K.; Hosoda, S.; Nakano, Y. Spatiotemporal changes of ocean carbon species in the western North Pacific using parameterization technique. J. Oceanogr. 2020, 76, 155–167. [Google Scholar] [CrossRef]
  3. Fujii, M.; Chai, F.; Shi, L.; Inoue, H.Y.; Ishii, M. Seasonal and interannual variability of oceanic carbon cycling in the western and central tropical-subtropical pacific: A physical-biogeochemical modeling study. J. Oceanogr. 2009, 65, 689–701. [Google Scholar] [CrossRef]
  4. Jiang, M.; Chai, F. Physical control on the seasonal cycle of surface pCO2 in the equatorial Pacific. Geophys. Res. Lett. 2006, 33, 265–288. [Google Scholar] [CrossRef]
  5. Gao, G.; Wang, T.; Sun, J.; Zhao, X.; Wang, L.; Guo, X.; Gao, K. Contrasting responses of phytoplankton productivity between coastal and offshore surface waters in the Taiwan Strait and the South China Sea to short-term seawater acidification. Biogeosciences 2022, 19, 2795–2804. [Google Scholar] [CrossRef]
  6. Xu, X.; Zhao, H.; Zang, K.; Zheng, N.; Huo, C.; Deng, X.; Wang, J. Contrasting effects of temperature and biological processes on aragonite saturation state at the A4HDYD station in the North Yellow Sea. Mar. Environ. Res. 2023, 192, 106187. [Google Scholar] [CrossRef]
  7. Dore, J.E.; Lukas, R.; Sadler, D.W.; Church, M.J.; Karl, D.M. Physical and biogeochemical modulation of ocean acidification in the central North Pacific. Proc. Natl. Acad. Sci. USA 2009, 106, 12235–12240. [Google Scholar] [CrossRef]
  8. Midorikawa, T.; Ishii, M.; Saito, S.; Sasano, D.; Kosugi, N.; Motoi, T.; Kamiya, H.; Nakadate, A.; Nemoto, K.; Inoue, H.Y. Decreasing pH trend estimated from 25-year time series of carbonate parameters in the western North Pacific. Tellus B Chem. Phys. Meteorol. 2010, 62, 649–659. [Google Scholar] [CrossRef]
  9. Takahashi, T.; Sutherland, S.C.; Chipman, D.W.; Goddard, J.G.; Ho, C.; Newberger, T.; Sweeney, C.; Munro, D.R. Climatological distributions of pH, pCO2, total CO2, alkalinity, and CaCO3 saturation in the global surface ocean, and temporal changes at selected locations. Mar. Chem. 2014, 164, 95–125. [Google Scholar] [CrossRef]
  10. Pelejero, C.; Calvo, E.; McCulloch, M.T.; Marshall, J.F.; Gagan, M.K.; Lough, J.M.; Opdyke, B.N. Preindustrial to modern interdecadal variability in coral reef pH. Science 2005, 309, 2204–2207. [Google Scholar] [CrossRef]
  11. Song, J.; Qu, B.; Li, X.; Yuan, H.; Li, N.; Duan, L. Carbon sinks/sources in the Yellow and East China Seas—Air-sea interface exchange, dissolution in seawater, and burial in sediments. Sci. China Earth Sci. 2018, 61, 1583–1593. [Google Scholar] [CrossRef]
  12. Zeebe, R.E. History of Seawater Carbonate Chemistry, atmospheric CO2, and Ocean Acidification. Annu. Rev. Earth Planet. Sci. 2012, 40, 141–165. [Google Scholar] [CrossRef]
  13. Kopáček, J.; Kaňa, J.; Bičárová, S.; Brahney, J.; Navrátil, T.; Norton, S.A.; Porcal, P.; Stuchlík, E. Climate change accelerates recovery of the Tatra Mountain lakes from acidification and increases their nutrient and chlorophyll a concentrations. Aquat. Sci. 2019, 81, 70. [Google Scholar] [CrossRef]
  14. Hao, Q. Temporal and Spatial Distribution Characteristics and Environmental Regulation Mechanism of Chlorophyll and Primary Productivity in Coastal China. Ph.D. Thesis, Ocean University of China, Qingdao, China, 2010. [Google Scholar]
  15. Guo, J. Evolution of Surface pH and pCO2 in the Western Tropical Pacific over the Past 150,000 Years and Their Influencing Factors. Master’s Thesis, Institute of Oceanography, Chinese Academy of Sciences, Qingdao, China, 2015. [Google Scholar]
  16. Chan, F.; Barth, J.A.; Blanchette, C.A.; Byrne, R.H.; Chavez, F.; Cheriton, O.; Feely, R.A.; Friederich, G.; Gaylord, B.; Gouhier, T.; et al. Persistent spatial structuring of coastal ocean acidification in the California Current System. Sci. Rep. 2017, 7, 2526. [Google Scholar] [CrossRef] [PubMed]
  17. Hudson, C.J.; Agostini, S.; Wada, S.; Hall-Spencer, J.M.; Connell, S.D.; Harvey, B.P. Ocean acidification increases the impact of typhoons on algal communities. Sci. Total Environ. 2023, 865, 161269. [Google Scholar] [CrossRef] [PubMed]
  18. Pitcher, G.C.; du Randt, A.; Seanego, K.G.; Tsanwani, M. Variability and controls of the ocean acidification metrics pH and pCO2 in a large embayment of an Eastern Boundary Upwelling System (EBUS). Estuar. Coast. Shelf Sci. 2023, 292, 108473. [Google Scholar] [CrossRef]
  19. George, R.; Job, S.; Semba, M.; Monga, E.; Lugendo, B.; Tuda, A.; Kimirei, I. High-frequency dynamics of pH, dissolved oxygen, and temperature in the coastal ecosystems of the Tanga-Pemba Seascape: Implications for upwelling-enhanced ocean acidification and deoxygenation. Front. Mar. Sci. 2024, 10, 1286870. [Google Scholar] [CrossRef]
  20. Sridevi, B.; Sarma, V.V.S.S. Role of river discharge and warming on ocean acidification and pCO2 levels in the Bay of Bengal. Tellus B Chem. Phys. Meteorol. 2021, 73, 1–20. [Google Scholar] [CrossRef]
  21. Monaco, C.L.; Metzl, N.; Fin, J.; Mignon, C.; Cuet, P.; Douville, E.; Gehlen, M.; Chau, T.T.T.; Tribollet, A. Distribution and long-term change of the sea surface carbonate system in the Mozambique Channel (1963–2019). Deep Sea Res. Part II Top. Stud. Oceanogr. 2021, 186, 104936. [Google Scholar] [CrossRef]
  22. Lorenz, E.N. Empirical Orthogonal Functions and Statistical Weather Prediction; Sci. Rep. No. 1, Statistical Forecasting Project; M.I.T.: Cambridge, MA, USA, 1956; Volume 48. [Google Scholar]
  23. Wang, J.; Xu, C. GeoDetectors: Principles and Prospects. Acta Geogr. Sin. 2017, 72, 116–134. [Google Scholar]
  24. Wang, J.; Zhu, S.; Liu, J.; Wang, X.; Wang, J.; Xu, J.; Yao, P.; Yang, Y. Frequency, Intensity and Influences of Tropical Cyclones in the Northwest Pacific and China, 1977–2018. Sustainability 2023, 15, 3933. [Google Scholar] [CrossRef]
  25. Haugan, P.M.; Drange, H. Effects of CO2 on the ocean environment. Energy Convers. Manag. 1996, 37, 1019–1022. [Google Scholar] [CrossRef]
  26. Feely, R.A.; Doney, S.C.; Cooley, S.R. Ocean acidification: Present conditions and future changes in a high-CO2 world. Oceanography 2009, 22, 36–47. [Google Scholar] [CrossRef]
  27. Jiang, L.-Q.; Carter, B.R.; Feely, R.A.; Lauvset, S.K.; Olsen, A. Surface ocean pH and buffer capacity: Past, present and future. Sci. Rep. 2019, 9, 18624. [Google Scholar] [CrossRef]
  28. Long, A.; Chen, S.; Zhou, W.; Xu, J.; Sun, C.; Zhang, F.; Zhang, J.; Xu, H. Distribution characteristics and correlation between nutrients, dissolved oxygen, pH value and chlorophyll in autumn in northern South China Sea. Mar. Sci. Technol. Bull. 2006, 25, 9–16. [Google Scholar]
  29. González-Dávila, M.; Santana-Casiano, J.M.; Rueda, M.-J.; Llinás, O.; González-Dávila, E.-F. Seasonal and interannual variability of sea-surface carbon dioxide species at the European Station for Time Series in the Ocean at the Canary Islands (ESTOC) between 1996 and 2000. Glob. Biogeochem. Cycles 2003, 17, 1076. [Google Scholar] [CrossRef]
  30. Raven, J.; Caldeira, K.; Elderfield, H.; Hoegh-Guldberg, O.; Liss, P.; Riebesell, U.; Shepherd, J.; Turley, C.; Watson, A.; Heap, R.; et al. Ocean Acidification Due to Increasing Atmospheric Carbon Dioxide; The Royal Society: London, UK, 2005. [Google Scholar]
  31. Nakano, Y.; Watanabe, Y.W. Reconstruction of pH in the surface seawater over the North Pacific basin for all seasons using temperature and chlorophyll-a. J. Oceanogr. 2005, 61, 673–680. [Google Scholar] [CrossRef]
  32. Li, F. Distribution characteristics and influencing factors of seawater pH in the adjacent sea area of the Yellow River Estuary in August 1985. Mar. Limnol. Bull. 1988, 4, 35–40. [Google Scholar]
  33. Ke, D. Interannual Variation of pH Value in the South China Sea and Its Relationship with Temperature and Salt. Mar. Sci. Technol. Bull. 1990, 9, 23–27. [Google Scholar]
  34. Liu, X.; Sun, D.; Huang, B.; Wang, J. Study on surface sea acidification trend and influencing factors in coastal waters of the East China Sea. Ocean. Limnol. 2017, 48, 398–405. [Google Scholar]
  35. Xiao, J. Study on Ocean Acidification in the Chukchi Sea and the Nordic Sea. Master’s Thesis, Third Institute of Oceanography, State Oceanic Administration, Xiamen, China, 2015. [Google Scholar]
  36. Björk, M.M.; Fransson, A.; Torstensson, A.; Chierici, M. Ocean acidification state in western Antarctic surface waters: Controls and interannual variability. Biogeosciences 2014, 11, 57–73. [Google Scholar] [CrossRef]
  37. Krumhardt, K.M.; Lovenduski, N.S.; Long, M.C.; Levy, M.; Lindsay, K.; Moore, J.K.; Nissen, C. Coccolithophore growth and calcification in an acidified ocean: Insights from community Earth system model simulations. J. Adv. Model. Earth Syst. 2019, 11, 1418–1437. [Google Scholar] [CrossRef]
  38. Li, J.; Chai, G.; Xiao, Y.; Li, Z. The impacts of ocean acidification, warming and their interactive effects on coral prokaryotic symbionts. Environ. Microbiome 2023, 18, 49. [Google Scholar] [CrossRef] [PubMed]
  39. Williams, J.; Pettorelli, N.; Hartmann, A.C.; Quinn, R.A.; Plaisance, L.; O’Mahoney, M.; Meyer, C.P.; Fabricius, K.E.; Knowlton, N.; Ransome, E. Decline of a distinct coral reef holobiont community under ocean acidification. Microbiome 2024, 12, 75. [Google Scholar] [CrossRef] [PubMed]
  40. Cabral-Tena, R.A.; López-Pérez, A.; Reyes-Bonilla, H.; Calderon-Aguilera, L.E.; Orión, M.-L.; Zaragoza, F.A.R.; Cupul-Magaña, A.L.; Rodríguez-Troncoso, A.P.; Ayala-Bocos, A. Calcification of coral assemblages in the eastern Pacific: Reshuffling calcification scenarios under climate change. Ecol. Indic. 2018, 95, 726–734. [Google Scholar] [CrossRef]
  41. Trotter, J.; Montagna, P.; McCulloch, M.; Silenzi, S.; Reynaud, S.; Mortimer, G.; Martin, S.; Ferrier-Pagès, C.; Gattuso, J.-P.; Rodolfo-Metalpa, R. Quantifying the pH ‘vital effect’ in the temperate zooxanthellate coral Cladocora caespitosa: Validation of the boron seawater pH proxy. Earth Planet. Sci. Lett. 2011, 303, 163–173. [Google Scholar] [CrossRef]
  42. Sun, J.-Z.; Zhang, D.; Yi, X.; Beardall, J.; Gao, K. Ocean deoxygenation dampens resistance of diatoms to ocean acidification in darkness. Front. Mar. Sci. 2024, 11, 1387552. [Google Scholar] [CrossRef]
Figure 1. (a) Interannual variation and (b) Seasonal variation of surface water pH in the North Pacific Ocean.
Water 16 02705 g001
Figure 2. Spatial distribution of pH values of surface waters in the North Pacific.
Water 16 02705 g002
Figure 3. Spatial distribution of correlation coefficients of influencing factors for surface seawater pH in the North Pacific (Quarterly) ((a) pH and SST; (b) pH and SSS; (c) pH and chl a; (d) pH and DO).
Water 16 02705 g003
Figure 4. Spatial distribution of correlation coefficients of influencing factors for surface seawater pH in the North Pacific (Annual) ((a) pH and SST; (b) pH and SSS; (c) pH and chl a; (d) pH and DO).
Water 16 02705 g004
Figure 5. Typical marine area zoning.
Water 16 02705 g005
Figure 6. Spatial distribution and time series of eigenvectors for the first and second modes of EOF in A region.
Water 16 02705 g006
Figure 7. Spatial distribution and time series of eigenvectors for the first and second modes of EOF in B region.
Water 16 02705 g007aWater 16 02705 g007b
Figure 8. Spatial distribution and time series of eigenvectors for the first and second modes of EOF in C region.
Water 16 02705 g008
Figure 9. Correlation coefficient plots between pH and various environmental factors in areas A, B, and C which were subdivided into 5° × 5° grid cells, with the northwest corner of each region designated as zone 1 and subsequent zones numbered sequentially from north to south.
Water 16 02705 g009
Figure 10. Geodetector results for pH and various environmental factors in areas A, B, and C.
Water 16 02705 g010
Table 1. Accuracy evaluation of each parameter of the data source.
ParameterCorrelation CoefficientDeviationMeasured Average-Simulated AverageRMSE
pH0.950.02/0.04
DO/(µmol·L−1)0.967.44/16.61
chl a/(µg·L−1)0.81//0.59
SST/°C//0.040.45
SSS/‰//−0.0020.06
Table 2. Types of interaction detectors.
FactorBasis for JudgmentInteractions
X1, X2q(X1 ∩ X2) < Min(q(X1), q(X2))Nonlinear weakening
X1, X2Min(q(X1), q(X2)) < q(X1 ∩ X2) < Max(q(X1), q(X2))Single-factor nonlinearity weakens
X1, X2q(X1 ∩ X2) > Max(q(X1), q(X2))Two-factor enhancement
X1, X2
X1, X2
q(X1 ∩ X2) = q(X1) + q(X2)
q(X1 ∩ X2) > q(X1) + q(X2)
Independent
Nonlinear enhancement
Table 3. Correlation analysis between pH value of surface seawater and environmental factors.
Environmental
Factors
Correlation CoefficientDispersion
YearSpringSummerAutumnWinterYearSpringSummerAutumnWinter
SST−0.721 **−0.658 **−0.714 **−0.699 **−0.702 **0.0110.0100.0110.0120.010
SSS−0.425 *−0.267 *−0.412 *−0.589 *−0.401 *0.0040.0010.0010.0010.001
chl a−0.328−0.448 *−0.344−0.167−0.1740.0300.0370.0700.0370.021
DO0.655 **0.3470.652 **0.601 **0.709 **0.0010.0040.0050.0040.004
NOTE: * p < 0.05, ** p < 0.01.
Disclaimer/Publisher’s Note: The statements, opinions and data contained in all publications are solely those of the individual author(s) and contributor(s) and not of MDPI and/or the editor(s). MDPI and/or the editor(s) disclaim responsibility for any injury to people or property resulting from any ideas, methods, instructions or products referred to in the content.

