Status, Sources, and Risks of Heavy Metals in Surface Sediments of Baiyangdian Lake and Inflow Rivers, North China
Abstract
1. Introduction
2. Study Area
3. Materials and Methods
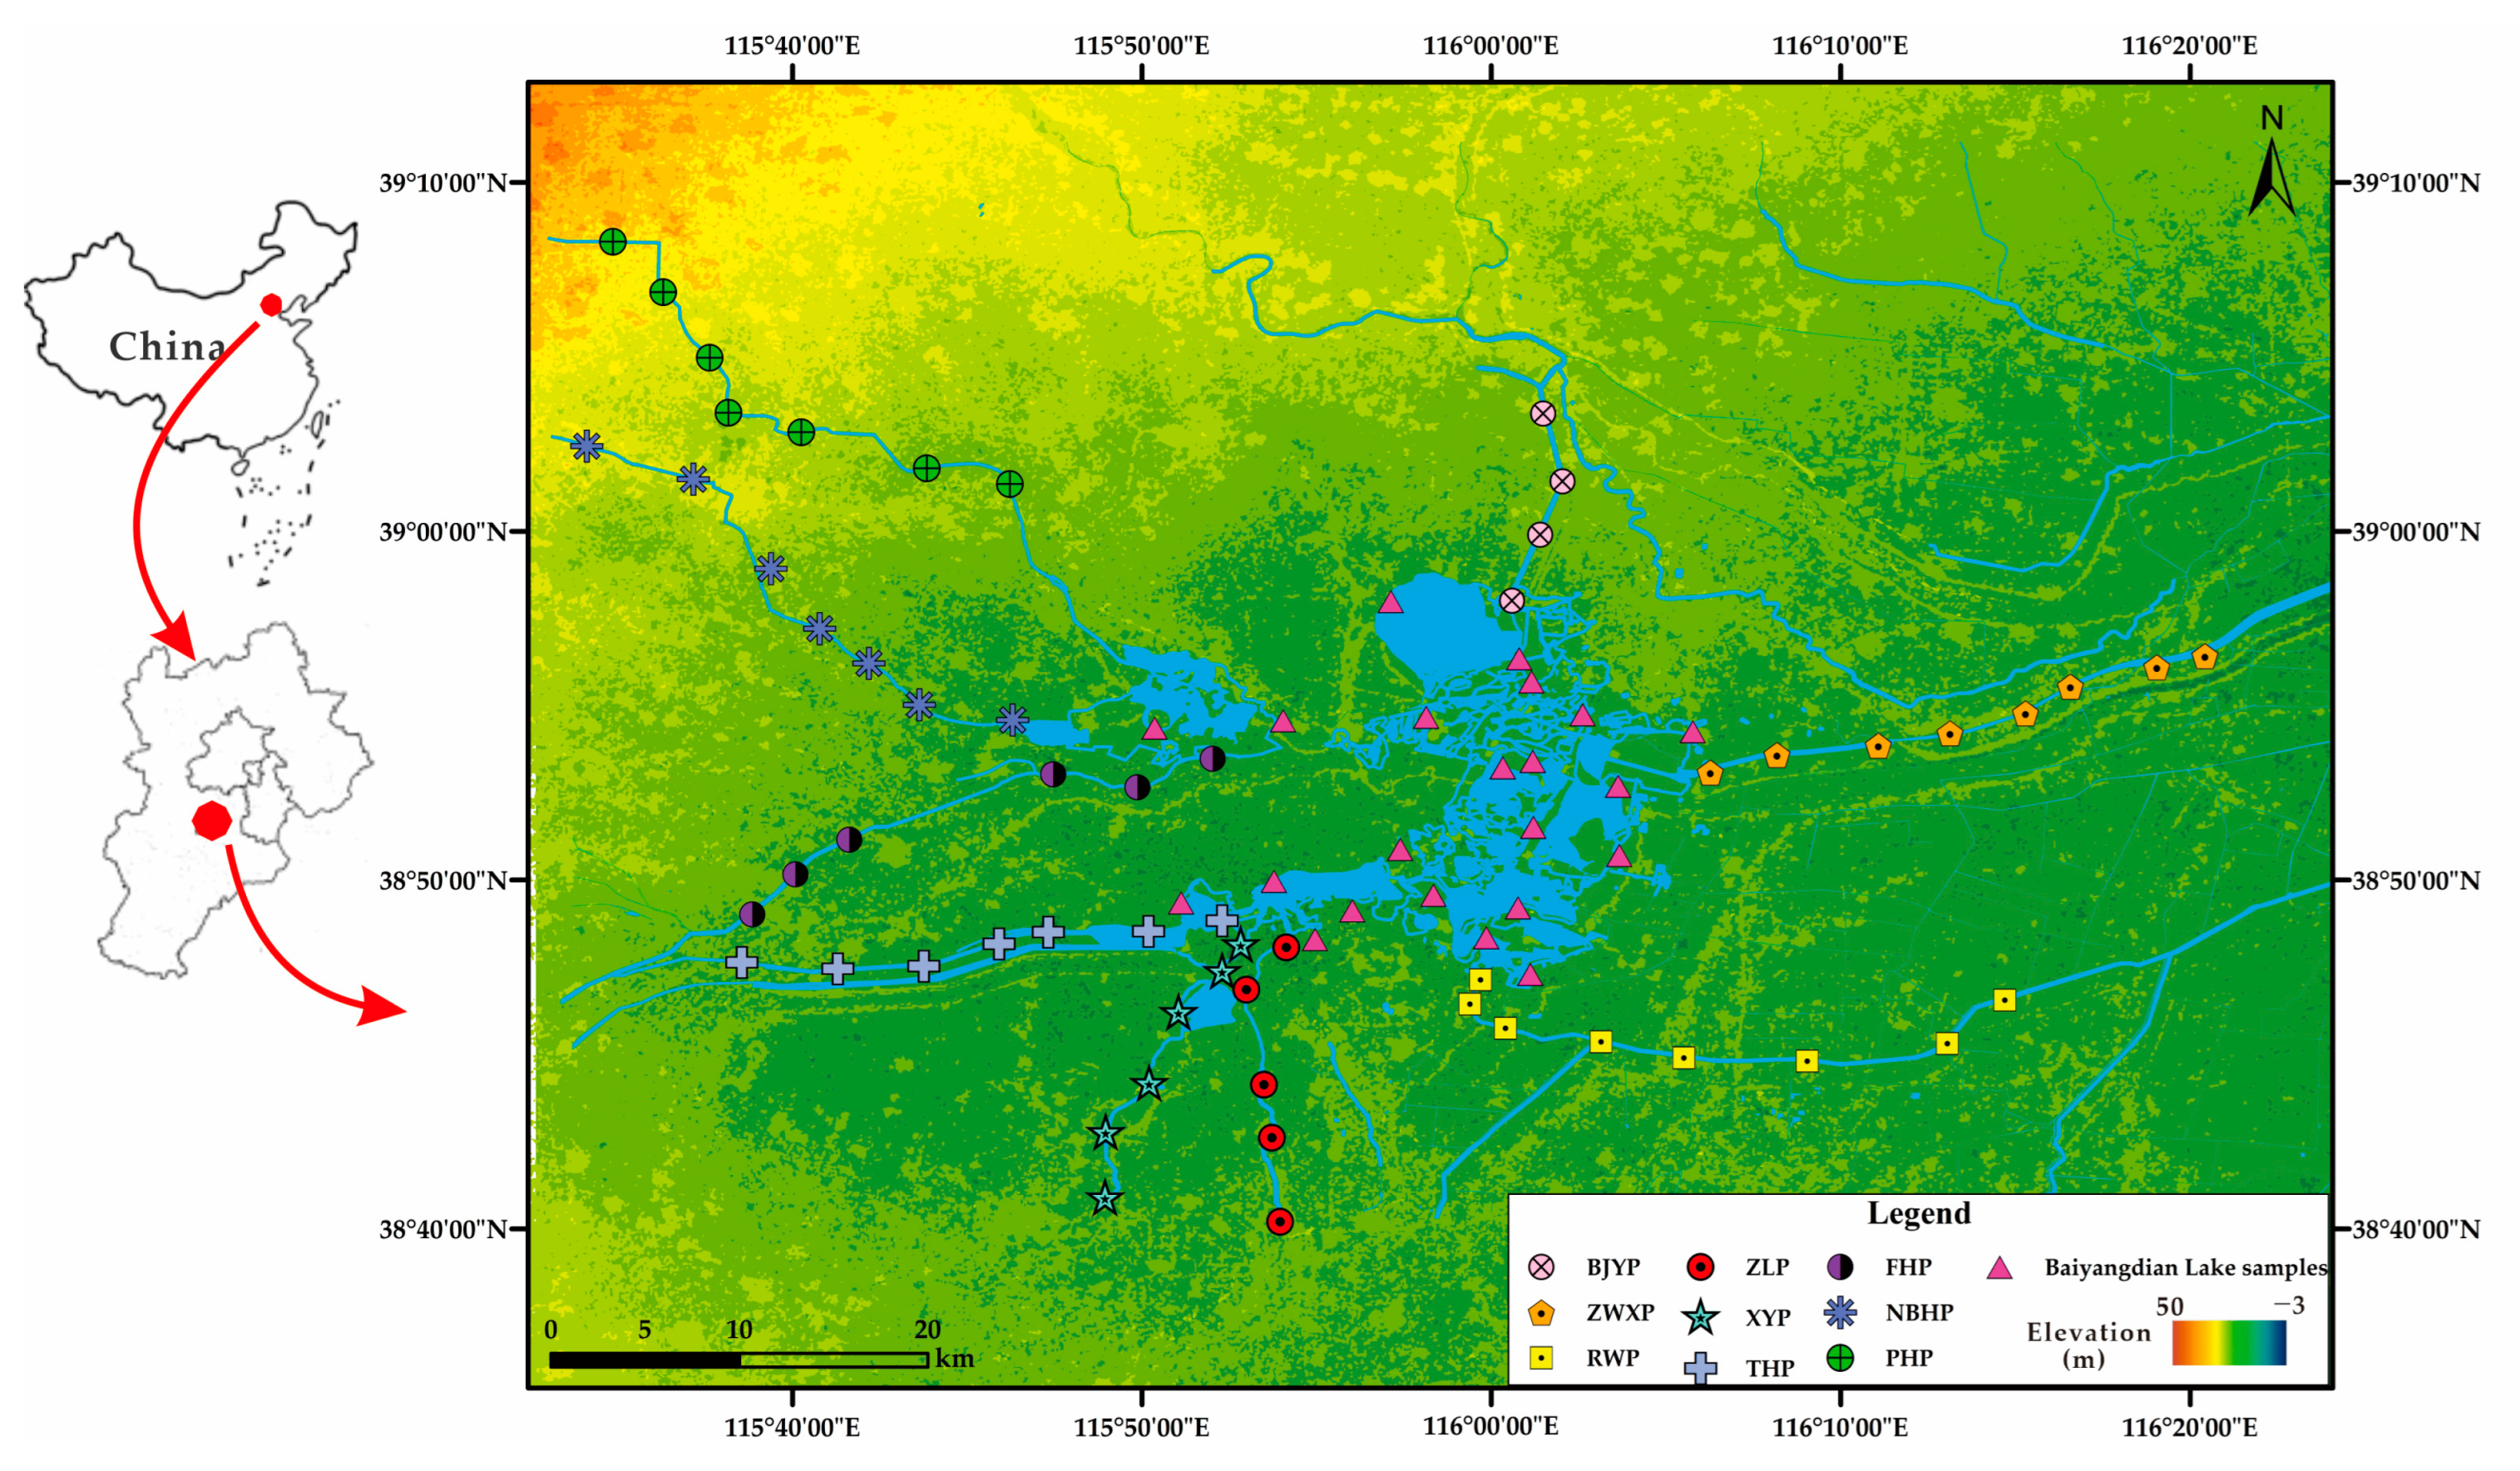
3.1. Sampling and Analysis
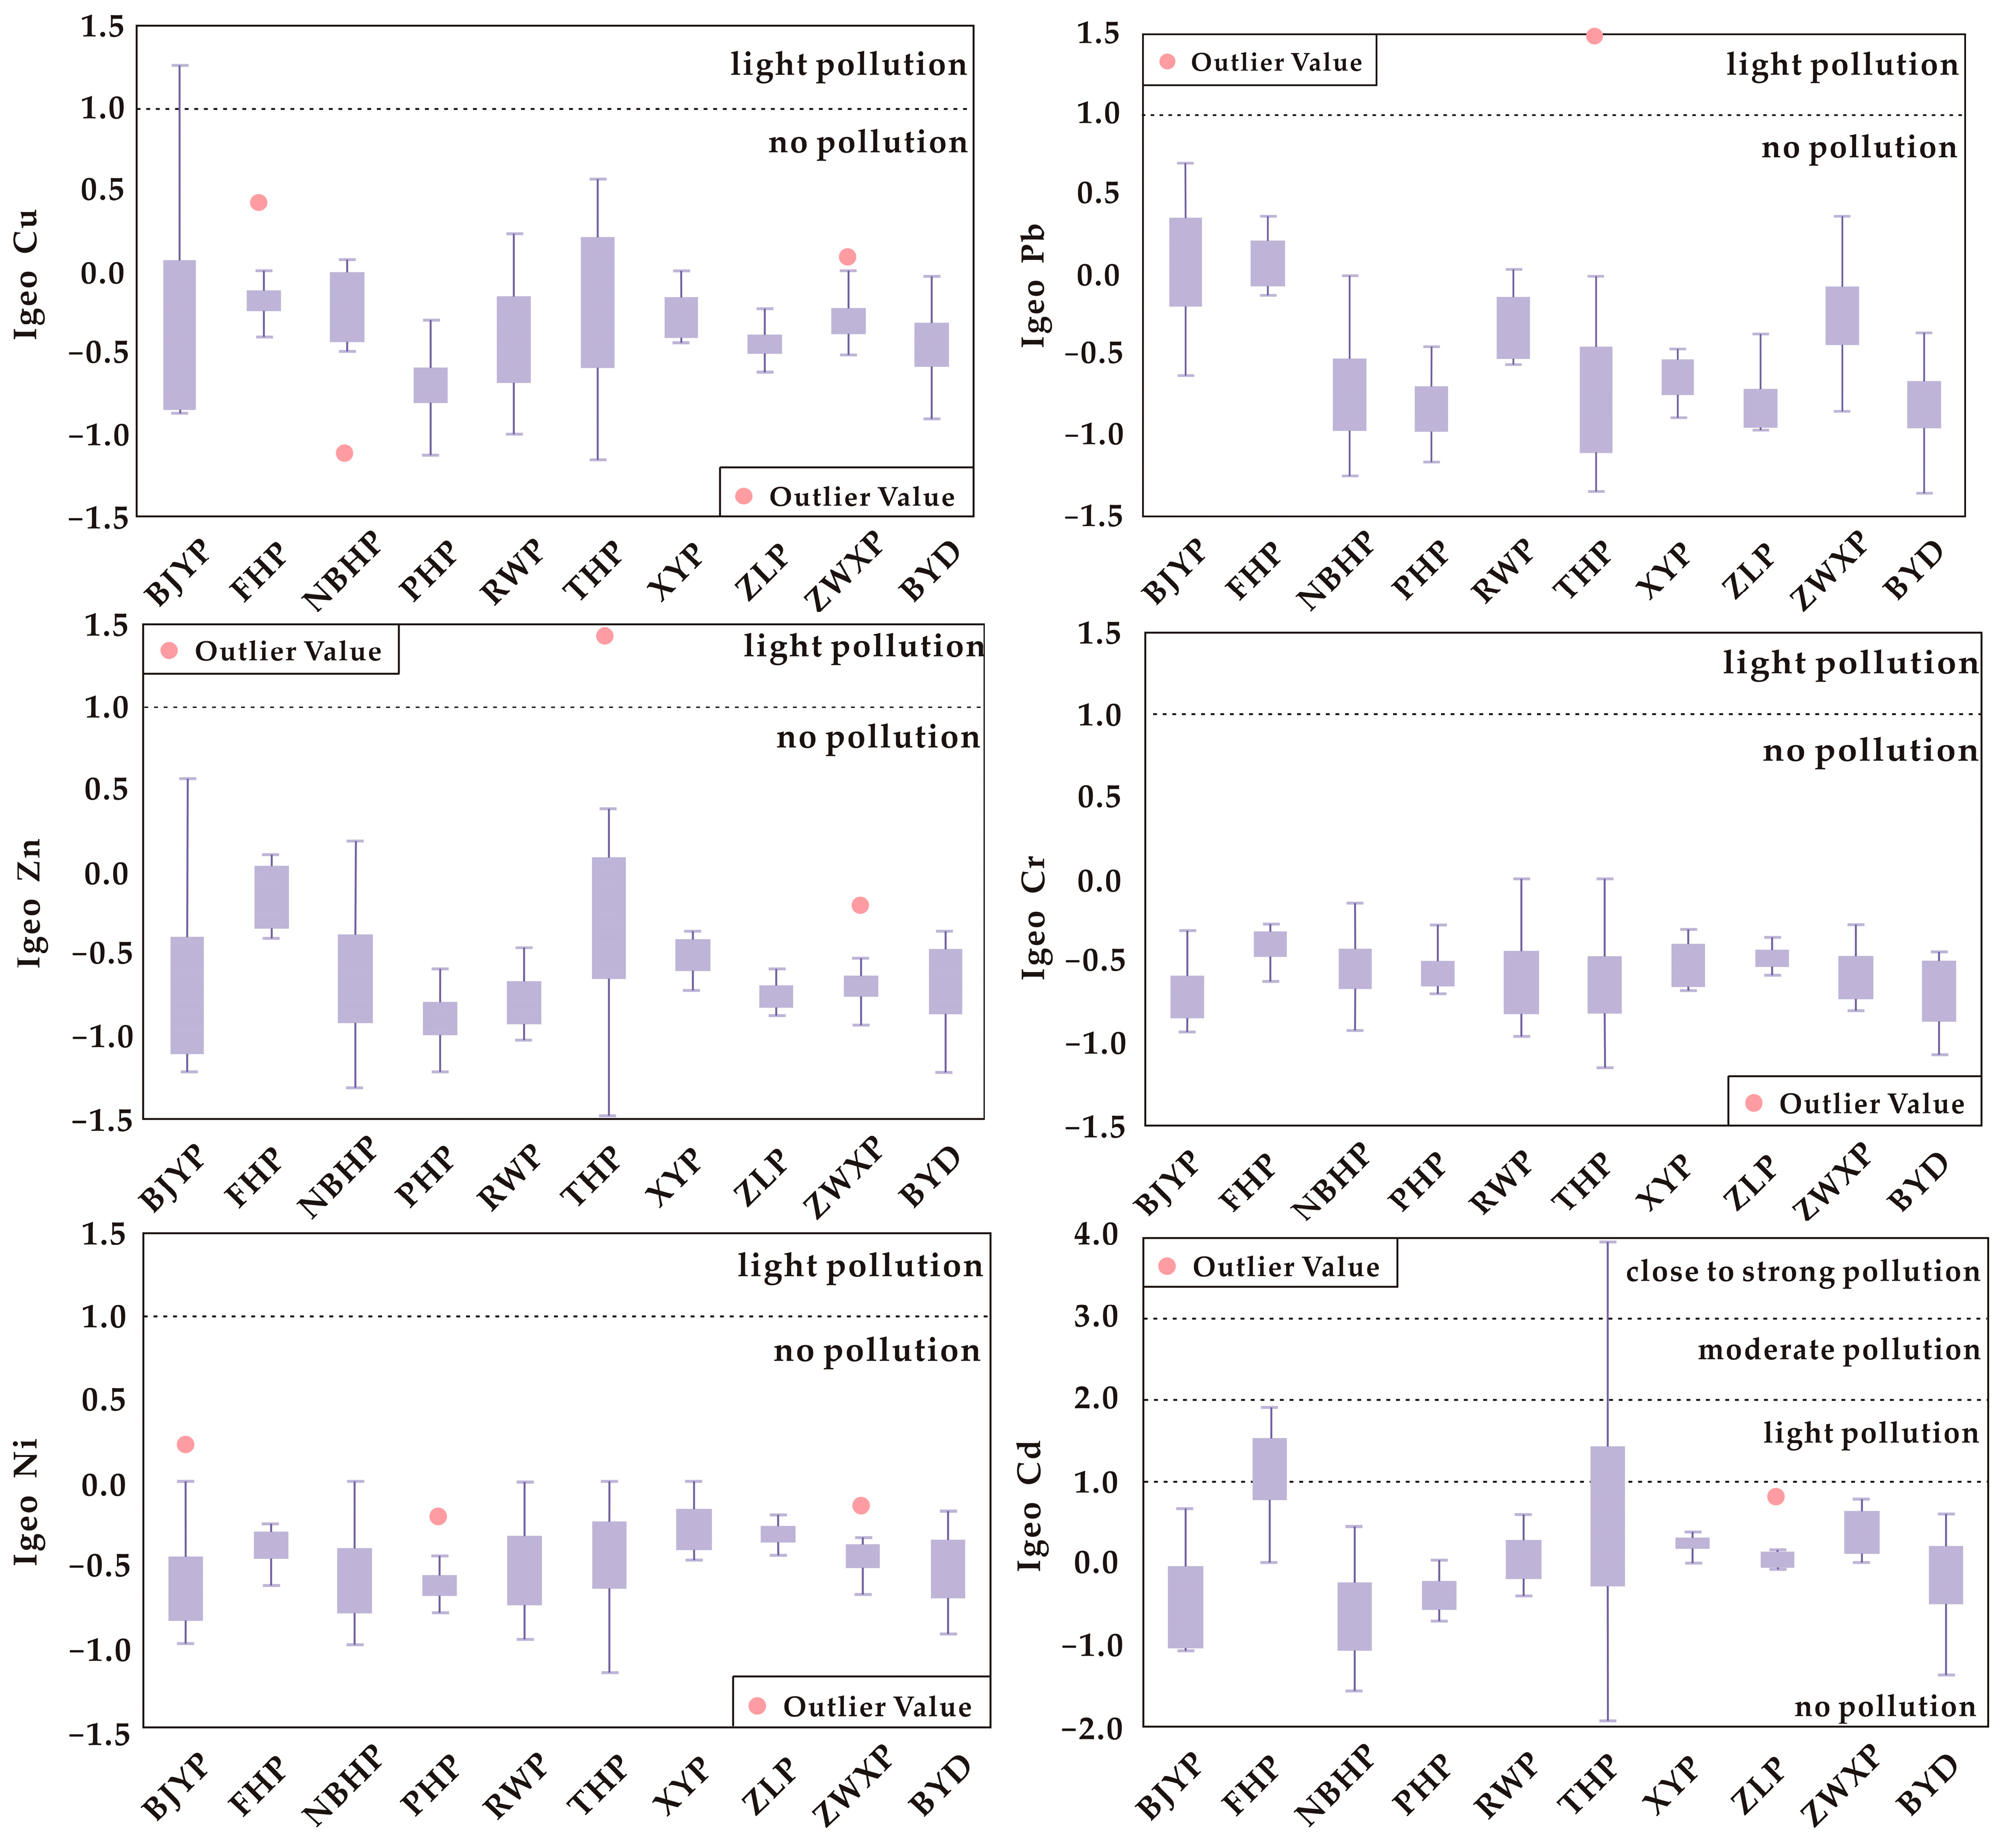
3.2. Pollution Levels of Heavy Metals
3.3. Pollution Sources of Heavy Metals
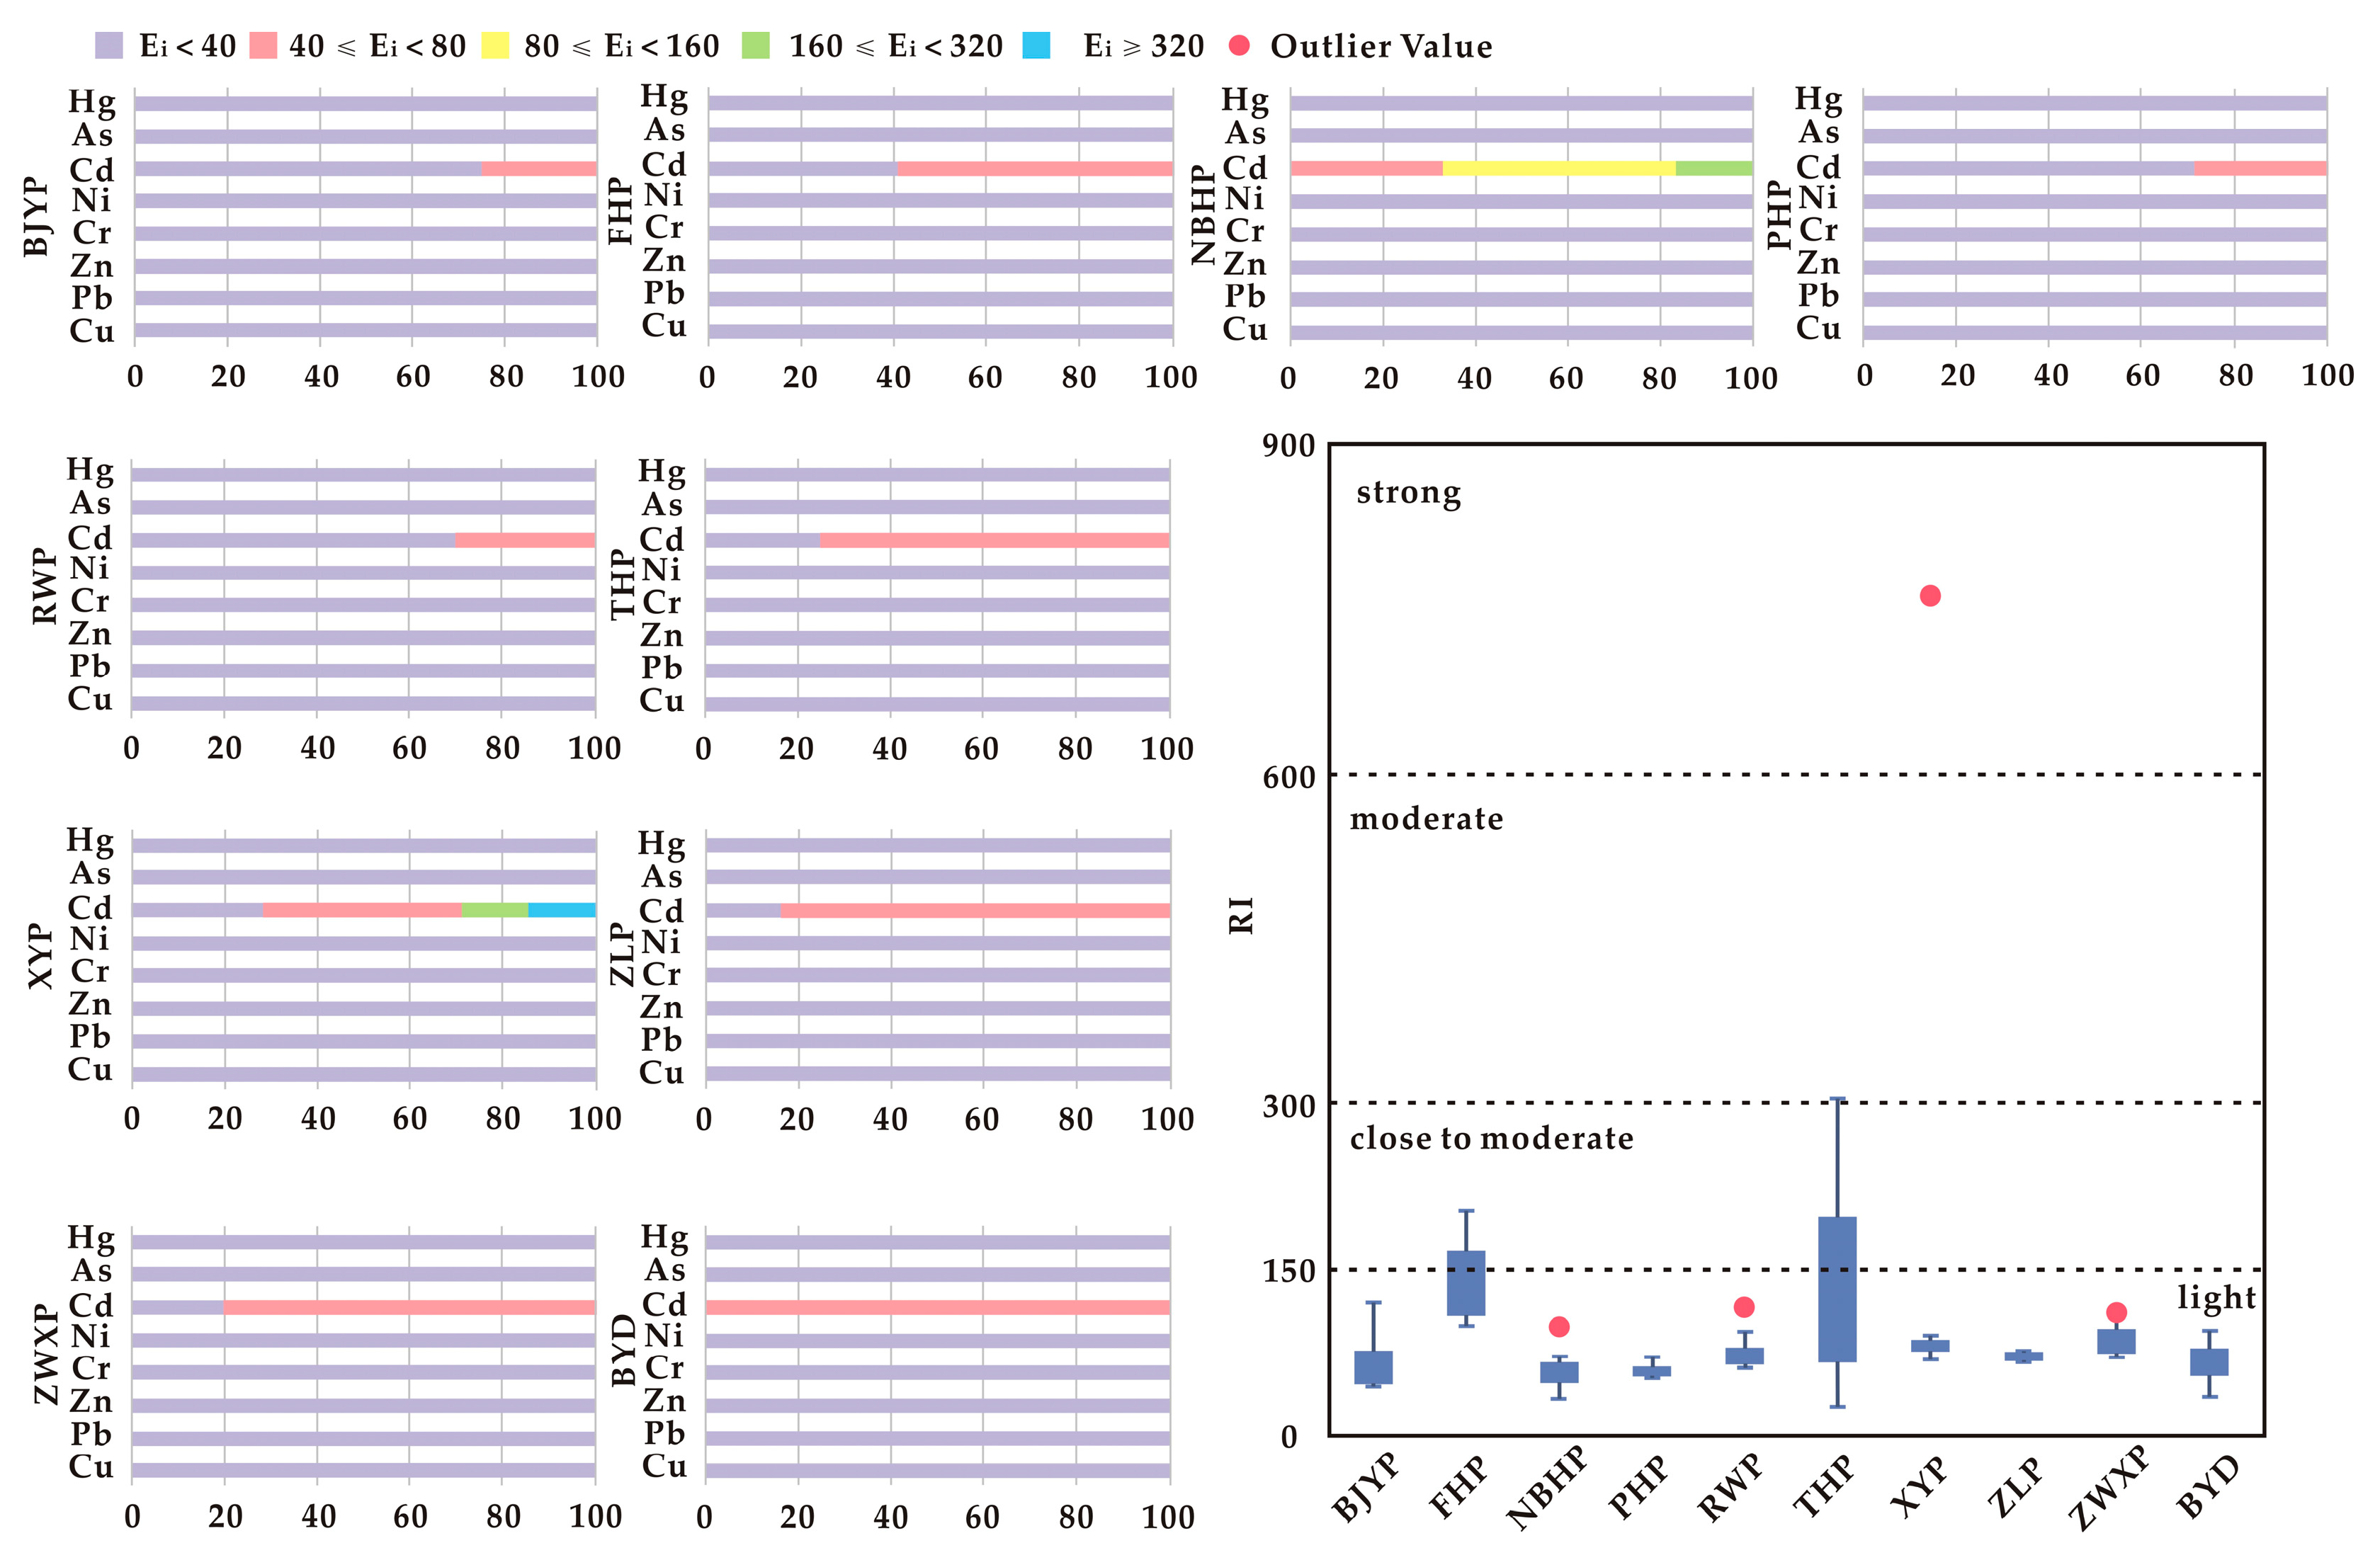
3.4. Potential Ecological Risks of Heavy Metals Pollution
3.4.1. Comprehensive Ecological Risk Index (RI)
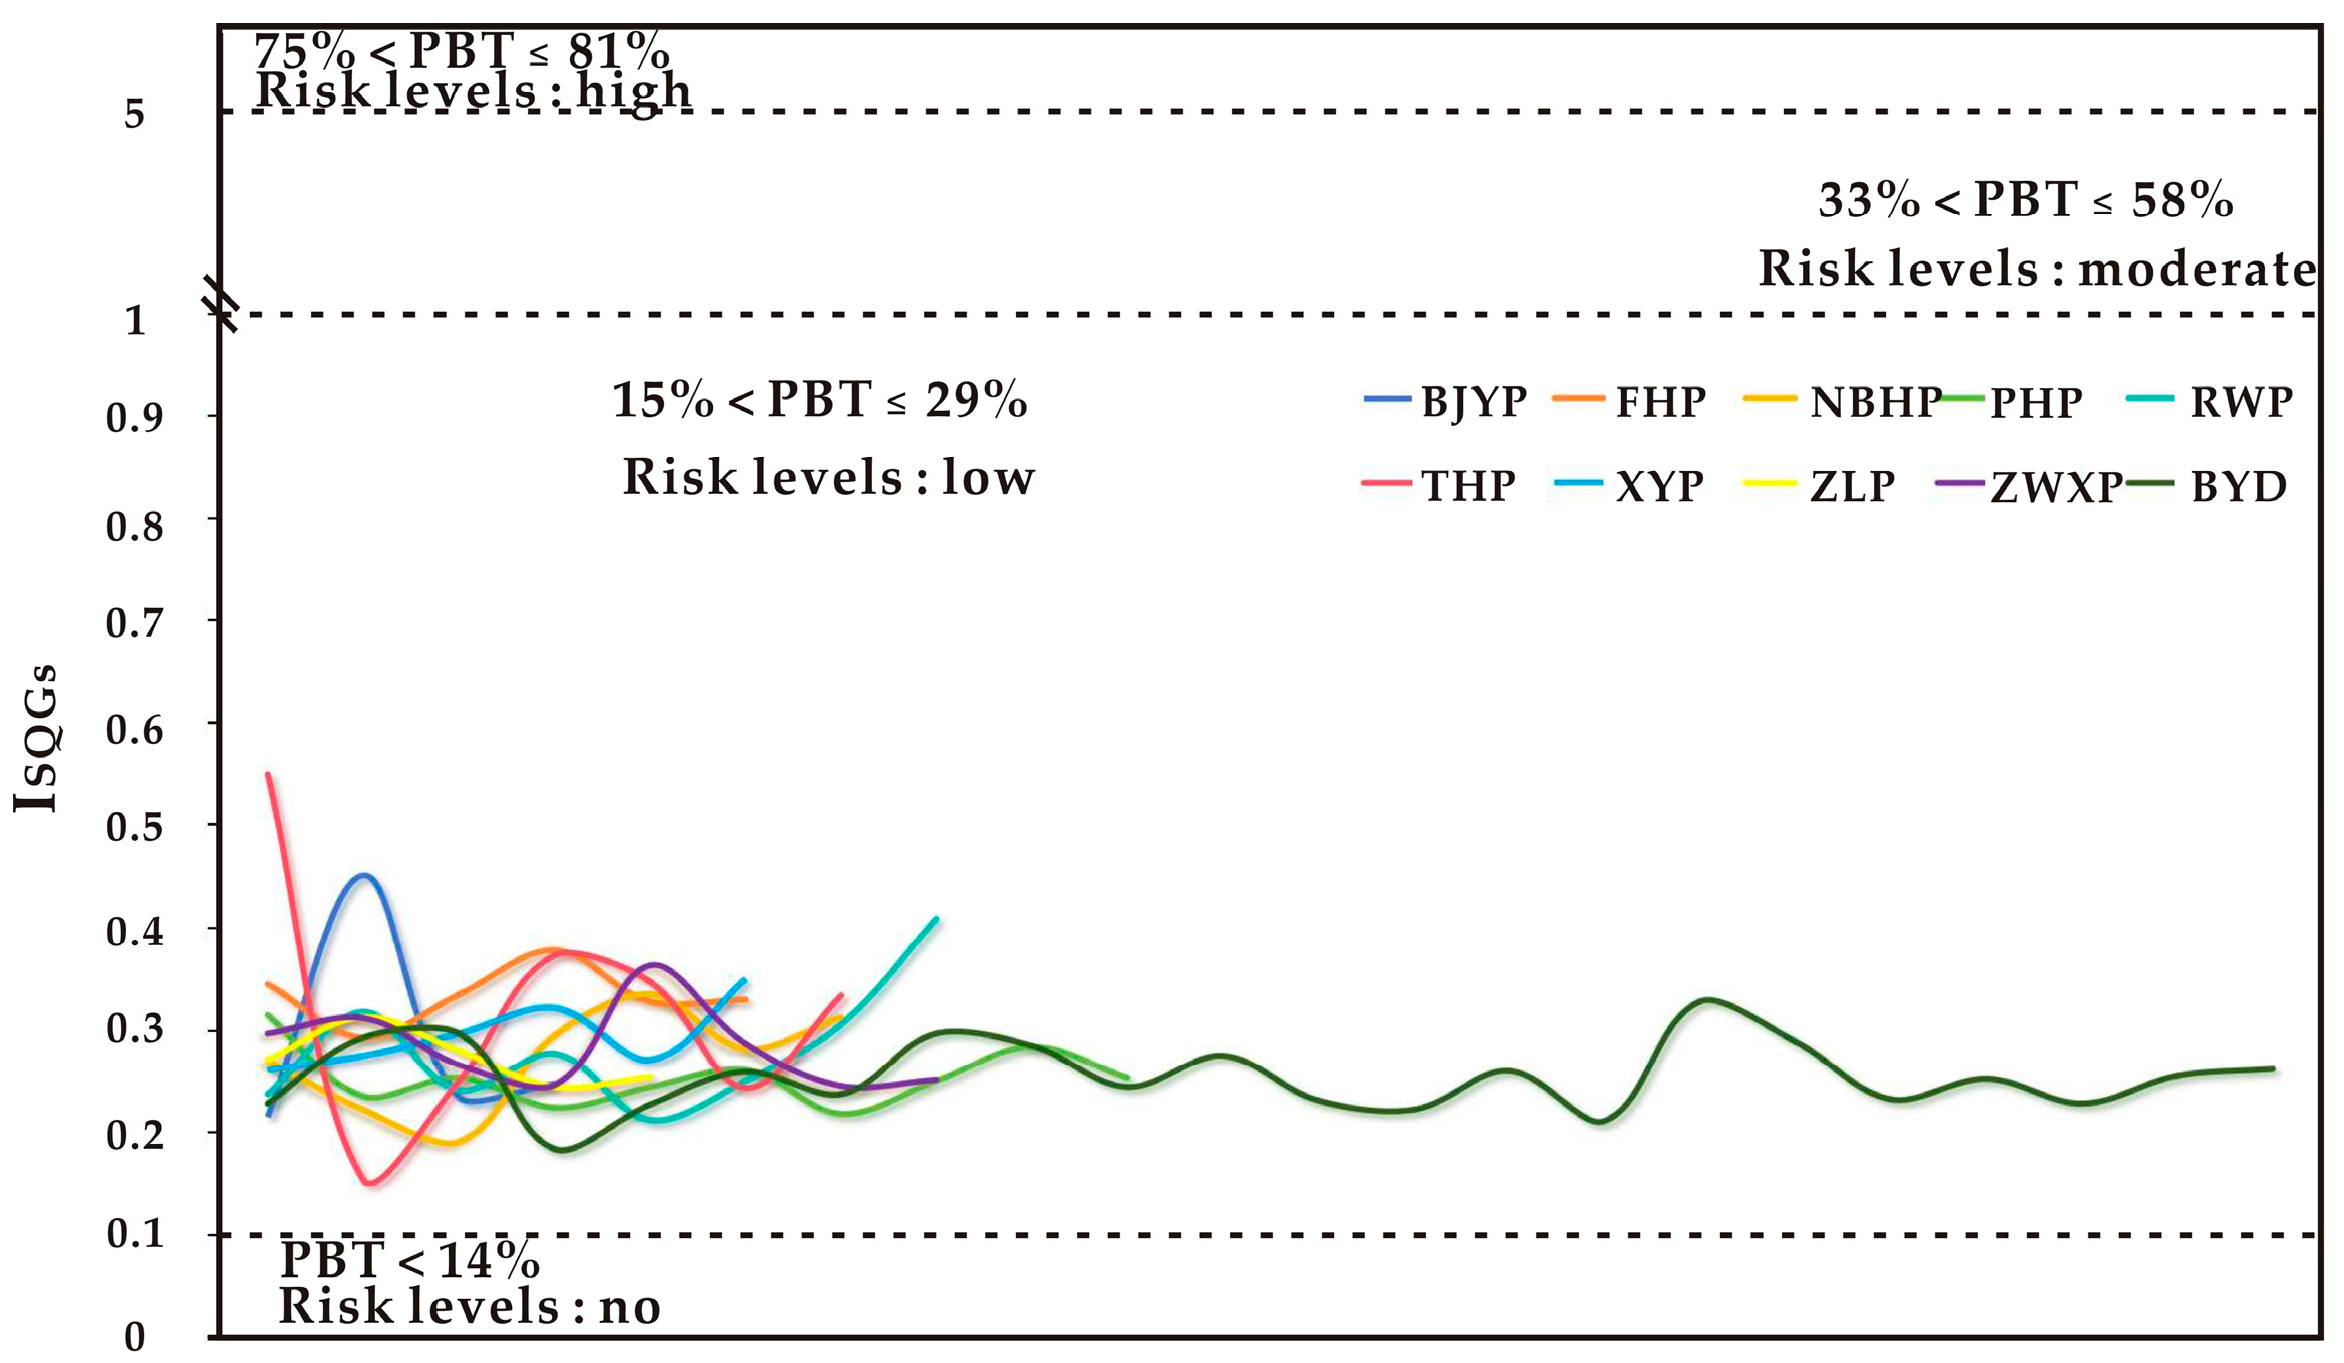
3.4.2. Sediment Quality Guidelines (SQGs)
| Cu | Zn | Pb | Cr | Cd | As | Ni | Hg | |
|---|---|---|---|---|---|---|---|---|
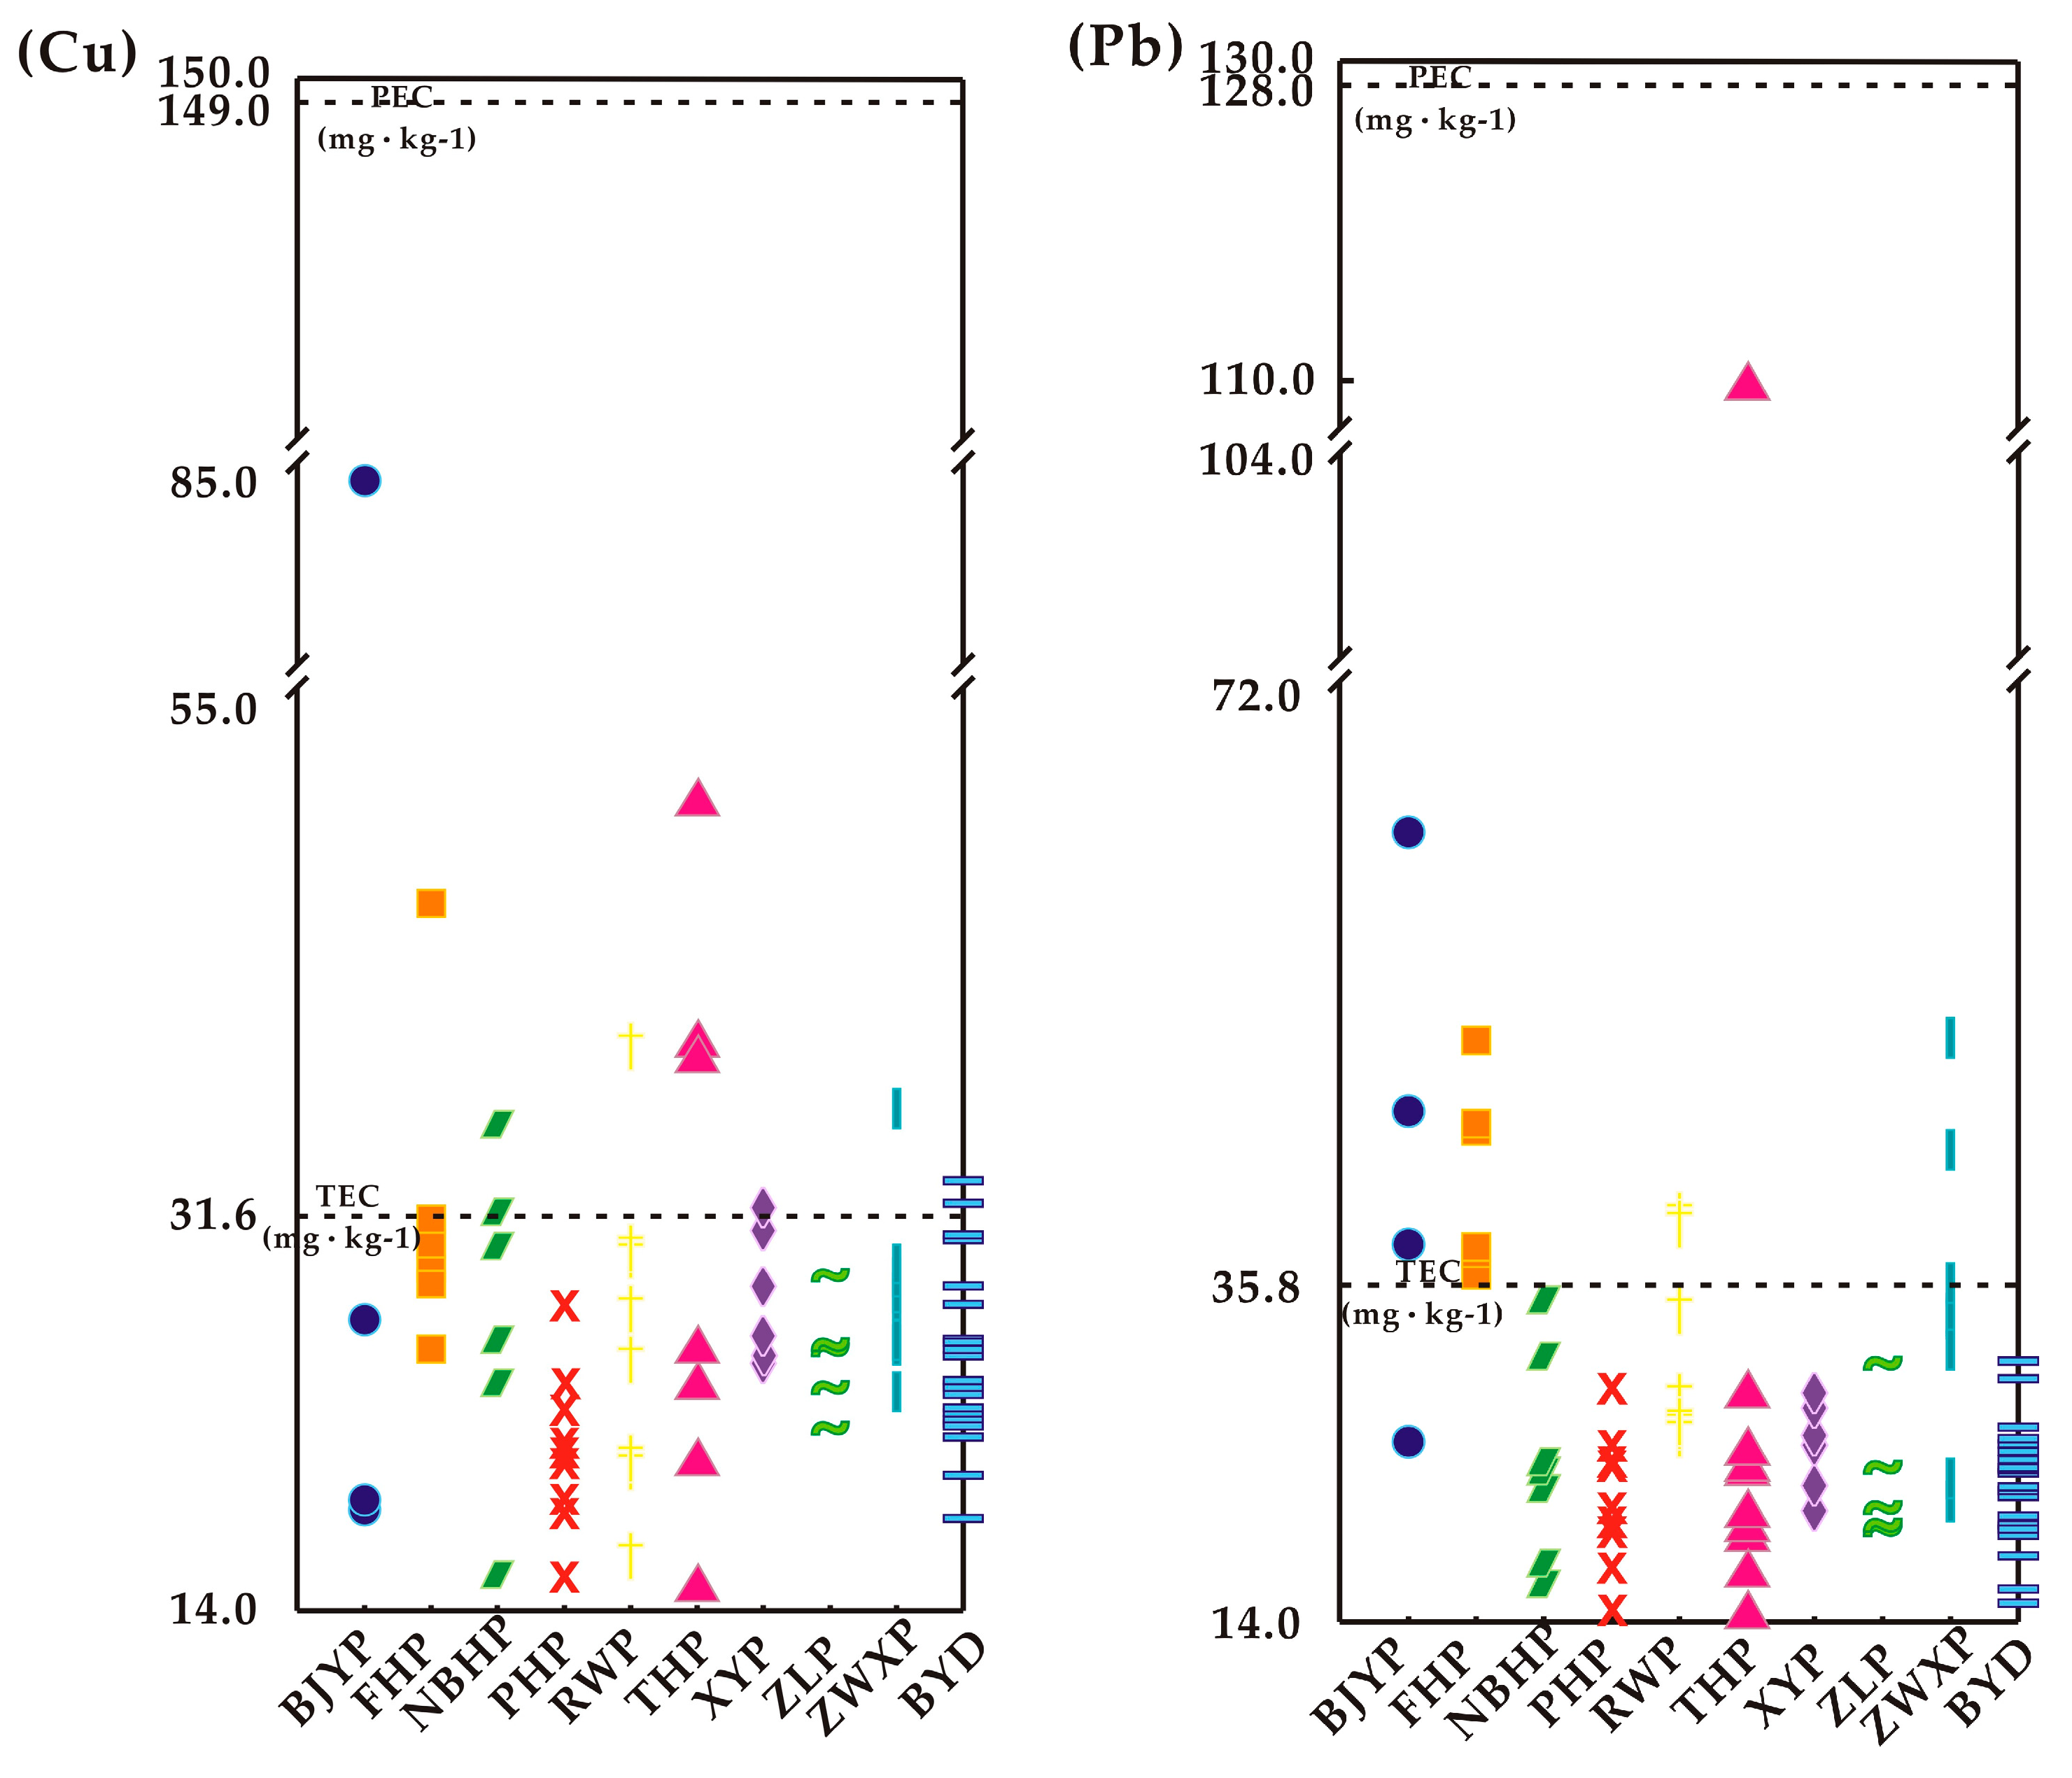
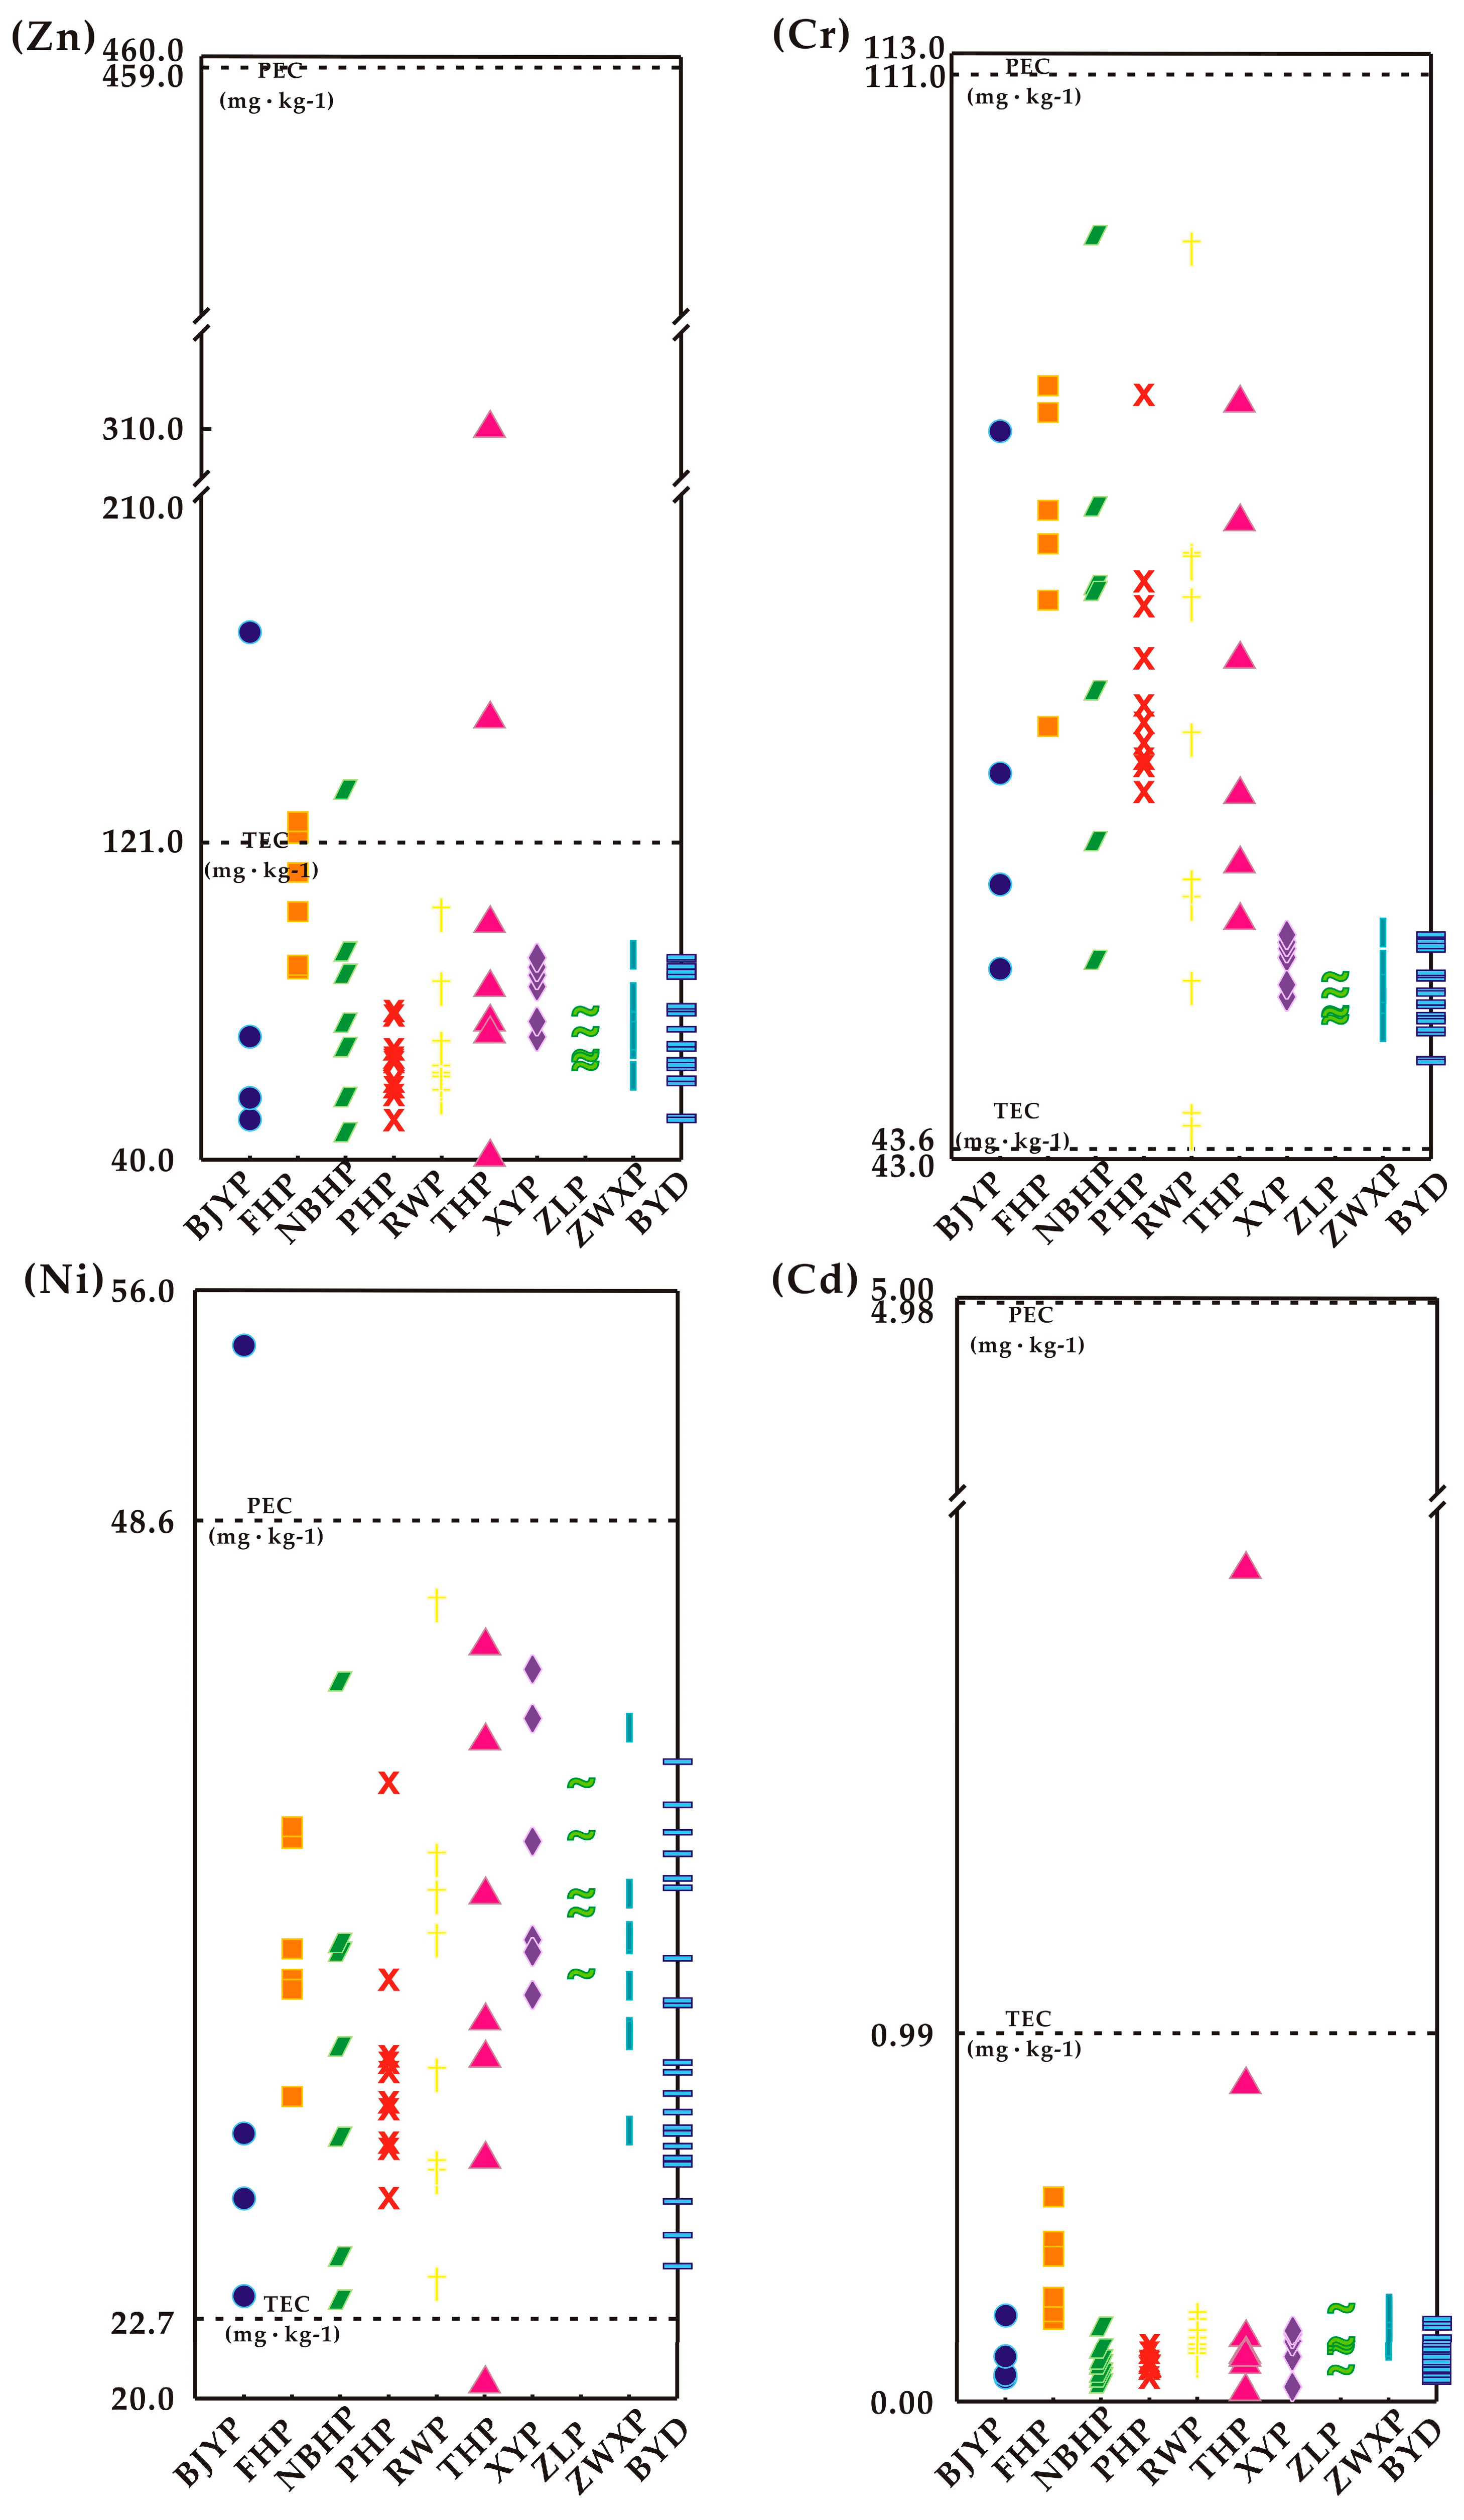
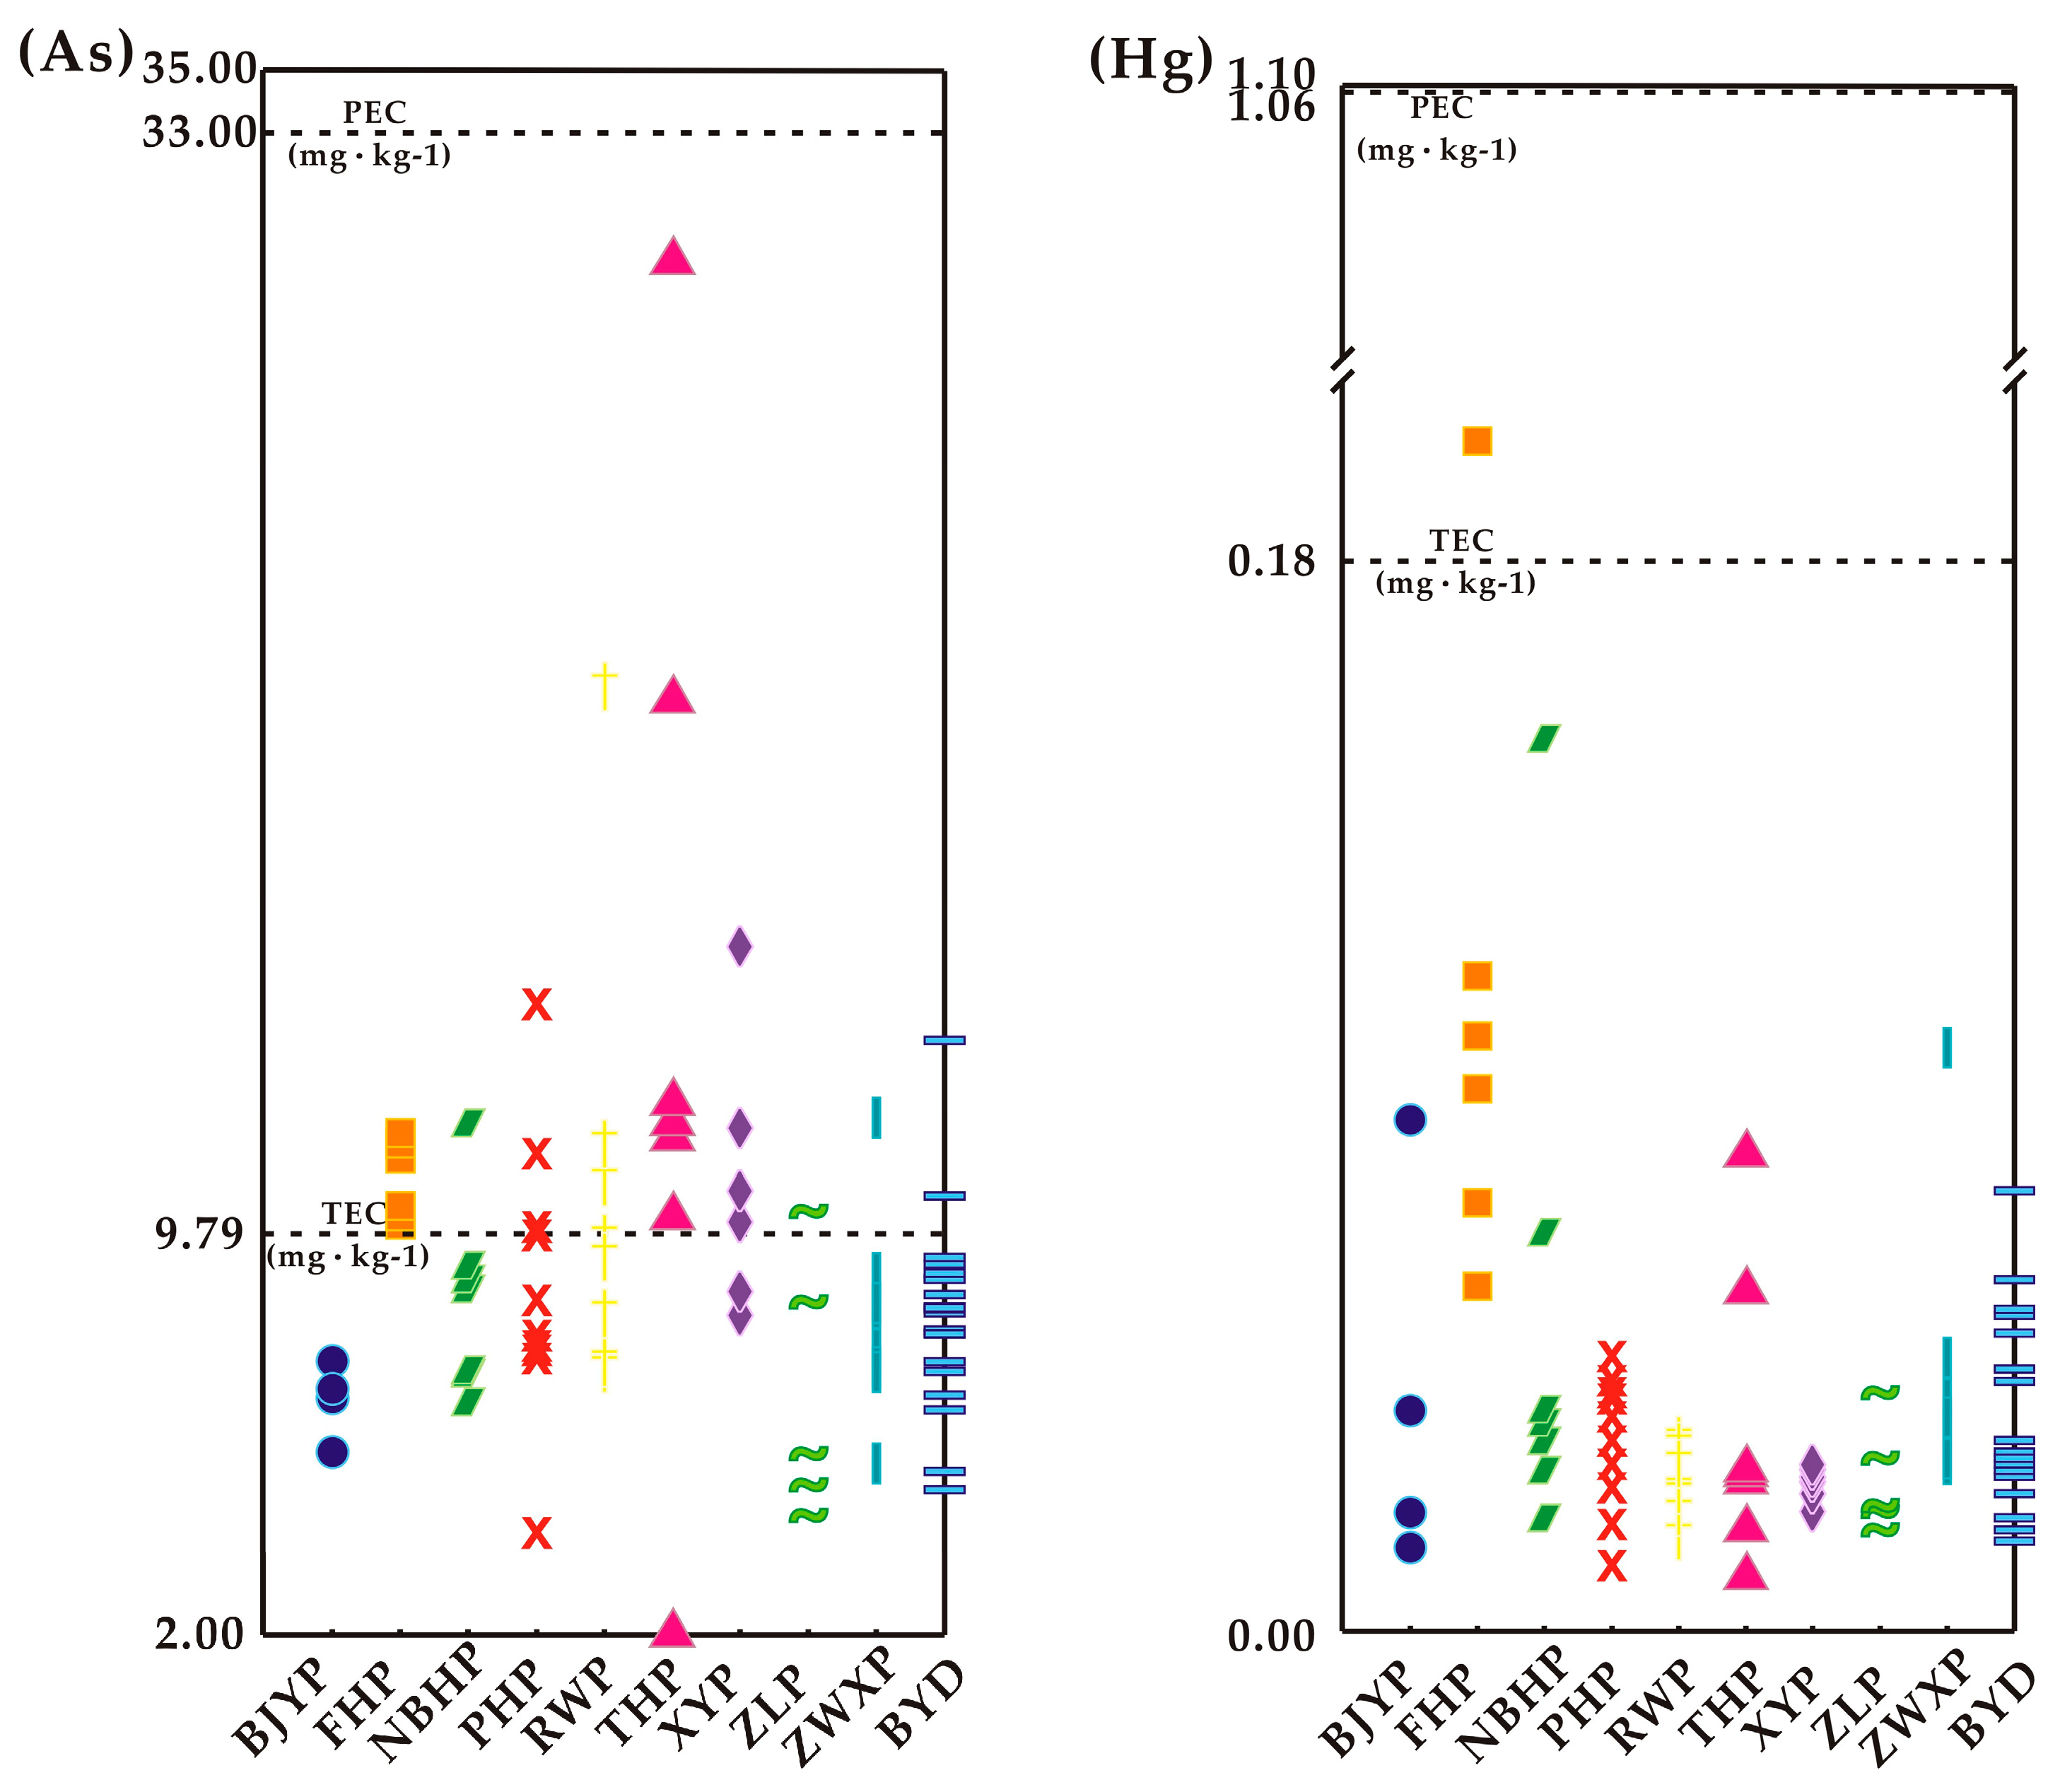
| TEC/(mg·kg−1) | 31.6 | 121 | 35.8 | 43.4 | 0.99 | 9.79 | 22.7 | 0.18 |
| PEC/(mg·kg−1) | 149 | 459 | 128 | 111 | 4.98 | 33 | 48.6 | 1.06 |
| Data sources | [9,84,89] | [84,89] | [84,89] | [9,84,89] | [9,84,89] | [9,84,89] | [9,84,89] | [84,89] |
| Item | ISQGs ≤ 0.1 | 0.1 < ISQGs ≤ 1 | 1 < ISQGs ≤ 5 | ISQGs > 5 |
|---|---|---|---|---|
| Probability of biological toxicity (PBT) | PBT < 14% | 15% < PBT ≤ 29% | 33% < PBT ≤ 58% | 75% < PBT ≤ 81% |
| Risk levels | no | low | moderate | high |
4. Results and Discussion
4.1. Pollution Levels of Heavy Metals
4.2. Pollution Sources of Heavy Metals
4.3. Potential Ecological Risks of Heavy Metals Pollution
4.3.1. Potential Ecological Risks of Heavy Metals Pollution Based on RI
4.3.2. Potential Ecological Risks of Heavy Metals Pollution Based on SQGs
4.4. Comparison of the Results with Published Study
5. Conclusions
- (1)
- Pollution levels of heavy metals exhibited relatively low in both the surface sediments of inflow rivers and Baiyangdian Lake. However, it is important to note that Cu, Zn, Pb, and Cd, with proportions of 1.64%, 1.64%, 1.64%, and 4.92%, respectively, indicated close to moderate pollution levels. Specifically, Cd, with a proportion of 1.64%, displayed moderate pollution at sampling sites of inflow rivers. Compared with previous studies, it is evident that heavy metal pollution levels were generally low, but Cd showed relatively higher pollution degrees at some sites.
- (2)
- Heavy metals found in the surface sediments of inflow rivers and Baiyangdian Lake originated from various sources such as industrial wastewater discharge, rock weathering deposition, and agricultural and domestic sewage discharge during the historical period. In the case of inflow rivers, industrial wastewater discharge was identified as the primary source of Cu, Zn, Pb, As, Cd, and Hg, contributing mean rates of 78.07%, 64.45%, 62.12%, 57.28%, 53.66%, and 57.27%, respectively. Rock weathering deposition was determined to be the main source of Ni, with a mean contribution rate of 52.49%. However, the main contributor to Cr, accounting for 40.02%, was not definitively identified, while rock weathering deposition contributed 39.99%. As for heavy metals in Baiyangdian Lake, industrial wastewater discharge was the primary source of Cu, Zn, Pb, Cd, Ni, and Hg, with mean contribution rates of 62.13%, 46.39%, 63.87%, 53.18%, 86.19%, and 68.12%, respectively. The main sources of Cr (47.74%) and As (40.71%) were not clearly identified, although industrial wastewater discharge contributed 44.12% and 39.35%, respectively. Additionally, heavy metals from the water recharging of the nine inflow rivers and local industrial activities, particularly for Cr, Ni, Cd, and Hg, also contributed to the heavy metals content in Baiyangdian Lake.
- (3)
- The comprehensive ecological risk indicated relatively low in most sites, both in the surface sediment of inflow rivers and Baiyangdian Lake. However, it is important to highlight that a small proportion of sampling sites (4.92%, 1.64%, and 1.64%) showed varying degrees of risk in inflow rivers, ranging from close to moderate to strong. The potential biological toxicity of heavy metals to benthic organisms or overlying aquatic organisms at all sites in inflow rivers and Baiyangdian Lake was also low, with a probability of biological toxicity (PBT) between 15% and 29%. Only one site was identified as having moderate toxicity, while the rest were considered non-toxic. Furthermore, variations were observed in the occurrence frequency of toxic effects among different heavy metals. Specifically, Ni was found to frequently cause toxic effects in one site, whereas other heavy metals caused toxic effects rarely or occasionally.
- (4)
- This study offered a comprehensive understanding of the heavy metal pollution status, sources, and potential ecological risks associated with various heavy metals in the surface sediments of Baiyangdian Lake and its inflow rivers. The research findings provided a crucial basis for government departments to formulate effective ecological restoration measures. Notably, for certain inflow rivers, there had been limited research or reporting on sediment heavy metal pollution, and this study contributed valuable new insights. Although the overall pollution level of surface sediments was low and had demonstrated a decreasing trend over recent years, it was important to highlight that some areas still exhibited Cd pollution at relatively higher concentrations. Nevertheless, due to financial constraints, the sample quantity and depth in this study were limited. Future researchers should enhance sample density to improve the accuracy of the findings.
Author Contributions
Funding
Data Availability Statement
Conflicts of Interest
References
- Palansooriya, K.N.; Li, J.; Dissanayake, P.D.; Suvarna, M.; Li, L.Y.; Yuan, X.Z.; Sarkar, B.; Tsang, D.C.W.; Rinklebe, J.; Wang, X.N.; et al. Prediction of soil heavy metal immobilization by biochar using machine learning. Environ. Sci. Technol. 2022, 56, 4187–4198. [Google Scholar] [CrossRef] [PubMed]
- Wang, Y.; Yang, Y.; Li, Q.; Zhang, Y.; Chen, X. Early warning of heavy metal pollution after tailing pond failure accident. J. Earth Sci. 2022, 33, 1047–1055. [Google Scholar] [CrossRef]
- Zaynab, M.; Al-Yahyai, R.; Ameen, A.; Sharif, Y.; Ali, L.; Fatinma, M.; Khan, K.; Li, S.F. Health and environmental effects of heavy metal. J. King Saud Univ. Sci. 2022, 34, 101653. [Google Scholar] [CrossRef]
- Zhang, Q.; Wang, C. Natural and human factors affect the distribution of soil heavy metal pollution: A review. Water Air Soil Pollut. 2020, 231, 1–13. [Google Scholar] [CrossRef]
- Jiang, W.J.; Meng, L.S.; Liu, F.T.; Sheng, Y.Z.; Chen, S.M.; Yang, J.L.; Mao, H.R.; Zhang, J.; Zhang, Z.; Ning, H. Distribution, source investigation, and risk assessment of topsoil heavy metals in areas with intensive anthropogenic activities using the positive matrix factorization (PMF) model coupled with self-organizing map (SOM). Environ. Geochem. Health 2023, 45, 6353–6370. [Google Scholar] [CrossRef]
- Gulan, L.; Stajic, J.M.; Zeremski, T.; Durlević, U.; Valjarević, A. Radionuclides and metals in the parks of the city of Belgrade, Serbia: Spatial distribution and health risk assessment. Forests 2022, 13, 1648. [Google Scholar] [CrossRef]
- An, Y.; Zhou, S.; Sun, C.L.; Wang, S.Y.; Zhang, X.; Lv, J.Q. Heavy metal pollution of sediments in northern Jiaozou Bay and influence of DOM on their environmental behavior. Earth Sci. 2024, 48, 2901–2913. [Google Scholar] [CrossRef]
- Yao, X.; Wang, Z.; Liu, W.; Zhang, Y.; Wang, T.H.; Li, Y.L. Pollution in river tributaries restricts the water quality of ecological water replenishment in the Baiyangdian watershed, China. Environ. Sci. Pollut. Res. 2023, 30, 51556–51570. [Google Scholar] [CrossRef]
- Zerizghi, T.; Yang, Y.F.; Wang, W.J.; Zhou, Y.; Zhang, J.; Yi, Y.J. Ecological risk assessment of heavy metal concentrations in sediment and fish of a shallow lake: A case study of Baiyangdian Lake, North China. Environ. Monit. Assess. 2020, 192, 154. [Google Scholar] [CrossRef]
- Mitra, S.; Chakraborty, A.J.; Tareq, A.M.; Emran, T.B.; Nainu, F.; Khusro, A.; Idris, A.M.; Khandaker, M.U.; Osman, H.; Alhumaydhi, F.A.; et al. Impact of heavy metals on the environment and human health: Novel therapeutic insights to counter the toxicity. J. King Saud Univ. Sci. 2022, 34, 101865. [Google Scholar] [CrossRef]
- Hou, D.; O’Connor, D.; Igalavithana, A.D.; Alessi, D.S.; Luo, J.; Tsang, D.C.W.; Sparks, D.L.; Yamauchi, Y.; Rinklebe, J.; Ok, Y.S. Metal contamination and bioremediation of agricultural soils for food safety and sustainability. Nat. Rev. Earth Environ. 2020, 1, 366–381. [Google Scholar] [CrossRef]
- Paul, D. Research on heavy metal pollution of river Ganga: A review. Ann. Agrar. Sci. 2017, 15, 278–286. [Google Scholar] [CrossRef]
- Hou, W.L.; Wang, Q.X.; Xiang, Z.Z.; Jia, N.; Hu, J.W.; Wu, Z.H.; Dong, W.L. Comprehensive assessment of occurrence, temporal-spatial variations, and ecological risks of heavy metals in Jiaozhou Bay, China: A comprehensive study. Mar. Pollut. Bull. 2024, 198, 115883. [Google Scholar] [CrossRef] [PubMed]
- Abd, E.M.K.; Elkaliny, N.E.; Elyazied, M.M.; Azab, S.H.; Elkhalifa, S.A.; Elmasry, S.; Mouhamed, M.S.; Shalamesh, E.M.; Alhorieny, N.A.; Elaty, A.E.A.; et al. Toxicity of heavy metals and recent advances in their removal: A review. Toxics 2023, 11, 580. [Google Scholar] [CrossRef]
- Sheng, Y.Z.; Baars, O.; Guo, D.Y.; Whitham, J.; Srivastava, S.; Dong, H. Mineral-bound trace metals as cofactors for anaerobic biological nitrogen fixation. Environ. Sci. Technol. 2023, 57, 7206–7216. [Google Scholar] [CrossRef]
- Feng, H.; Jiang, H.; Gao, W.; Weinstein, M.P.; Zhang, Q.; Zhang, W.; Yu, L.; Yuan, D.; Tao, J. Metal contamination in sediments of the western Bohai Bay and adjacent estuaries, China. J. Environ. Manag. 2011, 92, 1185–1197. [Google Scholar] [CrossRef]
- Wei, H.; Wang, J.Z.; Zhu, S.J.; Yu, K.N.; Cai, K.; Li, X.; Song, Z.F. Ecological assessment and source identification based on chemical forms and content of heavy metals in the sediment of Baiyangdian Lake. Front. Earth Sci. 2022, 1–15. [Google Scholar] [CrossRef]
- Dhaliwal, S.S.; Singh, J.; Taneja, P.K.; Mandal, A. Remediation techniques for removal of heavy metals from the soil contaminated through different sources: A review. Environ. Sci. Pollut. Res. 2020, 27, 1319–1333. [Google Scholar] [CrossRef]
- Valdés, J.; Guiñez, M.; Castillo, A.; Vega, S.E. Cu, Pb, and Zn content in sediments and benthic organisms from San Jorge Bay (northern Chile): Accumulation and biotransference in subtidal coastal systems. Cienc. Mar. 2014, 40, 45–58. [Google Scholar] [CrossRef]
- Mao, K.Z.; Li, H.M.; Ming, Q.; Liu, H.; Zhao, H.; Lu, B.S.; Hao, W.J. Health risk assessment in the groundwater of a certain mine in Hunan. North China Geol. 2023, 46, 57–66. [Google Scholar] [CrossRef]
- Mishra, S.P.; Sarkar, U.; Taraphder, S.; Swain, D.; Saikhom, R.; Panda, S.; Laishram, M. Multivariate statistical data analysis-principal component analysis (PCA). Int. J. Livest. Res. 2017, 7, 60–78. [Google Scholar] [CrossRef]
- Albarano, L.; Lofrano, G.; Costantini, M.; Zupo, V.; Carraturo, F.; Guida, M.; Libralato, G. Comparison of in situ sediment remediation amendments: Risk perspectives from species sensitivity distribution. Environ. Pollut. 2021, 272, 115995. [Google Scholar] [CrossRef] [PubMed]
- Palansooriya, K.N.; Shaheen, S.M.; Chen, S.S.; Tsang, D.C.W.; Hashimoto, Y.; Hou, D.; Bolan, N.S.; Rinklebe, J.; Ok, Y.S. Soil amendments for immobilization of potentially toxic elements in contaminated soils: A critical review. Environ. Int. 2020, 134, 105046. [Google Scholar] [CrossRef] [PubMed]
- Singh, U.K.; Kumar, B. Pathways of heavy metals contamination and associated human health risk in Ajay River basin, India. Chemosphere 2017, 174, 183–199. [Google Scholar] [CrossRef]
- Zhang, W.; Liu, M.; Li, C. Soil heavy metal contamination assessment in the Hun-Taizi River watershed, China. Sci. Rep. 2020, 10, 8730. [Google Scholar] [CrossRef]
- Liu, Y.; Lu, N. Hot topics and frontier evolution on soil heavy metals risk assessment in China. North China Geol. 2023, 46, 61–69. [Google Scholar] [CrossRef]
- Xu, Y.; Shi, H.; Fei, Y.; Wang, C.; Mo, L.; Shu, M. Identification of soil heavy metal sources in a large-scale area affected by industry. Sustainability 2021, 13, 511. [Google Scholar] [CrossRef]
- Hu, B.; Wang, J.Y.; Jin, B.; Li, Y.; Zhou, S. Assessment of the potential health risks of heavy metals in soils in a coastal industrial region of the Yangtze river delta. Environ. Sci. Pollut. R. 2017, 24, 19816–19826. [Google Scholar] [CrossRef]
- Soodmand, A.; Ebrahimi, S.; Kiani, F. Monitoring and assessment of contamination and ecological risk of heavy metals in Hezarpich surface soils. Int. J. Environ. Sci. Technol. 2024, 1–14. [Google Scholar] [CrossRef]
- Wardani, N.K.; Prartono, T.; Sulistiono, S. Sediments quality based on Geo-Accumulation Index in heavy metals (Pb, Cu, and Cd) of Cengkok coastal waters, Banten Bay. J. Pendidik. IPA Indones. 2020, 9, 574–582. [Google Scholar] [CrossRef]
- Lao, X.; Tam, N.F.Y.; He, H.; Su, X.T.; Zhong, M.L.; Wu, Q.H.; Liu, Y.H.; Huang, X.X.; Wei, L.Z.; Liu, Y.; et al. Distribution Characteristics and Assessment of Heavy Metal Pollution in Sediments of Fengyuan River, Guangdong. Environ. Forensics 2024, 1–13. [Google Scholar] [CrossRef]
- Jaskuła, J.; Sojka, M. Assessment of spatial distribution of sediment contamination with heavy metals in the two biggest rivers in Poland. Catena 2022, 211, 105959. [Google Scholar] [CrossRef]
- Han, X.; Wu, H.; Li, Q.; Cai, W.R.; Hu, S.Y. Assessment of heavy metal accumulation and potential risks in surface sediment of estuary area: A case study of Dagu river. Mar. Environ. Res. 2024, 196, 106416. [Google Scholar] [CrossRef] [PubMed]
- Khalili, R.; Zali, A.; Motaghi, H. Evaluating the heavy metals in the water and sediments of Haraz River, using pollution load index (PLI) and geo accumulation index (Igeo). Iran. J. Soil Water Res. 2021, 52, 933–942. [Google Scholar] [CrossRef]
- Lasheen, E.L.S.R.; Mansour, A.M.; Mohamed, A.W.; Osman, M.R.; Khaleal, F.M.; Tahoon, M.A.; Alarifi, N.; Jordan, G.; Abdelaal, A. Assessing the Heavy Metals in Surface Sediments of Wadi El-Gemal Island, Red Sea, Egypt: Pollution Levels, Sources, and Associated Risks. Water Air Soil Pollut. 2024, 235, 461. [Google Scholar] [CrossRef]
- Zhang, Y.; Li, H.; Yin, J.; Zhu, L.Y. Risk assessment for sediment associated heavy metals using sediment quality guidelines modified by sediment properties. Environ. Pollut. 2021, 275, 115844. [Google Scholar] [CrossRef]
- Wołowiec, M.; Komorowska-Kaufman, M.; Pruss, A.; Rzepa, G.; Bajda, T. Removal of heavy metals and metalloids from water using drinking water treatment residuals as adsorbents: A review. Minerals 2019, 9, 487. [Google Scholar] [CrossRef]
- Zaakour, F.; Kholaiq, M.; Khouchlaa, A.; Ikram, E.M.; Abdelmejid, R.; Najib, S. Assessment of heavy metal contamination using pollution index, geo-accumulation index, and potential ecological risk index in agricultural soil—A case study in the coastal area of Doukkala (Morocco). Ecol. Eng. Environ. Technol. 2023, 24, 38–44. [Google Scholar] [CrossRef]
- Hadif, W.M.; Abd Rahim, S.; Sahid, I.; Rahman, A.; Ibrahim, I. Assessment of Heavy Metal Pollution Using the Geo-accumulation Index (I-Geo), Pollution Load Index (PLI) and Potential Ecological Risk Index (RI) in Paddy Field Soils Adjacent to Ultrabasic Soils. Univ. Thi-Qar J. Agric. Res. 2020, 9, 85–97. [Google Scholar] [CrossRef]
- Xu, Y.F.; Wu, Y.; Han, J.; Li, P.P. The current status of heavy metal in lake sediments from China: Pollution and ecological risk assessment. Ecol. Evol. 2017, 7, 5454–5466. [Google Scholar] [CrossRef]
- Zhao, Y.J.; Deng, Q.Y.; Lin, Q.; Zeng, C.Y.; Zhong, C. Cadmium source identification in soils and high-risk regions predicted by geographical detector method. Environ. Pollut 2020, 263, 114338. [Google Scholar] [CrossRef] [PubMed]
- Jin, Z.; Zhang, L.; Lv, J.; Sun, X.F. The application of geostatistical analysis and receptor model for the spatial distribution and sources of potentially toxic elements in soils. Environ. Geochem. Health 2021, 43, 407–421. [Google Scholar] [CrossRef] [PubMed]
- Zhang, J.; Li, R.F.; Zhang, X.Y.; Bai, Y.; Cao, P.; Hua, P. Vehicular contribution of PAHs in size dependent road dust: A source apportionment by PCA-MLR, PMF, and Unmix receptor models. Sci. Total Environ. 2019, 649, 1314–1322. [Google Scholar] [CrossRef]
- Peng, Y.; Yu, G.I. Assessment of heavy metal pollution on agricultural land in Chengdu city under different anthropogenic pressures based on APCS-MLR modelling. Ecol. Indic. 2024, 165, 112183. [Google Scholar] [CrossRef]
- Shi, H.; Zeng, M.; Peng, H.; Huang, C.S.; Sun, H.M.; Hou, Q.Q.; Pi, P.C. Health risk assessment of heavy metals in groundwater of Hainan island using the Monte Carlo simulation coupled with the APCS/MLR model. Int. J. Environ. Res. Public Health 2022, 19, 7827. [Google Scholar] [CrossRef] [PubMed]
- Zhang, M.; Wang, X.; Liu, C.; Lu, J.Y.; Qin, Y.H.; Mo, Y.K.; Xiao, P.J.; Liu, Y. Quantitative source identification and apportionment of heavy metals under two different land use types: Comparison of two receptor models APCS-MLR and PMF. Environ. Sci. Pollut. Res. 2020, 27, 42996–43010. [Google Scholar] [CrossRef]
- Hsieh, P.Y.; Ho, C.C.; Wang, G.S.; Hsu, Y.C.; Wang, D.W.; Shang, Y.M.; Wu, C.F. Use of an Effective Variance Chemical Mass Balance Model for Source Apportionment of Metal Elements in a Polluted River. Environ. Process. 2022, 9, 51. [Google Scholar] [CrossRef]
- Zhang, F.G.; Wang, C.W.; Cheng, X.M.; Ma, H.H.; He, L. Ecological Assessment, Spatial Analysis, and Potential Sources of Heavy Metals (HMs) in Soils with High Background Values in the Lead-Zinc Mine, Hezhang County, Southwestern China. Water 2022, 14, 783. [Google Scholar] [CrossRef]
- Wu, J.; Fang, F.; Ma, K.; Li, Y.S.; Ge, L.; Chen, H.; Zhou, H. Spatial Distribution and Source Analysis of Soil Heavy Metals in Lujiang County Based on Unmix Model. J. Ecol. Rural Environ. 2022, 38, 1204–1210. [Google Scholar] [CrossRef]
- Li, Y.; Kuang, H.; Hu, C.; Ge, G. Source apportionment of heavy metal pollution in agricultural soils around the Poyang Lake region using UNMIX model. Sustainability 2021, 13, 5272. [Google Scholar] [CrossRef]
- Gong, C.; Xia, X.; Lan, M.; Shi, Y.C.; Lu, H.C.; Wang, S.X.; Chen, Y. Source identification and driving factor apportionment for soil potentially toxic elements via combining APCS-MLR, UNMIX, PMF and GDM. Sci. Rep. 2024, 14, 10918. [Google Scholar] [CrossRef] [PubMed]
- Wei, R.; Meng, Z.; Zerizghi, T.; Luo, J.; Guo, Q.J. A comprehensive method of source apportionment and ecological risk assessment of soil heavy metals: A case study in Qingyuan city, China. Sci. Total Environ. 2023, 882, 163555. [Google Scholar] [CrossRef] [PubMed]
- Chen, H.Y.; Teng, Y.G.; Chen, R.H.; Li, J.; Wang, J.S. Contamination characteristics and source apportionment of trace metals in soils around Miyun Reservoir. Environ. Sci. Pollut. Res. 2016, 23, 15331–15342. [Google Scholar] [CrossRef]
- Zhang, Y.; Guo, C.; Xu, J.; Tian, Y.Z.; Shi, G.L.; Feng, Y.C. Potential source contributions and risk assessment of PAHs in sediments from Taihu Lake, China: Comparison of three receptor models. Water Res. 2012, 46, 3065–3073. [Google Scholar] [CrossRef]
- Yin, D.C.; Qi, X.F.; Wang, Y.S.; Xu, R.Z.; An, Y.H.; Wang, X.Q.; Geng, H.J. Geochemical characteristics and ecological risk assessment of heavy metals in surface sediments of Baiyangdian Lake, Xiong’an New Area. Geol. China 2022, 49, 979–992. [Google Scholar]
- Zhao, Y.; Dong, L.M.; Zhang, Y.P.; Zhang, M.L.; Sun, X.T. Speciation distribution and pollution assessment of heavy metals in sediment of Baiyangdian Lake. In Proceedings of the Agricultural Environment and Ecological security—The 5th National Symposium on Agricultural Environment Science, Nanjing, China, 19–22 April 2013; pp. 537–545. [Google Scholar]
- Wang, J.Z.; Liu, Z.; Wei, H.; Wu, Y.H.; Zhan, S.E.; Zhu, C.; Zhang, Y.M. Spatial characteristics, risk assessment, and source analysis of elements in surface sediments from the Baiyangdian Lake. Environ. Sci. 2020, 41, 224–231. [Google Scholar] [CrossRef]
- Zhang, H.; Liu, M.Z.; Liao, P.P.; Zhou, X.S.; Guo, L.F.; Gao, J.Q. Analysis of spatial characteristics and source of main pollutants in Baiyangidan before and after flood season. J. Water Resour. Water Eng. 2016, 27, 28–31. [Google Scholar]
- Zhang, Q.; Zhao, Y.X.; Yang, Y.; Guo, W.C.; Yue, Y.P.; Xu, J. The ecological risk assessment of heavy metals in the sediments of Fu River Baiyangdian Lake system. Acta Sci. Circumstantiae 2024, 44, 167–176. [Google Scholar] [CrossRef]
- Zhang, S.R.; Wang, C.Y.; Liu, J.H.; Xing, Y.; Liu, Q.X.; Yang, J.Q.; He, F.Q. Assessments of heavy metal pollution in soils of the southwestern Xiong’an District and its ecological risk. Earth Sci. Front. 2021, 28, 238–249. [Google Scholar] [CrossRef]
- Wang, J.; Wei, H.; Liang, Z.; Zhan, S.E.; Jia, H.J.; Guo, S.; Ge, P.X. Contamination, risk and quantitative identification of nutrients and potentially toxic elements in the surface sediments of Baiyangdian Lake, North China. Ecotoxicology 2022, 31, 289–298. [Google Scholar] [CrossRef]
- Gao, H.; Bai, J.; Xiao, R.; Liu, P.P.; Jiang, W.; Wang, J.J. Levels, sources and risk assessment of trace elements in wetland soils of a typical shallow freshwater lake, China. Stoch. Environ. Res. Risk Assess. 2012, 27, 275–284. [Google Scholar] [CrossRef]
- Han, S.B.; Yuan, L.; Zhang, Q.X.; Zheng, Y.; Li, F.C. Heavy metal content and risk assessment of sediments and soil in the Juma river basin. Environ. Sci. 2024, 45, 2962–2970. [Google Scholar] [CrossRef]
- Zeng, Y.; Zhao, Y.; Qi, Z. Evaluating the ecological state of Chinese Lake Baiyangdian (BYD) based on ecological network analysis. Ecol. Indic. 2021, 127, 107788. [Google Scholar] [CrossRef]
- Wang, X.C.; Zhi, Q.Q.; Zhang, J.; Yang, Y.; Wu, J.J.; Wang, J.H.; Liu, D.M.; Deng, X.H. Application of Transient Electromagnetic Method in Investigation of Underground Water in Xiong’an New Area. Earth Sci. 2023, 48, 4243–4255. [Google Scholar]
- Liu, X.S.; Wang, Y.S.; Wang, X.Q.; Yin, D.C. Distribution characteristics and source of the main environmental elements in the surface soil of lake Baiyangdian wetlands. J. Lake Sci. 2022, 34, 496–505. [Google Scholar] [CrossRef]
- Ji, Z.; Zhang, H.; Zhang, Y.; Chen, T.; Long, Z.W.; Li, M.; Pei, Y.S. Distribution, ecological risk and source identification of heavy metals in sediments from the Baiyangdian Lake, Northern China. Chemosphere 2019, 237, 124425. [Google Scholar] [CrossRef] [PubMed]
- Chen, C.Y.; Pickhardt, P.C.; Xu, M.Q.; Folt, C.L. Mercury and arsenic bioaccumulation and eutrophication in Baiyangdian Lake, China. Water Air Soil Pollut. 2008, 190, 115–127. [Google Scholar] [CrossRef]
- Arisekar, U.; Shakila, R.J.; Shalini, R.; Jeyasekaran, G.; Keerthana, M.; Arumugam, N.; Almansour, A.I.; Perumal, K. Distribution and ecological risk assessment of heavy metals using geochemical normalization factors in the aquatic sediments. Chemosphere 2022, 294, 133708. [Google Scholar] [CrossRef] [PubMed]
- Chen, T.B.; Zheng, Y.M.; Lei, M.; Huang, Z.C.; Wu, H.T.; Chen, H.; Fan, K.K.; Yu, K.; Wu, X.; Tian, Q.Z. Assessment of heavy metal pollution in surface soils of urban parks in Beijing, China. Chemosphere 2005, 60, 542–551. [Google Scholar] [CrossRef]
- Zhang, C.; Zhang, Y.; Shan, B. Heavy metal distribution, fractionation, and biotoxicity in sediments around villages in Baiyangdian Lake in North China. Environ. Monit. Assess. 2023, 195, 86. [Google Scholar] [CrossRef]
- Sun, L.; Dong, Y.; Feng, W.; Zhang, Z.C.; Guo, X.B.; Li, H.T. Geochemical characteristics of soil elements and its driving mechanisms in the Xiong’an New Area, China. Geogr. Res. 2022, 41, 1715–1730. [Google Scholar]
- Wu, J.; Margenot, A.J.; Wei, X.; Fan, M.M.; Zhang, H.; James, L.B.; Wu, P.B.; Chen, F.R.; Gao, C. Source apportionment of soil heavy metals in fluvial islands, Anhui section of the lower Yangtze River: Comparison of APCS–MLR and PMF. J. Soils Sediments 2020, 20, 3380–3393. [Google Scholar] [CrossRef]
- Jin, G.; Fang, W.; Shafi, M.; Wu, D.T.; Li, Y.Q.; Zhong, B.; Ma, J.W.; Liu, D. Source apportionment of heavy metals in farmland soil with application of APCS-MLR model: A pilot study for restoration of farmland in Shaoxing City Zhejiang, China. Ecotoxicol. Environ. Saf. 2019, 184, 109495. [Google Scholar] [CrossRef]
- Duan, W.; He, B.; Nover, D.; Yang, G.S.; Chen, W.; Meng, H.F.; Zou, S.; Liu, C.M. Water quality assessment and pollution source identifica tion of the eastern Poyang Lake basin using multivariate statistical methods. Sustainability 2016, 8, 133. [Google Scholar] [CrossRef]
- Mu, D.; Wu, J.; Li, X.; Xu, F.; Yang, Y.Q. Identification of the spatiotemporal variability and pollution sources for potential pollutants of the Malian River water in northwest China using the PCA-APCS-MLR receptor model. Expo. Health 2024, 16, 41–56. [Google Scholar] [CrossRef]
- Li, W.; Wu, J.; Zhou, C.; Abel, N. Groundwater pollution source identification and apportionment using PMF and PCA-APCS-MLR receptor models in Tongchuan City, China. Arch. Environ. Contam. Toxicol. 2021, 81, 397–413. [Google Scholar] [CrossRef]
- Zhang, H.; Cheng, S.; Li, H.; Fu, K.; Xu, Y. Groundwater pollution source identification and apportionment using PMF and PCA -APCA-MLR receptor models in a typical mixed land-use area in Southwestern China. Sci. Total Environ. 2020, 741, 140383. [Google Scholar] [CrossRef]
- Hakanson, L. An ecological risk index for aquatic pollution control. A sedimentological approach. Water Res. 1980, 14, 975–1001. [Google Scholar] [CrossRef]
- Caeiro, S.; Costa, M.H.; Ramos, T.B.; Fernandes, F.; Sileira, N.; Coimbra, A.; Medeiros, G.; Painho, M. Assessing heavy metal contamination in Sado Estuary sediment: An index analysis approach. Ecol. Indic. 2005, 5, 151–169. [Google Scholar] [CrossRef]
- Chen, X.X.; Zhang, M.; Li, B.; Wen, P.Z.; Ding, P.; Yao, L.A.; Ma, Q.L.; Li, T.Z.; Cai, D.; Hu, G.C. Risk assessment and source analysis of heavy metal pollution in surface sediments from major river systems in Maoming city, Guangdong province. Environ. Sci. 2023, 44, 1397–1406. [Google Scholar] [CrossRef]
- Chai, M.W.; Li, R.L.; Ding, H.; Zan, Q.J. Occurrence and contamination of heavy metals in urban mangroves: A case study in Shenzhen, China. Chemosphere 2019, 219, 165–173. [Google Scholar] [CrossRef] [PubMed]
- Pedersen, F.; Bjørnestad, E.; Andersen, H.V.; Jesper, K.; Christian, P. Characterization of sediments from Copenhagen Harbour by use of biotests. Water Sci. Technol. 1998, 37, 233–240. [Google Scholar] [CrossRef]
- Bai, G.Y.; Zhao, K.L.; Liu, E.F.; Zhang, E.L. Accumulation characteristics and risk assessment of heavy metals in sediments of Fuxian Lake. China Environ. Sci. 2023, 43, 3625–3633. [Google Scholar] [CrossRef]
- Apitz, S.E.; Barbanti, A.; Bernstein, A.G.; Martina, B.; Eugeia, D.; Laura, M. The assessment of sediment screening risk in Venice Lagoon and other coastal areas using international sediment quality guidelines. J. Soil. Sediment 2007, 7, 326–341. [Google Scholar] [CrossRef]
- Lacey, E.M.; King, J.W.; Quinn, J.G.; Mecray, E.L.; Appleby, P.G.; Hunt, A.S. Sediment quality in Burlington harbor, lake champlain, U.S.A. Water Air Soil Pollut. 2001, 126, 97–120. [Google Scholar] [CrossRef]
- Huang, C.S.; Zhang, Q.; Tang, F.K.; Zhang, L.J.; Yu, Y.J.; Zhou, K.X.; Hu, G.C. Profiles of heavy metals pollution and potential influence to aquatic environment of Doushui reservoir from Jiangxi province. Environ. Chem. 2022, 41, 2919–2930. [Google Scholar]
- Bian, B.; Zhou, Y.; Zhang, Q. Pluution characteristics and risk assessment of heavy metals from river network sediment in western area of Taihu Lake. Environ. Sci. 2017, 38, 1442–1450. [Google Scholar] [CrossRef]
- MacDonald, D.D.; Ingersoll, C.G.; Berger, T.A. Development and evaluation of consensus-based sediment quality guidelines for freshwater ecosystems. Arch. Environ. Contam. Toxicol. 2000, 39, 20–31. [Google Scholar] [CrossRef]
- Chen, P.; Fu, C.G.; Ji, X.G.; Kang, G.Q. Research on the optimization and implementation effect of Baiyangdian water quality improvement plan. J. Water Ecol. 2022, 43, 48–55. [Google Scholar]
- Xiang, Y.X.; Wang, X.; Shan, B.Q.; Zhao, Y.; Tang, W.Z.; Shu, L.M.; Jiang, S.X.; Cao, Y. Spatial distribution, fractionation and ecological risk of heavy metals in surface sediments from Baiyangdian Lake. Acta Sci. Circumstantiae 2020, 40, 2237–2246. [Google Scholar] [CrossRef]
- Zhang, C.; Shan, B.; Zhao, Y.; Song, Z.X.; Tang, W.Z. Spatial distribution, fractionation, toxicity and risk assessment of surface sediments from the Baiyangdian Lake in northern China. Ecol. Indic. 2018, 90, 633–642. [Google Scholar] [CrossRef]



| Item | Cu | Zn | Pb | Cr | Cd | As | Ni | Hg |
|---|---|---|---|---|---|---|---|---|
| Background value/(mg·kg−1) | 22.6 | 78.4 | 26 | 68.3 | 0.097 | 13.6 | 30.8 | 36 |
| Data sources | [71] | [9,17] | [71] | [9,17] | [9,17,71] | [9,17] | [9] | [72] |
| Ecological Risk Index to Single Heavy Metal | Comprehensive Ecological Risk Index to Multiple Heavy Metals | Risk Levels |
|---|---|---|
| Ei < 40 | RI < 150 | light |
| 40 ≤ Ei < 80 | 150 ≤ RI < 300 | close to moderate |
| 80 ≤ Ei < 160 | 300 ≤ RI < 600 | moderate |
| 160 ≤ Ei < 320 | RI ≥ 600 | strong |
| Ei ≥ 320 | - | extreme |
| Item | Cu | Zn | Pb | Cr | Cd | As | Ni | Hg |
|---|---|---|---|---|---|---|---|---|
| Max/(mg·kg−1) | 81.200 | 372.000 | 123.000 | 92.600 | 2.250 | 28.700 | 54.200 | 0.200 |
| Mean/(mg·kg−1) | 27.746 | 82.849 | 30.269 | 69.931 | 0.207 | 9.544 | 33.669 | 0.042 |
| Min/(mg·kg−1) | 15.200 | 41.900 | 14.900 | 46.100 | 0.038 | 2.080 | 20.600 | 0.010 |
| Standard deviation | 9.796 | 38.495 | 14.308 | 9.855 | 0.294 | 4.073 | 6.226 | 0.034 |
| Variation coefficient | 35.305% | 46.464% | 47.270% | 14.092% | 141.765% | 42.673% | 18.493% | 81.556% |
| Upper quartile (75%) | 30.500 | 88.900 | 34.900 | 76.050 | 0.200 | 11.250 | 37.000 | 0.041 |
| Median | 26.000 | 72.700 | 26.900 | 70.300 | 0.150 | 8.880 | 33.600 | 0.029 |
| Lower quartile (25%) | 21.750 | 64.500 | 21.600 | 63.550 | 0.110 | 7.235 | 29.050 | 0.024 |
| Max/(mg·kg−1) | 33.100 | 91.300 | 30.500 | 75.300 | 0.220 | 13.500 | 40.700 | 0.074 |
| Mean/(mg·kg−1) | 25.159 | 72.918 | 22.768 | 62.927 | 0.136 | 8.191 | 31.800 | 0.035 |
| Min/(mg·kg−1) | 18.100 | 50.400 | 15.300 | 48.800 | 0.056 | 4.800 | 24.300 | 0.015 |
| Standard deviation | 3.887 | 12.457 | 3.755 | 8.474 | 0.051 | 1.778 | 4.767 | 0.015 |
| Variation coefficient | 15.450% | 17.083% | 16.493% | 13.467% | 37.623% | 21.706% | 14.990% | 44.508% |
| Upper quartile (75%) | 27.800 | 86.750 | 25.025 | 72.800 | 0.178 | 8.925 | 36.675 | 0.045 |
| Median | 24.100 | 72.900 | 23.150 | 62.250 | 0.130 | 8.255 | 30.750 | 0.030 |
| Lower quartile (25%) | 22.450 | 64.100 | 20.250 | 55.425 | 0.096 | 7.242 | 28.100 | 0.025 |
| Heavy Metal | Load Coefficient of PCA | ||
|---|---|---|---|
| PC01 | PC02 | PC03 | |
| Cu | 0.828 | 0.311 | 0.182 |
| Zn | 0.92 | −0.322 | −0.01 |
| Pb | 0.817 | −0.303 | 0.184 |
| Cr | 0.615 | 0.695 | −0.002 |
| Cd | 0.738 | −0.583 | −0.219 |
| As | 0.62 | −0.12 | −0.626 |
| Ni | 0.683 | 0.689 | −0.113 |
| Hg | 0.533 | −0.204 | 0.628 |
| Heavy Metal | Load Coefficient of PCA | ||
|---|---|---|---|
| PC01 | PC02 | PC03 | |
| Cu | 0.965 | −0.083 | −0.079 |
| Zn | 0.941 | 0.181 | −0.047 |
| Pb | 0.787 | 0.476 | −0.183 |
| Cr | 0.842 | −0.383 | −0.314 |
| Cd | 0.707 | 0.439 | 0.086 |
| As | 0.472 | −0.522 | 0.587 |
| Ni | 0.889 | −0.398 | −0.129 |
| Hg | 0.493 | 0.299 | 0.62 |
| Heavy Metal | Constant Term | APCS01 Coefficient | APCS02 Coefficient | APCS03 Coefficient | R2 |
|---|---|---|---|---|---|
| Cu | −8.439 | 5.799 | \ | −3.032 | 0.848 |
| Zn | −8.118 | 27.557 | −18.352 | 6.767 | 0.932 |
| Pb | 1.780 | 10.416 | −8.126 | −2.076 | 0.843 |
| Cr | 27.851 | 2.156 | 6.314 | −1.425 | 0.868 |
| Cd | −0.095 | 0.177 | −0.177 | 0.116 | 0.829 |
| As | 0.962 | 0.983 | 0.436 | 3.835 | 0.986 |
| Ni | 5.567 | 1.611 | 3.973 | −0.704 | 0.954 |
| Hg | 0.003 | 0.018 | −0.017 | −0.008 | 0.473 |
| Heavy Metal | Constant Term | APCS01 Coefficient | APCS02 Coefficient | APCS03 Coefficient | R2 |
|---|---|---|---|---|---|
| Cu | 9.315 | 1.693 | \ | \ | 0.930 |
| Zn | 24.835 | 5.297 | 2.121 | \ | 0.919 |
| Pb | 11.746 | 1.335 | 1.686 | −0.725 | 0.880 |
| Cr | 31.810 | 3.224 | −3.060 | −2.814 | 0.955 |
| Cd | −0.002 | 0.016 | 0.021 | \ | 0.693 |
| As | 3.579 | 0.379 | −0.874 | 1.104 | 0.839 |
| Ni | 12.927 | 1.914 | −1.788 | −0.653 | 0.965 |
| Hg | 0.001 | 0.003 | 0.004 | 0.010 | 0.717 |
| Pollution Sources | Cu | Zn | Pb | Cr | Cd | As | Ni | Hg |
|---|---|---|---|---|---|---|---|---|
| Industrial wastewater discharge | 78.07% | 64.45% | 62.12% | 19.00% | 53.66% | 57.28% | 29.62% | 57.27% |
| Rocks weathering deposition | \ | 31.16% | 35.14% | 39.99% | 38.87% | 18.58% | 52.49% | 39.18% |
| Agricultural and domestic sewage discharge | 3.06% | 1.22% | 0.96% | 1.00% | 2.68% | 14.78% | 1.02% | 1.96% |
| Unknown source | 18.87% | 3.17% | 1.77% | 40.02% | 4.80% | 9.36% | 16.87% | 1.59% |
| Pollution Sources | Cu | Zn | Pb | Cr | Cd | As | Ni | Hg |
|---|---|---|---|---|---|---|---|---|
| Industrial wastewater discharge | 62.13% | 63.87% | 46.39% | 44.12% | 86.19% | 39.35% | 53.18% | 68.12% |
| Rocks weathering deposition | \ | 2.93% | 6.54% | 4.71% | 12.59% | 10.00% | 5.59% | 10.26% |
| Agricultural and domestic sewage discharge | \ | \ | 2.26% | 3.43% | \ | 9.94% | 1.63% | 19.07% |
| Unknown source | 37.87% | 33.21% | 44.81% | 47.74% | 1.21% | 40.71% | 39.59% | 2.55% |
| Sampling Time | Cu | Zn | Pb | Cr | Cd | As | Ni | Hg | Data Sources |
|---|---|---|---|---|---|---|---|---|---|
| 2022 | 25.159 | 72.918 | 22.768 | 62.927 | 0.136 | 8.191 | 31.800 | 0.035 | Present study |
| 2020 | 31.02 | 93.06 | 39.8 | 82.56 | 0.32 | 18.96 | \ | \ | [17] |
| 2019–2020 | 37.43 | 102.43 | 27.78 | 75.46 | 0.33 | 9.91 | 37.22 | 0.054 | [55] |
| 2019 | 32.33 | 84.24 | 19.17 | 56.37 | 0.35 | 9.53 | 30.18 | \ | [9] |
| 2019 | 28.79 | 56.77 | 19.01 | 59.68 | 0.25 | \ | 28.85 | \ | [91] |
| 2016 | 32.27 | 137.84 | 66.96 | 54.52 | 1.22 | \ | 27.58 | \ | [92] |
| 2010 | 28.19 | 150.88 | 33.50 | 41.34 | 0.80 | 32.08 | 35.04 | \ | [56] |
Disclaimer/Publisher’s Note: The statements, opinions and data contained in all publications are solely those of the individual author(s) and contributor(s) and not of MDPI and/or the editor(s). MDPI and/or the editor(s) disclaim responsibility for any injury to people or property resulting from any ideas, methods, instructions or products referred to in the content. |
© 2024 by the authors. Licensee MDPI, Basel, Switzerland. This article is an open access article distributed under the terms and conditions of the Creative Commons Attribution (CC BY) license (https://creativecommons.org/licenses/by/4.0/).
Share and Cite
Liu, H.; Bai, Y.; Gao, Y.; Han, B.; Miao, J.; Shi, Y.; Yang, F. Status, Sources, and Risks of Heavy Metals in Surface Sediments of Baiyangdian Lake and Inflow Rivers, North China. Water 2024, 16, 2723. https://doi.org/10.3390/w16192723
Liu H, Bai Y, Gao Y, Han B, Miao J, Shi Y, Yang F. Status, Sources, and Risks of Heavy Metals in Surface Sediments of Baiyangdian Lake and Inflow Rivers, North China. Water. 2024; 16(19):2723. https://doi.org/10.3390/w16192723
Chicago/Turabian StyleLiu, Hongwei, Yaonan Bai, Yihang Gao, Bo Han, Jinjie Miao, Yanchao Shi, and Fengtian Yang. 2024. "Status, Sources, and Risks of Heavy Metals in Surface Sediments of Baiyangdian Lake and Inflow Rivers, North China" Water 16, no. 19: 2723. https://doi.org/10.3390/w16192723
APA StyleLiu, H., Bai, Y., Gao, Y., Han, B., Miao, J., Shi, Y., & Yang, F. (2024). Status, Sources, and Risks of Heavy Metals in Surface Sediments of Baiyangdian Lake and Inflow Rivers, North China. Water, 16(19), 2723. https://doi.org/10.3390/w16192723


