Article

Parameters Variation of Natural Gas Hydrate with Thermal Fluid Dissociation Based on Multi-Field Coupling under Pore-Scale Modeling

1
School of Petroleum Engineering, China Petroleum University (East China), Qingdao 266580, China
2
School of Civil and Resource Engineering, University of Science & Technology Beijing, Beijing 100083, China
3
CNPC Engineering Technology R&D Company Limited, Beijing 102206, China
*
Author to whom correspondence should be addressed.
Water 2024, 16(19), 2734; https://doi.org/10.3390/w16192734
Submission received: 3 September 2024 / Revised: 19 September 2024 / Accepted: 24 September 2024 / Published: 26 September 2024
(This article belongs to the Section Hydraulics and Hydrodynamics)

Abstract

:
The permeability, heat conductivity, and reaction rate will be varied with the change of natural gas hydrate saturation when thermal fluid is injected into the natural gas hydrate reservoirs. In order to characterize the variation of the physical field parameters with hydrate saturation, DDF-LBM was applied to simulate the hydrate dissociation process by thermal fluid injection under pore-scale modelling. Based on the forced conjugate heat transfer case, the relaxation frequency of the thermal lattice in the pores is corrected. Based on the P-T phase equilibrium relationship of hydrates and considering the heat absorbed by the hydrate reaction, the solid–liquid state of the hydrate lattice is judged in real time, and the dynamic simulation of the heat flow solidification multi-physics field is realized. The simulation results show that the dissociation rate of the hydrates by thermal fluid injection was higher than that by heating the hydrate surface alone and was positively correlated with the hydrate saturation. On the basis of the above results, this paper provided exponential fitting equations between different hydrate saturations and average permeability, effective thermal conductivity, and inherent reaction rate. The fitting results show that saturation has a negative correlation with relative permeability and effective thermal conductivity, and a positive correlation with the inherent reaction rate. The above results can provide a reference basis for accurately describing the heat and mass transfer of natural gas hydrate under the macroscale.

1. Introduction

Using geothermal energy for mining natural gas hydrates under the seabed is an efficient and low-carbon method [1]. As the fluid injected into the deeper geothermal reservoir, the heated water conveys the heat and is reinjected into the fractured hydrate reservoir [2]. During the hydrate dissociation in the reservoir, the thermal fluid enhances the porosity of structure, thereby augmenting the flow capacity and convective heat transfer capacity of the reservoir [3]. Accordingly, when heat flows through the medium of the hydrate, a condition of fully multi-field coupling must be considered with every physical field of thermo-hydro-mechanical-chemical (THMC) [4]. The simulation must therefore analyze these interactions between the fields. It is necessary to analyze the mutual influence of key parameters between multi-field coupling during simulation.
According to the reviews of the literature, there must be functions or laws to express the coupling ways of each field in THMC [5,6]. The coupling ways between flowing and mechanic fields are the Biot equation and Darcy’s law [7]. The consolidation coefficient was used to describe the harmonic relationship between the solid stress field and the fluid pressure field. The pressure field changes the fluid velocity field by Darcy’s law. However, the porosity changes greatly due to hydrate dissociation, and the Biot equation is no longer applicable. The coupling ways of flowing and the thermal field are the convection heat transfer equation and viscosity–temperature relationship [8]. The change in temperature has little effect on the viscosity. Because the average diameter of the pores was generally smaller than the thickness of the boundary layer, the fluid flowing in the microporous is laminar. Therefore, the convection heat transfer equation is directly used to simulate the internal energy transfer in the pores. Its thermal diffusion coefficient should include heat conduction and heat convection, while heat conduction is retained in the solid. The coupling ways between the flowing field and chemical field are the Kim-Bishnoi (K-B) equation in pressure form and the kinetics of methane hydrate decomposition [9]. The pressure distribution in the flowing field will affect the chemical reaction rate based on the K-B equation. The energy consumption caused by chemical reactions at the microscale will lead to kinetic energy transfer in the flowing field, but it will not be too obvious. The coupling way of the stress field and chemical field is porosity change. Hydrate dissociation will increase porosity and reduce the elastic modulus of the solid skeleton. The elastic modulus decreasing will lead to changes in the pressure field, which, in turn, affects the reaction rate [10]. The coupling ways of the mechanic and thermal field are thermal expansion and effective heat conductivity. When hydrates dissolve, the thermal expansion deformation of the solid structure is very tiny, but the porosity changes greatly, which, in turn, affects the effective heat conductivity, which has a significant impact on convective heat transfer. The coupling way of the thermal and chemical field is the K-B equation in thermal form. The reaction rate coefficient of the K-B equation is related to temperature, and the equilibrium pressure is also related to temperature, but the effect is not significant. The chemical reaction has a great influence on the internal energy transfer. The dissociation enthalpy of the chemical reaction will absorb a lot of heat and affect the internal energy diffusion rate [11]. In summary, when comprehensively considering the multi-field coupling of THMC, the unsteady Darcy’s law, the unsteady convective heat transfer equation, and the unsteady K-B equation are important governing equations. Therefore, the average permeability, effective thermal conductivity, and reaction rate coefficient are critical physical parameters. At the microscale simulation, Darcy’s law becomes the N-S equation, and the K-B equation is a macroscale equation and is not applicable. Therefore, it is necessary to solve the above key physical parameters through pore-scale simulation of the N-S equation, convective heat transfer equation, and fluid–solid boundary changes and verify Darcy’s law and K-B equation of macroscale condition.
The lattice Boltzmann method (LBM) is a discretely representative elementary volume (REV) simulation method based on the Boltzmann distribution equation. It can not only characterize the effects of microscale simulation but also has perfect convergence and stability. Using the dual distribution function (DDF-LBM) method, the distribution of the velocity and temperature field at the microscale modelling can be more accurately calculated [12]. At the same time, the calculation efficiency is relatively faster, and it has better self-stability for the fluid–solid boundary behaviors. Huo et al. used the DDF-LBM to simulate the solid–liquid boundary change during the dissociation of phase change of silicon materials in a square cavity and verified the feasibility of this method under natural thermal convection conditions [13]. He et al. reviewed and introduced the detailed method of LBM simulation of single fluid solid–liquid phase change [14]. The literature listed the expression of phase change latent heat in the convection heat transfer equation in the DDF method and introduced MRT to correct the nonlinear coefficient of the equation. However, this paper did not describe the analysis from REV to the macroscale and achieved no physical meaning overlap from micro to macro. Zhang et al. used the DDF-LBM to simulate the hydrate dissociation process at the pore scale and calculated the variation of macroscale permeability with hydrate saturation [15]. However, the literature did not conduct sufficient research on the effective thermal conductivity, hydrate activation reaction, and phase change latent heat, resulting in inaccurate calculation results. Ji et al. used the MRT-LBM to study the two-phase curves of gas–water flow during hydrate dissociation but did not consider the influence of multi-field coupling on the dissociation law [16]. Ross-Jones et al. used the DDF-LBM to study the simulation results of the effective thermal conductivity of porous structures at the nanoscale [17]. The calculation results verified that the DDF-LBM can be directly used to simulate convective heat transfer at the nanoscale, but the model did not consider the effects of forced convection and phase change on flow simulation. In summary, LBM can be applied to the microscale simulation of porous media, but the key parameters of the methods need to be modified to make the calculation results more satisfied with really physical phenomena such as convective heat transfer and phase change enthalpy absorption.
In this paper, the influence of hydrate activation reaction on flow heat transfer will be considered, based on DDF-LBM, and a simulation calculation method of heat flow and solidification will be designed, based on fully multi-field coupling, by THMC. According to the calculated results, the permeability, thermal conductivity, activation reaction rate, and other parameters of the models under multi-field coupling conditions would be analyzed, which can provide more accurate reference for mining natural gas hydrates using geothermal fluids.

2. Materials and Methods

It has been shown in many works that natural gas hydrate reservoirs currently exist in different modes at the microscale [15]. In order to better characterize the hydrate dissociation mechanism, we designed the pore-filling type and the grain-coating type, based on two common hydrate reservoir modes. Two different microstructures are shown in Figure 1. The model size length × width = 250 × 110, where the size of the hydrate and rock particles is 11 × 11. The unit of the model size is the number of grids. The square particles of rock and hydrate make the fluid flowing in the pores more similar to the flowing in slender pipes. This design ensures that the models have a porosity closer to the real reservoir (less than 15%) while allowing the thermal fluid to flow smoothly [2].
According to the literature [7], when simulating the thermal fluid flowing through porous media with hydrates, we need to set the Mass Equation (1), Momentum Equation (2), and Energy Equation (3) under the microscale as the controlling functions of the model. The controlling functions used in LBM are as follows.
ρ t + ( ρ u ) = 0
ρ u t + ( ρ u u ) = p + ( υ u )
ρ c p T t + ( ρ c p T u ) = ( λ T ) + S T ,   S T = Δ H R h
where ρ , u , p , and T stand for the density, velocity, pressure, and temperature. υ is the viscosity of fluid. c p is the heat capability of a fluid or solid. λ is the heat conductivity. S T is the heat source term. Δ H is the heat absorption enthalpy of the hydrate dissociation. R h is the hydrate dissociation rate.
Some literature has shown the experiments results under the microscale, with the actual pressure and temperature conditions of natural gas hydrate reservoirs [18,19]. The simulations have shown that, even if hydrates release gases, such as methane after dissociation, these types of gas will be difficult to gather as continuous bubbles in water due to the high pressure in storage and will basically be mixed in the flowing water as isolated particles. Therefore, only two structural grids, fluid and solid, were established in the LBM of this paper. The influence of continuous bubbles on the flow were not considered. Only the correction to the viscosity and density of the liquid was considered, which was based on mixed bubbles in the flow.

2.1. Lattice Boltzmann Method for Convection Simulation

The simulation fields in DDF-LBM include density field and temperature field. The Distribution Equation (4) and Equilibrium Distribution Function (5) of the density field and the Distribution Equation (6) and Equilibrium Distribution Function (7) of the temperature field in the D2Q9 model are as follows.
f a ( x + Δ x , t + Δ t ) f a ( x , t ) = Ω f [ f a ( x , t ) f a e q ( x , t ) ]
f a e q = ρ ω a [ 1 + 3 e a u + 9 2 ( e a u ) 2 3 2 u 2 ]
g a ( x + Δ x , t + Δ t ) g a ( x , t ) = Ω T [ g a ( x , t ) g a e q ( x , t ) ] ω a S T Δ t
g a e q = ρ ω a [ 1 + 3 e a u ]
ρ = f a ,   ρ u = f a e a ,   P = ρ R T = 1 3 ρ ,   T = g a
where Ω f and Ω T are the relaxion frequency of the density and temperature. In solid heat conduction problems, Ω T is generally a function of the thermal diffusivity α . However, in conjugate convection, energy transfer is not only heat conduction but also the flow affects the movement of internal energy, which is forced heat convection. Therefore, in the DDF-LBM simulation for conjugate convection, the thermal diffusion rate of fluid should be the combined effect of heat conduction and energy migration, which is Ω T = Ω α + Ω f , where Ω α = 1 3 α + 0.5 and Ω f = 1 3 υ + 0.5 . α stands for the thermal diffusivity of fluid at stagnation [20]. The temperature of fluid grids can be more accurately calculated by the modified relaxation frequency, which consider the coupling of fluid convection and solid heat transfer in porous media under the microscale.

2.2. Lattice Boltzmann Method for Phase Change

Since the heat source term S T in the temperature field distribution equation only exists at the equilibrium temperature and pressure, it is zero under other conditions. Therefore, in the LBM simulation codes, the processing of source term S T can be carried out according to the following equations.
{ w h e n T < T e q S T = 0 f H f H , g H g H w h e n T > T e q Δ T Δ t = T ( t + Δ t ) T ( t ) Δ T Δ t w h e n Δ T Δ t < Δ H c H M H T ( t + Δ t ) = T e q f H f H , g H g H w h e n Δ T Δ t > Δ H c H M H f H f F , g H g F S T = 0
where T e q is the equilibrium temperature. f H and g H stand for the lattice of hydrate as a solid. f F and g F stand for the lattice of hydrate as a fluid. Δ T Δ t is the temperature corresponding to the cumulative internal energy of the solid hydrate lattice reaching equilibrium. M H is the molecular weight of the hydrate. Common Type I and Type II natural gas hydrate C H 4 5.5 H 2 O have a molecular weight of 115 g/mol [21]. Then, the source term in Equation (9) can be calculated as follows.
Δ H c H M H = 52 kJ / mol 2.1 kJ / kg K 1 0.115 kg / mol 215   K
It means that the hydrate in the equilibrium needs to absorb the internal energy corresponding to 215 K before it can dissolve from the solid phase into the fluid phase.

2.3. Lattice Boltzmann Method for Hydrate Reaction

The macroscopic model of hydrate dissociation and activation can be characterized by the K-B model, as shown in the following [9]:
R h = Δ n h Δ t = k d A h s = A h s k d 0 exp ( Δ E R T ) ( f e q f )
where n h is the number of moles of dissolved hydrate, A h s is the reaction contact area, Δ E is the activation energy, k d 0 is the intrinsic activation rate, and f e q is the equilibrium pressure. The K-B model takes into account the influence of temperature–pressure equilibrium curves during hydrate dissociation and the influence of the reaction contact area.
According to the literature, the K-B model is based on a statistical experiment of each phase of hydrate at the equilibrium state in a sealed container under approximately steady-state conditions by reducing the pressure or increasing the temperature and calculating the dissociation rate of hydrates within steady-state conditions. The methods did not fully consider the effect of the thermal fluid injected into the hydrate. Therefore, the reaction rate k d 0 in the literature is a fixed value after fitting, but, in fact, the reaction rate changes with the temperature gradient, which cannot be calculated from the experiments. Therefore, DDF-LBM can be used to intuitively count the contact area during dissolving, and according to the average pressure of the lattices during dissolving, the change of reaction rate k d as the hydrate saturation decreases can be given, which means that this change has a relationship with the hydrate saturation in this model. The dissolved and dissolving lattice can be illustrated in Figure 2, including the reacting boundaries.
The undissolved grids shown in Figure 2 are the equations shown in the first row of Equation (9); that is, the current grid’s temperature has not reached the equilibrium condition. The dissolving grids shown in Figure 2 are those in the second and third rows of Equation (9); that is, the current grids satisfied the equilibrium condition, but the accumulated energy does not satisfy the phase transition condition. These grids maintain solid properties, and their contact boundaries with the flow grids in the pores are the activation contact areas A h s , as shown by the red lines in Figure 2. The contact areas A h s in this model that can be calculated as A h s = L h s H . L h s are the reacting boundaries, and H is the height of this model. The dissolved grids shown in Figure 2 are those in the fourth row of Equation (9); that is, the current accumulated energy of these grids was over the limit of the heat absorption enthalpy. Then, those grids will alter from a solid into a fluid and be part of the collision calculation of fluids. Then, the fluid–solid boundary evolutions with the hydrate activation reaction are realized.

2.4. Lattice Boltzmann Method for an Unstable Simulation

The simulation of hydrate dissociation in porous media is a process with approximately steady-state flowing and non-steady-state heat transferring, so the statistical method of the model calculation results needs to be revised [22]. The average permeability K a of the porous structure can be calculated using the differential form of Darcy’s law, as shown in Equation (12). The efficient thermal conductivity λ a can be calculated using the differential form of the energy equation, as shown in Equation (13). The model in this paper can be verified using experimental results in the literature, and Equation (14) (K-B model) can be used to solve the reaction rate k d .
K a = μ w L x ( u i n ¯ + u o u t ¯ ) 2 ( P i n ¯ P o u t ¯ )
λ a = [ ρ i c i T Δ t + ρ w c w ( u i n ¯ + u o u t ¯ ) 2 ( T i n ¯ T o u t ¯ ) L x ] / ( T i n ¯ + T o u t ¯ T m i d ¯ ) L x 2
k d = R h A h s = k d 0 exp ( Δ E R T ) ( P e q P r ¯ )
In the simulation of the dissociation process, the pressure, velocity, and temperature fields at the entire physical microscale are non-uniform. Therefore, it is impossible to directly using import and export statistics results to calculate this. It is necessary to divide the inhomogeneous physical fields into regions so that the calculation results can be more approximately stable. In this study, the simulation area will be divided into eight statistical areas of equal size and use the above equations to calculate the permeability and efficient thermal conductivity in each area, then average them. This can improve the impact of an unsteady state in the physical field within the models, making the calculation results more accurate.

3. Results and Discussions

Set the left side as the hot fluid inlet and the right side as the hot fluid outlet. Other parameters and boundaries can be set as in Table 1, including the initial conditions and different lattices [23,24]. Set the hydrate totally dissolved as the ending point. Simulate the pressure, velocity, and temperature at different times in the porous model. Fully consider the impact of fluid–solid boundary behaviors after hydrate dissociation. The calculation results of the structural field, velocity field, and temperature field at some time nodes are shown in Figure 3.

3.1. Simulation Verifying by Reaction Rate

Changing the hydrate storage state may not change the dissolving rate much. Figure 4 shows the variation in residual hydrate saturation over time for two different pore structures. S h is the absolute saturation of hydrate in the pores, and S h = V h / V P . V h and V P are the solid hydrate volume and pore volume, respectively.
Although the initial hydrate saturations of the grain-coating and the pore-filling types are different, their dissociation rates change in the same way because of the same boundary conditions of inlet velocity and temperature. By linear fitting the curves in Figure 4, the hydrate dissociation rates of the two models can be approximately described by the following equations.
{ n h = 0.98 × 10 3 t + 5.9 × 10 7 ( Grain - coating ) ,   R 2 = 0.97 n h = 0.99 × 10 3 t + 5.8 × 10 7 ( Pore - filling ) ,   R 2 = 0.98
According to Equation (15), the fitting results of the hydrate dissociation rate R h of the two models can be directly obtained as below.
R h = Δ n h Δ t = { 0.98 × 10 3   μ mol / s = 3.52   μ mol / h ( Grain - coating ) 0.99 × 10 3   μ mol / s = 3.55   μ mol / h ( Pore - filling )
Substituting the hydrate dissociation rate R h into Equation (14), we can obtain the hydrate activation reaction rate per contact area simulated by LBM, known as k d . The activation reaction area A h s can be obtained by counting the solid–liquid phase field boundary in Figure 2. The temperature difference Δ T in Equation (17) comes from the temperature difference between the inlet T i n and the boundary T w in Table 1.
k d = R h A h s = { 4.06 × 10 4   mol / h / m 2 ( Grain - coating ) 4 . 87 × 10 4   mol / h / m 2 ( Pore - filling ) k d = 6.464 × ( Δ T ) 2.05 = 3 . 65 × 10 3   mol / h / m 2
The simulation results in Equation (17) are familiar with the experimental results in the literature [25]. However, the experimental condition in the literature is to directly heat the upper surface of the hydrate in a sealed container, and the thermal fluid is not injected into the porous structure with the hydrate. Therefore, the hydrate dissociation reaction rate caused by the injection of hot fluids simulated by LBM must be greater than the experimental results but not much more. It is further proved that the DDF-LBM simulation method that comprehensively considers THMC in this paper can approximately describe the hydrate dissociation process when thermal fluid is injected into porous media.

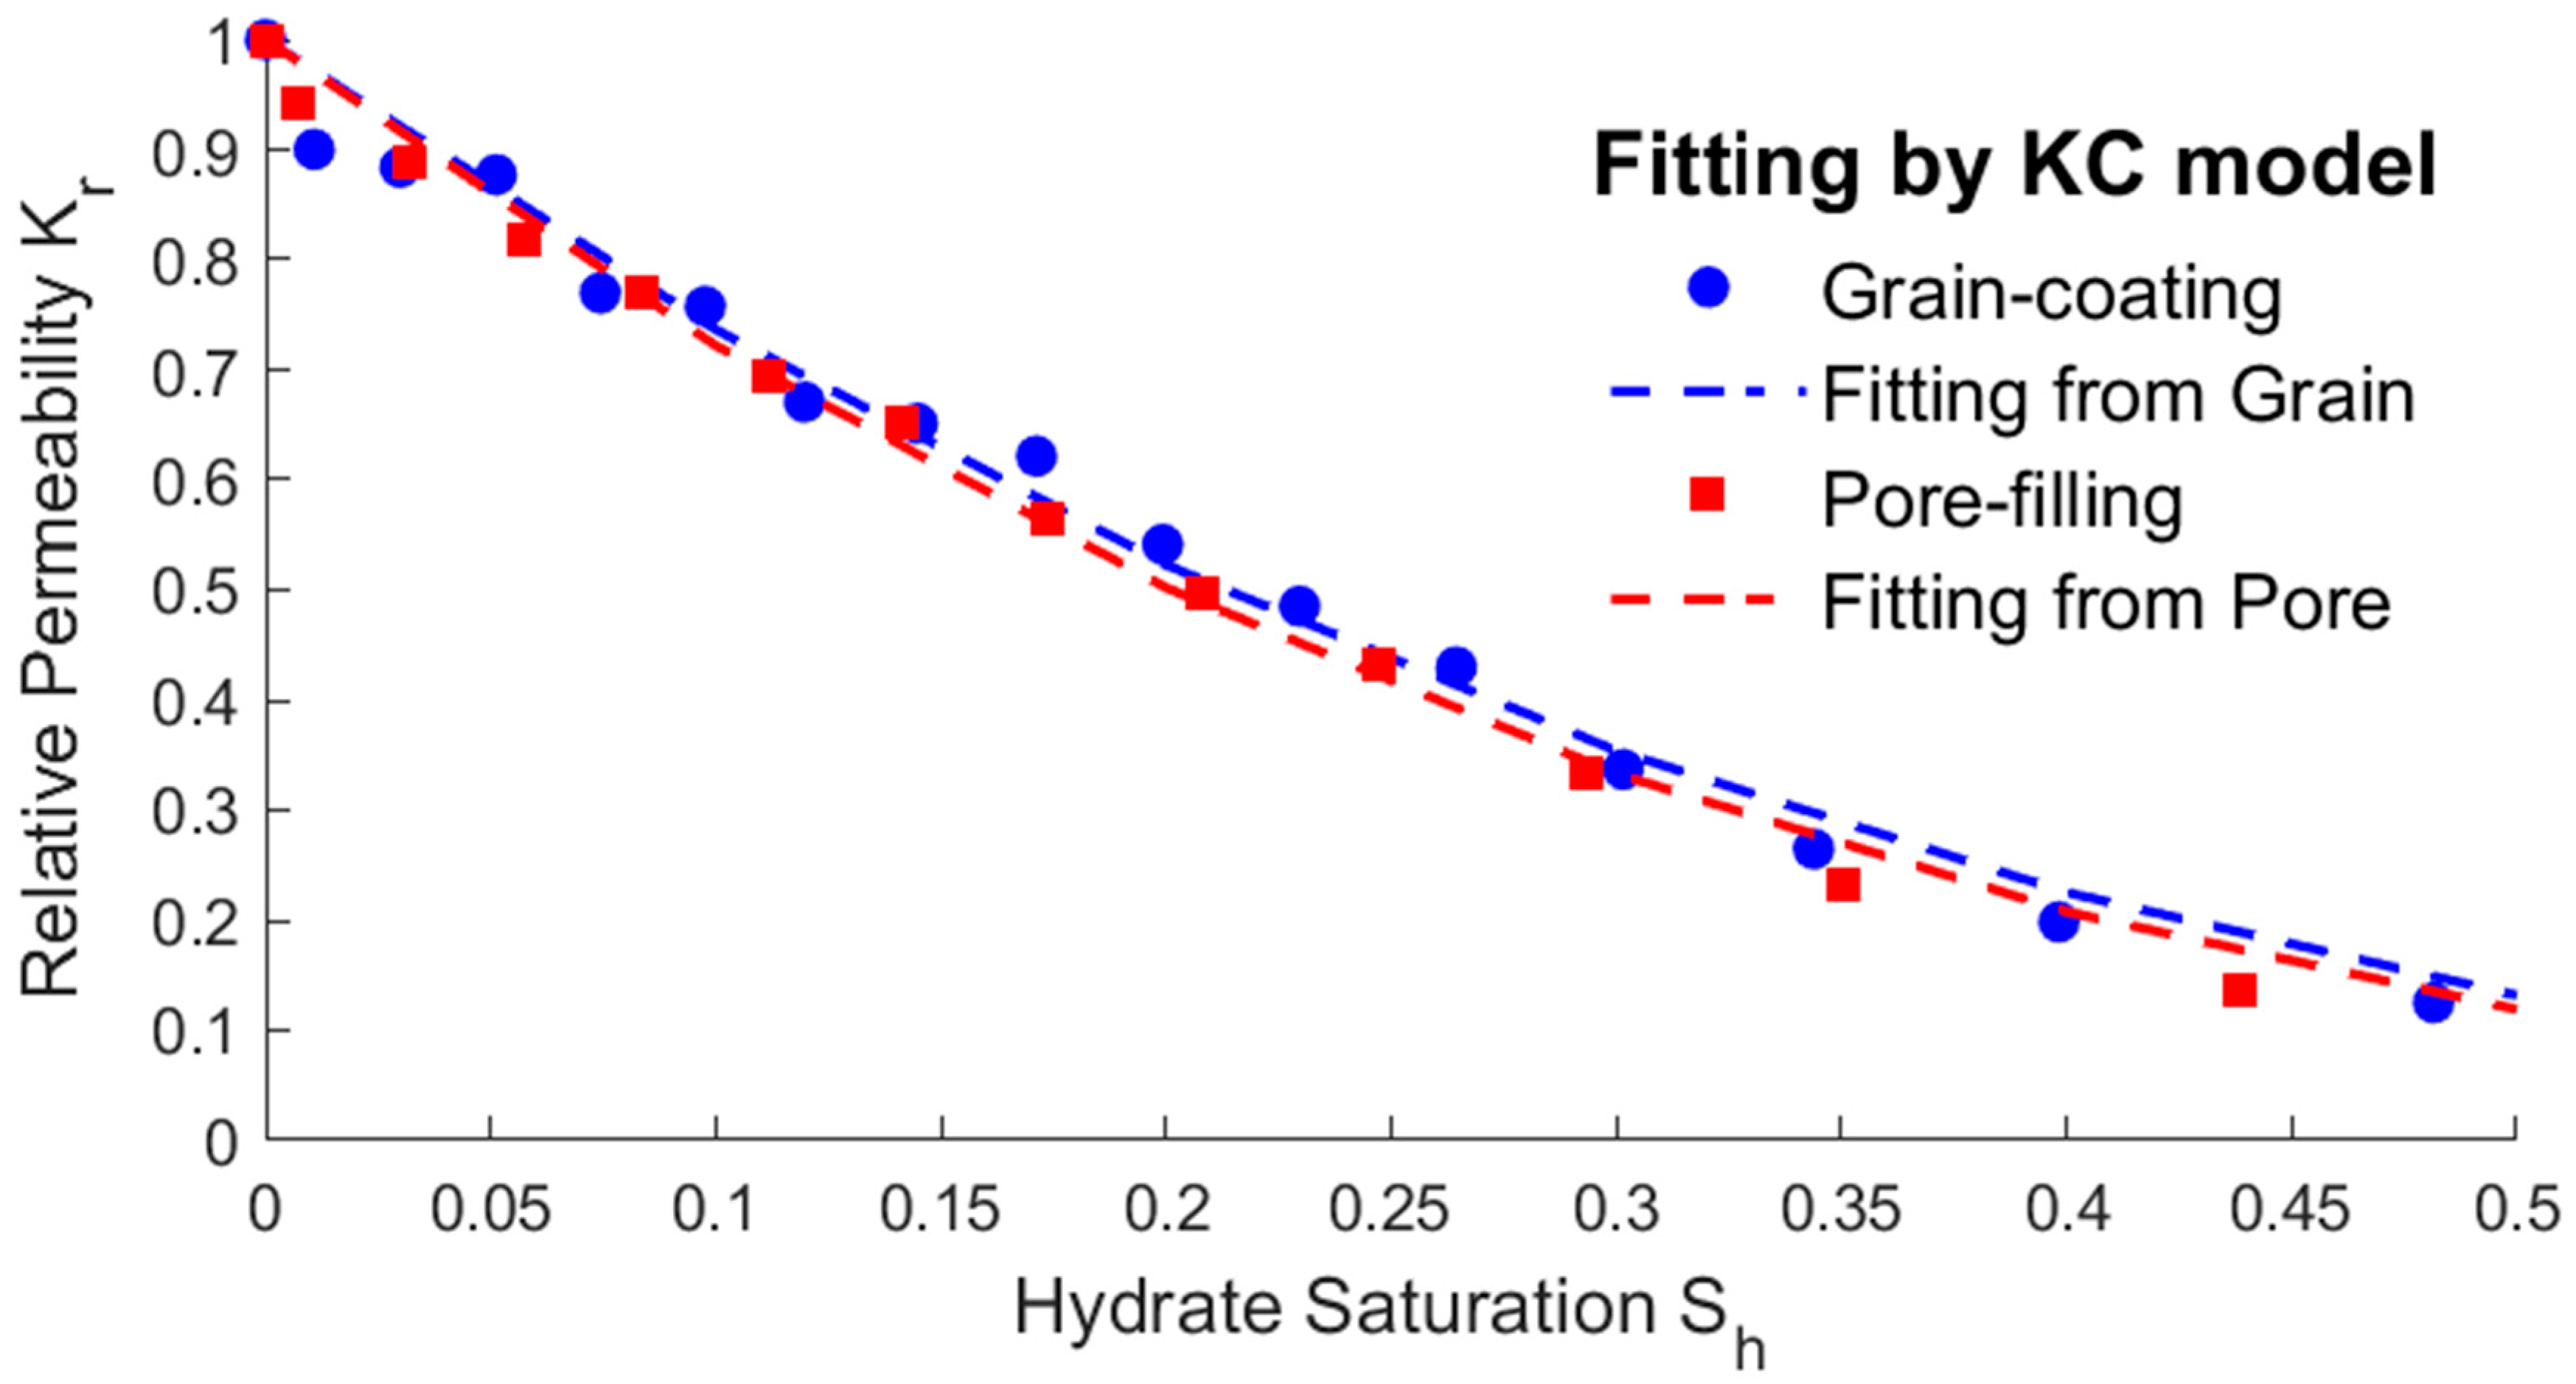
3.2. Relationship between Saturation and Permeability

Firstly, the solid boundary state in the model under different saturation conditions will be retained, as shown in the structure map in Figure 3. Then, the velocity and pressure field distributions under different solid boundary conditions were calculated using the BLGK method with eight partitions method. The approximate stable average permeability K a is calculated using Equation (12). The average permeability of the grain-coating model increased from 14 mD at the undissolved state to 116 mD at the totally dissolved state. The average permeability of the pore-filling model increased from 14 mD at the undissolved state to 107 mD at the totally dissolved state. Then, the average permeability was processed as dimensionless relative permeability K r , and it was found that the hydrate saturation S h and relative permeability K r basically conformed to the power exponential relationship. In this model, the relative permeability K r stands for the current permeability of different hydrate saturations with the permeability of the hydrate totally dissolved structure. According to the relevant literature, there are two typical models: the Masuda model (18) and KC model (19), which can describe the power exponential relationship [26,27]. The fitting results based on the calculation results are shown in Figure 5 and Equations (18) and (19).
K r = K K a = ( 1 S h ) n ,   { n = 2.92 , R 2 = 0.99 ( Grain - coating ) n = 3.09 , R 2 = 0 . 99 ( Pore - filling )
K r = K K a = ( 1 S h ) 3 ( 1 B × S h ) 2 ,     { B = 0.052 , R 2 = 0 . 99 ( Grain - coating ) B = 0 . 049 , R 2 = 0 . 99 ( Pore - filling )
From the fitting results above, the average permeability calculation results of different saturations can be obtained by using the steady-state LBM. The fitting results of the Masuda model and KC model are basically the same, which is consistent with the conclusions in the literature [26,27]. This method can be used to accurately show the expression of permeability by saturation and provide accurate results for other coupled parameters.

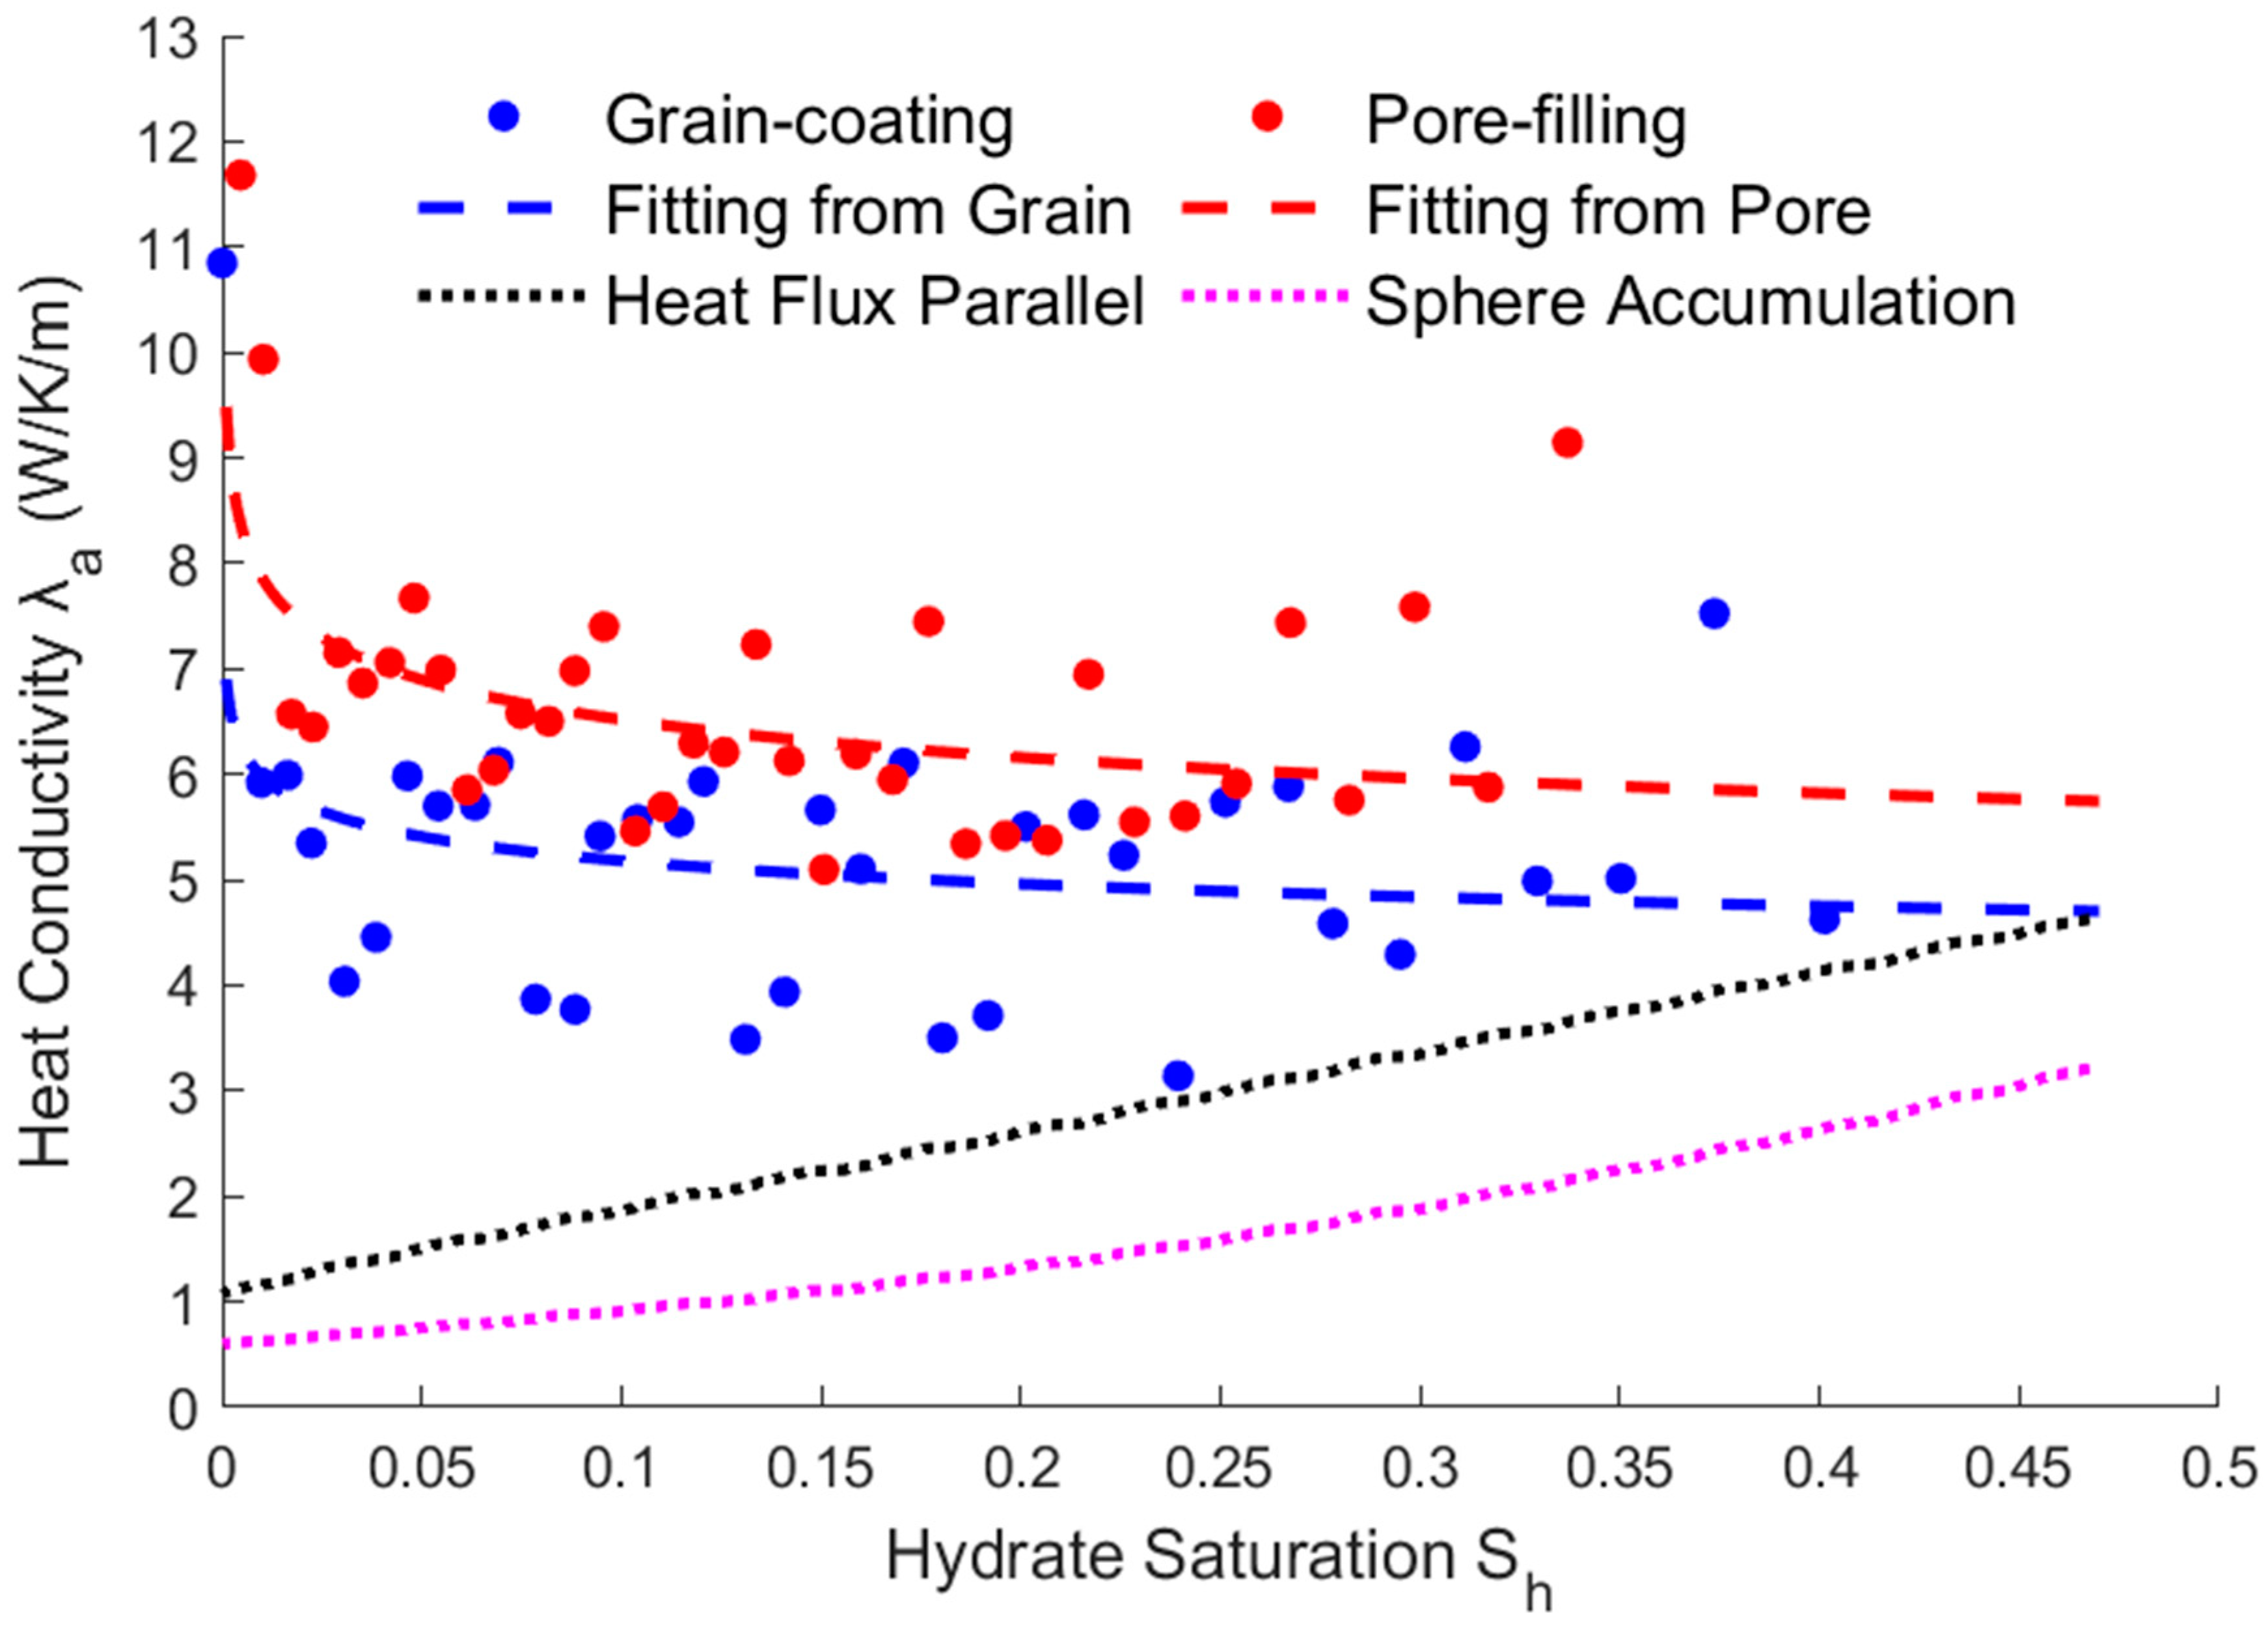
3.3. Relationship between Saturation and Heat Conductivity

The effective thermal conductivity can only be calculated using a non-steady-state method, because Equation (3) is a partial differential equation. Equation (13) can be used to calculate the effective heat conductivity at different hydrate saturations. According to the literature [28,29], if the medium of the porous is single or has a simple distribution, the average thermal conductivity can be directly calculated using the multi-component percentage weight of the hydrate, rock, and fluid. However, the porous structure of hydrate reservoirs is relatively complex. Therefore, the non-steady-state calculation results and component average calculation results of different structures are compared in Figure 6.
The simulation results are shown in Figure 5. The simulation results are significantly dispersed. Even if the time interval is increased, it is difficult to improve the fitting accuracy. Although the effective thermal conductivity fluctuates as the saturation decreases, the overall result gradually increases as the saturation decreases. The effective thermal conductivity of the grain-coating hydrate is smaller than that of the interval hydrate. Fitting the above calculation results, it is found that they can be approximately fitted by a power exponential equation, and the results are shown as follows.
λ a = a S h b { a = 4.49 , b = 0.062 ( Grain - coating ) , R 2 = 0 . 42 a = 5.40 , b = 0.082 ( Pore - filling ) , R 2 = 0 . 78
λ a = ϕ h λ h + ϕ s λ s + ϕ f λ f ( Heat   Flux   Parallel )
λ a = ( ϕ h λ h + ϕ s λ s ) 2 ( 1 ϕ f ) ( ϕ h λ h + ϕ s λ s ) + ( 1 + 2 ϕ f ) λ f ( 2 + ϕ f ) ( ϕ h λ h + ϕ s λ s ) + ( 1 ϕ f ) λ f ( Sphere   Accumulation )
Compared with the results of heat flux parallel and sphere accumulation, the rules are just the opposite. The reason is that, after the hydrates are reduced, the permeability increases, resulting in an increase in flow rate, and then the heat convection rate increases, resulting in an increase in the effective thermal conductivity.

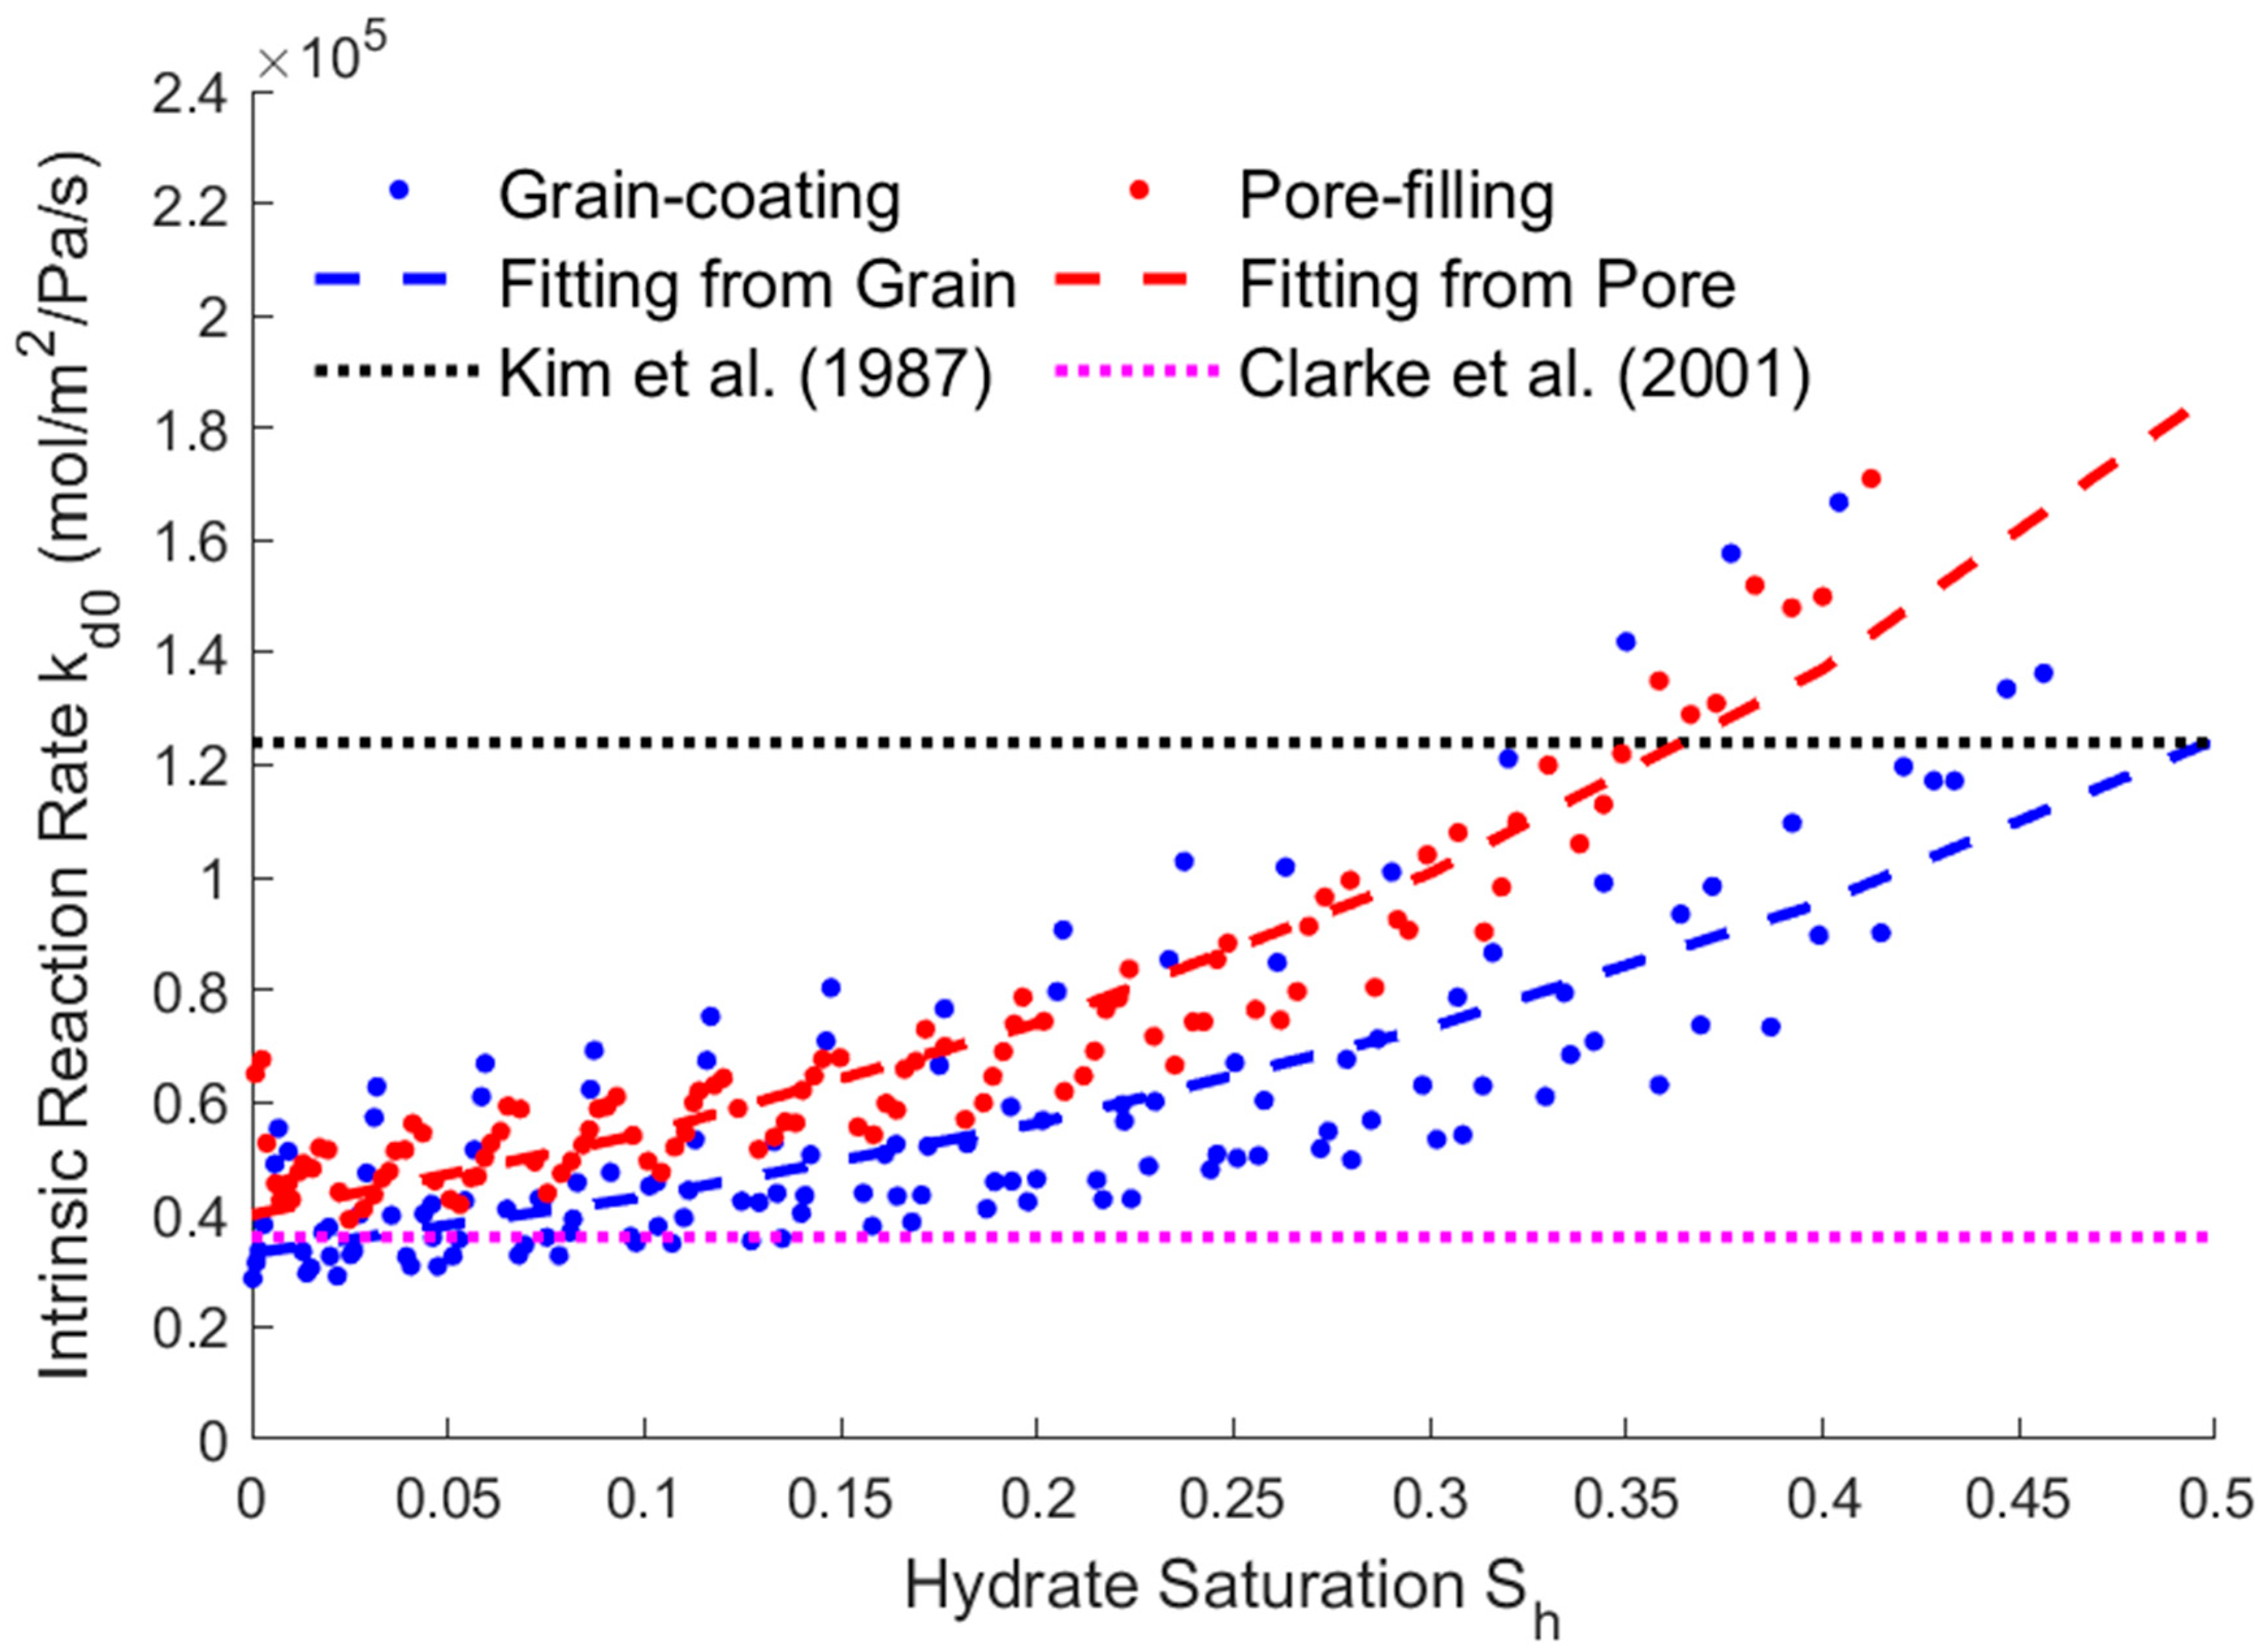
3.4. Relationship between Saturation and Reaction Rate

Calculate the average pressure P r ¯ at the activation reaction area, which is shown in Figure 2, then we can get the intrinsic activation reaction rate at different dissolving times or hydrate saturations by Equation (14). The simulation results are shown as follows.
It can be seen from Figure 7 that the intrinsic reaction rate gradually decreases with the decrease in saturation. Comparing the simulation results of two different structures, the intrinsic reaction rate of the grain-coating type hydrate is smaller than that of the pore-filling type. By fitting the results, the expressions of the intrinsic reaction rate can be obtained.
k d 0 = c e d S h { c = 3.31 × 10 4 , d = 2.65 , R 2 = 0.83 ( Grain - coating ) c = 3.99 × 10 4 , d = 3.08 , R 2 = 0.94 ( Pore - filling )
k d 0 = 1.24 × 10 5   mol / m 2 / Pa / s k d 0 = 3.6 × 10 4   mol / m 2 / Pa / s
Kim et al. used experimental methods to obtain the intrinsic activation reaction rate k d 0 [9]. However, Clarke et al. used a combination of experimental and numerical simulation methods to prove that Kim’s results may be too large [30]. The fitting results in Equation (21) show that, if thermal fluid injection dissociation was considered, k d 0 will be larger and related to the saturation S h .
Compared to the fitting results obtained above, the K-B model results are too large, because the actual reaction contact area under microscale conditions is not fully considered. Not all contact boundaries between solid hydrates and fluids, only the contact boundaries between hydrates and fluids in the activation reaction, are the actual reaction contact areas A h s . Clarke’s simulation results obtained a fixed value, because it did not fully consider the influence of the temperature gradient under microscale conditions. Although the inlet temperature T i n remains unchanged during the dissociation process, the front of the activation reaction gradually advances as the hydrate dissolves. By comparing the structural field and temperature field results at different times in Figure 3, it is shown that the distance between the dissolving lattices (green) and the entrance gradually increases as the saturation decreases, so the temperature gradient of the model decreases as the saturation decreases. Therefore, the intrinsic reaction rate of hydrates is actually correlated with the hydrate saturation, and the K-B model can be further modified.

4. Conclusions

In this paper, the DDF-LBM was used to simulate the dissociation of natural gas hydrate caused by a thermal fluid injection under a microscale porous model. The simulation results were solved by the unsteady difference method, and it was found that the dissociation rate of the thermal fluid injection was higher than that of surface heat absorption only. According to the simulated velocity field, pressure field, temperature field, and structure field results, the key physical parameters under different hydrate saturation conditions were calculated, and their exponential fitting equations were given. The fitting results were compared with those from other literature, which further proved that the DDF-LBM was feasible and realized the THMC fully multi-field coupled dynamic simulation of thermal fluid injection to dissolve natural gas hydrates. Based on the above results, the following conclusions can be drawn.
(1)
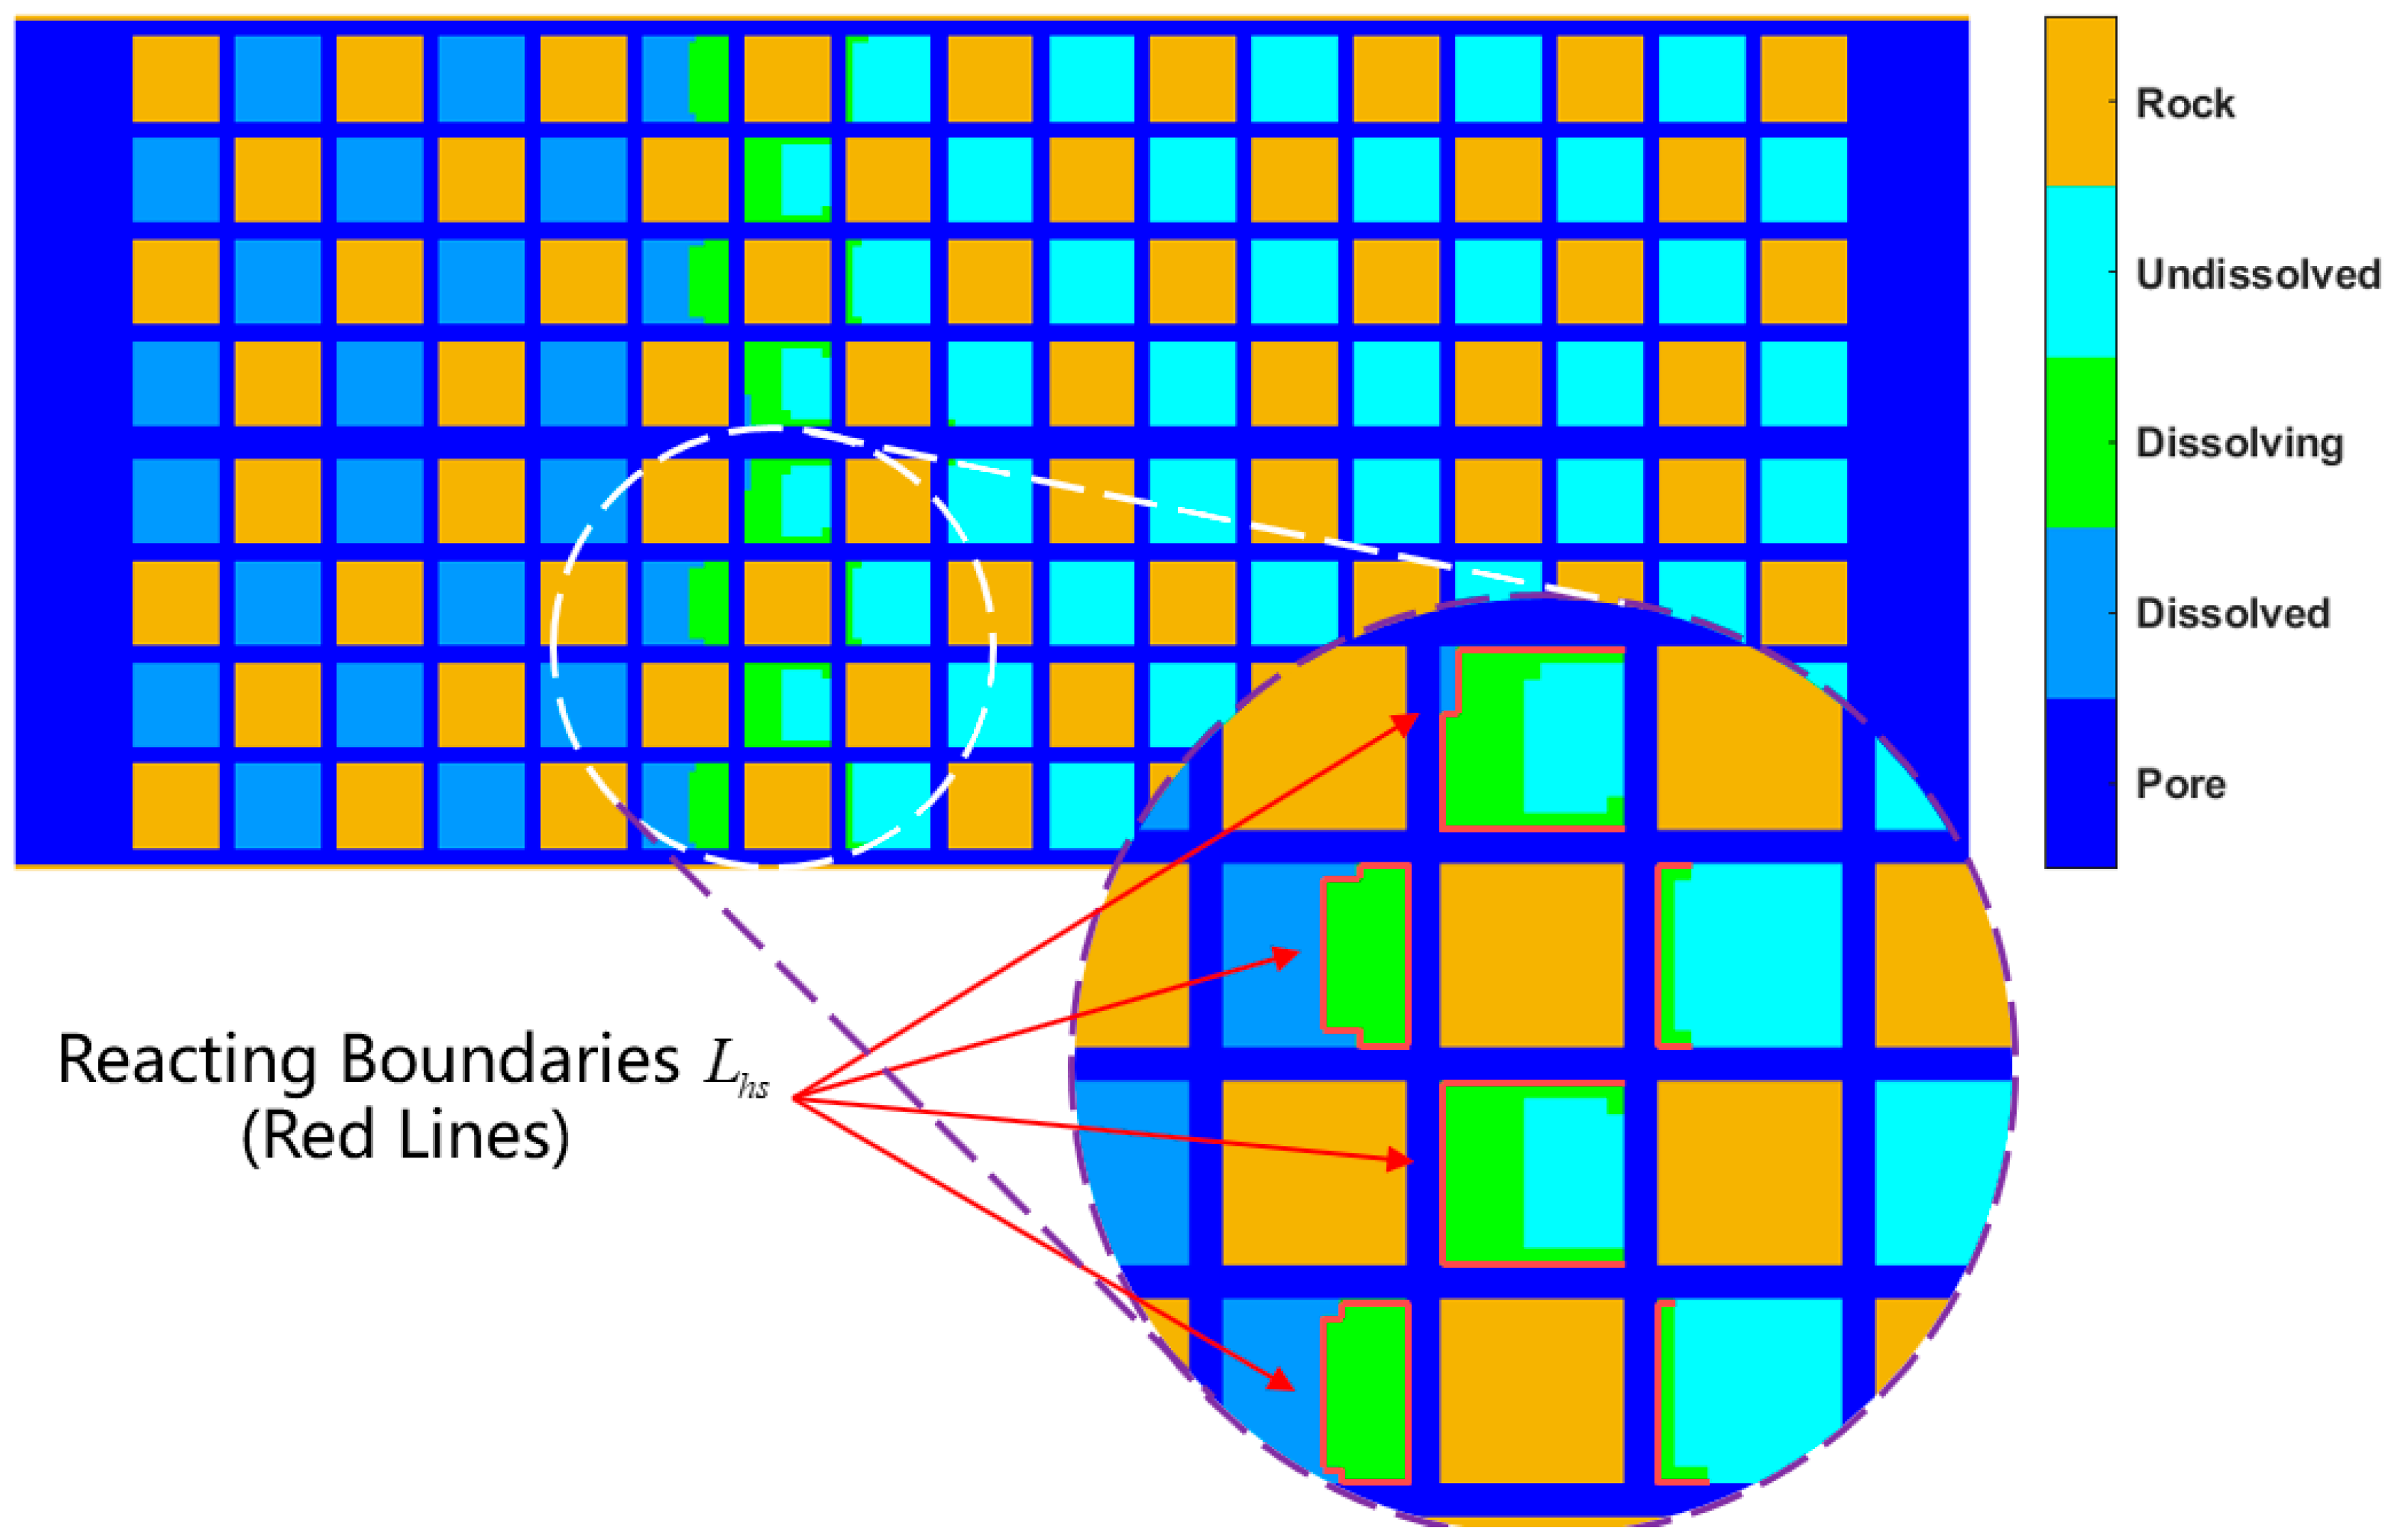
When DDF-LBM simulates conjugate convection, the relaxation frequency of the thermal lattice in the pores needs to be modified to consider the simultaneous existence of thermal diffusion and thermal convection. The modification is necessary when simulating forced convection heat transfer; otherwise, the calculated results will be much smaller. When describing the changes in fluid–solid boundaries, we must first determine whether the current solid hydrate lattices have reached the P-T phase equilibrium condition and then determine whether the cumulative internal energy absorbed by the current lattice exceeds the heat required for its reaction. The lattices that have reached phase equilibrium conditions but do not satisfy the cumulative endothermic conditions are dissolving solid hydrate lattices, and their contact boundaries with the flowing lattices are the reacting contact areas in the K-B model. The reaction contact area can be directly obtained from the structural field simulation results, so that the effect of dissociation endothermicity on internal energy transfer in the convective heat transfer process can be described at the microscale.
(2)
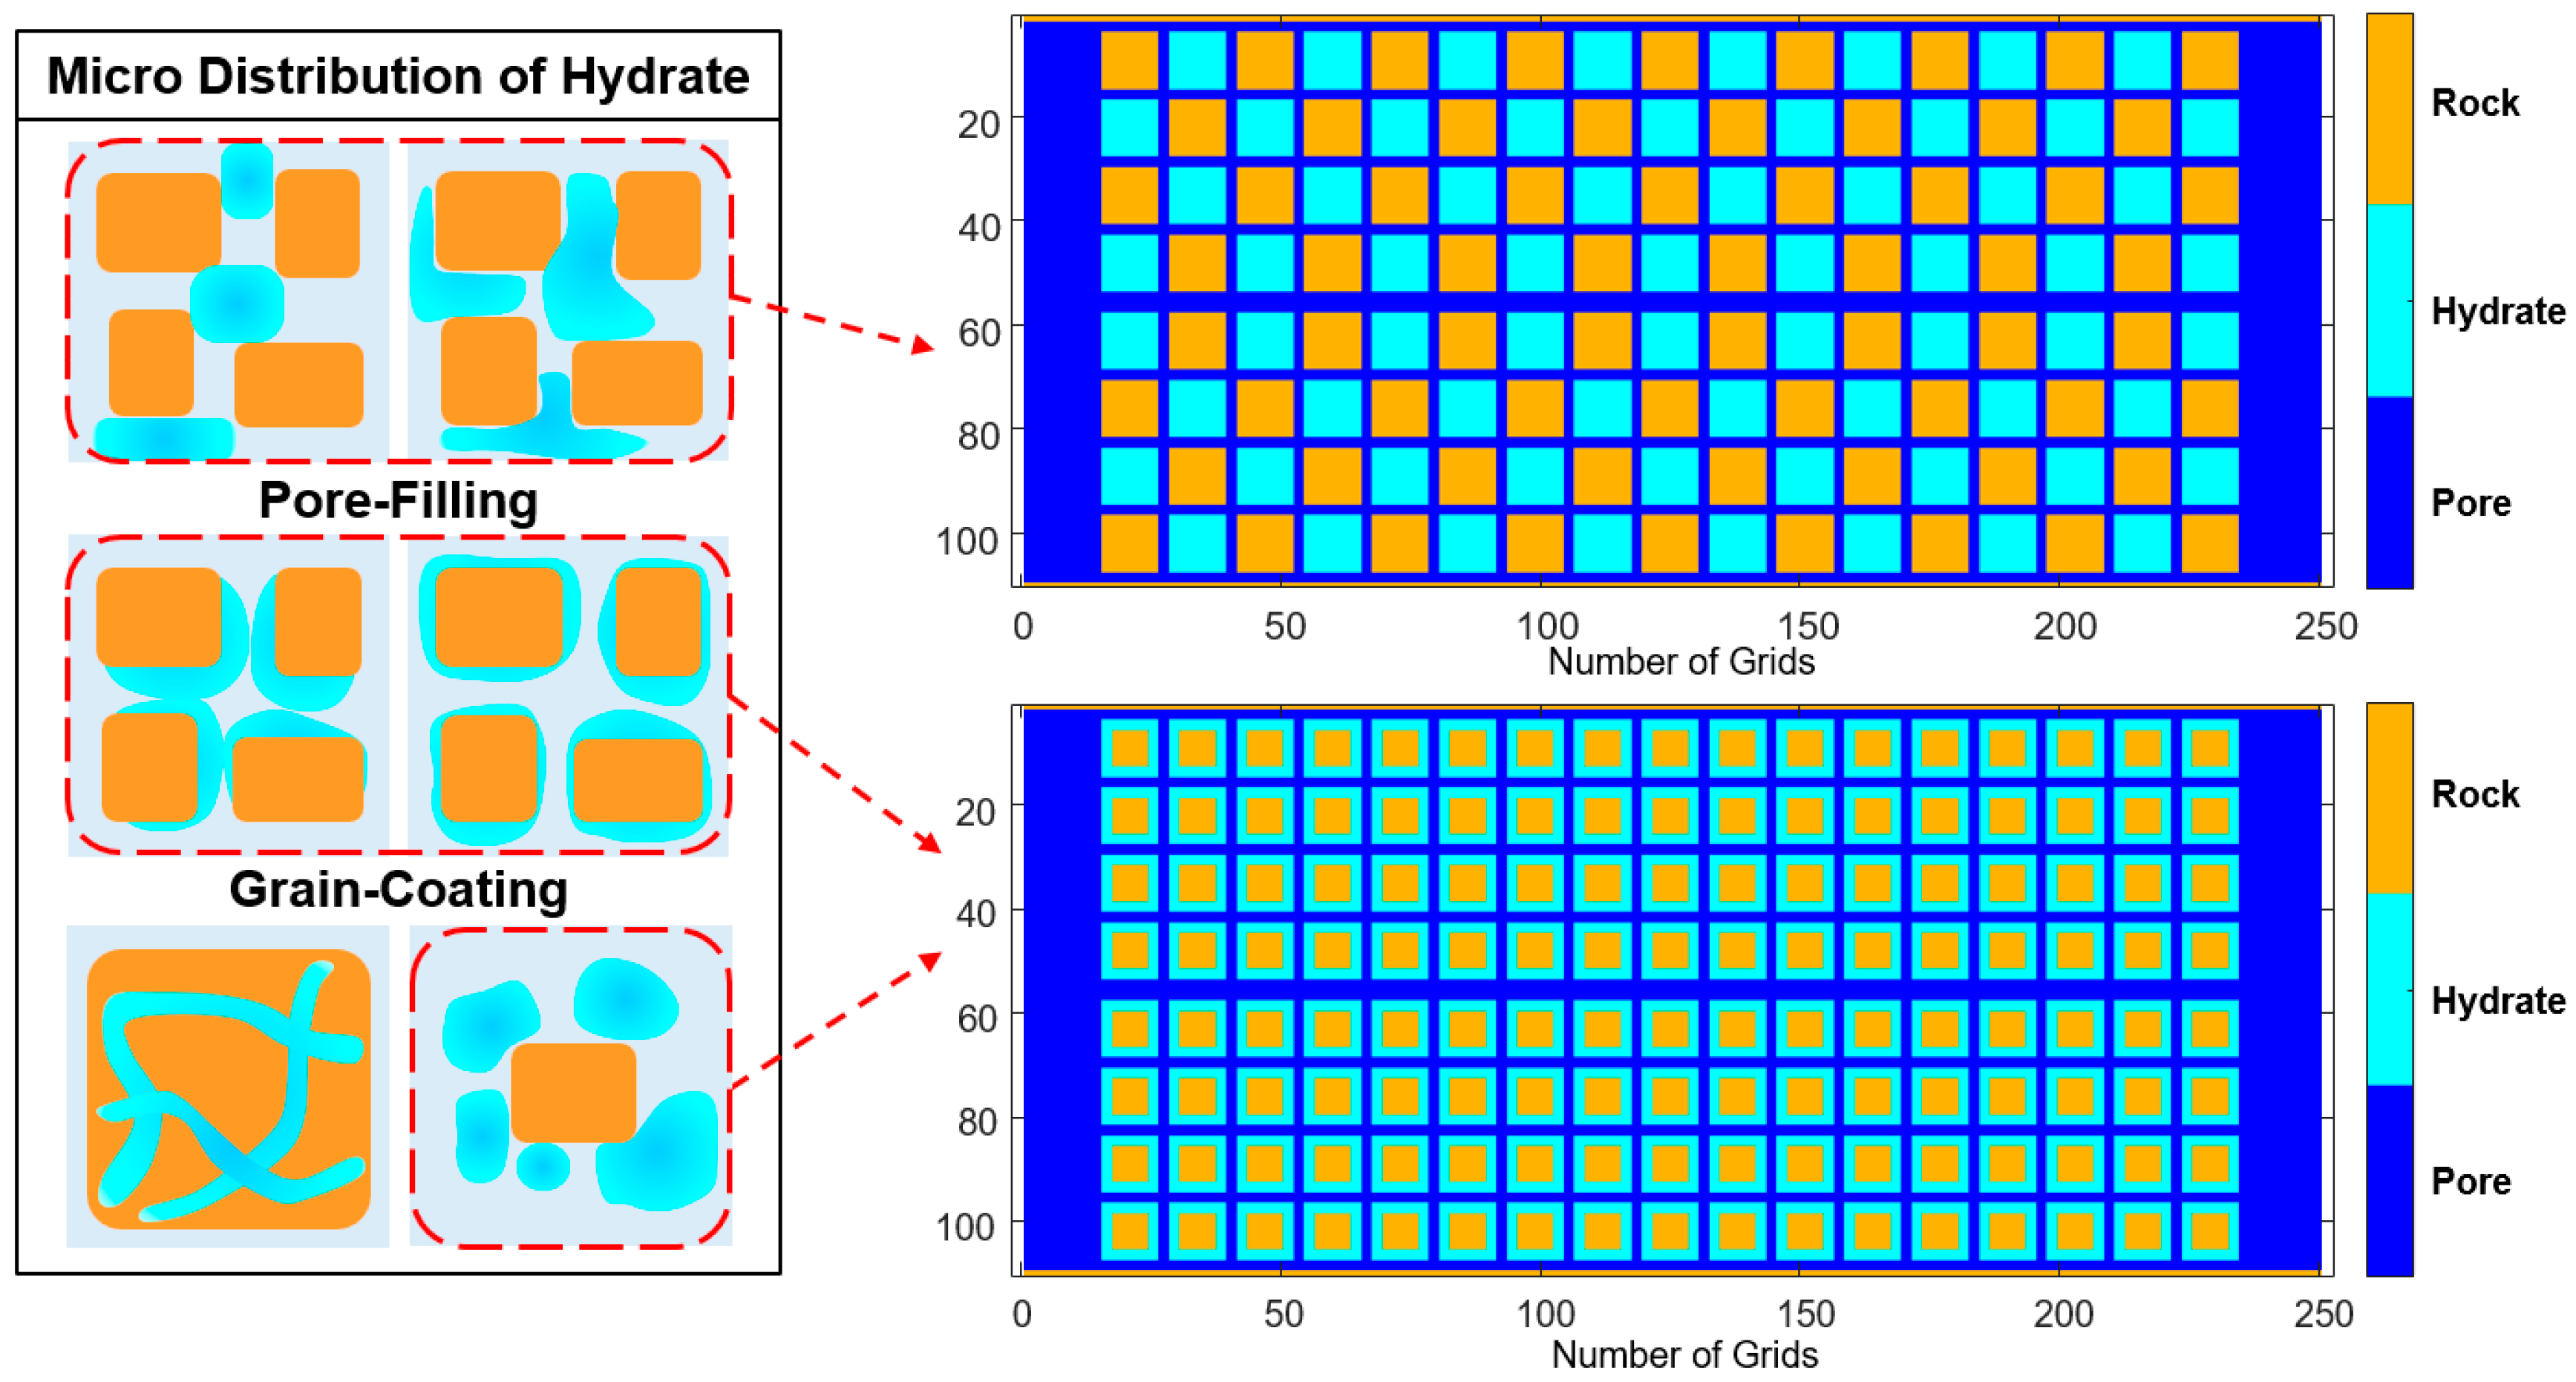
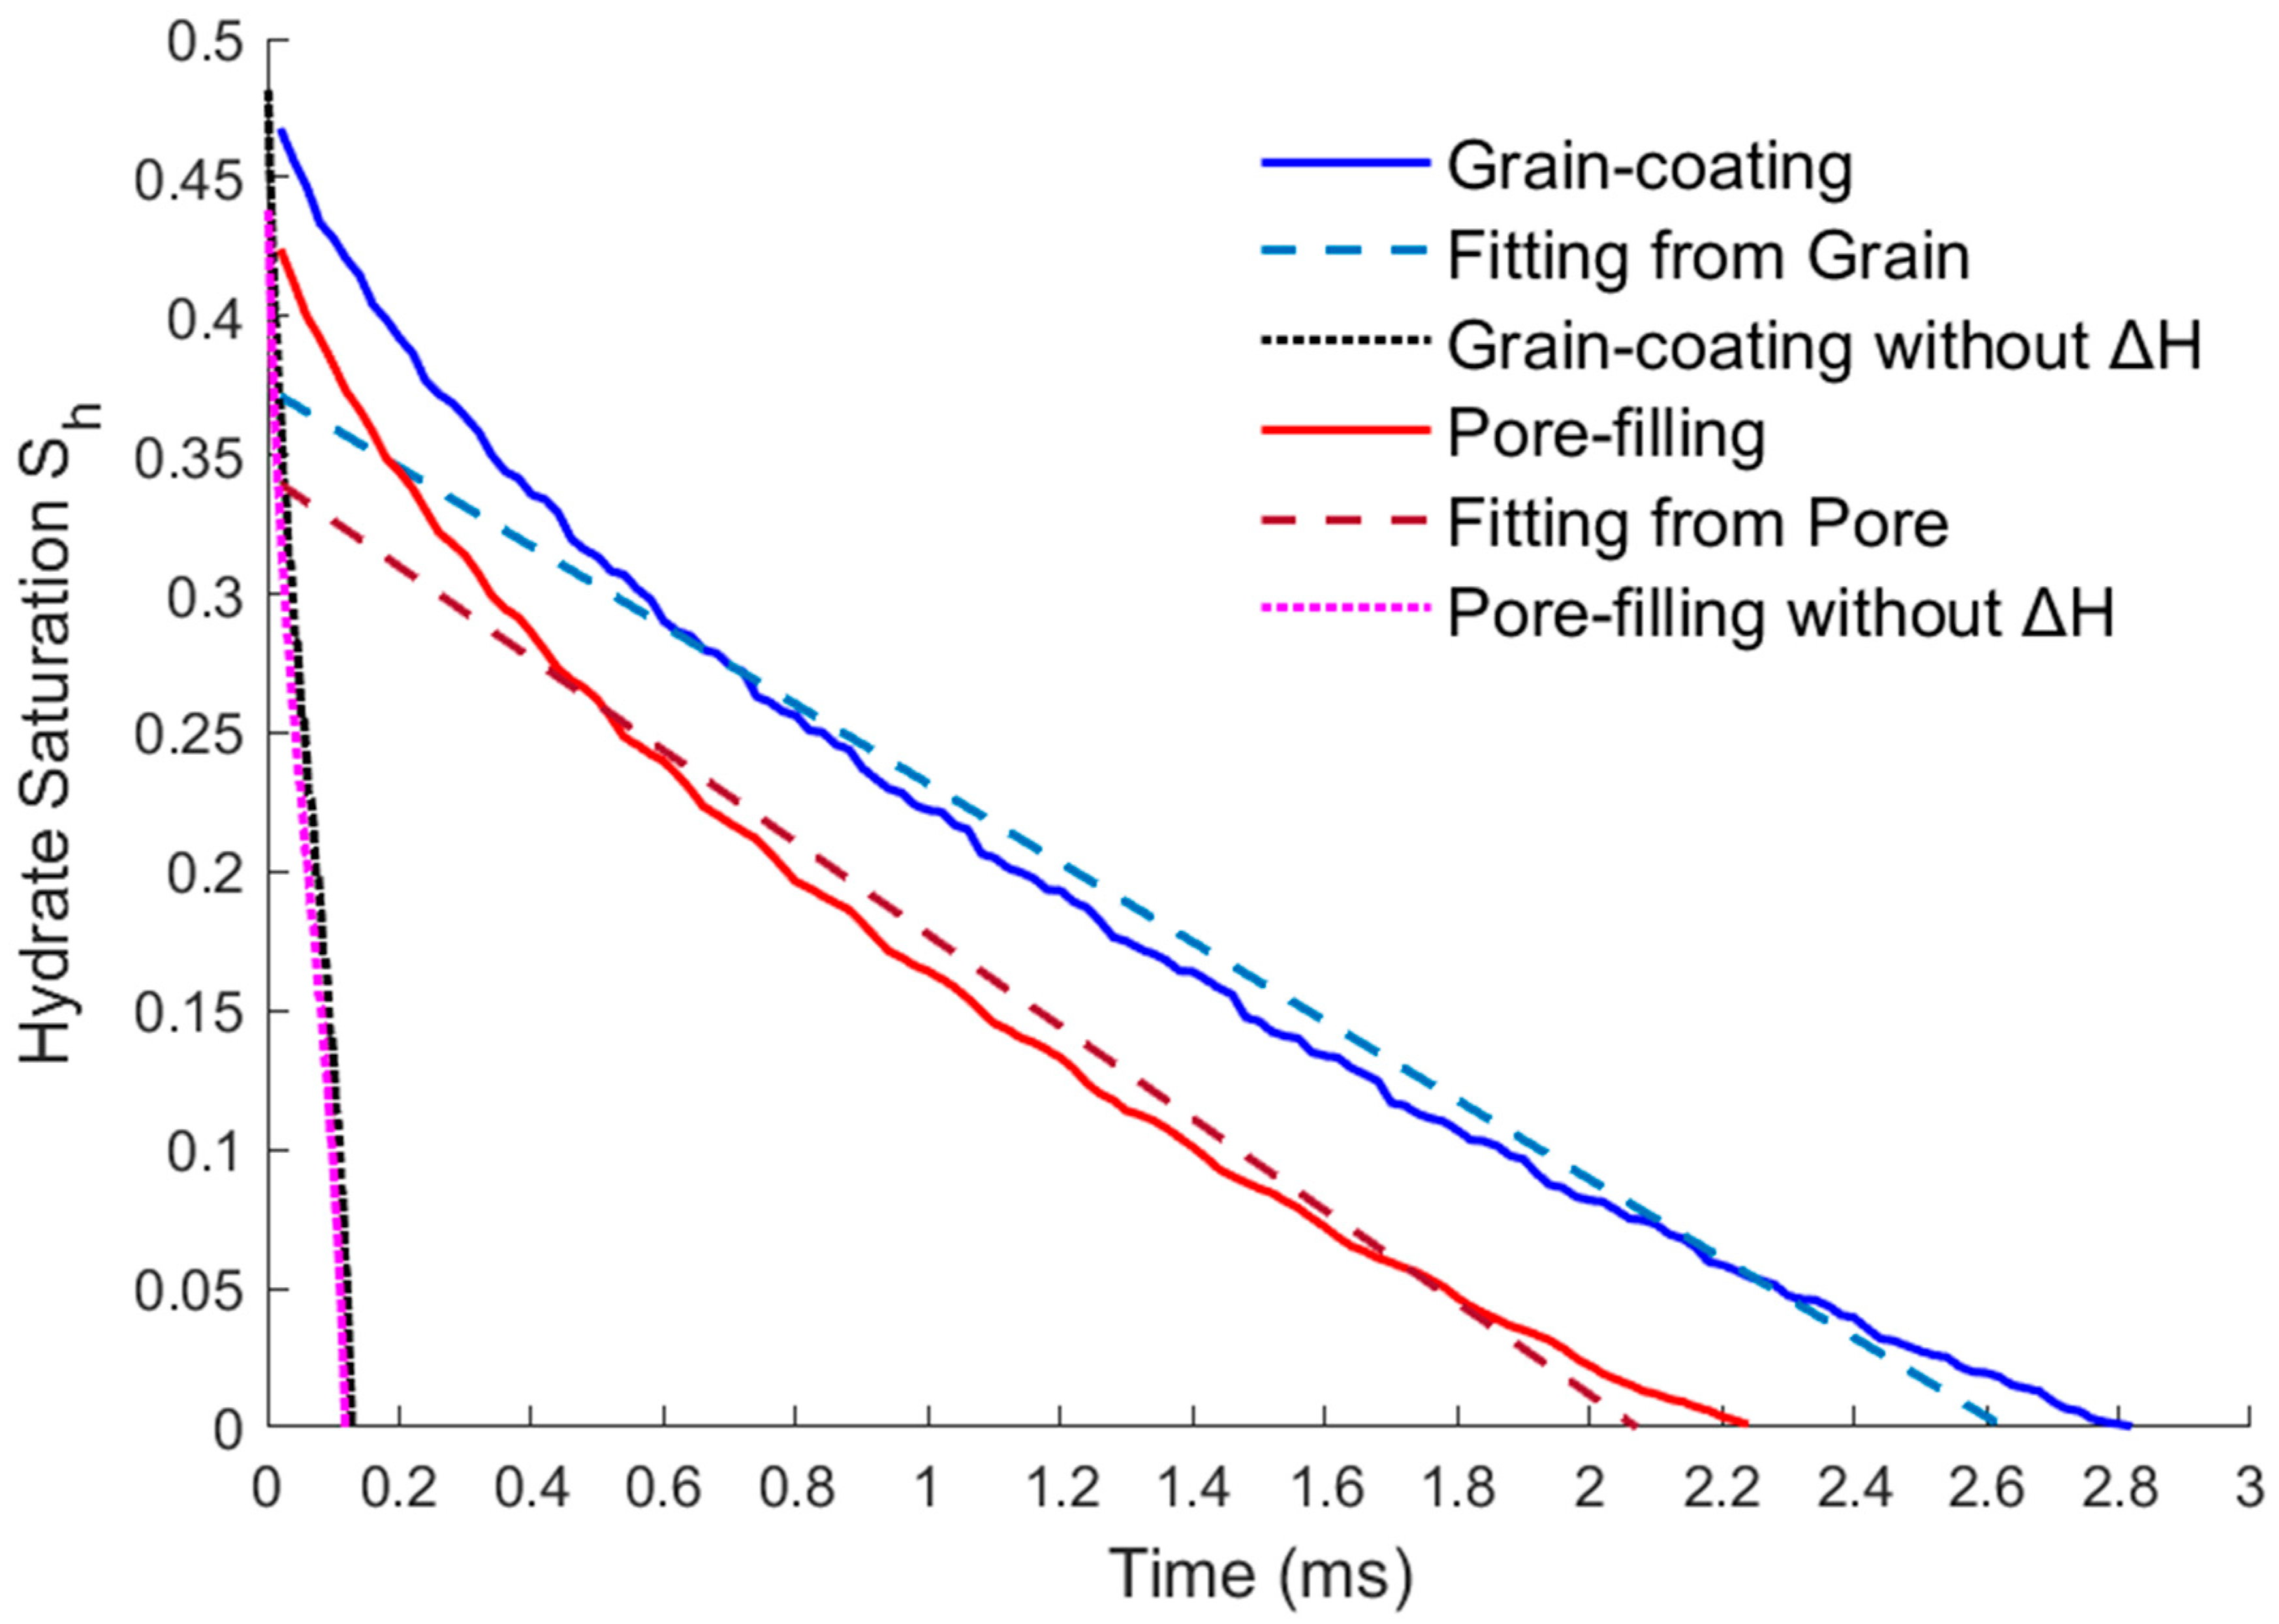
By comparing the results of heating dissociation experiments in closed containers in other literature, the hydrate dissociation rate under the thermal fluid injection conditions simulated in this paper is higher than the result of only heat absorption on the surface. This is because the dissociation rate obtained from the experiments in the literature was based on surface heat diffusion only and did not take into account the actual situation of thermal fluid flowing under the porous structure of the reservoir. Therefore, the activation reaction rate calculated by DDF-LBM is more consistent with the real reservoir situation. Comparing the dissociation rates of the grain-coating type and the pore-filling type, although the hydrate structures and initial saturations of the two models are different, their dissociation rates are basically the same due to the same boundary conditions of the injection flow velocity and temperature. It is shown that the DDF-LBM simulation with THMC multi-field coupling in this paper can approximately and accurately describe the hydrate dissociation process when thermal fluid injected into porous media.
(3)
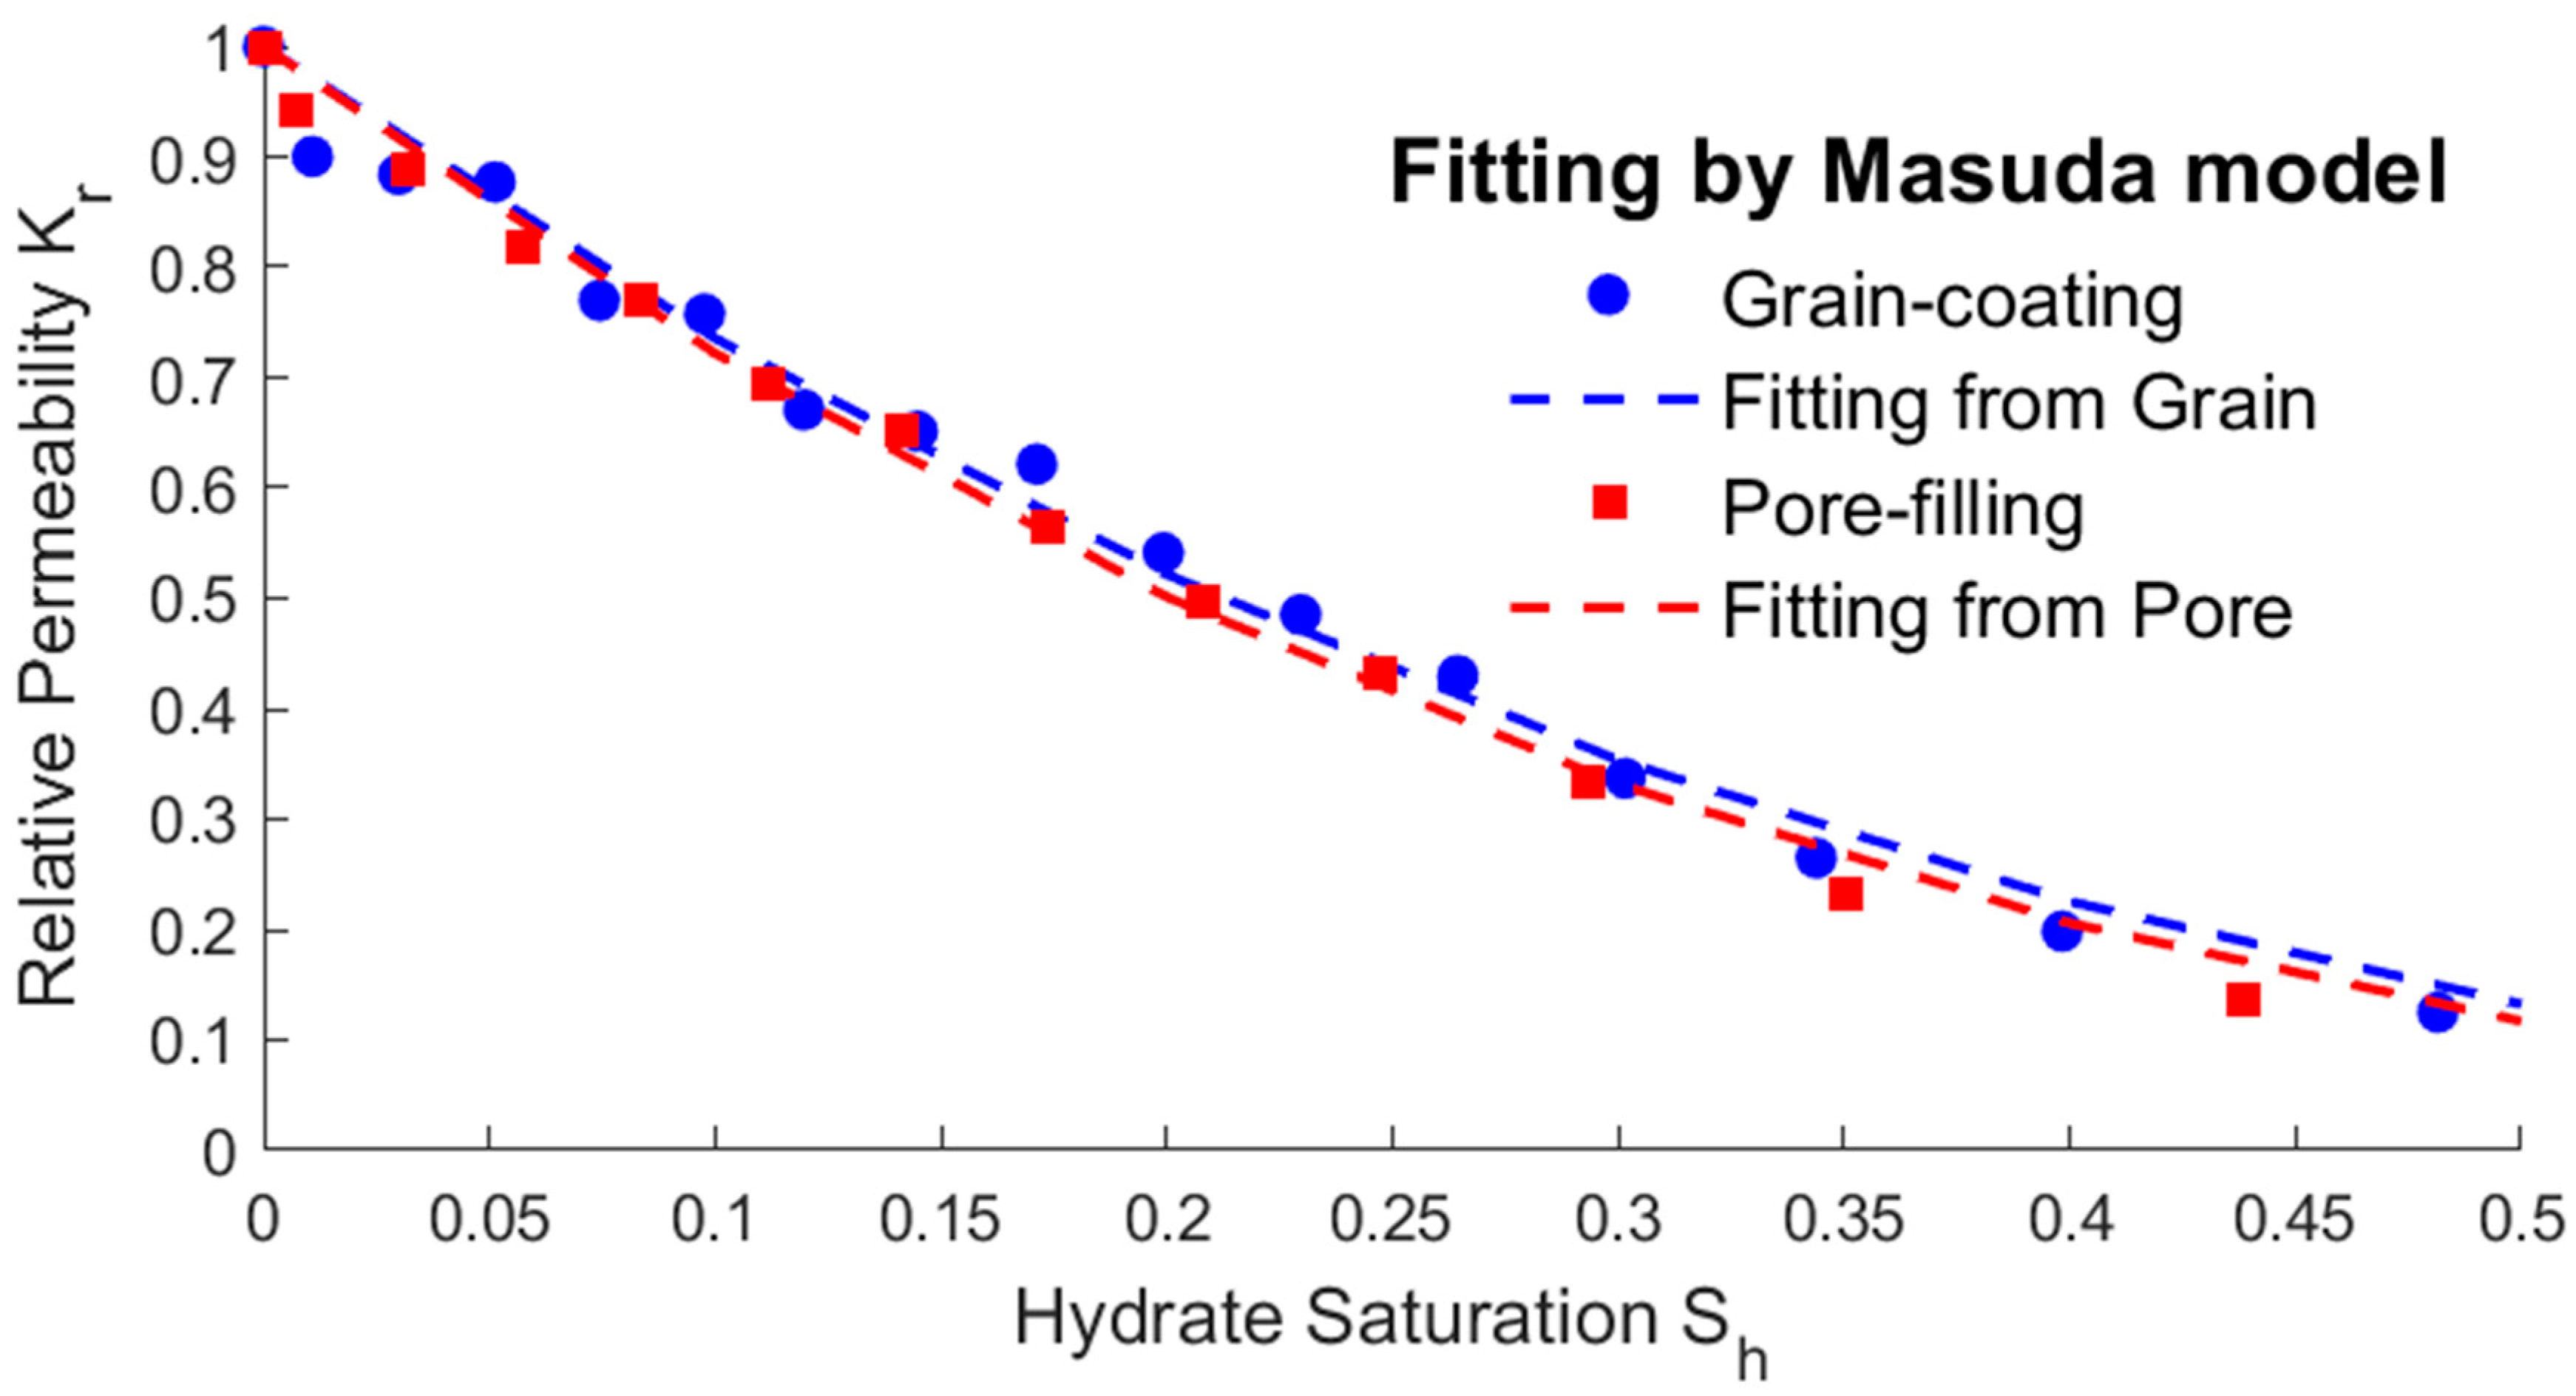
The modified expressions of the key physical parameters of THMC multi-field coupling can be obtained by fitting the hydrate saturation with the average permeability, effective thermal conductivity, and intrinsic reaction rate. The fitting results show that the parameters’ trending of two different storage structures are the same. The average permeability increases as the saturation decreases, and the relative permeability has an exponential relationship with the saturation. The effective thermal conductivity increases slightly with the decreasing saturation and increases substantially when most of the hydrates are dissolved. Therefore, there is an approximate linear or exponential relationship between the effective thermal conductivity and the saturation, and a power exponential equation was used for fitting in this paper. The intrinsic reaction rate decreases with the decreasing saturation, which is different from the fixed value given by the K-B model in the literature. This is because the model does not fully consider the impact of the temperature gradient and reaction contact area on the results at the microscale, so the K-B model can be further modified. The above modified expressions of the key parameters can provide necessary references for simulating the real-time full coupling of thermal fluid injection into hydrates under macros-scale conditions.

Author Contributions

Conceptualization, analysis, and writing, Z.L.; methodology and supervision, Z.W.; resources and validation, H.J. All authors have read and agreed to the published version of the manuscript.

Funding

This research was funded by National Natural Science Foundation of China (No. 51974350, No. 51991363).

Data Availability Statement

The original codes for this research can be found online.

Conflicts of Interest

Author Hongfei Ji was employed by CNPC Engineering Technology R&D Company Limited. The remaining authors declare that the research was conducted in the absence of any commercial or financial relationships that could be construed as a potential conflict of interest.

References

  1. Wang, Z.; Zhang, Y.; Peng, Z.; Shan, Z.; Sun, B.; Sun, J. Recent advances in methods of gas recovery from hydrate-bearing sediments: A Review. Energy Fuels 2022, 36, 5550–5593. [Google Scholar] [CrossRef]
  2. Wang, X.; Sun, B.; Wang, Z.; Gao, Y.; Li, H. Coupled heat and mass transfer model of gas migration during well cementing through a hydrate layer in deep-water regions. Appl. Therm. Eng. 2019, 163, 114383. [Google Scholar] [CrossRef]
  3. Wang, Z.; Liao, Y.; Zhang, W.; Sun, B.; Sun, X.; Deng, X. Coupled temperature field model of gas-hydrate formation for thermal fluid fracturing. Appl. Therm. Eng. 2018, 133, 160–169. [Google Scholar] [CrossRef]
  4. Rathnaweera, T.D.; Wu, W.; Ji, Y.; Gamage, R.P. Understanding injection-induced seismicity in enhanced geothermal systems: From the coupled thermo-hydro-mechanical-chemical process to anthropogenic earthquake prediction. Earth-Sci. Rev. 2020, 205, 103182. [Google Scholar] [CrossRef]
  5. Li, Q.; Liu, J.; Wang, S.; Guo, Y.; Han, X.; Li, Q.; Chen, Y.; Dong, Z.; Li, X.; Zhang, X. Numerical insights into factors affecting collapse behavior of horizontal wellbore in clayey silt hydrate-bearing sediments and the accompanying control strategy. Ocean Eng. 2024, 297, 117029. [Google Scholar] [CrossRef]
  6. Li, Q.; Cheng, Y.; Li, Q.; Ansari, U.; Liu, Y.; Yan, C.; Lei, C. Development and verification of the comprehensive model for physical properties of hydrate sediment. Arab. J. Geosci. 2018, 11, 325. [Google Scholar] [CrossRef]
  7. Huang, J.; Yin, X.; Barrufet, M.; Killough, J. Lattice Boltzmann simulation of phase equilibrium of methane in nanopores under effects of adsorption. Chem. Eng. J. 2021, 419, 129625. [Google Scholar] [CrossRef]
  8. Liu, Y.; Hou, J.; Zhao, H.; Liu, X.; Xia, Z. A method to recover natural gas hydrates with geothermal energy conveyed by CO2. Energy 2018, 144, 265–278. [Google Scholar] [CrossRef]
  9. Kim, H.C.; Bishnoi, P.R.; Heidemann, R.A.; Rizvi, S.S. Kinetics of methane hydrate decomposition. Chem. Eng. Sci. 1987, 42, 1645–1653. [Google Scholar] [CrossRef]
  10. Sun, X.; Luo, T.; Wang, L.; Wang, H.; Song, Y.; Li, Y. Numerical simulation of gas recovery from a low-permeability hydrate reservoir by depressurization. Appl. Energy 2019, 250, 7–18. [Google Scholar] [CrossRef]
  11. Moridis, G.J. User’s Manual for the Hydrate v1.5 Option of TOUGH+ v1.5: A Code for the Simulation of System Behavior in Hydrate-Bearing Geologic Media; Lawrence Berkeley National Laboratory: California, CA, USA, 2014. [Google Scholar]
  12. Karani, H.; Huber, C. Lattice Boltzmann formulation for conjugate heat transfer in heterogeneous media. Phys. Rev. E 2015, 91, 023304. [Google Scholar] [CrossRef] [PubMed]
  13. Huo, Y.; Rao, Z. Lattice Boltzmann simulation for solid–liquid phase change phenomenon of phase change material under constant heat flux. Int. J. Heat Mass Transf. 2015, 86, 197–206. [Google Scholar] [CrossRef]
  14. He, Y.L.; Liu, Q.; Li, Q.; Tao, W.Q. Lattice Boltzmann methods for single-phase and solid-liquid phase-change heat transfer in porous media: A review. Int. J. Heat Mass Transf. 2019, 129, 160–197. [Google Scholar] [CrossRef]
  15. Zhang, L.; Zhang, C.; Zhang, K.; Zhang, L.; Yao, J.; Sun, H.; Yang, Y. Pore-scale investigation of methane hydrate dissociation using the lattice Boltzmann method. Water Resour. Res. 2019, 55, 8422–8444. [Google Scholar] [CrossRef]
  16. Ji, Y.; Kneafsey, T.J.; Hou, J.; Zhao, J.; Liu, C.; Guo, T.; Wei, B.; Zhao, E.; Bai, Y. Relative permeability of gas and water flow in hydrate-bearing porous media: A micro-scale study by lattice Boltzmann simulation. Fuel 2022, 321, 124013. [Google Scholar] [CrossRef]
  17. Ross-Jones, J.; Gaedtke, M.; Sonnick, S.; Meier, M.; Rädle, M.; Nirschl, H.; Krause, M.J. Pore-scale conjugate heat transfer simulations using lattice Boltzmann methods for industrial applications. Appl. Therm. Eng. 2021, 182, 116073. [Google Scholar] [CrossRef]
  18. Zhang, J.; Yin, Z.; Khan, S.A.; Li, S.; Li, Q.; Liu, X.; Linga, P. Path-dependent morphology of CH 4 hydrates and their dissociation studied with high-pressure microfluidics. Lab A Chip 2024, 24, 1602–1615. [Google Scholar] [CrossRef]
  19. Yang, J.; Xu, Q.; Liu, Z.; Shi, L. Pore-scale study of the multiphase methane hydrate dissociation dynamics and mechanisms in the sediment. Chem. Eng. J. 2022, 430, 132786. [Google Scholar] [CrossRef]
  20. Woods, L.C. An Introduction to the Kinetic Theory of Gases and Magnetoplasmas; Oxford University Press: London, UK, 1993. [Google Scholar]
  21. Li, J.; Liang, Z.; Wang, Z.; Bao, W. Molecular dynamics simulation of decomposition of methane hydrate and interfacial characteristics in nanostructure region. Int. J. Thermophys. 2020, 41, 13. [Google Scholar] [CrossRef]
  22. Guo, B.; Zhang, P.; Zhang, H. Mathematical modeling of heat transfer from geothermal reservoirs to gas hydrate reservoirs. In Proceedings of the Applied Energy Symposium: MIT A+ B, Cambridge, MA, USA, 5–8 July 2022. [Google Scholar]
  23. Mohamad, A.A. Lattice Boltzmann Method: Fundamentals and Engineering Applications with Computer Codes, 2nd ed.; Springer: London, UK, 2019. [Google Scholar]
  24. Gaedtke, M.; Abishek, S.; Mead-Hunter, R.; King, A.J.; Mullins, B.J.; Nirschl, H.; Krause, M.J. Total enthalpy-based lattice Boltzmann simulations of melting in paraffin/metal foam composite phase change materials. Int. J. Heat Mass Transf. 2020, 155, 119870. [Google Scholar] [CrossRef]
  25. Kamath, V.A.; Holder, G.D. Dissociation heat transfer characteristics of methane hydrates. AIChE J. 1987, 33, 347–350. [Google Scholar] [CrossRef]
  26. Masuda, Y. Numerical calculation of gas-production performance from reservoirs containing natural gas hydrates. In Proceedings of the SPE Asia Pacific Oil & Gas Conference & Exhibition, Kuala Lumpur, Malaysia, 14–16 April 1997. [Google Scholar]
  27. Dai, S.; Seol, Y. Water permeability in hydrate-bearing sediments: A pore-scale study. Geophys. Res. Lett. 2014, 41, 4176–4184. [Google Scholar] [CrossRef]
  28. Zhu, W.; Kan, A.; Chen, Z.; Zhang, Q.; Zhang, J. A modified Lattice Boltzmann method for predicting the effective thermal conductivity of open-cell foam materials. Int. Commun. Heat Mass Transf. 2022, 133, 105957. [Google Scholar] [CrossRef]
  29. Qin, X.; Cai, J.; Zhou, Y.; Kang, Z. Lattice Boltzmann simulation and fractal analysis of effective thermal conductivity in porous media. Appl. Therm. Eng. 2020, 180, 115562. [Google Scholar] [CrossRef]
  30. Clarke, M.; Bishnoi, P.R. Determination of the activation energy and intrinsic rate constant of methane gas hydrate decomposition. Can. J. Chem. Eng. 2001, 79, 143–147. [Google Scholar] [CrossRef]
Figure 1. Two different microstructures of typical hydrate reservoirs.
Water 16 02734 g001
Figure 2. The dissolved and dissolving lattice, including reacting boundaries.
Water 16 02734 g002
Figure 3. Cloud maps of the structural field, velocity field, and temperature field at 0.24 ms and 1.80 ms.
Water 16 02734 g003
Figure 4. Hydrate dissolving rate over time, with or without enthalpy.
Water 16 02734 g004
Figure 5. Fitting results between hydrate saturation and relative permeability by the Masuda model and KC model.
Water 16 02734 g005aWater 16 02734 g005b
Figure 6. Calculation results between hydrate saturation and effective heat conductivity.
Water 16 02734 g006
Figure 7. Calculate and fitting results between hydrate saturation and the activation reaction rate [9,30].
Water 16 02734 g007
Table 1. Parameters used in the DDF-LBM model with THMC.
ParametersSymbolsValue with Units
Kinetic viscosity ν 1 × 10⁻⁶ m2/s
Heat diffusivity of liquid α 1.31 × 10⁻⁷ m2/s
Thermal conductivity of rock λ s 2.0 W/m/K
Thermal conductivity of hydrate λ H 9.0 W/m/K
Thermal conductivity of liquid λ w 0.55 W/m/K
Density of hydrate ρ h 920 kg/m3
Density of rock ρ s 2650 kg/m3
Specific heat of rock c s 1.0 kJ/kg/K
Specific heat of hydrate c h 2.08 kJ/kg/K
Inlet temperature T i n 293 K
Phase change temperature T e q 274 K
Original temperature T w 271 K
Inlet velocity u i n 0.1 m/s
Original pressure P w 2.3 MPa
Length scale L r 2 × 10⁻⁷ m
Time scale t r 2 × 10⁻⁸ s
Height H 10 × 10−7 m
Activation energy Δ E 81 kJ/mol
Reaction heat absorption Δ H 52 kJ/mol
Phase equilibrium curve P e q = exp ( 38.98 8533.8 / T e q )
Disclaimer/Publisher’s Note: The statements, opinions and data contained in all publications are solely those of the individual author(s) and contributor(s) and not of MDPI and/or the editor(s). MDPI and/or the editor(s) disclaim responsibility for any injury to people or property resulting from any ideas, methods, instructions or products referred to in the content.

