Article

Characteristics of Runoff Changes during the Freeze–Thaw Period and the Response to Environmental Changes in a High-Latitude Water Tower

1
Institute of Water Conservancy and Electric Power, Heilongjiang University, Harbin 150080, China
2
Key Laboratory of Wetland Ecology and Environment, Northeast Institute of Geography and Agroecology, Chinese Academy of Sciences, Changchun 130102, China
3
Jilin Institute of Hydraulic Research, Changchun 130500, China
4
College of Software, Jilin University, Changchun 130021, China
*
Authors to whom correspondence should be addressed.
These authors contributed equally to this work.
Water 2024, 16(19), 2735; https://doi.org/10.3390/w16192735
Submission received: 26 August 2024 / Revised: 16 September 2024 / Accepted: 24 September 2024 / Published: 26 September 2024
(This article belongs to the Special Issue Climate Change and Hydrological Processes)

Abstract

:
Runoff in high-latitude water towers is crucial for ecological and human water demands during freeze–thaw periods but is highly sensitive to climate change and human activities. This study focuses on Changbai Mountain, the source of the Songhua, Tumen, and Yalu rivers, analyzing runoff variation and its environmental responses using the modified Mann–Kendall method and the water–energy balance equation. The results show significant non-stationarity in runoff trends, with an increasing trend in the Yalu River basin (p < 0.05), a decreasing trend in the Tumen River basin (p < 0.05), and complex trends in the Songhua River basin. Additionally, the relationship between runoff and driving factors during freeze–thaw periods was quantized. When the snowfall, potential evapotranspiration (E0), and subsurface changes increased by 1%, the snowmelt runoff changes were 1.58~1.96%, −0.58~−1.96%, and −0.86~−1.11% in the Yalu River basin; 2.16~2.35%, −1.04~−1.35%, and −1.56~−1.95% in the Tumen River basin; and 1.44~2.41%, −0.44~−1.41%, and −0.72~−1.62% in the Songhua River basin. The increased snowfall was the most prominent reason for the increase in snowmelt runoff during spring. The results of this study will benefit ecosystem conservation and the stability of downstream water supply in this high-latitude water tower.

1. Introduction

Runoff produced during the freeze–thaw period plays an important role in maintaining downstream production, livelihoods, and spring agricultural irrigation in high-latitude water towers [1,2]. At the same time, runoff during the freeze–thaw period can be significantly altered by climate change and human activities, increasing the uncertainty of sustainable water supply for downstream environments [3,4,5]. Owing to spatial and temporal heterogeneity, this new runoff requires further study [6].
The spatial and temporal evolution of runoff during the freeze–thaw period has received increasing attention globally, for example, in the western United States [2,7,8], Canada [9,10], the Czech Republic [11], the Mediterranean [6], and the Qinghai–Tibet Plateau in China [5,12]. Snowmelt runoff trends are often complex. Musselman et al. [2] analyzed the long-term changes in snowmelt runoff in North America and found that 34% of monitoring stations showed an increasing trend at (p < 0.05), with three times as many monitoring stations exhibiting a decreasing trend (p < 0.05). In this article, p reflects the significance of the results: p < 0.05 indicates that the results are statistically significant and that the change did not occur by chance, while p > 0.05 indicates that the results are not statistically significant and that the change may have occurred randomly. Typically, runoff during the freeze–thaw period is influenced by climate change, with the uncertainty of snowfall increasing and snowmelt occurring earlier in the spring [13,14]. Li et al. [8] indicated that snowmelt’s contribution to runoff in the western United States will be reduced by one-third before 2100 under RCP 8.5. RCP 8.5 represents the climate projections for the High Emissions Scenario, which assumes a significant increase in global GHG concentrations by 2100, leading to a large increase in temperature. Snowmelt runoff is also influenced by changes in the subsurface, even more so than climate change [15]. Nevertheless, more extensive quantitative evaluations of the contribution of climate change and underlying surface changes to snowmelt runoff are required. Some studies have used models to quantify the contribution of snowmelt to runoff [5,16,17]. However, constructing these models requires a large amount of basic observational data, specifically in mountainous areas, where data are difficult to obtain [18]. In recent years, the Budyko-based analysis method has gained popularity for quantifying environmental contributions owing to its simplicity and effectiveness [19,20,21,22]. This method has been predominantly applied to assess the effects of climate change and human activities on annual runoff changes, with limited application to analyzing snowmelt runoff contributions.
Changbai Mountain is the source of the Songhua River (SR), Tumen River (TR), and Yalu River (YR), providing a stable supply of abundant freshwater resources to the downstream region. In addition, the YR and TR are important borders between the three countries of China, North Korea, and Russia [23,24]. With a freeze–thaw period of up to eight months a year, snowmelt runoff is a vital factor in maintaining the health of Changbai Mountain’s ecosystem and provides a sustainable water supply for downstream production and living. Thus, previous studies have quantified the response characteristics of annual runoff to changing environments in tributaries of the Changbai Mountain region [25,26]. However, our knowledge is still limited regarding the characteristics of runoff changes during the freeze–thaw period and its response to climate and subsurface changes in this region.
This study investigates the variations and trends in runoff during the freeze–thaw period and responses to anthropogenic drivers and climatic change in a specific high-latitude water tower. Firstly, the non-stationary change in runoff during the freeze–thaw period on Changbai Mountain was analyzed (from October to May of the next year). Secondly, the relationship between runoff and driving factors during freeze–thaw periods was quantized. Finally, the contributions of these drivers to changes in spring runoff were identified. This study reveals the changing laws of water resources in high-latitude water towers in the context of climate change and human activities. This not only provides a scientific basis for water resource management in the Changbai Mountain region but also provides a reference for hydrological studies and management strategies in similar regions, contributing to sustainable water resource management on a global scale.

2. Materials and Methods

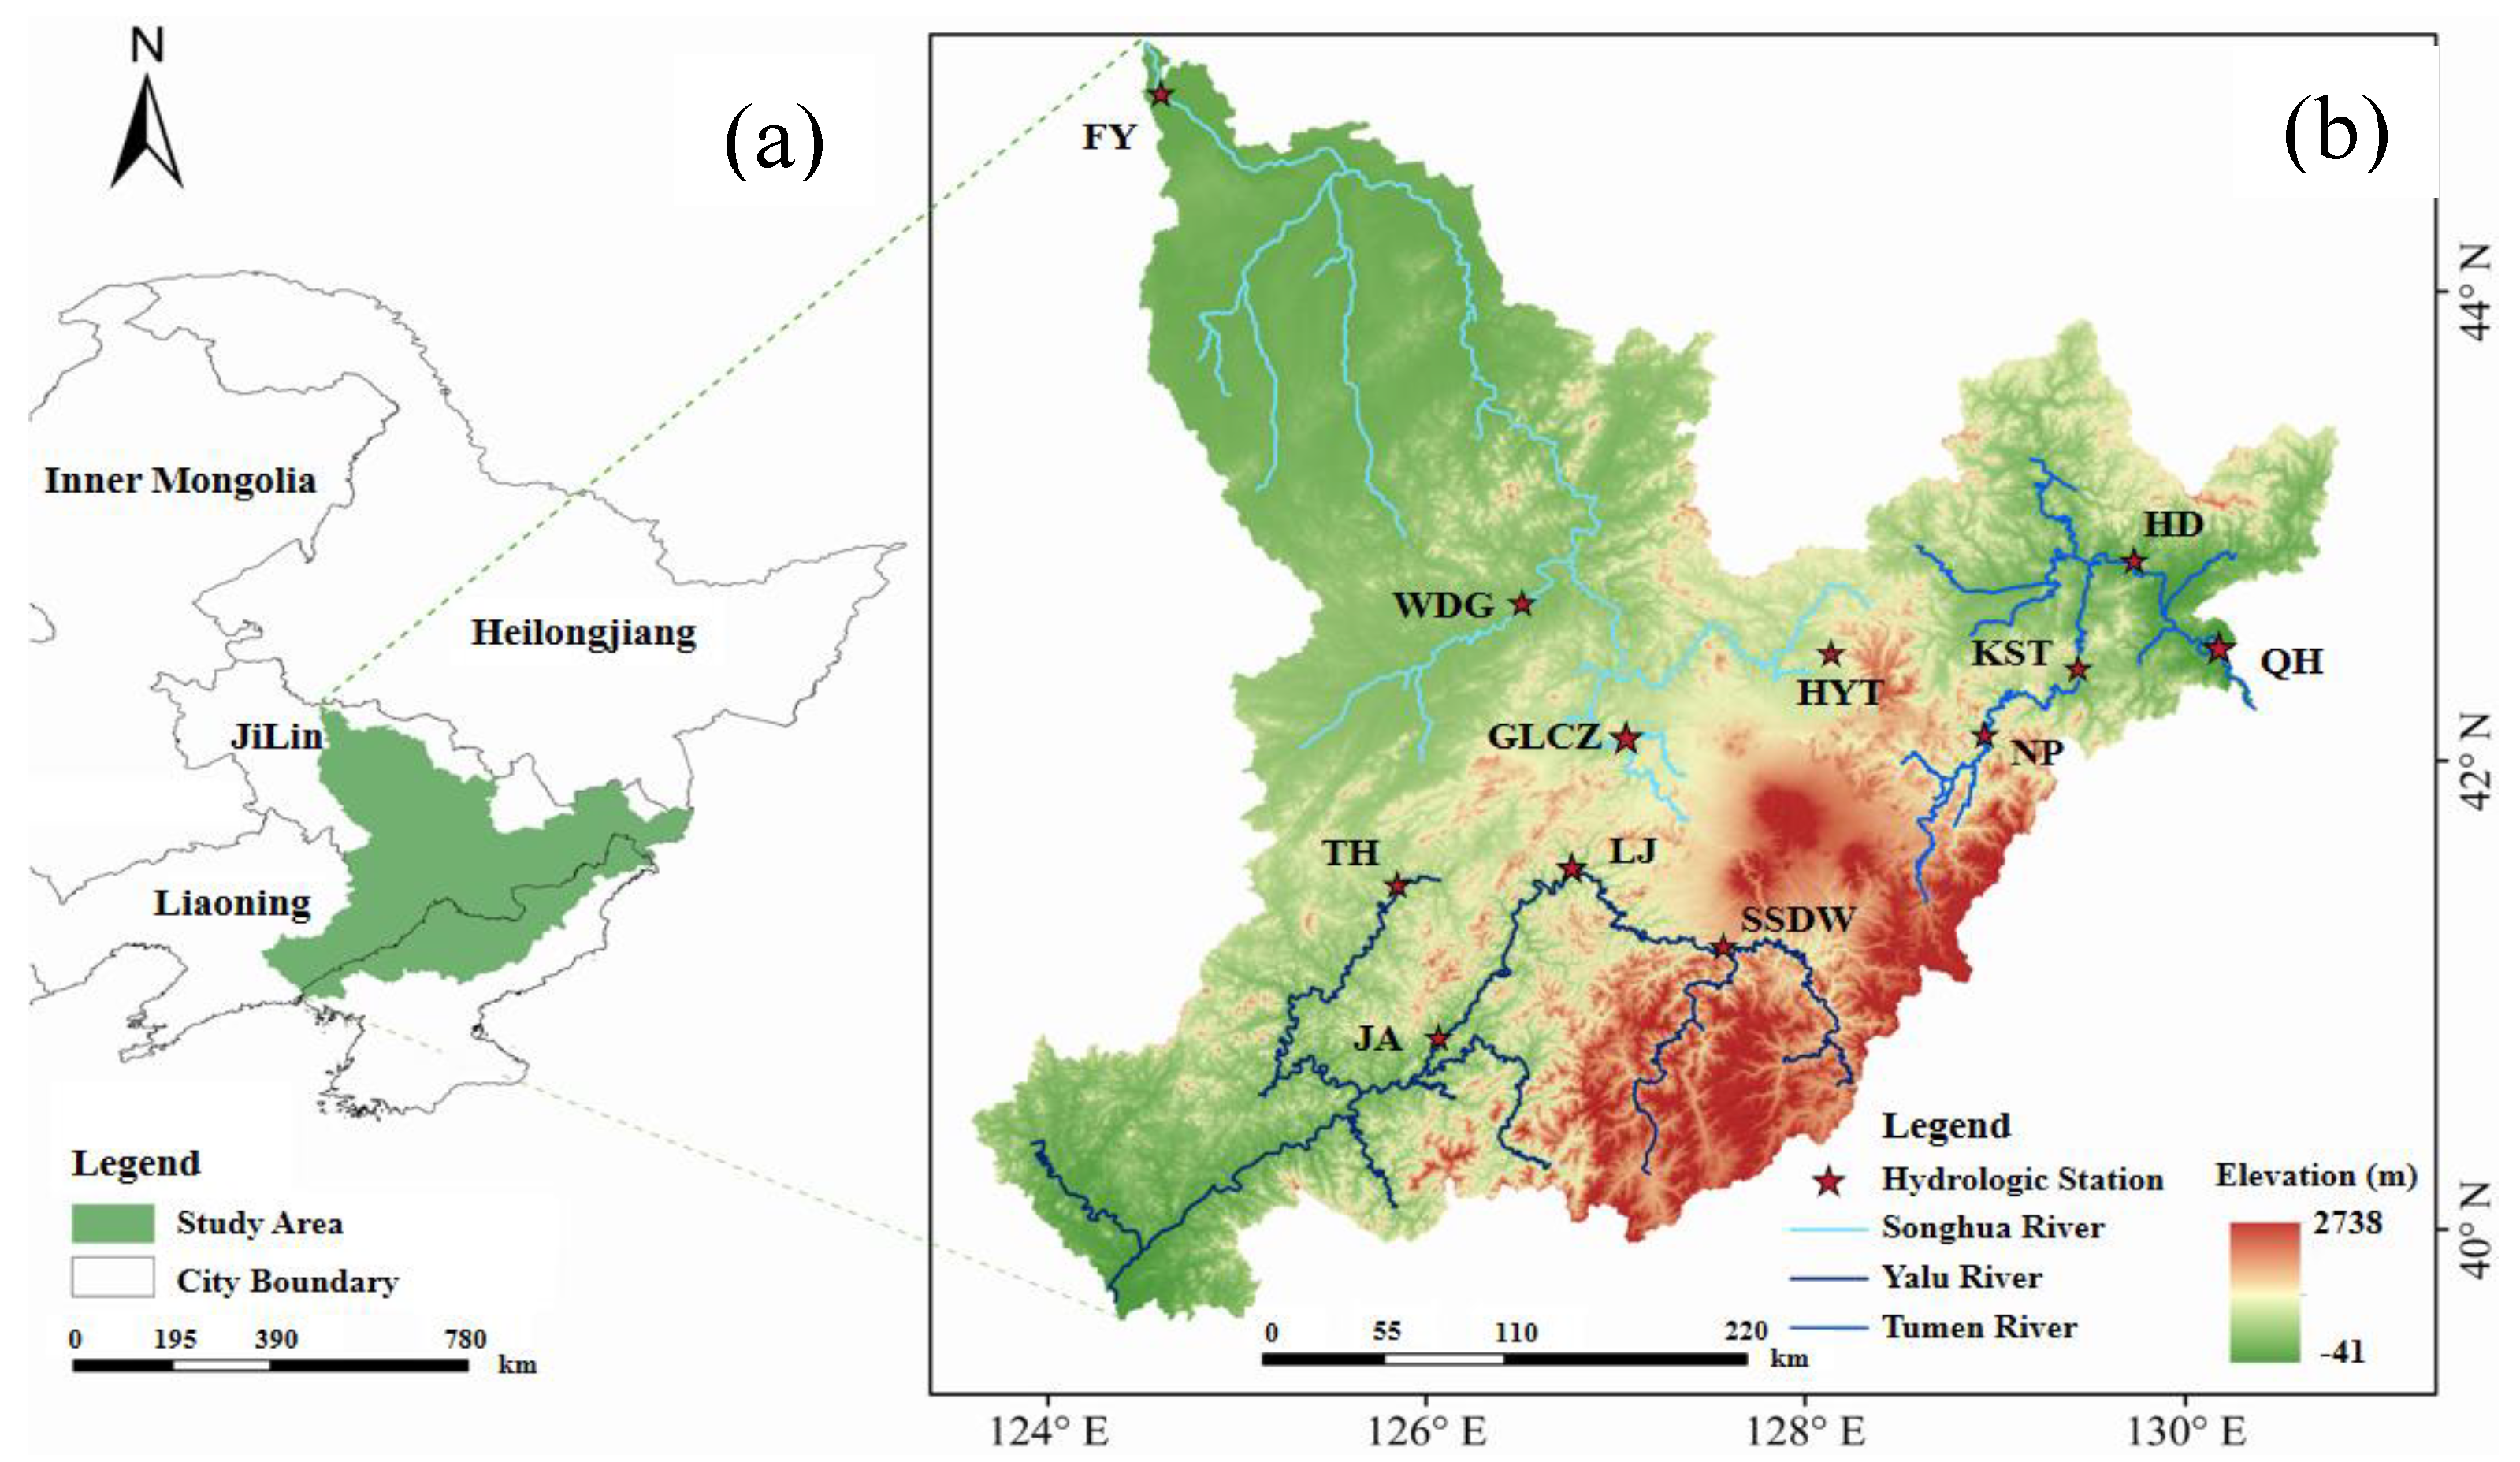
2.1. Study Site Description

Changbai Mountain is located in northeast Asia (39.8–45.4° N and 123.5–131.3° E), as shown in Figure 1. The total area is approximately 17.16 × 10⁴ km2. Changbai Mountain is also an important ecological function area in eastern Eurasia, with a significant variation characteristic for vegetation along its altitude.
The altitude of Changbai Mountain ranges from −8 m to 2738 m, showing a significant altitude gradient. Owing to the high altitude, the annual average temperature in this area is between −7 and 3 °C, the annual average snowfall is 200~400 mm, and the freeze–thaw period is up to 8 months (from October to May of the following year) [27].

2.2. Data

Meteorological data from 48 hydrological stations (1984–2019) on Changbai Mountain were obtained from the China Meteorological Data Service Centre (http://data.cma.cn/). The variables include snowfall and potential evapotranspiration (E0). Daily hydrological data from 1960 to 2020 were provided by the Hydrological Bureau for 12 stations (runoff data from the Hedong Hydrological Station on the TR are missing for 2011–2020), as shown in Table 1).

2.3. Method

2.3.1. Modified Mann–Kendall Method

The modified Mann–Kendall test analyzed the changing trend in runoff during freeze–thaw periods. The process for this method is described in detail by Yue et al. [28].

2.3.2. Water–Energy Balance Equation

The climate elasticity of runoff is defined as “the change degree of runoff in a watershed caused by the change of climate factors”. Here, the basin substrate change is mainly due to human activities, such as land use change and frozen soil. Under certain climatic and substratum conditions, the long-term hydroclimatic characteristics of the basin obey the principle of water and energy balance [19]. The expressions are as follows:
E = P E 0 P n + E 0 n 1 n
where E is the average actual evapotranspiration; P is the average snowfall; E0 is the average potential evapotranspiration; and n characterizes the subsurface of the basin (the subsurface parameter), including topography, soil, vegetation, etc.
P, E0, and n are mutually independent variables in the aforementioned equation.
The variation in runoff (R) can be expressed in a fully differentiated form as follows:
dR = f P dP + f E 0 d E 0 + f n dn
The snowfall elasticity coefficient is the degree of change in the runoff volume from a watershed due to a unit change in snowfall. Similarly, the potential evapotranspiration elasticity coefficient of runoff and the subsurface elasticity coefficient of runoff can be defined: ε P = dR R dP P is the elasticity coefficient of snowfall, ε E 0 = dR R d E 0 E 0 is the elasticity coefficient of E0, and ε n = dR R dn n is the elasticity coefficient of subsurface change. Based on the definition of these elasticity coefficients, the change in runoff can be expressed in the following fully differential form.
By dividing Equation (1) by the average runoff depth R, we obtain
dR R = ε P dP P + ε E 0 d E 0 E 0 + ε n dn n
Let ϕ = E 0 P . The formulas are then expressed as follows:
ε P = 1 + ϕ n 1 n + 1 ϕ n + 1 1 + ϕ n 1 + ϕ n 1 n ϕ
ε E 0 = 1 1 + ϕ n 1 1 + ϕ n 1 n
ε n = ln 1 + ϕ n + ϕ n ln 1 + ϕ n n 1 + ϕ n 1 + ϕ n 1 n + 1
According to Equations (4)–(6), the three runoff elasticity coefficients reflect the multi-year average hydroclimatic characteristics of the basin.
The study period can be divided into two subperiods according to the abrupt change points. To more comprehensively understand the key drivers of runoff changes during the freeze–thaw period, we employed a change point analysis to identify significant shifts in the runoff time series. Applying this method enabled us to precisely pinpoint the turning points at which different influencing factors impacted runoff, allowing for more accurate quantification of their contributions to runoff over different periods. The multi-year average runoff depths for period 1 and period 2 are denoted as R1 and R2, respectively. The change in runoff depth during the freeze–thaw period from period 1 to period 2 can be expressed as the difference between two factors, symbolized as Δ R 2 1 .
Δ R 2 1 = R 2 R 1
The change in runoff depth ( Δ R c l ) arises from changes in the meteorological elements and subsurface and can be expressed in terms of the change in runoff as
Δ R c l = Δ R c Δ R l
where Δ R c is the runoff change affected by climate change and Δ R l is the runoff change affected by the change in subsurface. The effects of meteorological element changes can be further refined into two parts: runoff affected by snowfall changes ( Δ R P ) and runoff affected by E0 changes ( Δ R E 0 ).
Based on the ε P , ε E 0 , and ε n values, the runoff changes affected by changes in snowfall, E0, and the subsurface can be estimated as follows:
Δ R P = ε P R P Δ P , Δ R E 0 = ε E 0 R E 0 Δ E 0 , Δ R l = ε E 0 R n Δ n
where A and B are the differences between the multi-year average snowfall and E0 for the two time periods. n1 and n2 represent the basin subsurface conditions for period 1 and period 2, respectively.

3. Results

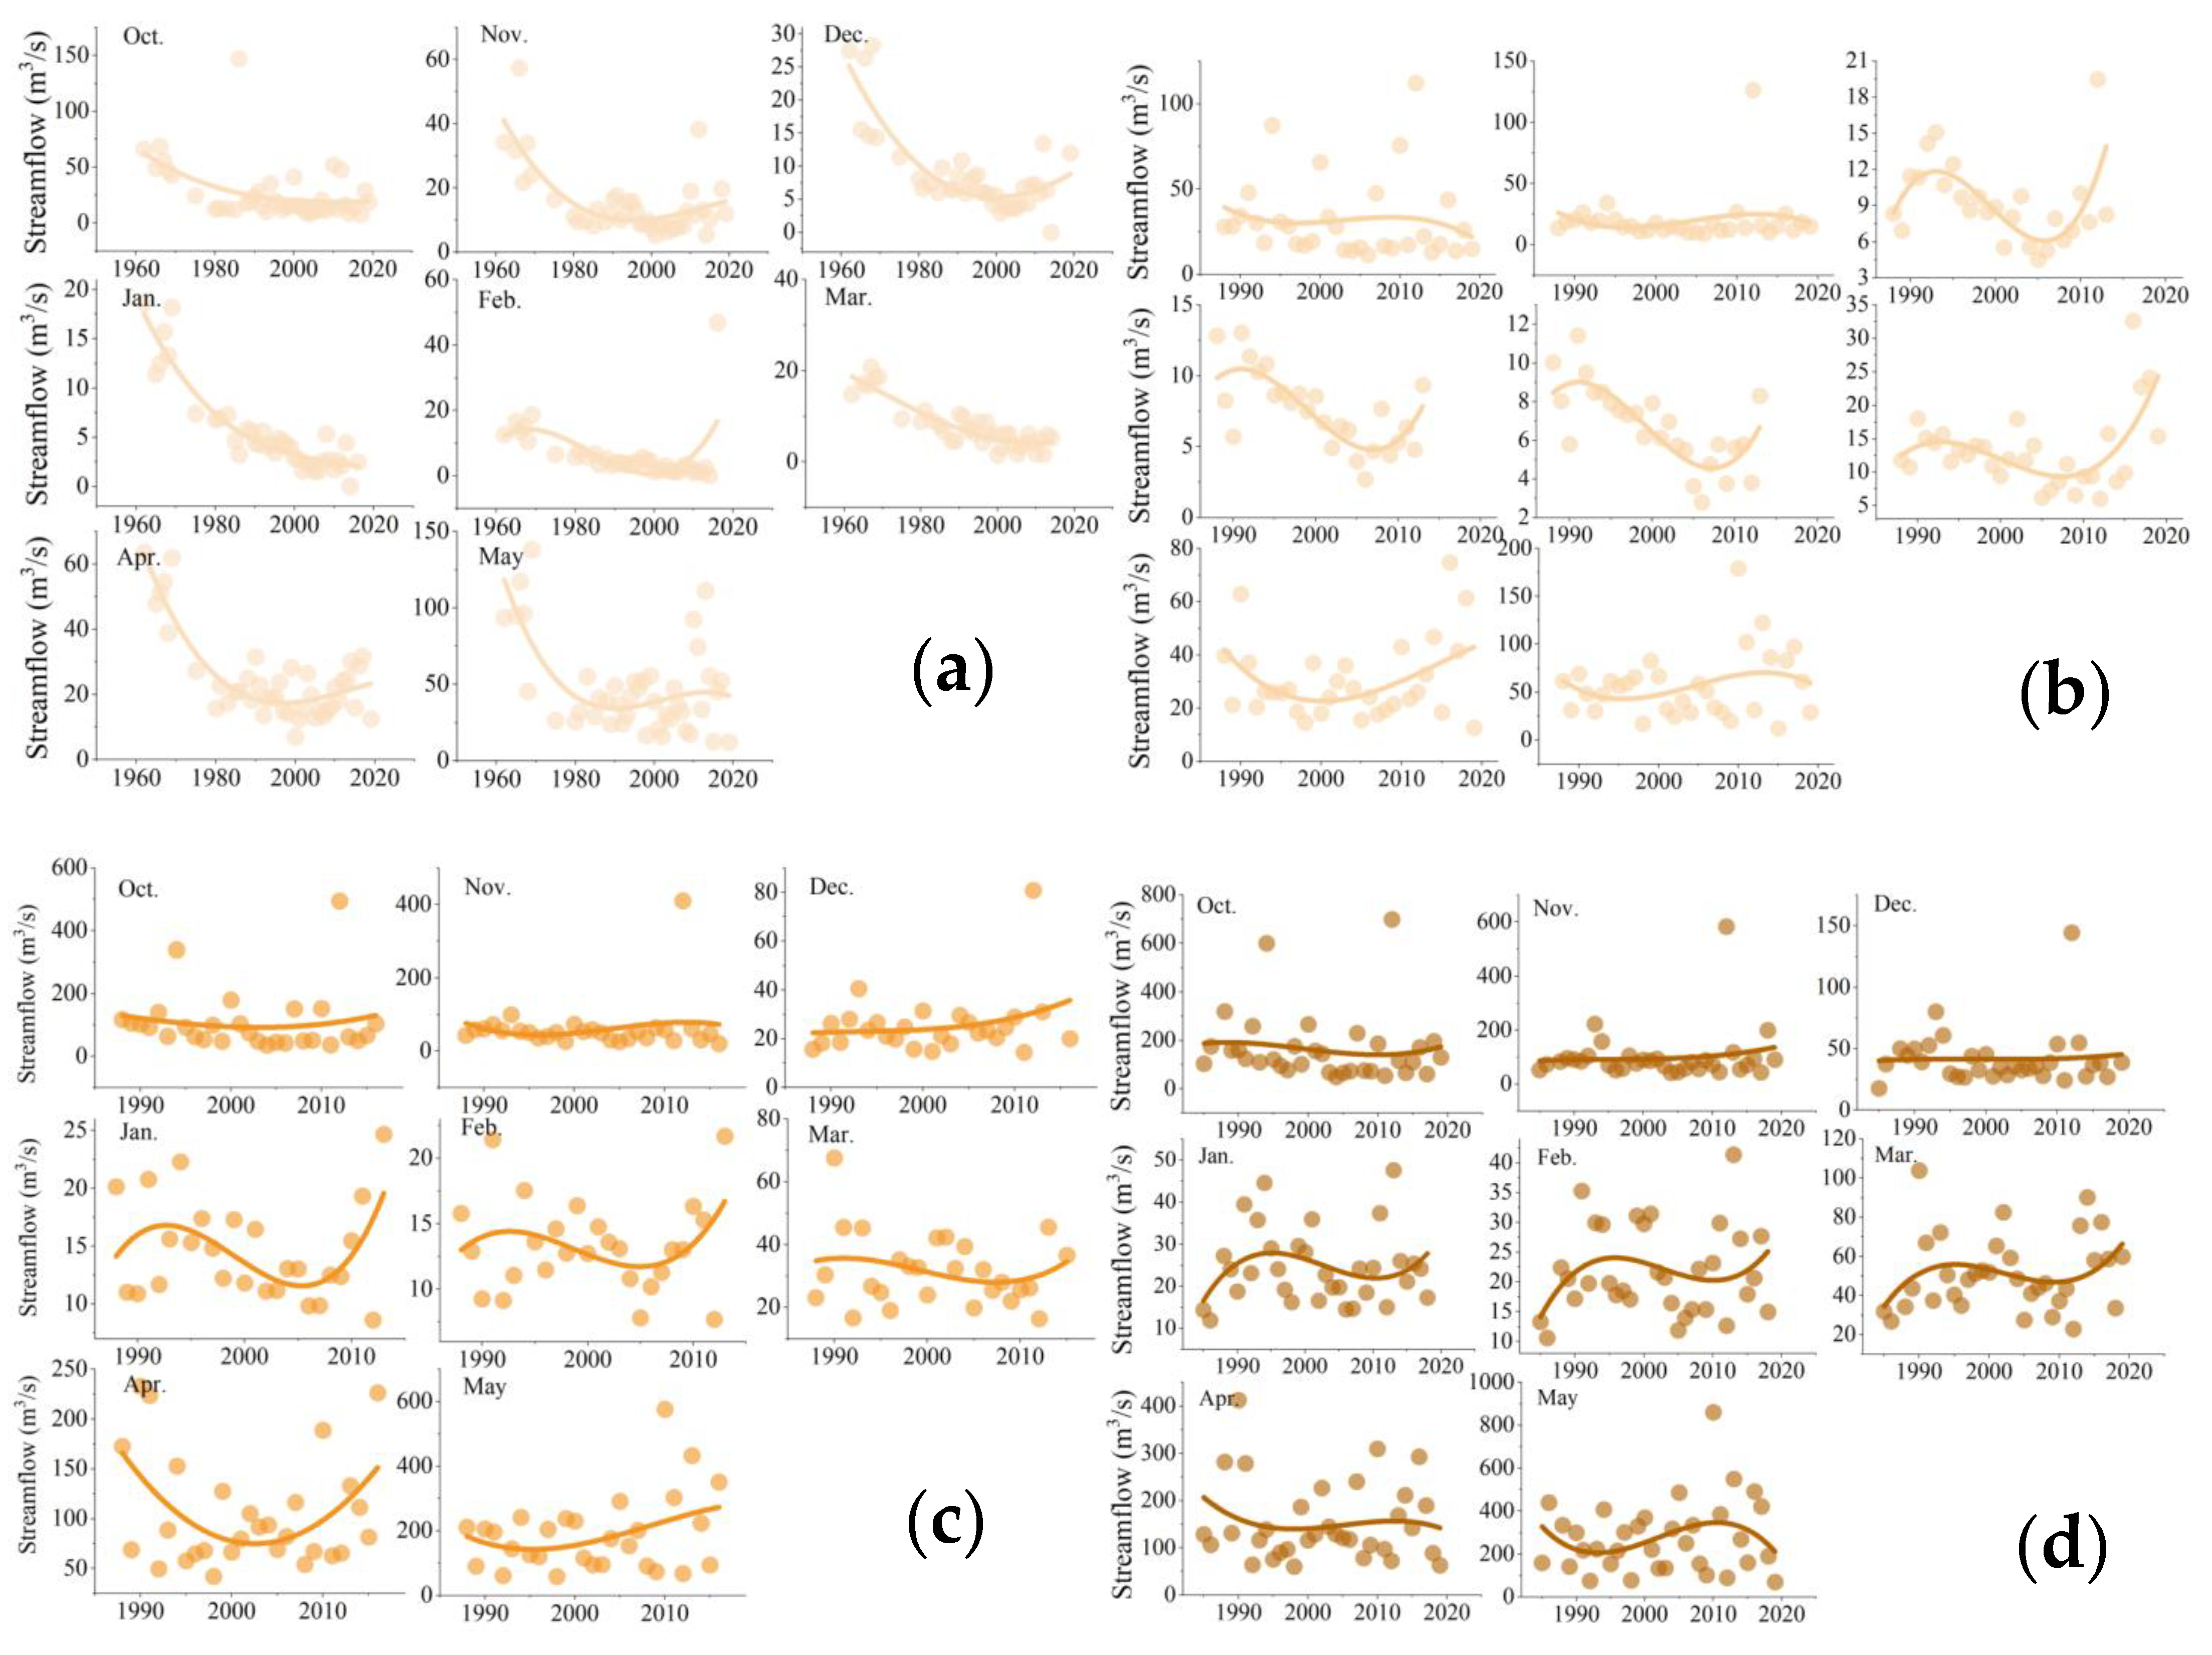
3.1. Runoff Variation Characteristics during Freeze–Thaw Periods

At SSDW station located in the source area of the YR, a significant decreasing trend occurred in runoff in October, November, December, and April. All months showed the largest increase after 2000. By contrast, runoff increased in March and fluctuated in January, February, and May; however, there was no clear trend (Figure 2a). LJ station, situated in the middle reaches of the YR, exhibited decreasing runoff trends from October to April, with the most notable increases in November through April after 2000. May’s runoff also fluctuated without a significant trend (Figure 2b). TH station in the Hun River showed a continuously increasing trend throughout the freeze–thaw period (Figure 2c). JA station, located in the lower reaches of the YR, experienced a significant decrease in runoff from October to December and May after 2013, with a decreasing trend followed by an increase from January to March (Figure 2d).
At SSDW station, runoff showed non-significant changes in October, April, and May (p > 0.05) but significant increasing trends from November to March (p < 0.01). LJ station experienced increasing runoff across all months, with significant increases from November to April (p < 0.05). At JA station, runoff increased in October, January, March, April, and May, though these changes were not significant (p > 0.05). Decreasing trends were observed in November, December, and February, with December showing a significant decrease (p < 0.05). Specific trend results can be found in Table 2.
NP station, located in the source area of the TR, exhibited a significant decreasing runoff trend during the freeze–thaw period, with the most notable decrease in January. After 2000, runoff in April and May showed an increasing trend (Figure 3a). KST station in the middle reaches of the TR showed no significant changes in October, November, or May and a decreasing and then increasing trend from December to April. (Figure 3b). At HD station, located in the middle and lower parts of the TR, runoff remained stable in October, November, and December and then decreased before increasing from January to April, with a significant rise in May (Figure 3c). QH station, in the lower reaches, had no significant trends in October, November, or December, with runoff showing a general decreasing and then increasing trend in other months (Figure 3d).
During the freeze–thaw period, NP station exhibited a significantly decreasing runoff trend for all months except May (p < 0.01). KST station showed a decreasing trend from October to March, with significant decreases in January and February (p < 0.01). Runoff in April and May increased, though not significantly (p > 0.05). At HD station, runoff trends varied by month but were not significant. QH station showed an increasing trend in October, November, and December and a decreasing trend from February to May, though none of these trends were significant (Table 3).
GLCZ station, located on the Toudaosonghua River at the headwater of the SR, showed a decreasing runoff trend in October. Before 2000, there was no obvious trend from November to March, but after 2000, runoff increased significantly, with a slight upward trend in May (Figure 4a). HYT station, on the Erdaosonghua River in the SR source area, experienced significant decreases in runoff from October to February, with an increasing trend in March after 2000 (Figure 4b). April and May showed no significant trends. WDG station, on the Huifa River, displayed a decreasing trend followed by an increasing trend from October to May (Figure 4c). FY station, in the lower reaches of the SR, had consistent monthly trends during the freeze–thaw period, with no significant changes (Figure 4d).
At GLCZ station, significant trends were observed in October, February, and March. October saw a significant decrease (p < 0.01), while February and March showed significant increases (p < 0.05 and p < 0.01, respectively). Trends in other months were not significant. At HYT station, significant decreases were recorded from October to February (p < 0.05), with no significant changes in March, April, or May. WDG station experienced significant increases in January and February (p < 0.05 and p < 0.01, respectively), while other months showed no significant trends. FY station exhibited a decreasing trend with no significant changes (p > 0.05) (Table 4).

3.2. Relationship between Runoff and Driving Factors during Freeze–Thaw Periods

There is a significant difference in snowmelt runoff between seasonally frozen soil areas and non-frozen soil areas. The precipitation in winter occurs in the form of snowfall and accumulates in the region. It is only affected by evaporation and will not immediately form runoff. As the temperature rises in the spring, snowmelt and snowmelt runoff form in the basin. Thus, the spring snowmelt runoff is mainly influenced by a combination of snowfall and evaporation during the freeze–thaw period under the condition that the subsurface remains unchanged.
Snowfall in different areas of the TR ranged from 155.74 mm to 180.17 mm; E0 ranged from 341.79 mm to 364.40 mm; spring runoff ranged from 68.82 mm to 114.03 mm; the drought index ranged from 1.92 to 2.34; the runoff coefficient ranged from 0.14 to 0.22; and n ranged from 1.39 to 1.65. Compared with the YR, the TR basin had less snowfall during the freeze–thaw period, greater E0, more significant drought, and smaller runoff coefficients. When snowfall increased by 1%, snowmelt runoff increased by 2.16~2.35%. When E0 increased by 1%, snowmelt runoff decreased by 1.04~1.35%. When n increased by 1%, snowmelt runoff decreased by 1.56~1.95%. The elasticity coefficients of each station show that the snowmelt runoff at KST station was the most sensitive to climate and subsurface. The sensitivity of snowmelt runoff to climate and subsurface changes was more prominent in the TR basin than in the YR; see Table 5.
Snowfall in different areas of the YR ranged from 206.57 mm to 275.37 mm; E0 ranged from 313.97 mm to 329.54 mm; spring runoff ranged from 68.82 mm to 114.03 mm; the drought index ranged from 1.18 to 1.60; the runoff coefficient ranged from 0.29 to 0.41; and the subsurface parameter (n) ranged from 1.58 to 1.96. When the snowfall increased by 1%, the snowmelt runoff increased by 1.58~1.96%. When the E0 increased by 1%, the snowmelt runoff decreased by 0.58~1.96%. When the lower bedding surface parameter increased by 1%, the snowmelt runoff decreased by 0.86~1.11%. The elasticity coefficient of each station showed that runoff at LJ station was more sensitive to climate and subsurface change; see Table 5.
Snowfall in different areas of the SR ranged from 167.49 mm to 297.15 mm; E0 ranged from 313.97 mm to 359.83 mm; spring runoff ranged from 34.28 mm to 154.41 mm; the drought index ranged from 1.11 to 2.15; the runoff coefficient ranged from 0.17 to 0.52; and n ranged from 0.87 to 1.83. The climatic and subsurface parameters of each section of the SR varied significantly. The drought index at FY station was the largest at 2.15. The runoff coefficient at GLCZ station was the largest at 0.52. The runoff coefficient at WDG station was the smallest at 0.17. When snowfall increased by 1%, snowmelt runoff increased by 1.44~2.41%. When E0 increased by 1%, snowmelt runoff decreased by 0.44~1.41%. When n increased by 1%, snowmelt runoff decreased by 0.72~1.62%. The elasticity coefficient of each station showed that the snowmelt runoff at WDG station was the most sensitive to climate and subsurface change; see Table 5.

3.3. Contribution of Driving Factors to Runoff during Freeze–Thaw Periods

According to the m-k mutation test, the abrupt change in spring snowmelt runoff in the three major basins of Changbai Mountain occurred after 2000. Compared with the pre-mutation period, all stations except for HYT exhibited an increasing trend; see Table 6.
After the abrupt change, the increase in snowmelt runoff in the YR was between 9.60 and 45.69 mm; the increase in snowfall was between 8.84 and 46.84 mm; the evaporation change was −2.6~12.21 mm; and the subsurface change was −0.03~−0.16 mm. The change in snowmelt runoff was mainly affected by climate and subsurface changes. After the abrupt change, the snowmelt runoff increased by 16.02 mm at SSDW station; the increase in snowfall led to a 5.6 mm increase in snowmelt runoff; and the increase in E0 led to a 1.2 mm decrease in snowmelt runoff. The subsurface change led to a 10.8 mm increase in snowmelt runoff. The contributions of snowfall, E0, and subsurface change to runoff change were 31.8%, 6.9%, and 61.3%, respectively. The increase in runoff at LJ station was 9.60 mm; the increase in snowfall led to a 10.6 mm increase in snowmelt runoff; the increase in E0 led to a 2.6 mm decrease in snowmelt runoff; and the subsurface change led to a 1.6 mm increase in snowmelt runoff. The contributions of snowfall, E0, and subsurface change to the change in runoff were 72.0%, 17.4%, and 10.6%, respectively. The largest increase in runoff volume was 45.69 mm at TH station. The increase in snowfall led to a 31.8 mm increase in snowmelt runoff; the decrease in E0 led to a 0.6 mm increase in snowmelt runoff; and the subsurface change led to a 13.7 mm increase in snowmelt runoff. The contributions of snowfall, change in E0, and subsurface to the change in runoff were 69.0%, 1.3%, and 29.8%, respectively.
After the abrupt change, the increase in snowmelt runoff in TR was between 6.39 and 15.15 mm; snowfall increased by 38.97~42.85 mm; the E0 change was −3.70~12.66 mm; and the subsurface change was 0.09~0.22. After the abrupt change, the increase in runoff at NP station was 8.09 mm. The snowfall, E0, and subsurface changes contributed 62.5%, 4.4%, and 33.2% to the runoff change, respectively. The snowmelt runoff at KST station increased by 6.52 mm; the increase in snowfall led to a 13.0 mm increase in snowmelt runoff; the decrease in E0 led to a 1.1 mm decrease in snowmelt runoff; and the change in subsurface led to a 5.5 mm decrease in snowmelt runoff. The contributions of snowfall, E0, and subsurface change to the change in runoff were 66.2%, 5.8%, and 28.0%, respectively. At HD station, snowmelt runoff increased by 15.15 mm, snowfall increased by 17.3 mm, E0 decreased by 0.4 mm, and subsurface changes decreased by 3.2 mm; the contributions of snowfall, E0, and subsurface changes to the change in snowmelt runoff were 82.9%, 2.0%, and 15.1%, respectively. The snowmelt runoff increased by 6.39 mm at QH station, the increase in snowfall led to an 18.5 mm increase in snowmelt runoff, the decrease in E0 led to a 0.5 mm increase in snowmelt runoff, and the change in subsurface led to a 12.7 mm decrease in snowmelt runoff; see Table 6.
After the abrupt change, the change in snowmelt runoff at SR station was between −4.27 and 19.08 mm; snowfall increased by 36.13~70.33 mm; the E0 change was −3.74~25.16 mm; and the lower bedding surface change was −0.03~0.33. After the abrupt change, the runoff at GLCZ station increased by 19.08 mm. The increase in snowfall led to a 52.7 mm increase in snowmelt runoff. The increase in E0 led to a 0.5 mm decrease in snowmelt runoff. The subsurface change led to a 33.5 mm decrease in snowmelt runoff. The contributions of snowfall, E0, and subsurface to the change in runoff were 60.7%, 0.6%, and 38.7%, respectively. At HYT station, the runoff decreased by 4.27 mm; the increase in snowfall led to a 27.3 mm increase in snowmelt runoff; the increase in E0 led to a 4.0 mm decrease in snowmelt runoff; and the subsurface change led to a 26.6 mm decrease in snowmelt runoff. The contributions of snowfall, E0, and subsurface to the change in runoff were 47.2%, 6.9%, and 45.9%, respectively. The runoff at WDG station increased by 15.86 mm; the increase in snowfall led to a 14.6 mm increase in snowmelt runoff; the increase in E0 led to a 0.2 mm increase in snowmelt runoff; and the subsurface change led to a 0.9 mm increase in snowmelt runoff. The contributions of snowfall, E0, and subsurface to the change in runoff were 92.8%, 1.4%, and 5.8%, respectively. The runoff at FY station increased by 3.83 mm; the increase in snowfall led to a 22.1 mm increase in snowmelt runoff; the increase in E0 led to a 0.4 mm increase in snowmelt runoff; and the subsurface change led to a 19.4 mm decrease in snowmelt runoff. The contributions of snowfall, E0, and subsurface to the change in runoff were 52.8%, 0.9%, and 46.3%, respectively.

4. Discussion

4.1. The Impact of Climate Change on Runoff during Freeze–Thaw Periods

This study assessed the impact of climate change on runoff during the freeze–thaw period in the Changbai Mountain region. Runoff regime shifts occurred at all three basins after 2000. Apart from HYT station, runoff during the freeze–thaw period increased across all stations (Table 4), primarily driven by increased snowfall during this period. Previous studies have indicated a significant increase in snowfall over the past 60 years on Changbai Mountain [29]. This increase has led to higher spring temperatures and greater snowmelt, indirectly contributing to the increased runoff. Although changes in runoff during the freeze–thaw period on Changbai Mountain have received little attention in past research and lack comparable results, numerous studies have demonstrated the significant contribution of snowmelt to mountain runoff. Our previous study used isotopic methods in the Changbai Mountain source area, showing that spring snowmelt contributes an average of 42.6% to runoff, supporting the validity of our findings [30]. Jenicek and Ledvinka [11] used a bucket-type watershed model to study 59 mountain watersheds in the Czech Republic. Their results indicated that 17–42% (an average of 26%) of total runoff comes from snowmelt. Additionally, snowmelt contributes approximately 23–26% to runoff in the headwaters of the Yellow River [31]. In our findings, SSDW station in the TR basin is unique, with groundwater being the primary factor influencing runoff during the freeze–thaw period. This is mainly because SSDW station is located at the headwaters of Changbai Mountain, and as shown in Figure 1, it is the highest-elevation hydrological station. Groundwater and surface water significantly interact at this station [32], where groundwater replenishment diminishes the contribution of snowmelt to surface runoff. Evaporation has the least impact on runoff during the freeze–thaw period in the Changbai Mountain region, and this phenomenon can be explained by three factors. First, temperatures are generally low during the freeze–thaw period. Although spring temperatures rise during the snowmelt season, they remain relatively low, resulting in slower evaporation rates [33]. Second, most of the soil remains frozen during this period, further inhibiting evaporation. Finally, runoff during the freeze–thaw period is primarily derived from snowmelt and groundwater recharge, both of which more significantly influence runoff, reducing the impact of evaporation.

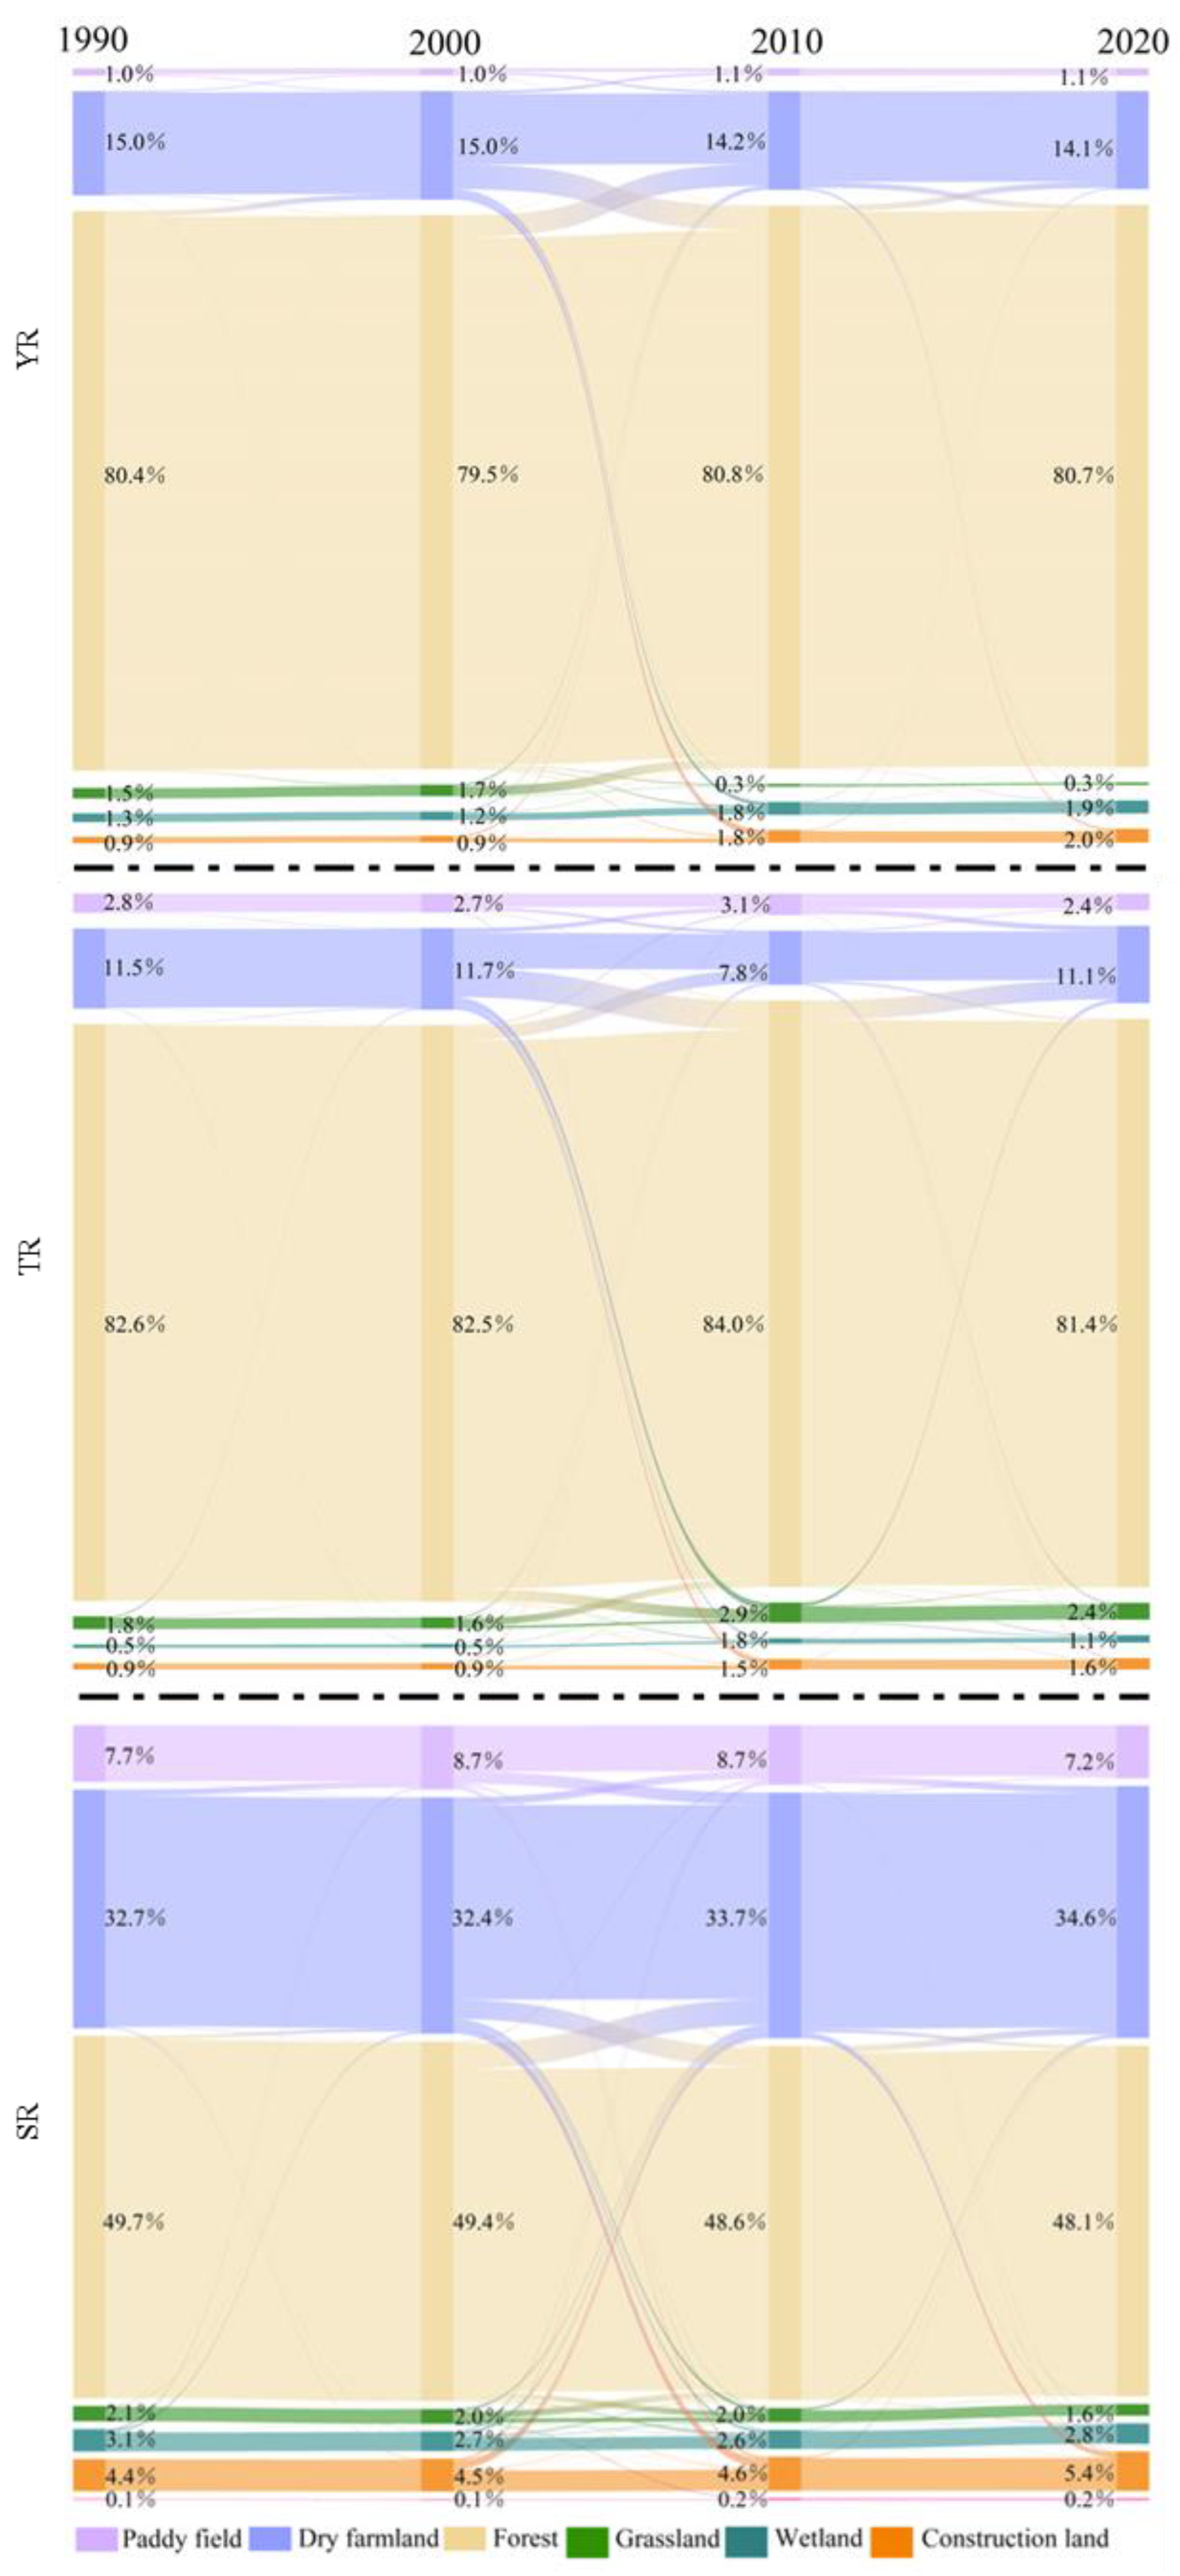
4.2. The Impact of Subsurface Change on Runoff during Freeze–Thaw Periods

The impact of groundwater changes on runoff during the freeze–thaw period demonstrates significant differences across the three basins. In the YR basin, groundwater changes significantly increased runoff during the freeze–thaw period, whereas runoff in the TR and SR basins decreased, except at WDG station. Zhang et al. [25] found that human activities had a greater impact on annual runoff at WDG station than climate change. However, this study reveals that human activities account for only 5.8% of the impact on WDG station, with a related significant increase in winter snowfall [29]. This indicates that the drivers of freeze–thaw period runoff significantly differ from those in other seasons and warrant further investigation [34]. Furthermore, the impact of land use changes on runoff also varies. The primary land use type in the Changbai Mountain area is forest (Figure 5), with forest coverage ratios of 80.4% in the YR basin, 82.6% in the TR basin, and 49.0% in the SR basin. Since 2000, following the implementation of China’s Natural Forest Protection Project, the dry land area has decreased, and forest areas have increased in the YR basin. By contrast, land use changes in the TR and SR basins have shown complex trends. Specifically, the SR basin has a significantly higher proportion of dry land than the other basins, which is related to agricultural activities. The dry land expansion notably impacts the hydrological cycle during the freeze–thaw period. In addition, changes in permafrost are another important factor affecting runoff during the freeze–thaw period. Our study indicates that permafrost degradation in the YR basin has significantly increased spring runoff [27,35]. Although land use changes, such as increased forest area, may slightly reduce runoff, the impact of permafrost degradation during the freeze–thaw period is more pronounced. In summary, the variability in freeze–thaw period runoff is influenced by multiple factors, including groundwater changes, land use changes, and permafrost degradation, which interact in complex ways across different basins. Permafrost degradation in high-altitude areas may significantly increase runoff, while low-altitude areas are more affected by land use changes and groundwater variations. Future research should pay closer attention to the coupling effects between permafrost degradation and land use changes to better predict and manage water resources under extreme climate conditions. This will contribute to developing more scientifically based water resource management strategies and addressing the challenges posed by climate change.

5. Conclusions

This study identified the runoff change trends during the freeze–thaw period and its response to a changing environment in a high-latitude water tower. Based on these findings, the following conclusions can be drawn: (1) Runoff during the freeze–thaw period in the Changbai Mountain area was significantly non-stationary. The runoff trends in each month in the three basins were not completely consistent. The runoff in most months showed an increasing trend in the YR basin (p < 0.05), a decreasing trend in the TR basin (p < 0.05), and a more complex and inconsistent trend in the SR basin. (2) The spring runoff in the YR was 68.82 mm~114.03 mm when the snowfall, E0, and subsurface changes increased by 1%, and the snowmelt runoff changes were 1.58~1.96%, −0.58~−1.96%, and −0.86~−1.11%, respectively. The spring runoff in the TR was 23.48 mm~39.10 mm when the snowfall, E0, and subsurface changes increased by 1%, and the snowmelt runoff changes were 2.16~2.35%, −1.04~−1.35%, and −1.56~−1.95%, respectively. The spring runoff in the SR was 34.28 ~154.41 mm when the snowfall, E0, and subsurface changes increased by 1%, and the snowmelt runoff changes were 1.44~2.41%, −0.44~−1.41%, and −0.72~−1.62%, respectively. (3) After the abrupt change, the increase in snowmelt runoff in YR ranged from 9.60 mm to 45.69 mm; the increase in snowmelt runoff in TR ranged from 6.39 mm to 15.15 mm; and the change in snowmelt runoff in the SR ranged from −4.27 mm to 19.08 mm. The increase in snowfall was the most prominent reason for the increase in snowmelt runoff in the spring, with a contribution of between 31.8% and 72.0% in the YR basin, 62.5% and 82.9% in the TR basin, and 47.2% and 92.8% in the SR basin. This study quantitatively analyzed the driving factors of runoff during the freeze–thaw period, providing managers with a strategic basis for coping with climate change and providing researchers with new methods and data support for studying hydrological processes in high-latitude regions, promoting in-depth explorations in related fields.

Author Contributions

Conceptualization, M.X. and P.Q.; methodology, D.L.; software, G.Z.; validation, M.X., P.Q. and Y.S.; formal analysis, L.G.; investigation, Y.C.; resources, P.Q.; data curation, D.L.; writing—original draft preparation, M.X.; writing—review and editing, M.X.; visualization, P.Q. All authors have read and agreed to the published version of the manuscript.

Funding

This research was funded by the National Natural Science Foundation of China; the grant numbers are 42371037 and 42001032.

Data Availability Statement

The data adopted in the study are included in the article; further inquiries can be directed to the corresponding author.

Conflicts of Interest

The authors declare no conflicts of interest.

References

  1. Qin, Y.; Abatzoglou, J.T.; Siebert, S.; Huning, L.S.; AghaKouchak, A.; Mankin, J.S.; Hong, C.; Tong, D.; Davis, S.J.; Mueller, N.D. Agricultural risks from changing snowmelt. Nat. Clim. Chang. 2020, 10, 459–465. [Google Scholar] [CrossRef]
  2. Musselman, K.N.; Addor, N.; Vano, J.A.; Molotch, N.P. Winter melt trends portend widespread declines in snow water resources. Nat. Clim. Chang. 2021, 11, 418–424. [Google Scholar] [CrossRef] [PubMed]
  3. Jeelani, G.; Feddema, J.J.; van der Veen, C.J.; Stearns, L. Role of snow and glacier melt in controlling river hydrology in Liddar watershed (western Himalaya) under current and future climate. Water Resour. Res. 2012, 48, 1–16. [Google Scholar] [CrossRef]
  4. Musselman, K.N.; Clark, M.P.; Liu, C.; Ikeda, K.; Rasmussen, R. Slower snowmelt in a warmer world. Nat. Clim. Chang. 2017, 7, 214–219. [Google Scholar] [CrossRef]
  5. Kraaijenbrink, P.D.; Stigter, E.E.; Yao, T.; Immerzeel, W.W. Climate change decisive for Asia’s snow meltwater supply. Nat. Clim. Chang. 2021, 11, 591–597. [Google Scholar] [CrossRef]
  6. Fayad, A.; Gascoin, S.; Faour, G.; López-Moreno, J.I.; Drapeau, L.; Le Page, M.; Escadafal, R. Snow hydrology in Mediterranean mountain regions: A review. J. Hydrol. 2017, 551, 374–396. [Google Scholar] [CrossRef]
  7. Vano, J.A.; Scott, M.J.; Voisin, N.; Stöckle, C.O.; Hamlet, A.F.; Mickelson, K.E.B.; McGuire Elsner, M.; Lettenmaier, D.P. Climate change impacts on water management and irrigated agriculture in the Yakima River Basin, Washington, USA. Clim. Chang. 2010, 102, 287–317. [Google Scholar] [CrossRef]
  8. Li, D.; Wrzesien, M.L.; Durand, M.; Adam, J.; Lettenmaier, D.P. How much runoff originates as snow in the western United States, and how will that change in the future? Geophys. Res. Lett. 2017, 44, 6163–6172. [Google Scholar] [CrossRef]
  9. Woo, M.K.; Thorne, R. Snowmelt contribution to discharge from a large mountainous catchment in subarctic Canada. Hydrol. Process. 2006, 20, 2129–2139. [Google Scholar] [CrossRef]
  10. Zaremehrjardy, M.; Victor, J.; Park, S.; Smerdon, B.; Alessi, D.S.; Faramarzi, M. Assessment of snowmelt and groundwater-surface water dynamics in mountains, foothills, and plains regions in northern latitudes. J. Hydrol. 2022, 606, 127449. [Google Scholar] [CrossRef]
  11. Jenicek, M.; Ledvinka, O. Importance of snowmelt contribution to seasonal runoff and summer low flows in Czechia. Hydrol. Earth Syst. Sci. 2020, 24, 3475–3491. [Google Scholar] [CrossRef]
  12. Qi, W.; Feng, L.; Kuang, X.; Zheng, C.; Liu, J.; Chen, D.; Tian, Y.; Yao, Y. Divergent and Changing Importance of Glaciers and Snow as Natural Water Reservoirs in the Eastern and Southern Tibetan Plateau. J. Geophys. Res. Atmos. 2022, 127, e2021JD035888. [Google Scholar] [CrossRef]
  13. Barnett, T.P.; Adam, J.C.; Lettenmaier, D.P. Potential impacts of a warming climate on water availability in snow-dominated regions. Nature 2005, 438, 303–309. [Google Scholar] [CrossRef] [PubMed]
  14. Morán-Tejeda, E.; Lorenzo-Lacruz, J.; López-Moreno, J.I.; Rahman, K.; Beniston, M. Streamflow timing of mountain rivers in Spain: Recent changes and future projections. J. Hydrol. 2014, 517, 1114–1127. [Google Scholar] [CrossRef]
  15. Arheimer, B.; Donnelly, C.; Lindstrom, G. Regulation of snow-fed rivers affects flow regimes more than climate change. Nat. Commun. 2017, 8, 62–71. [Google Scholar] [CrossRef]
  16. Liu, W.; Wang, L.; Sun, F.; Li, Z.; Wang, H.; Liu, J.; Yang, T.; Zhou, J.; Qi, J. Snow Hydrology in the Upper Yellow River Basin Under Climate Change: A Land Surface Modeling Perspective. Water Resour. Res. 2018, 123, 676–691. [Google Scholar] [CrossRef]
  17. Romshoo, S.A.; Marazi, A. Impact of climate change on snow precipitation and streamflow in the Upper Indus Basin ending twenty-first century. Clim. Chang. 2022, 170, 6. [Google Scholar] [CrossRef]
  18. Liu, Z.; Cuo, L.; Sun, N. Tracking snowmelt during hydrological surface processes using a distributed hydrological model in a mesoscale basin on the Tibetan Plateau. J. Hydrol. 2023, 616, 128796. [Google Scholar] [CrossRef]
  19. Yang, H.; Yang, D.; Lei, Z.; Sun, F. New analytical derivation of the mean annual water-energy balance equation. Water Resour. Res. 2008, 44, W03410. [Google Scholar] [CrossRef]
  20. Roderick, M.L.; Farquhar, G.D. A simple framework for relating variations in runoff to variations in climatic conditions and catchment properties. Water Resour. Res. 2011, 47, W00G07. [Google Scholar] [CrossRef]
  21. Tang, Y.; Wang, D.B. Evaluating the role of watershed properties in long-term water balance through a Budyko equation based on two-stage partitioning of precipitation. Water Resour. Res. 2017, 53, 4142–4157. [Google Scholar] [CrossRef]
  22. Sharma, P.; Mondal, A. Probabilistic Budyko-based Separation of Climate and Catchment Effects on Streamflow. J. Hydrol. 2022, 608, 127665. [Google Scholar] [CrossRef]
  23. Yu, E.; Qi, L.; Dai, L.; Yu, D.; Zhao, F.; Zhou, L.; Zhou, W.; Zhu, Q.; Mao, C.; Wu, G. Correlation analysis of elements in the mountains-rivers-forests-farmlands-lakes-grasslands life community: Using Changbai mountains as an example. Acta Ecol. Sin. 2019, 39, 8837–8845. [Google Scholar]
  24. Qi, P.; Huang, X.R.; Xu, Y.J.; Li, F.; Wu, Y.; Chang, Z.; Li, H.; Zhang, W.; Jiang, M.; Zhang, G.; et al. Divergent trends of water bodies and their driving factors in a high-latitude water tower, Changbai Mountain. J. Hydrol. 2021, 603, 127094. [Google Scholar] [CrossRef]
  25. Zhang, A.; Zhang, C.; Fu, G.; Wang, B.; Bao, Z.; Zheng, H. Assessments of Impacts of Climate Change and Human Activities on Runoff with SWAT for the Huifa River Basin, Northeast China. Water Resour. Manag. 2012, 26, 2199–2217. [Google Scholar] [CrossRef]
  26. Xin, Z.; Li, Y.; Zhang, L.; Ding, W.; Ye, L.; Wu, J.; Zhang, C. Quantifying the relative contribution of climate and human impacts on seasonal streamflow. J. Hydrol. 2019, 574, 936–945. [Google Scholar] [CrossRef]
  27. Chang, Z.; Qi, P.; Zhang, G.; Sun, Y.; Tang, X.; Jiang, M.; Sun, J.; Li, Z. Latitudinal characteristics of frozen soil degradation and their response to climate change in a high-latitude water tower. Catena 2022, 214, 106272. [Google Scholar] [CrossRef]
  28. Yue, S.; Wang, C.Y. Applicability of prewhitening to eliminate the influence of serial correlation on the Mann-Kendall test. Water Resour. Res. 2002, 38, 1–7. [Google Scholar] [CrossRef]
  29. Chen, Y.; Chang, Z.; Xu, S.; Qi, P.; Tang, X.; Song, Y.; Liu, D. Altitudinal Gradient Characteristics of Spatial and Temporal Variations of Snowpack in the Changbai Mountain and Their Response to Climate Change. Water 2021, 13, 3580. [Google Scholar] [CrossRef]
  30. Feng, M.; Zhang, W.; Zhang, S.; Sun, Z.; Li, Y.; Huang, Y.; Wang, W.; Qi, P.; Zou, Y.; Jiang, M. The role of snowmelt discharge to runoff of an alpine watershed: Evidence from water stable isotopes. J. Hydrol. 2022, 604, 127209. [Google Scholar] [CrossRef]
  31. Zhang, T.; Li, D.; Lu, X. Response of runoff components to climate change in the source-region of the Yellow River on the Tibetan plateau. Hydrol. Process. 2022, 36, e14633. [Google Scholar] [CrossRef]
  32. Hu, Y.; Sun, Z.; Ma, R. Springs Emerging along the Elevation Gradient Indicate Intensive Groundwater-Surface Water Exchange in an Alpine Headwater Catchment, Northwestern China. J. Earth Sci. 2023, 34, 181–193. [Google Scholar] [CrossRef]
  33. Linacre, E.T. A simple formula for estimating evaporation rates in various climates, using temperature data alone. Agric. Meteorol. 1977, 18, 409–424. [Google Scholar] [CrossRef]
  34. Li, Z.; Huang, S.; Liu, D.; Leng, G.; Zhou, S.; Huang, Q. Assessing the effects of climate change and human activities on runoff variations from a seasonal perspective. Stoch. Environ. Res. Risk Assess. 2020, 34, 575–592. [Google Scholar] [CrossRef]
  35. Sun, A.; Yu, Z.; Zhou, J.; Acharya, K.; Ju, Q.; Xing, R.; Huang, D.; Wen, L. Quantified hydrological responses to permafrost degradation in the headwaters of the Yellow River (HWYR) in High Asia. Sci. Total Environ. 2020, 712, 135632. [Google Scholar] [CrossRef]
Figure 1. Study site location. (a) Location of Changbai Mountain region in China. (b) DEM, three rivers, and hydrological stations.
Water 16 02735 g001
Figure 2. Variation characteristics of runoff during freeze–thaw periods in the YR basin: (a) SSDW; (b) LJ; (c) TH; (d) JA. Different colored scatter points are used to distinguish different stations. The fitted curves use polynomial regression to capture the nonlinear trends in the data.
Water 16 02735 g002aWater 16 02735 g002b
Figure 3. Runoff variation characteristics during freeze–thaw periods in the TR basin: (a) NP; (b) KST; (c) HD; (d) QH. Different colored scatter points are used to distinguish different stations. The fitted curves use polynomial regression to capture the nonlinear trends in the data.
Water 16 02735 g003
Figure 4. Runoff variation characteristics during freeze–thaw periods in the YR basin: (a) GLCZ; (b) HYT; (c) WDG; (d) FY. Different colored scatter points are used to distinguish different stations. The fitted curves use polynomial regression to capture the nonlinear trends in the data.
Water 16 02735 g004aWater 16 02735 g004b
Figure 5. Changes in land use/land cover in the Changbai Mountain area.
Water 16 02735 g005
Table 1. Hydrological stations in the river-source region in the Changbai Mountain region.
IDHydrological StationsShorthand FormBasins
1ShisandaowanSSDWYR
2LinjiangLJ
3TonghuaTH
4JianJA
5NanpingNPTR
6KaishantunKST
7HedongHD
8QuanheQH
9GaolichengziGLCZSR
10HanyangtunHYT
11WudaogouWDG
12FuyuFY
Table 2. Detection of runoff variation trends during the freeze–thaw period in the YR.
StationsParametersOctoberNovemberDecemberJanuaryFebruaryMarchAprilMay
SSDWMean (m3/s)73.6651.0935.7526.2225.3735.6195.57161.54
Z Value0.793.604.054.263.754.23−1.040.45
Slope0.130.440.380.270.260.43−0.260.22
Sig. **********
LJMean (m3/s)115.2986.0358.0843.4538.7363.60196.10293.63
Z Value0.112.403.323.643.643.862.220.03
Slope0.141.071.321.341.161.382.680.08
Sig. **********
THMean (m3/s)25.2523.9511.836.707.4025.1491.1291.86
Z Value0.041.072.143.782.891.462.623.78
Slope0.020.320.250.180.220.382.000.18
Sig. *** **
JAMean (m3/s)205.88190.76218.47200.90188.30193.47187.85233.55
Z Value0.03−0.68−1.980.30−0.951.141.331.01
Slope0.02−1.23−2.630.15−2.255.564.013.04
Sig. *
Note: ** is p < 0.01, * is p < 0.05.
Table 3. Runoff variation trends during freeze–thaw period in the TR.
StationsParametersOctoberNovemberDecemberJanuaryFebruaryMarchAprilMay
NPMean (m3/s)27.5715.108.715.575.097.7924.6748.99
Z Value−3.02−3.31−4.62−6.24−6.29−5.44−2.73−1.14
Slope−0.51−0.30−0.25−0.23−0.22−0.31−0.41−0.41
Sig.**************
KSTMean (m3/s)31.4519.809.277.546.7113.1430.3256.74
Z Value−1.86−0.99−1.94−3.61−4.06−0.700.210.34
Slope−0.33−0.12−0.15−0.28−0.22−0.090.060.21
Sig. ****
HDMean (m3/s)109.5564.7925.6214.5713.3731.57100.90184.67
Z Value−1.68−0.571.01−0.79−0.13−0.93−0.570.40
Slope−1.94−0.300.24−0.14−0.01−0.28−0.501.34
Sig.
QHMean (m3/s)164.62100.3141.4724.5821.7451.16155.85281.40
Z Value−1.66−0.60−0.930.050.050.760.290.98
Slope−2.02−0.29−0.190.000.010.340.412.25
Sig.
Note: ** is p < 0.01.
Table 4. Runoff variation trends during freeze–thaw period in the SR.
StationsParametersOctoberNovemberDecemberJanuaryFebruaryMarchAprilMay
GLCZMean (m3/s)45.1537.7823.5820.9819.1530.47122.03126.37
Z Value−3.46−0.601.760.702.253.96−1.230.63
Slope−0.49−0.090.110.050.150.32−0.380.25
Sig.** ***
HYTMean (m3/s)54.2840.7223.5517.3116.0331.74136.12165.35
Z Value−2.39−3.05−3.90−4.50−3.701.03−0.320.14
Slope−0.47−0.41−0.26−0.26−0.230.10−0.180.06
Sig.*********
WDGMean (m3/s)41.0428.8112.084.964.3336.7082.9552.41
Z Value−0.45−0.101.212.252.741.52−0.89−0.87
Slope−0.05−0.010.060.050.060.30−0.35−0.25
Sig. ***
FYMean (m3/s)372.83340.87300.04307.36302.75351.39459.61434.34
Z Value−0.66−0.57−0.52−1.10−0.78−0.13−1.42−0.87
Slope−0.74−0.68−0.48−0.75−0.76−0.14−1.42−0.89
Sig.
Note: ** is p < 0.01; * is p < 0.05.
Table 5. Climate and subsurface elasticity coefficients of snowmelt runoff from key sections on Changbai Mountain.
BasinsStationsArea (km2)Snowfall (mm)E0 (mm)Snowmelt Runoff (mm)E0/PR/PnεPεE0εn
YRSSDW9104206.57329.5482.541.600.400.971.58−0.58−1.04
LJ20,687235.47313.9768.821.330.291.461.96−0.96−1.11
TH4731275.37325.61114.031.180.411.131.64−0.64−0.86
JA24,359258.66320.0365.751.780.251.782.19−1.19−1.11
TRNP6745155.74364.4025.572.340.161.442.16−1.16−1.90
KST11,062165.74354.6623.482.140.141.652.35−1.35−1.95
HD25,970173.62341.7932.351.970.191.502.16−1.16−1.69
QH31,800180.17345.1639.101.920.221.392.04−1.04−1.56
SRGLCZ4728297.15329.54154.411.110.520.881.44−0.44−0.72
HYT8532220.80313.97103.741.420.470.871.48−0.48−0.88
WDG12,391204.24337.4334.281.650.171.832.41−1.41−1.62
FY71,783167.49359.8345.242.150.271.121.80−0.80−1.47
Table 6. Contribution of climate and subsurface changes to snowmelt runoff. A represents after; B represents before.
BasinsStationsArea
(km2)
Abrupt YearSnowfall
(mm)
E0
(mm)
Snowmelt Runoff (mm)ΔRP
(mm)
ΔRE0
(mm)
ΔRn
(mm)
ρP
(%)
ρE0
(%)
ρn
(%)
BABABA
YRSSDW91042012204.7213.5327.6335.979.495.45.6−1.210.831.86.961.3
LJ20,6872009230.4248.9310.4322.665.074.610.6−2.61.672.017.410.6
TH47312002253.1300.0326.9324.391.2136.931.80.613.769.01.329.8
JA24,3592006250.0264.2311.4345.860.668.57.9−8.47.932.734.832.5
TRNP67452012148.3187.6366.9354.923.932.013.91.0−7.462.54.433.2
KST11,0622013159.5198.4352.4365.122.328.813.0−1.1−5.566.25.828.0
HD25,9702009162.3205.1344.9341.228.643.717.30.4−3.282.92.015.1
QH31,8002004162.0203.7348.3343.936.342.718.50.5−12.758.21.640.2
SRGLCZ47282004267.8338.1331.0333.6146.2165.352.7−0.5−33.560.70.638.7
HYT85322001201.0240.3314.8340.0105.9101.727.3−4.0−26.647.26.945.9
WDG12,3912004189.1225.3338.1336.627.343.114.60.20.992.81.45.8
FY71,7832004150.7196.0360.3356.542.946.722.10.4−19.452.80.946.3
Disclaimer/Publisher’s Note: The statements, opinions and data contained in all publications are solely those of the individual author(s) and contributor(s) and not of MDPI and/or the editor(s). MDPI and/or the editor(s) disclaim responsibility for any injury to people or property resulting from any ideas, methods, instructions or products referred to in the content.

