Abstract
This study evaluates two reanalysis precipitation products (CRA40 and ERA5) over the Ganjiang River Basin with precipitation data from 37 ground rainfall gauges and surface-observed stream flow data from January 1998 to December 2008. Direct comparison with rain gauge observations shows that both CRA40 and ERA5 can capture the spatial and temporal characteristics of precipitation at the basin scale of the Ganjiang River and reflect most of the precipitation events, but there are pronounced differences in the quality of precipitation between them. ERA5 performs better on the daily scale, capturing precipitation changes more accurately over short periods of time, while CRA40 performs better on the monthly scale, providing more stable and long-term precipitation trends. The results of stream flow simulations using two reanalysis precipitation products driving the VIC hydrological model show that (1) CRA40 outperforms ERA5 with a better Nash–Sutcliffe Efficiency (NSE, 0.65 and 0.6) and higher CC (0.96 and 0.91) in daily and monthly scale stream flow simulations, and ERA5 has a good CC (0.86 and 0.93, respectively), but its NSE is poor (0.29 and 0.30, respectively); (2) both CRA40 and ERA5 generally overestimate basin stream flows, especially during the flood season (April–September), with ERA5’s overestimation being more pronounced. This study is expected to provide a basis for the selection of reliable reanalysis products for Ganjiang River Basin precipitation and hydrological simulation.
1. Introduction
In recent years, the frequency of extreme weather events such as heavy rain, floods, and droughts has significantly increased due to global climate change and human activities [1,2,3,4,5]. Precipitation, a critical factor in climate change affecting water resources, is notably influenced in distribution, intensity, and frequency by extreme weather events. Effectively collecting and analyzing precipitation data are crucial for addressing climate change, managing water resources effectively, and mitigating the impacts of droughts and floods. Traditional ground-based rain gauge observations are commonly used but are significantly influenced by factors such as gauge station density and terrain [6]. Weather radar, another observation method, is subject to various error sources including system errors, signal processing errors, propagation distortion, and observational angle limitations, while extreme weather events like heavy rainfall, thunderstorms, and hail can cause signal saturation and abnormal readings, which further restrict its performance [7,8]. With advancements in remote sensing technology, satellite precipitation data have become crucial for addressing sparse surface observation issues. Satellite-based quantitative precipitation estimation (QPE) products such as the TRMM (Tropical Rainfall Measuring Mission Satellite) and GPM (Global Precipitation Measurement) provide precipitation data with high spatial and temporal resolution and greater accuracy, which support critical tasks such as watershed hydrological analyses, water resource management, and monitoring and early warning of extreme weather events [9,10,11,12]. However, satellite precipitation data are derived from inversion algorithms, a process that increases the uncertainty of precipitation data and therefore requires more verification and calibration work. To enhance precipitation data accuracy, since the 1980s, researchers have utilized meteorological models and data assimilation techniques to re-simulate and analyze ground-based meteorological observations, satellite remote sensing data, and aircraft probe data, generating high-temporal-scale, high-spatial-resolution, and widely covered reanalysis datasets. Reanalysis datasets have become essential data sources driving hydrological models and watershed hydrological simulations [13,14,15]. However, due to variations in data sources and reanalysis models, significant quality differences in these data products may lead to overestimations or underestimations in precipitation and hydrological process studies in different regions [16,17], thereby impacting the accuracy and reliability of hydrological research. Therefore, conducting assessments of the applicability of reanalysis data is crucial as it helps evaluate their performance in precipitation accuracy and provides vital support for hydrological process studies.
The Fifth Generation of European Reanalysis (ERA5), developed by the European Centre for Medium-Range Weather Forecasts (ECMWF), represents the fifth generation of reanalysis data and includes ERA5, ERA5.1, and ERA5-Land datasets [18]. ERA5 is today internationally recognized as one of the most advanced global atmospheric reanalysis datasets, with advanced assimilation systems, optimized parameter schemes, and higher spatial and temporal resolution [19]. CRA (China Meteorological Administration’s Global Atmospheric Reanalysis) is China’s inaugural atmospheric reanalysis product. The conventional surface observations assimilated by CRA include the hourly Chinese basic data of precipitation, wind speed, and temperature from more than 2400 national surface weather stations developed by the China Meteorological Information Centre (CMIC), the observational dataset of the Climate Forecast System Reanalysis (CFSR), and the Integrated Surface Database (ISD) of the global observations of meteorological stations and airports published by the NCEI of the United States of America [20,21]. It uses the GSM-V14 atmospheric model, the GSI-V3.6 data assimilation system, and the 3D-Var assimilation technology [22]. GSM-V14 is the Global Spectral Model (GSM) developed by the China Meteorological Administration (CMA), which is an important version of the Global Numerical Weather Prediction System (GNWPS) that employs a spectral approach to solving the equations of atmospheric dynamics to provide short- and medium-range weather forecasts. The series includes the global atmospheric reanalysis (CRA-40) and global land reanalysis (CRA40-Land) products. CRA40-Land encompasses near-surface atmospheric forcing analysis and land model simulation products. In recent years, numerous scholars have quantitatively analyzed precipitation elements within the ERA5 series [23,24,25], highlighting the need for suitability assessments when using ERA5 for hydrological and climatological research. Additionally, researchers have explored the application of ERA5 datasets in hydrological runoff simulations. For instance, Tarek et al. [26] used ERA5 data to drive GR4J and HMETS hydrological models across 3138 North American basins, demonstrating that ERA5 reanalysis data closely match observational data in hydrological simulations across most regions. Xia et al. [27], using the Xin’anjiang model, compared the effects of original and downscaled ERA5 precipitation data on runoff simulations in the Hengjiang basin, confirming the feasibility of downscaled ERA5 precipitation data as inputs for watershed hydrological models. Tang et al. [28] evaluated the applicability of ERA5-Land reanalysis precipitation products in runoff simulations in the Manas River Basin using the SWAT model, concluding that ERA5-Land precipitation products are effective inputs for hydrological simulations. Concurrently, precipitation data from the CRA reanalysis series have been widely utilized across China and various regions. Wang et al. [20] used precipitation data from 2231 observational stations across mainland China to compare the performance of CRA40-Land, ERA5, and CFSR monthly precipitation products in the region. Their findings demonstrate that CRA40-Land shows minimal errors in estimating monthly average precipitation, suggesting its superior suitability for applications in China. Meanwhile, Zhang et al. [29] performed a thorough error analysis of ERA5-Land and CRA40-Land in the Yongding River Basin of North China, revealing that ERA5-Land had a higher annual total error compared to CRA40-Land. Nevertheless, previous studies have largely concentrated on the applicability of CRA reanalysis precipitation data across different regions; however, the potential of this dataset in hydrological applications in river basins has yet to be thoroughly explored.
Hydrological models form a critical foundation in hydrological research, providing mathematical frameworks to replicate hydrological processes and simulate water cycles, essential for water resources management [11,30]. The VIC (Variable Infiltration Capacity) model, a prominent distributed hydrological model, has become increasingly important for studying watershed simulations and the impacts of climate change on water resources. It is noted for its operational simplicity, high accuracy, open-source code, and ability to model basin water and energy balances effectively. VIC has been widely applied both domestically and internationally [31,32,33]. The Ganjiang River, characterized by complex terrain and prone to heavy rainfall, serves as the largest tributary flowing into Poyang Lake and is representative of the middle and lower Yangtze River region. Previous studies on stream flow simulation and analysis in the Ganjiang River Basin often used satellite precipitation data to drive hydrological models [34,35]. Despite significant advancements in satellite-based precipitation products, research indicates persistent measurement uncertainties, especially in complex terrains [36]. Moreover, there has been relatively little exploration of utilizing reanalysis precipitation data with the VIC hydrological model for hydrological research in the Ganjiang River Basin.
This study aims to achieve two main objectives: (i) to analyze the spatiotemporal error characteristics of CRA40-Land and ERA5 reanalysis precipitation products in the Ganjiang River Basin, quantifying differences to enhance the quality of these products, and (ii) to investigate how CRA40-Land and ERA5 reanalysis precipitation products can be applied in hydrology within the Ganjiang River Basin. This study focuses systematically on the Ganjiang River Basin, filling a research gap regarding the application of reanalysis data in hydrological studies within this region. The findings can provide valuable reference for hydrological research and water resource management in the Ganjiang River Basin and similar complex areas.
2. Region, Data and Methodology
2.1. Study Region
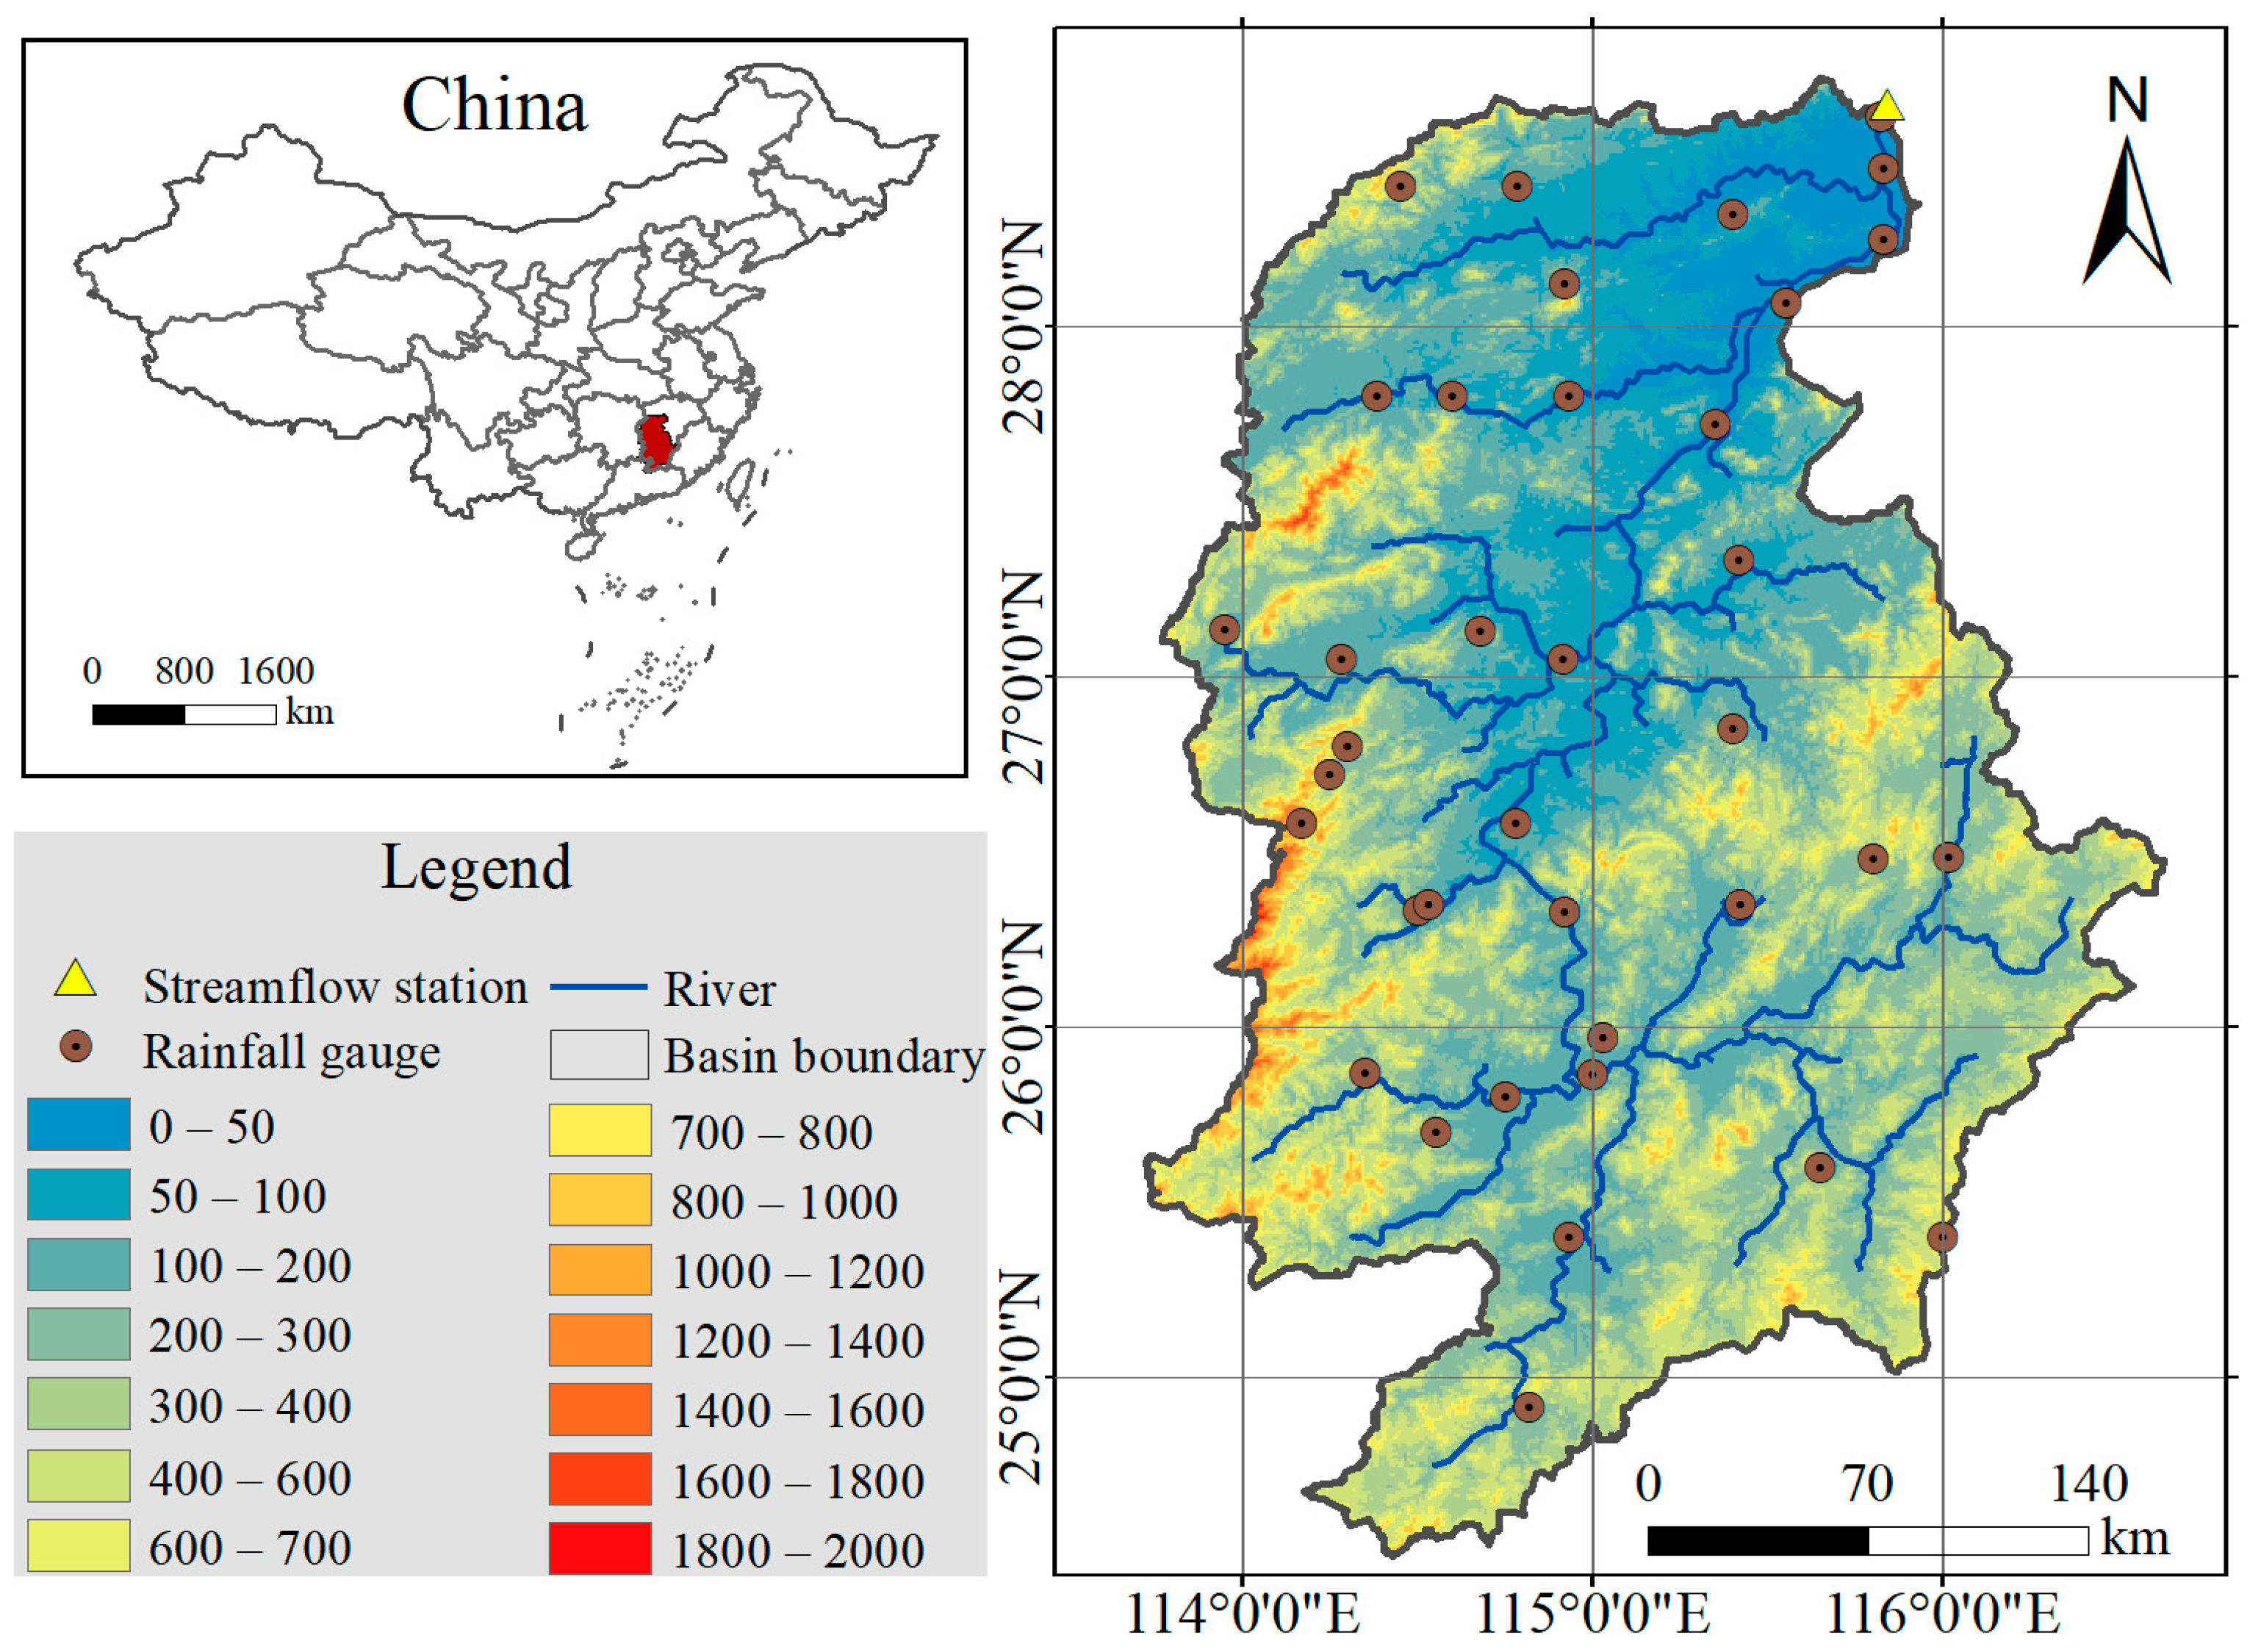
Ganjiang River is one of the eight major tributaries of the Yangtze River, as well as the first major river of the Pan Yang Lake system, which is located on the south bank of the middle and lower reaches of the Yangtze River, and runs through the whole territory of Jiangxi from south to north. Its basin spans longitudinally from 113.74° E to 116.63° E and latitudinally from 24.57° N to 29.07° N, encompassing 766 km in length and approximately 83,500 km² in area. The watershed is characterized by complex terrain, with mountains and hills dominating more than 60% of the watershed area. The Ganjiang River Basin is situated in a subtropical humid monsoon climate zone, where annual precipitation displays distinct seasonal variations and uneven distribution across space and time. Average basin precipitation ranges from 1400 to 1800 mm annually, with the rainy season concentrated mainly from April to June and frequent monsoon-induced convective weather from July to September. Streamflow in the basin is primarily replenished by precipitation.
This study designates the Waizhou Hydrological Station (115.83° E, 28.63° N) at the downstream end of the Ganjiang River Basin as the outlet station, covering a drainage area of 81,244 km². Figure 1 illustrates the geographical layout of the basin and the distribution of ground-based meteorological, rainfall, and hydrological stations.
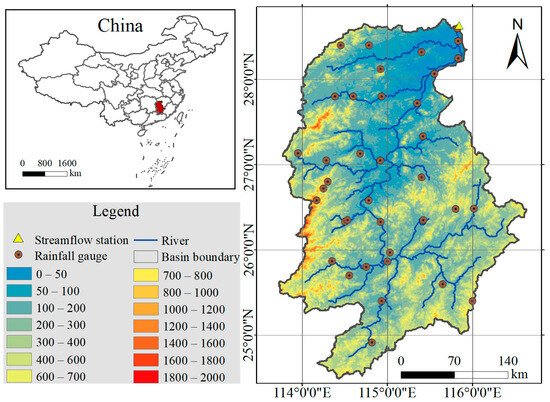
Figure 1.
Study region and gauge distribution.
2.2. Data
In the Ganjiang River Basin study area, DEM data were sourced from ASTER GDEM at 30 m resolution via the Geospatial Data Cloud. Soil characteristics were derived from 1 km resolution gridded data provided by the Harmonized World Soil Database (HWSD). Vegetation data were obtained from the University of Maryland’s global 1 km resolution land cover dataset (UMD).
Meteorological data to be used in the preparation of the meteorological parameter files for the VIC model include precipitation, maximum air temperature, minimum air temperature, and wind speed. The daily maximum temperature, daily minimum temperature, and daily wind speed data were obtained from the China Surface Climatological Data Daily Value Dataset. For daily precipitation, three sources were used: (i) Rain gauge data from 37 national standard stations uniformly distributed in the Ganjiang River Basin managed by the China Meteorological Administration (CMA) (Figure 1), which is manually managed and maintained by the Rain Gauge Instrument, with high data quality, and therefore it is used as the surface precipitation reference data in this study. When driving the VIC model, the surface rain gauge precipitation will be used to prepare the meteorological parameter files together with the maximum temperature, minimum temperature, and wind speed data provided by the China Terrestrial Climatological Data Daily Values dataset. (ii) The CRA40-Land reanalysis precipitation product (later referred to as CRA40). The CRA40-Land reanalysis precipitation product (later referred to as CRA40). The near-surface atmosphere-driven product precipitation is developed based on the CRA precipitation product and combines satellite precipitation data and ground-based rain gauge observations. Precipitation for CRA40 was simulated by the land surface model Noah3.3 using the near-surface atmosphere-driven products as input conditions [22], with a spatial resolution of 0.315° × 0.315° (1152 × 576, Gaussian grid) and a temporal resolution of 24 h. (iii) The ERA5 reanalysis precipitation product. ERA5 is one of the most advanced reanalysis datasets available, with observations assimilated from an Observation Database (ODB) [37] and generated from model forecasts in the Advanced 4D-Var Data Assimilation System and the ECMWF Integrated Forecast System (IFS) CY41R2, which provide higher temporal and spatial resolution than their predecessors [19]. The data were downloaded from the C3S Climate Data Store application programming interface with a spatial resolution of 0.25° × 0.25° and a temporal resolution of 1 h. Meteorological inputs for the VIC model runoff simulation were spatially interpolated using inverse distance weighting (IDW) for observational data and bilinear interpolation for reanalysis data, achieving a watershed grid resolution of 0.125°. When using reanalysis precipitation data to drive the VIC model, it is necessary to replace the precipitation at the surface rain gauge sites in the meteorological parameters with reanalysis precipitation data and to keep the data for maximum temperature, minimum temperature, and wind speed in the meteorological parameters unchanged.
Stream flow data consist of daily observations spanning from 1998 to 2008, sourced from the Jiangxi Waizhou Hydrology Station. These observations, subjected to rigorous quality control, were extracted from the Chinese Hydrological Yearbook and utilized for hydrological research in the Ganjiang River Basin.
2.3. Methodology
2.3.1. Hydrological Model
The Variable Infiltration Capacity hydrological model, or VIC model, is a medium- to large-scale, distributed hydrological model of the land surface that is grid-based and capable of embodying physical mechanisms, developed by the University of Washington; the University of California, Berkeley; and Princeton University [38]. The basic principle of the VIC model is to divide the watershed into several grids based on spatial orthogonal distribution, with each grid representing a land unit, and fully consider different vegetation cover types and soil characteristics within each grid. Within each grid, VIC models separately calculate canopy interception, soil infiltration, and evapotranspiration processes, and the model outputs include soil water content, evapotranspiration, and yield and discharge. In addition, the VIC model also takes into account the two mechanisms of accumulation and over-permeability [39], which improve the accuracy of surface stream flows forecast by the VIC model to a certain extent. However, the VIC model lacks an integrated catchment module. Therefore, in this study, the catchment model developed by Dag Lohmann et al. was used to calculate the catchment surface catchment flow by the unit line method and to simulate the catchment flow using the Saint-Venant equations [40], which ultimately generates stream flow simulation data at the outlet site.
2.3.2. Parameter Calibration and Validation Method
This study divided the simulation of stream flows in the Ganjiang River Basin into two distinct phases: calibration (January 1998 to December 2002) and validation (January 2003 to December 2008) of the hydrological model. The operation of the VIC model requires the preparation of a variety of parameters based on vegetation type and land use data in the study catchment, most of which can be obtained through simple calculations or estimates based on the land surface data used. However, there are six relatively sensitive soil parameters that need to be optimized through the VIC model calibration process [41,42], including (i) the variable infiltration curve parameter (B), which decreases infiltration when B increases, resulting in larger simulated flood peaks; (ii) the maximum velocity of baseflow (Dsmax), which increases surface runoff in winter when Dsmax increases; (iii) the Fraction of Dsmax where nonlinear baseflow begins (Ds), Ds affects baseflow, and winter flow increases with increasing Ds; (iv) the fraction of maximum soil moisture where nonlinear baseflow occurs (Ws) and baseflow increases with increasing Ws, which needs to be adjusted by comparing to the recession process, i.e., the process of runoff approaching the baseflow; (v) second layer of soil thickness (Depth2), which increases evapotranspiration when Depth2 increases, resulting in a decrease in runoff; and (vi) a third layer of soil thickness (Depth3), where an increase in Depth3 increases winter flow. In this study, the algorithm of the Shuffle Complex Evolutionary Algorithm from the University of Arizona (SCE-UA) [43] was used to optimize these six parameters, and the final results obtained are shown in Table 1. The accuracy of the VIC model calibration was assessed using the Nash–Sutcliffe Efficiency coefficient (NSE), calculated by
where denotes observed values, represents simulated values, indicates a specific value at time t, denotes the overall mean of observed values, and T is the total time of simulation. The value range and practical significance of NSE are shown in Table 2 [44,45].

Table 1.
Meanings, range of values, and results of the VIC model calibration parameters.
Table 2.
Evaluation criteria of hydrological simulation results.
2.3.3. Statistics Metrics
Precise precipitation data significantly impact the outcomes of hydrological model simulations. Hence, an evaluation of the accuracy of reanalysis precipitation products is essential prior to their use in driving hydrological models. This study employs two types of indicators for quantitative analysis. The first type comprises continuous statistical metrics used to assess precipitation data accuracy: Root-Mean-Squared Error (RMSE), Relative Bias (RB), and Correlation Coefficient (CC). Specifically, RMSE gauges the accuracy of reanalysis and surface observation precipitation data. A lower RMSE signifies minimal disparity between the two datasets, indicating a higher accuracy in reanalysis precipitation data (optimal value: 0 mm/day). RB quantifies the percentage deviations between the reanalysis and observational data, with positive/negative values indicating over/underestimation (optimal value: 0). CC measures the alignment between reanalysis and surface observation data, ranging from −1 to 1 (optimal: 0 denotes no linear correlation). These indicators are detailed as follows:
where n is the total number of grid points; and denote reanalysed precipitation data and surface-observed precipitation values, respectively; is the mean value of reanalysis precipitation products; and is the surface-observed precipitation value.
The second category is emergency statistical indicators that reflect the accuracy of reanalysis precipitation data to capture precipitation events, including Probability of Detection (POD), False Alarm Rate (FAR), and Critical Success Index (CSI). POD assesses the consistency between correctly identified precipitation events in reanalysis data and actual ground observations, ranging from 0 to 1, where 1 indicates perfect accuracy. FAR represents the percentage of false alarms among all precipitation alerts, ranging from 0 to 1, with 0 being ideal. CSI integrates both POD and FAR to gauge a precipitation product’s capability in correctly identifying real precipitation events, also ranging from 0 to 1, with 1 as the optimal score. These indicators are detailed as follows:
where H denotes the number of precipitation events detected by both the reanalysis precipitation data and the surface observation data; M denotes the number of events in which the reanalysis precipitation data did not show precipitation but the surface observation data showed that there was precipitation; and F denotes the number of events in which the reanalysis precipitation data showed that there was precipitation but the surface observation data did not detect precipitation.
3. Results and Analysis
The results of this study primarily focus on two main aspects. First, it evaluates the accuracy of CRA40 and ERA5 reanalysis precipitation data across different time spans and geographical extents within the Ganjiang River Basin, highlighting their variability in this area. Second, CRA40 and ERA5 reanalysis precipitation data served as inputs for meteorological forcing in the VIC model to simulate stream flows. This study further explores the hydrological potential of CRA40 and ERA5 reanalysis precipitation products by comparing them with observed surface stream flow data.
3.1. Assessment of Reanalysis Precipitation Products
To facilitate comparing and analyzing the spatial distribution of precipitation between ground observations and reanalysis products, we applied the IDW interpolation method to grid precipitation data from ground stations in the Ganjiang River Basin from 1998 to 2008 (GGIDW). Figure 2 illustrates the spatial distribution of 11-year daily average precipitation across the entire basin for GGIDW, CRA40, and ERA5 reanalysis products. Figure 2d,e show the intuitive difference between CRA40 (ERA5) and GGIDW, respectively. When the value is greater than 0, it indicates that the reanalysis product overestimates precipitation. This figure indicates that both reanalysis products generally reflect the spatial precipitation patterns in the Ganjiang River Basin, accurately capturing heavy precipitation in mountainous areas and lower precipitation in central basin regions. Overall, CRA40 tends to slightly overestimate precipitation across the basin, particularly in the southwestern mountainous and hilly areas, northwest low hilly areas, and eastern regions. ERA5 estimates in the central and southern parts of the basin are closer to GGIDW and show a slight underestimation in some areas. Compared to CRA40, ERA5 exhibits more concentrated overestimations, especially in the southwest, northwest, and eastern basin areas. These overestimated regions were similar to those of CRA40, but the extent of overestimation was more pronounced in ERA5.
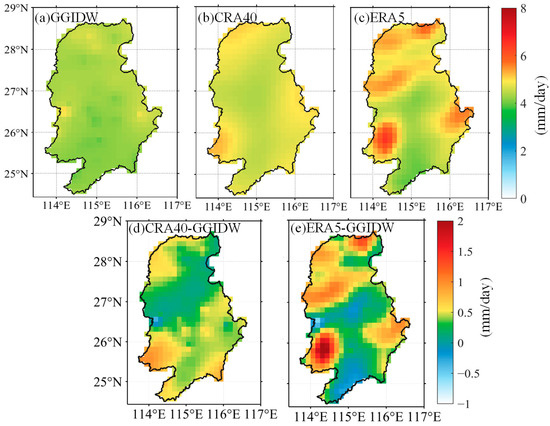
Figure 2.
Spatial distribution map of 11-year daily average precipitation (mm/day) in the Ganjiang River Basin using (a) GGIDW, (b) CRA40, and (c) ERA5, and spatial distribution of (d) the CRA40-GGIDW difference and (e) the ERA5-GGIDW difference.
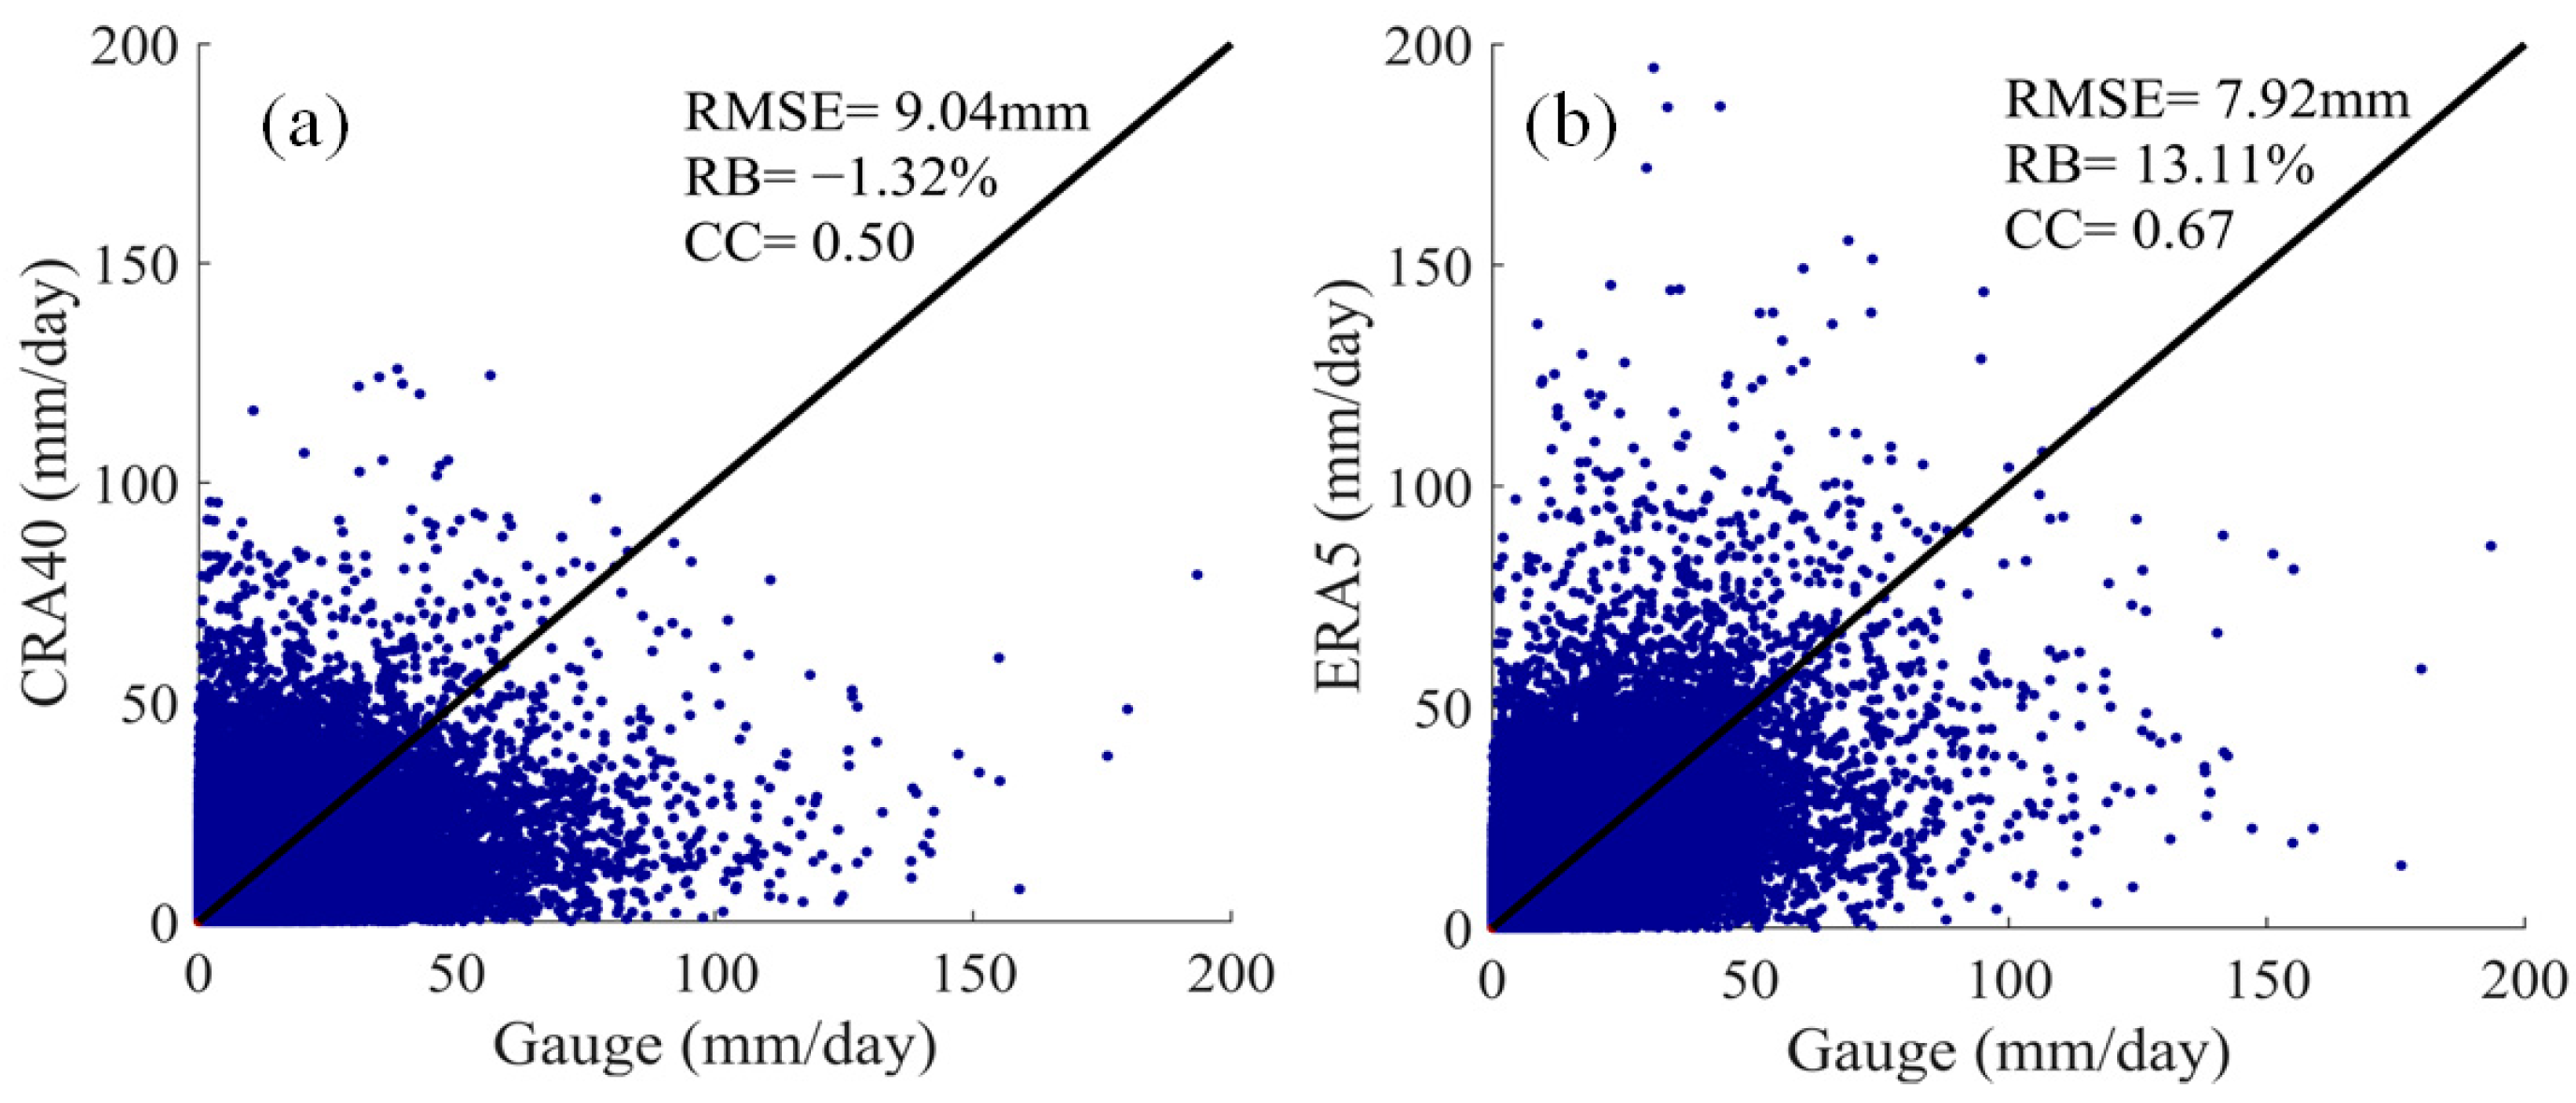
For the quantitative analysis, 37 grids with at least one rain gauge site were selected. Figure 3 and Figure 4 depict the daily and monthly precipitation scatter plots of CRA40 and ERA5 reanalysis products alongside ground station observations. ERA5 consistently overestimated precipitation in the Ganjiang River Basin by more than 13%, whereas CRA40 exhibited a slight underestimation of 1.32%. Specifically, on a daily basis, despite ERA5’s higher RB of 13.11%, it showed a smaller RMSE of 7.92 mm and higher CC of 0.67, surpassing those of CRA40. On a monthly scale, CRA40 closely aligned with observed ground station data, demonstrating a lower RB (−1.32%) and RMSE (38.58 mm) and a higher CC (0.92). These findings suggest that CRA40 accurately captures long-term and seasonal precipitation trends over extended periods, whereas ERA5’s performance in this regard is comparatively weaker. The superior performance of CRA40 is attributed to the fact that it incorporates a large amount of China-specific ground-based observations and satellite data as atmospheric drivers that indirectly influence land surface model precipitation estimates, which enhances the ability of the land surface model to depict overall trends and correlations in long-term precipitation.
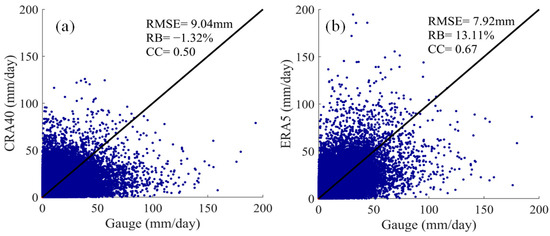
Figure 3.
Grid-based scatter distribution of daily precipitation: (a) CRA40; (b) ERA5.
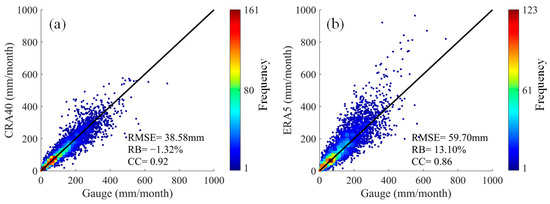
Figure 4.
Grid-based scatter density distribution of monthly precipitation: (a) CRA40; (b) ERA5.
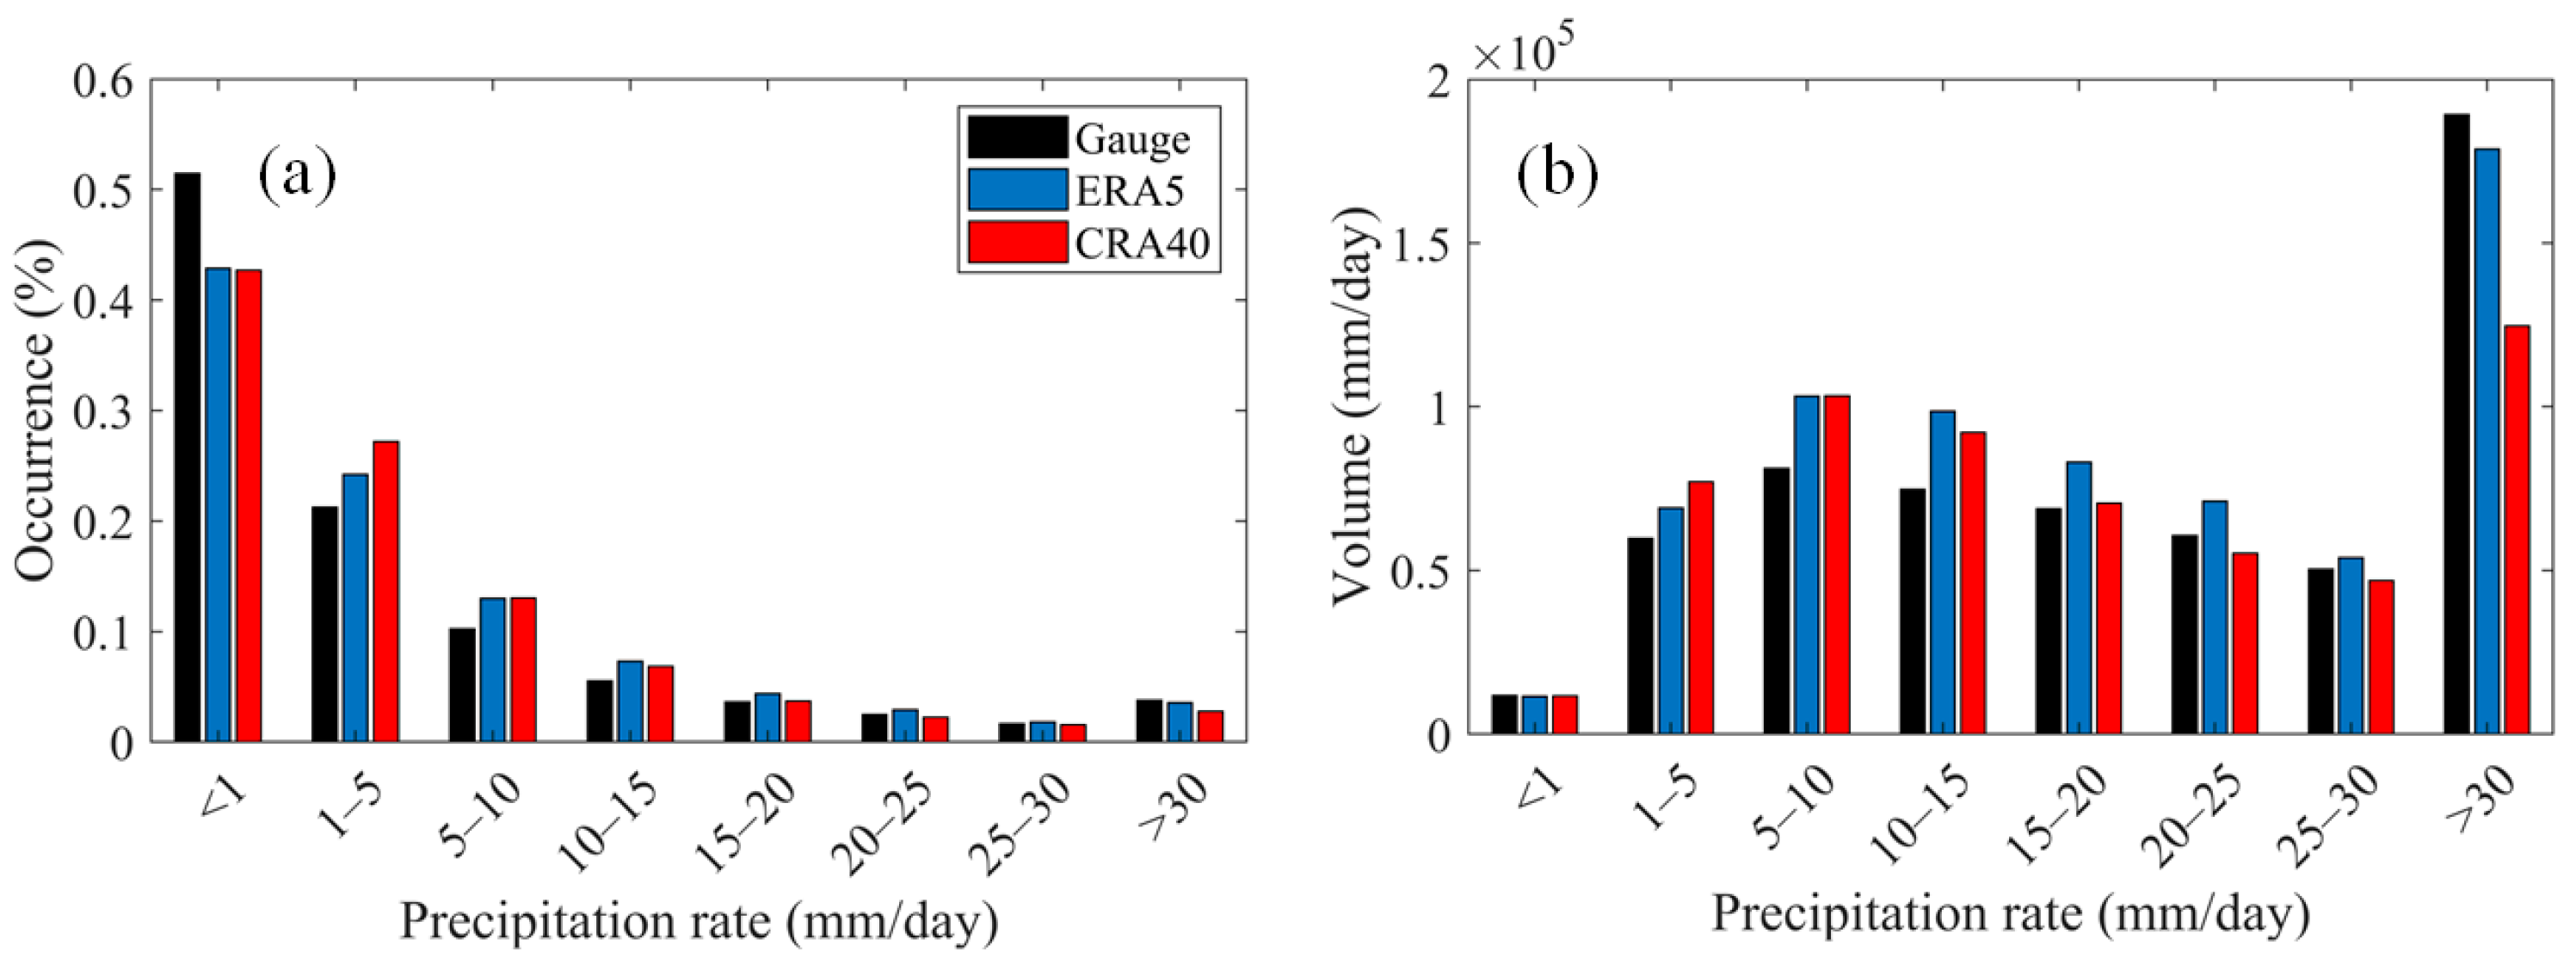
Probability distribution functions (PDFs) illustrate how precipitation products perform in detecting rainfall, showing the relationship between precipitation rate, occurrence, and the accuracy of estimation. Figure 5 depicts precipitation incidence (PDFc) and actual precipitation (PDFv) for CRA40 and ERA5 across various precipitation thresholds. These calculations consider only grid cells where both reanalysis products and ground-based observations record non-zero precipitation values [46]. As depicted in this figure, when precipitation rates are below 1 mm/day, CRA40 and ERA5 exhibit a lower precipitation incidence compared to ground observations, indicating an underestimation by the reanalysis products. In the 1–10 mm/day range, both CRA40 and ERA5 significantly overestimate precipitation incidence and actual precipitation, particularly evident at rates between 1 and 5 mm/day where CRA40 shows more pronounced overestimation. However, for rates exceeding 10 mm/day, CRA40 demonstrates better alignment with ground-based data, showing closer agreement in precipitation incidence and amounts, whereas ERA5 tends to overestimate both. At very high rates exceeding 30 mm/day, both reanalysis products underestimate precipitation incidence and amounts compared to ground observations, with ERA5 showing relatively less underestimation. These findings align with the precipitation patterns illustrated in Figure 2 and Figure 3. The better performance of CRA40 in the low to moderate precipitation range may be attributed to the high accuracy of the Noah 3.3 land surface model used in CRA40 in the simulation of processes such as soil moisture, evapotranspiration, and precipitation transitions, and its physically parameterized scheme that better reflects small-scale meteorological processes. On the other hand, ERA5 is closer to ground-based observations of extreme precipitation events, possibly due to the advantages of its broader data assimilation system and global models, which are better able to capture and simulate the overall characteristics of extreme weather events. Overall, these differences highlight the applicability and limitations of different models under various precipitation conditions.

Figure 5.
Probability distribution of precipitation (a) occurrence and (b) volume.
Figure 6 shows how CRA40 and ERA5 perform under various precipitation thresholds in the Ganjiang River Basin, assessing their ability to detect precipitation events through metrics like Probability of Detection (POD), False Alarm Rate (FAR), and Critical Success Index (CSI). ERA5 generally demonstrates superior accuracy in daily precipitation detection, boasting higher POD and CSI scores and lower FAR. The performance gap between CRA40 and ERA5 widens in the 1–50 mm/day threshold range but diminishes in the 50–100 mm/day range. Notably, for thresholds ≥116 mm/day, both reanalysis products struggle to capture high-intensity precipitation events, reflected in near-zero POD and CSI scores and close to 100% FAR. These findings underscore ERA5’s strengths in accurately detecting daily precipitation events, while highlighting limitations for both models in detecting high-intensity precipitation events.
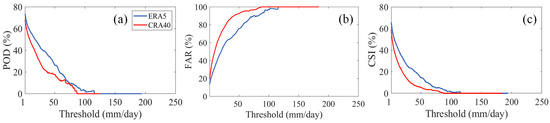
Figure 6.
Contingency metrics of (a) POD, (b) FAR, and (c) CSI for reanalysis precipitation products in Ganjiang River Basin.
3.2. Seasonal Statistics
Table 3 shows the performance of CRA40 and ERA5 reanalysis precipitation products on 11-year seasonal daily precipitation in the Ganjiang River Basin. ERA5 performed relatively well in the four seasons, but there was a general overestimation of precipitation, especially in summer, by 19.58%. In addition, ERA5 had relatively small RMSE values across all seasons and generally high CC values (0.63 to 0.72). In contrast, although CRA40 has a smaller absolute RB value in spring, summer, and autumn, its RMSE value is relatively large and its CC value is also low in general, especially in spring when it is only 0.37. In general, ERA5 is relatively more suitable for the study of seasonal daily precipitation in the Ganjiang River Basin, but its precipitation simulation in summer still has room for improvement. While CRA40 did not perform as well as ERA5, it did relatively well in the summer, fall, and winter. The reason for ERA5’s superior performance in daily series precipitation detection may stem from its higher temporal resolution of only 1 h compared to CRA40’s 24 h. This enables ERA5 to provide more detailed and accurate temporal and spatial information of precipitation, thus improving the performance of its daily precipitation simulation.
Table 3.
Grid-based seasonal statistics with CRA40 and ERA5 over Ganjiang River Basin.
3.3. Daily Series Mean Rainfall
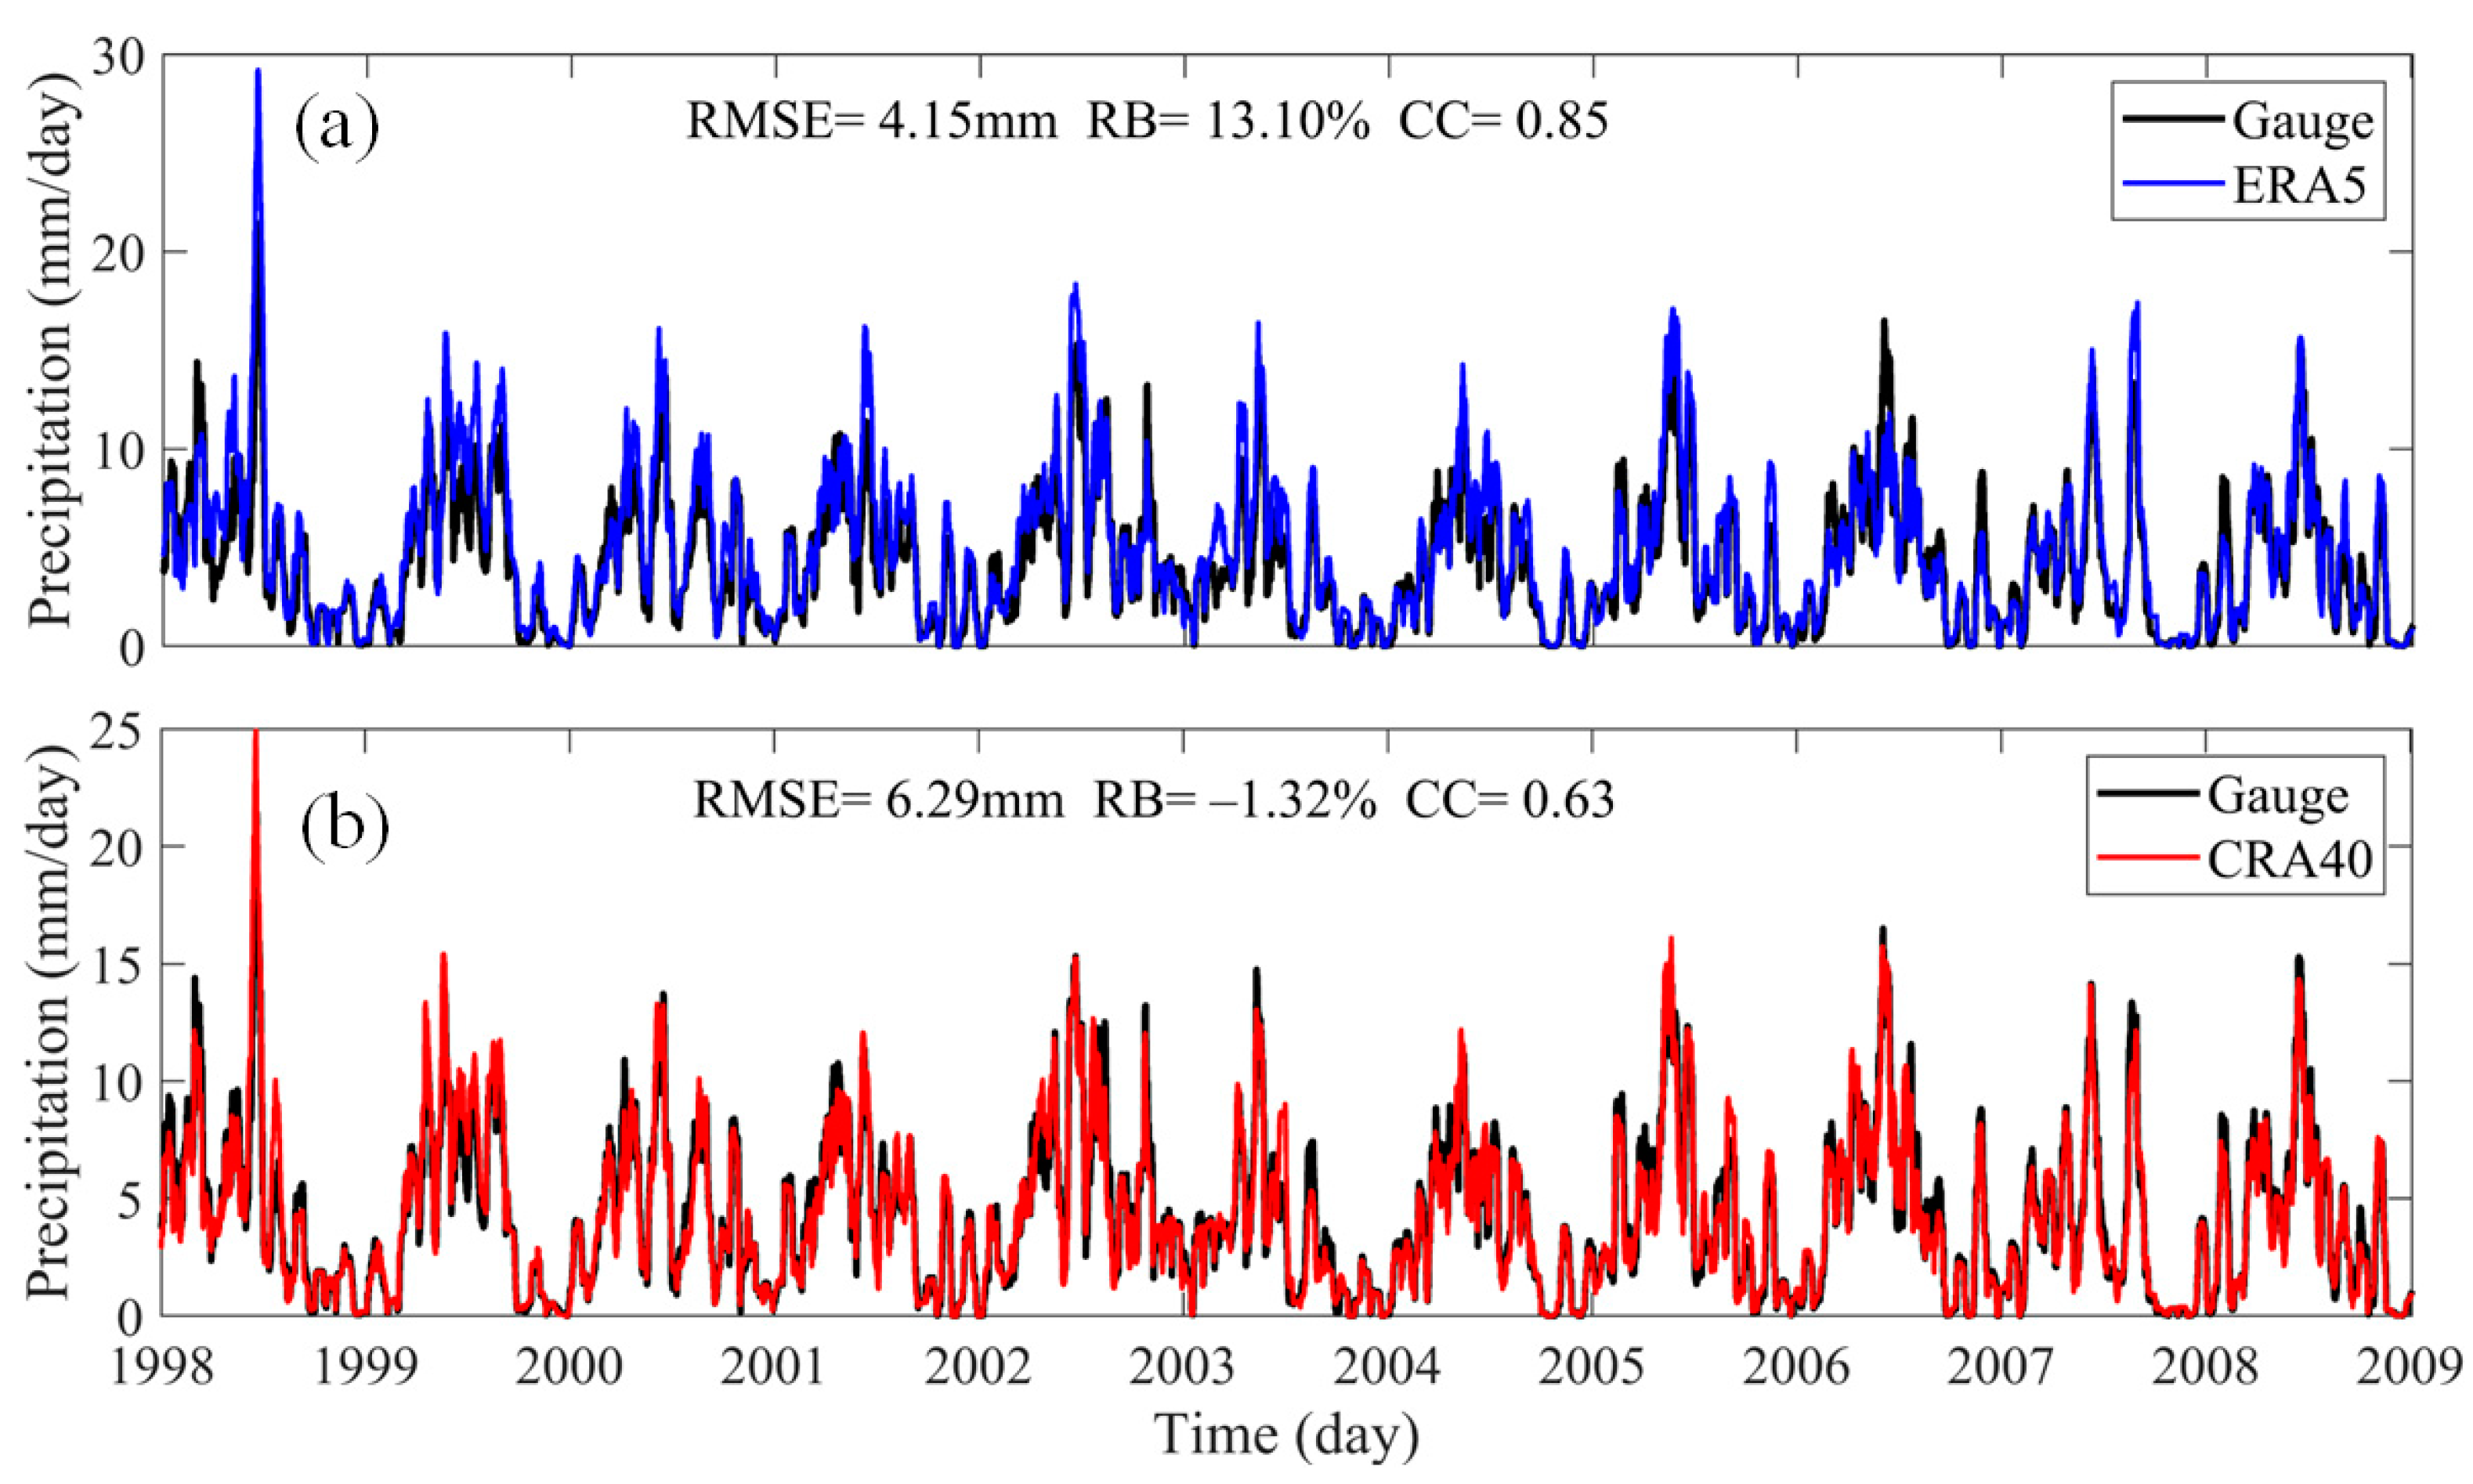
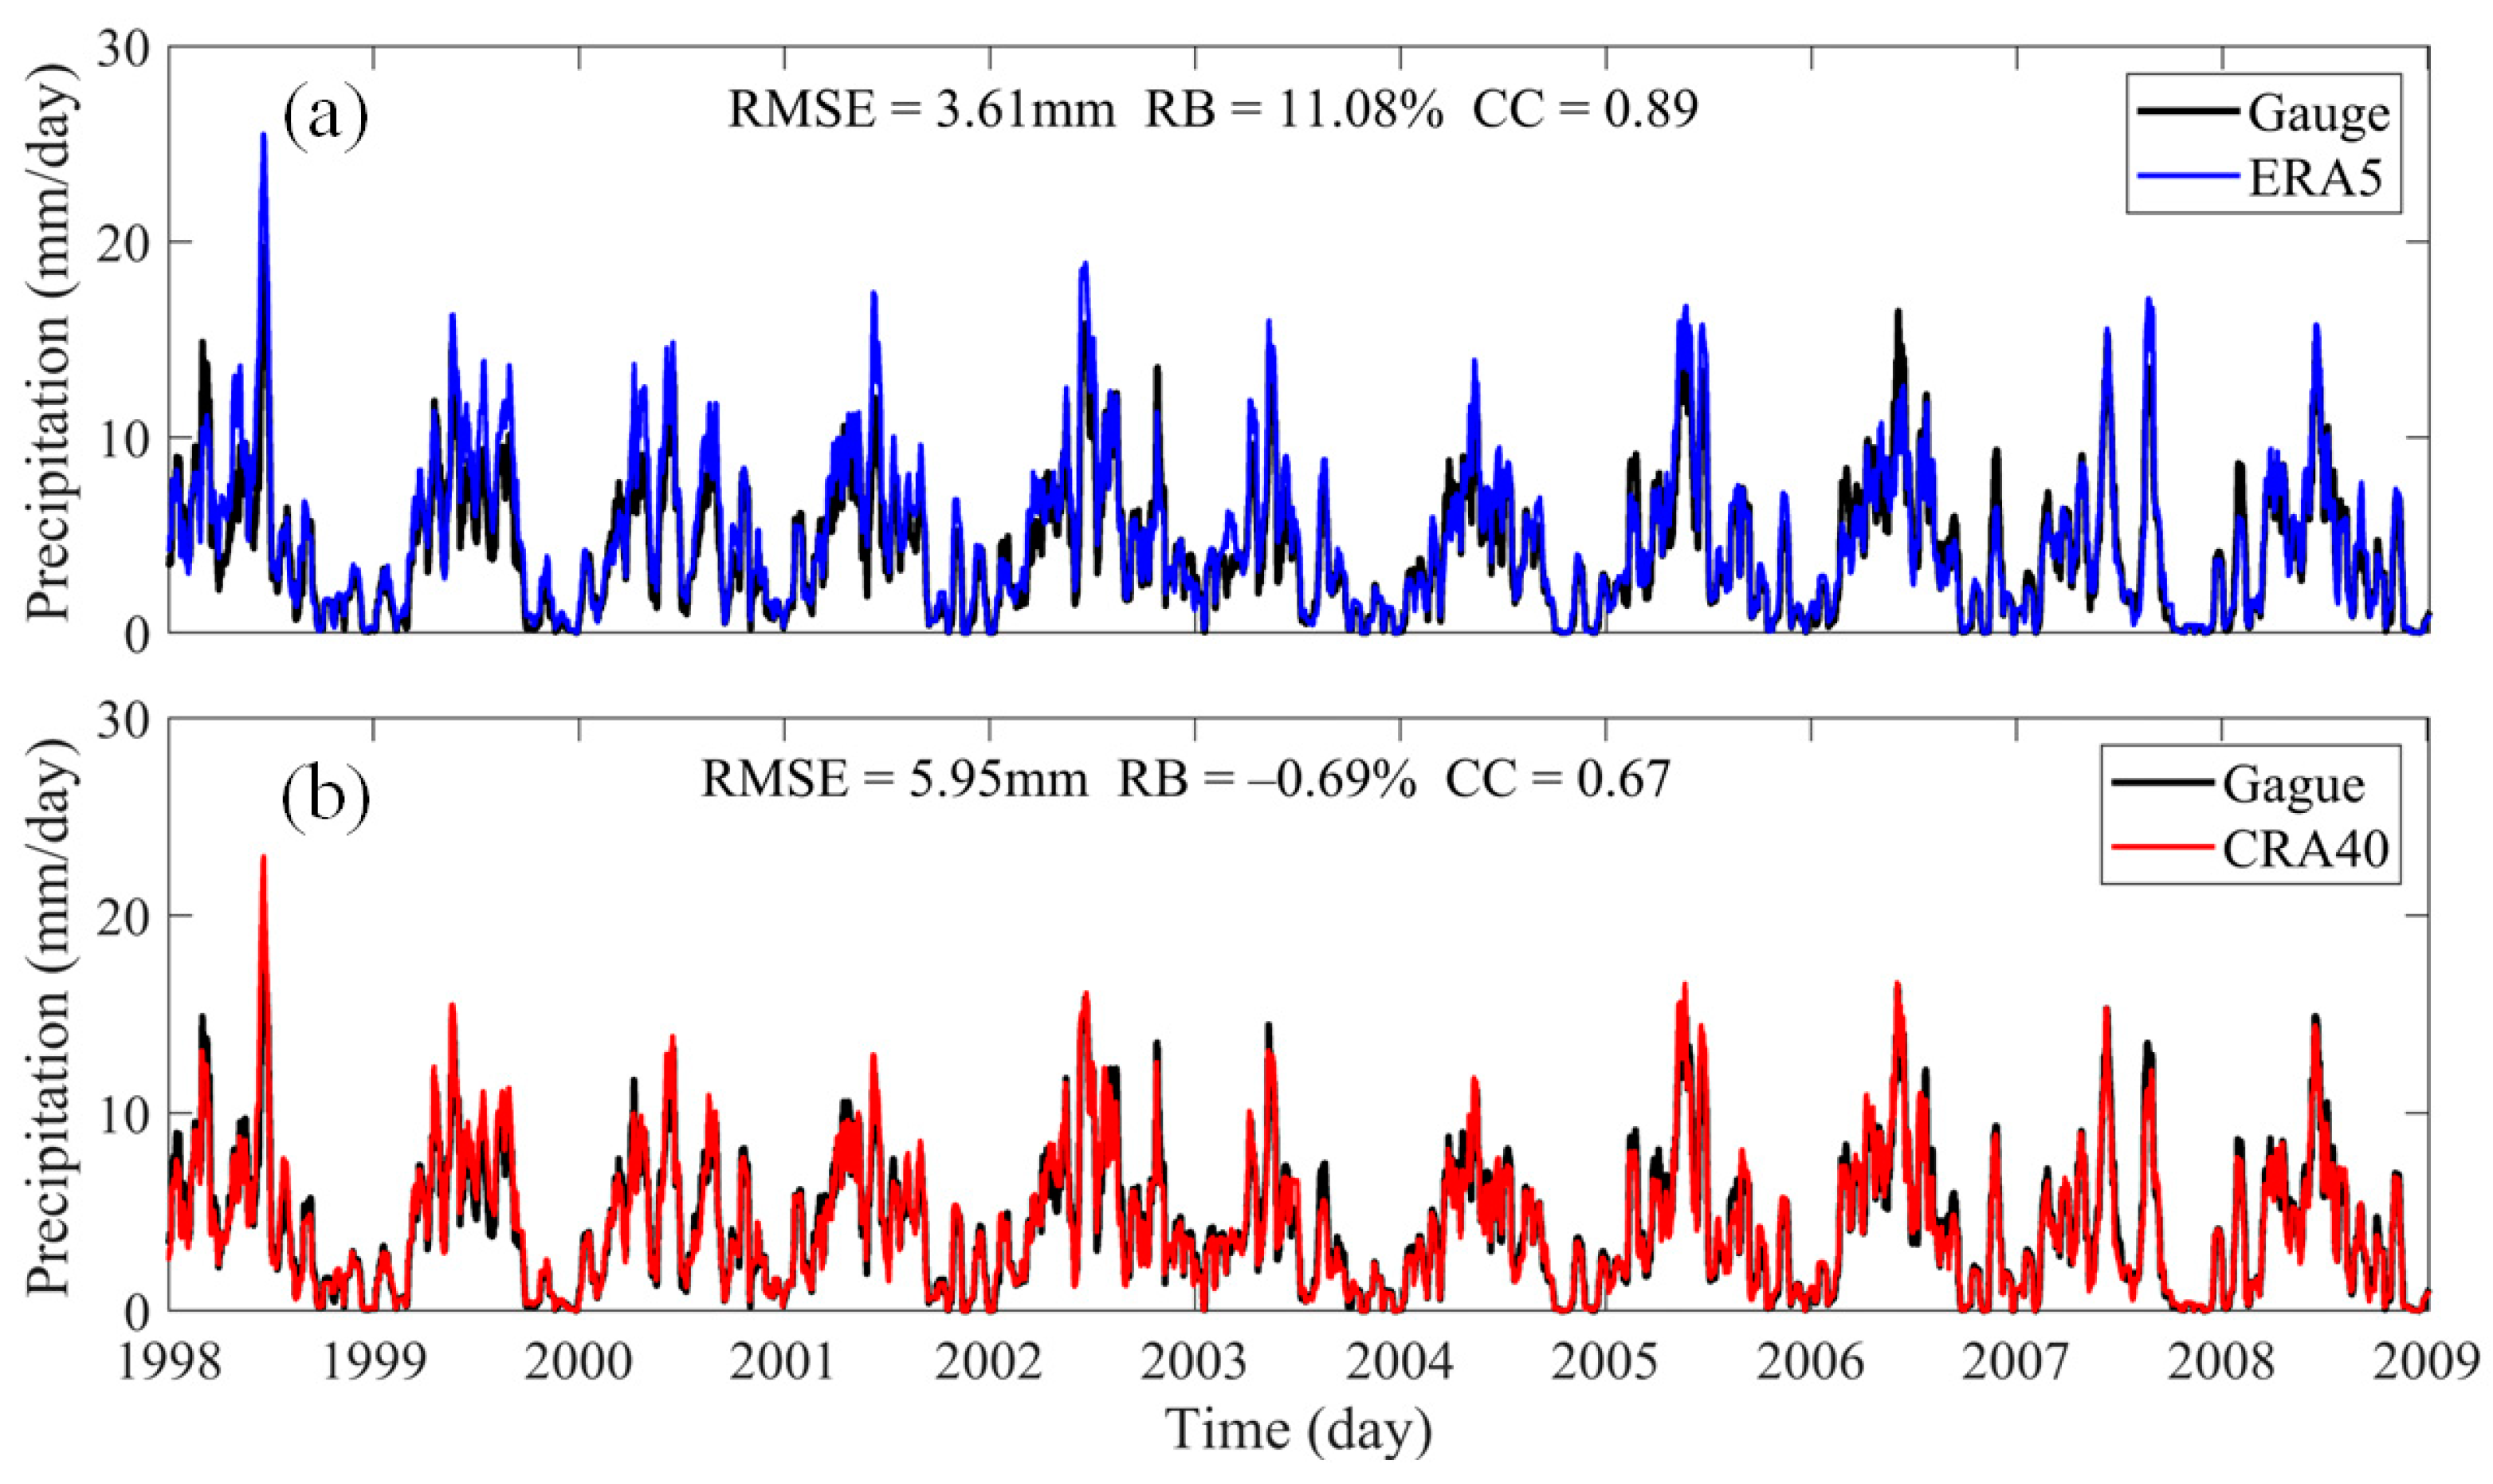
Figure 7 and Figure 8 show the time series of CRA40 and ERA5 precipitation products compared to 37 selected grid-based and basin-based daily mean precipitation. Both reanalysis products effectively capture the seasonal trends of increased summer precipitation and decreased winter precipitation observed by the ground stations. Moreover, they accurately reflect daily precipitation changes at the basin. Specifically, ERA5 has better agreement with ground-based observations in terms of both grid-based and catchment-based mean daily precipitation. In contrast, CRA40 performs slightly less effectively in these aspects. ERA5 tends to overestimate precipitation with RB values of 13.10% and 11.08%; yet, it achieves better RMSE (5.95 mm and 3.61 mm) and CC (0.85 and 0.89) scores. Conversely, CRA40 slightly underestimates precipitation with RB values of −1.32% and −0.69%, but exhibits higher RMSE (6.29 mm and 4.15 mm) and CC (0.63 and 0.67) scores compared to ERA5. These findings align with those presented in Table 3.
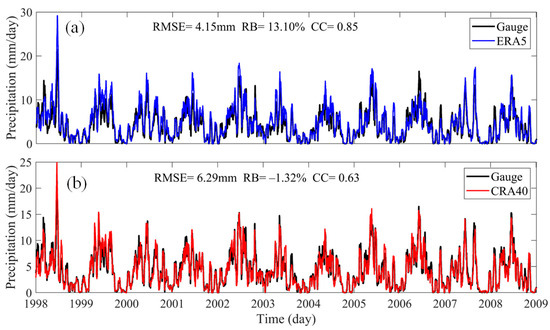
Figure 7.
Time series of daily mean precipitation based on grid-based observations from gauge and (a) CRA40 and (b) ERA5 products. The smooth function was applied to enhance the differences among different reanalysis precipitation products.
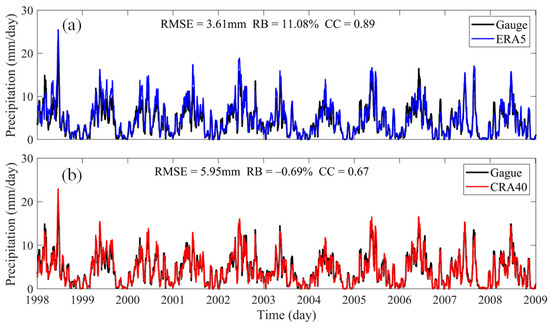
Figure 8.
Time series of daily mean precipitation of observational interpolation data and reanalysis products (a) CRA40 and (b) ERA5 within the basin. The smooth function was applied to enhance the differences among different reanalysis precipitation products.
3.4. Hydrologic Model Calibration
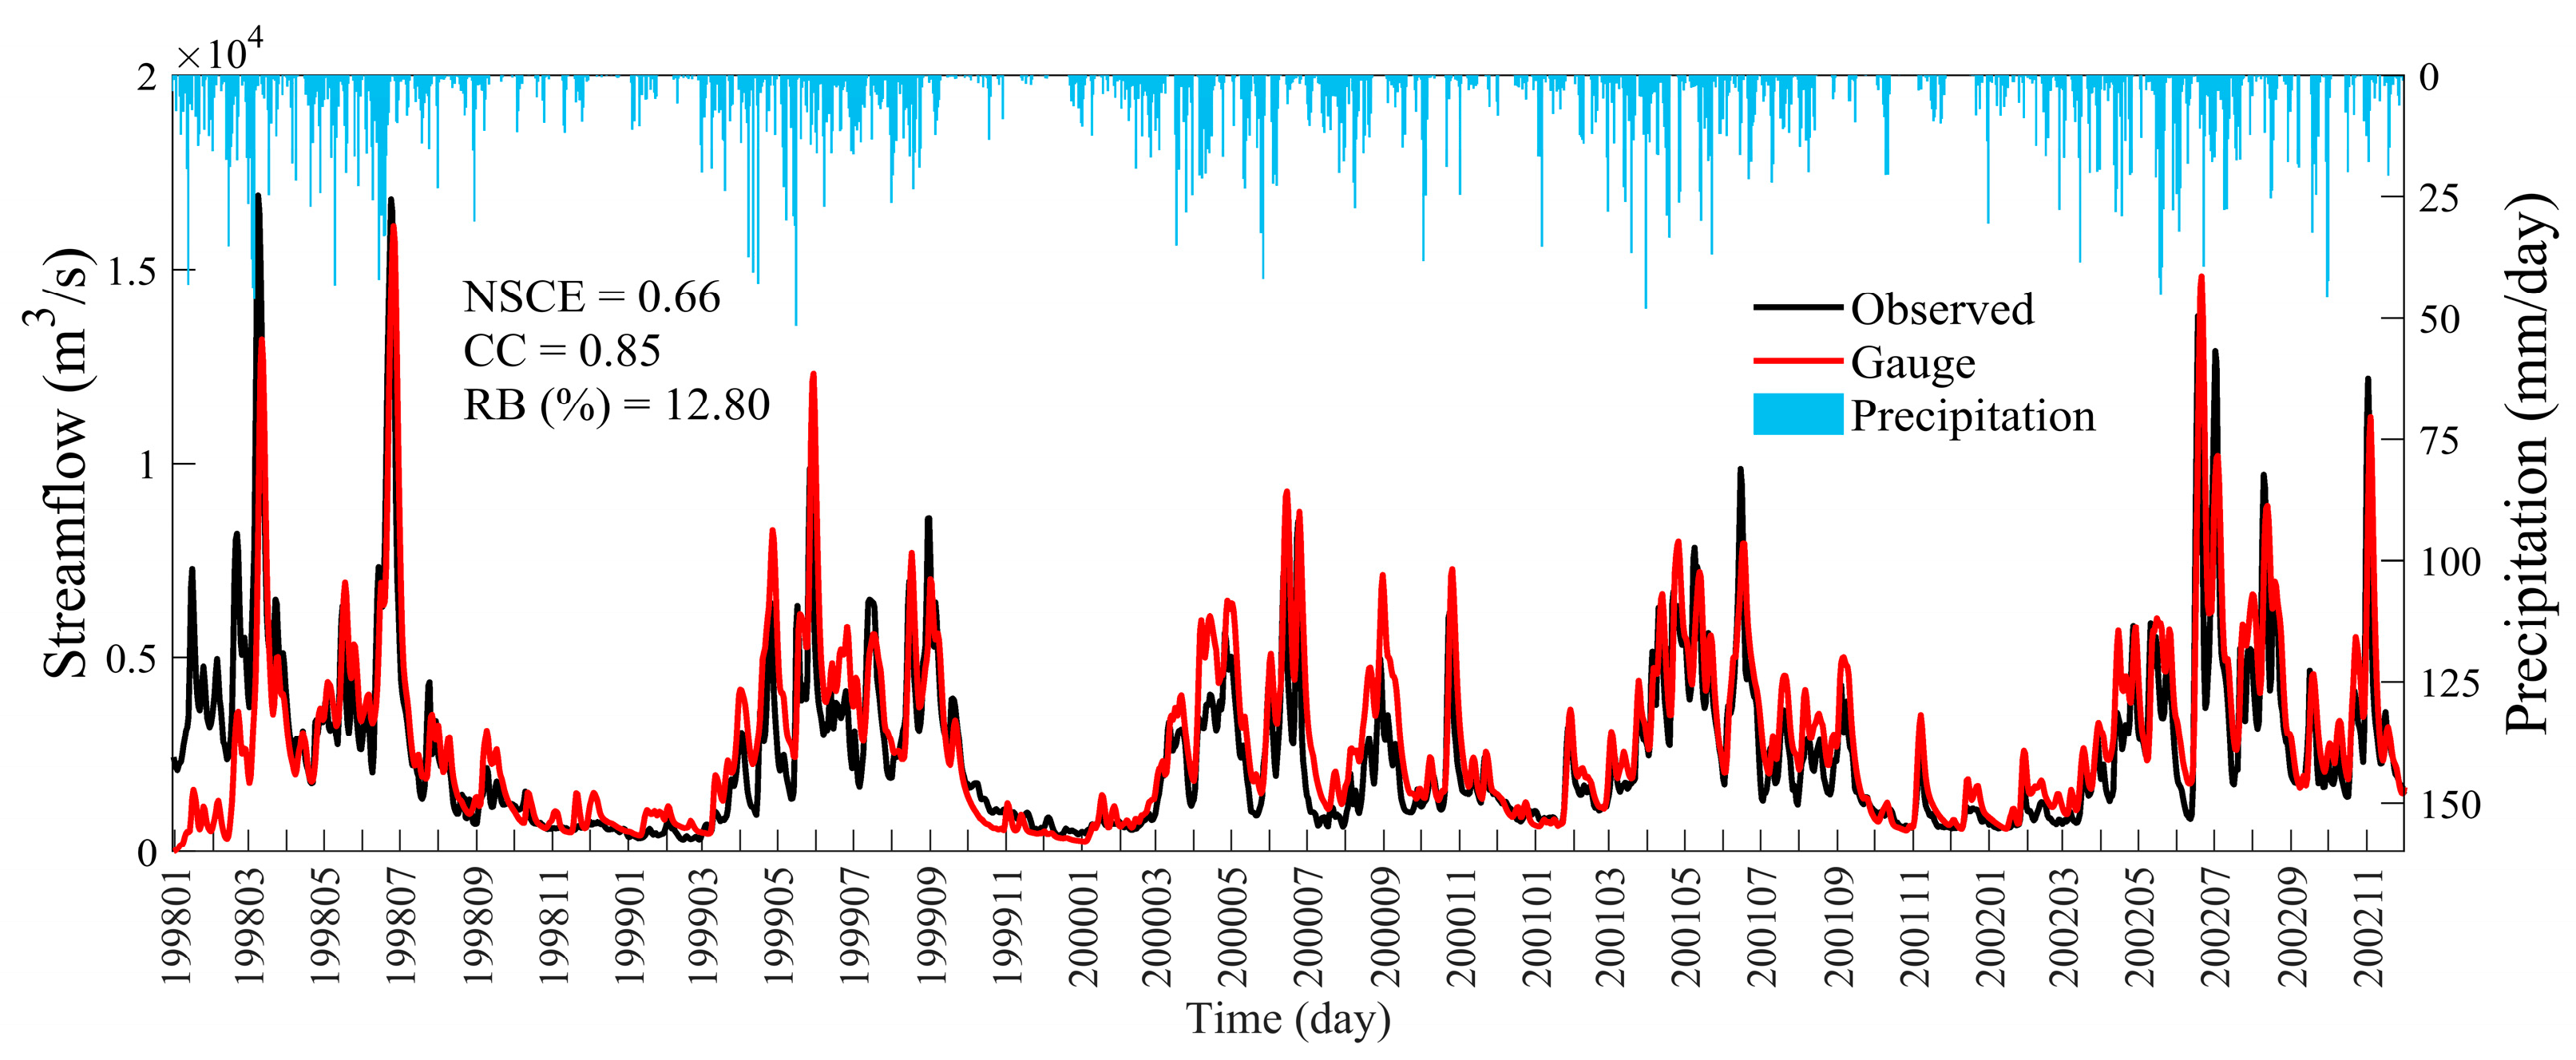
During the calibration and validation phases of the hydrological model, interpolated daily precipitation data from ground-based rain gauge observations spanning from January 1998 to December 2002 were used to drive the VIC model. Figure 9 illustrates the comparison between observed and simulated daily streamflow processes at the Waizhou Hydrological Station. The simulated stream flows curve is in good agreement with the measured stream flows curve, showing good agreement with an NSE of 0.66, CC of 0.85, and a slight overestimation (RB = 12.80%). The VIC model effectively captures hydrological characteristics such as peak flows, recession processes, and baseflow variations, demonstrating good overall simulation performance.
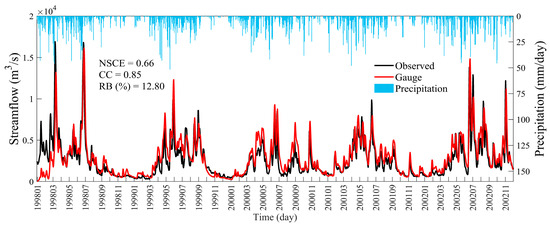
Figure 9.
Calibration of the VIC model during the period from January 1998 to December 2002. Rainfall inputs (gray bars) from gauge observations are plotted on the secondary coordinate.
3.5. Hydrological Assessment of Reanalysis Precipitation Products
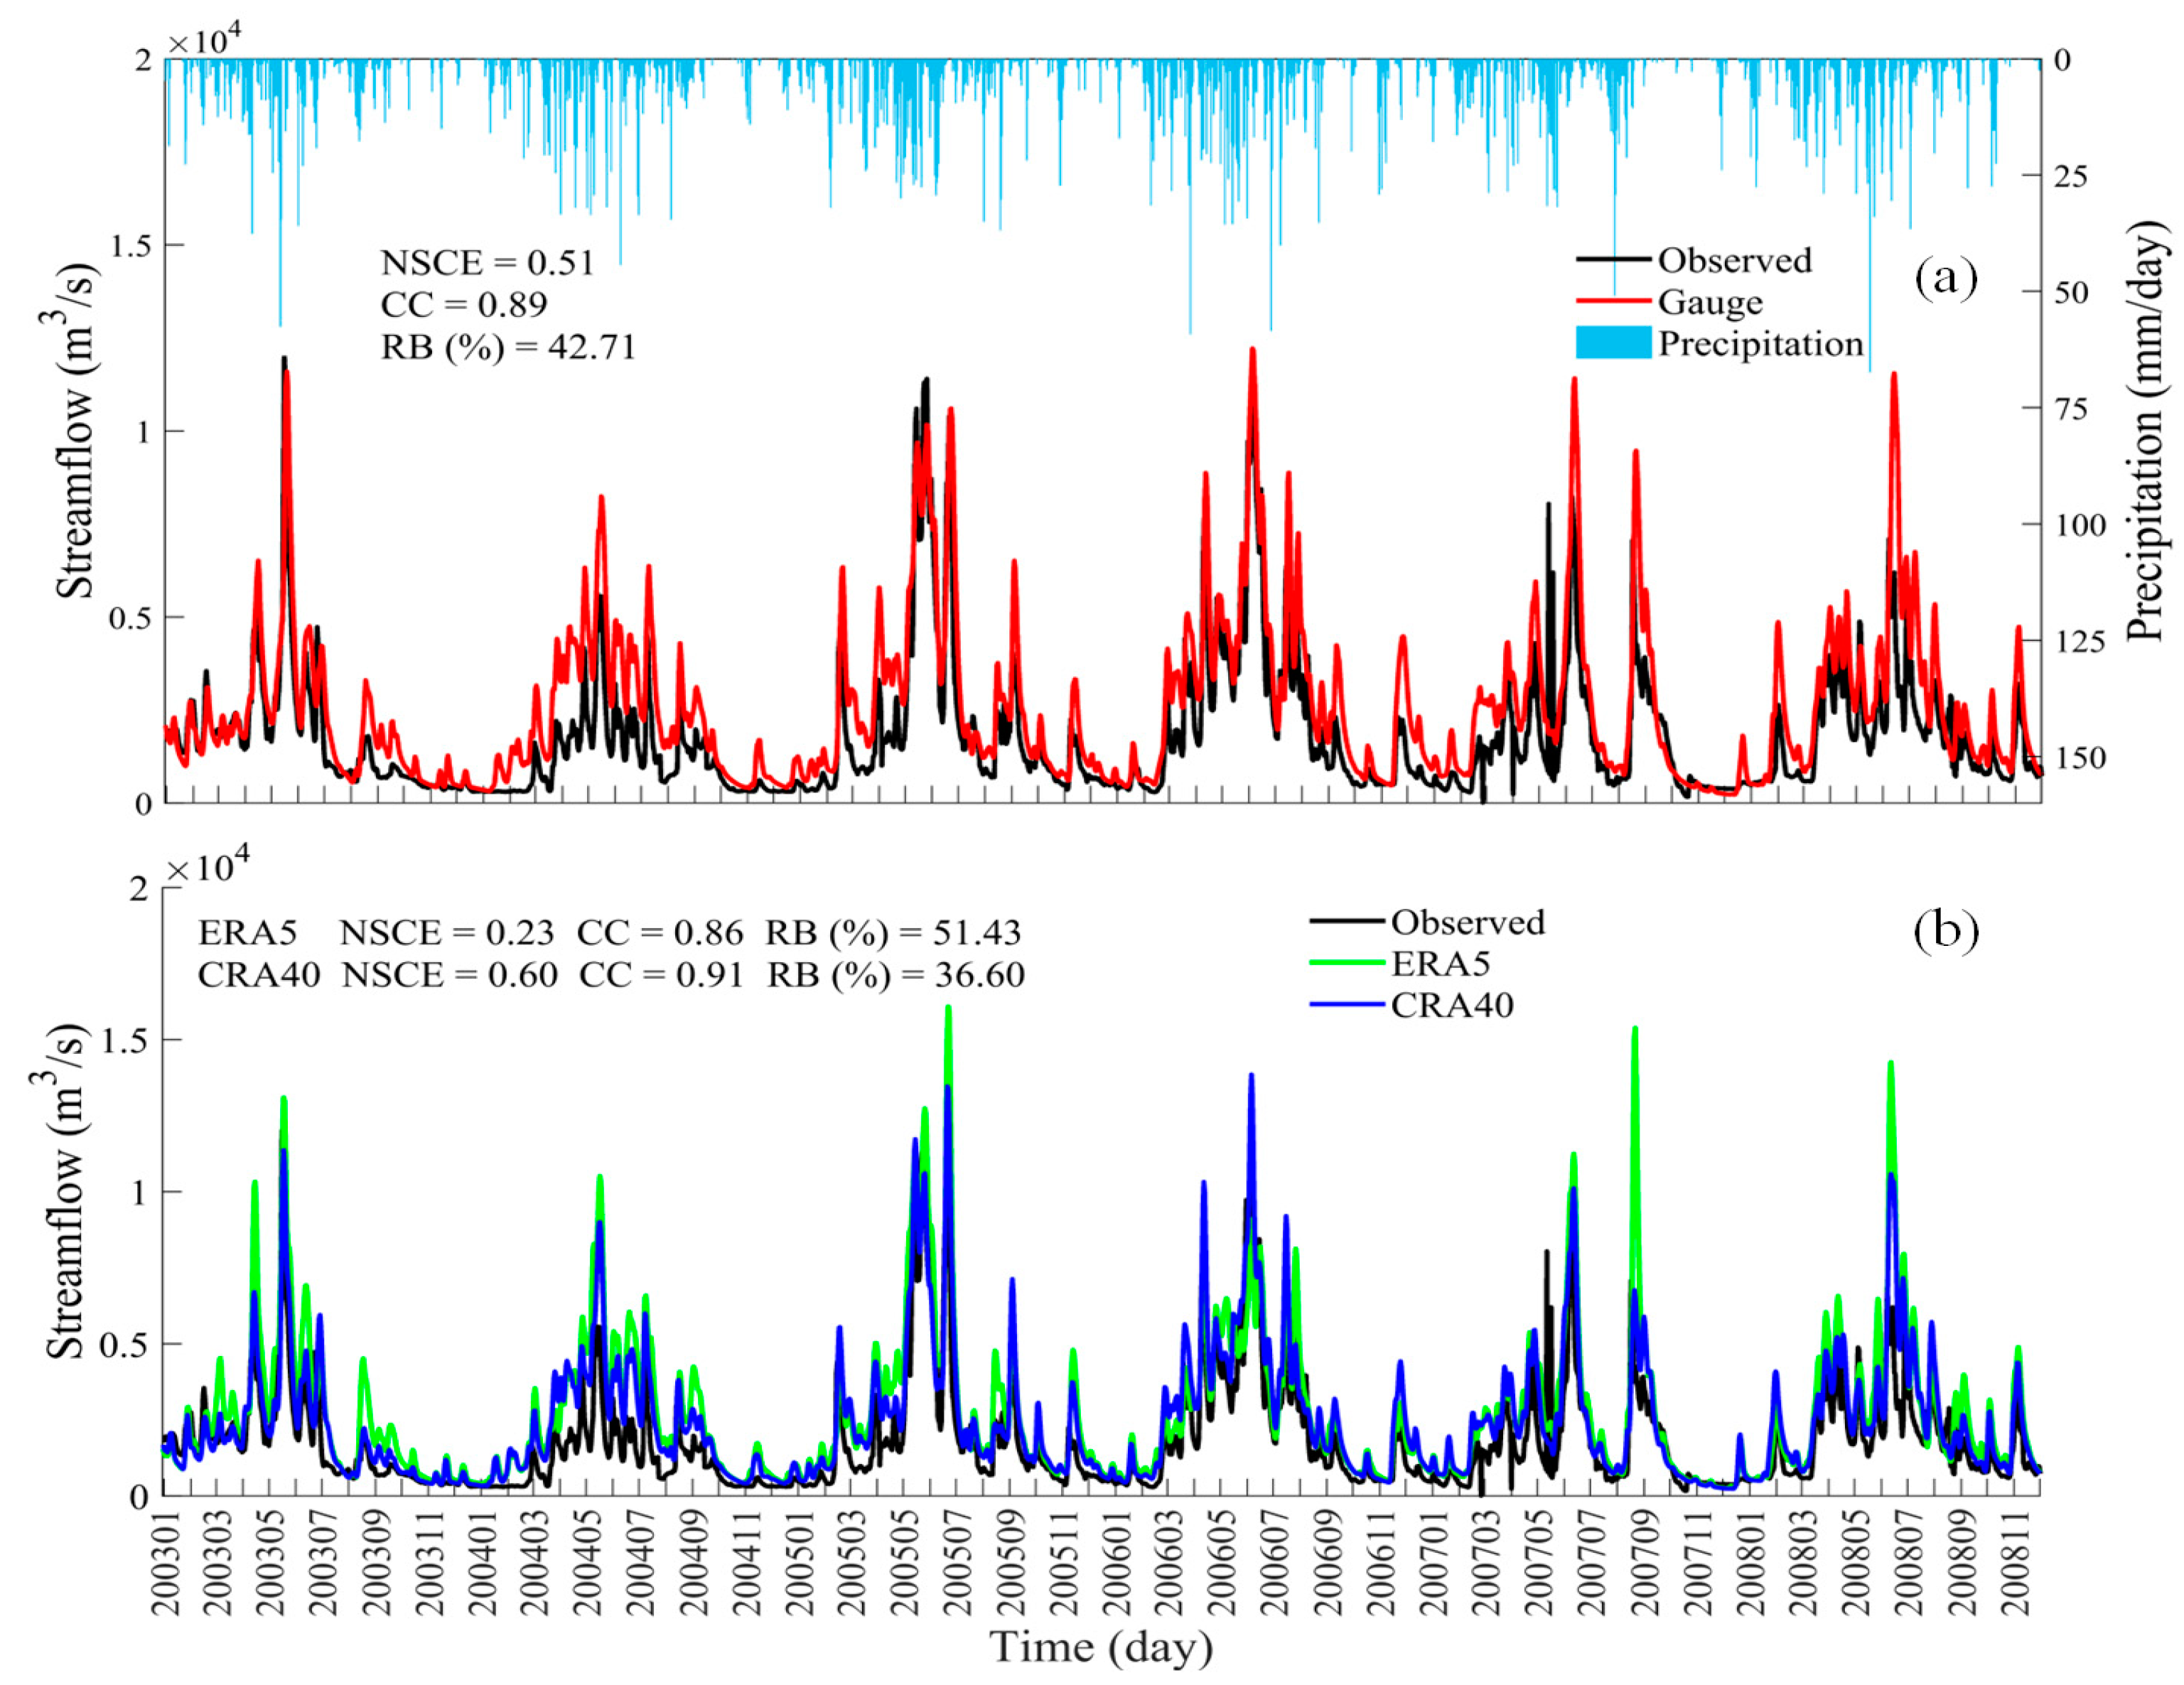
Figure 10 illustrates the observed and simulated daily stream flow processes in the Gan River basin during the validation period from 2003 to 2008. Simulations utilized various precipitation datasets including ground-based rain gauge observations, CRA40, and ERA5 reanalysis products. The simulations based on these datasets effectively capture the hydrological variability in daily stream flows in the basin. Specifically, simulations based on CRA40 exhibit higher consistency with observed runoff curves, as evidenced by higher NSE (0.60) and CC (0.91) scores, and a relatively lower RMSE (36.60%). In contrast, simulations using ERA5 show poorer performance with an NSE of 0.23, CC of 0.86, and an overestimation of stream flows by 51.43%. Compared to the calibration period, simulations using ground-based rainfall gauge observations during the validation period show a slight decrease in NSE (0.51) and a slight increase in CC (0.89), but a notable increase in overestimation (RB increasing from 12.80 to 42.71%). Overall, among the three input datasets, simulation effectiveness ranks in the following order: CRA40, ground-based rainfall gauges, and ERA5. Furthermore, during the validation period, simulations using inputs from ground-based rainfall gauges, CRA40, and ERA5 consistently overestimated various flow components, including peak flows and base flows, particularly from April to September each year. ERA5 exhibited the most pronounced overestimation, consistent with the findings in Figure 3 and Figure 4, indicating potentially poorer hydrological performance in simulations based on ERA5 inputs. It is noteworthy that in contrast to other years, the simulations based on ground-based rainfall gauges, CRA40, and ERA5 inputs in 2004 exhibit a distinct characteristic of significant overestimation. This could be attributed to a severe drought event experienced in the Ganjiang River Basin from late 2003 to early 2004. Despite a relatively uniform spatial and temporal precipitation distribution in 2004, the low soil moisture content and high land surface evaporation resulted in relatively smaller actual stream flows generated from precipitation [47], which was overestimated by the model.
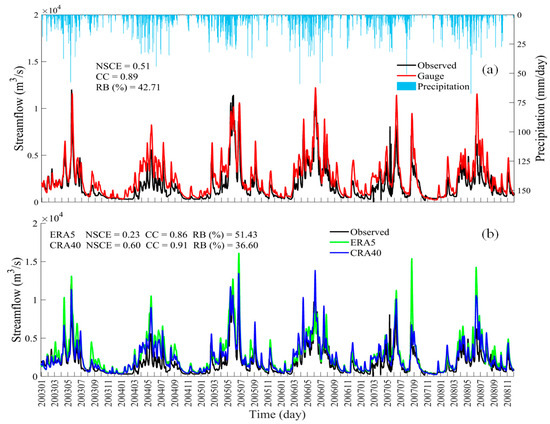
Figure 10.
Daily simulations of river discharge with rainfall inputs from (a) gauge; (b) CRA40, and ERA5. Rainfall inputs (blue bars) are depicted on the secondary vertical axis in (a).
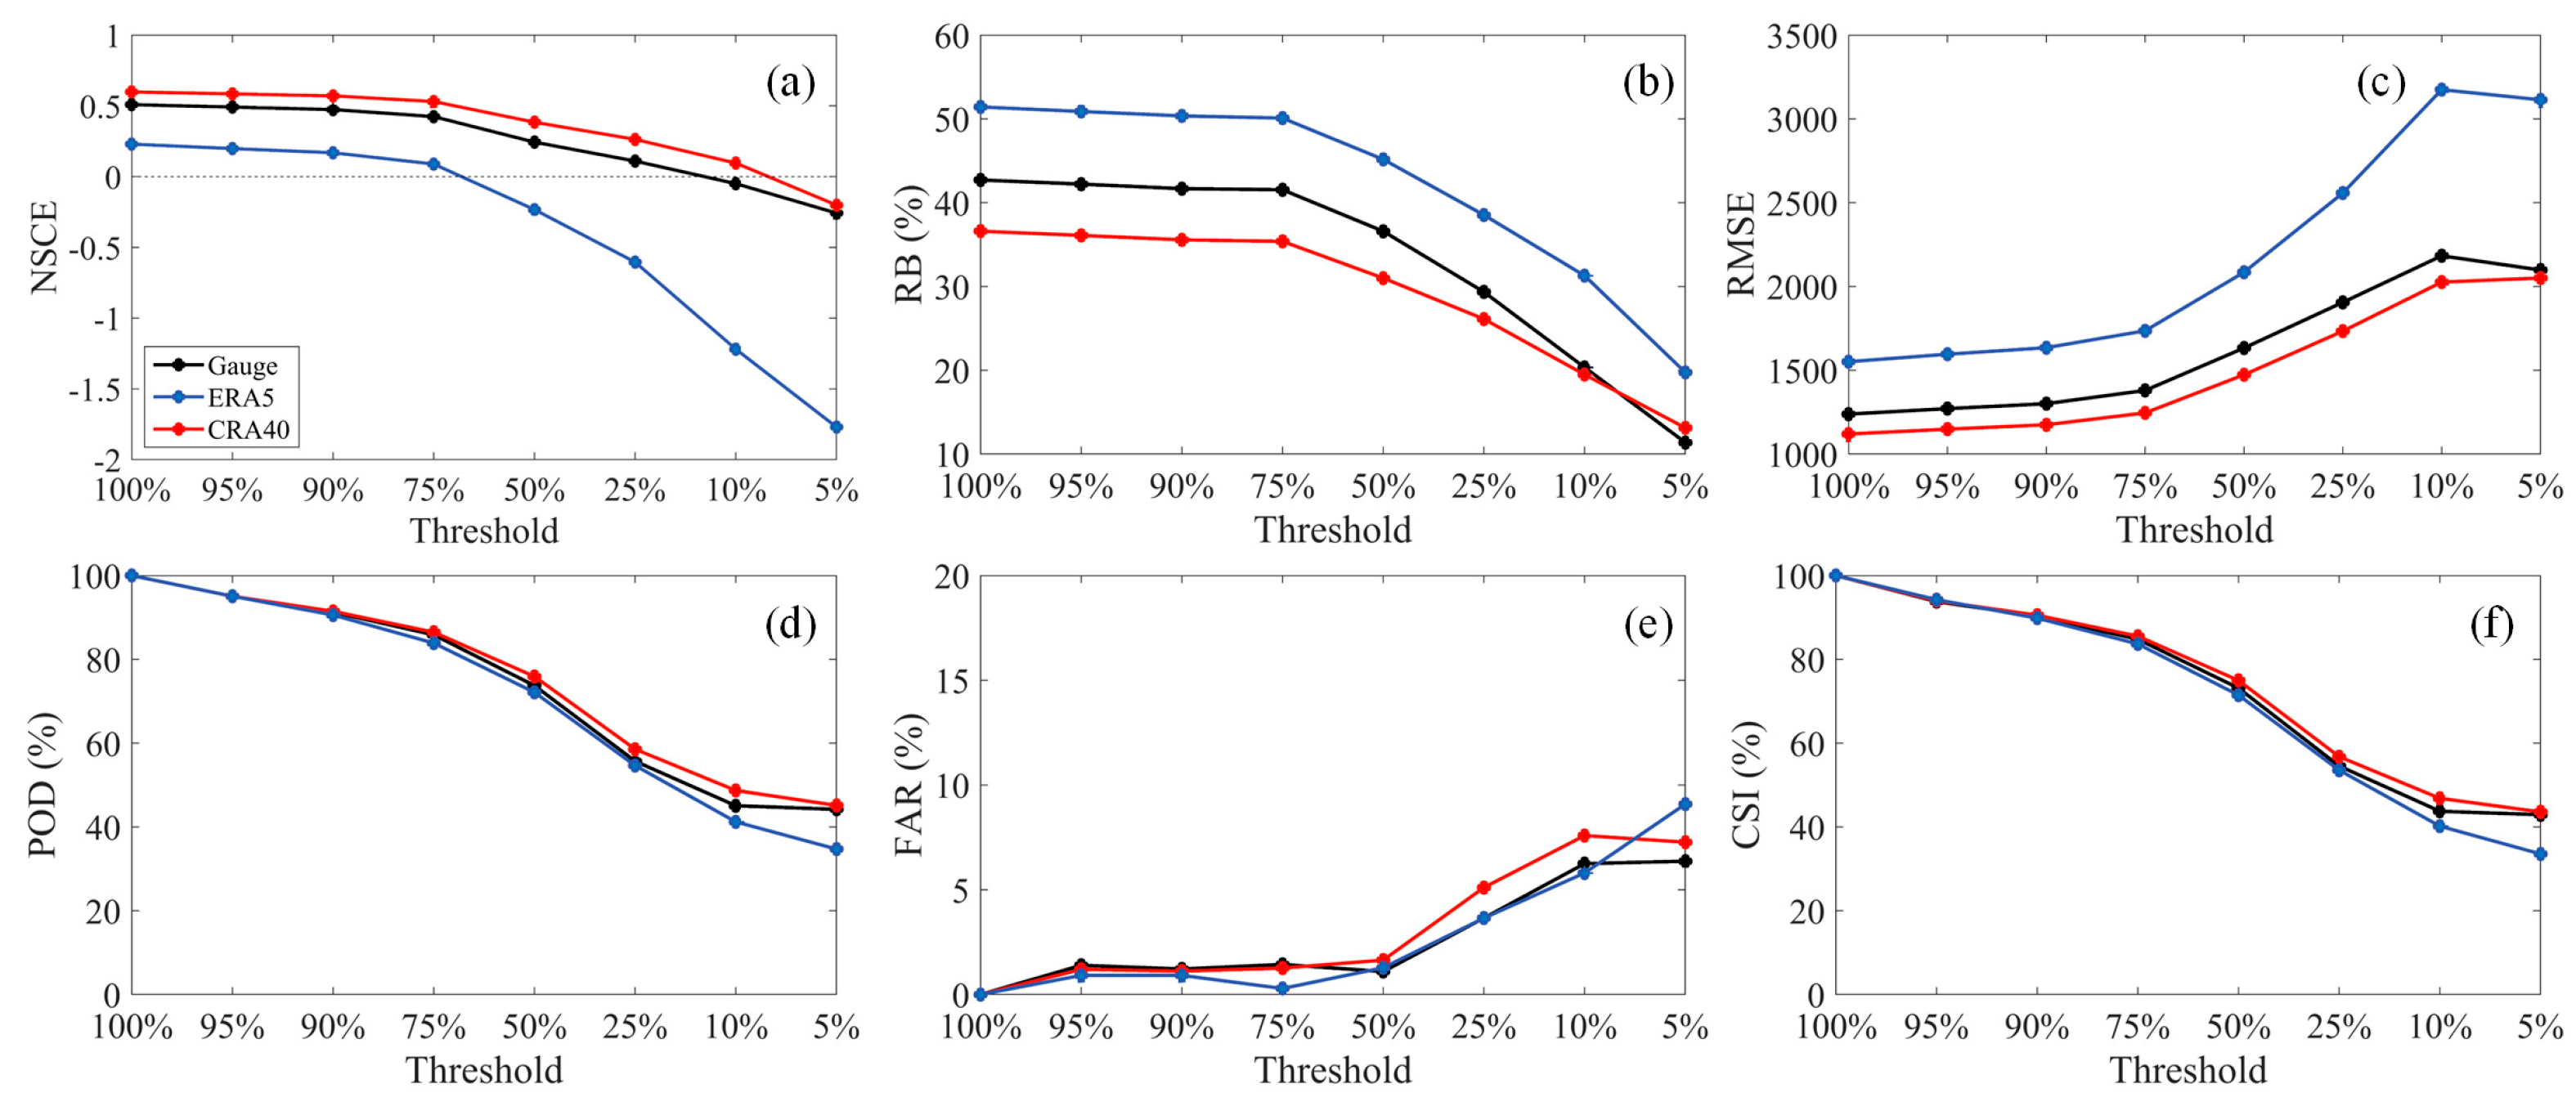
Figure 11 presents error assessment metrics for daily watershed stream flows based on observations from rainfall gauges and simulations using CRA40 and ERA5 products across various flow thresholds. Metrics include NSE, RB (%), RMSE (m3/s), POD, FAR, and CSI, aiming to analyze their differences comprehensively. The findings show that as flow thresholds rise, NSE, RB, POD, and CSI tend to decrease, whereas RMSE and FAR increase. Particularly noteworthy is CRA40’s superior performance across all thresholds, exhibiting higher NSE, POD, and CSI scores, alongside lower RB and RMSE values. Error metrics for rainfall gauge observations are slightly inferior to CRA40 across thresholds, with no significant overall differences. In contrast, ERA5 consistently exhibits significantly lower NSE scores across all thresholds compared to other sources, indicating a less effective modeling of stream flows in the watershed. It is worth noting that when the flow threshold is 100% (0 m3/s) to 75% (522 m3/s), the error indicators of the three data sources change relatively smoothly, indicating that their simulation performance is relatively stable in this flow range. However, at flow thresholds from 75% (522 m3/s) to 10% (3830 m3/s), there is a pronounced increase in the magnitude of error metrics across the three data sources, suggesting a gradual decline in their simulation performance under high flow conditions. Within the 10% (3830 m3/s) to 5% (5060 m3/s) threshold range, the variation trends of the three data sources gradually stabilize again, with results from CRA40 and rainfall gauge observations converging. Moreover, across all thresholds, the RB values for rainfall gauge observations, CRA40, and ERA5 consistently indicate overestimation, with ERA5 showing notably higher levels of overestimation, aligning with the observations in Figure 10.
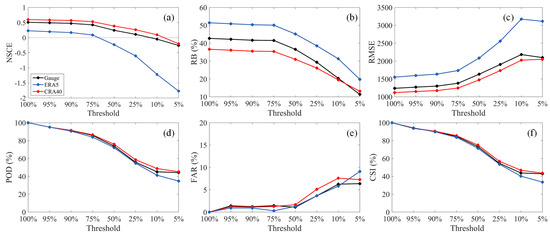
Figure 11.
Utilized (a) NSE, (b) RB (%), (c) RMSE (m3/s), (d) POD, (e) FAR, and (f) CSI as bivariate analyses of daily discharge against flow percentage. The x-axis percentages denote flow levels from low to high, where 100% represents all flows and 5% represents only the highest 5% of flows. Corresponding flow values are 0, 323, 393, 522, 1230, 2300, 3830, and 5060 (m3/s).
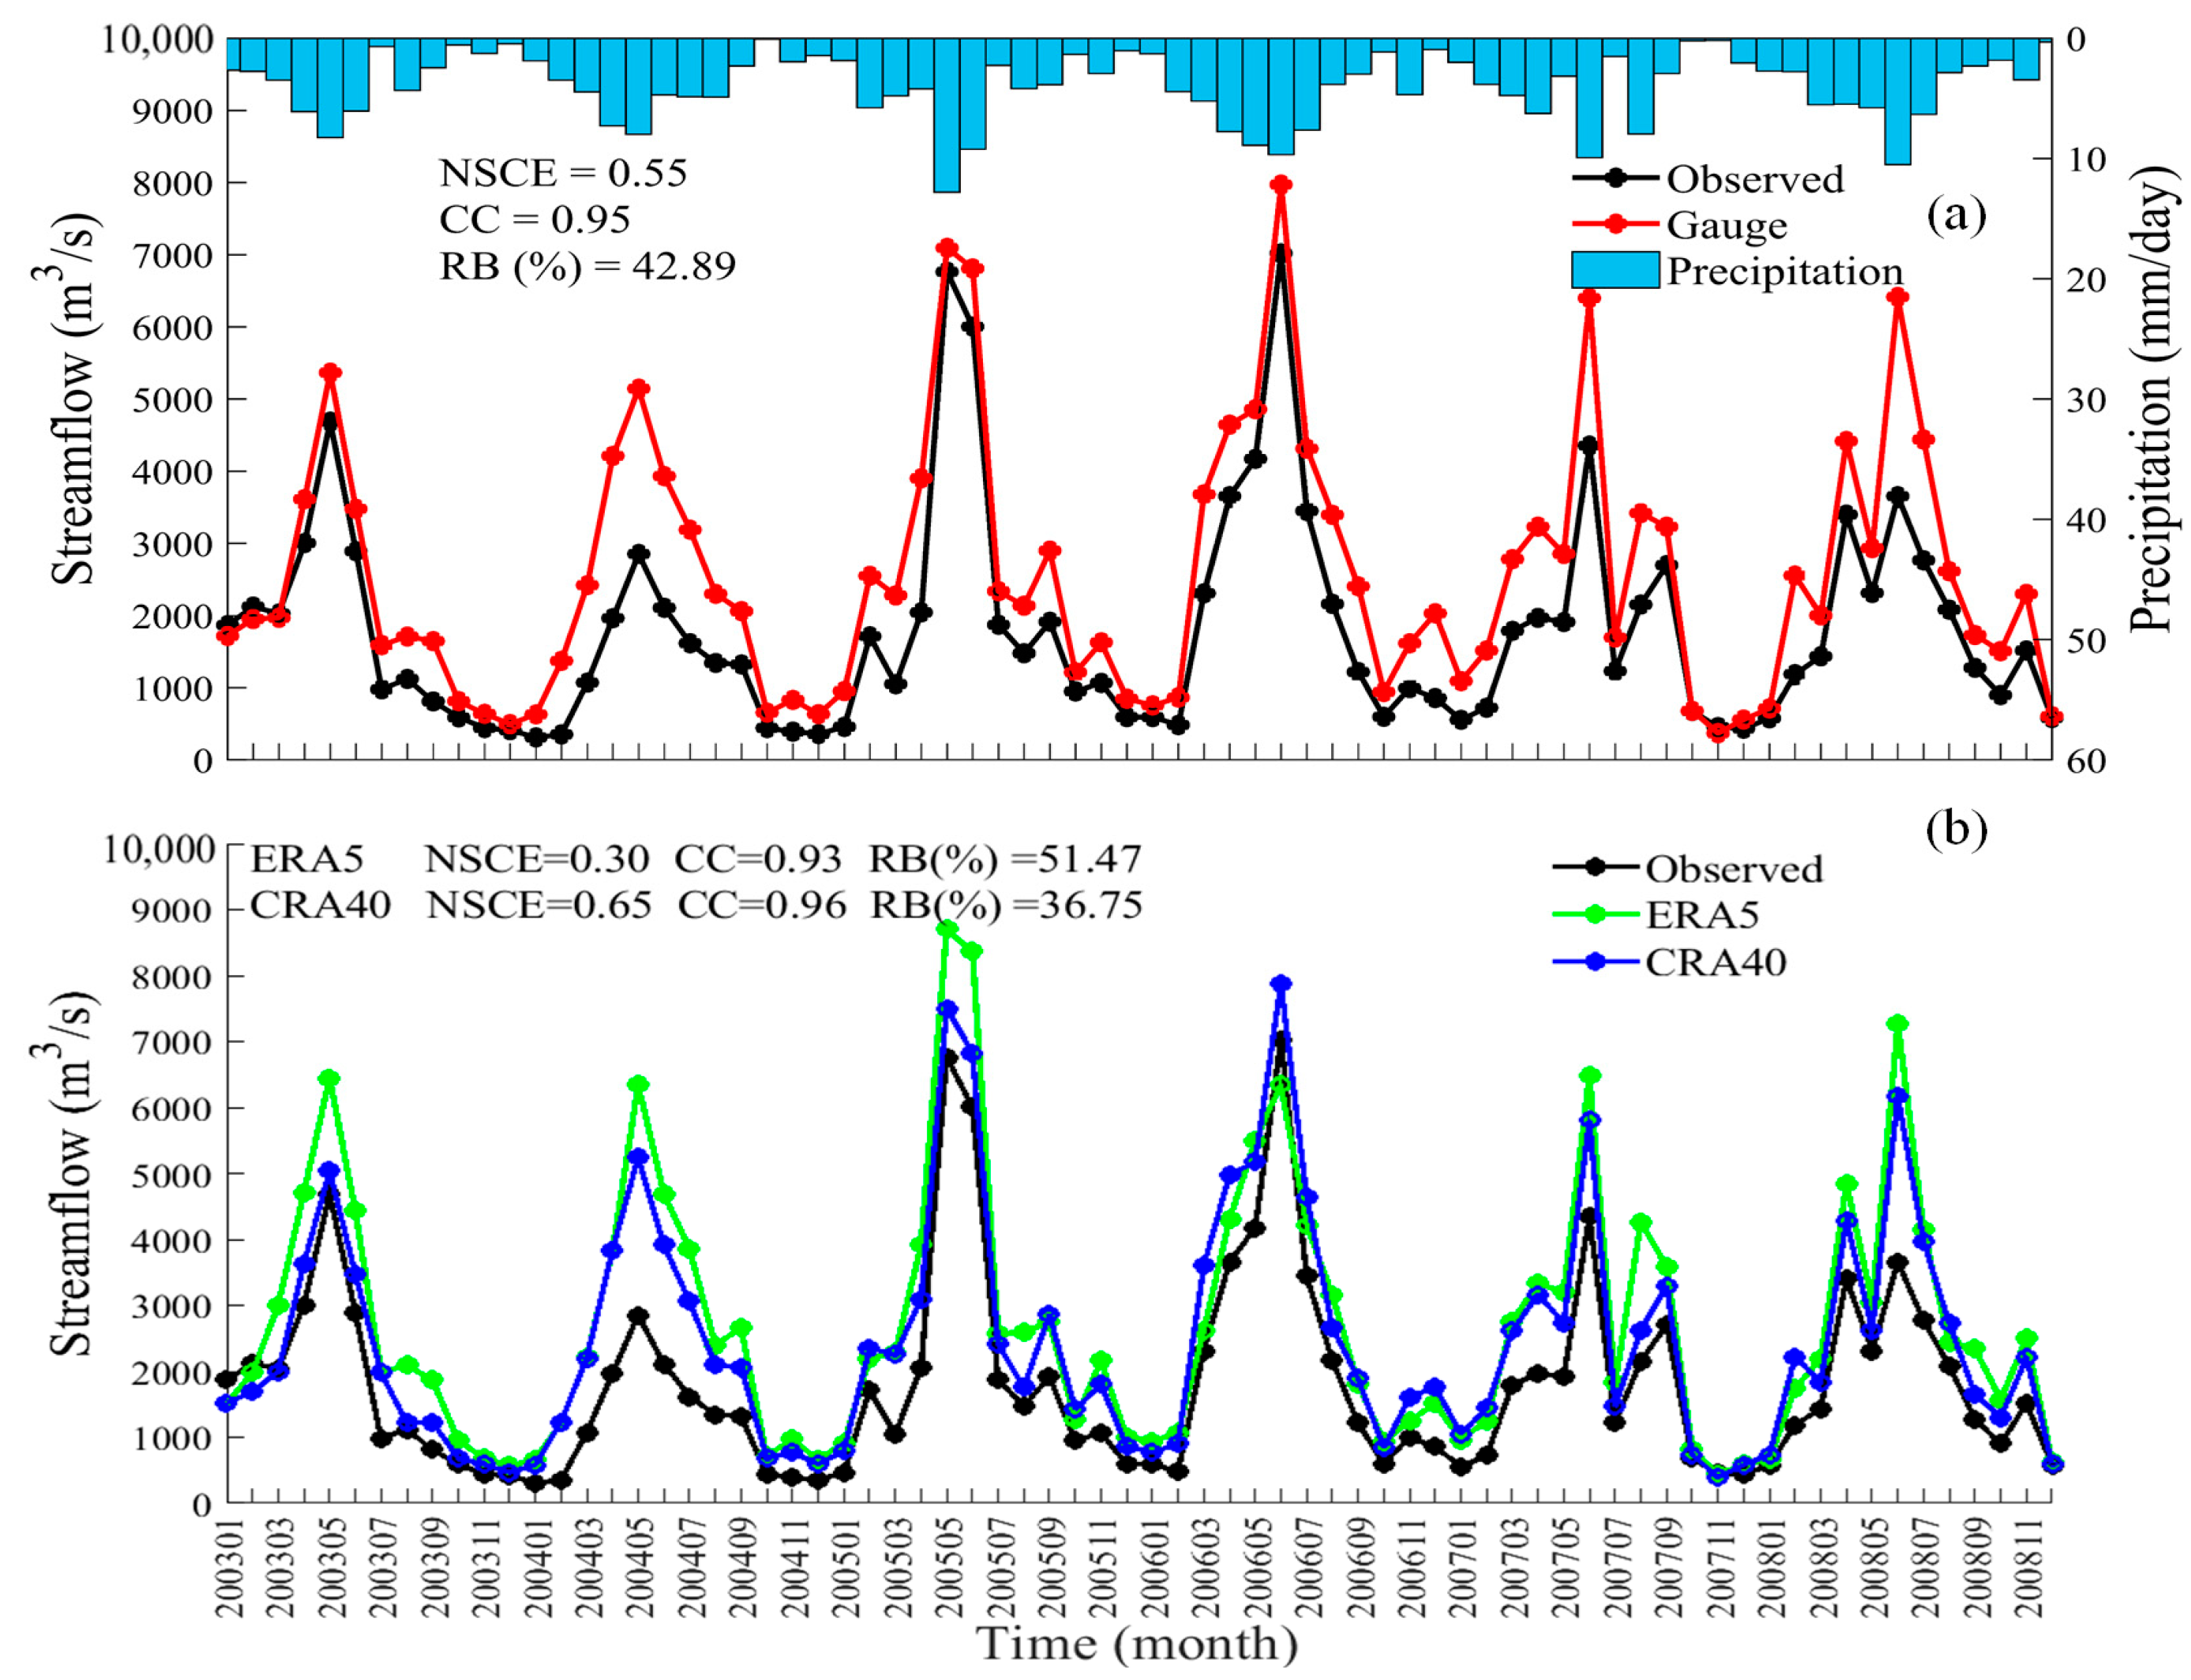
Figure 12 shows the monthly time series of simulated average daily discharge using data from ground rainfall gauges, CRA40, and ERA5 in the Ganjiang River Basin. All three data sources tend to overestimate monthly stream flow simulations. Specifically, the watershed stream flows curve simulated by CRA40 closely matches the observed stream flows curve, with an NSE of 0.65, CC of 0.96, and RB value of 36.75%. Stream flow simulations based on ground rainfall gauges slightly lag behind CRA40 but still show robust hydrological performance, achieving an NSE of 0.55, CC of 0.95, and RB of 42.89%. Conversely, ERA5 shows a high CC of 0.93 but a lower NSE of 0.30 and significantly overestimates (51.47%) monthly stream flows. This suggests that ERA5 is less effective in simulating monthly stream flows in the Ganjiang River Basin. This indicates a slightly higher overestimation relative to monthly observed stream flows compared to CRA40. In contrast, ERA5’s monthly scale stream flow simulation exhibits a high Correlation Coefficient (CC) of 0.93, but a lower NSE score of 0.30 and a significant overestimation (51.47%). This indicates the poor hydrological utility of ERA5 in simulating monthly scale stream flows in the Ganjiang River Basin. This figure also illustrates that monthly stream flow volumes during the flood season (April-September) in the Ganjiang River Basin are mostly overestimated by all three data sources, which may contribute to the overestimation in their monthly scale stream flow simulation results. The stream flow simulation results from all three data sources in 2004 continue to show significant overestimations, consistent with the observations in Figure 10.
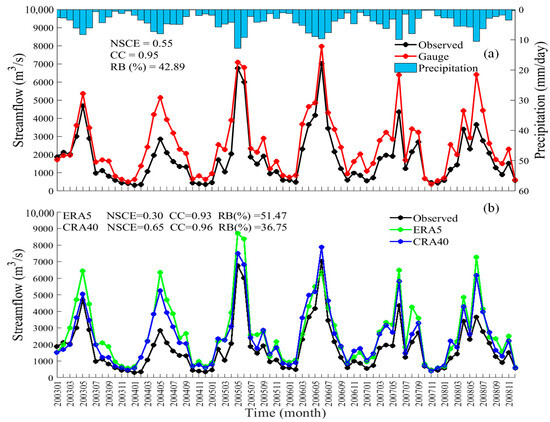
Figure 12.
Monthly observed stream flow and simulated flows with rainfall input from (a) gauge and (b) ERA5 and CRA40. Rainfall input (blue bars) is plotted on the secondary y-axis in (a).
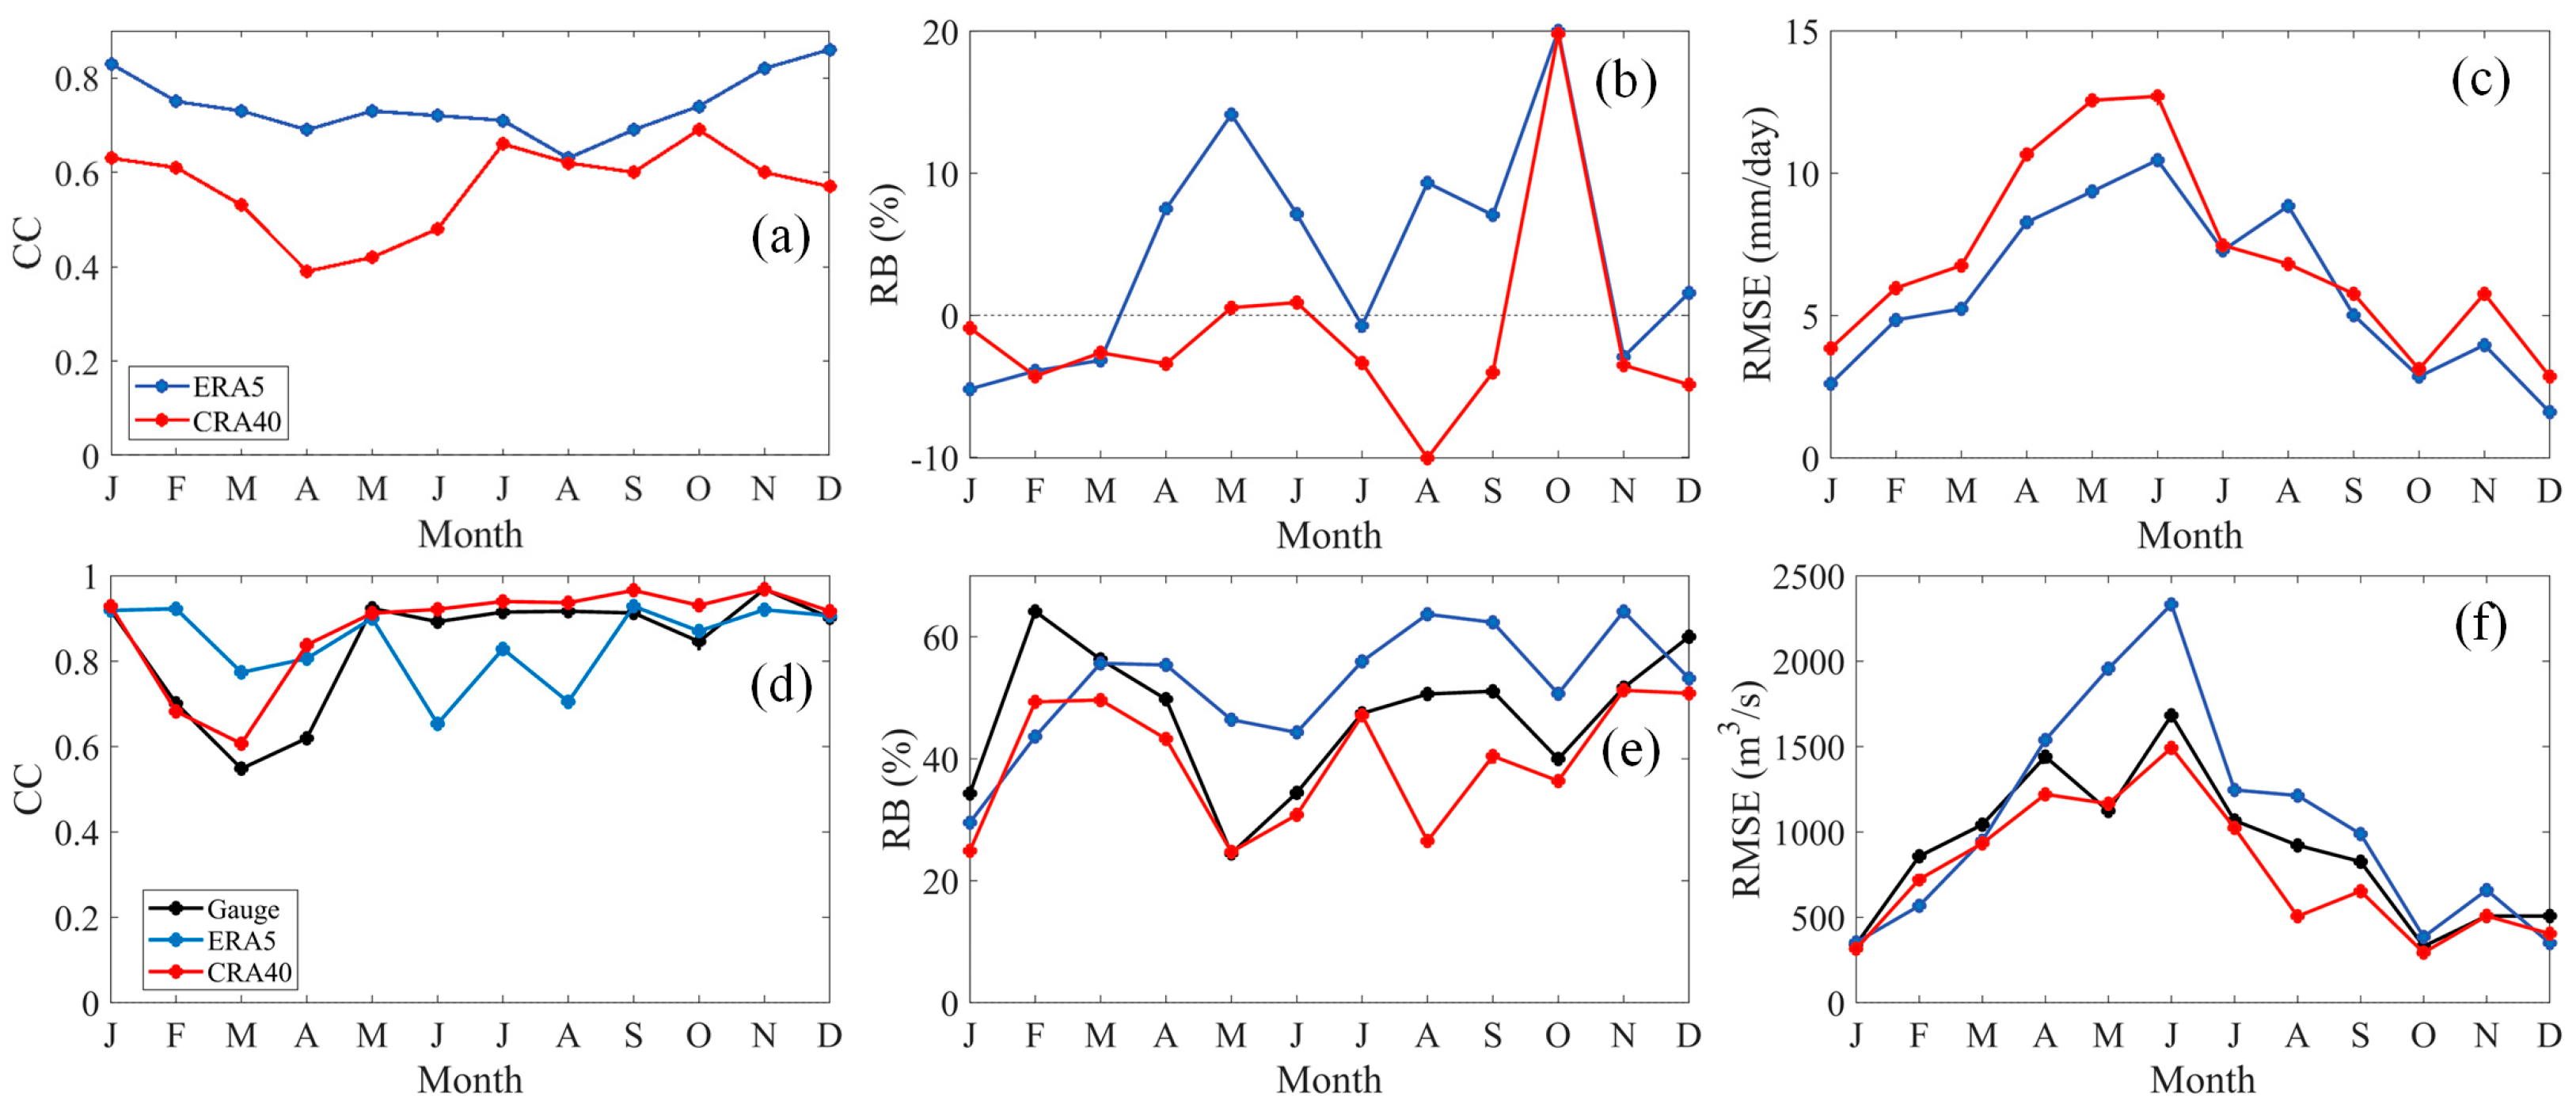
Figure 13 provides a statistical time series of CC, RB, and RMSE for precipitation and stream flow simulations from three data sources across 12 months in the Ganjiang River Basin. This aims to deepen the understanding of the relationship between precipitation and stream flows and the predictive capabilities of the models. This figure indicates that the precipitation dominance order of the reanalysis precipitation products is not reflected in their simulated stream flow results. In terms of monthly precipitation assessment, ERA5 exhibits generally better performance in monthly precipitation, despite its larger RB overestimation, with consistently higher CC and smaller RMSE values. Conversely, in terms of monthly stream flow statistics, CRA40 closely mirrors rainfall gauge inputs and exhibits robust hydrological performance. Apart from December and the dry seasons of January–February, as well as the transitional month of March, where some metrics marginally lag behind ERA5, CRA40 consistently demonstrates a stronger correlation with the observed stream flows, a reduced overestimation, and more precise monthly stream flow simulations. Both reanalysis products and ground-based rainfall gauge observations show overestimation in monthly stream flows, with the peak overestimation occurring in February for rainfall gauges (64.14%) and in November for CRA40 and ERA5 (51.23% and 64.16%, respectively) (Figure 13e). Seasonal precipitation patterns correspond similarly to simulated stream flow RMSE patterns, with CRA40 and ERA5 models exhibiting a higher RMSE during spring and summer and a relatively lower RMSE in autumn and winter. This suggests a greater variability in precipitation and stream flows during the spring and summer months.
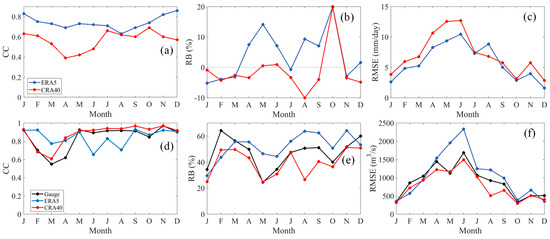
Figure 13.
Input of (a) monthly CC, (b) monthly RB (%) and (c) monthly RMSE (mm/day) for precipitation. And (d) monthly CC, (e) monthly RB (%) and (f) monthly RMSE (m3/s) for the output stream flows. Subscripts denote January (J), February (F), March (M), April (A), May (M), June (J), July (J), August (A), September (S), October (O), November (N), and December (D).
In terms of monthly precipitation, ERA5 shows a slight underestimation only in January–March, July, and November, while an overestimation is observed in other months; in contrast, CRA40 generally shows an underestimation except for a slight overestimation in May–June and a significant overestimation in October (Figure 13b). Seasonal precipitation patterns correlate similarly with simulated stream flow RMSE patterns, with CRA40 and ERA5 models showing a higher RMSE in the spring and summer seasons and a relatively lower RMSE in the autumn and winter seasons, indicating a more pronounced precipitation and stream flow variability during spring and summer.
4. Summary and Conclusions
This study assessed the hydrological utility and quality of CRA40 and ERA5 reanalysis precipitation products over the Ganjiang River Basin with daily and monthly ground-based rainfall gauge data, along with observed stream flow data as reference data from January 1998 to December 2008. Assessment indices include continuous statistical indicators (CC, RB, RMSE), precipitation occurrence, and volume probability density functions (PDFs), as well as contingency statistics (POD, FAR, CSI). In addition, with hydrological simulations based in a VIC model with input from ground-based rainfall gauge observations, CRA40, and ERA5 products, this study evaluates the hydrological modeling performance at both daily and monthly scales. Key findings of this study are summarized as follows:
- (1)
- Both CRA40 and ERA5 products successfully capture the precipitation patterns in the Ganjiang River Basin from 1998 to 2008. At the daily scale, ERA5 shows closer agreement with ground-based rainfall gauge observations with a higher overestimation (13.11%), demonstrating better performance in terms of CC (0.67) and RMSE (7.92 mm/day). At the monthly scale, CRA40 exhibits a higher CC (0.92), slight underestimation (1.32%), and smaller RMSE (38.52 mm/day), aligning more closely with the observed rainfall from ground-based gauges. Throughout the study period, ERA5 consistently overestimates precipitation compared to CRA40. Both reanalysis products underestimate light precipitation events (<1 mm/day) and underestimate the amount of extreme precipitation (>30 mm/day) (Figure 2, Figure 3, Figure 4 and Figure 5).
- (2)
- In seasonal daily precipitation simulations, ERA5 consistently shows high CC values across seasons but tends to overestimate precipitation. Winter exhibits the best performance, while summer shows the highest overestimation (19.58%), with CC decreasing from 0.72 in winter to 0.63 in summer. In contrast, CRA40, except for a slight overestimation in summer, slightly underestimates precipitation in the other three seasons. The CC values are relatively lower across all four seasons for CRA40, particularly with a CC of only 0.37 in spring (Table 3).
- (3)
- The simulation of stream flows using CRA40 and ERA5 as forcings for the VIC model reveals that CRA40 achieves promising results with NSE values exceeding 0.6 at both daily and monthly scales, indicating good simulation performance. In contrast, ERA5 demonstrates poorer hydrological performance with NSE values below 0.3 at both daily and monthly scales. CRA40 and ERA5 overestimate stream flows by 36.6% and 51.43%, respectively, at the daily scale, and by 36.75% and 51.47%, respectively, at the monthly scale. Both products consistently overestimate stream flows during the monsoon season (April to September), particularly evident in the year 2004 (Figure 10 and Figure 12).
- (4)
- The precipitation dominance order of the reanalysis precipitation products is not reflected in their simulated stream flow results. CRA40 outperforms both ground-based rain gauge observations and ERA5 in simulating stream flows in the Ganjiang River Basin. At the daily (monthly) scale, the validation period NSE for CRA40 and ground-based rain gauge observations is 0.6 and 0.51 (0.65 and 0.55), respectively, while CC values are 0.91 and 0.89 (0.96 and 0.95), respectively. Across monthly variations, except for a slightly better stream flow performance in December and January to March, ERA5 exhibits an inferior CC, RB, and RMSE performance compared to CRA40 in other seasons (Figure 10, Figure 12 and Figure 13).
Based on the aforementioned points, although ERA5 exhibits superior performance in precipitation, its overall hydrological simulation is less stable and accurate compared to CRA40. However, reanalysis precipitation products are generated through the assimilation of model and observational data, inevitably introducing some uncertainties. Such as the potential gap in observation data coverage of different reanalysis products, the distribution of observation stations may be uneven, resulting in missing or inaccurate precipitation data in some areas. Secondly, the physical processes and parameter assimilation schemes of the numerical forecast model of the reanalysis product may not fully capture the actual weather phenomenon, resulting in discrepancies between the simulated results and the actual situation. Moreover, the spatial and temporal resolution of the reanalysis products may not be sufficient in reflecting the local precipitation changes. In addition, due to time delays in the generation of reanalysis products, there may also be timeliness differences between actual weather times and data updates. Therefore, hydrology modelers as well as other data users should be cautious when conducting research with reanalysis precipitation products over the Ganjiang River Basin and beyond. This study provides an empirical analysis for the application of meteorological reanalysis products in the Ganjiang River Basin, Jiangxi Province. It underscores the criticality of selecting appropriate products for local weather forecasting and water resource management. Future research can further optimize the model parameters of reanalysis products and improve the simulation methods to improve the accuracy and applicability of meteorological prediction and hydrological simulation.
Author Contributions
Conceptualization, Z.Z. and S.C.; methodology, Z.Z. and S.C.; validation, S.C.; formal analysis, S.C. and Z.L.; investigation, S.C. and Z.L.; resources, S.C., Z.L., C.W. and Y.L.; data curation, Z.Z. and S.C.; writing—original draft preparation, Z.L. and Z.Z.; writing—review and editing, S.C. and Z.L.; visualization, Z.L. and Z.Z.; supervision, S.C. and Z.L.; project administration, S.C., Z.L., C.W. and Y.L.; funding acquisition, S.C. and Z.L. All authors have read and agreed to the published version of the manuscript.
Funding
This research was funded by the Guangxi Key R&D Program (Grant No. AB22080104, AB22035016); the Guangxi Natural Science Foundation (2020GXNSFAA238046); and the Key Laboratory of Environment Change and Resources Use in Beibu Gulf (Grant No. NNNU-KLOP-K2103) at Nanning Normal University.
Data Availability Statement
Digital Elevation Model (DEM) data were obtained from ASTER GDEM through the Geospatial Data Cloud (http://www.gscloud.cn, accessed on 10 December 2023). Soil characteristics were extracted from gridded data sourced from the Harmonized World Soil Database (HWSD, http://www.ncdc.ac.cn/portal/metadata/a948627d-4b71-4f68-b1b6-fe02e302af09, accessed on 26 September 2024). Vegetation data were acquired from the University of Maryland’s global land cover dataset (UMD, https://iridl.ldeo.columbia.edu/SOURCES/.UMD/.GLCF/.GLCDS/, accessed on 26 September 2024). Temperature and wind speed data were obtained from the Daily Value Dataset of Surface Climatological Data of China (http://data.cma.cn/, accessed on 5 May 2020). Daily rain gauge observations are available for download from the official website of the China Meteorological Administration (https://data.cma.cn/, accessed on 10 December 2021). In addition, the reanalysis precipitation data used in this study are the fifth generation of the European reanalysis product, ERA5 (https://cds.climate.copernicus.eu/#!/home, accessed on 7 October 2022), and the first generation of China’s global land surface reanalysis daily precipitation product, CRA40 (https://data.cma.cn/, accessed on 7 October 2022).
Acknowledgments
Thanks go to Wushuang Fan from Nanning Normal University for his helpful suggestions on data processing.
Conflicts of Interest
The authors declare no conflicts of interest.
References
- Habib, E.; Henschke, A.; Adler, R.F. Evaluation of TMPA Satellite-Based Research and Real-Time Rainfall Estimates during Six Tropical-Related Heavy Rainfall Events over Louisiana, USA. Atmos. Res. 2009, 94, 373–388. [Google Scholar] [CrossRef]
- Tang, Q. Global Change Hydrology: Terrestrial Water Cycle and Global Chang. Sci. China Earth Sci. 2020, 50, 459–462. [Google Scholar] [CrossRef]
- Song, Y.; Wang, S.; Luo, P.; Zha, X.; Xu, C.; Cao, Z.; Zhu, W. Advances in research methods of runoff evolution under changing environment. J. Water Resour. Water Eng. 2022, 33, 68–76. [Google Scholar]
- Majone, B.; Avesani, D.; Zulian, P.; Fiori, A.; Bellin, A. Analysis of High Streamflow Extremes in Climate Change Studies: How Do We Calibrate Hydrological Models? Hydrol. Earth Syst. Sci. 2022, 26, 3863–3883. [Google Scholar] [CrossRef]
- Thirel, G.; Andréassian, V.; Perrin, C.; Audouy, J.N.; Berthet, L.; Edwards, P.; Folton, N.; Furusho, C.; Kuentz, A.; Lerat, J.; et al. Hydrology under Change: An Evaluation Protocol to Investigate How Hydrological Models Deal with Changing Catchments. Hydrol. Sci. J. 2015, 60, 1184–1199. [Google Scholar] [CrossRef]
- Tong, K.; Su, F.; Yang, D.; Hao, Z. Evaluation of Satellite Precipitation Retrievals and Their Potential Utilities in Hydrologic Modeling over the Tibetan Plateau. J. Hydrol. 2014, 519, 423–437. [Google Scholar] [CrossRef]
- Xu, F.; Guo, B.; Ye, B.; Ye, Q.; Chen, H.; Ju, X.; Guo, J.; Wang, Z. Systematical Evaluation of GPM IMERG and TRMM 3B42V7 Precipitation Products in the Huang-Huai-Hai Plain, China. Remote Sens. 2019, 11, 697. [Google Scholar] [CrossRef]
- Sokol, Z.; Szturc, J.; Orellana-Alvear, J.; Popová, J.; Jurczyk, A.; Célleri, R. The Role of Weather Radar in Rainfall Estimation and Its Application in Meteorological and Hydrological Modelling—A Review. Remote Sens. 2021, 13, 351. [Google Scholar] [CrossRef]
- Tang, G.; Li, Z.; Xue, X.; Hu, Q.; Yong, B.; Hong, Y. A study of substitutability of TRMM remote sensing precipitation for gauge-based observation in Ganjiang River basin. Adv. Water Sci. 2015, 26, 340–346. [Google Scholar] [CrossRef]
- Wang, S.; Zhang, L.; Yu, X.; She, D.; Gan, Y. Application of Remote Sensing Precipitation Products in Runoff Simulation over the Lancang River Basin. Resour. Environ. Yangtze Basin 2019, 28, 1365–1374. [Google Scholar]
- Chen, S.; Hu, J.; Zhang, Z.; Behrangi, A.; Hong, Y.; Gebregiorgis, A.S.; Cao, J.; Hu, B.; Xue, X.; Zhang, X. Hydrologic Evaluation of the TRMM Multisatellite Precipitation Analysis Over Ganjiang Basin in Humid Southeastern China. IEEE J. Sel. Top. Appl. Earth Obs. Remote Sens. 2015, 8, 4568–4580. [Google Scholar] [CrossRef]
- Zhang, A.; Xiao, L.; Min, C.; Chen, S.; Kulie, M.; Huang, C.; Liang, Z. Evaluation of Latest GPM-Era High-Resolution Satellite Precipitation Products during the May 2017 Guangdong Extreme Rainfall Event. Atmos. Res. 2019, 216, 76–85. [Google Scholar] [CrossRef]
- Zhang, L.; Yang, M.; Wang, H. Evaluation of the Applicability of CMADS, CFSR and Observed Weather Gauge Data in the Hunhe River Basin. China Rural. Water Hydropower 2020, 12, 132–137. [Google Scholar]
- Lenters, J.D.; Coe, M.T.; Foley, J.A. Surface Water Balance of the Continental United States, 1963–1995: Regional Evaluation of a Terrestrial Biosphere Model and the NCEP/NCAR Reanalysis. J. Geophys. Res. Atmos. 2000, 105, 22393–22425. [Google Scholar] [CrossRef]
- Hagemann, S.; Gates, L.D. Validation of the Hydrological Cycle of ECMWF and NCEP Reanalyses Using the MPI Hydrological Discharge Model. J. Geophys. Res. Atmos. 2001, 106, 1503–1510. [Google Scholar] [CrossRef]
- Ding, G.; Guo, J.; Tang, Z.; Zhang, H.; Guo, H. Evaluation on applicability of various reanalysis datasets of precipitation in Changjiang River Basin. Yangtze River 2022, 53, 72–79. [Google Scholar] [CrossRef]
- Huang, X.; Wang, Z.; Sang, Y.; Yang, M.; Liu, X.; Gong, T. Precision of data in three precipitation datasets of the Yarlung Zangbo River Basin. Prog. Geogr. 2016, 35, 339–348. [Google Scholar]
- ECMWF ERA5. Data Documentation. Available online: https://confluence.ecmwf.int/display/CKB/ERA5%3A+data+documentation (accessed on 20 September 2024).
- Hersbach, H.; Bell, B.; Berrisford, P.; Hirahara, S.; Horányi, A.; Muñoz-Sabater, J.; Nicolas, J.; Peubey, C.; Radu, R.; Schepers, D.; et al. The ERA5 Global Reanalysis. Q. J. R. Meteorol. Soc. 2020, 146, 1999–2049. [Google Scholar] [CrossRef]
- Wang, C.; Huang, A.; Zheng, P.; Liu, K.; Hou, M. Applicability Evaluation of China’s First Generation of Global Land Surface Reanalysis (CRA40/Land) Air Temperature and Precipitation Products in China Mainland. Plateau Meteorol. 2022, 41, 1325–1334. [Google Scholar]
- Liao, J.; Hu, K.; Jiang, H.; Cao, L.; Jiang, L.; Li, Q.; Zhou, Z.; Liu, Z.; Zhang, T.; Wang, H. Pre-Process and Data Selection for Assimilation of Conventional Observations in the CMA Global Atmospheric Reanalysis. Adv. Meteorol. Sci. Technol. 2018, 8, 133–142. [Google Scholar]
- National Weather Science Data Centre Atmospheric Models and Assimilation Systems. Available online: https://data.cma.cn/analysis/cra40 (accessed on 20 September 2024).
- Jiang, Q.; Li, W.; Fan, Z.; He, X.; Sun, W.; Chen, S.; Wen, J.; Gao, J.; Wang, J. Evaluation of the ERA5 Reanalysis Precipitation Dataset over Chinese Mainland. J. Hydrol. 2021, 595, 125660. [Google Scholar] [CrossRef]
- Jiang, S.; Wei, L.; Ren, L.; Zhang, L.; Wang, M.; Cui, H. Evaluation of IMERG, TMPA, ERA5, and CPC Precipitation Products over Mainland China: Spatiotemporal Patterns and Extremes. Water Sci. Eng. 2023, 16, 45–56. [Google Scholar] [CrossRef]
- Torre, D.D.; Marco, N.D.; Menapace, A.; Avesani, D.; Righetti, M.; Majone, B. Suitability of ERA5-Land Reanalysis Dataset for Hydrological Modelling in the Alpine Region. J. Hydrol. Reg. Stud. 2024, 52, 101718. [Google Scholar] [CrossRef]
- Tarek, M.; Brissette, F.P.; Arsenault, R. Evaluation of the ERA5 Reanalysis as a Potential Reference Dataset for Hydrological Modelling over North America. Hydrol. Earth Syst. Sci. 2020, 24, 2527–2544. [Google Scholar] [CrossRef]
- Xiao, Z.; Zhang, X.; Fang, Y. Downscaling Assessment of ERA5 Rainfall Data and Hydrological Simulation: A Case Study of Hengjiang River Basin. Water Sav. Irrig. 2022, 1, 42–46. [Google Scholar]
- Tang, H.; Wang, X.; Chen, F.; Jiang, L.; He, C.; Long, A. Simulation of Manas River runoff based on ERA5-Land dataset. Earth Sci. Front. 2022, 29, 271–283. [Google Scholar] [CrossRef]
- Zhang, Y.; Wang, Y.; Li, L.; Wang, L.; Wang, Q.; Huang, Y.; Li, L. Error Decomposition of CRA40-Land and ERA5-Land Reanalysis Precipitation Products over the Yongding River Basin in North China. Atmosphere 2022, 13, 1936. [Google Scholar] [CrossRef]
- Zhang, Z.; Tian, J.; Huang, Y.; Chen, X.; Chen, S.; Duan, Z. Hydrologic Evaluation of TRMM and GPM IMERG Satellite-Based Precipitation in a Humid Basin of China. Remote Sens. 2019, 11, 431. [Google Scholar] [CrossRef]
- Song, X.; Yu, H.; Zhang, L.; Li, D. Application of VIC Land Surface Hydrological Model in Flow Simulation of Bailian River Basin. J. China Hydrol. 2007, 2, 40–44. [Google Scholar]
- Zhang, L.; Pang, B.; Xu, Z.; He, R. Comparative study on the performance of Vic model and Xin’anjiang model in simulating runoff. J. Beijing Norm. Univ. (Nat. Sci.) 2013, 49, 139–144. [Google Scholar]
- Maurer, E.P.; Adam, J.C.; Wood, A.W. Climate Model Based Consensus on the Hydrologic Impacts of Climate Change to the Rio Lempa Basin of Central America. Hydrol. Earth Syst. Sci. 2009, 13, 183–194. [Google Scholar] [CrossRef]
- Jiang, S.; Zhang, Z.; Huang, Y.; Chen, X.; Chen, S. Evaluating the TRMM Multisatellite Precipitation Analysis for Extreme Precipitation and Streamflow in Ganjiang River Basin, China. Adv. Meteorol. 2017, 2017, 2902493. [Google Scholar] [CrossRef]
- Huang, Y.; Zhang, Z.; Jin, Q. Evaluation of TRMM Satellite Rainfall in Driving Variable Infiltration Capacity (VIC) Model in Ganjiang Basin. In Proceedings of the 5th International Conference on Civil Engineering and Transportation, Guangzhou, China, 28–29 November 2015. [Google Scholar]
- Zhang, Z.; Jin, Q.; Chen, X.; Xu, C.-Y.; Chen, S.; Moss, E.M.; Huang, Y. Evaluation of TRMM Multisatellite Precipitation Analysis in the Yangtze River Basin with a Typical Monsoon Climate. Adv. Meteorol. 2016, 2016, 7329765. [Google Scholar] [CrossRef]
- ECMWF IFS Documentation CY45R1. Available online: https://www.ecmwf.int/en/elibrary/80892-ifs-documentation-cy45r1-part-i-observations (accessed on 13 September 2024).
- Gao, H.; Tang, Q.; Shi, J.X.; Zhu, C.; Bohn, T.; Su, F.; Sheffield, J.; Pan, M.; Lettenmaier, D.; Wood, E. Water Budget Record from Variable Infiltration Capacity (VIC) Model. 2010. Available online: https://www.researchgate.net/publication/268367169_Water_Budget_Record_from_Variable_Infiltration_Capacity_VIC_Model (accessed on 20 August 2023).
- Yuan, F.; Xie, Z.; Liu, Q.; Yang, H.; Su, F.; Liang, X.; Ren, L. An Application of the VIC-3L Land Surface Model and Remote Sensing Data in Simulating Streamflow for the Hanjiang River Basin. Can. J. Remote Sens. 2004, 30, 680–690. [Google Scholar] [CrossRef]
- Lohmann, D.; Raschke, E.; Nijssen, B.; Lettenmaier, D.P. Regional Scale Hydrology: I. Formulation of the VIC-2L Model Coupled to a Routing Model. Hydrol. Sci. J. 1998, 43, 131–141. [Google Scholar] [CrossRef]
- Sun, R.; Yuan, H.; Liu, X.; Jiang, X. Evaluation of the Latest Satellite–Gauge Precipitation Products and Their Hydrologic Applications over the Huaihe River Basin. J. Hydrol. 2016, 536, 302–319. [Google Scholar] [CrossRef]
- Xie, Z.; Yuan, F.; Duan, Q.; Zheng, J.; Liang, M.; Chen, F. Regional Parameter Estimation of the VIC Land Surface Model: Methodology and Application to River Basins in China. J. Hydrometeorol. 2007, 8, 447–468. [Google Scholar] [CrossRef]
- Duan, Q.; Sorooshian, S.; Gupta, V.K. Optimal Use of the SCE-UA Global Optimization Method for Calibrating Watershed Models. J. Hydrol. 1994, 158, 265–284. [Google Scholar] [CrossRef]
- Moriasi, D.; Arnold, J.; Van Liew, M.; Bingner, R.; Harmel, R.D.; Veith, T. Model Evaluation Guidelines for Systematic Quantification of Accuracy in Watershed Simulations. Trans. ASABE 2007, 50, 885–900. [Google Scholar] [CrossRef]
- Motovilov, Y.G.; Gottschalk, L.; Engeland, K.; Rodhe, A. Validation of a Distributed Hydrological Model against Spatial Observations. Agric. For. Meteorol. 1999, 98, 257–277. [Google Scholar] [CrossRef]
- Tian, Y.; Peters-Lidard, C.D.; Choudhury, B.J.; Garcia, M. Multitemporal Analysis of TRMM-Based Satellite Precipitation Products for Land Data Assimilation Applications. J. Hydrometeorol. 2007, 8, 1165–1183. [Google Scholar] [CrossRef]
- Jiangxi Provincial Water Resources Department. Water Resources Bulletin of Jiangxi Province; China Water&Power Press: Beijing, China, 2004. [Google Scholar]


Disclaimer/Publisher’s Note: The statements, opinions and data contained in all publications are solely those of the individual author(s) and contributor(s) and not of MDPI and/or the editor(s). MDPI and/or the editor(s) disclaim responsibility for any injury to people or property resulting from any ideas, methods, instructions or products referred to in the content. |
© 2024 by the authors. Licensee MDPI, Basel, Switzerland. This article is an open access article distributed under the terms and conditions of the Creative Commons Attribution (CC BY) license (https://creativecommons.org/licenses/by/4.0/).